The Quaker Oats Company The Quaker Oats Company Presented by: Maria Cabarrus Scott Holmes Richard...
25
The The Quaker Quaker Oats Oats Company Company Presented by: Presented by: Maria Cabarrus Maria Cabarrus Scott Holmes Scott Holmes Richard Ramos Richard Ramos David Seid David Seid
-
Upload
milton-porter -
Category
Documents
-
view
231 -
download
0
Transcript of The Quaker Oats Company The Quaker Oats Company Presented by: Maria Cabarrus Scott Holmes Richard...

The The Quaker Quaker
Oats Oats CompanyCompany
Presented by:Presented by:Maria Maria
CabarrusCabarrusScott HolmesScott HolmesRichard RamosRichard RamosDavid SeidDavid Seid

OverviewOverview
•History•Leadership•Products•Financial performance•Social responsibility•Outlook and future goals

HistoryHistory1856 : Akron, OH
FerdinandSchumacher
1877 : Ravenna, OHHenry Parsons Crowell
1901 : The Quaker Oats Co.

A Few HighlightsA Few Highlights•1983 – Gatorade acquired•1987 – Brookstone divested•1991 – Fisher-Price spun off•1994 – Snapple acquired•1997 – Snapple divested•2001 – merger with PepsiCo,
Inc.

LeadershipLeadership
Robert S. MorrisonChairman, President and CEO

Thirst QuencherThirst Quencher
•Gatorade•#1 sports beverage
worldwide
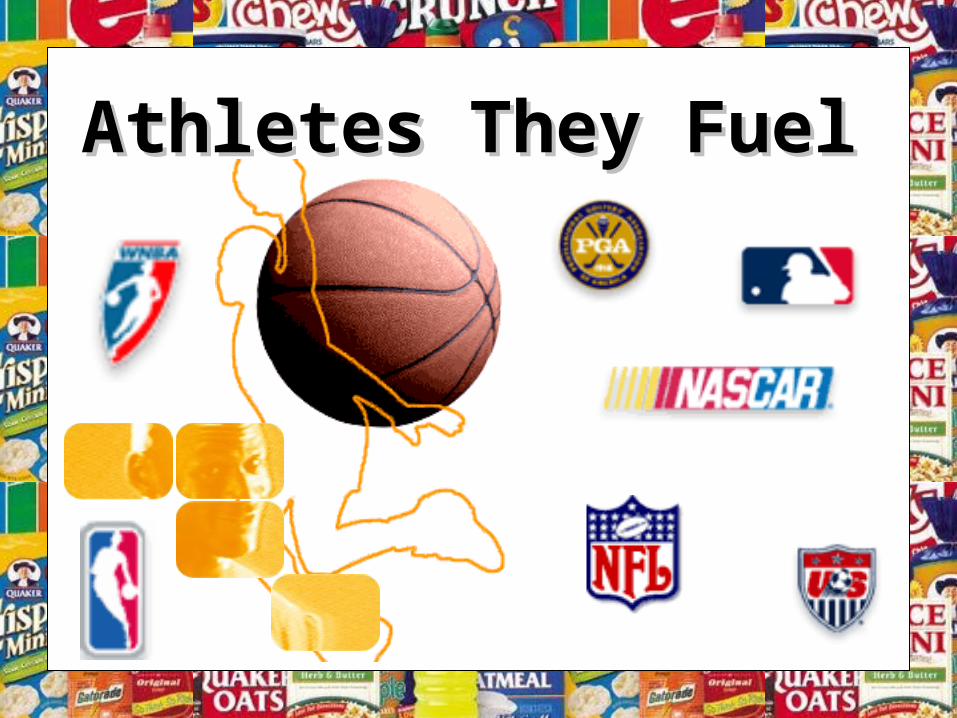
Athletes They FuelAthletes They Fuel

Hot CerealsHot Cereals
•Record high sales•124-year-old brand

Ready-to-eat Ready-to-eat CerealsCereals

On-the-go SnacksOn-the-go Snacks•Fastest growing•New flavors•Top-selling

Golden GrainGolden Grain

InternationalInternational• U.S. and Canada• Latin America• Europe and Asia/Pacific

Another Great YearAnother Great YearYear ended December 31$ in millions (except per share data)
2000 1999
Net sales $5,041.0 $4,725.2
Net income $360.6 $455.0
Number of employees 11,858 11,666
Per common share
Net income $2.71 $3.36
Dividends declared $1.14 $1.14
Average number of common shares outstanding
131,689 134,027
Source: The Quaker Oats Company 2000 Annual Report (page 18)

Financial Financial PerformancePerformanceAnnual Sales
Source: The Quaker Oats Company 2000 Annual Report (page 25)
15%
- 3%12%
- 5%6%
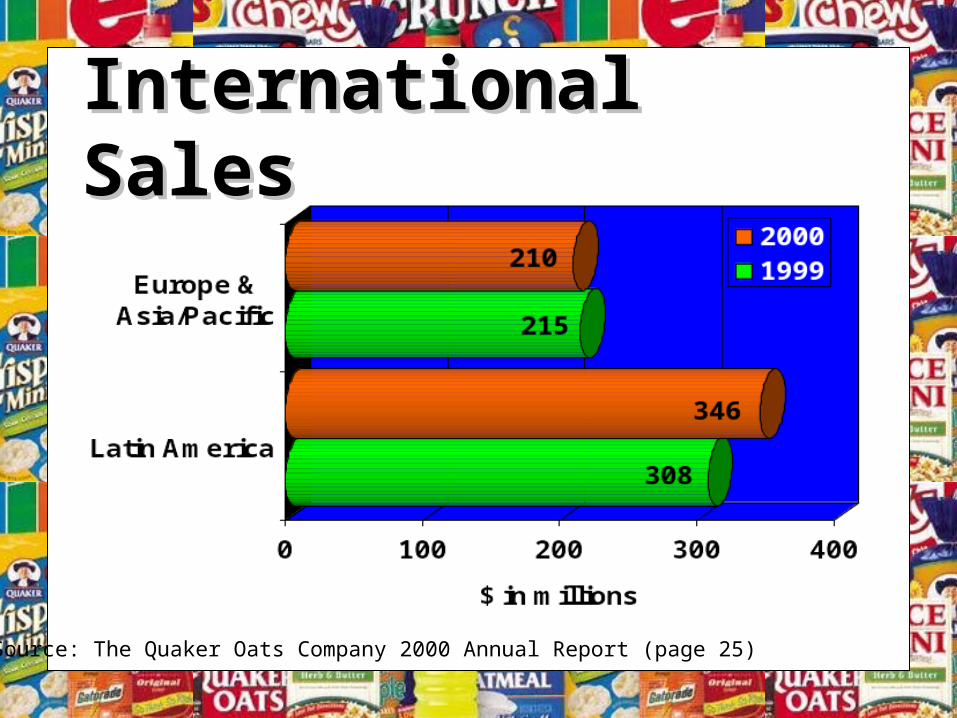
International SalesInternational Sales
Source: The Quaker Oats Company 2000 Annual Report (page 25)

1995 1996 1997 1998 1999 2000
Mega-brand SalesMega-brand Sales
$1.4 billion
$2.1 billion
Source: www.quakeroats.com

Top U.S. Food & Top U.S. Food & Beverage Companies in Beverage Companies in 20002000Company Total Sales in 2000
(In millions of dollars)
1. Kraft 34,679
2. ConAgra Foods Inc.
25,386
3. PepsiCo Inc. 20,144
4. Cargill Inc. 22,200
5. The Coca-Cola Co. 20,458
10. Sara Lee Corp. 7,915
12. Kellogg Co. 6,954
19. The Quaker Oats Co.
5,041
Source: Standard and Poor’s Industry Surveys (July 2001)

How They CompareHow They Compare
0
500
1000
1500
2000
2500
Net Income
KraftCoca-ColaSara LeeKelloggQuaker Oats
(In millions of dollars)
Source: Standard and Poor’s Industry Surveys (July 2001)

How They CompareHow They Compare
1.38
0.88
1.311.45
2.71
0
0.5
1
1.5
2
2.5
3
EPS (%)
KraftCoca-ColaSara LeeKelloggQuaker Oats
Source: Standard and Poor’s Industry Surveys (July 2001)

Social Social ResponsibilityResponsibility•Literacy and education•Nutrition•Hunger relief
Community Community InvolvementInvolvement

GoalGoal
•Simplicity•Innovation•Passion

A Winning Formula For A Winning Formula For ValueValue
Top-lineGrowth
Innovation
BrandBuilding
Cost Savings / Efficiency
ProfitableGrowth

ReferencesReferences• The Quaker Oats Company
Annual Report 2000• Standard and Poor’s
Industry Survey (July 2001)• www.quakeroats.com• www.kraft.com

Questions?Questions?