The PV-Battery Integrated Module: Energy Storage Sizing
79
The PV-Battery Integrated Module: Energy Storage Siz- ing Loic Barois Technische Universiteit Delft
Transcript of The PV-Battery Integrated Module: Energy Storage Sizing
The PV-Battery IntegratedModule: Energy Storage Siz-ing
Loic Barois
Tech
nisc
heUn
iver
siteit
Delf
t


THE PV-BATTERY INTEGRATED MODULE:ENERGY STORAGE SIZING
by
Loic Barois
in partial fulfillment of the requirements for the degree of
Master of Sciencein Sustainable Energy Technology
at the Delft University of Technology,to be defended publicly on Tuesday March 27, 2018 at 10:00 AM.
Supervisor: Dr. ir. L. Ramirez Elizondo TU DelftThesis committee: Prof. dr. ir. P. Bauer, TU Delft
Dr. ir. Z. Qin, TU DelftDr. ir. M. Popov, TU Delft
An electronic version of this thesis is available at http://repository.tudelft.nl/.


ABSTRACT
The physical integration of a battery system to the back of PV module provides solutions to the changing demandsof the residential solar energy market. The PV-Battery Integrated Module (PBIM) concept is proposed and equipsenergy-users with a modular and user friendly solar system. With each PV panel equipped with its exclusive balanceof system components, the PBIM aims to rival conventional solar home systems on an economic basis. With a poten-tial to offer savings on the installation process and removing the need to customize every residential solar system theuse of PBIM is a promising step towards the widespread implementation of solar systems.
This project contributes towards the PBIM design by exploring the effects of energy storage motivations and am-bient conditions on the optimal PBIM energy storage capabilities and the subsequent impact on its performance aswhole. To quantify these impacts realistic case studies are developed and test the PBIM’s capabilities in Costa Rica andthe Netherlands. The PBIM, for each location, was assessed for its application in a grid-tied system for peak shavingapplications and its performance as a stand-alone solution.
As compared to conventional solar systems, the PBIM operates at higher temperatures, influencing the perfor-mance and lifetime of the incorporated components. This thesis commences by capturing the effects of elevatedoperating temperatures through the development of a PBIM model. The energy control strategy is devised to simulatethe battery charging profiles for the identified applications. Location specific parameters are then implemented toasses the PBIM performance and the influence of different climates.
A sizing methodology is used to derive the appropriate battery capacity for each case study. A comparison ismade between the dynamic characteristics of the optimally sized system for each of the locations, indicating thefulfillment of the respective system objectives, minimizing battery degradation and maximizing autarky. Furthermore,the technical and economic feasibility of the PBIM concept is assessed with respect to a conventional solar homesystem, leading to the conclusion that the PBIM, at this point in time, possesses technical characteristics comparableto that of a convectional PV system. The PBIM concept is still in the early stages of development and there are stillmany challenges that need to be overcome before its widespread usage.
iii

CONTENTS
Abstract iii
List of Figures vii
List of Tables ix
1 Introduction 11.1 Global Energy Scenario . . . . . . . . . . . . . . . . . . . . . . . . . . . . . . . . . . . . . . . . . . 11.2 Significance of Solar Energy. . . . . . . . . . . . . . . . . . . . . . . . . . . . . . . . . . . . . . . . 1
1.2.1 Role of PV-Battery Integrated Module . . . . . . . . . . . . . . . . . . . . . . . . . . . . . . . 21.3 Thesis Objective . . . . . . . . . . . . . . . . . . . . . . . . . . . . . . . . . . . . . . . . . . . . . 31.4 Research Questions . . . . . . . . . . . . . . . . . . . . . . . . . . . . . . . . . . . . . . . . . . . . 31.5 Thesis Outline . . . . . . . . . . . . . . . . . . . . . . . . . . . . . . . . . . . . . . . . . . . . . . 4
2 Literature Review 52.1 PV-Battery Integration . . . . . . . . . . . . . . . . . . . . . . . . . . . . . . . . . . . . . . . . . . 52.2 PBIM Design . . . . . . . . . . . . . . . . . . . . . . . . . . . . . . . . . . . . . . . . . . . . . . . 6
2.2.1 Design Constraints. . . . . . . . . . . . . . . . . . . . . . . . . . . . . . . . . . . . . . . . . 62.2.2 Component Selection . . . . . . . . . . . . . . . . . . . . . . . . . . . . . . . . . . . . . . . 72.2.3 System Architecture . . . . . . . . . . . . . . . . . . . . . . . . . . . . . . . . . . . . . . . . 82.2.4 Power Electronics . . . . . . . . . . . . . . . . . . . . . . . . . . . . . . . . . . . . . . . . . 8
2.3 Applications . . . . . . . . . . . . . . . . . . . . . . . . . . . . . . . . . . . . . . . . . . . . . . . 82.3.1 Grid-connected applications. . . . . . . . . . . . . . . . . . . . . . . . . . . . . . . . . . . . 92.3.2 Off-grid applications . . . . . . . . . . . . . . . . . . . . . . . . . . . . . . . . . . . . . . . . 9
2.4 Energy storage sizing . . . . . . . . . . . . . . . . . . . . . . . . . . . . . . . . . . . . . . . . . . . 92.4.1 Performance index. . . . . . . . . . . . . . . . . . . . . . . . . . . . . . . . . . . . . . . . . 102.4.2 Sizing methodologies . . . . . . . . . . . . . . . . . . . . . . . . . . . . . . . . . . . . . . . 112.4.3 Comparable Studies . . . . . . . . . . . . . . . . . . . . . . . . . . . . . . . . . . . . . . . . 11
2.5 Conclusions. . . . . . . . . . . . . . . . . . . . . . . . . . . . . . . . . . . . . . . . . . . . . . . . 12
3 PBIM Modelling 133.1 Photovoltaic Module . . . . . . . . . . . . . . . . . . . . . . . . . . . . . . . . . . . . . . . . . . . 13
3.1.1 Available solar energy . . . . . . . . . . . . . . . . . . . . . . . . . . . . . . . . . . . . . . . 133.1.2 PV performance . . . . . . . . . . . . . . . . . . . . . . . . . . . . . . . . . . . . . . . . . . 143.1.3 Meteorological data . . . . . . . . . . . . . . . . . . . . . . . . . . . . . . . . . . . . . . . . 14
3.2 Battery . . . . . . . . . . . . . . . . . . . . . . . . . . . . . . . . . . . . . . . . . . . . . . . . . . 143.2.1 Aging mechanisms . . . . . . . . . . . . . . . . . . . . . . . . . . . . . . . . . . . . . . . . . 143.2.2 Efficiency . . . . . . . . . . . . . . . . . . . . . . . . . . . . . . . . . . . . . . . . . . . . . 153.2.3 State of Charge . . . . . . . . . . . . . . . . . . . . . . . . . . . . . . . . . . . . . . . . . . . 153.2.4 Battery Regulation . . . . . . . . . . . . . . . . . . . . . . . . . . . . . . . . . . . . . . . . . 153.2.5 Battery Temperature . . . . . . . . . . . . . . . . . . . . . . . . . . . . . . . . . . . . . . . . 163.2.6 Temperature Effects . . . . . . . . . . . . . . . . . . . . . . . . . . . . . . . . . . . . . . . . 173.2.7 Cycling. . . . . . . . . . . . . . . . . . . . . . . . . . . . . . . . . . . . . . . . . . . . . . . 173.2.8 Aging. . . . . . . . . . . . . . . . . . . . . . . . . . . . . . . . . . . . . . . . . . . . . . . . 18
3.3 Power Electronics . . . . . . . . . . . . . . . . . . . . . . . . . . . . . . . . . . . . . . . . . . . . . 193.3.1 Limitations. . . . . . . . . . . . . . . . . . . . . . . . . . . . . . . . . . . . . . . . . . . . . 19
3.4 Conclusions. . . . . . . . . . . . . . . . . . . . . . . . . . . . . . . . . . . . . . . . . . . . . . . . 20
4 Grid Connected Peak Shaving Concept 214.1 Methodology . . . . . . . . . . . . . . . . . . . . . . . . . . . . . . . . . . . . . . . . . . . . . . . 21
4.1.1 Objectives . . . . . . . . . . . . . . . . . . . . . . . . . . . . . . . . . . . . . . . . . . . . . 214.1.2 Approach . . . . . . . . . . . . . . . . . . . . . . . . . . . . . . . . . . . . . . . . . . . . . 21
4.2 System Modelling . . . . . . . . . . . . . . . . . . . . . . . . . . . . . . . . . . . . . . . . . . . . . 224.2.1 Energy Control Strategy . . . . . . . . . . . . . . . . . . . . . . . . . . . . . . . . . . . . . . 224.2.2 Governing equations. . . . . . . . . . . . . . . . . . . . . . . . . . . . . . . . . . . . . . . . 22
v

4.3 Case Studies . . . . . . . . . . . . . . . . . . . . . . . . . . . . . . . . . . . . . . . . . . . . . . . 234.3.1 Location Analysis . . . . . . . . . . . . . . . . . . . . . . . . . . . . . . . . . . . . . . . . . 244.3.2 Scope of Data . . . . . . . . . . . . . . . . . . . . . . . . . . . . . . . . . . . . . . . . . . . 244.3.3 Costa Rica . . . . . . . . . . . . . . . . . . . . . . . . . . . . . . . . . . . . . . . . . . . . . 254.3.4 Multiple PBIMs . . . . . . . . . . . . . . . . . . . . . . . . . . . . . . . . . . . . . . . . . . 284.3.5 Netherlands . . . . . . . . . . . . . . . . . . . . . . . . . . . . . . . . . . . . . . . . . . . . 314.3.6 System Characteristics . . . . . . . . . . . . . . . . . . . . . . . . . . . . . . . . . . . . . . . 314.3.7 Optimal system characteristics. . . . . . . . . . . . . . . . . . . . . . . . . . . . . . . . . . . 35
4.4 Conclusions. . . . . . . . . . . . . . . . . . . . . . . . . . . . . . . . . . . . . . . . . . . . . . . . 37
5 Off-grid PBIM system 395.1 Methodology . . . . . . . . . . . . . . . . . . . . . . . . . . . . . . . . . . . . . . . . . . . . . . . 39
5.1.1 Objectives . . . . . . . . . . . . . . . . . . . . . . . . . . . . . . . . . . . . . . . . . . . . . 395.1.2 Approach . . . . . . . . . . . . . . . . . . . . . . . . . . . . . . . . . . . . . . . . . . . . . 39
5.2 System Modelling . . . . . . . . . . . . . . . . . . . . . . . . . . . . . . . . . . . . . . . . . . . . . 405.2.1 Energy control strategy . . . . . . . . . . . . . . . . . . . . . . . . . . . . . . . . . . . . . . 405.2.2 Governing equations. . . . . . . . . . . . . . . . . . . . . . . . . . . . . . . . . . . . . . . . 40
5.3 Case Studies . . . . . . . . . . . . . . . . . . . . . . . . . . . . . . . . . . . . . . . . . . . . . . . 405.3.1 Scope of Data . . . . . . . . . . . . . . . . . . . . . . . . . . . . . . . . . . . . . . . . . . . 415.3.2 PV array sizing . . . . . . . . . . . . . . . . . . . . . . . . . . . . . . . . . . . . . . . . . . . 415.3.3 Costa Rica . . . . . . . . . . . . . . . . . . . . . . . . . . . . . . . . . . . . . . . . . . . . . 425.3.4 Netherlands . . . . . . . . . . . . . . . . . . . . . . . . . . . . . . . . . . . . . . . . . . . . 435.3.5 Optimal system characteristics. . . . . . . . . . . . . . . . . . . . . . . . . . . . . . . . . . . 445.3.6 Conclusions . . . . . . . . . . . . . . . . . . . . . . . . . . . . . . . . . . . . . . . . . . . . 47
6 PV-Battery Integrated Module Feasibility 496.1 Scenario Design. . . . . . . . . . . . . . . . . . . . . . . . . . . . . . . . . . . . . . . . . . . . . . 49
6.1.1 Energy Storage . . . . . . . . . . . . . . . . . . . . . . . . . . . . . . . . . . . . . . . . . . . 496.1.2 PV Module . . . . . . . . . . . . . . . . . . . . . . . . . . . . . . . . . . . . . . . . . . . . . 49
6.2 Technical Feasibility . . . . . . . . . . . . . . . . . . . . . . . . . . . . . . . . . . . . . . . . . . . 496.2.1 PV Module temperature . . . . . . . . . . . . . . . . . . . . . . . . . . . . . . . . . . . . . . 496.2.2 PV Energy Yield . . . . . . . . . . . . . . . . . . . . . . . . . . . . . . . . . . . . . . . . . . 506.2.3 Battery Degradation . . . . . . . . . . . . . . . . . . . . . . . . . . . . . . . . . . . . . . . . 506.2.4 Energy Drawn From The Grid . . . . . . . . . . . . . . . . . . . . . . . . . . . . . . . . . . . 51
6.3 Economic Feasibility . . . . . . . . . . . . . . . . . . . . . . . . . . . . . . . . . . . . . . . . . . . 526.3.1 Energy Bill Reduction . . . . . . . . . . . . . . . . . . . . . . . . . . . . . . . . . . . . . . . 526.3.2 Initial Capital Costs . . . . . . . . . . . . . . . . . . . . . . . . . . . . . . . . . . . . . . . . 526.3.3 Payback Time . . . . . . . . . . . . . . . . . . . . . . . . . . . . . . . . . . . . . . . . . . . 52
6.4 Conclusions. . . . . . . . . . . . . . . . . . . . . . . . . . . . . . . . . . . . . . . . . . . . . . . . 53
7 Conclusions & Recommendations 557.1 Conclusions. . . . . . . . . . . . . . . . . . . . . . . . . . . . . . . . . . . . . . . . . . . . . . . . 557.2 Recommendations . . . . . . . . . . . . . . . . . . . . . . . . . . . . . . . . . . . . . . . . . . . . 56
7.2.1 System Modelling . . . . . . . . . . . . . . . . . . . . . . . . . . . . . . . . . . . . . . . . . 567.2.2 Model Validation. . . . . . . . . . . . . . . . . . . . . . . . . . . . . . . . . . . . . . . . . . 577.2.3 PBIM Battery Sizing . . . . . . . . . . . . . . . . . . . . . . . . . . . . . . . . . . . . . . . . 57
A Appendix 59A.1 Data Sheets . . . . . . . . . . . . . . . . . . . . . . . . . . . . . . . . . . . . . . . . . . . . . . . . 59
A.1.1 PV module Data Sheet . . . . . . . . . . . . . . . . . . . . . . . . . . . . . . . . . . . . . . . 59A.1.2 Battery Data Sheets . . . . . . . . . . . . . . . . . . . . . . . . . . . . . . . . . . . . . . . . 59
Bibliography 65
B Acknowledgments 67
vi
LIST OF FIGURES
1.1 Historic trend of PV cost [1]. . . . . . . . . . . . . . . . . . . . . . . . . . . . . . . . . . . . . . . . . . . . . . . 21.2 PV System cost breakdown [1]. . . . . . . . . . . . . . . . . . . . . . . . . . . . . . . . . . . . . . . . . . . . . 21.3 The PBIM concept; adapted from [2]. . . . . . . . . . . . . . . . . . . . . . . . . . . . . . . . . . . . . . . . . 3
2.1 The ’Multifunctional lithium-ion module’ [3] . . . . . . . . . . . . . . . . . . . . . . . . . . . . . . . . . . . 52.2 Architecture of the ’Multifunctional module’ [3] . . . . . . . . . . . . . . . . . . . . . . . . . . . . . . . . . . 52.3 Interdependence of system variables. Image from [4]. . . . . . . . . . . . . . . . . . . . . . . . . . . . . . . 62.4 Ragone plot of various energy storage methods [5] . . . . . . . . . . . . . . . . . . . . . . . . . . . . . . . . 82.5 Assembly of multiple Prismatic cells connected in parallel [6] . . . . . . . . . . . . . . . . . . . . . . . . . . 82.6 The AC-coupled system architecture [7]. . . . . . . . . . . . . . . . . . . . . . . . . . . . . . . . . . . . . . . 82.7 The peak-shaving concept [8]. . . . . . . . . . . . . . . . . . . . . . . . . . . . . . . . . . . . . . . . . . . . . 102.8 Potential sizing methodologies. . . . . . . . . . . . . . . . . . . . . . . . . . . . . . . . . . . . . . . . . . . . 10
3.1 Change in PV efficiency as a function of module temperature for the 1st of January, Costa Rica. . . . . . . 143.2 Cell voltage (1 C-rate)and VoC as a function of SoC. . . . . . . . . . . . . . . . . . . . . . . . . . . . . . . . . 163.3 Temperature effect on VoC as a function of SoC. . . . . . . . . . . . . . . . . . . . . . . . . . . . . . . . . . . 163.4 Simulated relation between battery temperature, SoC and ambient temperature . . . . . . . . . . . . . . 173.5 Simulation results of battery cycling. . . . . . . . . . . . . . . . . . . . . . . . . . . . . . . . . . . . . . . . . 173.6 Voltage and deliverable capacity at various temperatures [6]. . . . . . . . . . . . . . . . . . . . . . . . . . . 183.7 Cells Cycle Life (1C Dis/Charge rates, adapted from [6] . . . . . . . . . . . . . . . . . . . . . . . . . . . . . . 183.8 Simulation results of battery aging . . . . . . . . . . . . . . . . . . . . . . . . . . . . . . . . . . . . . . . . . . 183.9 The algorithm used to model the battery capacity loss. . . . . . . . . . . . . . . . . . . . . . . . . . . . . . . 193.10 Efficiency of the PV inverter as a function of input power [9]. . . . . . . . . . . . . . . . . . . . . . . . . . . 203.11 Efficiency of the battery inverter as a function of input power [9]. . . . . . . . . . . . . . . . . . . . . . . . . 20
4.1 An overview of the PBIM model. . . . . . . . . . . . . . . . . . . . . . . . . . . . . . . . . . . . . . . . . . . . 224.2 The controller logic for peak shaving . . . . . . . . . . . . . . . . . . . . . . . . . . . . . . . . . . . . . . . . . 234.3 Annual PV production Costa Rica . . . . . . . . . . . . . . . . . . . . . . . . . . . . . . . . . . . . . . . . . . 244.4 Annual PV production Netherlands . . . . . . . . . . . . . . . . . . . . . . . . . . . . . . . . . . . . . . . . . 244.5 Daily load variation,Costa Rica . . . . . . . . . . . . . . . . . . . . . . . . . . . . . . . . . . . . . . . . . . . . 254.6 Daily load variation, Netherlands . . . . . . . . . . . . . . . . . . . . . . . . . . . . . . . . . . . . . . . . . . . 254.7 The peak shave scenario, Costa Rica. . . . . . . . . . . . . . . . . . . . . . . . . . . . . . . . . . . . . . . . . 264.8 PBIM System characteristics, simulation results for a 2 day period . . . . . . . . . . . . . . . . . . . . . . . 274.9 Effect of peak load drawn from the grid and battery capacity loss with respect to installed battery capacity
on an annual basis. . . . . . . . . . . . . . . . . . . . . . . . . . . . . . . . . . . . . . . . . . . . . . . . . . . . 284.10 Annual energy from grid during peak hours. . . . . . . . . . . . . . . . . . . . . . . . . . . . . . . . . . . . . 294.11 Annual energy drawn from grid during off-peak hours. . . . . . . . . . . . . . . . . . . . . . . . . . . . . . . 294.12 The annual battery capacity loss . . . . . . . . . . . . . . . . . . . . . . . . . . . . . . . . . . . . . . . . . . . 294.13 Battery sizing Costa Rica. optimal battery sized circled . . . . . . . . . . . . . . . . . . . . . . . . . . . . . . 294.14 Lithium-ion battery price trend. Source [10]. . . . . . . . . . . . . . . . . . . . . . . . . . . . . . . . . . . . . 314.15 The lifetime profit of a single PBIM as a function of battery costs and installed battery capacity. . . . . . 314.16 The total simulated capacity loss as a function of battery size. . . . . . . . . . . . . . . . . . . . . . . . . . . 314.17 The peak shave scenario, Netherlands (March). . . . . . . . . . . . . . . . . . . . . . . . . . . . . . . . . . . 324.18 PBIM System characteristics, simulation results for a 2 day period . . . . . . . . . . . . . . . . . . . . . . . 334.19 Annual energy from grid during peak hours. . . . . . . . . . . . . . . . . . . . . . . . . . . . . . . . . . . . . 344.20 Annual energy drawn from grid during off-peak hours. . . . . . . . . . . . . . . . . . . . . . . . . . . . . . . 344.21 The annual battery capacity loss. . . . . . . . . . . . . . . . . . . . . . . . . . . . . . . . . . . . . . . . . . . . 354.22 Battery sizing Netherlands. . . . . . . . . . . . . . . . . . . . . . . . . . . . . . . . . . . . . . . . . . . . . . . 354.23 The lifetime profit of a single PBIM as a function of battery costs and installed battery capacity. . . . . . 354.24 Total battery capacity loss over system lifetime. . . . . . . . . . . . . . . . . . . . . . . . . . . . . . . . . . . 354.25 Monthly peak load autarky, Costa Rica . . . . . . . . . . . . . . . . . . . . . . . . . . . . . . . . . . . . . . . 364.26 Monthly peak load autarky, Netherlands . . . . . . . . . . . . . . . . . . . . . . . . . . . . . . . . . . . . . . 364.27 Annual SoC variation, Costa Rica . . . . . . . . . . . . . . . . . . . . . . . . . . . . . . . . . . . . . . . . . . . 374.28 Annual SoC variation, Netherlands . . . . . . . . . . . . . . . . . . . . . . . . . . . . . . . . . . . . . . . . . . 374.29 Monthly battery degradation, Costa Rica . . . . . . . . . . . . . . . . . . . . . . . . . . . . . . . . . . . . . . 37
5.1 The controller logic for peak shaving . . . . . . . . . . . . . . . . . . . . . . . . . . . . . . . . . . . . . . . . . 40
vii

5.2 Applied load profile for off-grid case studies . . . . . . . . . . . . . . . . . . . . . . . . . . . . . . . . . . . . 415.3 Loss of Load probability, as a function of system size, Costa Rica . . . . . . . . . . . . . . . . . . . . . . . . 425.4 Battery capacit losses as a function of system size, Costa Rica. . . . . . . . . . . . . . . . . . . . . . . . . . 425.5 Identification of the critical battery capacity, Costa Rica. . . . . . . . . . . . . . . . . . . . . . . . . . . . . . 435.6 LLP as a function of installed battery capacity, Netherlands . . . . . . . . . . . . . . . . . . . . . . . . . . . 445.7 Annual capacity loss, Netherlands. . . . . . . . . . . . . . . . . . . . . . . . . . . . . . . . . . . . . . . . . . . 445.8 Identification of the critical battery capacity, Netherlands . . . . . . . . . . . . . . . . . . . . . . . . . . . . 445.9 Monthly system autarky, Costa Rica. . . . . . . . . . . . . . . . . . . . . . . . . . . . . . . . . . . . . . . . . . 455.10 Monthly system autarky, Netherlands. . . . . . . . . . . . . . . . . . . . . . . . . . . . . . . . . . . . . . . . . 455.11 SoC variations, Costa Rica . . . . . . . . . . . . . . . . . . . . . . . . . . . . . . . . . . . . . . . . . . . . . . . 455.12 SoC variations, Netherlands . . . . . . . . . . . . . . . . . . . . . . . . . . . . . . . . . . . . . . . . . . . . . . 455.13 Monthly energy dump, Costa Rica. . . . . . . . . . . . . . . . . . . . . . . . . . . . . . . . . . . . . . . . . . . 465.14 Monthly energy dump Netherlands. . . . . . . . . . . . . . . . . . . . . . . . . . . . . . . . . . . . . . . . . . 465.15 Comparison of the monthly battery degradation between Costa Rica (CR) and the Netherlands (NL). . . 46
6.1 PV temperature in conventional and PBIM systems for day 100 of the year. . . . . . . . . . . . . . . . . . . 506.2 Battery capacity loss for the conventional and PBIM solar systems. . . . . . . . . . . . . . . . . . . . . . . 516.3 Annual Energy drawn from grid during peak hours . . . . . . . . . . . . . . . . . . . . . . . . . . . . . . . . 516.4 Total annual energy drawn from grid . . . . . . . . . . . . . . . . . . . . . . . . . . . . . . . . . . . . . . . . 516.5 Normalized annual energy costs. . . . . . . . . . . . . . . . . . . . . . . . . . . . . . . . . . . . . . . . . . . . 52
viii

LIST OF TABLES
2.1 PV Module Characteristics at Standard Testing Conditions (STC). . . . . . . . . . . . . . . . . . . . . . . . . 72.2 Battery Characteristics . . . . . . . . . . . . . . . . . . . . . . . . . . . . . . . . . . . . . . . . . . . . . . . . . 7
3.1 Battery Aging; causes, effects, and influences. Adapted from [11] . . . . . . . . . . . . . . . . . . . . . . . 15
4.1 List of Symbols . . . . . . . . . . . . . . . . . . . . . . . . . . . . . . . . . . . . . . . . . . . . . . . . . . . . . 244.2 Pricing Scheme Costa Rica, [12]. . . . . . . . . . . . . . . . . . . . . . . . . . . . . . . . . . . . . . . . . . . . 264.3 PBIM component costs. . . . . . . . . . . . . . . . . . . . . . . . . . . . . . . . . . . . . . . . . . . . . . . . . 304.4 Pricing Scheme Netherlands, [13] . . . . . . . . . . . . . . . . . . . . . . . . . . . . . . . . . . . . . . . . . . 31
5.1 PV Array sizing for the considered locations . . . . . . . . . . . . . . . . . . . . . . . . . . . . . . . . . . . . 42
6.1 Energy generated by the 265Wp Jinko PV module in PBIM and conventional applications, for the differ-ent locations . . . . . . . . . . . . . . . . . . . . . . . . . . . . . . . . . . . . . . . . . . . . . . . . . . . . . . . 50
6.2 PBIM component cost. . . . . . . . . . . . . . . . . . . . . . . . . . . . . . . . . . . . . . . . . . . . . . . . . . 526.3 Conventional system component costs. . . . . . . . . . . . . . . . . . . . . . . . . . . . . . . . . . . . . . . . 52
ix


1INTRODUCTION
1.1. GLOBAL ENERGY SCENARIOThroughout the centuries, energy has played a key role in spurring industrialization, raising living standards and
has aided the transformation of the global economy and society to that we see today. It is with no doubt that energywill continue to be a vital pillar of our civilization for years to come. With the Untied Nations predicting a drasticglobal population increase of 1.7 billion by the year 2035, the global energy demand is poised to follow a similar in-creasing trend. The rapid economic growth of developing nations has consistently lead to the dramatic increase oflocal electrification rates. As these emerging markets evolve, generally speaking, the standard of living of the localpopulation rise: further accelerating the growing of energy demands. Essential for future progress and developmentof mankind is an uninterrupted and predictable source of energy. Nations which rely heavily on external stakeholdersfor energy resources become particularly vulnerable to factors such as limitations in energy supply, price and currencyfluctuations, which are all influenced by numerous external factors. The key to develop a stable economy and societyis energy security.
The global energy demand is estimated to double by 2060 [14]. Traditionally, a fossil fuel based approach has beenadopted to meet growing energy demands; the flaws in this ideology has rapidly become indisputable for a numberof reasons. Firstly, fossil fuel prices have consistently proven to be highly volatile and heavily influenced by politicalfactors. Combined with its increasing scarcity the use of fossil-fuels as an energy source has archaic. To make mattersworse the harmful carbon dioxide and greenhouse gas emissions directly associated with fossil fuel combustion hasconsistently been proven to be detrimental to the Earth’s climate; negatively effecting the natural environment andhumanity’s living standards. To ensure energy security and the preservation of the natural environment an energytransition is needed.
The penetration rate of renewable energy has rapidly grown since the turn of the century currently accountingfor 24.5% of electricity produced globally. Renewable energy technologies have proven to be an ideal replacement offossil fuels. Harnessing energy from renewable abundant sources such as the sun, wind and waste allows for nationsto become self-reliant in terms of meeting their energy needs. In this manner the issue of meeting rapidly growingenergy demands and climate change mitigation are simultaneously addressed. With the field of renewable energygathering increasing momentum and global attention, the development of the required technologies has lead to de-creasing prices and their increasing effectiveness. These trends will allow renewable sources of energy to become acost-effective and widespread solution in the energy market.
Unlike the traditional approach whereby a single technology and fuel has dominated the energy industry, thesuccessful power system of the future will most likely employ a wide range of technologies to harness energy from avariety of sources. Due to its intermittent nature, energy harnessed from renewable sources such as the Sun and windrequires effective management ensuring a reliable delivery of energy. It is important nations do not rely on a singlesource of energy and that the energetic potential of each of the sources is fully understood.
1.2. SIGNIFICANCE OF SOLAR ENERGYThe immense magnitude of available solar energy makes it an appealing source of energy. The United Nations De-
velopment Programme (UNDP) has estimated that the available solar energy on Earth lies in the range 1,575-49,837 EJ.Compared to the world energy consumption,in 2012 of 559.8 EJ; the abundance of the energy source is apparent[15].Photovolatic technology has developed rapidly over the last 30 years resulting in lower costs with increasing installedcapacity, a trend that is expected to continue. Figure 1.1 shows the decreasing price trend for c-Si and CdTe solar celltechnology as a function of cumulative production volume, a consistent trend spanning the last 40 years. Accordingto the International Energy Agency (IEA) by 2050 solar energy is expected to account for 20% of the global energy pro-duction and by over 60% in 2100 [16]. However, as it currently stands a major barrier in limiting the penetration rateof PV technology is the high initial investment costs, resulting in lengthy, financially unattractive payback times.
1

Figure 1.1: Historic trend of PV cost [1].
1.2.1. ROLE OF PV-BATTERY INTEGRATED MODULETo combat the issue of high initial costs, the concept of a single PV-Battery Integrated (PBIM) module is proposed,
Figure 1.3. Solar system costs can be reduced without improving component efficiencies. Instead to decrease overallcosts, installation and Balance of System (BoS) costs are targeted. Figure 1.2 provides a cost breakdown for PV sys-tems of various sizes for residential, commercial and utility applications. Residential systems are observed to be moreexpensive per watt-peak (Wp ) since they do not benefit from economies of scale. Larger, more commercial systemshave the benefit of acquiring large volumes of equipment at a time, driving down the price per unit. Commonly seenon the residential scale is the intricate customization of every PV system. Based on the available finances and thehousehold energy requirements, the PV array, battery system and the compatible power electronics need to be iden-tified and sized; a process which often requires the expertise of a hired professional. The installation of the PV systemrequires the connections between the various components to be completed and, as mentioned before requires theconsultation of a technical expert to do so. These so called ’soft’ costs that currently account for 40% of the total costsof a residential solar system. The proposed PBIM concept is aimed to reduce PV system ’soft’ costs using existing andmature technology in an integrated modular fashion.
Figure 1.2: PV System cost breakdown [1].
Physically integrating the necessary BoS components at the rear of the actual PV module, creating a single mod-ular and compact system, facilitates the installation process while making efficient use of the designated installation
2

space. With user-friendly characteristics the complexity of the installation process is reduced and thus requiring lesstechnical expertise, influencing the installation costs. The development of a standardized solar system, such as thePBIM, removes the need for detailed system sizing customization. Such a system would then benefit from economiesof scale and due to its modular nature be easily scalable. The capacity of the PBIM system can be altered by adding/removing the desired number of PBIMs to match the current energy demands.
The potential role of the PBIM within the solar energy market is to address the high initial investment costs, com-monly associated with conventional solar home systems. However, the physical integration of PV-battery systems iscurrently still in the early stages of development and does not come without any drawbacks. Due to its integratednature the implemented design within the PBIM is expected to optimally perform in a wide range of applications andenvironments. The accurate sizing of the PBIM’s energy storage capabilities has, to date, not been defined and willplay a significant role in influencing the PBIM effectiveness. The energy storage sizing impacts the system’s ability tostore energy for use during times of low/no solar energy. Furthermore, the battery accounts for a significant amountof the total costs and thus over-sizing is to be avoided to ensure the PBIM is cost effective. This highlights the signif-icance for the need for a robust system design. It would be essential to understand how the definition of an optimalPBIM system design varies with respect to its application and the surrounding environment.
Figure 1.3: The PBIM concept; adapted from [2].
1.3. THESIS OBJECTIVEA core component essential for the effective application of the PBIM is its battery. This project is aimed at under-
standing the impact of external factors on the definition and sizing of the optimal battery capacity for enabling thecompetitive and optimal usage of the PBIM. The overall thesis objective is summarized in the following statement;
• Propose and implement a sizing methodology to determine the optimal size of PBIM battery for its competitiveapplication in selected scenarios.
1.4. RESEARCH QUESTIONS1. What is the impact of local weather conditions and energy storage motivations on the PV-Battery Integrated
Module?
• In which applications is the PBIM an effective solution?
2. What is the most appropriate battery size to install in a single PV-Battery Integrated Module for each energystorage scenario?
• What are the system requirements for each energy storage scenario?
• How can the appropriate battery size be identified?
3. How effective is an optimally sized PBIM for the identified scenarios?
4. How does an appropriately sized PV-Battery Integrated Module compare to a conventional solar system?
3

• How does the performance of the PV-Battery Integrated Module compare to a conventional system?
• Is the PV-Battery Integrated Module a financially viable solution?
1.5. THESIS OUTLINEChapter 2 - Literature review
In this chapter, the evolution of the PBIM design is presented extending to include and justify the current design.Existing components are identified for their use in the PBIM concept, this selection is based on the compilation ofidentified components from previous studies. The potential applications of the PBIM are then discussed.
Chapter 3 - PBIM ModellingThe theory applied to model the dynamic characteristics of the incorporated components is presented. Included aresimulation results capturing the dependence of the components on the operational conditions. The components aremodeled taking into consideration the specific characteristics identified in chapter 1.
Chapter 4 - Grid-connected peak-shaving applicationsThe application of the PBIM for grid-connected peak shaving applications is modelled and assessed for different lo-cations. The model of the individual components are grouped together and an energy control strategy is integrated tosimulate a grid-connected system for peak shaving. This chapter includes an analysis of the system performance andimplements a sizing methodology to identify the optimal storage capacity.
Chapter 5 - Off-grid applicationsThe effectiveness of the PBIM for off-grid applications in different locations is analyzed. Similarly to Chapter 4 theappropriate battery size to install in a single PBIM is identified. A comparison is made between the systems simulatedfor the different locations.
Chapter 6 - PV-Battery Integrated Module FeasibilityThe feasibility of the PBIM concept with respect to technical and financial aspects are discussed in this Chapter andcomparisons are made with a conventional system.
Chapter 7 - Conclusions & RecommendationsIn this chapter the research questions are answered based on the findings of this project. Finally, in hindsight recom-mendations for future work and improvements are outlined.
4

2LITERATURE REVIEW
The first step in investigating the dynamic behaviour of the PBIM is to explore previous research related to itsdesign and application. This Chapter aims at explaining, in detail, the PV-Battery integrated Module concept andextends to include a literature study presenting the findings on the physical integration process of PV-Battery sys-tems and identifying existing designs. Additionally, energy storage sizing methodologies for comparable projects arediscussed.
2.1. PV-BATTERY INTEGRATIONThe PBIM is a relatively recent concept sparking interest from both private firms and research institutes. The con-
cept of integrating energy storage together with PV cells began on a small scale, with the integration of a capacitor intoa solar cell and demonstrated a storage efficiency of 5.12% ; laying the foundations for future work [17]. This evolvedinto the integration of lithium-ion cells and solar cells; mainly low power systems for portable and wearable applica-tions . However, these primitive solutions tended to be inefficient due to the lack of battery charging and dischargingschemes[18]. This highlighted the need to also incorporate the appropriate power electronics. Early studies describethe integration of inverters to a PV module, an AC output PV module is presented in [19].
Figure 2.1: The ’Multifunctional lithium-ion module’ [3]
Figure 2.2: Architecture of the ’Multifunctional module’ [3]
According to the literature study presented in [4], the integration of an energy storage unit, PV module and theelectronic control was initially proposed by [3] (Figures 2.1 & 2.2). A prototype of this concept was built and tested;a pioneering design due to the inclusion of the supervisory and control system design to control both the MaximumPower Point Tracker (MPPT) and the charging cycles of the battery. This study demonstrates the dynamic manner inwhich the integrated concept can be used as well as outlining a few restrictions. However, it does not cover its keytechnical features. The evolutionary time-line of the PBIM concept extends further with additional studies directedtowards the battery management system which is subsequently used to supply larger loads [18].
ADDITIONAL BENEFITS
In addition to the benefits outlined in Chapter 1 additional advantages of PBIM usage have been identified.
5
1. Reduced shading lossesEach PV module is connected to its exclusive MPPT, this implies better utilization per PV module. Shadingeffects across the entire PV array will have a smaller impact compared to a centralized conventional system [20].
2. Modular approachAppropriately scaling the system with respect to the energy demand is facilitated by adding/removing a PBIM inparallel. This eliminates having to initially oversize BoS components in a centralized solar system in anticipationof future system expansion.
3. PortableDue to its compact and modular nature the PBIM is portable, expanding its application spectrum to includeback up solutions; increasing the system’s reliability.
EXPECTED CHALLENGES
1. Heat ManagementHigh internal operation temperatures are expected in the PBIM, therefore in order to ensure component longevityand optimal performance the implementation of a cooling system is required.
2. Optimal SizingThe PBIM is expected to be used for a variety of applications, however to define the optimal storage size for suchdynamic usage will result in a sub-optimal storage capacity as compared to the conventional solution wherebythe optimal storage capacity is customized for each system.
3. Component SelectionThe appropriate underlying technology of the implemented components, especially the battery, is restricted.The desirable battery characteristics include high cycle lifetime, influencing the lifetime of the PBIM as a whole.Furthermore, the appropriate battery technology should be capable of nominal operation at a wide range ofambient temperatures. The maximum weight of the PBIM is limited. The PV panel and battery selection shouldreflect these restrictions. To make optimal use of the restricted space at the rear of the PV panel the batteryenergy density should be high, allowing for ample space thus facilitating heat removal.
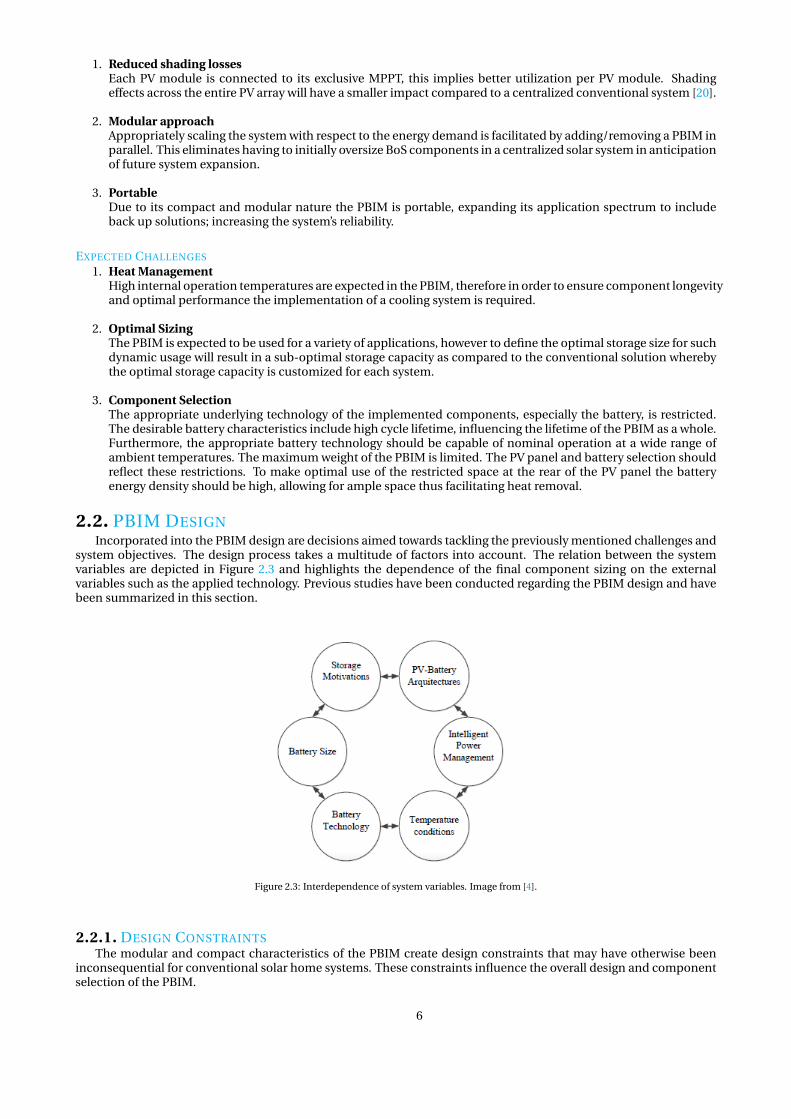
2.2. PBIM DESIGNIncorporated into the PBIM design are decisions aimed towards tackling the previously mentioned challenges and
system objectives. The design process takes a multitude of factors into account. The relation between the systemvariables are depicted in Figure 2.3 and highlights the dependence of the final component sizing on the externalvariables such as the applied technology. Previous studies have been conducted regarding the PBIM design and havebeen summarized in this section.
Figure 2.3: Interdependence of system variables. Image from [4].
2.2.1. DESIGN CONSTRAINTSThe modular and compact characteristics of the PBIM create design constraints that may have otherwise been
inconsequential for conventional solar home systems. These constraints influence the overall design and componentselection of the PBIM.
6

Parameter Value
Efficiency (%) 16.19Maximum power (W) 265Nominal voltage (V) 31.4Nominal current (A) 8.44
Open Circuit voltage (V) 38.6Short Circuit current (A) 9.03
Module length (m) 1.65Module width (m) 0.99Module area (m2) 1.63
Temp coeff Pmmp (%/°C) -0.41Temp coeff Voc (%/°C) -0.31Temp coeff Isc (%/°C) -0.06
Table 2.1: PV Module Characteristics at Standard Testing Conditions(STC).
Parameter Value
Dimensions (mm) 7.25 x 16Capacity (Ah) 19.5
Nominal Voltage 3.3Specific Energy (Wh/Kg) 131
Operating Temperature (°C) -30 to 55
Table 2.2: Battery Characteristics
HEAT CONSTRAINTS
Incorporating the battery to the rear of the PV module will inevitably lead to higher operating temperatures of thePV module, battery and the power electronics. To minimize the negative effect of elevated temperatures the designtakes into consideration the optimal distance between the PV module and the battery. Installing the battery banktoo close to the module will severely limit the heat removal from the PBIM via natural convection. On the otherhand, installing the battery at greater distance from the PV module will increase the size, weight and thus the ease ofinstallation of the PBIM. An elaborate thermal analysis of the PBIM is presented in [4].
Component performance and lifetime are greatly dependent on temperature. The significance of temperature onthe component partially depends on the component characteristics, therefore, by selecting components capable ofefficiently operating in elevated temperatures, the negative influence of temperature can be minimized.
PHYSICAL CONSTRAINTS
The dimensions and weight of the PBIM play a role in ascertaining its effectiveness as a portable and modular solarsystem solution. For residential applications most of the PV modules are installed on rooftops, this implies that theweight of the PBIM is limited by the rooftop weight carrying capabilities. Furthermore the available area is also oftenlimited thus requiring the PBIM to adhere to such constraints. Taken into consideration in the component selectionprocess is the specific energy Wh/Kg of the components which ensures the PBIM to be energetically effective withinthe weight and dimension constraints.
2.2.2. COMPONENT SELECTIONThe optimal battery capacity to incorporate into the PBIM is significantly impacted by the component character-
istics and the implemented control strategy, it is therefore necessary to predefined these variables. In previous studies[18] & [21] the PV module, battery and power electronics have been separately defined. In this section the currentPBIM design is outlined, and the component characteristics are used as data inputs in an effort to optimally size thebattery.
PV MODULE
The performance of the solar module is heavily influenced by ambient irradiance and temperature. Optimallyselecting a PV module based on the expected operational ambient conditions will enhance the PV module perfor-mance and thus result in a higher energy yield. In [21], a comparison was conducted between commercially availablePV modules with the potential for PBIM usage. The module’s weight, rated power, price and temperature coefficientproperties were considered in this comparison, thereby ensuring the selected PV module had the necessary desirablecharacteristics and remain cost effective. As a conclusion of the comparison, the Jinko Solar 265Wp poly crystallinesolar module was selected and its characteristics are presented in Table 2.1.
ENERGY STORAGE
The Prismatic Nanophosphate Lithium-ion pouch cell from A123 systems is implemented into the PBIM. Lithium-ion technology posses good power and energy density (Figure 2.4) as compared to other available battery technolo-gies. Throughout the discharging process lithium-ion batteries maintain a constant voltage until the battery is almostdischarged; allowing for greater discharging efficiency, unlike the previously popular lead-acid batteries. The imple-mented battery has an expected lifetime of 5000 cycles when operating at 25 °C, therefore ensuring the lifetime of theintegrated module is maximized. In addition, the shape of the batteries are ideal. Their compact rectangular formallow for optimal space usage, Figure 2.5.
7

Figure 2.4: Ragone plot of various energy storage methods [5]
Figure 2.5: Assembly of multiple Prismatic cells connected in parallel [6]
2.2.3. SYSTEM ARCHITECTUREBased on the work presented in [21] & [7], the AC coupled architecture has proven to be effective when consid-
ering the integrated PV-battery systems. An AC bus is utilized for the interconnection between the battery and PVmodule, Figure 2.6. This construction requires a unidirectional DC-AC inverter between the PV panel and AC bus. Abi-directional DC-AC inverter is also needed between the battery and the AC-bus and its function varies dependingon the battery activity (charging/discharging). The AC loads or the grid is connected directly to the AC bus.
Figure 2.6: The AC-coupled system architecture [7].
2.2.4. POWER ELECTRONICSFor the selected topology two power converters are needed. The uni-directional inverter connected to PV mod-
ule is incorporated with MPPT capabilities to alter the operating voltage of the module in response to the weatherconditions; ensuring its efficient operation. To optimize battery lifetime charging and discharging needs to occur inaccordance with the nominal battery characteristics, a charge controller is used to serve this purpose. Based on thebattery characteristics the charge controller can be programmed to dictate battery charging. In this setup the chargecontroller and the bi-directional inverter consist of a single device, converting between the DC battery requirementsand the AC bus.
2.3. APPLICATIONSTo reap the full benefits the PBIM has to offer, it application in the residential sector is deemed the most suitable.
The PBIM is equipped with a battery, the motivation for its use varies depending on the required level of autonomy. Inthis section the residential applications in which the PBIM could potentially become a competitive technical solutionin the solar energy market are defined. The energy storage motivations for residential applications depend on thewhether the system is connected to the grid.
8

The use of batteries in grid connected systems is becoming increasingly common and are used for a variety of rea-sons. For instance, batteries are used for smoothing solar power generation and preventing sudden spikes in deliveredenergy. In terms of microgrid stabilization, the grid connected batteries provide frequency and voltage regulation orsimply as a backup during islanding mode. Additional applications such as diminishing congestion and peak shavingmay also be considered. However, solely from a single household point of view, few of the mentioned applicationsare relevant. On the other hand, solar systems that lack grid connectivity require a higher level of autonomy whichintuitively requires a solar system with greater energy storage capabilities than grid-connected systems. Such off-gridapplications are especially relevant for the PBIM, particularly for its application in rural regions of developing coun-tries. Taking this into consideration the PBIM is potentially an effect solution for both grid-connected and off-gridscenarios.
The PBIM concept has, to date, been analyzed for a variety of energy storage motivations and locations. A casestudy presented in [21] analyses the effectiveness of the PBIM for grid-connected applications in Costa- Rica and theNetherlands. The considered energy storage scenarios are for peak-shaving and reducing the dependence of a house-hold on the grid and extends to provide a comparison between conventional and PBIM systems. The off-grid appli-cation of the PBIM in Cambodia is presented in [22], whereby the system requirements and performance is assessed.This project aims to extend upon this previous work.
2.3.1. GRID-CONNECTED APPLICATIONSFrom a residential energy consumer point of view, motivations for shifting to renewable energy technologies is
predominately due lower overall cost. Since 71% of consumers would adopt renewable energy technologies for loweroverall cost and only 48% for sustainability reasons [23], the implementation of the PBIM in a grid connected scenariowould predominately be to reduce the household energy cost, and this objective can be accomplished in a numberof ways. For a PV system without any energy storage, the generated energy from the PV array can be used directly bythe loads. In the case excess energy is generated, this can be exported to the grid. Depending on the energy providerdifferent compensation schemes are offered to the electricity consumer, who now becomes an electricity producer i.ea prosumer [5]. These concepts are net-metering and feed-in tariffs and in this manner the prosumer is able to reducetheir energy costs. On the other hand, incorporating energy storage into the grid connected PV system, as is the casewith the PBIM, the energy generated by the PV array can be stored and either be used or sold to the grid during atime period when the energy prices are high. Energy demands on a national scale vary throughout the day, basedon the demand and supply energy providers set the energy selling price which therefore also varies throughout theday. A household’s peak load often coincides with the peak demand hours of the grid, resulting in higher energy costsduring this time period [8]. During weekdays the household peak load typically occurs during the morning or eveningwhen people are at home [24]. Therefore, there is a mismatch between periods of high energy demands/costs andthe PV generation. The implementation of the energy storage bridges the temporal gap between the PV array energygeneration and the hours of high energy prices (peak hours) allowing for the prosumer to incur additional financialsavings. The peak shaving concept is depicted in Figure 2.7, which illustrates the redistribution of power throughoutthe considered time period. The recharge period occurs during off-peak times, whereby energy is used to charge thebattery; resulting in an increased apparent load. The battery is then discharged during the peak period, decreasing theapparent power during this time period. The peak of the load profile is shaved by meeting the peak load requirementswith the energy stored from the battery.
As a worldwide trend, the design of energy distribution grids deviates from a centralized design and approaches adecentralized configuration. Traditional centralized bulk power systems are characterized by a uni-directional powerflow from the generating units to the consumer. However as the penetration rate of renewable energy sources in-creases and with the introduction of new technologies such as electric vehicles a high variability of energy demandand supply is expected. This also results in the bi-directional power flow in power systems, whereby energy can beboth imported and exported from the grid by private consumers. This deviation from the traditional centralized powersystem introduces increased dynamic energy pricing and therefore makes peak shaving a very interesting applicationfor the PBIM.
2.3.2. OFF-GRID APPLICATIONSThe demand for autonomous energy systems is rapidly growing particularly in many unelectrifed regions across
the globe. These regions tend to predominately be rural areas of developing countries, who either have access to anunreliable grid or no electricity access [25]. The introduction of off-grid solar systems in such circumstances facemany barriers, with high upfront costs proving to be the biggest hurdle. Offering the advantages of lower upfrontcosts, scalability and ease of use that typical solar solutions did not offer, the PBIM possess characteristics to be acompetitive solution in this field of application,and is therefore considered in this thesis.
2.4. ENERGY STORAGE SIZINGAppropriately sizing the energy storage capacity for PV systems has been widely researched and its typically de-
pendent on the energy scenario for which it is applied. Energy storage costs account for a significant fraction of theoverall system costs and thus for economic reasons, should be refrained from being oversized. On the other hand,
9

Figure 2.7: The peak-shaving concept [8].
undersized batteries potentially lead to a reduction in system functionality, this highlights the need of optimally sizedenergy storage capacities, ensuring low investment costs and full use of the system component. The system batterysize is dependent on the application of the PV system (grid-connected or off-grid) and its location. Most the sizingmethodologies found in literature are categorized into 4 groups and presented in Figure 2.8. With each sizing tech-nique possessing their own benefits and challenges. Sizing parameters (decision variables) are selected to provideinsight on the functionality of the system with respect to the task it has been designed for. Assessing the manner inwhich the sizing parameters and the system functionality are affected by different battery capacities, an optimum canbe selected. In this section various decision variables are explored.
Figure 2.8: Potential sizing methodologies.
2.4.1. PERFORMANCE INDEXTo obtain the optimum design a set of decision variables (evaluation parameters) need to be defined. These vari-
ables describe the system in terms of its technical, economic, social and political parameters; and are elaborated onin this section.
TECHNICAL PARAMETERS
As a consequence of the intermittent nature of solar radiation, it is important to quantify the dynamic technicalcharacteristics of the system. These parameters could relate to specific components or to the system as a whole.Characteristics such as the Loss of Load Probability (LLP), battery degradation or component operating efficiency.
ECONOMIC PARAMETERS
A common parameter system designers strive for is a fully functional system operating at the lowest possible cost.These costs can describe either the initial capital investment, levelised cost of electricity or total life cycle cost. Eco-nomic parameters provide insight on the cost effectiveness of system and aims to distinguish between systems that aretechnically sound but with high costs and those that posses comparable technical capabilities and cost considerablyless.
10

SOCIAL AND POLITICAL PARAMETERS
Social and political parameters are often considered before installing renewable energy systems as it may affectthe proposed design. Social acceptance is often considered, and can be described in terms of the use of land or anypotential visual effects the system may impose. This category can also be expanded to include the incentives providedby governmental bodies for the development of renewable energy systems.
2.4.2. SIZING METHODOLOGIESA literature study has revealed an extensive range of sizing methodologies. A summary of which is presented in
this section.
INTUITIVE METHODS
The intuitive methodology is the simplest of sizing methods and disregards the the quantitative relation betweenthe components of the PV system. Typically the system is sized based on simplified calculations using averaged outdata inputs across a design period. The formulation of sizing coefficients are required and are chosen based on thedesigner’s intuition and experience; increasing the chances of subjective results. Due to its simplistic nature, the im-plementation of intuitive methodologies has the disadvantage of resulting in sub-optimal configuration of the system;potentially causing low system reliability and/or higher capital costs than necessary [26].
NUMERICAL METHODS
In this case a system simulation is used for each time period (hour/day). This method is significantly more ac-curate than intuitive methods as the energy balance of the system is determined allowing for the performance as-sessments to be applied in quantitative manner. This method yields simulation results representing the dynamicbehaviour of the system to allow optimization of the energy and financial costs of the system. The majority of optimalsizing methodologies researched were found to implement this technique [27].
ANALYTICAL METHODS
The analytical approach is based on the characterization of the PV system components through mathematicalmodels as a function of the system’s performance indexes (LLP, economic benefit), to provide an insight on the systemfeasibility. The performance of the complete system is analyzed based on a feasible set of component sizes. Theperformance indexes for each of the feasible configurations are evaluation against one another. The computationeffort needed for the implementation of analytical methods is minimal, however its major disadvantage is the need toestimate location dependent system performance coefficients [28].
ARTIFICIAL INTELLIGENCE.This methods requires high computation effort for the implementation of algorithms such as Particle Swarm op-
timization (PSO), genetic algorithm (GA), artificial neural networks (ANN) and fuzzy logic (FL). Reported use of suchalgorithms for optimal storage sizing of PV systems is minimal. Typical usage in comparable projects has been re-ported for meteorological data prediction. However, the use Artificial intelligence methods are predominately usedfor hybrid PV systems whereby multiple sources of energy are considered.
2.4.3. COMPARABLE STUDIESIn this section, the optimization methodology and decision variables used in comparable optimization problems
are presented.
OFF-GRID
Batteries incorporated into off-grid systems are optimized to cover the load demand at a specified reliability [27].For regions with greater solar irradiance variation throughout the year typically require larger batteries than in regionsthat experience minimal variations in annual solar irradiance. Such systems are undersized during the summer periodand oversized in the winter; factors which are taken into consideration to ensure the optimal usage of the system.The implemented batteries are expected to posses discharge rates capable of meeting peak load demand and be largeenough to ensure energy delivery for nighttime energy use and during periods of unfavorable ambient conditions [29].In [30], optimally sized batteries for off-grid applications were obtained based on minimizing Loss of Power SupplyProbability (LPSP) [30] using numerical methods. In [31], an analytical approach was adopted based, in the case thedesired LLP is selected prior to any optimization, the system is then optimized based on the levelised energy cost of thepossible system configurations. Another analytical approach is presented in [32] whereby general equations relatingthe LLP, PV capacity, battery capacity and load are derived. Similarly the desired LLP of the system is predefined.In [33], a numerical approach was adopted and the relation between the LLP unit cost of PV electricity was used asoptimization parameters. Likewise, in [34], via numerical methods the system is optimized based on the LLP andthe overall system cost. In [35] the LLP is described in economic terms namely as the Value of Lost Load (VLLP). Thisestimates the economic value incurred by the user when the energy demand is not met. The system is then sized basedon the relation between the LLP and the life-cycle costs.The work presented in [36] uses a predefined LLP and systemcost; using a generalized artificial neural network (GRNN) the PV sizing curves are predicted for a defined location.
11

GRID CONNECTED
On the other hand are grid-connected PV systems, whereby autonomy is typically a secondary goal. Instead thebatteries of such systems are used for economic benefit via peak shaving or arbitrage in addition to reducing the fluc-tuating PV power generation or reducing strain on the grid. This highlights the variety of variables on which to basethe optimization objective function. A numerical approach outlined in [37] regarding peak shaving applications, de-scribes an optimization methodology based on minimizing the systems costs (Energy brought form the grid and costsrelating to battery capacity loss).Similarly, in [38] the battery is sized to based on a economic objective function, whichin this case, is defined as the benefit (profit) for system user. In [39], the optimization of the generation and storage ofhybrid microgrid is solved via genetic algorithms to minimize costs whilst maximizing system reliability. Ultimately,the optimal solution is dependent on inputs by the decision maker to defined the relative weights of each decisionvariable.
2.5. CONCLUSIONSThe sizing methodology adopted for this project is the numerical method approach whereby simulations are per-
formed to quantify the system characteristics and provide data on which to base the sizing methodology. Despiteavailable literature presenting the sizing approaches for conventional PV system, the method in this case is adoptedfor the sizing of the PBIM, forming a core contribution of this project. The performance indexes considered for thePBIM’s application for off-grid applications are based on reliability and capital cost characteristics. On the other handfor peak shaving applications the system’s dependency on the grid and the system’s capital cost will be considered.This project will also extend to consider the impacts and the extent of battery aging.
12

3PBIM MODELLING
To size the energy storage capacity of the PBIM, the dynamic behaviour of the system characteristics need to beunderstood. A model of the PBIM was constructed in Simulink/MATLAB environment to incorporate the componentinteraction and operational characteristics. Since the component performance is dependent on ambient conditionssuch as available solar energy and ambient temperature, it consistently varies. To accurately propose an appropriateenergy storage capacity these factors must be taken into consideration. Furthermore, with the battery contributing toa significant portion of the overall cost, its estimated lifetime is essential, especially due to its operation in the elevatedtemperature environment at the rear of the PV module. Therefore, this model dynamically assesses the degradationof the battery. In this section, the theory used to model the different components in the PBIM is outlined.
3.1. PHOTOVOLTAIC MODULEThe energy generation is determined by the PV module operating characteristics as well as the ambient weather
conditions. The theory required to model the effect of temperature and incident irradiance on the PV module’s outputpower is presented in this section.
3.1.1. AVAILABLE SOLAR ENERGYAs the incoming solar radiation enters the Earth’s atmosphere it decomposes into different components; direct
(GdirectM ), diffused (Gdiffuse
M ) and reflected from the ground (GgroundM ). Each contributes to the total apparent solar energy
incident on the PV module, defined as the global irradiation GM .
GM =GdirectM +Gdiffuse
M +GgroundM (3.1)
Since orientation of the PV module remains fixed throughout the day and the year, the position of the Sun affectsthe amount of direct irradiance the PV module is exposed to. By quantifying the angle of incidence (γ) the amount ofdirect irradiance the PV module is exposed to is determined, taking into account the solar altitude (aS ), azimuth (AS )and the PV module tilt angle (θM ) and azimuth (AM ) the angle of incidence is defined to be:
γ= cos−1[sin(θM)cos(aS)cos(AM − AS)+cos(θM)sin(aS)] (3.2)
The direct irradiance can then be derived from the Direct Normal Irradiance (DNI) via equation 3.3
GdirectM = DNI ·cos(γ) (3.3)
The power output of the PV module is also dependent on the module temperature, which dictates its operatingefficiency. Through the implementation of the Fluid-Dynamics (FD) thermal model the fluctuating module temper-ature TM is estimated. Meteorological effects affect the thermal process associated with the module, the FD modeloffers a good approximation as ambient wind speeds are taken into account into the energy balance between the sur-roundings and the PV module. The modelling methodology is based on the research presented in [40]. The simulationresults of the module temperature during the daylight hours of a single day is presented in Figure 3.1.
PV manufacturers provide temperature coefficients for the module output characteristics such as the open circuitvoltage, short circuit current and maximum power output. In the case of the Jinko 265Wp module, this is found to be-0.41 %/°C regarding its maximum power output. Combining efficiency as a function of temperature and irradiance,the module area AM and the global irradiance incident on the PV module, the DC power generation is determinedusing equation 3.4.
PVDC = η(TM,GM).GM.AM (3.4)
13

3.1.2. PV PERFORMANCEThe effect of meteorological effects on the temperature of the PV module depends on whether a PBIM or conven-
tional system is considered. In the case of the PBIM proper ventilation is impeded by the BoS components, causingless heat to dissipate from the module as compared to a conventionally installed PV module. As a consequence oflower heat dissipation the PBIM PV module is expected to operate at higher average temperatures which negativelyimpact its operating efficiency, indicating higher losses. Elevated temperatures have the effect of increasing the mod-ule’s current, however the resulting voltage drop renders the current increase negligible [22]. The poor ventilationproperties of the PBIM are presented in Figure 3.1 in which the module temperature of the PBIM is seen to be con-sistently higher than the module temperature of a conventional solar system. The methodology to estimate the PBIMPV module temperature is obtained from [18]. The operating efficiency is also shown to vary throughout the day. withthe PBIM experiencing lower efficiencies particularly during the middle of the day.
3.1.3. METEOROLOGICAL DATAThe meteorological data inputs required to model the PV module power generation is obtained from Meteonorm,
a widely accepted and used source of solar irradiation data, wind speed, cloud cover and ambient temperature. Thedata is acquired for a total time period of a year at a resolution of 10 minutes.
6 8 10 12 14 16 18
Time of Day
0.14
0.145
0.15
0.155
0.16
0.165
PV
mo
dule
effic
ien
cy
20
25
30
35
40
45
50
55
60
65
Tem
pe
ratu
re [°C
]
PBIM
Conventional
Ambient Temp
PBIM
conventional
Figure 3.1: Change in PV efficiency as a function of module temperature for the 1st of January, Costa Rica.
3.2. BATTERYTo produce an accurate solution to the sizing problem the generated data takes into account dynamic battery char-
acteristics under the influence of discharge rates, ambient temperatures and cycling to estimate battery degradation.This provides an insight on the decrease in the battery’s usable capacity and determine a reliable indication on theexpected battery lifetime under the defined conditions; influencing both the energetic and economical characteristicsof the overall system. Once the capacity of the nano-phosphate battery in question reduces to 80% of its BeginningOf Life (BOL) capacity, battery replacement is required [6]. The incorporated battery modelling technique outlined inthis section applies the battery characteristics provided by the battery manufacturer [6] to ensure realistic results.
3.2.1. AGING MECHANISMSThe aging mechanism in lithium-ion batteries are complex and aging effects such as capacity loss and power fade
do not originate from a single cause. The aging mechanisms can be categorized into either mechanical or chemicaldegradation and vary depending on the applied cell chemistry. In this section the aging mechanisms of Lithium-ionbatteries are considered.
• Chemical DegradationChemical degradation can mostly be traced back to Solid electrolyte interface (SEI) formation, loss of lithium,electrolyte reduction and decomposition, active material dissolution, binder decomposition and gas evolution[41]. SEI formation occurs as a result of a side reaction from the chemical interaction between the electrolyteand the negative electrode. The build up of film on the electrode surface increases the electrode’s impedanceand thus contributing to the cell’s capacity fade. Other side reactions occur and accelerate the cell’s aging. Oper-ation at elevated temperatures generally leads to acceleration of the unwanted side reaction and thus negativelyimpacts the cell’s lifetime.
14

• Mechanical DegradationIn addition to side reactions lithium extraction and insertion lead to volume shrinkage and expansion, whichoften occurs inhomogeneously. These volume changes in the electrodes lead to tensile stress which often resultsin the formation of cracks in the active material, reduced contact between neighbouring active particles and/orthe current collector [42]. The extent of effects become more pronounced as a function of cycling. This has thenegative effect of reducing the effective capacity of the battery.
A brief outline of the causes, effects and influences of battery aging are presented in Table 3.1. The aging effectof the battery was considered important in assessing the PBIM performance. Therefore these degradation effects areincluded in the PBIM model.
Cause Effect Leads to Enhanced by
Electrolyte decomposition (SEI) Loss of lithium Capacity fade High temperaturesContact loss of active material due tostructural changes
Loss of active material Capacity fade High Cycling rate
Continuous SEI growth causing decreas-ing accessible surface area
Impedance rise Power fade High temperatures
Table 3.1: Battery Aging; causes, effects, and influences. Adapted from [11]
3.2.2. EFFICIENCYSimilarly to the other PV system components, the battery efficiency is not constant, instead it fluctuates over time
and dependent on a number of characteristics. The two main types of battery efficiencies are coulombic and voltaicefficiency.
The coulombic (Faraday) efficiency is indicative of the effectiveness of electron transfer to and from the battery.Charge is lost due to chemical inefficiencies and directly influences the usable battery capacity. The coulombic effi-ciency (ηC ) is defined by the ratio of the charge extracted from the battery (Qdischarge) and the total charge put in thebattery (Qcharge), considering a complete charge cycle,
ηC = Qdischarge
Qcharge(3.5)
The voltaic efficiency provides an indication of the non-ideality of the battery, and can be referred to as the internalresistance. The internal resistance of the battery can be modelled as a function of temperature and SoC. The voltaicefficiency (ηV ) is described as the ratio between average charging (Vcharge) and discharging (Vdischarge) voltages,
ηV = Vdischarge
Vcharge(3.6)
Taking both the voltaic and the coulombic efficiency into account the battery round trip efficiency is then definedas:
ηBatt = ηC.ηV (3.7)
Therefore the round trip efficiency of the battery is also expected to vary according to the operating temperatureand the SoC.
3.2.3. STATE OF CHARGEAn important aspect of the battery to model is the charging and discharging characteristics which allow for the de-
termination of the energy stored in the battery. The battery charging and discharging is modelled using the equationsadopted from [43],
SoC = 100
(1− 1
Q
∫ t
0i (t )d t
)(3.8)
where Q is the maximum battery capacity in [Ah] and i is the battery current in [A].
3.2.4. BATTERY REGULATIONTo optimize the battery lifetime and operation it is necessary to regulate its usage. In this system the charge con-
troller is assigned the task of ensuring the battery continuously operates within its nominal range. The battery reachesits end of life (EOL) when its capacity is 80% of its beginning of life (BOL) capacity.
• Charge RegulationThe battery lifetime is heavily influenced by the charging constraints imposed on the battery. Overcharging and
15

deep discharging of the Lithium-ion battery results in the breakdown of the cathode and should be avoided.The battery aging process is accelerated by operating the battery at a high depth of discharge.
• Voltage RegulationThe charge of the battery is terminated once the measured voltage reaches the recommend cut-off voltage. Ifthe cells are connected in strings then the charging of the entire string is to be terminated once any one cellreaches the cut-off voltage level.
• C-rateThe C-rate refers to the rate of charge/discharge of the battery. According to [6] higher C-rates negatively influ-ences the cycle life of the battery. Faster rates are commonly associated with increasing the degradation of theelectrodes; negatively influencing the battery capacity. Furthermore, high C-rates increase the internal temper-atures of the battery.
The properties of every battery differ, therefore to ensure the accurate modelling of the A123 pouch cell the bat-tery characteristics as provide by the manufacturer were used [6]. After estimating the SoC (section 3.2.3) the dynamicbattery characteristics can then be determined via a look-up table. Figure 3.2 depicts the change of voltage as a func-tion of SoC, observable is the non-linear voltage region towards the SoC high and low extremes. To ensure the batterydelivers a relatively constant voltage throughout each cycle SoC limits are imposed. The initial constraints used arepresented in section 4.2.2, this has the dual effect of ensuring constant voltage and ensuring the battery is not over-charged and over-discharged.
0 10 20 30 40 50 60 70 80 90 100
SoC [%]
2.4
2.6
2.8
3
3.2
3.4
3.6
Voltage [V
]
Voltage
VOC
Figure 3.2: Cell voltage (1 C-rate)and VoC as a function of SoC.
0 10 20 30 40 50 60 70 80 90 100
SoC [%]
-3.5
-3
-2.5
-2
-1.5
-1
-0.5
0
0.5
1
1.5
d(V
oC
)/dT
[V
/°C
]
10-4
Figure 3.3: Temperature effect on VoC as a function of SoC.
3.2.5. BATTERY TEMPERATUREBattery degradation is strongly dependent on the cell temperature. In the case of this model, only cell temperatures
during periods of time at which the battery was active (dis/charging) are considered, this assumption can be madeas the effect of battery calender aging can be considered minimal compared to the degradation due to cycling. Toestimate the battery temperature during activity periods the cell temperature is said to be homogeneous with coolingoccurring due to natural free convection. It is necessary to define the heat generation of the battery (qbattery) and heatdissipation via free convection (qconvection) which are described by the following expressions:
qbattery = I (V −VOC +T∂VOC
∂T) (3.9)
qconvection =U (T −Ta) (3.10)
where I is the charging or discharging current, V is the voltage, Ta is the ambient temperature, U is the heattransfer coefficient and T is the battery temperature. The battery open circuit voltage (VOC ), voltage curve (V ) and
the entropy coefficient ( ∂VOC∂T ) are obtained from the manufacturer [6] and presented in Figures 3.2 & 3.3. The heat
balance of the system is derived to be:
qbattery −qconvection = 0 (3.11)
The temperature of the battery is determined for each time step to include the effect of the charging and dis-charging processes on the battery’s heat production to predict its degradation. The battery temperature can then beexpressed as:
16

T = U .Ta + I (V −VOC )
U − I . ∂VOC∂T
(3.12)
The change in battery temperature throughout 24 hours is presented in Figure 3.4. Visible in the figure is the man-ner in which the battery temperature fluctuates depending on whether it is charged or discharged. For lithium-ionbatteries the chemical reaction associated with charging is endothermic. However, in the figure the battery is assumedto remain at ambient temperature throughout charging. The discharge process on the other hand is exothermic asseen by increasing temperatures for a decreasing SoC.
0 5 10 15 20 25
Time of Day [Hours]
10
20
30
40
50
60
70
80
90
SO
C[%
]
4
6
8
10
12
14
16
18
Te
mp
era
ture
[°C
]
SOC
Battery Temp
Ambient Temp
Figure 3.4: Simulated relation between battery temperature, SoC andambient temperature
0 5 10 15 20 25
Time [Hours]
0
0.05
0.1
0.15
0.2
0.25
0.3
0.35
Num
ber
of C
ycle
s
-3
-2
-1
0
1
2
3
4
5
Curr
ent [A
]
Cycles
Current
Figure 3.5: Simulation results of battery cycling.
3.2.6. TEMPERATURE EFFECTSLike the PV module, temperature significantly influences battery performance. Having mathematically described
the battery temperature, the extent to which temperature affects the battery is explored.
• Influence on capacityThe cell resistance fluctuates depending on the temperature. At low temperatures the cell’s internal resistanceincreases, thus reducing the deliverable capacity of the battery. At high temperatures the battery is able toprovide more power over a longer period of time, Figure 3.6.
• Influence on lifetimeThe deliverable capacity of the battery increases for higher temperatures. However, this also has the effect ofaccelerating the chemical degradation of the battery, as previously outlined. This effect is observable in Figure3.7 where cycling at higher temperatures reduces the expected cycle life of the battery.
3.2.7. CYCLINGIn combination with temperature, the battery degradation depends on the cycling of the battery (Table 3.1). A
cycle is defined as the process of complete charging and discharging [44]. Given the variability of the load and PVgeneration the number of cycles the battery undergoes per time-step will fluctuate. The specifications provided bybattery manufacturers predict the aging of the battery for continuous and uniform cycling. The typical charging pro-file of batteries used for PV system applications depends on the power output of the PV module. Due to the highvariability of available solar energy the battery charging current will unlikely remain constant throughout the charg-ing cycle. This will influence the aging characteristics of the battery, therefore, the manufacturer aging specificationsare inapplicable in this circumstance.
In this circumstance, the continuous charging and discharging is irregular. In this AC topology (Figure 2.6) thebattery is charged according to the PV generation. Therefore the C-rate at which the battery is charged varies overthe course of the charging cycle. To dynamically incorporate battery degradation, the concept of microcyling is intro-duced. A single microcycle is defined as the fraction of cycle the battery has undergone per activity period. As seen inFigure 3.5, during the period of time when the battery current is non-zero the cycle count is updated per simulationtime step. By integrating the battery power exchange per micro-cycle the elapsed cycle number is determined. Thebattery current returns to zero, signalling the end of an activity period, whereby the total battery elapsed cycle num-ber remains unchanged until the subsequent activity period begins. In this manner the battery cycling is dynamical
17

0 2 4 6 8 10 12 14 16 18 20
Delivered Capacity[Ah]
2
2.5
3
3.5
Vola
tge [V
]
45°C
10°C
-10°C
Figure 3.6: Voltage and deliverable capacity at various temperatures [6].
incorporated into the PBIM model. The dynamic, non-uniform cycling of the battery (NCycles) is incorporated into themodel for each time step using the following expression:
NCycles =Ebatt
2.Cbatt(3.13)
where Ebatt is the absolute value of either the charging or discharging energy of the battery for the elapsed cycleand Cbatt is the battery capacity.
3.2.8. AGINGThe model evaluates the battery temperature and the fraction of a cycle for each time step. Combining these two
battery characteristics for each time-step across the entire simulation, results in the quantification of the capacity loss.The calculated battery temperature is categorized into temperature ranges of 1°C and the aging coefficient (Caging)(interpreted as the gradient of the appropriate curve) is derived from the manufacturer specifications (see Figure 3.7)for each time step. For higher temperatures the battery degrades at a much faster rate, this effect is thus included inthe model.
0 1000 2000 3000 4000 5000 6000 7000
Number of Cycles
70
75
80
85
90
95
100
Capacity (
% o
f B
OL C
apacity)
25°C
35°C
45°C
55°C
Figure 3.7: Cells Cycle Life (1C Dis/Charge rates, adapted from [6]
0 5 10 15 20 25
Time of Day [Hours]
10
20
30
40
50
60
70
80
90
SO
C[%
]
0
0.5
1
1.5
2
2.5
3
3.5
Capacity L
oss [W
h]
10-4
Figure 3.8: Simulation results of battery aging
The capacity loss Closs per micro-cycle is then calculated:
Closs =−Caging.NCycles
100.EBOL (3.14)
18
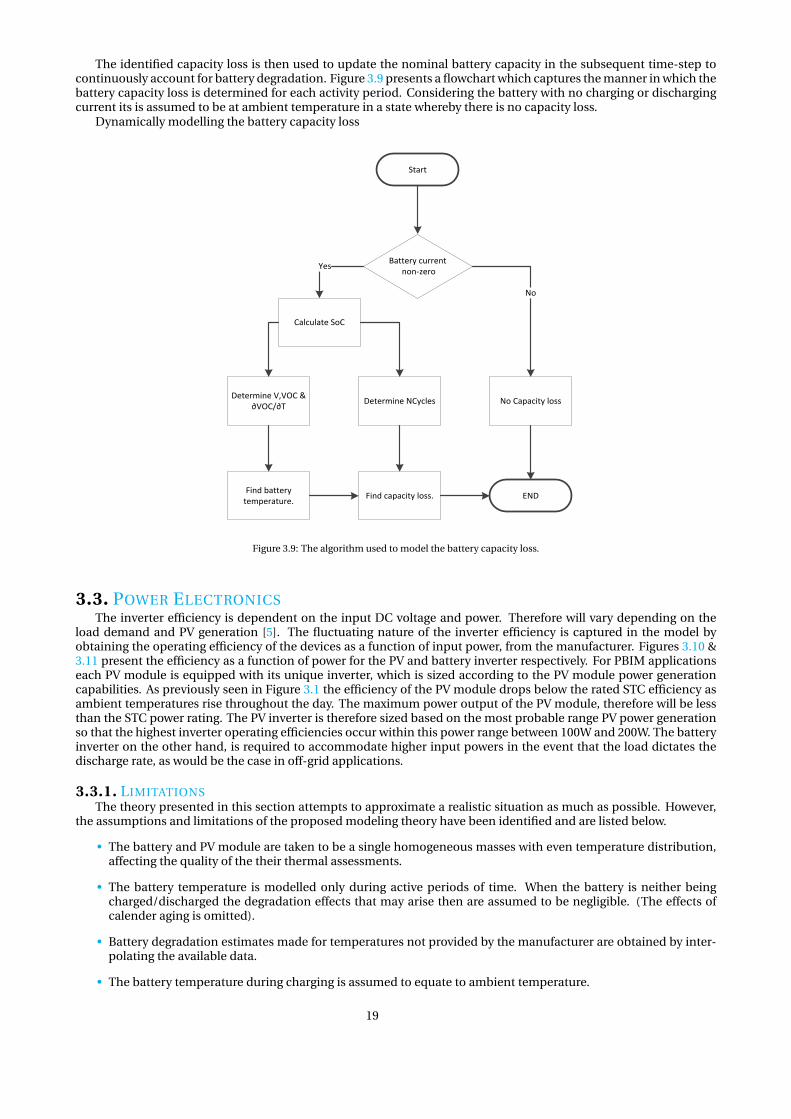
The identified capacity loss is then used to update the nominal battery capacity in the subsequent time-step tocontinuously account for battery degradation. Figure 3.9 presents a flowchart which captures the manner in which thebattery capacity loss is determined for each activity period. Considering the battery with no charging or dischargingcurrent its is assumed to be at ambient temperature in a state whereby there is no capacity loss.
Dynamically modelling the battery capacity loss
Calculate SoC
Start
Battery current non-zero
Determine V,VOC & ∂VOC/∂T
Find battery temperature.
Determine NCycles
Yes
Find capacity loss.
No Capacity loss
No
END
Figure 3.9: The algorithm used to model the battery capacity loss.
3.3. POWER ELECTRONICSThe inverter efficiency is dependent on the input DC voltage and power. Therefore will vary depending on the
load demand and PV generation [5]. The fluctuating nature of the inverter efficiency is captured in the model byobtaining the operating efficiency of the devices as a function of input power, from the manufacturer. Figures 3.10 &3.11 present the efficiency as a function of power for the PV and battery inverter respectively. For PBIM applicationseach PV module is equipped with its unique inverter, which is sized according to the PV module power generationcapabilities. As previously seen in Figure 3.1 the efficiency of the PV module drops below the rated STC efficiency asambient temperatures rise throughout the day. The maximum power output of the PV module, therefore will be lessthan the STC power rating. The PV inverter is therefore sized based on the most probable range PV power generationso that the highest inverter operating efficiencies occur within this power range between 100W and 200W. The batteryinverter on the other hand, is required to accommodate higher input powers in the event that the load dictates thedischarge rate, as would be the case in off-grid applications.
3.3.1. LIMITATIONSThe theory presented in this section attempts to approximate a realistic situation as much as possible. However,
the assumptions and limitations of the proposed modeling theory have been identified and are listed below.
• The battery and PV module are taken to be a single homogeneous masses with even temperature distribution,affecting the quality of the their thermal assessments.
• The battery temperature is modelled only during active periods of time. When the battery is neither beingcharged/discharged the degradation effects that may arise then are assumed to be negligible. (The effects ofcalender aging is omitted).
• Battery degradation estimates made for temperatures not provided by the manufacturer are obtained by inter-polating the available data.
• The battery temperature during charging is assumed to equate to ambient temperature.
19

0 50 100 150 200 250 300 350
Power [W]
0.9
0.91
0.92
0.93
0.94
0.95
0.96
0.97E
ffic
iency
Figure 3.10: Efficiency of the PV inverter as a function of input power [9].
0 100 200 300 400 500 600 700 800 900 1000
Power [W]
0.7
0.75
0.8
0.85
0.9
0.95
Effic
iency
Figure 3.11: Efficiency of the battery inverter as a function of input power[9].
• The effect of temperature on the battery charging and discharging characteristics is not considered.
• The battery internal resistance is assumed to remain constant.
• The self discharge of the battery is not considered.
3.4. CONCLUSIONSCombining the meteorological data inputs, the appropriate load profile and the modelling techniques of the indi-
vidual components outlined in this section, the dynamic characteristics of the PBIM as complete system is obtained.The modelling of the individual components is based on existing hardware, whereby the simulation results of theindividual components is validated using the data provided by the respective manufacturer.
20

4GRID CONNECTED PEAK SHAVING CONCEPT
In Chapter 3, an outline of the PBIM component modelling is provided. However, depending on the PBIM applica-tion the energy control strategy will vary. In this chapter, the application of the PBIM in a grid connected environmentfor peak shaving applications is assessed for two locations: Costa Rica and the Netherlands. The dynamic behaviourof this system is presented which then extends to the implementation of energy storage sizing methodologies to de-termine the most appropriate battery capacity. Throughout the chapter, comparisons are made between the PBIMbehaviour for the two locations.
4.1. METHODOLOGYIn order to asses the system functionality a set of objectives the system is designed to meet, and an approach
applied to identify the optimally sized PBIM system are required.
4.1.1. OBJECTIVESGiven that the target PBIM users are primarily residential electricity consumers, the application of the PBIM for
grid-connected scenarios can be assumed to be motivated by the potential cost savings on the energy bill. For suchusers, PV generation occurs ’behind the meter’, enabling the self-generated energy to be either directly consumed bythe household loads, stored or exported to the grid. Either option results in the decrease in demand of energy fromthe grid. The PBIM system for peak shaving applications can minimize the costs associated with the purchasing ofelectricity from the grid. This is amplified by storing energy from the PV array during time periods of low energycosts and using the energy during periods of time where the energy costs are high. In the case of a single PBIM thiscan be achieved by increasing the storage capacity, however this results in higher initial capital costs. The cost of asingle PBIM is assumed to increase linearly with respect to its energy storage capabilities. The system objectives cantherefore be summarized:
1. Maximize peak load shaving.
2. Minimize the installed battery capacity.
The identified system objectives are conflicting and thus a compromise is necessary to maximize the benefit of thePBIM to the user.
4.1.2. APPROACHA numerical approach is adopted to identify the appropriate battery capacity to install per integrated module. The
system performance indexes used are selected based on the insight they provide on the identified system objectives.Therefore the energy drawn from the grid with respect to the time-of-use pricing and the battery degradation havebeen selected as the performance indexes for the grid-connected energy scenarios.
A peak-shaving scenario is constructed for two locations, whereby the meteorological data, energy demands andtime-of use pricing reflect a realistic situation. Simulations are carried out to determine the system’s power balanceper simulation time step, to gain an insight on the impact of the ambient climates and energy storage capacity on thesystems ability to fulfill the identified criterion.
This project demonstrates the existence of the critical battery capacity (CCrit) above which the decreasing rate ofthe peak load drawn from the grid worsens. In other words increasing the battery capacity above (CCrit) will have lessof a positive influence on the peak load drawn from the grid as compared to increasing the battery capacity by thesame amount for a total battery capacity below (CCrit). Identifying this battery capacity signals the point, above whichthe battery could be considered over-sized (method adapted from [37]). Intuitively if the battery is much greater thanCCrit the peak load drawn from the grid could be the same as for a scenario with a battery capacity equal to CCrit. Thecritical battery capacity identifies the smallest possible battery capacity to ultimately maximize the benefit of PBIMusage.
21

4.2. SYSTEM MODELLINGThe models of the various components are complied to create a single coherent model of the entire PBIM system,
Figure 4.1. The model thus describes the energy flow and the respective efficiencies starting from its generation viathe PV module and resulting in the determination of the system characteristics.
External Data (meteorological, energy demand,
time of day..)
Start
PV generation model
PV inverter
Energy Control Strategy
Battery inverter
Battery modelTechnical
system data
Figure 4.1: An overview of the PBIM model.
4.2.1. ENERGY CONTROL STRATEGYThe peak shaving energy storage control strategy includes specific battery charging and discharging times based
on the presence of peak hours, the underlying logic on which the energy control strategy is based on is presented inFigure 5.1. Therefore, the charging and discharging times of the battery depend on the length and frequency of peakhours throughout the day. Figure 5.1 displays the manner in which the power is control within the system, efficiencylosses do occur however, they are not represented in the figure.
4.2.2. GOVERNING EQUATIONSThe governing equations which capture the interactions between the different system components are outlined.
Furthermore the essence of the energy balance occurring between the system and the utility grid is presented. Thesymbols used in this section are defined in Table 4.1.
PV GENERATION
Based on the peak shaving algorithm presented in Figure 5.1 if the battery is fully charged, the excess power gen-erated by the PV array is used to power the load (PPV-Load) subject to the following constraint.
1
ηMPPTt .ηinvt
.PPV−Battt +1
ηMPPTt
.PPV−loadt +1
ηMPPTt
.PPV−gridt≤ P max
PVt∀t . (4.1)
22

Peak HourPeak Hour
SOC<80%SOC<80%SOC>20%SOC>20%
Load = Pgrid +PVLoad = Pgrid +PV Load=Pgrid+PVLoad=Pgrid+PV
TRUE
TRUE
FALSE
FALSE
TRUE
FALSE
STARTSTART
Discharge battery
Discharge battery
Load =Pgrid+PVLoad =Pgrid+PV
Charge battery
Charge battery
ENDENDENDENDENDEND
Figure 4.2: The controller logic for peak shaving
BATTERY
For optimal usage the battery is protected from the detrimental effects of deep discharging and overcharging asfollows:
0.2E maxt ≤ Et ≤ 0.8E max
t ∀t . (4.2)
The power delivered to the battery is described by:
PBattt = ηch.P inBattt
− 1
ηdis.P out
Battt∀t . (4.3)
The initial battery SoC is 20% .Hence the energy content of the battery is determined as follows:
Et =
0.2EBOL, if t ≤ t0Et−1 +PBattt .∆t , if t0 ≤ t ≤ tend. (4.4)
The battery aging effects outlined in section 3.2 are incorporated such that
Closst =−Caging(T )∗NCyclest
100.E max
t ∀t . (4.5)
ELECTRIC GRID
Energy is exchanged with the grid either in an effort to satisfy the load demand or to sell excess energy such thatthe overall energy balance is;
Ploadt = PPVt +Pgridt+P in
Battt−P out
Battt∀t (4.6)
whereby
• Pgridt> 0 if electric power is imported from the grid.
• Pgridt< 0 if electric power is exported to the grid.
4.3. CASE STUDIESThe performance of the PBIM in real life applications is assessed based on the dynamic technical characteristics
obtained from the model. To approximate real life applications the PBIM is assessed for different case studies wherebythe input data describing the scenario is implemented.
23

Definition SymbolEfficiency MPPT during time period t ηMPPTt
Efficiency Inverter during time period t ηinvt
Power transfer from PV array to battery during time period t PPV-Battt
Power transfer from PV array to load during time period t PPV-loadt
Power transfer from PV array to grid during time period t PPV-loadt
Maximum PV power during time period t P maxPVt
Maximum Energy content of the battery during time period t E maxt
Battery capacity loss during time period t Closst
Power exchanged with the grid during time period t Pgridt
Power to charge the battery during time period t P inBattt
Power discharged from battery during time period t P outBattt
Table 4.1: List of Symbols
4.3.1. LOCATION ANALYSISCosta Rica and the Netherlands are the chosen sites at which to simulate the PBIM for peak shaving and off-grid
applications. Costa Rica experiences a year-round tropical climate with minimal seasonal variations. Ambient tem-peratures and incident solar irradiance remain fairly consistent throughout the year. On the other hand, the climatein the Netherlands is remarkably dissimilar, with significant changes in available solar energy and ambient temper-atures throughout the year. Figures 4.3 & 4.4 portray the differences in the power generation of the 265Wp Jinko PVmodule for Costa Rica and the Netherlands respectively and imply an uneven distribution of available solar energythroughout the year. These two locations are selected based on the vast differences between their climates. In thismanner, the impact of ambient meteorological conditions on the PBIM can quantified and to determine whether thePBIM is a viable solution for both locations. Furthermore, to approach a realistic scenario the load profile data input isrepresentative of the average household load profile of the respective region. The energy consumption of an averageCosta Rican household differs, in terms of amount and time of usage, compared to their Dutch counterparts. There-fore these test sites were selected based on the significant dissimilarities between the two nations in an attempt toquantify the effect of these factors on the identification of the optimal PBIM battery capacity. An overview comparingthe characteristics of the case studies for each location is presented in Table 4.3.1.
0 50 100 150 200 250 300 350
Time [Days]
0
50
100
150
200
250
300
Po
we
r [W
]
PV generation CR
Figure 4.3: Annual PV production Costa Rica
0 50 100 150 200 250 300 350
Time [Days]
0
50
100
150
200
250
300
Po
we
r [W
]
PV geneneration NL
Figure 4.4: Annual PV production Netherlands
Location Equivalent Sun hours (ESH) [hours] Average Energy per PV module [Wh/day] Load [kWh/day]
Costa Rica 4.8 1163 16.1Netherlands 2.7 594 9.7
4.3.2. SCOPE OF DATAThe integrity of the simulations results depends on the assumptions and the input data. The meteorological and
load profile data plays a significant role in the overall system sizing task at hand, the scope of the implemented data is
24

discussed.
METEOROLOGICAL DATA
The meteorological data has been obtained from Meteonorm database software at a 10 minute resolution, for thetime span of a year. The high temporal resolution allows for accurate prediction of PV generation to account for theintermittent nature of solar energy.
LOAD DATA
Realistic load profiles are essential in ensuring the creation of the case studies. In order to capture the high vari-ability of residential loads, load data of a high temporal resolution is needed. Moreover, the distribution of residentialenergy demands differ between the Netherlands and Costa Rica on both a daily and annual basis. These variationsarise due a number of differences including standard of living, climate and culture. Therefore including this differencein addition to the meteorological data into the case studies increases the robustness of this analysis.
• Costa RicaThe load profile implemented into this case study to represent the energy use of an average Costa Rican house-hold is obtained from [45] in which stochastic load profiles are created based on the statistical characterizationof electricity demand in Costa Rica, Figure 4.6.
• NetherlandsAn approximation of the energy usage of an average Dutch household is obtained from [46], also at a resolutionof 10 minutes. Based on seasonal averages the average daily energy demand varies with respect to the season.As a result the load profile is split into a winter and summer load profile, whereby the average energy demandper day is higher in the winter than in the summer, Figure 4.5.
0 5 10 15 20
Time of Day [hours]
200
400
600
800
1000
1200
1400
1600
Po
we
r [W
]
Figure 4.5: Daily load variation,Costa Rica
0 5 10 15 20 25
Time of Day [hours]
100
200
300
400
500
600
700
800
Pow
er
[W]
Winter
Spring
Summer
Autumn
Figure 4.6: Daily load variation, Netherlands
4.3.3. COSTA RICAThe load profile and ambient conditions are incorporated to approach a realistic assumption of the PBIM system
for peak shaving in San Jose, Costa Rica. Figure 4.7 depicts the peak shave scenario, for two peak periods per day, thisremains true throughout the course of the year. The load profile and the available solar energy are also represented,showing the need to store energy for its use during the second peak period which occurs during the night. The bat-tery dis/charging schedule is programmed according to the controller strategy presented in Figure 4.2, which aimsto reduce the energy drawn from the grid during peak hours. The presence of two peak periods per day result in thebattery being charged and discharged twice in 24 hours and is represented in the battery SoC variation in Figure 4.8(a).
In this case study the peak periods are defined by the Costa Rican electricity provider ’Instituto Costarricense deElectricidad’ who set electricity prices depending on the time of day, Table 4.2 . These prices reflect the national vari-ation of the demand of energy, and the selected load profile. As a result the price experiences a dramatic increase of144% during peak hours which acts in favour of using the PBIM for peak shaving.
To gain an insight on the technical characteristics of the system the case study is created with the aim of assessingthe battery charging and discharging cycles as well as the system interaction with the grid. In this section the systemdynamics on both a daily and a yearly basis are discussed.
25

Tariff Scheme Symbol Price [e/kWh]
Off-Peak electricity λGOP 0.09
Peak hours electricity (from 10.00-12.30 and 17.30-20.00) λP 0.22
Table 4.2: Pricing Scheme Costa Rica, [12].
Figure 4.7: The peak shave scenario, Costa Rica.
DAILY SYSTEM DYNAMICS
Significant changes in the PBIM’s characteristics and performance are predicted with respect to the size of theinstalled battery. To gain an insight on the nature and significance of these changes simulations for a single PBIMsystem were performed to determine the relation between battery capacity and desirable PBIM characteristics; anessential insight for energy storage sizing. In this section the system characteristics are presented to illustrate theapplied energy control strategy.
• Off-PeakAs dictated by the peak shave algorithm during off-peak hours the energy generated by the PV array, if any, issolely used to charge the battery. The initial battery SoC is set to 20% and is seen to increase for all battery sizesas soon as PV array begins converting solar energy, Figure 4.8(a). With the 90Wh battery being the smallest itis charged the quickest. Figure 4.8(b) presents the energy exchange of the battery, whereby the positive powervalues represent the charging of the battery. The nature of the charging profile reflects the PV power generation.For discharging the battery is discharged at a constant power
Once charged, the the generated PV power once used to charge the battery is redirected to satisfy the loadseen by the decrease in energy drawn from the grid, Figure 4.8(c). Since the 90Wh battery was fully chargedbefore the off peak period terminated less energy was stored as compared to the 450Wh and 750Wh batteries.This indicates that the 450Wh and 750Wh batteries were able to satisfy a larger fraction of the load during thesubsequent peak period. However, in the case of the 90Wh battery less energy was imported from the gridduring the off-peak.
• Peak HoursDuring peak hours the PBIM battery begins to discharge and will continue to do so until either it is no longerpeak hour or the battery is discharged. Each of the simulated batteries were discharged at the same nominaldischarge current. It is clear that the larger 700Wh battery provided the most energy during the peak hours, indi-cating larger financial savings during this time period were incurred. The battery is discharged to its lower 20%limit twice in 24 hours. The longest peak period of the day is 2.5 hours, to ensure the battery is fully discharge bythe end of the peak period and that nominal discharge rates are not exceeded, each considered battery capacityis set to discharge at 0.4C.
YEARLY SYSTEM DYNAMICS
Having simulated and understood the behaviour of the PBIM on a daily basis with respect to various battery capac-ities it is also essential to consider such characteristics over a longer period of time. For a variety of battery capacitiesthe PBIM system was modeled for a year and the results are presented in this following section.
• Peak Load ReductionWith energy from the grid costing the most during peak hours the battery capacity is to be optimized in such wayso as to decrease the load during peak hours by as much as possible. As seen in the simulation results increasingthe battery capacity generally results in a decrease in the peak load (Figure 4.9). Noticeable in the figure is thegradual reduction of the effect of increasing the battery capacity on the peak load. This observable saturationindicates that above 700Wh the battery is oversized. The battery capacity of 700Wh can thus be identified as
26

0 5 10 15 20 25 30 35 40 45 50
Time Elapsed [Hours]
10
20
30
40
50
60
70
80
90
Sta
te o
f C
harg
e [%
]
90Wh
450Wh
750Wh
((a)) Battery State of Charge
0 5 10 15 20 25 30 35 40 45 50
Time Elapsed [Hours]
-400
-300
-200
-100
0
100
200
Battery
Pow
er
[W]
90Wh
450Wh
750Wh
((b)) Battery Power
0 5 10 15 20 25 30 35 40 45 50
Time Elapsed [Hours]
200
250
300
350
400
450
500
550
600
650
700
Po
we
r d
raw
n f
rom
grid
[W
]
90Wh
450Wh
750Wh
load
((c)) Energy Exchange with the grid(Simplified load profile used forillustration purposes)
Figure 4.8: PBIM System characteristics, simulation results for a 2 day period
27

CCrit. The existent of the gradual decrease in peak load for batteries larger than 700Wh is due to the presenceof particularly sunny days thus leading to higher than average PV production; additional energy the oversizedbatteries are able to store. Oversized batteries will reduce the peak load, however they will also negatively impactthe financial aspects of the proposed PBIM system.
400 600 800 1000 1200 1400 1600 1800
Battery Capacity [Wh]
1.3
1.31
1.32
1.33
1.34
1.35
En
erg
y d
raw
n f
rom
grid
du
rin
g p
ea
k h
ou
rs [
Wh
]
106
2.3
2.4
2.5
2.6
2.7
2.8
Ba
tte
ry C
ap
acity L
oss [
Wh
]
10-3
Figure 4.9: Effect of peak load drawn from the grid and battery capacity loss with respect to installed battery capacity on an annual basis.
• Battery DegradationOn the other hand, with an increasing battery size, the capacity loss throughout the year increases with anincreasing installed battery capacity (Figure 4.9). As is the case with the peak load reduction a saturation pointis noticeable at CCrit. Batteries with a capacity less than CCrit experience a similar rate of degradation. This isdue to the equal fraction of the usable capacity being used. In other words up to a battery with capacity CCrit, thebattery is charged and discharged between the 20% and 80% SoC limits an equal number of times. Batteries witha capacity larger than CCrit experience a slower rate of degradation a year as the battery is considered oversized.The amount of energy available for storage purposes is insufficient to fully charge the batteries on a regularbasis. These batteries are therefore less deeply cycled resulting in the plateauing of the capacity loss since theyearly energy throughput of the batteries is similar.
4.3.4. MULTIPLE PBIMSThe effect on varying the available capacity as been assessed on both a daily and yearly basis, however most PBIM
systems will consist of more than a single PBIM. It is therefore necessary to determine whether the appropriate batterycapacity for a single PBIM will remain consistent for systems of different capacities. By adding a PBIM in parallel thesystem PV and energy storage capacity is increased. It is not the scope of this thesis to determine the optimal size ofthe entire system but the attention is directed to sizing the energy storage capacity of a single modular PBIM unit. Inthis section the PBIM’s characteristics are assessed as a function of battery capacity and PV capacity. The aim of thisanalysis is to identify the critical battery capacity (CCrit).
• Peak hoursThe first system design variable is the energy drawn from the grid during peak hours. Given the implementedenergy control strategy, the battery is programmed to discharge the solar energy it has accumulated during day-light off-peak hours. The simulation results in Figure 4.10 show that the energy drawn from the grid duringpeak hours throughout the whole year is reduced as battery capacity increases, and as the number of PBIMs in-crease. However, note the presence of the saturation point in the curve whereby increasing the battery capacityno longer results in the reduction of the energy drawn from the grid. When a PBIM is added in parallel the PVWp and battery capacity scale accordingly. By altering both the battery capacity and the rated PV Wp CCrit, isconsistent throughout the considered system sizes.
• Off-peak hoursAs the battery capacity increases, for a fixed PV capacity, charging times increase. During off-peak hours thepower generated by the PV array is used to charge the batteries, whilst energy is drawn from the grid to meet thedemand. Increasing the battery capacity for constant PV capacity will lead to longer charging times, resultingin more energy drawn from the grid before the energy generated by the PV module can be directly used (Figure4.11 ). For batteries smaller than 700Wh per PBIM the energy drawn from the grid decreases for an increasingnumber of PBIMs connected in parallel. This is occurs since the available PV power after the battery is chargedis greater. However, for battery capacities greater than 700Wh per PBIM, irrespective of the PV capacity, the
28

0 200 400 600 800 1000 1200 1400
Battery Capacity per PBIM [Wh]
0
5
10
15
Energ
y d
raw
n fro
m g
rid,(
Peak H
ours
) [W
h/y
ear]
105
1 PBIM
2 PBIMs
3 PBIMs
4 PBIMs
Figure 4.10: Annual energy from grid during peak hours.
0 200 400 600 800 1000 1200 1400
Battery Capacity per PBIM [Wh]
3.5
3.6
3.7
3.8
3.9
4
4.1
4.2
Energ
y d
raw
n fro
m g
rid (
Off-p
eak h
ours
) [W
h/y
ear]
106
1 PBIM
2 PBIMs
3 PBIMs
4 PBIMs
Figure 4.11: Annual energy drawn from grid during off-peak hours.
energy drawn from the grid ceases to increase for increasing battery capacity. This is due to the fact that thebattery is too large to be fully charged during the allotted charging periods. This implies that the battery is nowcapable of storing all the energy generated by the PV module in the off-peak time period. As seen in Figure 4.3the power output of the PV module experiences minimal variations throughout the year, since the daily energyproduction of a PV panel is limited by both its efficiency and the available solar irradiance. The battery capacityat which the saturation point occur will therefore remain consistent throughout the year. The critical batterycapacity is again identifiable at 700Wh per PBIM at the point of convergence.
0 200 400 600 800 1000 1200 1400
Battery Capacity per PBIM [Wh]
0
0.002
0.004
0.006
0.008
0.01
0.012
0.014
Capacity loss [W
h]
1 PBIM
2 PBIMs
3 PBIMs
4 PBIMs
Figure 4.12: The annual battery capacity loss
0.5 1 1.5 2 2.5 3 3.5 4 4.5 5 5.5
Storage Capacity/PV capacity [Wh/W]
0
1
2
3
4
5
6
7
8
9
En
erg
y d
raw
n f
rom
grid
,(P
ea
k H
ou
rs)
[Wh
/ye
ar]
105
Figure 4.13: Battery sizing Costa Rica. optimal battery sized circled
• Battery degradationAs the battery is repeatedly charged and discharged its capacity begins to fade, as explained in section 3.2. Therate of battery degradation is dependent on how often it is cycled and the temperatures and which this processoccurs. Batteries of smaller capacities, less than (CCrit), will have a larger average State of Charge than a largerbattery. Since these smaller batteries are regularly fully charged and discharged they will be cycled more oftenresulting in a faster rate of degradation. If the battery capacity is increased a smaller fraction of the usablebattery capacity is regularly used and which thus equates to fewer cycles over the same period of time. Thesimulation results in figures 4.12 both demonstrate the existence of a saturation point above which the totalcapacity loss is no longer affected by increasing the total installed storage capacity. Figure 4.12 demonstratesthat in terms of battery degradation CCrit remains consistent for the considered PBIM system sizes.
29

• Energy storage sizingFigure 4.7 illustrates the first peak period of the day coinciding with the highest irradiance levels of the day, in-dicating that during this time period the energy generated by the PV array is fed directly to the loads and not tocharge the battery. The energy stored in the battery is also discharged. After the termination of the first peakperiod the power generated by the PV module is stored in the battery to be used during the second peak pe-riod Figure 4.7. Therefore, due to the adopted energy control strategy, the battery is not required to have thecapacity to store all the converted solar energy throughout the day. Instead it is only required to store the PVenergy generation during a single off-peak period. Although the equivalent sun hours experience a slight varia-tion throughout the year it will remain relatively constant, leading to the conclusion that the available chargingperiods of the battery will also be consistent, given that the peak periods remain unchanged.
The energy drawn from the grid during peak hours is not strictly required to be minimized. However it canbe optimized for a single PBIM. Increasing the storage capabilities above a certain point will cease to have asignificant effect in reducing the energy demand from the grid, i.e the critical battery capacity. Increasing thebattery capacity beyond this point will be less beneficial for the PBIM user as higher capital costs are required forthe additional energy storage. Figure 4.13 identifies the optimal battery/PV ratio for peak shaving applicationsin Costa Rica and is found to be 2.75Wh/W. This equates to an energy storage capacity capable of storing theenergy generated by the PV module operating at rated efficiency for 2.75 hours. This time period is comparableto the equivalent sun hours present during the allotted charging periods of the battery. In the case of a 265Wp PVmodule the optimal battery capacity is found to be 729Wh. Looking at Figures 4.10 through to 4.12 the batterycapacity per PBIM at which the saturation point occurs for the energy drawn from the grid and the capacity fadeoccurs at the identified optimal capacity of 729Wh, and remains true for the considered range of PV capacities.In this case, the critical battery capacity is defined to be the most appropriate battery size to install in the PBIM.
ECONOMIC CONSIDERATIONS
Having taken into account the energetic system characteristics to provide an indication of the appropriate batterysize, the economic characteristics related to the sizing issue are now considered. In this section the system is assumedto have a lifetime of 15 years; a conservative estimate since most commercially available PV module are expectedto operate up to 25 years. However a worst-case scenario is assumed here. The profit the system generates over itslifetime is defined by the following equation:
LIFETIME PROFIT = LIFETIME ENERGY SAVINGS−LIFETIME CAPITAL COSTS (4.7)
where Lifetime energy savings is defined as the savings on the electricity bill by reducing the energy drawn fromthe grid. The lifetime capital costs refer to the capital investment costs of the PBIM system throughout its lifetime,including battery replacement costs, if necessary. A break down of the PBIM capital costs is provided in Table 6.2 andthe battery costs in this case is seen as variable. Due to the rapid evolution of the technology and to highlight theinfluence of the battery costs on the sizing task, a range of battery costs are considered.
Component Price [e]
PV Module 150Micro inverter 45
Charge Controller 220Battery Figures 4.14 & 4.15
Table 4.3: PBIM component costs.
Figure 4.14 presents the historic trend of lithium-ion battery costs and continues to estimate the battery costs inthe future. In the case a battery replacement is required, it is more than likely that the purchasing for the new batteryreplacement will be a fraction of its costs today. As can be derived from Figure 4.14 within the next 7 years the cost perWatt-hour is expected to decrease by 50%, this is taken into consideration when estimating the system lifetime capitalcosts.
Figure 4.15 presents the profits expected from a single PBIM over its lifetime for its application is Costa Rica forpeak shaving applications. This analysis also takes into account battery costs, represented as e/kWh, and the in-stalled battery size. Figure 4.16 presents the total expected battery capacity loss over the system’s lifetime. As outlinedin previous sections, once the BOL capacity decreases by 20% the battery is required to be replaced. As can be derivedfrom the figure batteries with capacity smaller than 900Wh will need to one replacement throughout the system’s life-time. Therefore, batteries with a capacity lower than 900Wh a reduction in profits is observed due to the cost of thenecessary battery replacement.
To conclude, the economic considerations the most profitable battery capacity to install per PBIM is 900Wh, thisrepresents a battery over-sizing of 23% compared to the optimal battery capacity derived in Figure 4.13. Irrespectiveof the considered battery costs this battery capacity remains to be considered the most economically favorable. This
30

larger 900Wh battery will result in having a lower average DoD than smaller batteries, therefore experiencing fewercomplete cycles across the system’s lifetime.
Figure 4.14: Lithium-ion battery price trend. Source [10].
0 200 400 600 800 1000 1200 1400
Battery Capacity per PBIM [Wh]
1100
1150
1200
1250
1300
1350
1400
1450
1500
1550
1600
Figure 4.15: The lifetime profit of a single PBIM as a function of batterycosts and installed battery capacity.
0 200 400 600 800 1000 1200 1400
Battery Capacity per PBIM [Wh]
10
15
20
25
30
35
40
45
Capacity L
oss [%
]
Figure 4.16: The total simulated capacity loss as a function of battery size.
4.3.5. NETHERLANDSIn comparison to Costa Rica, the Netherlands experiences a greater variation in irradiance throughout the year
which significantly impacts the performance of the PBIM. The manner in which this affects the optimal battery ca-pacity to be installed in the PBIM for peak shaving applications is outlined in this section. The peak shaving scenariofor the Netherlands is shown in Figure 4.17 which displays the available solar energy for an average spring day inMarch. Only a single peak period is defined for the Netherlands occurring in the early evening and coinciding withthe end of the average work day. This implies that the battery is only required to be charged and discharged onceevery 24 hours. With the peak period occurring for a few hours in the evening this allows ample time for the batteryto be charged throughout the day. The appropriate battery size to install per PBIM will therefore be dependent on theaverage daily power generation of a single module. The peak period is identified using the pricing scheme of e-on, adutch energy provider, the pricing scheme is presented in Table 4.4. In this scenario the price increase during peakhours is 65% .
Tariff Scheme Symbol Price [e/kWh]
Off-Peak electricity λGOP 0.2
Peak hours electricity (between 17.00-21.00) λP 0.33
Table 4.4: Pricing Scheme Netherlands, [13]
4.3.6. SYSTEM CHARACTERISTICS
31

Figure 4.17: The peak shave scenario, Netherlands (March).
DAILY SYSTEM DYNAMICS
The battery SoC and power exchange are presented in Figures 4.18(a) & 4.18(b) respectively, while the system’senergy exchange with the grid is presented is Figure 4.19 for a time period of 48 hours.
• Peak hoursThe peak period occurs for 4 hours, this is assumed to remain constant. The battery discharge rate is based onthis time period to ensure that all the stored energy is discharged. A discharge rate that is to low will result in thebattery storing energy that will not be used. On the other hand discharge rates that are too high will result in aheightened battery temperature during discharging and result in the acceleration of its degradation. Thereforethe discharge rate is set to 0.25C.
• Off Peak hoursDuring the off-peak hours the battery is programmed to charge, Figure 4.18(b) presents the charging and dis-charging of the battery, whereby the charging power experiences fluctuations due to the intermittent nature ofsolar energy. The charging C-rate is therefore dependent on the power generated by the PV module. As was thecase in the previous case studies, larger batteries take longer to charge thus having the effect of importing moreenergy from the grid during off-peak hours. On the other hand larger batteries are able to store more energyresulting in a larger portion of the load during off-peak hours met using self-generated energy.
MULTIPLE PBIMS
The effect on the energy drawn from the grid and the battery capacity loss is analyzed as a function of PV and bat-tery capacity. The high variability of the available solar energy makes sizing the battery in this scenario considerablymore complex than in the case of Costa Rica. The PBIM system is modelled and the simulation results of the energyexchange with the grid and the battery capacity loss over the course of an entire year are presented in Figures 4.19through to 4.21. Based on these system characteristics the critical battery capacity is identified.
• Peak hoursThe energy drawn from the grid during peak hours is simulated for an entire year and the effect of varying thebattery capacity and the number of PBIMs is presented in Figure 4.19. Since the peak period is present in theevening, the addition of a PBIM in parallel each installed with a 200Wh battery, will not have a significant effectin reducing the peak load. This is due to the lack of solar energy in this time period indicating that the majorityof self-generated energy is drawn from the battery with minimal energy being drawn directly from the PV array.As battery capacity increases, more energy is able to be stored for peak period usage and thus has a greaterimpact in reducing the peak load. As seen by the changing slope of the curves, for an increasing battery capacitythe positive impact in reducing the peak load decreases. This observable change in effectiveness arises due tothe over-sizing of the battery in the winter. As the battery exceeds a certain capacity it is larger enough to storea significant fraction of a the energy generated by a single module during a typical winter day. The continuationof peak load reduction for increasing battery capacity occurs due to new found ability of the system to storemore energy during the times of abundant sunshine in the summer months. Unlike in the case of the system inCosta Rica no saturation point on which to identify the critical battery capacity is noticeable. Due to the highvariation of available solar irradiance throughout the year, as a result of this analysis no single optimal batterycapacity is identifiable as an appropriate size for this application.
• Off-Peak hoursAs in the previous case study the off-peak energy demand from the grid increases as the installed battery ca-pacity increases, Figure 4.20. This is due to the longer charging times required for the larger batteries, beforethe energy generated by the PV is directly used to power the load. As the PV capacity of the system increases,the off-peak energy demand decreases as there is an increase in self- generated energy. As the installed batterycapacity per PBIM increases the curves representing the different system sizes begin to converge. Although not
32
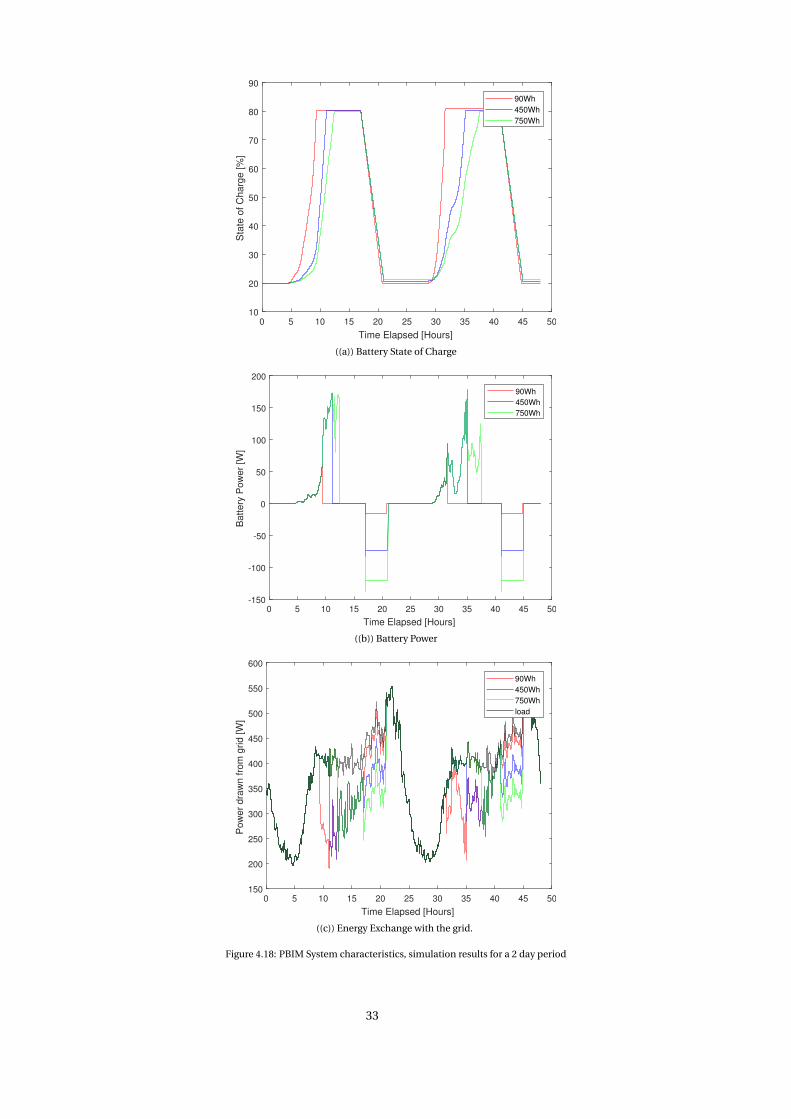
0 5 10 15 20 25 30 35 40 45 50
Time Elapsed [Hours]
10
20
30
40
50
60
70
80
90
Sta
te o
f C
harg
e [%
]
90Wh
450Wh
750Wh
((a)) Battery State of Charge
0 5 10 15 20 25 30 35 40 45 50
Time Elapsed [Hours]
-150
-100
-50
0
50
100
150
200
Battery
Pow
er
[W]
90Wh
450Wh
750Wh
((b)) Battery Power
0 5 10 15 20 25 30 35 40 45 50
Time Elapsed [Hours]
150
200
250
300
350
400
450
500
550
600
Po
we
r d
raw
n f
rom
grid
[W
]
90Wh
450Wh
750Wh
load
((c)) Energy Exchange with the grid.
Figure 4.18: PBIM System characteristics, simulation results for a 2 day period
33

seen in the figure the actual point of convergence represents the battery capacity which is able store all the en-ergy generated by the PV array on any given day. Unlike the case study in Costa Rica this point of convergenceis not identified as the saturation point or the critical battery capacity, as the battery is considered too large forPBIM applications due to limited space.
0 200 400 600 800 1000 1200 1400
Battery Capacity per PBIM [Wh]
1
2
3
4
5
6
7
8
En
erg
y d
raw
n f
rom
grid
,(P
ea
k H
ou
rs)
[Wh
/ye
ar]
105
1 PBIM
2 PBIMs
3 PBIMs
4 PBIMs
Figure 4.19: Annual energy from grid during peak hours.
0 200 400 600 800 1000 1200 1400
Battery Capacity per PBIM [Wh]
2.1
2.2
2.3
2.4
2.5
2.6
2.7
2.8
Energ
y d
raw
n fro
m g
rid (
Off-p
eak h
ours
) [W
h/y
ear]
106
1 PBIM
2 PBIMs
3 PBIMs
4 PBIMs
Figure 4.20: Annual energy drawn from grid during off-peak hours.
• Battery degradationThe capacity fade represented in total Wh lost increases for an increasing battery capacity, however the rateat which the capacity loss increases decreases for larger batteries. As the battery capacity increases and thePV energy generation remains constant, the percentage of the battery’s total capacity range which is used de-creases. The battery is therefore operated at cycles less deeply resulting in a decreased rate of degradation. Inthis instance no observable critical capacity can be identified.
• Energy storage sizing
Due to the disparity in meteorological conditions throughout the year. The most appropriate battery size to in-stall per PBIM would equate to the PV module energy generation per day; since the peak period peak occurs atthe close of the day, and as dictated by the energy control strategy this is the only time period at which the batteryis required to be discharged. However the PV module generation varies throughout the year and the installedbattery capacity is fixed. If the battery is optimized for the winter period the battery would be appropriatelysized for this period alone. If it were to be used during the summer such a capacity would be non-optimal asadditional peak load reduction would be feasible for larger battery capacities. Therefore a trade-off is requiredwith the extremities of the acceptable battery range being either a large battery with low usage during the win-ter, or a small battery that severely limits the benefits for the consumer during the summer.
Based on the analysis of the performance indexes, the relation between the system characteristics and the bat-tery capacity is understood. However it is insufficient to propose an optimal battery capacity. A cost analysisis required to determine whether the installation of a battery makes economical sense, and which battery willmaximize the economic savings. The savings incurred by reducing the peak load will compared to the cost ofincreasing the energy storage capabilities of the PBIM.
ECONOMIC CONSIDERATIONS
Adopting the same economic analysis methodology as outlined in section 4.3.4, the optimal battery size for PBIMpeak shaving applications in the Netherlands is analyzed in terms of economic benefits, whereby the profits incurredby a single PBIM is assessed as a function of battery capacity and battery costs. As a consequence of the less frequentusage and significantly lower average ambient temperatures, the battery for peak shaving in the Netherlands experi-ences a considerably slower degradation rate as compared to the Costa Rican case. The simulation results presentedin Figure 4.24 indicates that no battery replacements are necessary, throughout the considered system lifetime. Ap-plying equation 4.7 the total lifetime profit for a single PBIM as a function of battery capacity and battery costs ispresented in Figure 4.23. In this case the economically favorable battery capacity is heavily influenced by the batteryprices. At the higher end of the battery costs spectrum considering 0.4 e/Wh and 0.3e/Wh, the most economicallybattery capacity is 200Wh whereby savings can potentially be incurred on the energy costs. However, considering
34

0 200 400 600 800 1000 1200 1400
Battery Capacity per PBIM [Wh]
0
1
2
3
4
5
6
7
8
9
Ca
pa
city lo
ss [
Wh
]10-3
1 PBIM
2 PBIMs
3 PBIMs
4 PBIMs
Figure 4.21: The annual battery capacity loss.
0.5 1 1.5 2 2.5 3 3.5 4 4.5 5 5.5
Storage Capacity/PV capacity [Wh/W]
6.4
6.6
6.8
7
7.2
7.4
7.6
7.8
En
erg
y d
raw
n fro
m g
rid,(
Peak H
ours
) [W
h/y
ear]
105
Figure 4.22: Battery sizing Netherlands.
battery costs 0.2 e/Wh the optimal battery capacity increases to 600Wh. Prices lower than 0.2 e/Wh do not reflectcurrent battery costs, and is presented for a future scenario. In this case, the optimal battery size will only be restrictedby the available physical space at the rear of the PV module for the battery installation.
To conclude the economic considerations for optimally sizing the battery; the optimal battery size is heavily in-fluenced by battery prices, however this economic approach provides an additional insight into the considerationsfor energy storage sizing for peak shaving applications. The result presented in Figure 4.22 proved to be inconclusiveregarding the identification of optimal Storage/ PV array capacity ratio. In [47], the average costs for Lithium-ion bat-teries quoted to be 0.17 e/Wh. Therefore, using a conservative estimate of 0.2 e/Wh an optimal battery capacity of600Wh is identified, equating to a Storage Capacity / PV capacity ratio of 2.26Wh/W.
100 200 300 400 500 600 700 800 900 1000 1100
Battery Capacity per PBIM [Wh]
100
150
200
250
300
350
400
450
Figure 4.23: The lifetime profit of a single PBIM as a function of batterycosts and installed battery capacity.
100 200 300 400 500 600 700 800 900 1000 1100
Battery Capacity per PBIM [Wh]
8
8.5
9
9.5
10
10.5
11
11.5
12
12.5
Capacity L
oss for
lifetim
e [%
]
Figure 4.24: Total battery capacity loss over system lifetime.
4.3.7. OPTIMAL SYSTEM CHARACTERISTICSThe characteristics of the optimally sized PBIM for peak shaving applications in Costa Rica and the Netherlands is
expected to significantly differ. The extent of these differences are analyzed in this section, to quantify the impact ofthe meteorological conditions and the peak shaving scenario on the appropriate battery size. For the PBIM system inthe Netherlands a battery capacity of 600Wh was considered whilst for the system in Costa Rica a PBIM with batterycapacity of 729Wh was used. In both locations the effectiveness of a single PBIM is assessed.
35

AUTARKY
The implemented energy management system is programmed to reduce the load demand during peak hours bydischarging the battery. To asses the effectiveness at which this occurs the concept of autarky is introduced whichprovides an indication of the self-sufficiency of the system. In this particular case the system autarky is used to assesthe system’s independence from the grid exclusively during peak hours. Autarky is therefore defined as the percent-age of energy used to satisfy the load that originates from either the battery or the PV array and in this case is onlyconsidered for peak hours. The autarky is defined to be:
AUTARKY = Delivered self generated energy (Peak hours)
Peak load demand∗100 (4.8)
where: Delivered self-generated energy= Energy drawn from battery + Energy from PV array.
Therefore an autarky of 100% indicates that the entire load demand was met using exclusively self generated en-ergy and the system is entirely independent from the grid, however in this case this would require the additionalPBIMs to be connected in parallel. In this analysis the performance of only a single PBIM is analyzed. It is assumedthat system characteristics will scale relative to the number of PBIMs in the system as seen in Sections 4.3.4 and 4.3.6.
Figures 4.25 & 4.26 display the monthly autarky for Costa Rica and the Netherlands respectively. The variation ofautarky levels are seen to match the corresponding irradiance profiles, with consistent autarky levels seen throughoutthe year in Costa Rica. The autarky levels for the system in the Netherlands experiences significant variations. Due tolow PV generation during the winter a larger fraction of the peak load is met by drawing energy from the grid, whereasin the summer average autarky levels of 14% is recorded for a single PBIM system. Even during the summer, when theavailable solar energy is plentiful the PBIM installed in the Netherlands achieve lower autarky levels than comparedto Costa Rica due to the higher load demand during the peak hour period.
1 2 3 4 5 6 7 8 9 10 11 12
Month
0
5
10
15
20
25
Au
tark
y [
%]
Figure 4.25: Monthly peak load autarky, Costa Rica
1 2 3 4 5 6 7 8 9 10 11 12
Month
0
2
4
6
8
10
12
14
16
18
Au
tark
y [
%]
Figure 4.26: Monthly peak load autarky, Netherlands
STATE OF CHARGE
The variation in battery usage throughout the year is presented in Figures 4.27 & 4.28 with the battery SoC inCosta Rica reaching the set upper and lower usage limits of 80% and 20% throughout the year. The battery in theNetherlands on the other hand is never fully charged during the winter and can be regarded as over sized for this timeperiod. However during the summer the battery is regularly fully charged due to the abundant sunshine. Since theinstalled battery capacity is fixed, a trade-off is observed in the case of the Netherlands.
BATTERY DEGRADATION
Due to consistently warmer temperatures, a higher depth of discharge and performing twice the number of cyclesa day the battery in Costa Rica experiences a much greater degradation rate than the battery used in the Nether-lands. Figure 4.29 provides a comparison between the battery capacity loss in the PBIM system for both locations.The degradation rate for Costa Rica appears relatively uniform for each month since the battery usage remains largelyunchanged as the year progresses. The capacity loss for the Netherlands on the other hand differs greatly, with a largercapacity loss observed during the summer months. This heightened degradation rate is due to higher ambient tem-peratures and the deeper cycling of the battery as compared to its usage during the winter months. The PBIM batteryfor peak shaving applications in Costa Rica experiences a capacity loss of 1.56% per year whereas the battery in the
36

0 50 100 150 200 250 300 350
Time [Days]
10
20
30
40
50
60
70
80
90S
tate
of
Ch
arg
e [
%]
Figure 4.27: Annual SoC variation, Costa Rica
0 50 100 150 200 250 300 350
Time [Days]
0
10
20
30
40
50
60
70
80
90
Sta
te o
f C
ha
rge
[%
]
Figure 4.28: Annual SoC variation, Netherlands
Netherlands degrades by 0.8% per year.
Based on the degradation estimates the battery for peak shaving applications in Costa Rica has a lifetime of 12.8years before its capacity reduces to 20% of BOL. On the other hand, in the Netherlands the battery lifetime is expectedto last up to 25 years, matching the predicted lifetime of the PV module.
1 2 3 4 5 6 7 8 9 10 11 12
Month
0
0.2
0.4
0.6
0.8
1
1.2
1.4
1.6
Capacity L
oss [%
]
CR
NL
Figure 4.29: Monthly battery degradation, Costa Rica
4.4. CONCLUSIONS• Energy storage sizing
The appropriate energy storage size for peak shaving applications in Costa Rica and the Netherlands has beenidentified and the performance of the optimally sized systems are compared. The scenarios have been createdto be as realistic as possible through the application of meteorological data, load profiles and the identificationof peak periods all of which impact the optimal battery capacity.
1. Peak Shave Scenario The time and frequency of the peak periods affect the required battery size. In thecase of Costa Rica, peak periods occur twice a day affecting the number of hours where the battery isprogrammed to charge (during periods of PV module energy generation and off-peak times.) The optimalbattery size is therefore based on the energy generated by the PV module during the allocated battery
37

charging times. In the Netherlands, the peak period occurs in the evening, therefore the battery is chargeduninterrupted throughout the day, limited only by the available solar energy.
2. Meteorological effects The system characteristics of the grid-connected PBIM in Costa Rica is seen toremain relatively constant throughout the year and is able to meet, on average, 21% of the peak load withself generated energy. The system autarky in the Netherlands is seen to vary from 2% on the worst monthto 17% during the summer, for a single PBIM.
• ReliabilityDespite the varying levels of autarky the system is always 100% reliable due to presence of a grid connection.However considering a single PBIM, the system based in Costa Rica is able to meet a greater fraction of the peakload with self-generated energy, than the system based in the Netherlands.
38

5OFF-GRID PBIM SYSTEM
In this chapter the usage of the PBIM concept for off-grid applications is assessed. The energy control strategyand the energy balance of such a system is presented. This extends further to include two case studies whereby theoff-grid system is applied in two locations. The appropriate battery capacity for these two systems is then identified.
5.1. METHODOLOGYTo assimilate the dynamic characteristics of the off-grid system an energy management control is implemented.
The performance of the system is assessed based on the fulfillment of the system objectives.
5.1.1. OBJECTIVESThe system objectives for stand-alone applications differ from those presented in the grid-connected case study.
The standalone system relies exclusively on the energy generated by the PV to meet the load requirements. The op-timal system from a residential user’s point of view would be minimize the frequency of power interruptions. Thisrelates to the reliability of the system and its ability to store energy during daylight hours and satisfy the load demandthroughout the night or during periods of time with unfavorable meteorological conditions. However the reliabilityincreases with respect to the energy storage capabilities of the system. Therefore as the system becomes increasinglyreliable the capital costs associated with it will also rise. Again in this instance the capital costs of the PBIM are as-sumed to increase linearly with respect to increasing the installed battery capacity. The system objectives can thus besummarized:
1. Maximize system reliability
2. Minimize the installed battery capacity.
5.1.2. APPROACHSimilar to the sizing methodology in the grid connected case the appropriate battery size is selected based upon
the concept of a saturation point of desirable system characteristics as a function of battery capacity. In the case ofthe grid connected system in the Netherlands economic factors had to be taken into consideration. The capacity atwhich this occurs, the critical capacity, indicates the lowest possible installed capacity at which the desirable systemcharacteristics are improved minimally if this capacity is increased. In essence, this point highlights the lowest batterycapacity at which the identified system performance indexes are optimized.
Unlike the grid-connected scenario there is no source of revenue or potential savings in the case of an off-gridsystem. However by modelling the dynamics between system reliability and battery capacity a saturation point atwhich CCrit occurs can be determined. The system reliability is found to be the governing decision variable. Reliabilityis reflected in the Loss of Load Probability (LLP) [5] which is described by;
LLP = Efail∫year P (t )loadd t
(5.1)
where Efail is the total energy required by the load that cannot be delivered by the PBIM.
To take into account the manner in which the battery is used, battery degradation is also considered as a perfor-mance index. The battery aging process is accelerated if the battery is regularly deeply cycled. Having a larger batterywill reduce the aging process, however the additional investment cost of over-sizing the battery should be considered.The battery sizing is based on the LLP of the system. Once identified the characteristics of the optimally sized systemsare analyzed.
39

5.2. SYSTEM MODELLINGThe concepts implemented to model the off-grid PBIM system are presented in this section.
STARTSTART
PV>LoadPV>Load
SOC<80%SOC<80% SOC<20%SOC<20%
Load not 100% metLoad not 100% met
TRUE
FALSE
FALSE
TRUE
FALSE
Charge battery
Charge battery
Dump Surplus
Dump Surplus
ENDEND
Discharge battery
Discharge battery
Load metLoad met
Load metLoad met
ENDEND ENDEND
Figure 5.1: The controller logic for peak shaving
5.2.1. ENERGY CONTROL STRATEGYThe logic used to model the system dynamics and energy flow in an off-grid system is presented in Figure 5.1. In
the instance that neither the PV energy generation nor the battery is able to meet the load demand a loss of load isconsidered. If the opposite holds true whereby the battery is fully charged and the PV array generates more energythan is required by the load, there is excess energy which needs to be dumped.
5.2.2. GOVERNING EQUATIONSThe governing equations represent the energy balance in the off-grid system and the dynamic relation between
the supply, storage and consumption of energy at any given time. The symbol definitions are presented in Table 4.1.
PV GENERATION
Without the presence of the grid additional parameters Pfail and Pexcess are the power required that cannot bedelivered and the excess power generated that is not used or stored respectively.
1
ηMPPTt .ηinvt
.PPV−Battt +1
ηMPPTt
.PPV−loadt +Pfail +Pexcess ≤ P maxPVt
∀t . (5.2)
BATTERY
The battery constraints are identical to those outlined in section 4.2.2.
ENERGY BALANCE
The equality constraint of the off-grid system is described by;
Ploadt = PPVt +Pfailt −Pexcesst +P inBattt
−P outBattt
∀t (5.3)
5.3. CASE STUDIESTwo case studies are created to test the performance of the PBIM for off-grid applications. Costa Rica and the
Netherlands are again used as locations in which to simulate the dynamic behaviour of the PBIM. Based on the systemdynamics the appropriate battery size for each case study is identified.
40

5.3.1. SCOPE OF DATAThe scope of the input data used throughout the off-grid case studies is touched upon in this section.
METEOROLOGICAL DATA
The required meteorological data inputs remains unchanged and is described in section 4.3.2.
LOAD DATA
The average daily energy consumption is assumed to be less for an off-grid household as compared to a gridconnected household. In addition off-grid energy users are assumed to be more willing to shift their energy usage withrespect to the energy supply, and therefore resulting in lower night time energy usage as compared to grid connectedhouseholds. The profile used to represent the energy consumption is the same for each off-grid case study, and isconsidered for a resolution of 10 minutes, Figure 5.2. The average daily energy demand is 6.3KWh.
0 5 10 15 20 25
Time of day
50
100
150
200
250
300
350
400
450
500
550
Po
we
r [W
]
Figure 5.2: Applied load profile for off-grid case studies
5.3.2. PV ARRAY SIZINGTo enable the creation of a realistic off-grid scenario it is necessary to derive an estimation of the required PV array
capacity. In the off-grid case study analyzing the effectiveness of a single PBIM for a given load profile and mete-orological conditions is unrealistic unlike in the grid connected case study. The reasoning for this alteration in themethodology is summed up in two reasons. Firstly, as dictated by the energy control strategy, once the conditionshave been met to commence the discharging of the battery, the discharge C-rate is governed by the energy demandand the PV generation at that instant in time. Given a scenario whereby the PV array does not generate any energy, thebattery is required to discharge at a rate such that the load demand is met until either the PV array resumes generatingenergy or the battery is fully discharged. Considering a single PBIM, the discharge requirements of the battery will notbe within its nominal operating range, a scenario which is unlikely to occur in real-life applications. This heighteneddischarge C-rate required from the small battery capacity implies that the degradation that will occur will be unreal-istically high and therefore analyzing this effect will not provide any valuable insight on the system characteristics.
The second reason to estimate the PV array size is to ensure that a realistic range of the battery-PV ratio is ascer-tained. In the case an unrealistic ratio is assumed, the energy generated by the PV array will be directly used to meetthe energy demands the instant it is generated, this will remain true throughout the entire time period of PV energygeneration throughout the day. However, for a more realistic scenario the PV array is sized such that it produces suffi-cient energy during the day to meet the energy demand at that instant in time and to charge the battery to store energyfor future use.
An estimation of the PV array sizes is derived using the following expression obtained from [5].
Nmodules =E L
Y .SF
AM .∫
year .GM (t ).η(t )d t(5.4)
where the number of modules, Nmodules, is a function on the yearly energy demand, E LY , the yearly energy genera-
tion per PV module (AM .∫
year .GM (t ).η(t )d t ). A sizing factor, SF , is introduced to prevent the under-sizing the system
41

and equates to 1.1. The required number of modules for each location is presented in Table 5.1.
Location Load [kWh/day] Nmodules
Costa Rica 6.3 6Netherlands 6.3 11
Table 5.1: PV Array sizing for the considered locations
5.3.3. COSTA RICAIn this section the PBIM characteristics for its off-grid application in Costa Rica are analyzed. A 6 PBIM system is
taken into consideration as presented in Table 5.1.
LOSS OF LOAD PROBABILITY
The probability of the load demand not being met as a function of installed battery capacity per PBIM and PVcapacity is pictured in Figure 5.3. Intuitively larger battery capacities enable the system to operate in a more reliablemanner, the same applies for increasing the PV capacity of the system. The critical battery capacity describes thecapacity at which a saturation point is observed, whereby increasing the battery capacity will not result in a morereliable system. In terms of available solar energy the identifiable saturation point indicates a battery size that isable to accommodate the energy generated by the PV module that is not required by the load during the day. Sincethe energy generated by a single PV module is limited, installing a larger battery would not result in more energybeing stored; thus the LLP is not significantly improved for batteries larger than the critical capacity. Particularlynoticeable in the 6 PBIM system, is the continued decrease in LLP beyond the identified saturation point,this is dueto the presence of outlier days whereby the daily PV module energy production is considerably higher than average.Larger batteries will be able to store this additional energy, however this will only be beneficial on days where PVgeneration is extraordinarily high, which has a low probability of occurring.
BATTERY DEGRADATION
The battery degradation losses are presented Figure 5.4. Again, a saturation point is observable and is consistentthroughout the different system sizes and occurs at a capacity of 800Wh per PBIM. For batteries larger than 900Wh perPBIM the increase in degradation due to cycling is minimal. This feature is due to the over-sizing of the battery withrespect the energy generation of the PV module and the energy demands during the day. The energy storage capacityis greater than the energy available to be stored. Therefore the energy throughput of the battery no longer increasesas the battery capacity increases; degradation remains constant.
0 200 400 600 800 1000 1200 1400
Battery Capacity per PBIM [Wh]
0
0.05
0.1
0.15
0.2
0.25
0.3
0.35
0.4
0.45
Loss o
f Load P
robabili
ty
6 PBIMs
7 PBIMs
8 PBIMs
Figure 5.3: Loss of Load probability, as a function of system size, Costa Rica
0 200 400 600 800 1000 1200 1400
Battery Capacity per PBIM [Wh]
2
4
6
8
10
12
14
16
Annual C
apacity L
oss [W
h]
10-3
6 PBIMs
7 PBIMs
8 PBIMs
Figure 5.4: Battery capacit losses as a function of system size, Costa Rica.
ENERGY STORAGE SIZING
The sizing of the energy storage capacity is presented in Figure 5.5 as a function of energy storage and PV capacityfor 6 PBIMs connected in parallel. The optimal battery capacity to PV capacity ratio is found to be an energy storagesize capable of storing the energy generated by the Jinko PV module operating at rated capacity for 3 hours. By in-creasing the battery to PV capacity ratio from 1 Wh/W to 3 Wh/W a decrease in the LLP of 0.3 is observed. Howeverincreasing the battery to PV capacity ratio from 3Wh/W to 5Wh/W a significantly smaller decrease in LLP of 0.045 isobservable. The saturation point equating to battery capacity of 800Wh, marks the capacity above which there is nosignificant improvement in the system reliability.
42

0.5 1 1.5 2 2.5 3 3.5 4 4.5 5 5.5
Storage Capacity/PV capacity [Wh/W]
0.05
0.1
0.15
0.2
0.25
0.3
0.35
0.4
0.45
Lo
ss o
f L
oa
d P
rob
ab
ility
Figure 5.5: Identification of the critical battery capacity, Costa Rica.
5.3.4. NETHERLANDS
The off-grid application of the PBIM in the Netherlands is analyzed in this section, resulting in the proposal ofan appropriately sized battery capacity to install per PBIM. In order to satisfy the energy demand during the winterenergy is required to be available during periods of time of minimal available solar energy. Therefore the requirednumber of modules for the Netherlands case study is considerably larger than the array required in Costa Rica.
LOSS OF LOAD PROBABILITY
The loss of load probability is presented in Figure 5.6. With double the number of PV modules to power the sameload profile as in the Costa Rican case, the PBIM system in the Netherlands still suffers from low reliability, whichis primarily due to the uneven distribution of solar energy throughout the year. The rate of system reliability im-provement due to the increase of available battery capacity reduces for as battery capacities increase above 400Wh.However unlike in the Costa Rican case study, slight improvements in the system reliability can be made by increasingthe available energy storage above the critical capacity of 400Wh.
BATTERY DEGRADATION
The battery degradation for each system capacity is presented in Figure 5.7, above a capacity of 400Wh per PBIMthe rate of increase of the battery capacity loss slows. This is due to the over-sizing of the battery above this capacityresulting in a lower percentage of the available capacity being used to store energy.
ENERGY STORAGE SIZING
The system reliability as a function of the PV-battery ratio for PBIM off-grid applications in the Netherlands ispresented in Figure 5.8. The optimal battery-PV ratio is found to be 2Wh/W. A lower optimal capacity is found forthe Netherlands as compared to Costa Rica since on a yearly basis there is less available energy. With Costa Ricaexperiencing on average 5 equivalent sun hours a day the energy generated by the 6 module PV array is sufficient tomeet both the day and night-time loads at a low LLP. In the Netherlands however, the energy generated by a single PVmodule, as a daily average, is considerably less and experiences 3 equivalent sun hours a day. To generate sufficientenergy an increased number of PV modules is required. The optimal battery capacity/ PV capacity of the PBIM in theNetherlands is therefore less than required in Costa Rica due to the distributed nature of the energy storage.
43

0 200 400 600 800 1000 1200 1400
Battery Capacity per PBIM [Wh]
0.34
0.36
0.38
0.4
0.42
0.44
0.46
0.48
0.5
0.52Loss o
f Load P
robabili
ty
11 PBIMs
12 PBIMs
13 PBIMs
Figure 5.6: LLP as a function of installed battery capacity, Netherlands
0 200 400 600 800 1000 1200 1400
Battery Capacity per PBIM [Wh]
3
3.5
4
4.5
5
5.5
6
6.5
7
7.5
Annual C
apacity L
oss [W
h]
10-3
11 PBIMs
12 PBIMs
13 PBIMs
Figure 5.7: Annual capacity loss, Netherlands.
0.5 1 1.5 2 2.5 3 3.5 4 4.5 5 5.5
Storage Capacity/PV capacity [Wh/W]
0.36
0.38
0.4
0.42
0.44
0.46
0.48
0.5
0.52
Lo
ss o
f L
oa
d P
rob
ab
ility
Figure 5.8: Identification of the critical battery capacity, Netherlands
5.3.5. OPTIMAL SYSTEM CHARACTERISTICS
The performance and the system characteristics differ greatly when comparing between the PBIM’s off-grid ap-plication in Costa Rica and the Netherlands. In this case with the entire supply of energy being self generated, theability of the system to meet the load requirements is dependent on the ratio between the energy storage and batterycapacity, which have been identified in the previous section. For each location the optimal system is defined by thePV array sizes presented in Table 5.1 and the optimal battery-PV ratios presented in Figures 5.5 & 5.8 for Costa Ricaand the Netherlands respectively.
AUTARKY
Compromising of 6 PBIMs, within each a 800Wh battery installed, the system in Costa Rica is able to maintainmonthly autarky levels of above 80%, Figure 5.9. On the other hand the autarky levels for the PBIM system in theNetherlands varies between monthly autarky levels as low as 10% in December and rising above 70% in June despiteconsisting of an 11 module PV array.
44

1 2 3 4 5 6 7 8 9 10 11 12
Month
0
10
20
30
40
50
60
70
80
90
100A
uta
rky [
%]
Figure 5.9: Monthly system autarky, Costa Rica.
1 2 3 4 5 6 7 8 9 10 11 12
Month
0
10
20
30
40
50
60
70
80
Au
tark
y [
%]
Figure 5.10: Monthly system autarky, Netherlands.
STATE OF CHARGE
The SoC variations over the entire year are presented in Figures 5.11 & 5.12 for Costa Rica and the Netherlandsrespectively. In the Costa Rican case the battery is uniformly used throughout the year, with the battery being fullycharged and discharged between restricting SoC limits on a regular basis. For scenario in the Netherlands throughoutthe winter the months, the battery usage is minimal with the battery SoC rarely rising above 50%. However, during thesummer, the battery SoC variations is comparable to that in Figure 5.11, whereby the entire available energy storagecapacity is used.
0 50 100 150 200 250 300 350
Time [Days]
10
20
30
40
50
60
70
80
90
Sta
te o
f C
ha
rge
[%
]
Figure 5.11: SoC variations, Costa Rica
0 50 100 150 200 250 300 350
Time [Days]
10
20
30
40
50
60
70
80
90
Sta
te o
f C
ha
rge
[%
]
Figure 5.12: SoC variations, Netherlands
ENERGY DUMP
The energy dump refers to the available excess energy that occurs once the load energy demand is met and thebattery is fully charged. During this time the PV array continues to generate energy which needs to be dumped. Theexcess energy generated by the systems in Costa Rica and the Netherlands are presented in Figures 5.13 & 5.14 re-spectively. The excess energy in the Costa Rican system varies on a monthly basis and with the total energy dumpedper month seemingly high. As a result of the high reliability of the system it is designed to perform during periods oftime with unfavorable conditions. Therefore in the presence of consistently favorable conditions an excess of energyis generated. When the batteries are fully charged the energy from the PV array is directly used to meet the energydemands at that instant in time. During such a scenario should the energy generation of the PV array exceed the in-stantaneous energy demand, this generated energy is dumped. Combining the high variability of both the availablesolar energy and the energy demands (Figure 5.2) a mismatch between the two is expected. The system in Costa Ricaboasts an LLP of 0.12 it is therefore able to meet the energy demands throughout most of the unfavorable conditions,
45
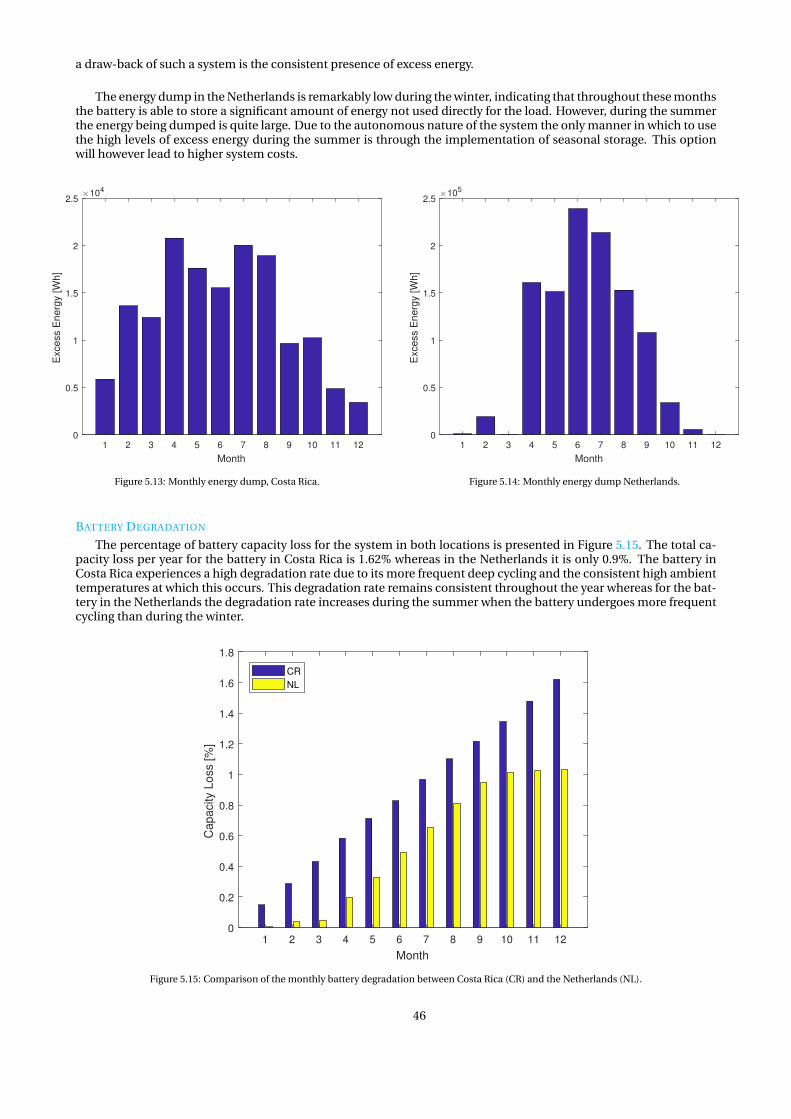
a draw-back of such a system is the consistent presence of excess energy.
The energy dump in the Netherlands is remarkably low during the winter, indicating that throughout these monthsthe battery is able to store a significant amount of energy not used directly for the load. However, during the summerthe energy being dumped is quite large. Due to the autonomous nature of the system the only manner in which to usethe high levels of excess energy during the summer is through the implementation of seasonal storage. This optionwill however lead to higher system costs.
1 2 3 4 5 6 7 8 9 10 11 12
Month
0
0.5
1
1.5
2
2.5
Exce
ss E
ne
rgy [
Wh
]
104
Figure 5.13: Monthly energy dump, Costa Rica.
1 2 3 4 5 6 7 8 9 10 11 12
Month
0
0.5
1
1.5
2
2.5
Exce
ss E
ne
rgy [
Wh
]
105
Figure 5.14: Monthly energy dump Netherlands.
BATTERY DEGRADATION
The percentage of battery capacity loss for the system in both locations is presented in Figure 5.15. The total ca-pacity loss per year for the battery in Costa Rica is 1.62% whereas in the Netherlands it is only 0.9%. The battery inCosta Rica experiences a high degradation rate due to its more frequent deep cycling and the consistent high ambienttemperatures at which this occurs. This degradation rate remains consistent throughout the year whereas for the bat-tery in the Netherlands the degradation rate increases during the summer when the battery undergoes more frequentcycling than during the winter.
1 2 3 4 5 6 7 8 9 10 11 12
Month
0
0.2
0.4
0.6
0.8
1
1.2
1.4
1.6
1.8
Capacity L
oss [%
]
CR
NL
Figure 5.15: Comparison of the monthly battery degradation between Costa Rica (CR) and the Netherlands (NL).
46

5.3.6. CONCLUSIONS• Storage Observable in the LLP figures, for a fixed PV capacity is an optimal battery capacity. Increase the avail-
able capacity above a certain limit no longer proves to have a positive impact on the system reliability, this isobservable for both locations. The off-grid system in the Netherlands is found to require a lower battery/PV ca-pacity compared to an off-grid system in Costa Rica, however the total system size in the Netherlands is requiredto be much larger than in Costa Rica in order to overcome the negative effects of poor solar irradiance duringthe winter.
• Energy Dump The distribution and quantity of energy dumped a year varies between the two locations. How-ever the energy dumped for both locations is considered to be high and let unavoidable. In order to minimizethe dumping of excess energy, alternative energy storage technologies could be considered for the longer termseasonal storage.
• Degradation Higher ambient temperatures and more frequent deep cycling of the battery result in a greatercapacity loss for the system in Costa Rica. As a result the battery can be expected to be replaced sooner thanthat installed in the system in the Netherlands.
47


6PV-BATTERY INTEGRATED MODULE
FEASIBILITY
In this section, the PV-Battery integrated Module is compared to a conventional solar system in terms of boththeir technical and economical aspects. The PBIM design aims to reduce the initial capital costs of residential solarsystems. However this will only become the case if its performance characteristics remain comparable to that ofconventional solar home systems. The characteristics of the PBIM and conventional system are modelled and theresults are analyzed. The technical and economic comparisons are performed between a conventional and PBIMsystem in the Netherlands.
6.1. SCENARIO DESIGNThe modelling of the PBIM has been explained in detail in Chapter 3. In this performance comparison between
a convention solar home system and the PBIM the effect of temperature is considered. The operating temperatureof the PV module and the battery are considered to be the aspects which heavily influence the PBIM performance. Acomparison is provided to determine the extent to which this affects the system performance; the conventional systemis first defined. Both systems are modelled for the same application: grid connected peak shaving in the Netherlands.To preserve the integrity of the comparison the storage and PV capacity of both systems are identical. In this sectionthe scenario in which the two systems are compared is defined.
6.1.1. ENERGY STORAGEAs is common practice the batteries for conventional residential system are placed away from the PV modules
and stored indoors. The ambient temperatures in a Dutch household do not reflect outdoor ambient temperatures.The battery of a convectional system is exposed to, is therefore assumed to remain constant throughout the year. Theindoor ambient temperatures remain well within the nominal temperature range, (Table 2.2. On the other hand thebattery in the PBIM is exposed to a much wider range of ambient temperatures throughout the year.
6.1.2. PV MODULEThe efficiency of the PV module varies as a function of the module temperature. For conventional solar systems
the convective cooling of the module is dependent on the applied mounting structure whereby rack mounts, installedapproximately 1 meter above the ground allow for a larger heat transfer between the module and the environment ascompared to a stand-off mount which typically leaves the module placed 20cm above the ground. As a result of highwind speeds the cooling of the module is accelerated due the turbulent nature of the airflow around the PV module.
Regarding the PBIM concept the BoS components are encased at the rear of the PV module resulting in a lowermodule surface area that is directly in contact with the surrounding environment. As a result of this encasing theheat dissipation from the module to the ambient air is reduced. The PV module of the PBIM will therefore experiencehigher operating temperatures than a solar module in conventional systems. The extent to which the elevated moduletemperatures affect the system performance as a whole is discussed.
6.2. TECHNICAL FEASIBILITYTo asses the deliverable performance of the PBIM, the manner in which the PV and battery are affected by tem-
perature is studied.
6.2.1. PV MODULE TEMPERATURESimulations were performed to asses the system characteristics of the PBIM as compared to a conventional system
and to quantify the effect of elevated temperatures on the system. The methodology on which the modelling on thePV module temperature is based is derived from [18]. To illustrate the effect of the poorer heat dissipation of the PBIM
49

PV module the simulation result presented in Figure 6.1 presents the temperature variation of the module applied ina conventional and the PBIM system for an average spring day.
6 8 10 12 14 16 18
Time [Hours]
5
10
15
20
25
30
35
40
45
Te
mp
era
ture
[°C
]
Conventional
PBIM
Figure 6.1: PV temperature in conventional and PBIM systems for day 100 of the year.
During the middle of the day, where the highest ambient temperatures are present the difference in the tempera-ture between the two modules reaches a maximum of 1.5 °C, for the 100th day of the year. The difference is expected tobecome more pronounced during the warmer periods of the year. This elevated temperature will affect the PV moduleperformance, resulting in its operation at lower efficiencies.
6.2.2. PV ENERGY YIELDWith both modules exposed to same ambient irradiance and temperature conditions in the Netherlands, the dy-
namic operating efficiency of each test module is determined and resulting in an estimation of the the annual energygeneration of each module, Table 6.1. The PV module in the conventional system is predicted to generated 0.4 % moreenergy compared to the module used in the PBIM system. This decreased PV energy production can be considered tobe insignificant. To provide additional perspective the energy yield results for the different system in Costa Rica havealso been provided. In this case the difference in energy production is considerably more, with the PV module in theconventional system generating 10.5% more energy per year than the module in the PBIM system. This justified byeffect of the ambient meteorological conditions for each location.
SystemEnergy generation [kWh/year]NL CR
PBIM 255.14 384.25Conventional 256.16 424.45
Table 6.1: Energy generated by the 265Wp Jinko PV module in PBIM and conventional applications, for the different locations
6.2.3. BATTERY DEGRADATIONIncluded in this comparison is the extent to which the elevated ambient temperatures affects the degradation of
the battery installed at the rear of the PV module according to the PBIM design. According to [18] when placed at anoptimal distance from the PV module to battery in the PBIM experiences a temperature equal to the ambient temper-ature, such that the heat dissipation of the PV module does not influence the ambient temperature of the battery. Onthe other hand the battery in the conventional system, located in the household, is assumed to experience a constantambient temperature of 21 °C throughout the year [48]. The extent to which these conditions influence the batterydegradation for each system is presented in Figure 6.2.
These results indicate the battery in the PBIM experiences a greater loss in capacity throughout a year of usage,as compared to the battery used in conventional systems. This is due to the elevated temperatures of the outdoorPBIM battery. The total degradation of the PBIM battery is found to be 0.11% higher per year than in the conventionalsystem, for the applied peak shaving algorithm. This is considered to be a negligible difference.
50

0 2 4 6 8 10 12
Month
0
0.1
0.2
0.3
0.4
0.5
0.6
0.7
0.8
Capacity L
oss [%
]
Conventional
PBIM
Figure 6.2: Battery capacity loss for the conventional and PBIM solar systems.
6.2.4. ENERGY DRAWN FROM THE GRIDThe objective of the grid-connected system is to reduce the energy costs by reducing the peak load demand. The
effectiveness of the conventional and the PBIM systems at realizing this goal is assessed. Figure 6.3 compares theannual peak load energy costs for the different systems. For comparison the energy consumption exclusively duringpeak hours is presented for a the normal household with no PV or storage capacity (NO PV), for a system with only PVand no storage capabilities (PV) and for the PBIM and conventional systems. These comparisons are performed for a6 module array with the optimal battery capacity equating to a Battery-PV ratio of 2.3 Wh/Wp. The energy consump-tion is normalized for the peak hour requirements of the load. Having solely a PV array with no storage capabilitieshas a minimal effect in reducing the energy consumption. This is due to the presence of the peak hours in the eveningwhereby the available solar energy is minimal. The ability of the PBIM and conventional system to meet the systemrequirements have what can be considered to a negligible difference in peak load reduction by taking into accountsolely temperature effects.
For the same system, the impact on the total energy drawn from the grid is presented in Figure 6.4. With No-PVindicating the total household energy demand. Noticeable in this figure is the reduced energy demand for a PV arrayas compared to both the conventional and PBIM systems. This is due to the higher losses associated to the batteryusage and therefore, more energy is drawn from the year on an annual basis for the systems incorporated with energystorage capabilities.
10.96954
0.44929 0.4489
No PV PV PBIM Conventional0
0.1
0.2
0.3
0.4
0.5
0.6
0.7
0.8
0.9
1
No
rma
lise
d G
rid
En
erg
y c
on
su
mp
tio
n (
Pe
ak h
ou
rs)
Figure 6.3: Annual Energy drawn from grid during peak hours
1
0.62101 0.63227 0.63064
No PV PV PBIM Conventional0
0.1
0.2
0.3
0.4
0.5
0.6
0.7
0.8
0.9
1
No
rma
lise
d G
rid
En
erg
y c
on
su
mp
tio
n
Figure 6.4: Total annual energy drawn from grid
51

Component Price [e]
PV module 150Charge Controller (MPPT) 220
Micro inverter 45Battery (10 Ah,33 V) 250
Table 6.2: PBIM component cost.
Component Price [e]
PV module 150Charge Controller (MPPT) 440
Inverter 340Battery (10 Ah,33 V) 185
Table 6.3: Conventional system component costs.
6.3. ECONOMIC FEASIBILITYIn addition to the technical aspects of the PBIM, a cost analysis is also performed to provide an indication of the
potential economic benefits for the end-user. In this case such benefits are in the form of savings made on the energybill.
6.3.1. ENERGY BILL REDUCTIONThrough the implementation of the peak shaving energy savings on the residential electricity bill are incurred by
the energy user. With the algorithm dictating that the self-generated is used exclusively during peak periods unlessthe battery is fully charged. Figure 6.5 presents the energy costs with respect to the different systems. The annual costsfor the system without nay batteries (PV) is 23% higher than the PBIM and convectional systems in which batteriesare present. This demonstrates that the addition of batteries to store self-generated energy for use during periodsof time with high energy prices has a significant effect on reducing energy costs. Capital costs need to be taken intoconsideration to asses the financial viability of introducing the batteries into the renewable energy system.
1
0.83211
0.60573 0.60428
No PV PV PBIM Conventional0
0.1
0.2
0.3
0.4
0.5
0.6
0.7
0.8
0.9
1
Norm
alis
ed E
nerg
y C
osts
Figure 6.5: Normalized annual energy costs.
6.3.2. INITIAL CAPITAL COSTSThe component costs for a single PBIM are presented in Table 6.2. For the 6 module PBIM system considered in
Figures 6.3 through to 6.5 the total capital cost of such a system amounts to a total of 6618e. It has to be noted thatthe PBIM concept is still in the early stages in development and therefore high capital costs are associated with thenecessary components.
6.3.3. PAYBACK TIMEThe payback time is widely used financial metric used across the industry to asses the financial viability of up-
coming projects. It is defined as the time, in years, that it takes for the system to generate enough savings such that itcovers the initial investment costs. The payback time is calculated as follows:
Payback time = Initial Investment
Annual return(6.1)
The energy costs of the energy demand per year, whereby the 100% of the energy used is drawn from the grid thehousehold electricity bill stands at 915e. Figure 6.2 demonstrates that the application of the 6 module PBIM systemreduces the energy bill by 40%. The PBIM system therefore has a payback time of 11.8 years, which is remarkably high
52

for a residential PV system. Furthermore, for its application in the Netherlands, the system remains relatively unusedduring the winter, due to the low levels of available irradiance, which is unlike the case for the its application in CostaRica. On the other hand, a conventional solar home system of the same capacity the payback time is estimated to be7.6 years.
The PBIM is still in the early stages of development and requires the implementation of state-of-the-art batteriesand micro-inverter. These high cost components negatively influence the financial attractiveness of the PBIM system,over a conventional system. However as these technologies develop and economies of scale is introduced instead ofthe single component purchasing, which the prices in Table 6.2 and 6.3 are based upon, the cost of a PBIM can beexpected to significantly decrease.
6.4. CONCLUSIONSIn this section the financial and technical feasibility of the PBIM has been assessed and compared to that of a
conventional solar system. In terms of technical capabilities the PBIM performs slightly worse than a conventionalsystem, in terms of lower PV generation and a faster battery degradation. However, the differences between thetwo systems can be considered insignificant as concluded by this comparisons for the grid connected system in theNetherlands. In terms of financial feasibility the PBIM currently does not fare well as compared to a conventionalsystem despite the promise of reduced installation and labour costs. This is primarily due to the high costs of thecomponents. The costs of the PBIM components are based on the costs of a PBIM prototype, with the componentsorigination from various suppliers and regions leading to a remarkably high cost. With further development the PBIMhas potential to compete with conventional solar systems in the future.
53


7CONCLUSIONS & RECOMMENDATIONS
Throughout this thesis the PBIM concept was tested under different energy storage scenarios and locations. Casestudies were created to asses the PBIM performance in off-grid and grid-connected applications for the Netherlandsand Costa Rica. Based on the system objectives and characteristics the optimal battery capacity for each case study isproposed. The project extends further to asses the performance of the PBIM system with the optimal energy storagecapacity for each of the case studies. Furthermore, the technical and economic feasibility of the PBIM is compared toa conventional system for peak shaving applications in the Netherlands.
7.1. CONCLUSIONSTo set the scope of the project research questions were formulated. In this section, the identified questions are
answered based on the analysis performed throughout the project.
1. What is the impact of local weather conditions and energy storage motivations on the PV-Battery IntegratedModule?
• In which applications is the PBIM an effective solution? The full benefits of the PBIM are taken advantageof in residential applications, by offering a standardized and optimized solar system. The PBIM is foundto be an effective solution for grid connected applications by reducing the peak load of a household andbenefiting the consumer by reducing the energy costs. The PBIM is also an effective solution for off-gridapplications particularly in remote rural areas, offering a user-friendly, modular energy system.
An analysis on the impact of ambient conditions on the performance indicators was implemented, concludingthat the ambient conditions significantly impact the operation of the PBIM. In Costa Rica the PBIM is seen asa more effective solution as its energy generation is consistently high throughout the year. The Jinko 265Wp PVmodule generates on average, 424kWh yr−1 in Costa Rica, whilst in the Netherlands for the same PV module, anenergy yield of 217kWh yr−1 is estimated. The ambient temperatures of the different locations were also concludedto have a significant impact on the PBIM battery. The higher ambient temperatures in Costa Rica were found toaccelerate the battery aging mechanisms resulting in a shorter lifetime than its operation in the cooler ambienttemperatures of the Netherlands.
The analyzed energy storage motivations dictated the manner in which the internal power flow was controlled.For peak shaving applications in Costa Rica the battery was required to undergo more frequent cycling than in theNetherlands, due to the year-round abundance of solar energy. The energy pricing scheme in Costa Rica dictatedthe presence of two peak periods. To meet the peak shaving requirements the battery was programmed to dischargetwice a day, whilst in the Netherlands a single peak period was defined on a daily basis, therefore requiring thebattery to discharge once. The combined effect of higher temperatures and more frequent cycling resulted in anannual battery capacity loss of 1.5% in Costa Rica. On the other hand the annual capacity loss in the Netherlandswas significantly lower 0.8%. Regarding the application of the PBIM for off-grid applications the battery capacityloss was found to be 1.6% in Costa Rica per year and in the Netherlands an annual capacity loss of 1% is expected.
The application and location of the PBIM significantly impacts the system characteristics of the PBIM. The effectsin terms of battery degradation, autarky, reliability have been defined and quantified based on the analysis of 4different case studies. The case studies were designed to include locations with significantly different climates.
2. What is the most appropriate battery size to install in a single PV-Battery Integrated Module for each energystorage scenario?
• What are the system requirements for each energy storage scenario? The objectives of the consideredsystem applications were determined to be conflicting. Regarding the gird-connected topology for peak
55

shaving, the system requirements were defined to be maximizing the shaving of the peak load and min-imize the capacity of the installed battery bank. Off-grid applications were also considered and were re-quired to posses a higher level of autonomy. The system objectives for the off-grid system were defined tobe: maximize the reliability and minimize the installed battery capacity.
• How can the appropriate battery size be identified? The defined set of performance indicators are batterydegradation, autarky and for the off-grid scenario, energy dump. This project demonstrated the existenceof a saturation point whereby increasing the battery capacity for a fixed PV array did not result in an in-crease of the beneficial system characteristics. This was found to be true for all the considered cases exceptthe grid connected PBIM system in the Netherlands which required economic factors to be taken into ac-count.
For peak shaving applications the appropriate battery capacity per PBIM with respect to the Jinko 265Wp PVmodule for grid connected applications in Costa Rica is found to be 729Wh. For the same application in theNetherlands the optimal capacity is found to be 600Wh (taking economic considerations into account). Regardingoff grid applications, the optimal battery capacity to PV capacity ratio has been found to be 3Wh/Wp and 2Wh/Wpfor Costa Rica and the Netherlands respectively.
3. How effective is an optimally sized PBIM for the identified scenarios?
• Grid Connected For grid connected peak shaving applications a single PBIM system with an optimal bat-tery capacity of 729Wh is able to reduce the peak load by 26% which equates to the system generating 101ein savings per year. Regarding the PBIM system in the Netherlands which, on an annual basis, reduced thepeak load by 28% generating annual savings of 76e.
• Off-grid. For the off-grid case study the the PV array size and the energy storage was optimized for eachcase study. In Costa Rica a 1.5kWp PV array with each PBIM installed with a 800Wh the system is found tohave a LLP of 0.1. Whereas the 2.9kWp PV array necessary in the Netherlands, with each PBIM installedwith a 530Wh battery is only able to achieve an LLP of 0.4.
4. How does an appropriately sized PV-Battery Integrated Module compare to a conventional solar system?
• How does the performance of the PV-Battery Integrated Module compare to a conventional system? Foethe assessed case in the Netherlands the PV module of the PBIM was estimated to generate 0.4% less in theNetherlands and 10.5% less in Costa Rica. The rate of battery degradation is 0.11% higher per year for gridconnected PBIM applications in the Netherlands as compared to a conventional system.
• Is the PV-Battery Integrated Module a financially viable solution? At the time of writing the PBIM is notconsidered a financially viable solar solution. The PBIM for grid-connected applications in the Nether-lands was found to have a payback time of 11.8 years, whereas for a conventional system the payback timeis found to be significantly less standing at 7.6 years.
In conclusion the PBIM is has been proven to be slightly less efficient as compared to a conventional system how-ever, it is found to be technically feasible. With the potential to deliver multiple advantages over conventional PVsystems, with further development the PBIM concept is poised to become a promising a concept within the solarindustry, whereby the advantages it provides justifies the reduced working efficiencies it possesses.
7.2. RECOMMENDATIONSWith this thesis providing an overview on the impact of energy storage motivations and locations on the appropri-
ate battery size and system performance a continuation and improvements can always be made.
7.2.1. SYSTEM MODELLINGIn hindsight, additional features to take into consideration regarding the PBIM modelling are identified.
• Temperature Effects In this project, the effect of the elevated PBIM temperatures on component lifetime wasonly considered for the battery. To provide a more comprehensive overview the effect of such temperatureson the lifetime of the other components; namely the PV module and the power electronics can be taken intoconsideration. In this manner the deterioration of the PV module’s power output and the impact of the powerelectronics’ operating efficiencies.
• Performance indexes In addition to the performance indexes implemented in this project, the number of per-formance indexes can be increased to include parameters such as maximum allowable battery Depth of Dis-charge of the battery. This will provide the added benefit of identifying the optimal battery operation scheme.
• Dynamic time-of-use pricing Regarding the analysis of the PBIM for peak shaving applications, the scope ofthis project considered fixed peak hours throughout the assessed time-span. However, based on the marketclearing price energy pricing may fluctuate on an hourly basis, affecting the time and length of peak periods.
56

Furthermore, with the rapid integration of distributed energy sources electricity prices can be expected to ex-perience significant fluctuations based on the supply of energy (especially from intermittent sources such aswind or solar) as well as the energy demand. For future considerations a more realistic peak shave scenario maybe considered such that a dynamic pricing scheme is included thus influencing the manner and frequency atwhich the battery is operated.
7.2.2. MODEL VALIDATIONThroughout this project the PBIM model has been applied in a dynamic manner and producing consistent results
for each of the case studies. However a more robust validation approach can be adopted, by using data from eitherexperimental or real-life systems to asses how well the model simulates a realistic scenario. Via such validation meth-ods the consequences of physically integrating the battery and the BoS components to the rear of the PV module canbe fully understood and quantified.
7.2.3. PBIM BATTERY SIZINGIn the light of the PBIM becoming a standardized solar system, the ideal system design is required to be sized to
suit all applications and locations. This standardized sizing would require a compromise in the system’s performancein every application therefore it would be interesting to determine an energy storage capacity whereby the negativeimpact on the fulfillment of the system’s objectives would be minimized. In this manner the battery sizing methodol-ogy outlined in this project would be expanded to include multiple locations in a single sizing analysis.
57


AAPPENDIX
A.1. DATA SHEETSA.1.1. PV MODULE DATA SHEET
A.1.2. BATTERY DATA SHEETS
59

60

61

www.a123systems.com +1.734.772.0300
20Ah Prismatic Pouch Cell Nanophosphate®Lithium-Ion
Product Specifications
Cell Dimensions (mm) 7.25 x 160 x 227
Cell Weight (g) 496
Cell Capacity (minimum, Ah) 19.5
Energy Content (nominal, Wh) 65
Discharge Power (10-second, W)) 1200
Voltage (nominal, V) 3.3
Specific Power (nominal, W/kg) 2400
Specific Energy (nominal, Wh/kg) 131
Energy Density (nominal, Wh/L) 247
Operating Temperature -30°C to 55°C
Storage Temperature -40°C to 60°C
© 2015 A123 Systems LLC. All rights reserved. Proprietary and confidential.
Applications
+ HEV Heavy Duty Commercial Vehicles
+ PHEV & HEV Passenger Vehicles
+ Starter Battery
Abuse Test Result
Nail Penetration Pass—EUCAR 4
Overcharge Pass—EUCAR 3
Over-discharge Pass—EUCAR 3
Thermal Stability Pass—EUCAR 4
External Short Pass—EUCAR 3
Crush Pass—EUCAR 3
A123’s patented Nanophosphate technology
provides this prismatic cell with outstanding
cycle life and a very high power output.
With a high usable energy range and
industry-leading abuse tolerance, this cell
delivers excellent performance even under
the most rigorous testing. Packaging these
light weight cells is easy because of the
compact design that’s ready for virtually any
high power application.
Power From Innovation
62

Power From Innovation
www.a123systems.com +1.734.772.0300
14Ah Prismatic Pouch Cell Nanophosphate®Lithium-Ion
Product Specifications
Cell Dimensions (mm) 7.25 x 160 x 227
Cell Weight (g) 510
Cell Capacity (minimum, Ah) 14
Max Discharge Current (10-second, A) 500
Discharge Power (10-second, W)) 1400
Voltage (nominal, V) 3.3
Specific Power (nominal, W/kg) 2700
DCR (10-second, MΩ) 1.3
Cycle Life at 100A Discharge, 100% DOD >1000
Operating Temperature -30°C to 55°C
Storage Temperature -40°C to 60°C
© A123 Systems LLC. All rights reserved. Proprietary and confidential.
Applications
+ HEV Heavy Duty Commercial Vehicles
+ HEV Passenger Vehicles
+ Starter Battery
Abuse Test Result
Nail Penetration Pass—EUCAR 4
Overcharge Pass—EUCAR 3
Over-discharge Pass—EUCAR 3
Thermal Stability Pass—EUCAR 4
External Short Pass—EUCAR 3
Crush Pass—EUCAR 3
A123’s patented Nanophosphate technology provides
this prismatic cell with outstanding cycle life and a
very high power output. With a high usable energy
range and industry-leading abuse tolerance, this cell
delivers excellent performance even under the most
rigorous testing. Packaging these light weight cells is
easy because of the compact design that’s ready for
virtually any application.
63


BIBLIOGRAPHY
[1] IRENA, Renewable energy technologies: Cost analysis series; solar photovolatics, IRENA Working Paper 1 (2015).
[2] V. Vega-Garita, Pv-battery integration design, construction, and evaluation, .
[3] J. Reynaud, C. Alonso, P. Aloisi, C. Cabal, B. Estibals, G. Rigobert, G. Sarre, H. Rouault, D. Mourzagh, F. Mattera,and S. Genies, Multifunctional module lithium-ionstorage and photovoltalc conversion of solar energy, Photo-voltaic Specialists Conference (2008).
[4] V. Vega-Garita, A. Harsarapama, L. Ramirez-Elizondo, and P. Bauer, Physical integration of pv-battery system:Advantages, challenges, and thermal model, 2016 IEEE International Energy Conference (ENERGYCON) (2016).
[5] A. Smets, K. Jäger, O. Isabella, R. van Swaaij, and M. Zeman, Solar energy; the physics and engineering of photo-voltaic conversion, technologies and systems, UIT Cambridge (2016).
[6] A123, Energy, and Solutions, Battery pack design, validation and assembly guide using a123 systems amp20hd-ananophophate cells, Design Guide (2014).
[7] V. Sulaeman, I andVega-Garita, G. Chandra Mouli, N. Narayan, L. Ramirez-Elizondo, and P. Bauer, Comparison ofpv-battery architectures for residential applications, 2016 IEEE International Energy Conference (ENERGYCON)(2016).
[8] G. Karmiris, , and T. Tengnér, Peak shaving control method for energy storage, ABB AB, Corporate Research Center(2015).
[9] ABB, Abb micro inverter system, Product Datasheet (2017).
[10] C. Curry, Lithium-ion battery costs and market, BLoombergy New Energy Finance (2017).
[11] J. Vetter, P. Novák, M. Wagner, and C. Veit, Ageing mechanisms in lithium-ion batteries, Journal of Power Sources147, 269 (2005).
[12] I. C. de Electricidad, Tipos de tarifa residencial, (2017).
[13] e on, Huishoudelijk en kleinzakelijk, e-on 75, 1 (2016).
[14] World, Energy, and Council, World energy scenarios, (2016).
[15] UNDP and WEC, Energy and the challenge of sustainability, World energy statistics (2016).
[16] ISPRE, Research and development on renewable energies: A global report on photovoltaic and wind energy„Progress in Photovoltaics: Research and Applications (2009).
[17] Z. Yang, L. Li, Y. Luo, R. He, L. Qiu, H. Lina, and H. Peng, An integrated device for both photoelectric conversionand energy storage based on free-standing and aligned carbon nanotube film, Journal of materials chemistry A 1,954 (2013).
[18] V. Vega-Garita, L. Ramirez-Elizondo, and P. Bauer, Physical integration of pv-battery system: thermal analysis,Applied Energy 208, 446 (2017).
[19] Z. Yang, L. Li, Y. Luo, R. He, L. Qiu, H. Lina, and H. Peng, The ac photovoltaic module concept, Energy ConversionEngineering Conference, 1 (1997).
[20] J. Reynaud, C. Alonso, P. Aloisi, C. Cabal, B. Estibals, G. Rigobert, G. Sarre, H. Rouault, D. Mourzagh, F. Mattera,and S. Genies, Cascaded dc-dc converter connection of photovoltaic modules„ IEEE Transactions on Power Elec-tronics 19, 1130 (2004).
[21] N. Shani, Architecture of integrated pv-battery module: modeling, simulation, and comparison, Master Thesis(2016).
[22] V. Vega-Garita, D. De Lucia, N. Narayan, L. Ramirez-Elizondo, and P. Bauer, Pv-battery integrated module as asolution for off-grid applications in the developing world, ENERGYCON 2017 (2017).
[23] G. Gyimesi and R. Viswanathan, The shift to electric vehicles, IBM Institute for Business Value (2013).
65

[24] L. Chuan and A. Uki, Modeling and validation of electrical load profiling in residential buildings in singapore,IEEE Transactions on Power Systems 30, 2800 (2015).
[25] L. Chuan and A. Uki, Understanding the present and the future electricity needs: Consequences for design of futuresolar home systems for off-grid rural electrification, Domestic Use of Energy Conference (2017).
[26] K. S. RT. Khatib, A. Mohamed, A review of photovoltaic systems size optimization techniques, Renewable and Sus-tainable Energy Reviews 22, 454 (2013).
[27] T. Khatib, I. Ibrahim, and A. Mohamed, A review on sizing methodologies of photovoltaic array and storage batteryin a standalone photovoltaic system, Energy Conversion and Management 120, 430 (2016).
[28] E. Egid, M Lorenzo, The sizing of stand alone pv-system: A review and a proposed new method, Solar EnergyMaterials and Solar Cells 26, 51 (1992).
[29] Y. Ru, J. Kleissl, and S. Martinez, Storage size determination for grid-connected photovoltaic systems, IEEE Trans-actions on Sustainable Energy 4, 68 (2013).
[30] C. Cabral, D. Filho, A. Diniz, J. Martins, O. Toledo, and L. Neto, A stochastic method for stand-alone photovoltaicsystem sizing, Solar Energy 84, 1628 (2010).
[31] M. Kolhe, Techno-economic optimum sizing of a stand-alone solar photovoltaic system, IEEE Transactions onEnergy Conversion 24, 511 (2009).
[32] T. Khatib, A. Mohamed, K. Sopian, and M. Mahmoud, A new approach for optimal sizing of standalone photo-voltaic systems, International Journal of Photoenergy 2012, 7 (2012).
[33] A. Celik, T. Muneer, and P. Clarke, Optimal sizing and life cycle assessment of residential photovoltaic energysystems with battery storage, Progress in Photovolatics 20, 6 (2012).
[34] H. Kazem and K. Khatib, T Sopian, Sizing of a standalone photovoltaic/battery system at minimum cost for remotehousing electrification in sohar, oman, Energy and Buildings 61, 108 (2013).
[35] S. Mandelli, C. Brivio, E. Colombo, and M. Merlo, A sizing methodology based on levelized cost of supplied andlost energy for off-grid rural electrification systems, Renewable Energy 89, 475 (2016).
[36] T. Khatib and W. Elmenreich, An improved method for sizing standalone photovoltaic systems using generalizedregression neural network, International Journal of Photoenergy 2014 (2014).
[37] Y. Ru, J. Kleissl, and S. Martinez, Storage size determination for grid-connected photovoltaic systems, IEEE Trans-actions on Sustainable Energy 4, 68 (2013).
[38] A. Oudalov, R. Cherkaoui, and A. Beguin, Sizing and optimal operation of battery energy storage system for peakshaving application, Power Tech IEEE Lausanne (2007).
[39] M. Shadmand and R. Balog, Multi-objective optimization and design of photovoltaic-wind hybrid system for com-munity smart dc microgrid, IEEE Transactions on Smart Grid 5, 2635 (2014).
[40] M. Fuentes, A simplified thermal model for flat-plate photovoltaic arrays, Tech. Rep. (Sandia National Laborato-ries (1987).
[41] M. Kabir and D. Demirocak, Degradation mechanisms in li-ion batteries: a state-of-the-art review, Int. J. EnergyRes. 41 (2017).
[42] A. Mukhopadhyay and B. S. m. Sheldon, Deformation and stress in electrode materials for li-ion batteries, Progressin Materials Science 63, 58 (2014).
[43] O. Tremblay and D. L.-A, Experimental validation of a battery dynamic model for ev applications, World ElectricVehicle Journal 3 (2009).
[44] X. Han, M. Ouyang, L. Lu, J. Li, and Z. Zheng, Y Li, A comparative study of commercial lithium ion battery cyclelife in electrical vehicle: Aging mechanism identification, Journal of Power Sources 251, 38 (2014).
[45] D. D. Leiva, C. Araya, G. Valverde, and J. Quiros-Tort, Statistical representation of demand for gis-based load profileallocation in distribution networks, 2017 IEEE Manchester PowerTech (2017).
[46] B. Asare-BediakoaW, W. Kling, and P. Ribeiroa, Future residential load profiles: Scenario-based analysis of highpenetration of heavy loads and distributed generation, Energy and Buildings 75, 228 (2014).
[47] M. Chediak, The latest bull case for electric cars: the cheapest batteries ever, BLoomberg Technology (2017).
[48] R. Kemma, Average eu building heat load for hvac equipment, Van Holsteijn en Kemna B.V. (2014).
66

BACKNOWLEDGMENTS
Firstly, I would like to express my sincere gratitude to everyone that offered their support, inputs, criticism andmost of all their encouragement throughout the course of this project. Specifically, I would like to thank Victor Vega-Garita, who supervised me for the entire duration of the project, I am especially grateful to him for always having anopen door and an armoury of valuable inputs: providing a fantastic environment in which to develop this project. Iwould also like to thank Dr. L. Ramirez Elizondo, Prof. dr P. Bauer and Dr. O. Isabella for their feedback and sugges-tions.
Having called the Netherlands home for half a decade, I would like to express my gratitude to all the incrediblepersonalities that have made it a truly remarkable experience that I will always cherish. Finally, I would like to thankmy parents who never cease to believe in my abilities and without whom I would never be where I am today.
67