
The Public EDF Model Developed by: The Market Information Lab Fall 2009 CreditEdge Tutorial.
35
The Public EDF Model Developed by: The Market Information Lab Fall 2009 CreditEdge Tutorial
-
Upload
marsha-dorsey -
Category
Documents
-
view
216 -
download
1
Transcript of The Public EDF Model Developed by: The Market Information Lab Fall 2009 CreditEdge Tutorial.

The Public EDF Model
Developed by: The Market Information Lab
Fall 2009
CreditEdge Tutorial

Credit Risk in Financial Markets
• Limitless Opportunities• Dynamic Credit Environment• Numerous Market Sectors• Complexity of Financial Statements
Bottom Line:• How likely is it that we get paid
back?

Tutorial OverviewTutorial Overview
CreditEdge OverviewCreditEdge Overview• What/Who/How for CreditEdge
• Calculating Expected Default Frequency (EDF)
• Calculating the Three Drivers
The CreditEdge InterfaceThe CreditEdge Interface• Building and Portfolio
• Analyzing a Company Graphically• Estimation Using Scenario Analysis

Structure of the ProductsStructure of the ProductsMoody’s Credit Rating Agency
Moody’s KMV
CreditEdge RiskCalc
MIL Product MIL Product
Public Co. Credit Risk Private Co. Credit Risk
Subsidiary

What is CreditEdge?What is CreditEdge?
• Product developed by Moody’s CompanyProduct developed by Moody’s Company
• Calculation of Public Company DefaultCalculation of Public Company Default
• Likelihood of Lender Getting Paid BackLikelihood of Lender Getting Paid Back
• Unbiased Comparison of Public CompaniesUnbiased Comparison of Public Companies

Who Uses CreditEdge?Who Uses CreditEdge?• LendersLenders
• Access counterparty riskAccess counterparty risk
• Determines likelihood of getting paid backDetermines likelihood of getting paid back
• i.e. Barclaysi.e. Barclays
• Large CorporationsLarge Corporations
• Analysis of Internal Credit RiskAnalysis of Internal Credit Risk
• Gauge of competitor credit statusGauge of competitor credit status
• i.e. Hewlett-Packardi.e. Hewlett-Packard
• Fixed Income Investors/AnalystsFixed Income Investors/Analysts

How CreditEdge WorksHow CreditEdge Works
• Public Company Probability of Default
• Internal Company Data / External Market Conditions
• Portfolio Management with many companies

Check Your UnderstandingCheck Your Understanding
Question: Which of these financial analysts would NOT benefit from CreditEdge?
A. Fixed Income Analysts
B. Credit Risk Lenders
C. Internal Corporate Financial Analyst
D. Equity Analysts
E. All of the Above Can Benefit CreditEdge

Expected Default FrequencyExpected Default Frequency
• Definition – The Probability that a company’s value will fall below a threshold where its unable to pay back its creditors
• Three EDF Drivers for calculation:• Default Point• Market Value of Assets• Asset Volatility
• Case Application: General Electric (GE)

Calculation of EDFCalculation of EDF
EDF = Market Value
of Assets
Default PointX Asset Volatility
Formula:Formula:

Default PointDefault Point
• Defined – A threshold where the company’s value is not sufficient to payback what it owes
• Between Total Liabilities and ST Liabilities• Empirical Studies Reveal Accurate Formula
Default Point = ST Liabilities + ½ (LT Liabilities)Default Point = ST Liabilities + ½ (LT Liabilities)

GE Default PointGE Default Point
Total Liabilities - ST Liabilities__________________
LT Liabilities
Default PointDefault Point
ST Liabilities+ (1/2) LT Liabilities
DEFAULT POINTDEFAULT POINT
246,133,000
+ (1/2) 433,675,000
679,788,000
- 246,113,000
433,675,000
462,970,500
Source: Capital IQ
Note: Numbers are in Thousands

Market Value of AssetsMarket Value of Assets
• Market Capitalization of Assets• Book Value of Liabilities: Senior Claims• Market Capitalization of Equity: Junior Claims
Formula:• MV Assets = Market Cap. + BV Liabilities

GE Market Value of AssetsGE Market Value of Assets
Market Cap. + BV Liabilities__________________
Market Value of Assets
118,940,000
+ 679,778,000
798,728,000
Source: Capital IQ

Check Your UnderstandingCheck Your Understanding
Question: Warren Buffet decides to purchase $50 billion in Senior Unsecured Corporate Bonds from GE. What will happen to GE’s EDF
A. It will remain the sameB. It will increase because of the increase to GE’s Default PointC. It will decrease because of the increase to GE’s Market Value of AssetsD. It will increase because the increase to MV of Assets will not have as
great of an effect as the Default Point increase.
EDF = Market Value
of Assets
Default PointX Asset Volatility

Calculating New Default PointCalculating New Default Point

Calculating New MV of AssetsCalculating New MV of Assets

Putting it All TogetherPutting it All Together
The Ratio Decreased, what does that mean?
Numbers in Billions
Debt Raised 50
Category of Capital LIABILITY/DEBT Assumption: Asset Volatility Remains Constant
New Ratio: Default Point ÷ MV of Assets Old Ratio: Default Point ÷ MV of Assets
Default Point 488 Default Point 463
Market Value of Assets 848 Market Value of Assets 799
New Ratio 0.575472 Old Ratio 0.579474

Check Your UnderstandingCheck Your Understanding
Question: Warren Buffet decides to purchase $50 billion in Senior Secured Corporate Bonds from GE. What will happen to GE’s EDF?
A. It will remain the sameB. It will increase because of the increase to GE’s Default PointC. It will decrease because of the increase to GE’s Market Value of AssetsD. It will decrease because the increase to MV of Assets will have a greater
effect as the Default Point increase.
EDF = Market Value
of Assets
Default PointX Asset Volatility

• Uncertainty (Volatility) of a Firm• High Volatility = Greater Probability Of Default• Equity Return v. Asset Return
Formula:Asset Volatility = Standard Deviation of MV of Assets
Asset VolatilityAsset Volatility
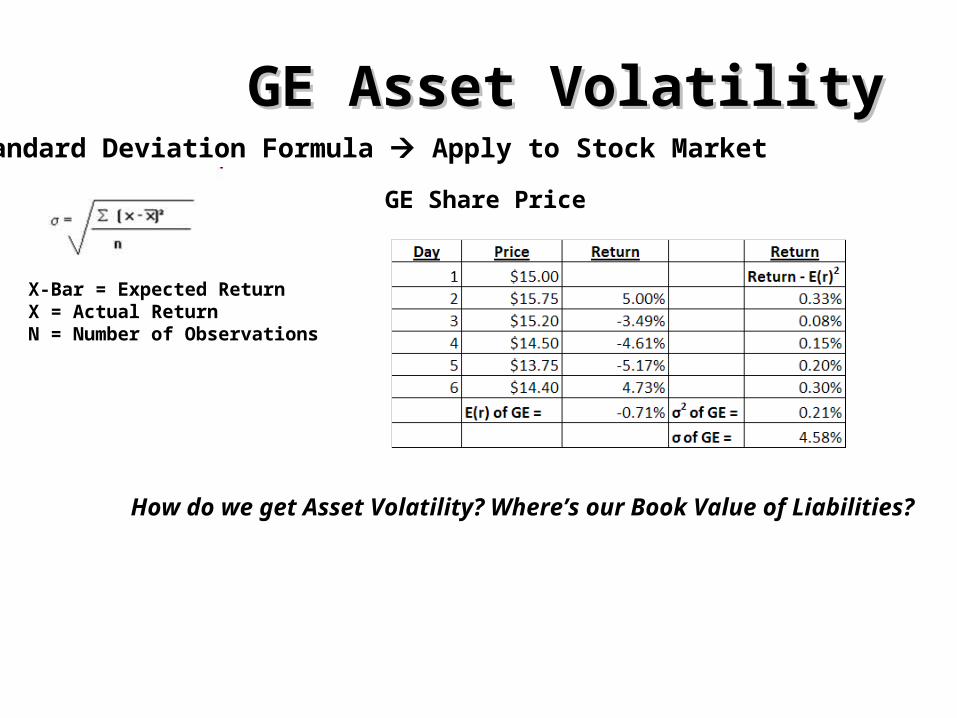
GE Asset VolatilityGE Asset VolatilityStandard Deviation Formula Apply to Stock Market
X-Bar = Expected ReturnX = Actual ReturnN = Number of Observations
GE Share Price
How do we get Asset Volatility? Where’s our Book Value of Liabilities?

GE Asset VolatilityGE Asset Volatility
GE Asset Volatility = 0.88%GE Asset Volatility = 0.88%

Check Your UnderstandingCheck Your Understanding
Question: An decrease in GE’s asset volatility will:
A. Will have no effect on EDF
B. Cause EDF to Increase
C. Cause EDF to Decrease
D. Asset Volatility has nothing to do with EDF
EDF = Market Value
of Assets
Default PointX Asset Volatility

GE EDF CalculationGE EDF Calculation
EDF = Market Value
of Assets
Default PointX Asset Volatility
Formula:Formula:
EDF =433,351,500
798,728,000X 0.88%
EDF = 0.477446 %... What does it mean?EDF = 0.477446 %... What does it mean?

Distance to DefaultDistance to Default
Distance to Default = $ 365,373,500How likely will it be for MV Assets to fall below Default Point?
Distance to Default
Distance to Default = Market Value of Assets – Default Point

Graphical Interpretation of EDFGraphical Interpretation of EDF
Asset Volatility = 0.88%
EDF = 0.477% = Chance GE will Default in 1 YearEDF = 0.477% = Chance GE will Default in 1 Year
EDF = Probability that Asset Value will fall below the Default Point

Check Your UnderstandingCheck Your Understanding
Question: What is the conceptual definition of a 1 Year EDF?
A. It’s the probability that a firm will pay back its creditors in a year’s time.
B. It’s the probability that a firm will not be able to pay back its creditors in a year’s time.
C. It’s the number of standard deviations a firm is away from its default point.
D. It’s the expected return on a firm’s stock.
E. None of the Above

The CreditEdge InterfaceThe CreditEdge Interface
• Portfolio creation and managementPortfolio creation and management
• Company AnalysisCompany Analysis
• Charting ToolCharting Tool
• Solver and calculator scenario analysisSolver and calculator scenario analysis

Creation and Analysis Creation and Analysis of a Portfolioof a Portfolio
• Create a Portfolio
• Adding companies to portfolio
• Analysis by EDF and credit rating
• Average EDF across portfolio
• Adjusting the time period

Individual Company Individual Company Credit AnalysisCredit Analysis
• Sample Company – General Motors
• EDF highlights and ratings
• Current v. previous EDF
• Base Company Profile
• Company news and key developments
• Company SEC filings
Chart BuildingChart Building
• Sample Chart – EDF only
• How EDF calculation points factor in
• GM Comparison to Toyota

Check Your UnderstandingCheck Your Understanding
Question: What are the tasks you can't do with the Chart tool?
A. Export as an Excel
B. Chart Portfolio items
C. Custom time series
D. We can do all the above
E. None of the Above

Scenario Analysis with SolverScenario Analysis with Solver
• Solver overview and definition
• Sample Analysis – Volkswagen
• Sample Analysis – GM
• Calculator feature

Check Your UnderstandingCheck Your Understanding
Question: Holding everything else constant, if the MV of assets increases, what happens to GE’s EDF?
A. Increases
B. Decreases
C. Stays the Same
EDF = Market Value
of Assets
Default PointX Asset Volatility

Wrap-Up and ConclusionWrap-Up and Conclusion
• Other Moody’s KMV tutorials
• RiskCalc Tutorial
• MKMV Integration with Capital IQ
• MKMV Integration with Crystal Ball
• Words of wisdom on tool learning
• Questions and support