The Psychological Representation of Musical Pitch in a Tonal Context
29
COGNITIVE PSYCHOLOGY 11, 346-374 (1979) The Psychological Representation of Musical Pitch in a Tonal Context CAROL L. KRUMHANSL Stanford University In this series of experiments, evidence was found for a complex psychological representation of musical pitch. The results of a scaling study, in which subjects judged the similarities between pairs of tones presented in an explicitly tonal context, suggest that musical listeners extract a pattern of relationships among tones that is determined not only by pitch height and chroma, but also by member- ship in the major triad chord and the diatonic scale associated with the tonal system of the context. Multidimensional scaling of the similarity ratings gave a three-dimensional conical structure around which the tones were ordered ac- cording to pitch height. The major triad components formed a closely related cluster near the vertex of the cone; the remaining diatonic scale tones formed a less closely related subset farther from the vertex; and, the nondiatonic tones, still farther from the vertex, were widely dispersed. The results also suggest that, in the psychological representation, tones less closely related to the tonality are less stable than tones closely related to the tonality, and that the representation incor- porates the tendency for unstable tones to move toward the more stable tones in time, reflecting the dynamic character of musical tones. In the similarity ratings of the scaling study, tones less related to the tonality were judged more similar to tones more related to the tonality than the reverse temporal order. Furthermore, in a delayed recognition task memory performance for nondiatonic tones was less accurate than for diatonic tones, and nondiatonic tones were more often confused with diatonic tones than diatonic tones were confused with nondiatonic tones. These results indicate the tonality-specific nature of the psychological representa- tion and argue that the perception of music depends not only on psychoacoustic properties of the tones, but also on processes that relate the tones to one another through contact with a well-defined and complex psychological representation of musical pitch. Music provides an interesting domain for psychological investigation. It is a domain in which the individual elements, the tones, can be well defined in terms of their physical properties. However, in combination these simple elements form complex structures such as chords, melodies, and larger musical units. The rules for the construction of these musical structures from the basic elements are complicated and difficult to specify This article is based on a PhD dissertation at Stanford University, 1978, and was sup- ported by the author’s National Institutes of Health Traineeship MH-10478-09 and National Science Foundation Grant BNS-75-02806 to Roger N. Shepard. The helpful comments of Roger N. Shepard, Ewart A. C. Thomas, Amos Tversky, and Herbert H. Clark are grate- fully acknowledged. Don Mares and Zehra Peynircioglu assisted in running subjects. Por- tions of this paper were presented at the 1978meeting of the Psychonomic Society Meeting, San Antonio, TX, 1978. Requests for reprints may be addressed to Carol L. Krumhansl, Department of Psychology and Social Relations, Harvard University, 33 Kirkland Street, Cambridge, Massachusetts 02138. 346 OOlO-0285/79/030346-29$05.00/0 Copyright 0 1979 by Academic Press, Inc.
Transcript of The Psychological Representation of Musical Pitch in a Tonal Context

COGNITIVE PSYCHOLOGY 11, 346-374 (1979)
The Psychological Representation of Musical Pitch in a Tonal Context
CAROL L. KRUMHANSL Stanford University
In this series of experiments, evidence was found for a complex psychological representation of musical pitch. The results of a scaling study, in which subjects judged the similarities between pairs of tones presented in an explicitly tonal context, suggest that musical listeners extract a pattern of relationships among tones that is determined not only by pitch height and chroma, but also by member- ship in the major triad chord and the diatonic scale associated with the tonal system of the context. Multidimensional scaling of the similarity ratings gave a three-dimensional conical structure around which the tones were ordered ac- cording to pitch height. The major triad components formed a closely related cluster near the vertex of the cone; the remaining diatonic scale tones formed a less closely related subset farther from the vertex; and, the nondiatonic tones, still farther from the vertex, were widely dispersed. The results also suggest that, in the psychological representation, tones less closely related to the tonality are less stable than tones closely related to the tonality, and that the representation incor- porates the tendency for unstable tones to move toward the more stable tones in time, reflecting the dynamic character of musical tones. In the similarity ratings of the scaling study, tones less related to the tonality were judged more similar to tones more related to the tonality than the reverse temporal order. Furthermore, in a delayed recognition task memory performance for nondiatonic tones was less accurate than for diatonic tones, and nondiatonic tones were more often confused with diatonic tones than diatonic tones were confused with nondiatonic tones. These results indicate the tonality-specific nature of the psychological representa- tion and argue that the perception of music depends not only on psychoacoustic properties of the tones, but also on processes that relate the tones to one another through contact with a well-defined and complex psychological representation of musical pitch.
Music provides an interesting domain for psychological investigation. It is a domain in which the individual elements, the tones, can be well defined in terms of their physical properties. However, in combination these simple elements form complex structures such as chords, melodies, and larger musical units. The rules for the construction of these musical structures from the basic elements are complicated and difficult to specify
This article is based on a PhD dissertation at Stanford University, 1978, and was sup- ported by the author’s National Institutes of Health Traineeship MH-10478-09 and National Science Foundation Grant BNS-75-02806 to Roger N. Shepard. The helpful comments of Roger N. Shepard, Ewart A. C. Thomas, Amos Tversky, and Herbert H. Clark are grate- fully acknowledged. Don Mares and Zehra Peynircioglu assisted in running subjects. Por- tions of this paper were presented at the 1978 meeting of the Psychonomic Society Meeting, San Antonio, TX, 1978. Requests for reprints may be addressed to Carol L. Krumhansl, Department of Psychology and Social Relations, Harvard University, 33 Kirkland Street, Cambridge, Massachusetts 02138.
346 OOlO-0285/79/030346-29$05.00/0 Copyright 0 1979 by Academic Press, Inc.

REPRESENTATION OF MUSICAL PITCH 341
(Piston, 1962; Ratner, 1962), suggesting that music perception is also a complex process, requiring the extraction by the listener of certain im- portant relationships among the individual elements. This series of ex- periments investigates the psychological representation of tones in well- structured musical contexts.
Psychophysical approaches to pitch perception have typically used as stimuli tones or pairs of tones presented in isolation, or in other nonmusi- cal contexts. Stevens (Stevens & Volkmann, 1940; Stevens, Volkmann, & Newman, 1937) and others have described the pitch domain as a uni- dimensional psychological continuum which is monotonically related to the physical dimension of frequency. This dimension has been calledpitch height. However, other investigators (Allen, 1967; Bachem, 1954; Deutsch, 1973b; Humphreys, 1939) have found evidence that tones dif- fering by an octave interval are closely related psychologically. This oc- tave effect has led a number of theorists (Bachem, 1950; Revesz, 1954; Shepard, 1964) to propose a circular representation for pitch that iden- tifies tones separated by an octave. This circular structure, which defines the pitch of a tone up to octave equivalence, has been called the chroma circle. These studies, then, suggest that the psychological representation of pitch is based on at least two factors: pitch height and chroma.
When tones are presented in explicit musical contexts, additional fac- tors may emerge. For example, tones that are separated by certain inter- vals other than an octave may also be perceived as closely related. Bal- zano (Note 1) found shorter reaction times for identification of such inter- vals as the major third and the perfect fifth, which play a central and important role in musical composition, than for other intervals. In his experiments, certain individual tones were over-represented so as to suggest to the subject a particular musical organization. Additional factors having to do with the tonality established by the musical context may also have an effect. This notion of tonality is of central importance to musical organization, and will now be described in order to provide some background for the experiments to be presented later.
In Western music, as in most musical cultures (Dowling, 1978), the set of musical tones consists of a finite set of pitches. This finite set can be thought of, for example, as the complete set of notes on the piano keyboard. These tones are approximately equally spaced in terms of log frequency and the interval between adjacent pitches is called a half-step or semitone. Two tones separated by 12 half-steps form an octave inter- val, with a frequency ratio of approximately 2 : 1. A musical scale consists of a subset of these pitches and is, loosely speaking, the set of pitches used in a particular context. The most common scale used in traditional Western music is the diatonic scale, which contains 7 of the 12 tones within an octave interval. The white notes on the piano keyboard com- prise one such scale. The term diatonic refers to the fact that the scale is

348 CAROL L. KRUMHANSL
built of 5 whole steps among which are placed 2 half-steps separated by intervals of a fourth (2 whole steps and 1 half-step) and a fifth (3 whole steps and 1 half-step). This pattern repeats in every octave. The remaining tones not contained in the scale are called nondiatonic. Thus, the full set of musical tones is divided into diatonic and nondiatonic tones, with the diatonic scale tones conforming to a fixed pattern of intertone intervals.
Tonality is defined by Piston (1962, p. 30) as “the organized relation- ship of tones in music.” Tonality is synonomous with key, and implies a central tone with all other tones tending toward it in one way or another. This tonal center is called a tonic and is described by Ratner (1%2, p. 23) as a sort of reference point operating throughout a musical passage. Every other musical tone has a well-defined relationship to the tonic, called it
“1 tonal function (Piston, 1962, p. 32). Tones vary in terms of how structur ally stable they are within the tonal context. Nondiatonic tones are the least related to the tonic and are very unstable, with a strong tendency ta move to scale tones, particularly to the tonic itself. The diatonic scale tones are more stable and closely related to the tonic than the nondiatonia tones. Within the set of scale tones, the fifth scale tone, called the fifth degree of the scale, is particularly stable and often substitutes for the tonia itself. Together, the tonic, the third scale degree, and the fifth scale degrea form what is called a major triad chord which gives a clear embodiment ofl the sense of key. As such, these tones form a particularly strong tonal unit. The scale beginning and ending on the tonic is also an unambiguousl expression of tonality. To summarize, basic to music theory are the no1 tions of diatonic scale and tonality. The diatonic scale designates a subsel of the set of possible musical tones as the elements from which the musi- cal material is to be constructed. These tones conform to a specified pattern of intervals. Tonality designates one of these tones as central and the other musical tones differ in terms of the degree of relationship to thig particular tone.
There is some evidence that listeners perceive these music-theoretio structures. Cohen (Note 2) has shown that musically trained listeners, after hearing only a short excerpt from a musical passage, are able ta generate the associated diatonic scale with some accuracy. She suggeste that the subjects construct on the basis of the short excerpt an “inferre 9 set” of pitches, the set of tones that might occur in the melody. A numbed of investigators (Dewar, Cuddy, & Mewhort, 1977; Dewar, Note 3) have/ found better memory for tones contained in sequences conforming to d diatonic structure with a well-defined tonality than for tones contained id atonal sequences. In these studies, a standard sequence was followed by two comparison sequences, one of which contained an altered tone and one of which was identical to the standard. The subject indicated which 01 the two comparison sequences was identical to the standard. The task was easier when the standard was a tonal sequence than when it was atonal.

REPRESENTATION OF MUSICAL PITCH 349
Cohen (Note 4) and Attneave and Olson (1971) have found that subjects are better able to recognize and produce transpositions of familiar or tonal sequences than less structured sequences, and Cohen (Note 2) found fewer sight-singing errors for tonal sequences.
In addition to better recognition performance for tonal than for atonal sequences, Dewar (Note 3) found a systematic pattern of errors on trials on which the standard sequence was tonal. When the altered tone in the comparison sequence was contained within the diatonic scale more errors were found than when the altered tone was nondiatonic. Thus, changes outside the diatonic structure were more obvious than changes within the established diatonic framework. This is similar to the finding of Dowling (1978) concerning the recognition of transposed tonal melodies. In Dowl- ing’s study, subjects found it difficult to distinguish between exact trans- positions of comparison melodies (a constant shift in log frequencies<, keeping the relative intervals constant but moving outside the diatonic scale) and shifts of the contour along the same diatonic scale as the stan- dard (resulting in changed intervals between the pitches, but keeping the pitches in the same diatonic scale). These studies suggest that the diatonic scale structure is extracted by the listener and can be used as a generally efficient framework for remembering individual tones. Using this framework, however, can result in various systematic errors such as those found by Dewar (Note 3) and Dowling (1978). The systematic bias- ing of memory by a tonal musical context will be explored further in Experiments 2 and 3.
Tonality establishes a single tone within the set of musical tones, the tonic, as a kind of stable reference point. This suggests a similarity be- tween the musical domain and the kind of categories investigated by Rosch (1975). In categories such as colors, lines varying in orientation, and numbers, Rosch hypothesized that certain stimuli (focal colors, verti- cal and horizontal lines, and numbers that are multiples of 10) take the role of reference points. These reference points are those objects in rela- tion to which the other stimuli in the category are judged. Using a task in which subjects placed a stimulus in physical space to indicate its psychological distance from a second stimulus in a fixed position, Rosch found that the distances were smaller when the fixed position contained a reference stimulus than when it contained a nonreference stimulus. Thus, Rosch found that nonreference stimuli were judged to be more similar to reference stimuli than reference stimuli were to nonreference stimuli. A similar pattern of asymmetries has been found by Tversky (1977) and others (reviewed in Krumhansl, 1978). ,By analogy, Rosch’s work suggests the following hypothesis for the musical domain: Tones less closely related to the tonality should be judged more similar to tones closely related to the tonality than the reverse order. This hypothesis will

3.50 CAROL L. KRUMHANSL
be tested in Experiment 1 of this paper, which consists of a scaling study of the 13 musical tones within an octave interval.
EXPERIMENT 1
In this experiment, subjects were asked to make similarity judgments on sequentially presented pairs of tones in the context of a well-defined tonal system. The tonality was established by playing at the start of each trial either an ascending or descending C major scale or the major triad chord built on C. Following this tonal context, the two comparison tones were heard and the subject was asked to judge how closely related the first tone is to the second tone in the tonal system suggested by the context.
Earlier work indicates that a number of factors may influence these similarity judgments. The work of Stevens (Stevens & Volkmann, 1940; Stevens et al., 1937) indicates that tones close in terms of pitch height should be judged more closely related than tones farther apart in pitch height. Dewar (Note 3) found that the detection of an incorrect compari- son sequence increased with the increasing distance that the incorrect tone was removed from the original frequency. Deutsch (1972a), using a paradigm that will be described in detail later in this paper, also found specific effects on memory for a standard tone that varied as a function of the separation in pitch between the standard and other tones intervening between the standard and the test tones. If, as is generally assumed, similarity ratings are correlated with confusion errors, then these earlier results suggest that in the present experiment the similarity ratings should depend to some extent on the difference in pitch of the two tones. In another study, Deutsch (1973b) found that, although reduced in mag- nitude, these memory effects generalized across octaves. Other studies have also found evidence for octave generalization in both human sub- jects (Humphreys, 1939) and the rat (Blackwell & Schlosberg, 1943). In addition, Bachem (1954) observed that subjects with perfect pitch often confuse tones separated by octaves and Allen (1967) found an increase in similarity ratings for tones at octave intervals, suggesting that octave equivalence should also emerge as a factor in the present study. Finally, the studies of Dewar (Note 3) and Dowling (1978), in which subjects confused diatonic tones with other diatonic tones more often than with nondiatonic tones, indicate greater similarity between diatonic tones than between diatonic and nondiatonic tones in the representation of musical pitch. These studies suggest that at least three factors, pitch height, chroma, and diatonicism, may affect similarity ratings in the present ex- periment .
Of particular interest is the pattern of similarities between the tonic and the other diatonic and nondiatonic tones. Music theory would indicate

REPRESENTATION OF MUSICAL PITCH 351
that these similarity ratings should show large variation reflecting the degree of relationship between the tonic and the other muscial tones. A study done in collaboration with Roger Shepard (Krumhansl & Shepard, in press) investigated this pattern of relationships. In that study, subjects judged how well a single tone completed a major scale sequence. The tonic itself was judged to be the most satisfactory completion. Also, tones close to the tonic in pitch were generally preferred to tones farther from the tonic. Additional structure was found in the ratings of the more musi- cally trained subjects such that diatonic tones were preferred to non- diatonic tones, with particularly high ratings for the octave and the third and fifth degrees of the scale. The generality of these findings can be tested by comparing the rating profiles from the earlier experiment to the similarity profile involving the tonic in the present experiment.
Earlier scaling studies of the pitch domain have used musical intervals as stimuli. Levelt, VandeGeer, and Plomp (1966) obtained a two- dimensional spatial representation of musical intervals. This representa- tion took a U-shaped form with the musical intervals ordered along this contour according to their width. For complex tones, the intervals were also ordered along a dimension that is related to the simplicity of the frequency ratio of the fundamental frequencies. Balzano (Note 1) also did a scaling study of musical intervals, in which the intervals were found to conform to a circular pattern. In one condition of his study, using har- monic intervals, he also found evidence for a dimension of ratio simplic- ity. These two studies differed in that, unlike the Levelt et al. (1966) study (1966), Balzano used musically trained listeners and constructed the stimulus materials so as to suggest a particular tonality by using as base tones for the intervals the major triad tones of a particular key. In his study, however, there was no direct test to determine whether this tonal- ity manipulation was effective, although a number of specific results can be interpreted in terms of the notion of a tonal framework. Both studies contain an implicit assumption that may not be entirely warranted in a tonal context, namely, that all intervals of a given size are equivalent. For example, in a C major tonal context, the tonic, C, and the fifth scale degree, G, which form an interval of a fifth, may be more closely related than pairs of nondiatonic tones, such as C# and G#, which form intervals of the same size. In order to test the possibility that intervals of a given size are not necessarily equivalent, subjects in the present experiment judged the similarity between individual tones rather than between pairs of intervals.
A number of studies suggest that the subject’s ability to abstract struc- tural relationships from a tonal array varies as a function of the musical training of the subject. In an absolute judgment study, Cuddy (1970) found that musically trained subjects were better able to exploit musical rela-
352 CAROL L. KRUMHANSL
tions among the tones in the pitch set than were musically naive subjects. Similar effects of training have also been found in studies of melody recognition (Cohen, 1975; Dewar et al., 1977). In addition, the octave effect in similarity ratings found by Allen (1967) appeared almost entirely in the ratings of music students; the effect was virtually absent in the ratings of nonmusicians. Finally, the responses of musical subjects in the scale completion study (Krumhansl & Shepard, in press) showed consid- erably more structure than the responses of nonmusical subjects. Since the present series of studies investigates the psychological representation of the complex set of relationships obtaining among musical tones in tonal contexts, the subjects who participated in the study were required to have at least a moderate level of musical training.
Method SU&?C~S. Ten Stanford undergraduates served as subjects and were paid at the rate of
$250/hr. Each subject participated in all four experiments, requiring a total of approximately ten I-hr sessions per subject. The subjects were required to have a minimum of 5 years of formal musical instruction, and were recruited by posting notices in the music department, practice rooms, and residential halls. Each subject completed a short questionnaire de- scribing their musical training and experience. Table 1 summarizes the responses to this questionnaire. Subjects had taken music lessons on an average of 2.1 different instruments, averaging 12.5 years of total instruction on the different instruments. In terms of performing experience, subjects had participated on the average for 6.7 years in instrumental groups and 3.1 years in choral groups. Currently, the subjects were involved in musical activities an average number of 5.6 hrlweek. This included practice, lessons, and participation in music groups. Of the 10 subjects, only 3 had taken a music theory course and 1 was a music major. All subjects reported having normal hearing, and no subject reported having absolute pitch.
Apparatus. The stimulus tapes were made by recording at 7.5 ips directly from a Fartisa (Chicago Musical Instrument Company) electronic organ onto tape using a Revox A77 stereo taperecorder. The flute stop on the organ was used because it seemed to approximate most closely a pure sine wave. During the experimental sessions, playback by the Revox taperecorder was at a comfortable loudness level via a Dynaco SCA - 8OQ amplifier and two Bang and Olafsen Beovox S45 speakers. Subjects were tested individually in an IAC (Industrial Acoustics Company) sound-attenuated chamber.
Stimulus materiu~s. Each trial consisted of a set of context tones followed by 2 tones played in succession. All tones used in the experiment were drawn from the octave range bounded by middle C (C,) and the C an octave above (C,). Three context types were used: a
TABLE 1 SUBJECT’S MUSICAL TRAINING AND EXPERIENCE
Number of instruments studied Total years instrumental instruction Years performing in instrumental groups Years performing in choral groups Hours per week in musical activities
Average Range
2.1 l-3 12.5 6-22 6.7 O-16 3.1 o-9 5.6 O-10

REPRESENTATION OF MUSICAL PITCH 353
major triad chord, an ascending major scale, and a descending major scale. The major triad chord consisted of the tones C1, E,, G,, and C5 played simultaneously for approximately 2 sec. The ascending scale context consisted of the 8 tones of the diatonic major scale begin- ning on Cg and ending on C, played successively for approximately 0.25 set each, so that the total duration of the scale context was 2 sec. The descending scale context was identical, only the tones were played in the reverse order. Following the context was a silent interval lasting 2 set, and the two comparison tones played successively for approximately 1 set each. All ordered pairs of the 13 tones in the octave range appeared in a block of trials. Thus, each block contained 156 trials which were randomly ordered within the blocks. Each block was subdivided into four subblocks consisting of 39 trials each, and these were randomly ordered for each subject. There were two complete blocks of trials for each of the three context types, and subjects were presented with these blocks in different orders.
Procedure. Subjects were instructed to judge on each trial how similar the first tone is to the second tone in the tonal system suggested by the context. They were to consider the tones similar if they are closely related to each other, and dissimilar if they are not closely related. The directionality of the similarity judgment was stressed, that is, they were re- minded to judge how similar the first tone is to the second tone. Subjects used a scale from 1 to 7 to make their responses, where 1 was designated Very Dissimilar and 7 was designated Very Similar. They were encouraged to use the full range of the response scale. Nine practice trials included three trials from each of the three context types.
Results Effect of context type. For each of the three context types (ascending
scale, descending scale, and major triad chord) a matrix of average inter- tone similarity judgments was constructed. The pattern of results was similar in the three similarity matrices. The correlations between the en- tries in the similarity matrices for ascending and descending scale con- texts was r = .870, for ascending scale and chord contexts was r = .832, and for descending scale and chord contexts was r = .815, withp < .OOl in all three cases. Furthermore, there were no systematic differences be- tween the results obtained using the different contexts. Consequently, in the remaining results and discussion, the data will be collapsed across the three context types.
Similarity data. Table 2 shows the average similarity rating for each of the pairs of tones in the octave range C4 to C,. These ratings are shown plotted in Fig. lA-C. Figure 1A shows the similarity ratings as a function of the second tone for the cases in which the first tone was a component of the major triad chord in the key of C major (C,, E4, G4, and C,). In the graphs, the open circles correspond to the missing diagonal in the simi- larity matrix. A maximal similarity of 7 was assumed for these identity pairs. These similarity profiles reveal a considerable amount of structure. In general, the major triad tones were judged to be more similar to diatonic scale tones than to nondiatonic tones. In addition, the compo- nents of the major triad chord were judged to be particularly similar to each other. That is, high ratings were given for the pairs C4E4, C4G4, C&, E4G4, E&, and G&. In addition, there was some evidence for a distance effect such that when the first and second tones were close in frequency

TABL
E 2
SIM
ILAR
ITY
MAT
RIX
FR
OM
EXP
ERIM
ENT
1
Seco
nd
Tone
Firs
t to
ne
C
C#
D
D#
E F
F#
G
G#
A A#
B
C’
c 3.
72
5.50
3.
22
5.65
4.
67
3.02
5.
42
3.22
4.
40
3.05
3.
83
5.43
F
C#
4.65
4.
20
4.08
3.
47
3.40
3.
43
3.08
4.
00
3.28
3.
10
2.93
2.
88
D
5.82
3.
17
3.97
5.
48
3.65
3.
33
4.90
2.
75
3.95
2.
98
4.85
4.
13
P
D#
3.12
3.
45
3.88
4.
50
3.97
3.
75
3.80
3.
20
3.05
3.
52
3.25
3.
10
r E
5.87
3.
32
5.25
3.
70
4.73
3.
73
5.32
3.
58
4.17
2.
98
4.10
5.
05
F 4.
73
3.37
4.
55
3.28
4.
98
4.08
5.
07
3.52
4.
18
3.47
3.
67
4.45
F#
3.18
3.
45
4.32
3.
88
3.93
3.
63
:
4.77
3.
83
3.80
3.
28
3.65
2.
85
G
5.50
2.
43
3.95
3.
43
5.08
4.
08
3.92
3.
83
4.97
3.
42
4.82
5.
53
G#
3.02
3.
28
3.02
3.
97
4.05
3.
88
4.08
4.
67
4.22
3.
62
3.48
3.
67
E z A
4.03
2.
55
3.78
2.
93
4.07
4.
80
3.88
5.
52
4.32
3.
88
5.55
5.
43
F A#
2.
92
2.92
3.
18
3.55
3.
13
3.98
4.
05
4.23
3.
87
4.57
4.
63
3.88
B
4.12
2.
28
3.30
2.
42
3.80
2.
60
3.32
4.
87
3.67
4.
20
3.93
6.
53
C’
5.75
2.
57
3.32
2.
68
4.67
3.
92
2.80
5.
65
3.97
4.
82
3.57
6.
00

k ,I I-
C ‘2
8 D
08
E F
F#
G
Gt
A A@
S
C Se
cond
To
ne
Il”“““
““l
C C
P D
M)
E F
F8
G
Gli
A A8
B
C’
Seco
nd
Tone
FIG
. I.
Aver
age
sim
ilarit
y ra
tings
as
a fu
nctio
n of
the
sec
ond
tone
for
ca
ses
in w
hich
th
e fir
st
tone
was
(A)
a c
ompo
nent
of
the
maj
or
triad
ch
ord,
(B
) di
aton
ic
and
not
cont
aine
d in
the
maj
or
triad
ch
ord,
(C
) no
ndia
toni
c.
c

356 CAROL L. KRUMHANSL
higher similarity ratings were given than when they were farther apart in frequency.
Figure 1B shows the similarity profiles for the cases in which the first tone was contained in the C major scale but not in the major triad chord (D4, F4, Aq, and B4). Again, these tones were judged to be more similar to other scale tones than they were to nondiatonic tones and there is a distance effect that is similar to that found for major triad components.
Figure 1C shows the similarity profiles for the nondiatonic tones, that is, the tones that are not contained in the C major scale (C#4, D#4, F#4, G#4r and A#& These profiles look qualitatively different from the pro- files for scale tones. Here, there is no difference between cases in which the second tone was a diatonic tone and cases in which it was a non- diatonic tone, and most of the variance can be accounted for in terms of the frequency difference between the first and the second tones. In addi- tion, the similarity ratings are generally lower in these profiles than they were in profiles in which the first tone was a diatonic tone.
In order to determine whether the identity of the first tone or the iden- tity of the second tone had a larger effect on the similarity ratings, row and column sums were computed from the similarity matrix. The column sums showed significantly more variance than the row sums, F*(12,12) = 3.239, p < .05. Thus, in general, the identity of the second tone had a larger effect on the similarity ratings than the identity of the first tone.
Muftidimensionaf scaling of the symmetrized data. The matrix shown in Table 2 was made symmetric by averaging across the diagonal. The resulting half-matrix was scaled using nonmetric multidimensional scaling of the sort introduced by Shepard (1962) and Kruskal(l964). The particu- lar scaling program used was KYST (Kruskal, Young, & Seery, Note 5) with the options of monotone regression, stress formula one, and the primary approach to ties specified.
The two-dimensional solution (stress = 0.166) is shown in Fig. 2. Con- tours are included connecting the tones of the major triad chord, the other diatonic tones not contained in the major triad chord, and the nondiatonic
FIG. 2. The two-dimensional multidimensional scaling solution of the similarity data.

REPRESENTATION OF MUSICAL PITCH 357
tones. These three contours are roughly circular segments with a smaller radius for the segment connecting the major triad components, a some- what larger radius for the segment connecting the remaining scale tones, and a large radius for the segment connecting the nondiatonic tones. In addition, the tones fall in a regular pattern of increasing pitch height along each of the three contours.
In the three-dimensional solution (stress = 0.108), the three circular segments of the two-dimensional configuration outlined a conical form, with the circular segment connecting the major triad tones located below the circular segment connecting the other diatonic tones, which fell below the circular segment connecting the nondiatonic tones. This solution was very similar to the slightly idealized configuration shown in Fig. 3. This configuration, rather than the actual three-dimensional solution, is shown because it is easier to depict in two-dimensional projection. In the figure, the points are located on the surface of a right circular cone with the radius at the base equal to the height of the cone. The major triad compo- nents fall on a circular cross section of half the radius of the circular cross section containing the other scale tones, and one-quarter the radius of the circular cross section containing the nondiatonic tones. The 13 tones contained within the octave interval are spaced with equal angular sep- arations around the cone such that the points corresponding to the two Cs fall at an angular separation of 270”. The program CONGRU was used to determine the correspondence between the obtained three-dimensional configuration and the conical configuration shown in Fig. 3. This program rotates and normalizes the distances in one configuration to maximize agreement with the second configuration. The resulting R value of .939 indicated a close correspondence between the three-dimensional solution and the conical configuration, suggesting that the configuration in Fig. 3 is
FIG. 3. The idealized three-dimensional conical configuration.

358 CAROL L. KRUMHANSL
TABLE 3 ASYMMETRIES IN THE SIMILARITY DATA OF EXPERIMENT 1”
First tone Second tone Similarity Difference
Other Scale Major Triad Nondiatonic Other Scale Nondiatonic Major Triad
Major Triad Other Scale Other Scale Nondiatonic Major Triad Nondiatonic
4.871 4.532 .339* 3.717 3.355 .362* 3.675 3.308 .368**
a Major Triad refers to the tones C, E, G, C’, Other Scale refers to the tones D, F, A, B, and Nondiatonic refers to the tones C#, D#, F#, G#, A#.
*p < .Ol. **p < .ool.
a fairly accurate model of the structure contained in the three-dimensional scaling solution of the similarity data.
Asymmetries in the similarity data. The similarity ratings for pairs of tones were often asymmetric, that is, the similarity ratings depended on the order in which the two tones were presented. The asymmetries appear in the similarity matrix in Table 2 as differences between the value above the diagonal and the corresponding value below the diagonal. The asym- metries followed a regular pattern. Table 3 gives the average similarity ratings for first and second tones from each of the three categories (major triad components, other diatonic tones not contained in the major triad, and nondiatonic tones). When the first tone presented was diatonic not contained in the major triad chord (D4, Fq, Ad, BJ and the second tone was a component of the major triad chord (C,, Ed, Gq, C,), the average similarity rating was larger than when the tones were presented in the opposite temporal order (t(df= 15) = 3.322, p < .Ol). Similar asymmetries were found for nondiatonic tones (C#,, D#4, F#4, G#4, A#,) and diatonic tones not contained in the major triad chord (D4, Fq, Ad, B4) (t(df=19) = 3.826, p < .Ol), and for nondiatonic tones (C#,, D#4, F#4r G#4, A#3 and major triad components (C,, Ed, Gq, C,) (t(df= 19) = 4.481, p < .OOl). Thus, higher average similarity ratings were given when the first tone was less closely related to the tonality established by the context and the second tone was more closely related to the tonality than when the tones appeared in the opposite temporal order.
Discussion The similarity ratings from this experiment indicate that, in an explicitly
musical context, musical listeners perceive a complex patterr. of inter- relationships among the individual tones. Diatonic tones were judged as more closely related to each other than they were to nondiatonic tones. The tones comprising the major triad chord formed a set of particularly
REPRESENTATION OF MUSICAL PITCH 359
closely related tones. In addition, pitch height emerged as a factor, with a tendency for tones close in frequency to be judged more similar than tones farther apart in frequency. This factor of pitch height was particularly apparent for comparisons involving nondiatonic tones. Finally, the simi- larity ratings involving the tonic itself were very similar to the findings of the earlier scale completion experiment (Krumhansl & Shepard, in press), suggesting that the same psychological representation is involved in these two quite different tasks.
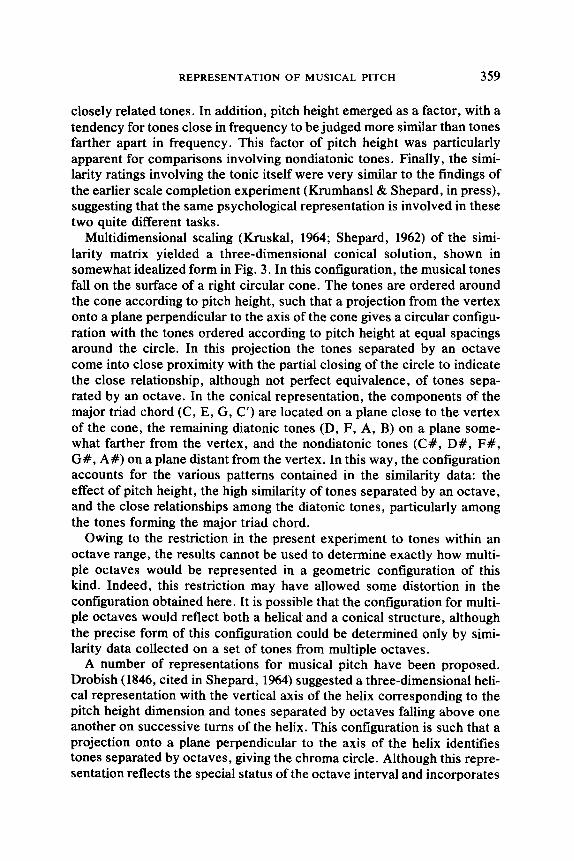
Multidimensional scaling (Kruskal, 1964; Shepard, 1962) of the simi- larity matrix yielded a three-dimensional conical solution, shown in somewhat idealized form in Fig. 3. In this configuration, the musical tones fall on the surface of a right circular cone. The tones are ordered around the cone according to pitch height, such that a projection from the vertex onto a plane perpendicular to the axis of the cone gives a circular configu- ration with the tones ordered according to pitch height at equal spacings around the circle. In this projection the tones separated by an octave come into close proximity with the partial closing of the circle to indicate the close relationship, although not perfect equivalence, of tones sepa- rated by an octave. In the conical representation, the components of the major triad chord (C, E, G, C’) are located on a plane close to the vertex of the cone, the remaining diatonic tones (D, F, A, B) on a plane some- what farther from the vertex, and the nondiatonic tones (C#, D#, F#, G#, A#) on a plane distant from the vertex. In this way, the configuration accounts for the various patterns contained in the similarity data: the effect of pitch height, the high similarity of tones separated by an octave, and the close relationships among the diatonic tones, particularly among the tones forming the major triad chord.
Owing to the restriction in the present experiment to tones within an octave range, the results cannot be used to determine exactly how multi- ple octaves would be represented in a geometric configuration of this kind. Indeed, this restriction may have allowed some distortion in the configuration obtained here. It is possible that the configuration for multi- ple octaves would reflect both a helical and a conical structure, although the precise form of this configuration could be determined only by simi- larity data collected on a set of tones from multiple octaves.
A number of representations for musical pitch have been proposed. Drobish (1846, cited in Shepard, 1964) suggested a three-dimensional heli- cal representation with the vertical axis of the helix corresponding to the pitch height dimension and tones separated by octaves falling above one another on successive turns of the helix. This configuration is such that a projection onto a plane perpendicular to the axis of the helix identifies tones separated by octaves, giving the chroma circle. Although this repre- sentation reflects the special status of the octave interval and incorporates

360 CAROL L. KRUMHANSL
the dimension of pitch height, it does not reflect the importance of other intervals such as the fifth and the third, nor does it represent in any way the distinction between diatonic and nondiatonic tones that is made in a tonal context.
Recognizing the importance of the interval of a fifth for defining re- lationships among musical tones, Shepard (Notes 6, 7) recently proposed a five-dimensional double helical structure. In this representation, the tones are ordered according to pitch height in one dimension, two other dimensions accommodate the chroma circle, and the remaining two di- mensions accommodate the circle of fifths around which the tones are placed such that adjacent tones differ by an interval of a fifth. In addition to defining the relationships among different tonal centers, the circle of fifths has the property that all the diatonic tones in any given key fall on one side of the circular structure. Thus, this kind of representation has the potential for representing the distinction between diatonic and non- diatonic tones in a particular tonality, although some additional rule for specifying the subset of diatonic tones out of the set of musical tones is required. The double helical structure might be thought of, then, as repre- senting certain relations between tones that are invariant across different tonal systems. How this basic structure might be modified to account for various tonality-specific relations, however, needs to be specified. In ad- dition, the structure does not reflect in any way the special status of the interval of a third.
Longuet-Higgens (1962) stressed the importance of the major third, in addition to the fifth and octave, and suggested that musical tones might be represented by a two-dimensional array. In this array, adjacent tones along one dimension are separated by major thirds and along the second dimension by fifths. He suggested that in this scheme, the close relation- ship between tones separated by octaves might be represented either by adding a third dimension or by identifying chroma equivalent tones in the two-dimensional array. Attneave (Note 8) and Balzano (Note 9) have independently proposed a similar two-dimensional array, only with the two dimensions corresponding to major and minor thirds. Both of these two-dimensional arrays have the property that the diatonic tones of a particular tonal system fall in a fairly compact region of the space, with the major triad tones forming a particularly compact set. Again, however, these representations do not explicitly designate the tones to be included in these tonality-specific subsets.
Thus, these representations variously reflect the importance of such factors as pitch height, diatonicism, and the interval differences of oc- taves, fifths, and thirds for determining the relationships between the individual musical tones. None of the representations, however, accounts explicitly for the effect that a tonal system has on the basic relationships
REPRESENTATION OF MUSICAL PITCH 361
contained within the representation. In particular, these representations are all highly geometrically symmetric, that is, they have the property that all intervals of a given size correspond to a fixed interpoint distance. The results of the present experiment, however, indicate that this assumption is violated in a well-defined tonal context. Similarity ratings for pairs of tones separated by a fixed interval varied considerably depending on the particular tones involved in the comparison and the similarity ratings yielded a rather nonregular three-dimensional conical configuration. For example, the distance between C and G in the configuration was very different from the distance between C# and G# of equal interval size. Nonetheless, the conical representation bears a close relationship to the symmetric chroma circle or helix, which can be described as a deforma- tion of the symmetric representation. Starting with a single turn of the helix or broken chroma circle, the diatonic tones are drawn together in the deformation by pulling them toward a point introduced in an additional dimension, which then becomes the vertex of the cone. The tonic, third, and fifth scale tones are drawn more closely to the vertex than are the other diatonic tones. In this way, the conical configuration can simulta- neously represent dimensions that are independent of the particular to- nality, such as pitch height and chroma, and factors that depend on the particular tonality, such as membership in the associated major triad chord and diatonic scale.
In addition to the structure contained in the symmetrized similarity data, the data showed a regular pattern of asymmetries. In general, tones less closely related to the established tonality were judged more similar to tones more central to the tonality, than tones central to the tonality were judged to tones less related to the tonality. These asymmetries were found between the major triad tones and the other diatonic tones, between the major triad tones and the nondiatonic tones, and between the diatonic tones not contained in the major triad chord and the nondiatonic tones. Like the kinds of categories investigated by Rosch (1975), then, the set of musical tones in a tonal context appears to contain certain members that serve as psychological reference points.
Two models of similarity relations have been proposed that have been shown to account for asymmetric similarity data in a number of stimulus domains. The first, the feature-matching model (Tversky, 1977), is a set- theoretic model. In this model, the observed measure of similarity is assumed to be monotonically related to a linear combination of the mea- sure of the features shared by the two objects and the distinctive features of the objects, that is, the features associated with one but not with the other of the two objects. Shared features are assumed to add to, and distinctive features are assumed to subtract from, the similarity measure. The feature-matching model implies the following relationship: In the

362 CAROL L. KRUMHANSL
comparison more weight is given to the first than to the second stimulus if and only if less prominent objects in the first position are more similar to more prominent objects in the second position than the reverse order. Music theory suggests that tones less related to the tonality are less prominent in musical contexts than are the tones closely related to the tonality, and the present data show that tones less related to the tonality are judged more similar to tones closely related to the tonality than the opposite order. The feature-matching model, then, implies that more em- phasis is given in the judgment to the first than to the second stimulus. However, as indicated by the variance of the row and column sums of the similarity matrix, the identity of the second tone was found to have a larger effect on the similarity measure than the identity of the first tone, suggesting that the feature-matching model as formulated is unable to account for the pattern of asymmetries found in the similarity data in the present experiment.
The distance-density model (Krumhansl, 1978) has a similar problem. In that model, the observed similarity measure is assumed to be related by a monotonically decreasing function to a linear combination of the dis- tance between the two points in the spatial configuration and the density of points in the regions surrounding the two points. Thus, the model assumes that large similarity measures are associated with small distances and low spatial densities. The model implies that more emphasis is given to the first than to the second object in the comparison if and only if points in less dense regions are judged more similar to points in more dense regions than the reverse order. Considering the multidimensional scaling solution this was the pattern of asymmetries found. However, the simi- larity data indicate that more emphasis was given to the second than to the first tone in the comparison, contrary to prediction. Thus, although the present results are similar to those found in other studies (see Krumhansl, 1978) in which objects in less dense regions tend to be judged more similar to objects in more dense regions than the opposite, the greater effect on the similarity measure of the second than the first tone indicates that the asymmetries cannot be accounted for in precisely the manner assumed by the distance-density model.
Thus, neither of the two similarity models as formulated is totally con- sistent with the data of the present study. As in earlier studies, the asym- metries found seem to be related to the relative centrality of the objects in the stimulus set, where central objects tend to be both prominent and located in dense regions of the spatial configuration. Therefore, centrality may be a factor generally associated with asymmetries in similarity mea- sures. However, the results of this study suggest that asymmetries do not necessarily depend on a greater focus on one than on the other compari- son stimulus as assumed in the feature-matching and distance-density

REPRESENTATION OF MUSICAL PITCH 363
models. An alternative approach to describing the asymmetries in the present experiment is to say that there is a tendency to move over time toward, rather than away from, the vertex of the conical configuration.
The tendency of the less structurally stable musical tones to move toward the tonic and its closely related tones in time in unanimously regarded by music theorists (for example, Meyer, 1957; Ratner, 1962; Tech, 1977; Zuckerkandl, 1957) as important in shaping the flow of music in time. A musical phrase typically begins with the establishment of cer- tain tones as stable reference tones, followed by a series of less stable tones which move toward and finally return to the structurally stable tones, particularly the tonic itself. This notion of tendency is critical in determining the dynamic aspect of musical tones in time. If tones less related to the tonic are also less stable in the psychological representation, then this suggests that certain tones, particularly the nondiatonic tones, may be more difficult to remember in a tonal context than are other musical tones. This hypothesis is tested in the next two experiments.
EXPERIMENT 2
Memory for tones has been investigated by Wickelgren (1966, 1969) and Deutsch (1972a, 1972b, 1973a, 1973b, 1974, 1978) using a delayed recog- nition task. In this paradigm, the subject first hears a single pitch, called the standard (S) tone. This is then followed by a retention interval during which a single interference tone, or a sequence of tones, is heard. Fol- lowing this retention interval is another single tone, called the comparison (C) tone, and the subject judges whether the S and C tones are the same or different. Wickelgren found that a single tone interpolated between the S -and C tones produced memory deterioration that increased with the dura- tion of the interference tone. He also found that a larger separation in pitch between the S and C tones resulted in a lower false recognition rate. Using sequences of multiple tones during the retention interval, Deutsch found evidence for various specific interactive effects of the tones of the intervening sequence. Memory for the S tone was facilitated when the interpolated sequence contained a tone of the same pitch as the S tone, and was hindered by inclusion of a tone a half step removed from the S tone. On different trials, inclusion of the C tone in the sequence also increased the number of errors. Although reduced in magnitude, these effects generalized across octaves. Finally, the complexity of the inter- polated sequence was found to have an effect, such that memory was better when the average size of the melodic interval in the interpolated sequence was small than when it contained larger intervals, leading to the suggestion that subjects use melodic interval information as a framework of pitch relationships to which the test tones can be anchored.
This delayed recognition paradigm was used in the next two experi- ments to test the hypothesis that in a tonal context the representation of
364 CAROL L. KRUMHANSL
diatonic tones is more stable than that of nondiatonic tones. In these experiments, the interpolated sequences are either tonal or atonal. The tonal sequences are constructed to sound reasonably melodic and suggeslt the tone C as the tonic, and, in the first of the two experiments, the tonal sequences include all the tones of the diatonic C major scale. The atonal sequences were constructed from the tonal sequences by raising the highi est and lowest tones of the sequences by a half-step, thus destroying 04 weakening the tonality of the interpolated sequence. Both diatonic and nondiatonic tones, where the designation is made with respect to the tonality of the tonal sequences, appeared as S tones. When the S tone was diatonic it was repeated during the interpolated sequence. Based on Deutsch’s (1972a) result that performance is facilitated when the S tone is repeated in the sequence, better overall performance is expected fo$ diatonic than for nondiatonic tones. However, if a tonal context selec- tively strengthens the representation of diatonic tones in memory and weakens the representation of nondiatonic tones, the difference between performance on diatonic and nondiatonic tones should be larger for tonal than for atonal sequences. Thus, an interaction between the type of con- text (tonal or atonal) and the type of tone (diatonic or nondiatonic) is predicted.
Method Subjects and apparatus. The subjects and apparatus were identical to those of
Experiment 2, except that the tapes were recorded at 3.75 ips. Stimulus materials. Each trial consisted of a standard (S) tone followed by an
interpolated eight-tone sequence and a final comparison (C) tone. The duration of the S tone was approximately 0.5 sec. This was followed immediately by the eight-tone interpolated sequence in which each tone was sounded for approximately 0.5 sec. Following the se+ quence and a l.S-set silent interval, the C tone was played for approximately 0.5 sec. Thd intertrial interval, during which subjects made their responses, was approximately 8 sec.
Twenty blocks of 32 trials each were constructed. In 10 blocks, the S and C tones were drawn from the set (Fa, F#4, Ga, G#4r A& The four eight-tone interpolated sequences for this range of test tones are shown in Fig. 4. Two of the sequences contain the eight tones of the C major scale within the octave range C, to C,. These sequences, beginning on Cd, ending with the leading tone to tonic progression, B,C5, and containing the major scale tones, were constructed so as to strongly suggest the C major tonality. These sequences are therefore called tonal sequences. The other two sequences were constructed from the first two sequences by changing C4 to C#4, D4 to D#,, and C, to C#,, leaving the remaining tones and their order fixed. Since these sequences do not conform to diatonic structure, they are called atonal sequences. For both tonal and atonal sequences, the test tones fell in the center of the range of tones used in the interpolated sequences. In the remaining 10 blocks of trials, the S and C tones were drawn from the set (C4, C#4r Dq, D#4, E4). The four eight-tona interpolated sequences for this range of test tones are also shown in Fig. 4. TWO of the sequences contain the eight tones of the C major scale within the octave range Gs to G,. These sequences begin on G, and end on Ga. the fifth scale degree of the key of C major, and were constructed to suggest the tonal system centered on C. The remaining two sequences were constructed from the tonal sequences by changing G4 to G#4r F, to F#,, and G, to GXI, and do not conform to diatonic structure. Again, the test tones fell in the center of the range of tones used in the interpolated sequences.

REPRESENTATION OF MUSICAL PITCH 365
TONAL ATONAL
Test Tones F. Fk!.G.Gk A
Seauence
1
2
Test Tones C.Ctl. C4Dti.E
3
4
FIG. 4. The tonal and atonal interpolated sequences used in Experiment 2.
On half the trials, the S and C tones were the same, and on half the trials the S and C tones differed by a semitone. Thus, on different trials, either the S tone was diatonic and the C tone was nondiatonic, or the S tone was nondiatonic and the C tone was diatonic. Across blocks of trials, for each of the different interpolated sequences there were eight observa- tions for each possible same trial, and five observations for each postible different trial. Trials were randomly ordered within blocks, and the 20 blocks were presented in different random orders to the different subjects.
Procedure. Subjects were instructed to judge on each trial whether the very first tone on the trial was the same or different from the very last tone on the trial, and to indicate their confidence in the judgment. Subjects used a scale from 1 to 6 to make their responses where the response was labeled as follows: 1 = Very Sure Same, 2 = Quite Sure Same, 3 = Probably Same, 4 = Probably Different, 5 = Quite Sure Different, and 6 = Very Sure Different. They were encouraged to use the full range of the response scale. Subjects were given six practice trials before the start of the experiment.
Results The six-category confidence ratings were used to generate individual
memory operating characteristics (MOC) for each subject for each of the four conditions: diatonic S tone and tonal sequence, nondiatonic S tone and tonal sequence, diatonic S tone and atonal sequence, and nondiatonic S tone and atonal sequence. The designation of the S tone as diatonic or nondiatonic is made with respect to the tonality of the tonal sequences. The area under the MOC will be used as the dependent measure in the analysis. This measure is free of a number of distributional assumptions of signal detection theory and can be interpreted as an estimate of the per- centage correct if chance performance is 0.50 (Swets, 1973).
The average area under the MOC curve for each of the four conditions is shown in Fig. 5, where diatonic and nondiatonic indicates whether or

366 CAROL L. KRUMHANSL
1.00 -
.90 -
30 -
.70 -
.60 -
so -
- Tonal
--- Atonal
k I I
DIATONIC NONDIATONIC
FIG. 5. The average area under the MOC curve for diatonic and nondiatonic standard (S) tones in tonal and atonal contexts in Experiment 2.
not the standard (S) tone belongs to the diatonic scale of the tonality of the tona sequences. An analysis of variance showed significantly better per- formance overall for diatonic S tones (C,, Dq, Ed, Fq, Gq, A4) than for nondiatonic S tones (C#,, D#4, F#4, G#e), F(1,9) = 69.24, p < .OOl. Thus, subjects confused nondiatonic tones with diatonic tones more often than they confused diatonic tones with nondiatonic tones. It should be recalled that diatonic tones were repeated in the interpolated sequences, whereas nondiatonic tones were not. The overall difference between tonal and atonal sequences was not significant. However, the interaction be- tween the type of context (tonal or atonal) and the type of S tone (diatonic or nondiatonic) was significant, F(1,9) = 16.40, p < .Ol. Memory for diatonic tones was better in tonal than atonal contexts (t(df=9) = 3.381, p < .Ol), but memory for the nondiatonic tones was better in atonal than tonal contexts @(@=9) = 3.284, p < .Ol).
Discussion In this experiment, using a delayed recognition task with an interpo-
lated sequence of tones, an interaction was found between the type of standard (to be remembered) tone and the type of interpolated sequence. Diatonic tones were better remembered in tonal than in atonal contexts, and nondiatonic tones were better remembered in atonal than in tonal contexts. This suggests that, compared to atonal contexts, tonal contexts selectively reinforce the representation of diatonic tones and weaken the representation of nondiatonic tones in memory. This result is consistent with the music theoretic description of diatonic tones as more stable than nondiatonic tones in a tonal system.

REPRESENTATION OF MUSICAL PITCH 361
In addition, in both tonal and atonal contexts, subjects more often confused nondiatonic tones with diatonic tones than they confused diatonic tones with nondiatonic tones. This is the same pattern of asym- metry found in the similarity ratings of Experiment 1. However, this effect is somewhat difftcult to interpret in the present experiment since diatonic tones, but not nondiatonic tones, were repeated in the interpo- lated sequences. Therefore, the asymmetry may result from the reinforc- ing of the diatonic tones by the repetition contained in the sequence, as suggested by Deutsch (1972a). That the asymmetry was larger for tonal than for atonal contexts, however, suggests that the effect is at least partially related to the differential stability of diatonic and nondiatonic tones in tonal contexts. In the next experiment, this confounding of the type of standard tone and whether or not is repeated in the interpolated sequence was eliminated.
EXPERIMENT 3
This experiment is similar in design to Experiment 2, except that the interpolated sequences do not contain either the diatonic or nondiatonic tones that appear as test tones. Therefore, direct comparisons can be made between memory performance on diatonic and nondiatonic tones. The tones used as standards in this experiments are the tones C and G, the diatonic tones particularly closely related to the tonality of the tonal se- quences, and their neighboring nondiatonic tones, C#, F#, and G#. For symmetry of design the tone B, a half-step below the tone C, was also used as a test tone, although the results from trials on which the B ap- peared as either a standard or comparison tone are not included in the analysis.
Method
Subjects, apparatus, and procedure. The subjects, apparatus, and procedure were identical to those of Experiment 2.
Stimufus materials. The trials were similar in construction to those of Experiment 2, except that the sequences were altered by deleting the tone G., from the first four sequences of Experiment 2 (Fig. 4), and the tones Bs and C, from the other four sequences. The resulting sequences are shown in Fig. 6. In addition, the S and C tones were limited to the set (F#4, G+, G#,) for the first four sequences, and the set (B3, C1, C#J for the other sequences. Thus, on no trial was the standard tone repeated in the interpolated sequence, nor did the sequence contain the comparison tone. Six blocks of 32 trials were constructed for each of the two ranges of test tones. On half the trials the S and C tones were the same, and on half the trials the S and C tones differed by a semitone. For each of the interpolated sequences, there were eight observations for each possible same trial, and six observations for each possible different trial. The durations of the tones were the same as in Experiment 2. Trials were randomly ordered within blocks, and the 12 blocks were presented in different random orders to the different subjects.

368
Sequsnca 1
2
3
4
CAROL L, KRUMHANSL
TONAL ATONAL
Test Tones F#.C.Gtl
Test Tones B.C.Cfl
FIG. 6. The tonal and atonal interpolated sequences used in Experiment 3.
Results Figure 7 shows the average area under the MOC curves for diatonic and
nondiatonic standard (S) tones in tonal and atonal contexts. The designa- tion of the tones C4 and G4 as diatonic and the tones C#4, F#4, and G#l as nondiatonic is made with respect to the tonality of the tonal interpolated sequences. Here the critical comparison is between performance on diatonic and nondiatonic tones when they are presented in tonal contexts.
1.00 - - Tonal
--- Atonal
.50 -
I I
DIATONIC NONDIATONIC
FIG. 7. The average area under the MOC curve for diatonic and nondiatonic Standard (S) tones in tonal and atonal contexts in Experiment 3.

REPRESENTATION OF MUSICAL PITCH 369
Performance was significantly better on diatonic than on nondiatonic S tones (r(u”=9) = 2.310, p < .05). As indicated by the average confidence ratings, diatonic tones were more often correctly recognized on same trials than were nondiatonic tones, and on different trials, diatonic tones were less often confused with nondiatonic tones than nondiatonic tones were confused with diatonic tones. In atonal contexts, the pattern was actually reversed with average performance on the tones C#4, F#4, and G#4 better than on the tones Cq and Gq (t(df=9) = 2.745, p < .05), although the difference in performance was not as large as the difference in the opposite direction for tonal sequences. An analysis of variance showed no overall difference between tonal and atonal sequences, or between diatonic and nondiatonic standard tones, but the interaction of these two variables was significant, F(1,9) = 9.16, p < .05.
Discussion The results of this experiment support the hypothesis that in tonal
contexts, the psychological representation of diatonic tones is more stable than that of nondiatonic tones. Recognition memory was more accurate for diatonic than for nondiatonic tones when the interpolated sequence was tonal. In addition, like the pattern of asymmetries found in the simi- larity ratings of Experiment 1, nondiatonic tones were more often con- fused with diatonic tones than the reverse. Together these results suggest that, not only is the representation of nondiatonic tones less stable, there is a tendency for the memory representation of nondiatonic tones to be biased toward diatonic tones in the representation, just as there is a ten- dency for musical phrases to move from the less structurally stable tones to the more stable tones, particularly to the tonic itself.
An alternative explanation for the results from the tonal context trials might be that when the standard is nondiatonic, there is a tone in the interpolated sequence that is a half-step removed from it. This is not true, however, for standard tones that are diatonic. Deutsch (1973a) found that the inclusion of a tone a half-step removed from the standard in the interpolated sequence has a detrimental effect on memory for the stan- dard tone. Thus, the difference in tonal contexts between diatonic and nondiatonic tones might be accounted for in this way. However, this explanation would predict that the tones C and G should be better re- membered than the tones C#, F#, and G# with the atonal sequences also. But, the results with atonal sequences were just the opposite, sug- gesting that it is in fact the diatonicism which is the important factor in producing the results in the tonal contexts.
In atonal contexts, performance was better on the tones C#, F#, and G# than it was on the tones C and G. This reversal of performance on diatonic and nondiatonic (with respect to the tonality of the tonal se-

370 CAROL L. KRUMHANSL
quences) standard tones was not predicted. An analysis of the atonal sequences, however, suggests that instead of being atonal these se- quences may have suggested some other tonality in which the test tones that are nondiatonic in C major are diatonic and test tones that are diatonic in C major are nondiatonic. For example, the first two atonal sequences in Fig. 6 may suggest C# minor (or E major) in which the tones F# and G# are diatonic and the G is nondiatonic, and the second two atonal sequences may suggest A major in which the C# is diatonic and the tone C is nondiatonic. Although not anticipated, in retrospect, these results are consistent with the notion of differential stability of the psychological representation of diatonic and nondiatonic tones in memory.
EXPERIMENT 4
This experiment merely represents a check on the effectiveness of the manipulation contained in Experiments 2 and 3. In those experiments, the interpolated sequences were designed so as to sound either tonal or atonal. In order to check whether this difference was perceived, the sub- jects were asked to make musicality judgments on the 16 sequences used in Experiments 2 and 3.
Method Subjects and apparatus. The subjects and apparatus were identical to those of
Experiments 2 and 3. Stimulus materials. Each of the 16 sequences from Experiments 2 and 3 (Figs. 4 and
6) were played at the rate of 0.5 set per tone, with approximately 6 set between sequences. Three blocks, each containing the 16 sequences in random order were constructed, so that each of the sequences appeared three times in the experiment.
Procedure. Subjects were instructed to judge on a scale from 1 to 7 on each trial how musical the sequence sounded, where 1 was designated Not At All Musical and 7 was designated Very Musical. The three blocks of trials were presented in different random orders to the different subjects.
Results and Discussion The average musicality judgments of the 16 sequences from Experi-
ments 2 and 3 are shown in Table 4. In all cases, the tonal sequences were judged to be significantly more musical than the related atonal versions. The significance level for the t value for each comparison is given in Table 4. Thus, the musicality judgments indicate that the tonal sequences were in fact perceived by the listeners as more well-structured musical contexts than the atonal sequences.
SUMMARY AND CONCLUSIONS
As musical entities, tones acquire meaning through their relationships to other tones. In a musical context, the individual tones become part of a larger structure and perform distinguishable functions within that system.

REPRESENTATION OF MUSICAL PITCH 371
TABLE 4 MUSICALITYJUDGMENTSON INTERWLATEDSEQUENCESOF EXPERIMENTS 2 AND 3
Experiment 2 Experiment 3
Sequence Tonal Atonal Tonal Atonal
I 6.233 2.700** 6.100 3.333** 2 5.799 2.533** 5.600 2.933** 3 4.567 3.367* 4.933 3.833* 4 5.333 3.633* 4.767 3.633*
*p < .05. **p < .Ol.
The music-theoretic term for this organized system of relationships is
tonality. The tonal system establishes the pattern of similarities and dif-
ferences among the tones, as well as the dynamic quality of musical tones
in time. In this series of experiments, evidence was found for a complex
psychological representation of musical pitch that corresponds to this
music-theoretic description of tonality.
In the first experiment, musically trained subjects judged the simi-
larities between tones presented in an explicit tonal context. The results
indicated that musical listeners perceive a pattern of relationships among
tones that is determined not only by pitch height and chroma, but also by
membership in the major triad chord and the diatonic scale associated
with the established tonality. Thus, measured in terms of the similarity
ratings, the degree of relationship between tones was determined not only
by the frequency relations of the tones but also by the function of the
particular tones within the tonal system. For example, the similarities
between tones separated by a fixed interval varied depending on whether
the individual tones in the comparison were components of the major triad
chord, the diatonic scale, or were nondiatonic. This argues against
theories that, in the tradition of Helmholtz (1863/1954), explain the per-
ceived similarities between tones in terms of the relationships of their
fundamental frequencies and harmonics. Apparently, the pattern of per-
ceived similarities in a tonal context is more complex than can be ex-
plained on the basis of such frequency relationships alone.
Multidimensional scaling of the similarity ratings gave a three-
dimensional conical configuration. In this representation, tones were or- dered around a conical form according to pitch height, bringing the tones
differing by an octave into close proximity. The diatonic or scale tones
were located near the vertex of the cone to represent the close relation- ships among these tones. The components of the major triad chord, which
form a strong tonal unit, were located particularly closely to the vertex. At the other extreme, nondiatonic tones were located far from the vertex

372 CAROL L. KRUMHANSL
to reflect the weaker relationships among these tones and between these tones and the diatonic tones. Thus, this structure reflects the hierarchy established within a tonal context, in which the major triad tones are the most structurally stable and closely related tones, followed by the other diatonic tones, and, finally, the nondiatonic tones.
The similarity judgments also contained a regular pattern of asymmet- ries such that tones less related to the tonality were judged more similar to tones more related to the tonality than the reverse temporal order. These asymmetries were also found in a delayed recognition task. In that task, subjects more often confused a first-presented nondiatonic tone with a second-presented diatonic tone than they confused a first-presented diatonic tone with a second-presented nondiatonic tone. These results suggest that, in the psychological representation, those tones less closely related to the tonality are less stable than tones closely related to the tonality, and that the representation incorporates the tendency for less stable tones to move toward more stable tones in time. Thus, these tem- poral asymmetries reflect the dynamic character of musical tones in time.
Music perception, like other psychological processes involving com- plex stimuli, requires the contact in the perceiver between the incoming stimulus and a psychological representation that relates the parts of the stimulus to one another in a coherent and meaningful way. This series of experiments indicates that, in musical listeners, the representation of pitch consists of a pattern of interrelationships that is highly specific to the tonal system of the musical context. Further, this pattern of interrelation- ships, once established, has implications for the processing of subsequent musical events. The tonality-specific nature of this representation argues that the musical pitch domain is appropriately investigated only in the context of a well-defined musical system and that the perception of music depends not only on psychoacoustic properties of the tones, but also on processes that relate the tones to one another through contact with a well-defined and complex psychological representation of musical pitch.
REFERENCES Allen, D. Octave discriminability of musical and non-musical subjects. Psychonomic Sci-
ence, 1967, 7, 421-422. Attneave, F., & Olson, R. K. Pitch as medium: A new approach to psychophysical scaling.
American Journal of Psychology, 1971, 84, 147- 166. Bachem, A. Tone height and tone chroma as two different pitch qualities. Acta
Psychologica, 1950, 7, 80-88. Bachem, A. Time factors in relative and absolute pitch determination. Journal of the Acous-
tical Society of America, 1954, 26, 751-753. Blackwell, H. R., & Schlosberg, H. Octave generalization, pitch discrimination, and loud-
ness thresholds in the white rat. Journal of Experimental Psychology, 1943, 33, 407-419.
Cuddy, L. L. Training the absolute identification of pitch. Perception & Psychophysics, 1970, 8, 265-269.

REPRESENTATION OF MUSICAL PITCH 373
Deutsch, D. Effect of repetition of standard and comparison tones on recognition memory for pitch. Journal of Experimental Psychology, 1972,93, 156- 162. (a)
Deutsch, D. Mapping of interactions in the pitch memory store. Science, 1972, 175, 1020- 1022. (b)
Deutsch, D. Interference in memory between tones adjacent in the musical scale. Journal of Experimental Psychology, 1973, 100, 228-231. (a)
Deutsch, D. Octave generalization of specific interference effects in memory for tonal pitch. Perception & Psychophysics, 1973, 13, 271-275. (b)
Deutsch, D. Generality of interference by tonal stimuli in recognition memory for pitch. Quarterly Journal of Experimental Psychology, 1974, 26, 229-234.
Deutsch, D. Delayed pitch comparisons and the principle of proximity. Perception & Psychophysics, 1978, 23, 227-230.
Dewar, K. M., Cuddy, L. L., & Mewhort, D. J. K. Recognition memory for single tones with and without context. Journal OfExperimental Psychology: Human Learning and Memory, 1977, 3, 60-67.
Dowling, W. J. Scale and contour: Two components of a theory of memory for melodies. Psychological Review, 1978, 85, 341-354.
Helmholtz, H. von. On the sensations of tone as a physiological basis for the theory of music. A. J. Ellis (Ed. and trans.) New York: Dover, 1954 (Original German publication, 1863).
Humphreys, L. F. Generalization as a function of method of reinforcement. Journal of Experimental Psychology, 1939, 25, 361-372.
Krumhansl, C. L. Concerning the applicability of geometric models to similarity data: The interrelationship between similarity and spatial density. Psychological Review, 1978, 85, 445-463.
Krumhansl, C. L., & Shepard, R. N. Quantification of the hierarchy of tonal functions within a diatonic context. Journal of Experimental Psychology: Human Perception and Performance, in press.
Kruskal, J. B. Nonmetric multidimensional scaling: A numerical method. Psychometrika, 1964, 29, 28-42.
Levelt, W. J. M., VandeGeer, J. P., & Plomp, R. Triadic comparisons of musical intervals. British Journal of Mathematical and Statistical Psychology, 1966, 19, 163- 179.
Longuet-Higgins, C. Letter to a musical friend. The Music Review, 1962, 23, 244-248. Meyer, L. B. Emotion and meaning in music. Chicago: Univ. of Chicago Press, 1957. Piston, W. Harmony (3rd ed.). New York: Norton, 1962. Ratner, L. G. Harmony: Structure and sty/e. New York: McGraw-Hill, 1962. Revesz, G. Introduction fo the psychology of music. Norman, OK: Univ. of Oklahoma
Press, 1954. Rosch, E. Cognitive reference points. Cognitive Psychology, 1975, 7, 532-547. Shepard, R. N. The analysis of proximities: Multidimensional scaling with an unknown
distance function. I. & II. Psychometrika, 1962, 27, 125- 140, 219-246. Shepard, R. N. Circularity in judgments of relative pitch. Journa/ of the Acoustical Society
of America, 1964, 36, 2346-2353. Stevens, S. S., & Volkmann, J. The relation of pitch to frequency; A relative scale. Ameri-
can Journal of Psychology, 1940, 53, 329-353. Stevens, S. S., Volkmann, J., & Newman, E. B. A scale for the measurement of the
psychological magnitude of pitch. Journal of the Acoustical Society of America, 1937, 8, 185-190.
Swets, J. A. The relative operating characteristic in psychology. Science, 1973, 182, 990- 1000.
Tech, E. The shaping forces in music. New York: Dover, 1977. Tversky, A. Features of similarity. Psychological Review, 1977, 84, 327-352.

374 CAROL L. KRUMHANSL
Wickelgren, W. A. Consolidation and retroactive interference in short-term memory for pitch. Journal of Experimental Psychology, 1966, 72, 250-259.
Wickelgren, W. A. Associative strength theory of recognition memory for pitch. Journal of Mathematical Psychology, 1969, 6, 13-61.
Zuckerkandl, V. Sound and symbol. Princeton, NJ: Princeton Univ. Press, 1956.
REFERENCES NOTES 1. Balzano, G. J. Chronometric studies of the musical interval scale. Unpublished doc-
toral dissertation, Stanford University, 1977. 2. Cohen, A. Inferred sets of pitches in melodic perception. Symposium on Cognitive
Structure of Musical Pitch, Western Psychological Association Meetings, San Fran- cisco, April 1978.
3. Dewar, K. M. Context effects in recognition memory for tones. Unpublished doctora dissertation, Queen’s University at Kingston, Ontario, Canada, 1974.
4. Cohen, A. Perception of tone sequences from the Western-European chromatic scale: Tonality, transposition and the pitch set. Unpublished doctoral dissertation, Queen’s University at Kingston, Ontario, Canada, 1975.
5. Kruskal, J. B., Young, F. W., & Seery, J. B. How to use K YST, a veryflexible program to do multidimensional scaling and unfolding. Murray Hill, NJ: Bell Telephone Laboratories, 1973.
6. Shepard, R. N. The double helix of musicalpitch. Symposium on Cognitive Structure of Musical Pitch, Western Psychological Association Meetings, San Francisco, April 1978.
7. Shepard, R. N. Geometrical approximations to the structure of musical pitch. Manu- script in preparation.
8. Attneave, F. Comments as discussant. Symposium on Cognitive Structure of Musical Pitch, Western Psychological Association Meetings, San Francisco, April 1978.
9. Balzano, G. J. The structural uniqueness of the diatonic order. Symposium on Cogni- tive Structure of Musical Pitch, Western Psychological Association Meetings, San Francisco, April 1978.
(Accepted February 28, 1979)