The Property Tax- School Funding Dilemma - Lincoln … The properTy Tax–School Funding dilemma . ....
68
Policy Focus Report • Lincoln Institute of Land Policy The Property Tax- School Funding Dilemma BY DAPHNE A. KENYON
Transcript of The Property Tax- School Funding Dilemma - Lincoln … The properTy Tax–School Funding dilemma . ....

Policy Focus Report • Lincoln Institute of Land Policy
The Property Tax- School Funding Dilemma
B y D a P h n e a . K e n y o n

K e n y o n ● T h e p r o p e r T y Ta x – S c h o o l F u n d i n g d i l e m m a �
This report is one of a series of policy focus reports published by the Lincoln Institute of Land Policy to address timely public policy issues relating to land use, land markets, and property taxation. Each report is designed to bridge the gap between theory and practice by combining research findings and case studies with contributions from scholars in a variety of academic disciplines and from professional practitioners, local officials, and citizens in diverse communities.
The Lincoln Institute of Land Policy is a private operating foundation whose mission is to improve the quality of public debate and decisions in the areas of land policy and land-related taxation in the United States and around the world. The Institute’s goals are to integrate theory and practice to better shape land policy and to provide a nonpartisan forum for discussion of the multidisciplinary forces that influence public policy. The work of the Institute is organized in four departments: Valuation and Taxation, Planning and Urban Form, Economic and Community Development, and International Studies. We seek to inform decision making through education, research, demonstration projects, and the dissemination of information through publications, our Web site, and other media. Our programs bring together scholars, practitioners, public officials, policy advisers, and involved citizens in a collegial learning environment.
Daphne A. Kenyon is principal of D. A. Kenyon & Associates, a public finance consulting firm in Windham, New Hampshire. She also serves on New Hampshire’s State Board of Education and on the Education Commission of the States, a national organization. Prior to founding her consulting firm, Kenyon served as president of The Josiah Bartlett Center for Public Policy; professor and chair in the Economics Department at Simmons College; senior economist with the Office of Tax Analysis at the U.S. Department of the Treasury, the Urban Institute, and the U.S. Advisory Commission on Intergovernmental Relations; and assistant professor at Dartmouth College. Kenyon earned her B.A. in economics from Michigan State University and her M.A. and Ph.D. in economics from the University of Michigan.
Kenyon researched and wrote this report while serving as a visiting fellow at the Lincoln Institute of Land Policy. The views expressed in this paper should not be attributed to the Lincoln Institute of Land Policy or the New Hampshire State Board of Education.
Copyright © 2007 by the Lincoln Institute of Land Policy All rights reserved.
www.lincolninst.edu
ISBN 978-1-55844-168-2 Policy Focus Report / Code PF015
The Property Tax- School Funding Dilemma
K e n y o n ● T h e p r o p e r T y Ta x – S c h o o l F u n d i n g d i l e m m a �
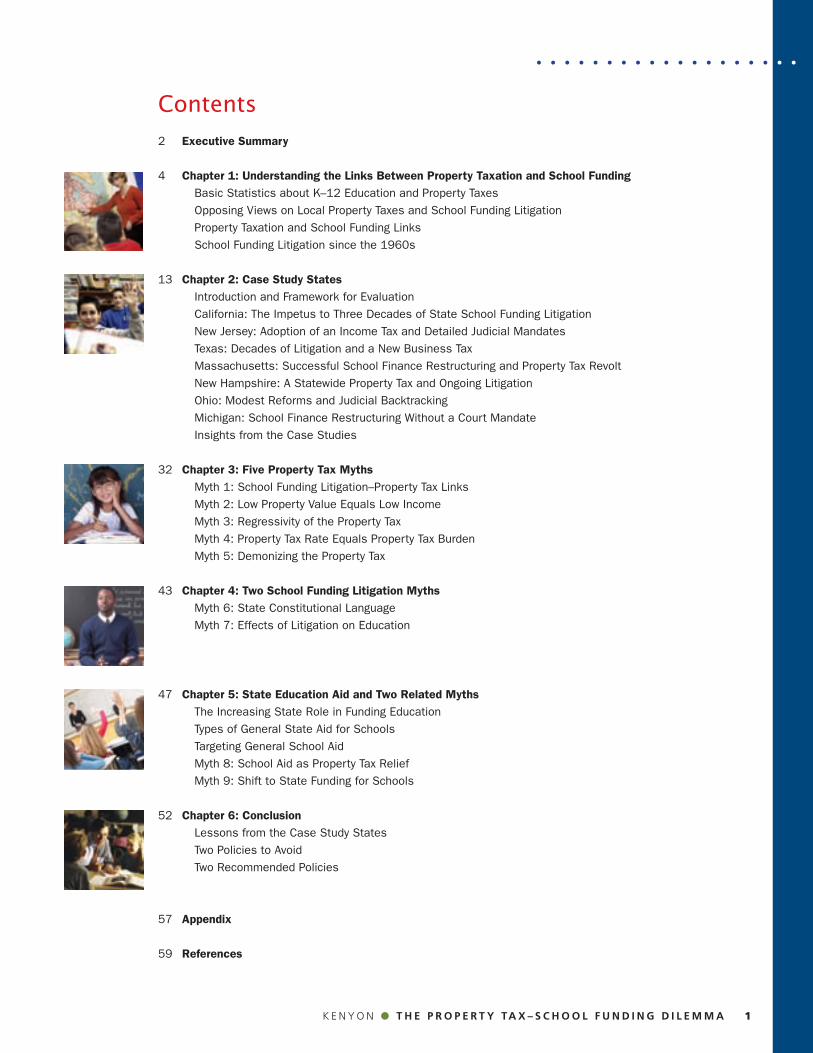
. . . . . . . . . . . . . . . . . . .Contents2 Executive Summary
4 Chapter 1: Understanding the Links Between Property Taxation and School FundingBasic Statistics about K–12 Education and Property TaxesOpposing Views on Local Property Taxes and School Funding LitigationProperty Taxation and School Funding LinksSchool Funding Litigation since the 1960s
13 Chapter 2: Case Study StatesIntroduction and Framework for Evaluation California: The Impetus to Three Decades of State School Funding Litigation New Jersey: Adoption of an Income Tax and Detailed Judicial MandatesTexas: Decades of Litigation and a New Business TaxMassachusetts: Successful School Finance Restructuring and Property Tax Revolt New Hampshire: A Statewide Property Tax and Ongoing LitigationOhio: Modest Reforms and Judicial BacktrackingMichigan: School Finance Restructuring Without a Court MandateInsights from the Case Studies
32 Chapter 3: Five Property Tax MythsMyth 1: School Funding Litigation–Property Tax Links Myth 2: Low Property Value Equals Low IncomeMyth 3: Regressivity of the Property TaxMyth 4: Property Tax Rate Equals Property Tax BurdenMyth 5: Demonizing the Property Tax
43 Chapter 4: Two School Funding Litigation MythsMyth 6: State Constitutional Language Myth 7: Effects of Litigation on Education
47 Chapter 5: State Education Aid and Two Related MythsThe Increasing State Role in Funding EducationTypes of General State Aid for SchoolsTargeting General School AidMyth 8: School Aid as Property Tax Relief Myth 9: Shift to State Funding for Schools
52 Chapter 6: ConclusionLessons from the Case Study StatesTwo Policies to AvoidTwo Recommended Policies
57 Appendix
59 References
� p o l i c y F o c u S r e p o r T ● L i n c o L n i n s t i t u t e o f L a n d P o L i c y
. . . . . . . . . . . . . . . . . . .
K e n y o n ● T h e p r o p e r T y Ta x – S c h o o l F u n d i n g d i l e m m a �
Property taxation and school funding are closely linked in the United States, with nearly half of all property tax revenue used for public elementary and secondary education. There is an active policy debate across the country regarding the degree to which public schools should be funded with property tax dollars. Some policy makers
and analysts call for reduced reliance on property taxation and increased reliance on state funding; others claim that the property tax is a critical ingredient in effective local government. School funding is no less controversial, and nearly every state has dealt with school funding
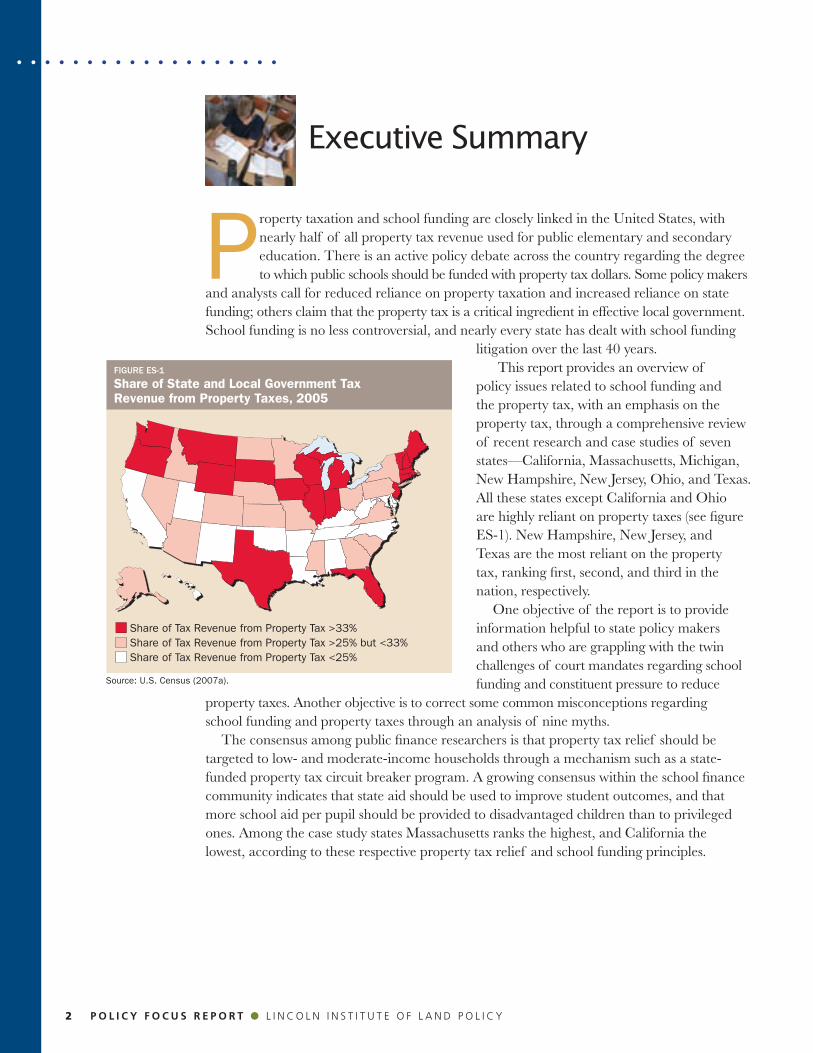
litigation over the last 40 years. This report provides an overview of policy issues related to school funding and the property tax, with an emphasis on the property tax, through a comprehensive review of recent research and case studies of seven states—California, Massachusetts, Michigan, New Hampshire, New Jersey, Ohio, and Texas. All these states except California and Ohio are highly reliant on property taxes (see figure ES-1). New Hampshire, New Jersey, and Texas are the most reliant on the property tax, ranking first, second, and third in the nation, respectively. One objective of the report is to provide information helpful to state policy makers and others who are grappling with the twin challenges of court mandates regarding school funding and constituent pressure to reduce
property taxes. Another objective is to correct some common misconceptions regarding school funding and property taxes through an analysis of nine myths. The consensus among public finance researchers is that property tax relief should be targeted to low- and moderate-income households through a mechanism such as a state-funded property tax circuit breaker program. A growing consensus within the school finance community indicates that state aid should be used to improve student outcomes, and that more school aid per pupil should be provided to disadvantaged children than to privileged ones. Among the case study states Massachusetts ranks the highest, and California the lowest, according to these respective property tax relief and school funding principles.
executive Summary
FIGURE ES-1
Share of State and Local Government Tax Revenue from Property Taxes, 2005
Share of Tax Revenue from Property Tax >33%Share of Tax Revenue from Property Tax >25% but <33%Share of Tax Revenue from Property Tax <25%
Source: U.S. Census (2007a).

� p o l i c y F o c u S r e p o r T ● L i n c o L n i n s t i t u t e o f L a n d P o L i c y K e n y o n ● T h e p r o p e r T y Ta x – S c h o o l F u n d i n g d i l e m m a �
. . . . . . . . . . . . . . . . . . .
P RoPERTy TAx – S ChooL FUnD Ing MyThS
Myth 1: School funding litigation reduces reliance on property taxation.Reality: School funding litigation has not significantly reduced reliance on property taxation for more recent court mandates or for states that replace local property taxation with state property taxation.
Myth 2: Property-poor school districts are also low-income districts.Reality: Communities with low per-pupil property values may be high-income communities just as communities with high per-pupil property values can be low-income.
Myth 3: The property tax is a regressive tax.Reality: Researchers agree the property tax is not generally regressive, and, to the extent that it is a tax on capital, can be progressive. Furthermore, the property tax is more progressive than the sales tax.
Myth 4: Property tax rates are a reasonable measure of property tax burden.Reality: Property tax rates are not a good measure of property tax burden because high tax rates can reflect a high level of local government services or restrictive zoning practices rather than low fiscal capacity; high tax rates can also reduce house prices, which partially compensates new homeowners for high taxes.
Myth 5: Reducing reliance on property taxation is usually beneficial.Reality: There are advantages to relying on property taxes; they provide stable revenue and promote local fiscal autonomy and civic engagement, among other virtues.
Myth 6: State supreme court school finance rulings rely directly on the language of state constitutions.Reality: No direct relationship exists between constitutional language and state supreme court school finance rulings; court mandates have differed markedly in two states with nearly identical constitutional language.
Myth 7: School funding litigation has been a generally effective means of improving education outcomes.Reality: Researchers generally find court-mandated school finance restructuring reduces within-state inequality in education spending per pupil, but they do not find a consistent impact on the level of school spending or on student achievement.
Myth 8: State aid for schools is one form of property tax relief.Reality: State aid for schools may or may not provide property tax relief, depending upon how it is structured. State-funded circuit breakers are more likely to achieve that relief.
Myth 9: State policy makers should aim to provide more than half of total K–12 funding.Reality: State policy makers should not aim to provide any specific percentage of the total fund-ing for K–12 education. Better policy goals focus on student achievement or limiting property tax burdens to some percentage of household income.
� p o l i c y F o c u S r e p o r T ● L i n c o L n i n s t i t u t e o f L a n d P o L i c y
. . . . . . . . . . . . . . . . . . .
K e n y o n ● T h e p r o p e r T y Ta x – S c h o o l F u n d i n g d i l e m m a �
c h a p t e r 1
Understanding the Links Between Property Taxation and School Funding
Property taxation and school fund-ing are closely linked in the United States. Independent school districts (those not dependent on city or
country governments) derive 96 percent of their tax revenues from property taxes, thus relying more heavily on property taxation than any other type of local government (Fisher 2007, 320). At the same time nearly half of the total property tax dollars collected in the United States are used to finance public elementary and secondary education. School funding and property taxation are so interconnected that those who are con-cerned about school finance find themselves examining the role of the property tax, and those who are interested in property taxation inevitably find they need to consider school finance questions. This report provides an overview of the critical issues at that intersection, with an emphasis on the role of the property tax.
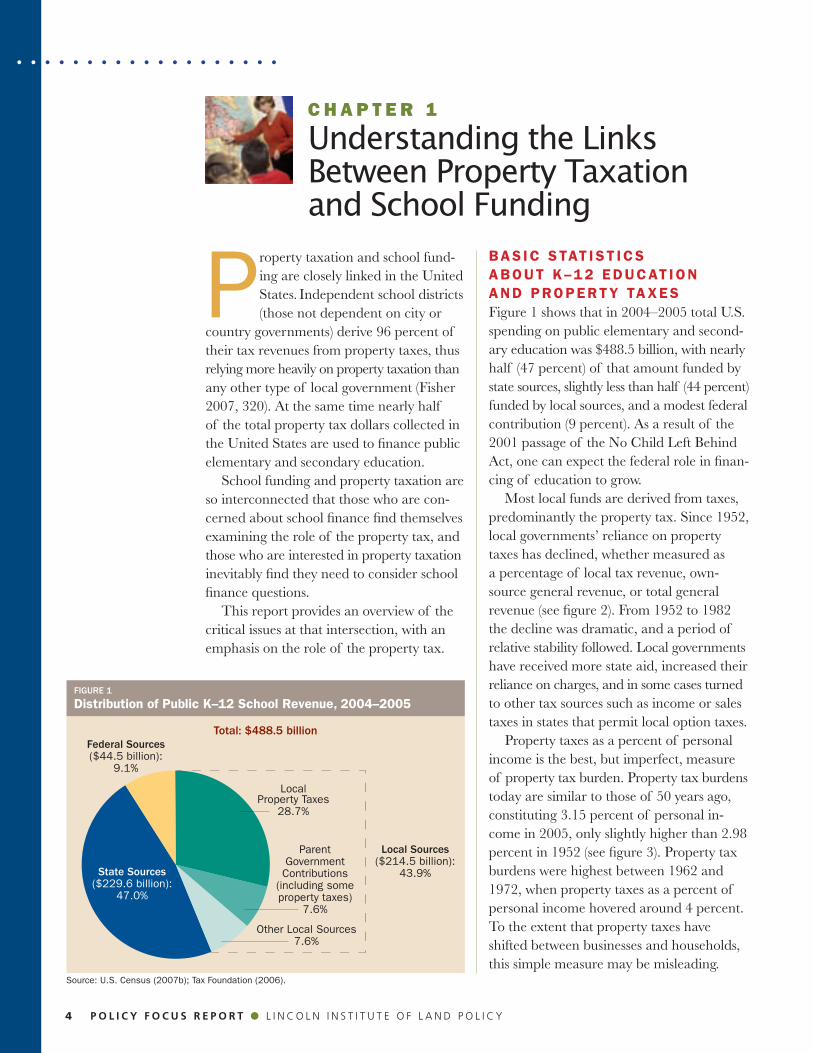
BAS IC S TAT IST ICS ABoUT K–12 E DUCAT Ion AnD P RoPERTy TAxESFigure 1 shows that in 2004–2005 total U.S. spending on public elementary and second-ary education was $488.5 billion, with nearly half (47 percent) of that amount funded by state sources, slightly less than half (44 percent) funded by local sources, and a modest federal contribution (9 percent). As a result of the 2001 passage of the No Child Left Behind Act, one can expect the federal role in finan-cing of education to grow. Most local funds are derived from taxes, predominantly the property tax. Since 1952, local governments’ reliance on property taxes has declined, whether measured as a percentage of local tax revenue, own-source general revenue, or total general revenue (see figure 2). From 1952 to 1982 the decline was dramatic, and a period of relative stability followed. Local governments have received more state aid, increased their reliance on charges, and in some cases turned to other tax sources such as income or sales taxes in states that permit local option taxes. Property taxes as a percent of personal income is the best, but imperfect, measure of property tax burden. Property tax burdens today are similar to those of 50 years ago, constituting 3.15 percent of personal in-come in 2005, only slightly higher than 2.98 percent in 1952 (see figure 3). Property tax burdens were highest between 1962 and 1972, when property taxes as a percent of personal income hovered around 4 percent. To the extent that property taxes have shifted between businesses and households, this simple measure may be misleading.
FIGURe 1
Distribution of Public K–12 School Revenue, 2004–2005
Total: $488.5 billionFederal Sources($44.5 billion):
9.1%
State Sources($229.6 billion):
47.0%
local Sources($214.5 billion):
43.9%
Local Property Taxes
28.7%
ParentGovernment Contributions
(including some property taxes)
7.6%
Other Local Sources7.6%
Source: U.S. Census (2007b); Tax Foundation (2006).

� p o l i c y F o c u S r e p o r T ● L i n c o L n i n s t i t u t e o f L a n d P o L i c y K e n y o n ● T h e p r o p e r T y Ta x – S c h o o l F u n d i n g d i l e m m a �
. . . . . . . . . . . . . . . . . . .
oPPoSIng V IEwS on LoCAL PRoPERTy TA x ES A n D SC hoo L FUnD Ing L I T I g AT I onStrong views on both property taxation and school finance abound. The boldest state-ments typically criticize local property taxes in general or their use for financing educa-tion. A recent review of policies in the New England states, a region that depends more heavily on property taxes than the rest of the country, is strongly critical of this reli-ance: “High property taxes—the burdens and perverse incentives they create, the rage they generate, the town-to-town school fund-ing inequities they proliferate—…represent an endless New England nightmare…” (Peirce and Johnson 2006). The authors recommend that New England states restructure their tax systems by reducing their reliance on property taxes and filling the revenue gap by increasing income and sales taxes. A review of school finance by two legal scholars reaches similar conclusions. “The ultimate goal for most states should be reduc-ing reliance on local property tax while increasing state funding” (Carr and Griffith 2005, 168). The authors recommend that state governments should provide at least 60 percent of the financial support for public schools. In 2004–2005 only 12 states met or exceeded this recommended threshold (see chapter 5). On the other side, some scholars con-clude that property taxation is an important revenue source for effective local govern-ment. Wallace Oates (2001, 29) states, “If we acknowledge the need for local taxation in some form to facilitate efficient local decision-making, the property tax seems the right choice, at least in the U.S.” William Fischel (2001a, 161) takes a stronger stand in favor of the local property tax when he states, “…there is evidence that loss of local property taxation reduces civic engagement generally.”
Source: Census of Governments (1952–2002), Annual Survey of Government Finances (2005); see Appendix for details.
Source: Census of Governments (1952–2002), Annual Survey of Government Finances (2005); see Appendix for details.
Litigation over school finance is no less controversial. Some groups applaud and advocate for state school funding lawsuits; others conclude that courts are interfering in legislative decisions and harming public policy. For example, the National Access Network at Columbia University notes that
FIGURe 2
Local government Property Taxes as a Percent of Various Local government Revenue Totals, 1952–2005
19
52
19
57
19
62
19
67
19
72
19
77
19
82
19
87
19
92
19
97
20
02
20
05
100%
90%
80%
70%
60%
50%
40%
30%
20%
10%
0%
Property Taxes as % of Total Local TaxesProperty Taxes as % of Own- Source General RevenueProperty Taxes as % of Total General Revenue
FIGURe 3
Local government Property Taxes as a Percent of Personal Income, 1952–2005
19
52
19
57
19
62
19
67
19
72
19
77
19
82
19
87
19
92
19
97
20
02
20
05
4.5%
4.0%
3.5%
3.0%
2.5%
2.0%
1.5%
1.0%
0.5%
0%

� p o l i c y F o c u S r e p o r T ● L i n c o L n i n s t i t u t e o f L a n d P o L i c y
. . . . . . . . . . . . . . . . . . .
K e n y o n ● T h e p r o p e r T y Ta x – S c h o o l F u n d i n g d i l e m m a �
in many states adequacy lawsuits “have led to better education and the stronger com-munities and economies that result from good schools” (ACCESS 2007b). In contrast, economist Eric Hanushek concludes in his book, Courting Failure: How School Finance Law-suits Exploit Judges’ Good Intentions and Harm Our Children, that “…no currently available evidence shows that past judicial actions about school finance—either related to equity or adequacy—have had a bene- ficial effect on student performance” (Hanushek 2006, xxiii-xxiv).
PRo PERT y TA x AT I on AnD SC hoo L FU n D I ng L I nKSThe links between property taxation and school funding are many and varied. One such link starts with a focus on education needs, and incorporates the preference for local autonomy and local involvement.
From this perspective the question is: What revenue source is best suited to support independent local governments, including school districts? Among the “big three” tax bases of sales, income, and property, prop-erty taxation is often seen as the most appro-priate source. Local governments face diffi-culties when they try to tax a mobile tax base, and the property tax base is generally less mobile than sales or income. Another rationale for relying on local property taxation is the concept of homevoters —voters whose home ownership gives them an incentive to carefully evaluate local school spending proposals and support those that enhance school quality at a reasonable cost in terms of taxes (Fischel 2001a). Another key link between the property tax and school funding is the disparity in per-pupil property wealth among school districts, and the possibility that disparities could lead to

� p o l i c y F o c u S r e p o r T ● L i n c o L n i n s t i t u t e o f L a n d P o L i c y K e n y o n ● T h e p r o p e r T y Ta x – S c h o o l F u n d i n g d i l e m m a �
. . . . . . . . . . . . . . . . . . .
State lawmakers restructuring school funding systems face difficulties in part because there are many definitions of
fairness in school funding. For example, John Yinger (2004, 9) sets out four possible goals of school finance reform:
• Equality: providing the same education in every school district;
• Wealth neutrality: providing school aid so that school district wealth and education spending are not correlated,
even after local spending behavior changes as a result of that aid;
• Access equality: ensuring that an increase in the tax rate has the same impact on per-pupil revenue in every district; and
• Adequacy: affording all students an education that meets some minimum standard.
Access equality focuses on fairness to taxpayers, while adequacy focuses on fairness to students. Property tax wealth is
a critical element both of wealth neutrality (explicitly) and access equality (implicitly). An adequacy standard focuses on the
situation of the school districts least able to provide some minimum level of education, but does not prevent high-income or
wealthy districts from providing superb schools. An equality standard, on the other hand, implies placing a limit on the resources
that high-income or wealthy districts may spend on their public education systems. In general over the 40 years of school
finance litigation, courts have tended to shift from standards of wealth neutrality or access equality to an adequacy standard.
The consensus of some school finance analysts is that “By and large, the attention paid by school finance reformers to
taxpayer equity is misguided. With limited fiscal resources in the public sector, we should concentrate our efforts on achieving
student-based rather than taxpayer-based equity” (Reschovsky 1994, 195).
Box 1
what Is a Fair School Funding System?
inequities for children or taxpayers. For ex-ample, children in property-rich districts may have access to better education than children in property-poor districts. Alterna-tively, certain taxpayers may be disadvan-taged if property-poor districts require higher tax rates than property-rich districts in order to finance the same quality of education. One can apply a number of definitions of fairness in restructuring a school funding system. Two definitions in particular—wealth neutrality and access equality—relate directly to the property tax (see box 1). But just as school finance lawsuits have shifted their focus over time from disparities in per-pupil pro-perty wealth to the needs of school children, so has the equity focus shifted from wealth neutrality and access equality to educational adequacy. The legislative response to court-imposed school funding mandates can (but does not have to) impact the property tax system. In
the process of restructuring, states can reduce reliance on property taxation for funding schools by increasing state aid, which is often funded through income or sales taxes. Alter-natively, states can reduce reliance on local property taxes and instead levy a statewide property tax at a fixed rate. From a political standpoint, pressure to provide adequate funding of schools and pressure to provide property tax relief are often intertwined. State school aid is some-times mentioned as one source of funding for local property tax relief. Taxpayers who want to see reductions in their property tax liabilities sometimes press state govern-ment for particular school finance restruc-turing measures. Steven Sheffrin (1998, 133) has observed that “Educational reform may have simply served as convenient political cover…for an underlying desire to shift the tax base away from property and toward other tax bases.”

� p o l i c y F o c u S r e p o r T ● L i n c o L n i n s t i t u t e o f L a n d P o L i c y
. . . . . . . . . . . . . . . . . . .
K e n y o n ● T h e p r o p e r T y Ta x – S c h o o l F u n d i n g d i l e m m a �
SC hoo L FU n D I ng L I T I gAT Ion S In CE Th E 1960sSince the 1960s, equity and adequacy concerns have prompted lawsuits across the country to challenge states’ school funding systems. Only five states have not had to contend with school funding lawsuits (Dela-ware, Hawaii, Mississippi, Nevada, and Utah). Some lawsuits have resulted in plaintiff victories; others have not. One of the most contentious aspects of school funding lawsuits is the appropriate line between judicial and legislative action (see box 2). Legislatures in some states have responded to court mandates by restructur-ing their systems of financing education; others have not. Figure 4 illustrates five categories of states with respect to litigation and school finance restructuring (see Appen-dix for data sources and discussion of the challenges of classifying states into these categories). The courts have been prominent players
in this 50-year drama, so histories of this issue often focus on changing legal theories or strategies, as does the summary below. However, it is important to note that some-times legislatures have acted to restructure education finance and tax structures without prodding from the courts, as in the case of Michigan. (This report is careful to use the term “restructure” rather than “reform” to describe large-scale changes in school finance systems because the term “reform” carries a positive connotation that is not always warranted.)
Early Need-Based Lawsuits Were Unsuccessful (1960s)The initial focus of school funding lawsuits was educational opportunity for disadvan-taged children. Some authors trace the roots of school finance litigation to Brown v. Board of Education of Topeka (1954) in which “sepa-rate but equal” schools were found to violate the equal protection clause of the United
“As school finance legislation grinds on…the line between the legislature and the judiciary frequently becomes almost
indistinct, with the legislature accusing the judiciary of encroaching on its turf and the judiciary accusing the legislature
of failing to fulfill its constitutional duty to properly fund schools” (Carr and Griffith 2005).
The separation of judicial, executive, and legislative powers is a basic part of our American system of government. James
Madison argued in The Federalist Papers that the separation of powers was essential for preserving the liberty of citizens.
Notwithstanding this national premise, states have reached very different decisions regarding the appropriate roles of
legislatures versus the courts in the realm of K–12 education.
In some states courts have rejected school funding lawsuits either because they did not view education as a fundamental
right or because they accepted that it was the legislature’s responsibility to make policy judgments about public education.
For example, when Massachusetts’ highest court removed itself from the school funding process, it noted, “Because deci-
sions about where scarce public money will do the most good are laden with value judgments, those decisions are best
left to our elected representatives” (Hancock v. Driscoll 2005).
Other state courts have made very specific policy judgments, including the dollar amount of K–12 spending (Kansas),
the form of the school aid formula (New Hampshire), permissible tax structure for funding education (New Hampshire and
Texas), and required curriculum (New Jersey).
Box 2
School Funding Lawsuits and Separation of Powers

� p o l i c y F o c u S r e p o r T ● L i n c o L n i n s t i t u t e o f L a n d P o L i c y K e n y o n ● T h e p r o p e r T y Ta x – S c h o o l F u n d i n g d i l e m m a �
. . . . . . . . . . . . . . . . . . .
States Constitution because they discrimi-nated among individuals on the basis of race (McDonald, Kaplow, and Chapman 2006; Odden and Picus 2000; Starr 2007). In Brown Chief Justice Earl Warren emphasized the critical importance of public education:
Today, education is perhaps the most important function of state and local governments…In these days, it is doubt-ful that any child may reasonably be expected to succeed in life…if denied the opportunity of an education.
Many school finance cases also rest on equal protection claims, but instead of focusing on race, as Brown did, they have focused on economic status. The first lawsuits challenging school finance systems occurred in the late 1960s. In McInnis v. Shapiro (1968), an Illinois case, the plaintiffs charged that the state failed to distribute education aid based on the educa-tional needs of the districts. Burrus v. Wilkerson (1969) was a similar Virginia suit, also filed in federal court. In each case the federal court rejected the claims “on the ground that it could not discern judicially manage-able standards to gauge what students’ needs were and whether they were being met” (Minorini and Sugarman 1999, 37). Litigants appealed both cases to the United States Supreme Court, which affirmed lower court rulings. The failure of these early cases led lawyers concerned with school finance equity to seek a new approach to litigation.
Equitable Finance of Education Sought in Federal and State Courts (Late 1960s to 1973) This second wave of more successful school funding lawsuits was based on the theory that school spending per pupil should not depend on the school district’s property wealth. Evi-dence was put forward comparing school districts with low property wealth, high tax
rates and low per pupil spending to other school districts with high property wealth, low tax rates, and high per pupil spending. Plaintiffs compared a pair of school districts in Los Angeles County: Beverly Hills, an affluent district with high assessed value per pupil, a low tax rate, and high per pupil spending; and Baldwin Park, a poor district with low assessed value per pupil, a high tax rate and low per pupil spending (see table 1). Of course, not all school districts across the country fit this pattern (Odden and Picus 2000, 22).
Source: Author calculations based on ACCESS (2007a), Sielke et al. (2001), and various state government Web sites; see Appendix for details.
FIGURE 4
School Finance Restructuring by State
Subject to a highest court mandate that prompted school finance restructuring
Subject to a highest court mandate that did not prompt school finance restructuring
Restructuring without a highest court mandate
No court mandate and no school finance restructuring
No school finance litigation and no restructuring
TaBle 1
Comparison of Selected California School Districts, 1968–1969
Pupils (#)
Assessed Value per Pupil Tax Rate
Expenditure per Pupil
Beverly hills 5,542 $50,885 $2.38/$1,000 $1,232
Baldwin Park 13,108 $3,706 $5.48/$1,000 $577
Source: Serrano v. Priest (1971) as quoted in Odden and Picus (2000, 12).

�0 p o l i c y F o c u S r e p o r T ● L i n c o L n i n s t i t u t e o f L a n d P o L i c y
. . . . . . . . . . . . . . . . . . .
K e n y o n ● T h e p r o p e r T y Ta x – S c h o o l F u n d i n g d i l e m m a ��
From the late 1960s until 1973, lawsuits challenging state school funding systems on equal protection grounds were brought in both state and federal courts. The most significant decision of this era was Califor-nia’s Serrano v. Priest (1971), in which the California Supreme Court found that the state’s school funding system violated the equal protection clauses of both the federal and California constitutions. The most significant defeat of this era (for supporters of school funding lawsuits) was the United States Supreme Court’s 1973 decision in San Antonio Independent School District v. Rodriguez. In that case the court decided school funding disparities in Texas did not violate the equal protection clause of the United States Constitution. In a 5–4 deci-sion, the court held that education was not a fundamental right and property wealth per pupil was not a suspect class. Rodriguez effectively shut the door on federal school funding lawsuits. From 1973 on, those working to obtain equitable school funding through litigation shifted their efforts to state courts.
Equitable Finance of Education Sought in State Courts (1973 to 1989)This period of school finance litigation also rested on equal protection claims, but under state constitutions. The Rodriguez ruling did not overturn Serrano v. Priest because it was also based on a state constitution. Moreover, the California court reaffirmed its finding on the basis of the state’s constitution in Serrano II (1976). This wave of school finance litigation con-tinued to focus on interdistrict disparities in property tax bases and the resulting inequa-lities in per pupil school spending, but the ratio of plaintiff victories to lawsuits filed was low. Beginning in 1989, plaintiffs shifted to a different approach that enabled them to overturn more states’ school funding systems.
Adequate Education Sought in State Courts (since 1989)With the 1989 Rose v. Council for Better Educa-tion, Inc. decision in Kentucky, school finance suits moved to a focus on adequacy and to claims arising from education clauses in state constitutions. One typical state con-stitution education clause found in both New Hampshire and Massachusetts requires the state legislature to “cherish” education. Under the adequacy theory, the focus shifted to the claim that state government must assure that all children in the state have the opportunity to receive an adequate education. During this period, the ratio of plaintiff victories to cases filed increased significantly. There are two major differences between adequacy and equity targets. First, an ade-quacy target puts greater emphasis on out-comes. That is, it tends to focus on the quality of education received by school children rather than on the amount spent per child. Second, an adequacy target emphasizes an absolute rather than a relative standard. Instead of focusing on inequality in school spending among districts, which is one focus of some equity lawsuits, adequacy lawsuits ask whether all children are able to receive an education that meets some absolute stan-dard (Evans, Murray, and Schwab 2001, 214). Although there are conceptual distinc-tions between equity and adequacy, and between claims and cases based on equal protection and those deriving from a state’s education clause, in practice these distinc-tions are often blurred. The difficulty in categorizing school funding lawsuits as either equity or adequacy suits is illustrated in the state case studies in chapter 2.
A New Era of Increasing Judicial Humility? At least one scholar believes we are now entering a new era in which courts have begun to doubt their competence to effect

�0 p o l i c y F o c u S r e p o r T ● L i n c o L n i n s t i t u t e o f L a n d P o L i c y K e n y o n ● T h e p r o p e r T y Ta x – S c h o o l F u n d i n g d i l e m m a ��
. . . . . . . . . . . . . . . . . . .
reform of school finance systems and the legitimacy of their involvement (McMillan 1998). Another researcher describes “recent hints of judicial humility,” which he divides into three types (Heise 2007). First, the court may decline jurisdiction. For example, the Illinois Supreme Court declined to rule the state’s school funding system unconstitutional, arguing that the question of educational quality is properly the responsibility of the legislature, not the courts. Second, the court may accept jurisdiction, but find that no vio-lation exists, as in Nebraska’s 1993 decision in Gould v. Orr. Finally, the court may accept jurisdiction, find a violation, but decline involvement in specific questions, such as the proper division between state and local funding. Recent statements by policy analysts at both ends of the political spectrum describe
increasing numbers of court decisions in favor of defendants. Dunn and Derthick (2007a, 11) note that:
Over the past two years, the highest courts of New York, Texas, and Mas-sachusetts have decided to end or limit their support for adequacy plaintiffs…While these decisions do not spell the end of adequacy lawsuits, they suggest that judges may be growing weary of being asked to solve the intractable problems afflicting the states’ poorest-performing school districts.
At the other end of the political spec-trum, a report of a recent speech by Michael Rebell, executive director of the National Access Network, describes a media blitz by “right-wing organizations that oppose public education” (ACCESS 2007c).
�� p o l i c y F o c u S r e p o r T ● L i n c o L n i n s t i t u t e o f L a n d P o L i c y
. . . . . . . . . . . . . . . . . . .
K e n y o n ● T h e p r o p e r T y Ta x – S c h o o l F u n d i n g d i l e m m a ��
This report continues:
It is not a coincidence, Rebell said, that this blitz coincided with the largest number of negative court decisions in recent years, with six of eleven court decisions in the past twelve months being against plaintiffs.
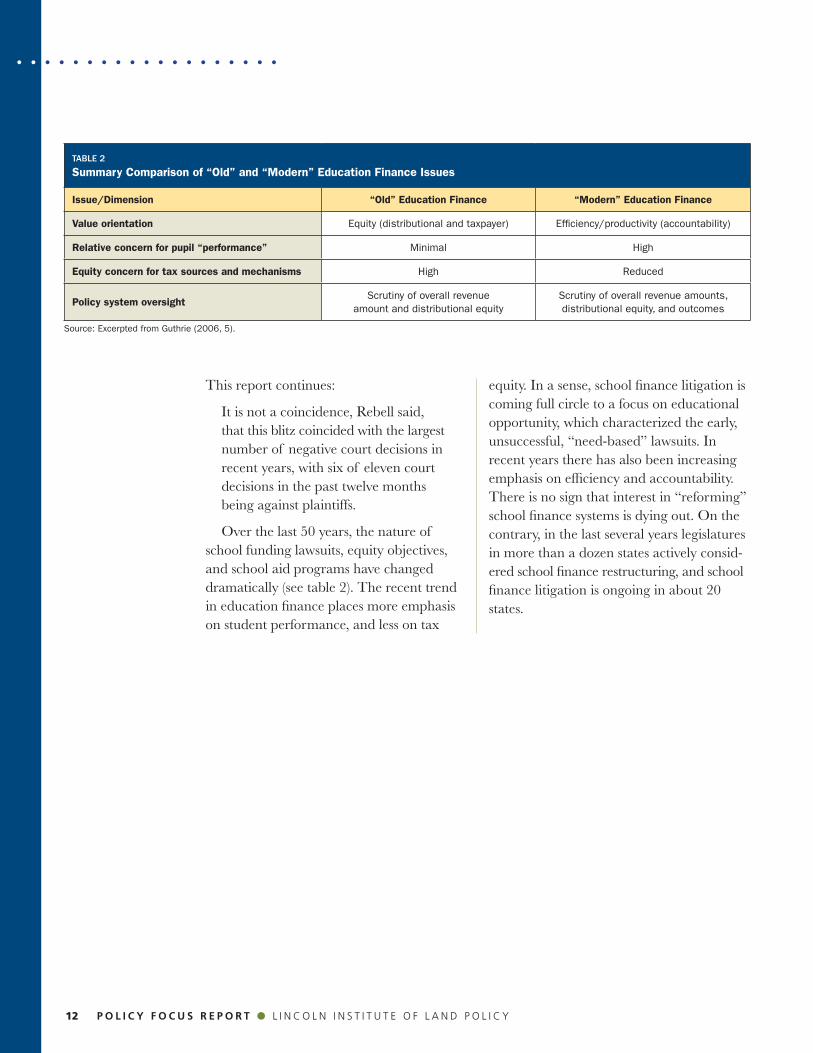
Over the last 50 years, the nature of school funding lawsuits, equity objectives, and school aid programs have changed dramatically (see table 2). The recent trend in education finance places more emphasis on student performance, and less on tax
TaBle 2
Summary Comparison of “old” and “Modern” Education Finance Issues
Issue/Dimension “old” Education Finance “Modern” Education Finance
Value orientation Equity (distributional and taxpayer) Efficiency/productivity (accountability)
Relative concern for pupil “performance” Minimal High
Equity concern for tax sources and mechanisms High Reduced
Policy system oversightScrutiny of overall revenue
amount and distributional equityScrutiny of overall revenue amounts, distributional equity, and outcomes
Source: Excerpted from Guthrie (2006, 5).
equity. In a sense, school finance litigation is coming full circle to a focus on educational opportunity, which characterized the early, unsuccessful, “need-based” lawsuits. In recent years there has also been increasing emphasis on efficiency and accountability. There is no sign that interest in “reforming” school finance systems is dying out. On the contrary, in the last several years legislatures in more than a dozen states actively consid-ered school finance restructuring, and school finance litigation is ongoing in about 20 states.

�� p o l i c y F o c u S r e p o r T ● L i n c o L n i n s t i t u t e o f L a n d P o L i c y K e n y o n ● T h e p r o p e r T y Ta x – S c h o o l F u n d i n g d i l e m m a ��
. . . . . . . . . . . . . . . . . . .
I nTRoDUCT Ion A n D FRAMEwoRK Fo R EVALUAT I on
Case studies of school funding sagas in seven states help the reader ap-preciate the complexity of each state’s school funding story. The
six states facing court mandates regarding school funding (California, New Jersey, Texas, Massachusetts, New Hampshire, and Ohio) are analyzed first, in order of the date of their first (or only) highest state court mandate. Michigan, the only case study state to restruc-
c h a p t e r 2
Case Study States
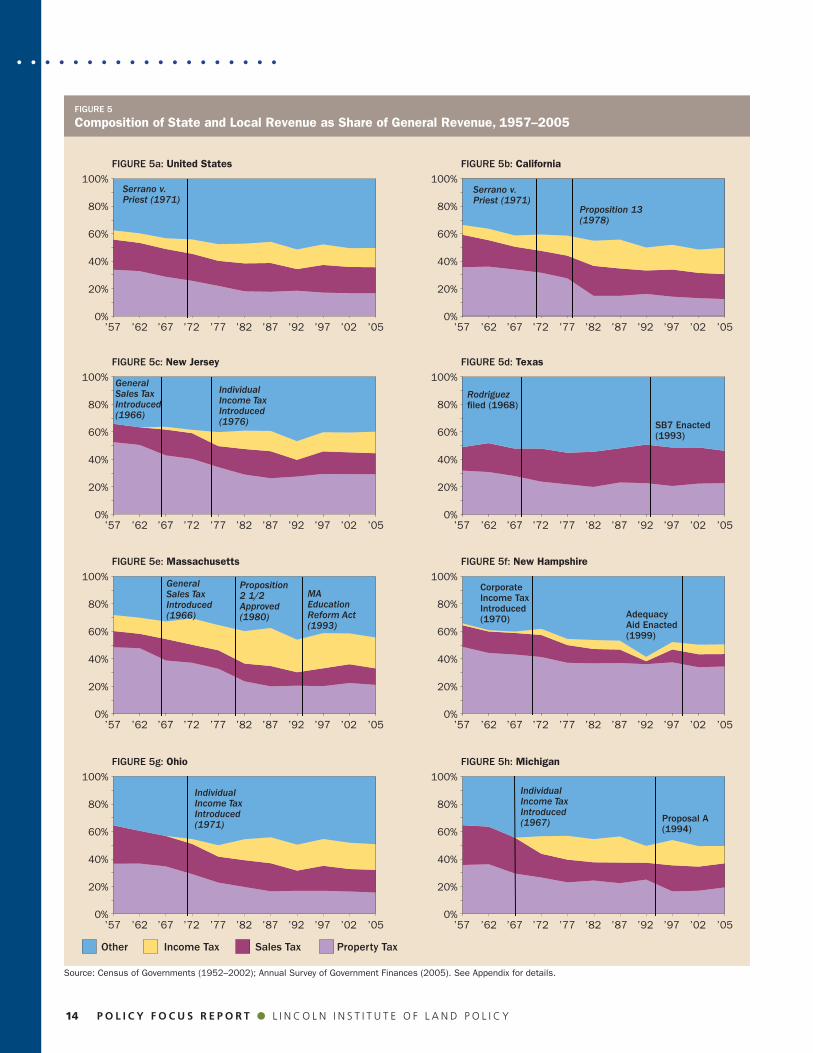
ture its school funding system without a court mandate, is analyzed last. This chapter highlights the relationship in each state between school funding litigation and restructuring, if any, and its degree of reliance on property taxation (see figure 5). Each of the states has faced difficult issues related to use of the property tax for school funding, but otherwise they are quite different (see table 3). California educates 6.4 million students with nearly 6,000 students per school district,
TaBle 3
School Finance in a nutshell, Case Study States
california Massachusetts Michigan New hampshire New Jersey Ohio texas
Reliance on property tax, 2005. State and local property taxes as percent of total state and local taxes; state rank (U.S. average 30.6%)
23.2% (41st) 36.0% (12th) 36.6% (10th) 61.4% (1st) 45.1% (2nd) 28.7% (30th) 43.8% (3rd)
Spending per pupil and rank, 2003, adjusted for regional cost differences; state rank
$6,765 (42nd)
$8,921 (13th)
$8,646 (16th)
$8,186 (23rd)
$10,908 (1st)
$8,735 (15th)
$7,570 (35th)
number of school districts, 2005–2006
1,128 495 831 264 669 1,044 1,268
number of students, 2005–2006 6,437,202 971,909 1,741,845 205,767 1,395,602 1,839,683 4,525,394
Students/district, 2005–2006 5,707 1,964 2,096 779 2,086 1,762 3,569
Percent limited English proficiency, 2005–2006
24.4% 5.3% 3.8% 1.2% (2004-5) 3.6% 1.6% 15.7%
Percent special education, 2005–2006
10.5% 15.4% 14.1% 14.8% 26.7% 14.5% 11.3%
Percent eligible for free or reduced-price meals, 2005–2006
47.6% 28.2% 35.0% 17.1% 26.8% 32.5% 48.2%
graduation rates, 2003–2004 70.7% (30th) 73.2% (23rd) 69.1% (34th) 76.0% (15th) 82.5% (2nd) 74.7% (20th) 67.3% (36th)
2007 national Assessment of Educational Progress test, percent scoring at or above basic; state rank
Math -- 4th grade 69.6% (50th) 93.2% (1st) 79.9% (34th) 91.3% (2nd) 89.6% (4th) 87.5% (10th) 87.4% (12th)
Reading -- 4th grade 53.2% (48th) 81.1% (1st) 66.2% (30th) 76.0% (3rd) 77.2% (2nd) 73.3% (10th) 65.8% (31st)
Math -- 8th grade 59.1% (47th) 85.0% (2nd) 66.4% (37th) 77.6% (10th) 77.5% (12th) 76.4% (16th) 77.6% (11th)
Reading -- 8th grade 62.3% (49th) 83.9% (3rd) 72.1% (32nd) 81.9% (7th) 81.1% (8th) 79.4% (13th) 73.0% (31st)
Source: U.S. Census, Education Weekly Research Center, National Center for Education Statistics, National Assessment of Educational Progress, EditorialProjects in Education Research Center. See Appendix for details.
�� p o l i c y F o c u S r e p o r T ● L i n c o L n i n s t i t u t e o f L a n d P o L i c y
. . . . . . . . . . . . . . . . . . .
K e n y o n ● T h e p r o p e r T y Ta x – S c h o o l F u n d i n g d i l e m m a ��
Source: Census of Governments (1952–2002); Annual Survey of Government Finances (2005). See Appendix for details.
FIGURe 5
Composition of State and Local Revenue as Share of general Revenue, 1957–2005
100%
80%
60%
40%
20%
0%
Serrano v. Priest (1971)
FIGURe 5a: United States
’57 ’62 ’67 ’72 ’77 ’82 ’87 ’92 ’97 ’02 ’05
other Income Tax Sales Tax Property Tax
100%
80%
60%
40%
20%
0%
Serrano v. Priest (1971)
FIGURe 5b: California
’57 ’62 ’67 ’72 ’77 ’82 ’87 ’92 ’97 ’02 ’05
100%
80%
60%
40%
20%
0%
FIGURe 5c: new Jersey
’57 ’62 ’67 ’72 ’77 ’82 ’87 ’92 ’97 ’02 ’05
100%
80%
60%
40%
20%
0%
Rodriguez filed (1968)
FIGURe 5d: Texas
’57 ’62 ’67 ’72 ’77 ’82 ’87 ’92 ’97 ’02 ’05
100%
80%
60%
40%
20%
0%
FIGURe 5e: Massachusetts
’57 ’62 ’67 ’72 ’77 ’82 ’87 ’92 ’97 ’02 ’05
100%
80%
60%
40%
20%
0%
FIGURe 5f: new hampshire
’57 ’62 ’67 ’72 ’77 ’82 ’87 ’92 ’97 ’02 ’05
100%
80%
60%
40%
20%
0%
FIGURe 5g: ohio
’57 ’62 ’67 ’72 ’77 ’82 ’87 ’92 ’97 ’02 ’05
100%
80%
60%
40%
20%
0%
FIGURe 5h: Michigan
’57 ’62 ’67 ’72 ’77 ’82 ’87 ’92 ’97 ’02 ’05
Proposition 13 (1978)
Individual Income Tax Introduced (1976)
General Sales Tax Introduced (1966)
SB7 enacted (1993)
General Sales Tax Introduced (1966)
Proposition 2 1/2 Approved (1980)
MA Education Reform Act (1993)
Corporate Income Tax Introduced (1970) adequacy
aid enacted (1999)
Individual Income Tax Introduced (1971)
Individual Income Tax Introduced (1967) Proposal a
(1994)

�� p o l i c y F o c u S r e p o r T ● L i n c o L n i n s t i t u t e o f L a n d P o L i c y K e n y o n ● T h e p r o p e r T y Ta x – S c h o o l F u n d i n g d i l e m m a ��
. . . . . . . . . . . . . . . . . . .
while New Hampshire educates just over 200,000 total students and about 800 students per district. Almost half of California and Texas students are eligible for free or reduced-price meals, an indicator of low income, whereas only 17 percent of New Hampshire students are eligible for this program. New Jersey ranks first in the nation for spending per pupil adjusted for regional cost differences, in contrast to California which ranks forty-second. All the case study states except Cali-fornia and Ohio are highly reliant on property taxes, but New Hampshire, New Jersey and Texas are the most reliant, ranking first, second, and third in the nation, respectively, in 2005. The framework for evaluating these case studies reflects the growing consensus of the school finance community regarding both student achievement and property tax relief.
Student AchievementSchool aid should be used to improve student outcomes. For example, the School Finance Design Project at the University of Washington states, “…better student outcomes (academic achievement and other performance indica-tors such as graduation rates) should be the ultimate objective of changes in school finance systems” (Hansen et al. 2007, 12). This implies property tax relief is not the primary objective of school aid.
Equitable school aid provides more aid to disadvantaged children than to privileged ones. Ladd and Hansen (1999, 44) state:
The increasing importance of education to success in the labor market highlights the significance of disparities in educa-tional opportunity. Of particular concern are continuing gaps in academic achieve-ment related to background charac-teristics of students, such as race and family income.
These educational disparities have con-crete implications for state aid for education. Specifically, state aid should be structured to reflect the fact that certain students, such as those from low-income families or those with special education needs, require more resources to educate than other students.
Property Tax ReliefSome households pay an extraordinarily high amount of property taxes in relation to their income. For example, a recent study of Maine found that about a third of homeowners pay more than 6 percent of their income in property taxes (Allen and Woodbury 2006). Many tax analysts argue that it makes sense to target property tax relief to low- and moderate-income households that face large property tax burdens relative to their income (Allen and Woodbury 2006; Bowman 2006).

�� p o l i c y F o c u S r e p o r T ● L i n c o L n i n s t i t u t e o f L a n d P o L i c y
. . . . . . . . . . . . . . . . . . .
K e n y o n ● T h e p r o p e r T y Ta x – S c h o o l F u n d i n g d i l e m m a ��
Litigation and Restructuring History Concerns that the quality of children’s edu-cation should not depend upon the property wealth in their communities motivated California’s Serrano v. Priest (1971) case. Five years later, in Serrano II, the court ruled that disparities related to property wealth among school districts meant that financing K–12 education through the local property tax violated the state’s equal protection clause (see table 4). Although the Serrano decisions began with a focus on wealth neutrality, over time the focus changed to spending equality. In Serrano III the state high court ruled that spending dis-parities among districts that were $100 per pupil or less (later modified to $198) consti-
tuted evidence that the new school funding system satisfied the requirements of the constitution (Tractenberg 2006). By an unlucky coincidence, the years just after Serrano II found the state legislature grappling with the need to pass substantial property tax relief in response to escalating property values, assessed values, and prop-erty taxes. Although it seemed that the state government’s surplus should have facilitated a political solution, William Fischel (1996; 2001a) argues that the constraints on con-stitutionally permissible property tax relief imposed by Serrano II blocked its passage and made possible the victory of Howard Jarvis’ Proposition 13. Among the most important components of Proposition 13 were a reduc-
CALIFoRnIAthe Impetus to three Decades of State School Funding Litigation

�� p o l i c y F o c u S r e p o r T ● L i n c o L n i n s t i t u t e o f L a n d P o L i c y K e n y o n ● T h e p r o p e r T y Ta x – S c h o o l F u n d i n g d i l e m m a ��
. . . . . . . . . . . . . . . . . . .
TaBle 4
California Event Timeline
Date Significant Event
1971 Serrano v. Priest I: the California Supreme Court ruled education a fundamental constitutional right
1976 Serrano v. Priest II: the California Supreme Court found that wealth-related disparities in per-pupil spending violated the constitution’s equal protection clause
1978 Proposition 13 limited property taxes to 1 percent of assessed value, rolled assessments back to 1975–1976 levels, limited annual assessment increases until properties are sold, and required two-thirds approval of voters for new special taxes
1986 Proposition 62 mandated new local government taxes receive approval of a majority of local voters and two-thirds of the governing body
1986 Serrano v. Priest III found that the state’s equal protection clause was satisfied by the then-existing situation in which per-pupil spending in nearly all districts varied by $100 or less
tion of property tax rates to 1 percent of assessed value, a rollback of assessed values to 1975 levels, and a subsequent 2 percent annual cap on growth in assessed values, except upon sale.
Reliance on Property TaxCalifornia has never relied on the property tax more than the U.S. average (see figures 5a and 5b). After Proposition 13 the state’s reliance on property taxation fell significantly, while its reliance on income taxation increased. This shift has reduced the stability of state and local revenues. “During the last recession, California tax revenue declined from $76 billion in 2000–2001 to $63 billion in the following year. This 17 percent loss in general fund revenue was almost entirely composed of a loss in personal income tax revenue due to a reduction in realized stock options and capital gains” (Wassmer 2006, 13).
Special Features of State HistorySome argue that the reduction in the dis-parity in spending per pupil among school
Source: ACCESS (2007a) and state government Web sites.
districts is a positive outcome of California’s school finance restructuring. However, because total school spending fell at the same time, several analysts have noted that the more equitable distribution of revenue among school districts was achieved “more by level-ing down high-spending districts than by raising low-spending ones” (Public Policy Institute of California 2000; Hoxby 2001). While disparities in spending have declined across districts, disparities in test scores have not changed significantly (Rueben 2006). In fact, California’s test scores, which were equal to the United States average prior to the late 1970s, are now among the lowest (Brunner and Sonstelie 2006, 73). Although Proposition 13 remains popular with voters, California’s centralized system of school funding and governance gets low ratings. In 2007, a bipartisan group of state leaders concluded that the “school finance system in California is overly complicated, extremely inefficient, and actually hindering the ability of schools to provide a quality education” (ACCESS 2007a).

�� p o l i c y F o c u S r e p o r T ● L i n c o L n i n s t i t u t e o f L a n d P o L i c y
. . . . . . . . . . . . . . . . . . .
K e n y o n ● T h e p r o p e r T y Ta x – S c h o o l F u n d i n g d i l e m m a ��
Litigation and Restructuring History New Jersey also has had a long history of school funding litigation. The New Jersey Supreme Court ruled in Robinson v. Cahill (1973) that the state’s system of education funding was unconstitutional because it did not meet the requirement to be “thorough and efficient.” To comply with the court’s mandate the legislature enacted the 1975 Public School Education Act, but did not appropriate funds to implement it. In response, the court enjoined school spending (over the summer recess) until the legislature met the court’s mandate. The legislature complied, and enacted the state’s first personal income tax to do so. A decade later a second strand of court challenges, known as the Abbott cases, was initiated by the Education Law Center fo-cused more narrowly on educational out-comes for particular disadvantaged children. The Center was dissatisfied with the legis-lative response to the Robinson rulings, con-vinced it would not “cure the wide gap in funding between urban and suburban schools” (Education Law Center 2007). The head of the Center filed the challenge and the plaintiffs (which came to be known as Abbott districts) were 28 lower-wealth urban school districts, including Camden and Jersey City. The 1990 Abbott II ruling required enough additional spending for the Abbott districts to make per-pupil spending in those districts “substantially equivalent” to per-pupil spending in high property wealth districts (see table 5). Abbott districts have made some progress, but litigation has continued. Proponents of school funding litigation in New Jersey claim: “Students in many of New Jersey’s low-income, urban districts have made great strides”
(ACCESS 2007e). Critics of New Jersey’s school funding history note that “New Jer-sey continued to lag far behind other states in closing the achievement gap between white and black students” (Hess 2007, 28–29).
Reliance on Property TaxThe state’s reliance on property taxation is less than in the 1970s, but still consider-ably exceeds the national average, and has increased in recent years (see figure 5c). Property tax burdens have ranked high on the political agenda, at least since 1999 (Carr and Griffith 2007, 557). After meeting in a special summer session in 2006, the legi-slature issued nearly 100 recommendations, including capping school district spending, reducing public employee benefits, consoli-dating school districts, increasing school aid, and providing property tax relief (Brunori 2006; ACCESS 2007a). In February 2007, the legislature approved $2 billion in prop-erty tax cuts and a 4 percent cap on local government tax increases (Smothers 2007).
Special Features of State HistoryA notable aspect of New Jersey’s highest court rulings is their specificity. For example, Abbott V mandated that school children in the disadvantaged Abbott districts receive full-day kindergarten and half-day preschool, improved school facilities, curriculum reform using the whole-school reform model, and supplements such as after-school and sum-mer-school programs. New Jersey’s overall education system merits praise for high state average test scores and graduation rates. On the other hand, those interested in efficien-cy note per-pupil spending (adjusted for regional cost differences) is the highest in the nation.
nEw JERSEyadoption of an Income tax and Detailed Judicial Mandates

�� p o l i c y F o c u S r e p o r T ● L i n c o L n i n s t i t u t e o f L a n d P o L i c y K e n y o n ● T h e p r o p e r T y Ta x – S c h o o l F u n d i n g d i l e m m a ��
. . . . . . . . . . . . . . . . . . .
TaBle 5
new Jersey Event Timeline
Date Significant Event
1973 Robinson v. Cahill (Robinson I): New Jersey Supreme Court ruled the existing school funding system violated the education clause of the state constitution
1976 New Jersey enacted its first personal income tax in order to fund a restructured school aid program; Robinson VII repealed Robinson VI that had enjoined all school spending until legislature complied with the previous court mandate
1985 Abbott v. Burke (Abbott I) ruled the school funding system unconstitutional; the state must assure urban children an education enabling them to compete with their suburban peers
1990 Abbott II required the legislature to amend its school funding program to ensure “substantially equivalent” per-pupil spending in Abbott districts compared with property-rich districts
1998 Abbott V mandated a timetable of specific reforms regarding early education, elementary school curriculum, supplemental programs, and classroom facilities
2003 Abbott X ordered parties to mediation
Source: ACCESS (2007a) and state government Web sites.

�0 p o l i c y F o c u S r e p o r T ● L i n c o L n i n s t i t u t e o f L a n d P o L i c y
. . . . . . . . . . . . . . . . . . .
K e n y o n ● T h e p r o p e r T y Ta x – S c h o o l F u n d i n g d i l e m m a ��
TExASDecades of Litigation and a New Business tax
Litigation and Restructuring HistorySixteen years after Rodriguez, Texas’ first significant school funding discussion (see chapter 1), the state’s highest court found the school funding system unconstitutional. In Edgewood I (1989) the court ruled that the system must ensure “substantially equal access to similar revenues per pupil at similar levels of tax effort” (Hansen et al. 2007, 32). It took
six years for the legislature to pass a consti-tutional school funding system known as SB7, which still forms the state’s basic structure (see table 6). Under SB7 there are three primary tiers of school aid. The first tier is a foundation aid program that mandates that local gov-ernments levy a specific local property tax rate. Those districts that cannot fund the basic allotment per student at this tax rate receive foundation aid. The second tier is a guaranteed tax base grant that sends matching funds to districts with low per-pupil property bases. The third tier, termed a “recapture” or “Robin Hood” provision, requires that districts with per-pupil property values greater than $305,000 per weighted pupil must share their resources with property poor districts if they raise revenues above a certain level. Because the state did not adjust the founda-tion level or brackets of the school funding system in the years following SB7’s enactment, the state’s share of school funding declined and local school districts gradually ended up funding a greater percentage of total K–12 spending through local property taxes (Hansen et al. 2007, 19–20). In Neeley v. West Orange-Cove (2005) the Texas Supreme Court again declared the state’s school funding system unconstitu-tional. As local school districts provided an increasing share of total school revenues, their rates increased and a number of the districts approached the $1.50 per $100 state cap. When a large proportion of school districts lost their ability to lower property tax rates (because they needed the revenue) or raise property tax rates (because of the state tax cap), the Supreme Court ruled the school funding system violated the Texas constitutional prohibition against state

�0 p o l i c y F o c u S r e p o r T ● L i n c o L n i n s t i t u t e o f L a n d P o L i c y K e n y o n ● T h e p r o p e r T y Ta x – S c h o o l F u n d i n g d i l e m m a ��
. . . . . . . . . . . . . . . . . . .
TaBle 6
Texas Event Timeline
Date Significant Event
1973Rodriguez: United States Supreme Court ruled education not a fundamental interest and closed the door on equal protection challenges to state school funding systems under United States Constitution
1989 Edgewood I: Texas Supreme Court ruled state’s school funding system unconstitutional
1993 Texas legislature passed SB7 which included new school funding and accountability systems
1995 Edgewood IV: Texas Supreme Court found restructured school funding system constitutional
2005Neeley v. West Orange-Cove: Texas Supreme Court found school funding system effectively created state property tax in violation of state constitution
2006Legislature reduced local property taxes and replaced the business franchise tax with broad-based margin tax
property taxation. The court declared local property taxes had been effectively trans-formed into a state tax (Carr and Griffith 2006, 796).
Reliance on Property TaxIn 2006 the legislature added new sources of state revenue, including higher cigarette taxes and a new business tax, to lessen the reliance of school funding on local property taxes. Analysts have estimated the cuts in property taxes exceed the increase in state tax revenues by as much as $5 billion annually, and there are concerns that the new school aid system may have a structural deficit (Hamilton 2007b). It is too soon to tell whether this legislation will significantly reduce the state’s reliance on property taxation. So far this reliance has declined only slightly over the state’s school funding litigation history (see figure 5d).
Special Features of State HistorySchool funding litigation in Texas has focused more on tax questions than on whether students are receiving an adequate education. For the most part education reform has operated on a separate track. The Edgewood cases focused on tax equity,
as many of the early state cases did, and the West Orange-Cove case rested on a tax pro-vision peculiar to the Texas Constitution. An empirical test of the distribution of state school aid found that Texas’ school funding system did a reasonable job of en-suring access equality or tax equity, but did not do as well in ensuring educational ade-quacy. For example, once the additional costs of educating low-income children are taken into account, more state aid per pupil is effectively distributed to districts with smaller proportions of low-income children than to those with higher proportions of low-income children (Imazeki and Reschovsky 2004). With respect to school reform, “Texas committed itself early to a standards-based approach to school improvement and to holding districts and schools accountable for results…Texas is often cited as an exemplar of a consistent, coherent approach to edu-cation reform that has resulted in demon-strable improvements in student achievement” (Hansen et al. 2007, 15). For example, stu-dent scores on the National Assessment of Educational Progress test rose significantly from 1991 to 2005 (Hansen et al. 2007, 17).
Source: ACCESS (2007a) and state government Web sites.

�� p o l i c y F o c u S r e p o r T ● L i n c o L n i n s t i t u t e o f L a n d P o L i c y
. . . . . . . . . . . . . . . . . . .
K e n y o n ● T h e p r o p e r T y Ta x – S c h o o l F u n d i n g d i l e m m a ��
MASSAChUSETTSSuccessful School Finance restructuring and property tax revolt
Litigation and Restructuring HistoryIn 1980 Massachusetts voters approved a citizens’ initiative known as Proposition 2½, which limited the level and growth of prop-erty taxes (see table 7). Local property taxes may not exceed 2.5 percent of the value of all assessed property in the municipality, and taxes may increase no more than 2.5 percent per year. The legislation reduced reliance on the local property tax and local revenues, which led to increased state aid. The tax limitation’s impact was blunted by growth in the economy and two impor-tant modifications subsequently enacted by the legislature. One amendment put prop-erty taxes on new construction outside of the levy limit of 2.5 percent per year; another allowed local voters to approve exceptions to the 2.5 percent annual limit through either permanent overrides or temporary exclusions for debt or capital expenditures.
More than 25 years after its enactment, analysts find that Proposition 2½ has had “a smaller impact than either its supporters had hoped or its detractors had feared” (Cutler, Elmendorf, and Zeckhauser 1997, 2, 9–10). Although the plaintiffs filed suit in 1978, it was not until 1993 that the Supreme Judi-cial Court ruled in McDuffy that the state was not meeting its constitutional duty to provide an adequate education for all stu-dents. Importantly, in that case the court imposed no specific remedy on the legisla-ture. 1993 was also the year when a major education restructuring measure, the Mas-sachusetts Education Reform Act (MERA), was enacted. MERA set ambitious standards for achievement, established a new school funding formula, and increased state aid to schools. The new school aid was highly targeted to needy districts, and the state share of school funding increased modestly.

�� p o l i c y F o c u S r e p o r T ● L i n c o L n i n s t i t u t e o f L a n d P o L i c y K e n y o n ● T h e p r o p e r T y Ta x – S c h o o l F u n d i n g d i l e m m a ��
. . . . . . . . . . . . . . . . . . .
TaBle 7
Massachusetts Event Timeline
Date Significant Event
1980 Proposition 2½ (property tax limit) passed
1982 Proposition 2½ went into effect
1993McDuffy: Massachusetts’ highest court declared the state was in violation of its constitutional duty on education
1993 Massachusetts Education Reform Act passed
2005 Hancock v. Driscoll decision removed highest court from school funding deliberations
Since 1993, despite backlash against the high-stakes high school graduation tests and other aspects of school reform, many test scores have risen. Indeed, in 2007 Massachusetts’ fourth grade reading and math scores on the National Assessment of Educational Progress were the highest in the nation (see table 3). A second school funding suit, Hancock v. Driscoll, was settled in 2005, when the Su-preme Judicial Court “lifted its 1993 finding of Constitutional violation and decisively terminated 27 years of litigation” (Costrell 2005, 1). The court’s key finding was that:
The public education system we review today…is not the public education sys-tem reviewed in McDuffy…A system mired in failure has given way to one that, although far from perfect, shows a steady trajectory of progress. (Costrell 2005, 23)
Reliance on Property TaxThe share of general revenue derived from property taxes dropped steeply after the passage of Proposition 2½ and the share derived from income taxes rose (see figure 5e). For a few years after the 1993 passage of MERA, the relative shares of revenue from property and income taxation stayed almost the same. More recently, reliance on local property
taxes has increased. From 1996 to 2006, the average single-family property tax bill increased in both constant and current dollars. In addition, the share of the tax burden borne by residential property tax owners increased from 68 percent in 1999 to 72 percent in 2005. These changes can be attributed to rising residential property assessments, stagnant property values and assessments in the commercial and indus-trial sectors, and flat state aid budgets (Dressel 2005, 3). A related issue is the tendency of the state to increase local aid when it is experiencing revenue growth, and to cut state aid during recessions so that, “[i]n the face of the state aid rollercoaster, local communities have had to rely increas-ingly on the property tax to buffer the vicissitudes of the Commonwealth’s local assistance” (Bluestone, Clayton-Matthews, and Soule 2006, 25).
Special Features of State HistoryIn Massachusetts, property tax reform and school finance restructuring have operated on separate tracks. Proposition 2½ was en-acted more than a decade before the highest court ruled the state’s system of education funding unconstitutional, and a constitu-tional clause requiring “proportional and reasonable taxation,” played no role in the state’s high court school funding decisions.
Source: ACCESS (2007a) and state government Web sites.

�� p o l i c y F o c u S r e p o r T ● L i n c o L n i n s t i t u t e o f L a n d P o L i c y
. . . . . . . . . . . . . . . . . . .
K e n y o n ● T h e p r o p e r T y Ta x – S c h o o l F u n d i n g d i l e m m a ��
Litigation and Restructuring HistoryBeginning in 1993, the New Hampshire Supreme Court issued a number of decisions mandating changes in the state’s system of school funding (see table 8). Most important, the court ruled that the state had a constitu-tional duty to provide or guarantee an ade-quate education for each child, and to fund that education using taxes that are “propor-tional and reasonable.” As noted earlier, Massachusetts also has a “proportional and reasonable” clause, but it did not play a role in that state’s school finance lawsuits or restructuring. In 1999 New Hampshire dramatically changed its system of school aid, and enacted
the largest tax increase in state history to do so (Gottlob and Kenyon 2005,1). The state moved from a poorly funded state aid pro- gram that was highly targeted to needy com-munities, to a better funded program that was much less targeted. To finance the 1999 increase in state aid, the state increased taxes on business, tobacco, rooms, meals, and rental cars. A statewide property tax provided half of the necessary funding for the new school aid system (Hall 2003). For the most part, the statewide property tax consisted of relabeled local property tax dollars, levied and retained by local govern-ments. A small fraction of the statewide property tax levied by the towns with the
nEw hAMPShIREa Statewide property tax and Ongoing Litigation

�� p o l i c y F o c u S r e p o r T ● L i n c o L n i n s t i t u t e o f L a n d P o L i c y K e n y o n ● T h e p r o p e r T y Ta x – S c h o o l F u n d i n g d i l e m m a ��
. . . . . . . . . . . . . . . . . . .
TaBle 8
new hampshire Event Timeline
Date Significant Event
1993 Claremont I: New Hampshire Supreme Court ruled the state has a constitutional duty to guarantee/provide each child with an adequate education
1997 Claremont II ruled the state must fund an adequate education with proportional and reasonable taxes
1999 Legislature restructured system of school funding with substantially increased school aid funded half from tax increases and half from a new state property tax
2002 Claremont IV ruled that the state must establish an education accountability system
2005 Legislature enacted a new school aid system that lowered reliance on state property tax and eliminated most donor towns
2006 Londonderry: New Hampshire Supreme Court ruled the new school funding system unconstitutional
highest per-pupil property taxes was sent to the state by towns known as donor towns. Towns receiving aid became known as recipient towns. Shortly after the legislature enacted the 1999 system of school funding, donor towns formed a coalition to eliminate the state-wide property tax and donor tax payments. Their efforts bore fruit when the legislature enacted a new school funding formula in 2005 that eliminated all but a few donor towns. In reaction, a new coalition of towns losing aid under the 2005 formula filed a lawsuit. In Londonderry (2006) the Supreme Court ruled the new school funding law was unconstitutional because it did not define an adequate education. The court gave the legislature until the end of the 2007 fiscal year to remedy this shortcoming (Colquhoun 2006; Olabisi 2006). In June 2007, the legis-lature enacted a definition of an adequate education and set to work to determine its cost.
Reliance on Property TaxNew Hampshire is notable, among other things, for being the state most reliant upon property taxation for state-local revenue. It derives 61 percent of its state-local taxes from
property taxation compared to 31 percent for the average state. Reliance on property taxation decreased only slightly after the 1999 education finance restructuring, largely due to the state’s use of a state property tax to fund about half of its restructured school aid program (see figure 5f). New Hampshire is one of several states, including Michigan, which enacted a state property tax as part of its school finance restructuring.
Special Features of State HistoryPrior to 1999, New Hampshire provided 8 percent of total K–12 funding and ranked last among the states in the percentage of total K–12 funding contributed by state aid (Hall 2003). The state is also notable in the specificity of its court mandates on school funding. Over the years the court has man-dated that the state “define an adequate education, determine its cost, fund it with constitutional taxes, and ensure its delivery through accountability.” In addition, the Londonderry ruling mandates that “Whatever the State identified as comprising constitu-tional adequacy it must pay for. None of that financial obligation can be shifted to local school districts, regardless of their relative wealth or need.”
Source: ACCESS (2007a) and state government Web sites.

�� p o l i c y F o c u S r e p o r T ● L i n c o L n i n s t i t u t e o f L a n d P o L i c y
. . . . . . . . . . . . . . . . . . .
K e n y o n ● T h e p r o p e r T y Ta x – S c h o o l F u n d i n g d i l e m m a ��
ohIoModest reforms and Judicial Backtracking
Litigation and Restructuring HistoryDisparities in per-pupil property wealth ex-acerbated by layoffs in the steel industry and the closing of coal mines led to the creation of the Coalition of Rural and Appalachian Schools. This group later expanded to in-clude urban as well as rural districts, and is now known as the Ohio Coalition for Equity and Adequacy in School Funding (E & A Coalition). In 1991, the E & A Coalition filed its first adequacy lawsuit. This case was based on the “equal protection and benefit” and “thorough and efficient” clauses of the Ohio Constitution (McKinley 2005a, 302). The latter clause states:
The general assembly shall make such provisions, by taxation or otherwise, as with the income arising from the school trust fund and will secure a thorough and efficient system of common schools throughout the state.
In 1997, in the first of the DeRolph decisions, the Ohio Supreme Court in a 4–3 decision
found the school funding system unconsti-tutional (see table 9). The court cited insuffi-cient state funding for school building and overreliance on property taxation as two of the system’s flaws (McKinley 2005a, 311). In 2000, despite subsequent increases in state aid for school construction, the court in DeRolph II again found the funding system unconstitutional (McKinley 2005b, 326). In 2001, in DeRolph III, the state’s highest court modified its ruling in light of changes in the school funding formula and signifi-cant political pressure from the executive and legislative branches of state government and several major newspapers. DeRolph III ruled the school funding system would be constitutional with some additional funding. Significantly, Supreme Court justices in Ohio are elected for six-year terms and the first two DeRolph decisions played a critical role in the 2000 judicial election campaign (McKinley 2005b). In the following year the Ohio Supreme Court vacated the 2001 decision, once again

�� p o l i c y F o c u S r e p o r T ● L i n c o L n i n s t i t u t e o f L a n d P o L i c y K e n y o n ● T h e p r o p e r T y Ta x – S c h o o l F u n d i n g d i l e m m a ��
. . . . . . . . . . . . . . . . . . .
TaBle 9
ohio Event Timeline
Date Significant Event
1997 DeRolph I: Ohio Supreme Court ruled the education funding system unconstitutional
2000DeRolph II again ruled the education funding system unconstitutional; Legislature modified the school funding formula
2001 DeRolph III found the new funding system constitutional as long as funding is increased
2002DeRolph IV vacated DeRolph III, found the school funding system unconstitutional, and refused jurisdiction over subsequent appeals
2003State v. Lewis (also known as DeRolph V) granted writ of prohibition sought by the state, ending the jurisdiction of the Ohio trial court over DeRolph matters
2003 E & A Coalition filed a writ of certiorari with United States Supreme Court asking it to review State v. Lewis
2003 United States Supreme Court refused to hear the appeal of State v. Lewis
finding the school funding system unconsti-tutional. However, in this ruling (DeRolph IV ), the court refused jurisdiction over subsequent appeals. In 2003, in DeRolph V (also known as State v. Lewis) the Ohio Supreme Court closed off opportunities for the plaintiffs to appeal to the trial court. The E & A Coali-tion plaintiffs appealed this decision to the United States Supreme Court, but that Court refused to take the case.
Reliance on Property TaxOhio’s reliance on property taxes is slightly less than the U.S. average (see figure 5g). Ohio reduced its reliance on property taxation from 1957 to 1987, while increasing its reliance on income taxes. From 1987 to 2005, Ohio did not significantly change its reliance on property taxes as a source of general revenue. Of particular interest given the focus of this report is the disagreement among Ohio chief justices regarding reliance on property taxes for school funding. In DeRolph II, Justice Resnick declared:
The most glaring weakness in the State’s attempts to put in place a thorough and efficient system of education is the
failure to specifically address the over-reliance on local property taxes. If this problem is not rectified, it will be vir-tually impossible for the school-funding system to be characterized as thorough and efficient. (McKinley 2005b, 328)
In contrast, the majority opinion in DeRolph III ruled that it is constitutionally permissible for the school funding system to rely partially on local property taxes, and notes certain positive attributes of property tax financing, that is, that property tax reve-nues are less susceptible to economic cycles than income or sales taxes (McKinley 2005b, 348).
Special Features of State HistoryOhio is one of only three states (with Alabama and North Carolina) in which a state court mandate did not lead to school finance restructuring. Unlike most states, Ohio allows both local option sales and income taxes (National Conference of State Legislatures 2002, 5). A few school districts levy a modest income tax (Sielke et al. 2001).
Source: ACCESS (2007a) and state government Web sites.

�� p o l i c y F o c u S r e p o r T ● L i n c o L n i n s t i t u t e o f L a n d P o L i c y
. . . . . . . . . . . . . . . . . . .
K e n y o n ● T h e p r o p e r T y Ta x – S c h o o l F u n d i n g d i l e m m a ��
Litigation and Restructuring HistoryIn the early 1970s, the Michigan Supreme Court found the school funding system in violation of the United States Constitution, but effectively reversed its decision a year later in Milliken v. Green. For almost two decades, Michigan voters considered and defeated a series of proposals to restructure property taxes and school funding. Finally in 1993 the state legislature (temporarily) eliminated the property tax as a source of operating revenue for public schools. Voters had two alternatives for the 1994 election: one, known as Proposal A, increased reliance on the sales tax to pay for schools, and the other proposed increased
MIChIgAnSchool Finance restructuring Without a court Mandate
reliance on income taxation. Voters adopted Proposal A, which included an increase in the sales tax, a new state property tax for edu-cation, a lower required local property tax rate for funding school operating expenses, and a cap on annual increases in property assessments (see table 10). Evaluation of Michigan’s school finance restructuring is mixed. For those concerned about Michigan’s above-average reliance on property taxation and the disparities in per-pupil spending among school districts, Pro-posal A is considered an improvement. It raised total school spending, particularly in the districts that had previously expended the least amount of money per pupil. Before

�� p o l i c y F o c u S r e p o r T ● L i n c o L n i n s t i t u t e o f L a n d P o L i c y K e n y o n ● T h e p r o p e r T y Ta x – S c h o o l F u n d i n g d i l e m m a ��
. . . . . . . . . . . . . . . . . . .
TaBle 10
Michigan Event Timeline
Date Significant Event
1972Governor v. State Treasurer: Michigan Supreme Court found the school funding system in violation of United States Constitution
1973 Milliken v. Green: Michigan Supreme Court vacated its 1972 decision
1972–1993 Michigan voters rejected a series of property tax and school finance restructuring ballot proposals
1993Legislature eliminated property tax as a source of operating revenue for public schools (partially reversed in 1994 with passage of Proposal A)
1994 Constitutional amendment to restructure school funding approved by voters (Proposal A)
restructuring, per-pupil spending was below $6,700 in 512 districts; after restructuring no school district spent less than $6,700 per pupil (Michigan Department of Treasury 2002, 35). However, because the new school aid system does not take into account variations in the costs of educating different pupils or intrastate differences in the cost of living, some do not view Proposal A as an improve-ment. For example, after Proposal A the lowest-income communities received smaller aid increases than middle-income communities. Some analysts argue that suburban districts and most rural districts are better off after Proposal A, but most central city and low-income districts are worse off (Arsen and Plank 2003).
Reliance on Property TaxPrior to Proposal A, Michigan’s reliance on property taxation exceeded the U.S. average, but afterwards it was comparable (see figure 5h). Remaining property tax burdens shifted from homeowners to non-homeowners (or owners of second homes). The state’s respon-sibility for funding K–12 education increased a great deal, and local discretion was signifi-cantly limited. For example, individual school
districts are now prohibited from asking voters to approve higher property taxes for school operating expenses.
Special Features of State HistoryMichigan’s school finance restructuring is one of the most dramatic in the United States. Inequities in education finance and concern over property tax burdens moti-vated the restructuring, but it is clear that concern over the property tax was the primary issue. One continuing concern is that Michi-gan’s new school funding system has made school aid more vulnerable to economic downturns. The state is facing a serious financial crisis, including a large structural budget deficit and downgrades in its credit rating. In April 2007, Governor Jennifer Granholm ordered $122 per-pupil, end-of-the-year cuts in state aid to education. Days before the cuts were to go into effect, the legislature agreed to shift funds from the state budget, already in deficit, to eliminate the proposed cuts (Christoff and Bell 2007). Although the legislature enacted a new business tax in July 2007, analysts say that this does not eliminate the state’s budget deficit (Hamilton 2007a).
Source: ACCESS (2007a) and state government Web sites.

�0 p o l i c y F o c u S r e p o r T ● L i n c o L n i n s t i t u t e o f L a n d P o L i c y
. . . . . . . . . . . . . . . . . . .
K e n y o n ● T h e p r o p e r T y Ta x – S c h o o l F u n d i n g d i l e m m a ��
The earlier summary of school fund-ing litigation from the 1960s to the present and these case studies show the limits of any simple taxonomy.
In addition to the familiar equity and ade-quacy categories, one needs to consider additional dimensions of state court deci-sions. For example, tax-specific aspects of high court rulings are very important in both New Hampshire and Texas. Some high court rulings focus only on capital spending rather than on operating spending (e.g., Arizona, Colorado, Idaho, Louisiana, and New Mexico) (ACCESS 2007d). Court deci-sions can also address all school districts in the state or a subset of districts, as in New Jersey’s Abbott rulings, which focus on a particularly needy subset of school dis- tricts (see table 11). A further difficulty for lawmakers is that state courts have not always been clear in their choice of equity standards. One legal
scholar describes “a tendency, among some courts, to slip back and forth among these standards without realizing the distinctions between them” (Lukemeyer 2003, 19). This can be especially problematic when two ob-jectives that may be mutually contradictory are chosen simultaneously. For example, the objective of New Hampshire’s school finance restructuring appears to be a reduc-tion in “inequities in educational opportu-nity for students in different school districts and inequities in tax burden imposed on taxpayers in different school districts” (Hall and Minard 2003, 19). One standard focuses on students and the other on taxpayers. The specificity of the state court man-dates is another important dimension. For example, Massachusetts had one of the more general mandates, but those in New Hampshire and New Jersey include specific requirements about curriculum, capital construction, permissible tax structures, and school aid formulas (see figure 6).
I n S Igh TS FRo M ThE CASE STUD IES
TaBle 11
Summary of State highest Court School Funding Rulings, Case Study States
State
Type of Ruling Total number of highest Court Rulings
Equity Adequacy Additional Focus
California 1971, 1976 2
Massachusetts 1993, 2005 2
Michigan 1972, 1973 19971997 ruling concerns services
for special education3
new hampshire1993, 1997, 1999,
2002, 2006Funding must be financed by
proportional and reasonable taxes5
new Jersey 1973, 19761990, 1994, 1997, 1998, 2000, 2000, 2002, 2003, 2005
Adequacy rulings focus on subset of urban school districts (Abbott districts); 2000 ruling concerned capital funding
11
ohio 1976 1997, 2000, 2002, 2003 5
Texas 1989, 1991, 1992, 1995 2003, 2005 Prohibition against state property tax 6
Source: West and Peterson (2007, 345–358); author updates from news accounts.

�0 p o l i c y F o c u S r e p o r T ● L i n c o L n i n s t i t u t e o f L a n d P o L i c y K e n y o n ● T h e p r o p e r T y Ta x – S c h o o l F u n d i n g d i l e m m a ��
. . . . . . . . . . . . . . . . . . .
Source: ACCESS (2007a); various court rulings.
FIGURE 6
State Supreme Court Rulings Range Widely
OhioDeRolph IV (2002)
found system unconstitutional
but refused jurisdiction over subsequent
appeals
CaliforniaSerrano cases
mandated near-equality of school spending
among districts
New HampshireCourt issued
four-part mandate including funding with constitutional taxes
MassachusettsMcDuffy imposed
no specific remedy; Hancock removed court from further
deliberations
TexasEdgeworth mandated
access equality, West Orange enforced
constitutional prohibition of state
property tax
New JerseyAbbott V mandated a timetable of specific
reforms including particular curricular
changes and supplemental
programs
Increasingly specific mandates
Supreme court upheld school finance system
Supreme court found system
unconstitutional but did not enforce
Supreme court found system
unconstitutional but mandated no specific remedy
Supreme court found system
unconstitutional and imposed one specific mandate
Supreme court found system
unconstitutional plus imposed other specific mandates
MichiganCourt vacated
1972 decision of unconstitutionality
in 1973 after Rodriguez

�� p o l i c y F o c u S r e p o r T ● L i n c o L n i n s t i t u t e o f L a n d P o L i c y
. . . . . . . . . . . . . . . . . . .
K e n y o n ● T h e p r o p e r T y Ta x – S c h o o l F u n d i n g d i l e m m a ��
My Th 1 : SChooL FUnDIng LITIgATIon–PRoPERTy TAx LInKS Because one frequent objective of school funding lawsuits is to reduce reliance on property taxation, some policy analysts argue that a significant portion of the decline in the importance of property taxation in state-local revenue systems in recent years is due to those lawsuits. Testing this hypothesis using regression analysis and Census data, Bahl, Sjoquist, and Williams (1990, 170) conclude:
Our empirical analysis suggests that a result of adverse court rulings and the reform of state financing systems is an increase in the state share of educa-tional financing and a decreased reli-ance on the use of the property tax for that purpose.
A more recent empirical exercise attempts to examine the impact of court mandated school finance restructuring on property tax reliance (Murray and Rueben 2007). This study focuses only on the 36 states with inde-pendent school districts, because the school funding structure in other states makes it im-possible to determine the extent to which property taxes are used for education. That is, when school districts are dependent upon parent governments, there is no clear way to determine whether property tax revenues are used for education or for other revenue needs of the government. Between 1972 and 2002, independent school district states reduced their reliance on property taxes to fund K–12 education by 13.2 percentage points, from 43.6 to 30.4 percent. To investigate whether court mandated school reform has contributed to this decline,
Murray and Rueben carefully classify states as those with early court mandates (before 1989, when the adequacy wave began) or late court mandates. They separately investigate the impact of tax limits on property tax reli-ance and perform their calculations including and excluding California, so the California experience alone does not control the results (see figure 7). When California is excluded, court man-dated school reform appears to have had a modest impact on the degree to which inde-pendent school district states rely on prop-erty taxation in the early years, and negli-gible impact in more recent years. Comparing independent school district states that collectively reduced their reliance on property taxation for funding schools 13.2 percentage points between 1972 and 2002, those with early court mandated school reform (except California) reduced their reli-ance 15.9 percentage points, and those with late court mandated school reform reduced their reliance 12.4 percentage points. States with no court mandated school reform re-duced their reliance on property taxation 12.1 percentage points. Thus Bahl, Sjoquist, and Williams’ 1990 finding about the rela-tionship between school finance litigation and property tax reliance apparently no longer holds for the later court cases.
c h a p t e r 3
Five Property Tax Myths
Myth 1: School funding litigation reduces
reliance on property taxation.
reaLIty: School funding litigation has not
significantly reduced reliance on property
taxation for more recent court mandates
or for states that replace local property
taxation with state property taxation.

�� p o l i c y F o c u S r e p o r T ● L i n c o L n i n s t i t u t e o f L a n d P o L i c y K e n y o n ● T h e p r o p e r T y Ta x – S c h o o l F u n d i n g d i l e m m a ��
. . . . . . . . . . . . . . . . . . .
FIGURe 7
Percentage Point Decrease in K–12 Spending from Property Taxes in Independent School District States, 1972–2002
0.0%
-5.0%
-10.0%
-15.0%
-20.0%
-25.0%
-30.0%
-35.0%
-40.0%Total
Independent School District
States
California Early Court Mandated
School Reform, with California
Early Court Mandated School Reform, without
California
No Court Mandated
School Reform
Late Court Mandated
School Reform
-35.6
-19.9
-15.9
-12.4 -12.1-13.2
Source: Murray and Rueben (2007).
TaBle 12:
has Property Tax Reliance Decreased as a Result of Court Mandates?
State Court Mandate
Decrease in Property Taxes as Percent of general Revenue
from Mandate to 2004–2005 notes
California Serrano (1971) 18.1% (from 30.7% to 12.6%) Property tax has essentially been converted to state tax
MassachusettsNo mandate; McDuffy (1993)
issued in same year as legislative reform enacted
-0.5% (from 20.5% to 21.0%)Reliance on property tax decreased significantly from implementation of Proposition 2½ (1982) to 1993
Michigan No mandate; Proposal A (1994) 4.2% (from 23.5% to 19.3%) Deliberate shift from property tax to sales tax
new hampshire Claremont (1997) 3.4% (from 37.8% to 34.4%) Remains the state most reliant on property tax
new Jersey Robinson (1973) 11.2% (from 40.1% to 28.9%)Reliance on property tax decreased from court
mandate until 1987, then increased
ohioDeRolph (1997) (Supreme Court
backtracked from mandate)1.0% (from 16.5% to 15.5%) Reliance on property tax already less than U.S. average
TexasEdgewood Independent School
District (1989)0 (from 22.9% to 22.9%) State constitution prohibits use of state property tax
Source: Author computations from the Census of Governments (1972–1997); Annual Survey of Government Finances (2005).
The seven case studies in this report provide no simple story about the relation-ship between reliance on property taxation and court school funding mandates (see table 12). California, the state with the first supreme court mandate, decreased reliance on the property tax by the greatest degree (18.1 percent). However, Michigan, the state
with the third largest drop (4.2 percent), had no court mandate. New Hampshire avoided significantly reducing its reliance on property taxation by enacting a state property tax in place of a significant proportion of local property taxes. In Ohio and Texas, reliance on property taxation essentially remained unchanged after their high court mandates.

�� p o l i c y F o c u S r e p o r T ● L i n c o L n i n s t i t u t e o f L a n d P o L i c y
. . . . . . . . . . . . . . . . . . .
K e n y o n ● T h e p r o p e r T y Ta x – S c h o o l F u n d i n g d i l e m m a ��
My Th 2 : Low PRoPERTy VALUE EqUALS Low InCoME There is a tendency to equate property-wealthy districts with high-income districts and property-poor districts with low-income districts. Using the shorthand of “rich” to stand for property-wealthy and “poor” to stand for property-poor tends to create this confusion. A community’s per-pupil property value depends on the magnitude of industrial and commercial property that shares the prop-erty tax burden with homeowners. Low-income communities may have a larger share of industrial and commercial property than high-income communities, as in the case of central cities (Odden and Picus 2000, 151). Conversely, many suburbs with high-income residents have little commercial and indus-trial property. Sometimes this is a result of exclusionary zoning policies, which inten-tionally zone out commercial and industrial uses that might affect quality of life, but can create a community with low per-pupil property values (Kenyon 2003).
Available empirical evidence indicates a mild positive correlation between per-pupil property wealth and median household income. Fischel (2001a, 133–134) cites data for Connecticut, New Hampshire, New York, and Washington state that indicate a weak positive correlation between property value per pupil and household income. Using 2002 New Hampshire data, I found the correla-tion between equalized property value per pupil and median household income for New Hampshire towns to be only 0.11 (Kenyon 2003, 645). Additional studies of this question for other states would be useful. In addition, many communities con- tain households of varying income levels. Sonstelie, Brunner, and Ardon (2000, 28) looked at the distribution of assessed value per pupil by family income. One study in California found that 20 to 30 percent each of low-, middle-, and high-income families lived in districts with per-pupil assessed values lower than 75 percent of the median, and a similar percentage of each income level lived in districts with per-pupil assessed values higher than 125 percent of the median.
The community of Lincoln,
new hampshire, is pro-
perty wealthy but income
poor. The median family
income in 2000 was
$28,000, the lowest for
any town in the state. At
the same time, the large
ski area and associated
condominiums made the
per-pupil property value
so high that from 1999
to 2005, Lincoln was
one of the state’s
“donor towns.”

�� p o l i c y F o c u S r e p o r T ● L i n c o L n i n s t i t u t e o f L a n d P o L i c y K e n y o n ● T h e p r o p e r T y Ta x – S c h o o l F u n d i n g d i l e m m a ��
. . . . . . . . . . . . . . . . . . .
Sending school aid to a community with low per-pupil assessed value is thus apt to benefit families of all income levels (Brunner and Sonstelie 2006). Perhaps because of this recognition that per-pupil property value is not a perfect in-dicator of a community’s fiscal situation, many states use income together with prop-erty value per pupil to measure community fiscal need in their school funding formulas. Furthermore, a prominent education finance text recommends that a proper measure of school district fiscal capacity include house-hold income in addition to measures of prop-erty value (Odden and Picus 2000, 151).
MyTh 3 : REgRESSIVITy oF ThE PRoPERTy TAxMany policy analysts and legislators con-sider the property tax regressive—a tax in which higher-income households pay a smaller percentage of their income in taxes than do lower-income households (Giertz 2006, 701). The general consensus among economists is just the opposite, although they disagree on their rationale for this conclusion (Fisher 2007, 358–362; Rosen 2005, 522–529; Bow-man 2006, 51–53). Economists no longer claim, as they once did, that the property tax is clearly regressive. Many policy makers may believe the property tax is regressive because this was the general consensus of economists between the mid-1940s and the mid-1960s (Groves 1945; Netzer 1966 quoted in Fisher 2007, 358). An alternative explanation is simply
that the general public defines “regressivity” differently from economists, using the term to mean “unfair” (Youngman 2002). Early theories of the property tax burden treated property taxes like sales taxes, which impact people’s budgets through their effects on prices. For example, early property tax analyses assumed residential property taxes increased housing prices. When it was noted that housing expenditures constituted a larger proportion of annual income for low-income households than for high-income households, it followed that the residential property tax was a regressive tax (Fisher 2007, 358). The professional consensus that the prop-erty tax was regressive began to unravel in the 1970s, when Peter Mieszkowski reevalu-ated the property tax, examining its perva-siveness across the United States and char-acterizing it as a tax on capital (Zodrow 2001, 79). This new approach also account-ed for the possibility that capital or labor could move in reaction to higher property taxes. Mieszkowski concluded that the aver-age property tax burden across the country had a progressive impact, similar to the impact of the corporate income tax. Only deviations from the average burden could have a progressive or regressive impact, depending upon the extent to which busi-nesses or households relocated to avoid the tax. A further conclusion of this approach is that
…it is impossible to state with certainty the single effect from lowering (or raising) property taxes…the expected result of any property tax change depends both on what all jurisdictions are doing simultaneously and on how individuals respond. (Fisher 2007, 357)
To the extent that property tax increases negatively impact land values, their impact will tend to be progressive; to the extent
Myth 2: Property-poor school districts
are also low-income districts.
reaLIty: Communities with low per-pupil
property values may be high-income com-
munities just as communities with high per-
pupil property values can be low-income.

�� p o l i c y F o c u S r e p o r T ● L i n c o L n i n s t i t u t e o f L a n d P o L i c y
. . . . . . . . . . . . . . . . . . .
K e n y o n ● T h e p r o p e r T y Ta x – S c h o o l F u n d i n g d i l e m m a ��
that property tax increases negatively im-pact wages, they will tend to be regressive. But even this prediction must be qualified, as property tax increases could lower wages in high-income jurisdictions (hence having a predominantly progressive impact) or in low-income jurisdictions (with a predomi-nantly regressive impact). The view of the
erty taxation has a predominantly progres-sive impact. The benefit view concludes the property tax is not regressive because the concept of regressivity is simply not applicable. Furthermore, many economists argue that lifetime income, not annual income, is the appropriate measure of income to use when estimating the burden of the pro-perty tax. Empirical studies of property tax burdens are less apt to find regressive burdens when they use lifetime income rather than annual income (Fisher 2007, 360). How can the use of lifetime be jus-tified? If households purchase a home based on a lifetime view of their income prospects, then the burden of the tax should be considered in the same way. For example, a young physician might purchase a house considered expensive in light of her current income, but she is likely making the purchase in the context of her expected lifetime income, not her current income. Conversely, a retiree with relatively low income may live in an expensive house purchased years ago during a career of high earnings. From the perspective of lifetime income, neither the young professional nor the retiree can be considered truly low-in-come. Thus, current income is a misleading measure of the person’s financial situation. Finally, the incidence of the property tax should be compared with revenue alterna-tives. Those concerned with the fairness of the property tax will find that shifting to a general sales tax, selective sales tax (such as a cigarette tax), or lottery revenue will not increase equity. “The typical sales tax is con-siderably more regressive than property taxes” (McGuire and Papke, forthcoming 2008). Cigarette taxes and lottery revenues are also considered to be very regressive sources of revenue (Ladd and Hansen 1999, 246; Fisher 2007, 490).
Myth 3: The property tax is a regressive tax.
reaLIty: Researchers agree the property
tax is not generally regressive, and, to the
extent that it is a tax on capital, can be pro-
gressive. Furthermore, the property tax is
more progressive than the sales tax.
property tax espoused by Mieszkowski and elaborated upon by later economists came to be known as the “new view.” Some economists subsequently developed a second general theory of the property tax, which has been labeled the “benefit view.” It states that the property tax should be thought of as a charge for local services, such as schools and fire protection (Fischel 2001b; Zodrow 2001, 79). Economists taking this view further argue that the concepts of progressivity or regressivity do not apply to government charges any more than these concepts would apply to private sector goods and services such as restaurant meals or clothing prices. At present, there is no consensus regard-ing whether the new view or the benefit view is more appropriate (Nechyba 2001). The important point is that neither view concludes that the property tax is clearly a regressive tax. The first view concedes the property tax could have some regressive elements for certain property taxes or prop-erty tax changes in some parts of the coun-try; but, overall, the new view argues prop-

�� p o l i c y F o c u S r e p o r T ● L i n c o L n i n s t i t u t e o f L a n d P o L i c y K e n y o n ● T h e p r o p e r T y Ta x – S c h o o l F u n d i n g d i l e m m a ��
. . . . . . . . . . . . . . . . . . .
MyTh 4 : PRoPERTy TAx RATE EqUALS PRoPERTy TAx BURDEn Policy makers and analysts sometimes equate property tax rates with property tax burden, such as this statement about the Illinois “education crisis”:
Local property taxpayers pay local edu-cation taxes ranging from $6.67 per $100 of assessed value to $.94 per $100 of assessed value—meaning a taxpayer pays seven times the tax rate [of one in another district]. (A+ Illinois 2007)
After examining changes in school funding from 1999 to 2004, a New Hampshire think tank report states:
The gap between communities with the lowest and highest tax rates for education is widening, resulting in less “taxpayer equity.” (Minard 2004, 5)
There are a number of reasons why a community’s property tax rate is not a good measure of the property tax burden faced by the residents. The most important is that a substantial proportion of property tax pay-ments is capitalized into the value of one’s property (see box 3). Thus, a family pur-
Most people who own stocks have an intuitive understanding of capitalization, but may not
realize it also applies to housing and property taxes. Capitalization occurs when the value
of an asset (a stock or house) is affected by annual benefits or costs (dividends paid on stocks
or property tax liabilities for houses).
A stylized example of property tax capitaliza-
tion is based on a real-world example in cen-
tral New Hampshire, where two identical
homes down the street from each other were
located in the same subdivision, but in differ-
ent towns. Children from both towns attend-
ed the same regional high school.
The higher tax rate in Concord was reflected
in a lower house price, compared to Bow, for
an identical house (see table 13). Because
the house costs less in Concord, the mort-
gage payment is less as well. In this example, which assumes perfect capitalization, lower annu-
al mortgage payments in Concord perfectly compensate for higher annual tax payments. Home-
owners in each town pay $24,000 each year for their mortgage and property tax payments; the
division between mortgage payments and tax payments differs, however.
In the real world capitalization may not be perfect, but substantial and strong evidence indicates
that it exists (Yinger et al. 1988, 44–45). Capitalization has important implications for under-
standing property tax burdens. Just as in the example above, one cannot assume the family fac-
ing a higher property tax rate is disadvantaged relative to an otherwise identical family facing a
lower tax rate.
Box 3
what is Capitalization?
TaBle 13
Example of Tax Capitalization in Adjoining Towns with Identical houses
Concord Bow
Tax Rate 5% 2%
house Price $160,000 $200,000
10% Mortgage $16,000 $20,000
Property Taxes $8,000 $4,000
Total Annual Payment $24,000 $24,000
Source: Fischel (2001b, 41).

�� p o l i c y F o c u S r e p o r T ● L i n c o L n i n s t i t u t e o f L a n d P o L i c y
. . . . . . . . . . . . . . . . . . .
K e n y o n ● T h e p r o p e r T y Ta x – S c h o o l F u n d i n g d i l e m m a ��
chasing a house in a high tax community pays less than a family purchasing a home in a low tax community. It is a mistake to use a high tax rate as a measure of property tax burden, because the new entrant to the com-munity has already been compensated for the high tax rate by the house price discount. There are other reasons why focusing on property tax rates as a measure of tax equity can be misleading. As described in the pre-vious section, high-income communities can become property poor by zoning out indus-trial, utility, and commercial property. If high-income communities use zoning to obtain a pristine bedroom-community environment that results in higher tax rates, should these high tax rates make the communities more deserving of state aid? In contrast, low-income communities, particularly central cities, can become property rich by hosting power plants, industrial facilities, and com-mercial development, leading to lower tax rates. Should these lower rates make the community any less deserving of state aid? Community tax rates are also influenced by the desire of community residents for municipal and education spending. High-income communities can decide to spend more money on schools and municipal services, which will also tend to increase property tax rates. Again, one should ques-tion whether the higher tax rates that result
Myth 4: Property tax rates are a reason-
able measure of property tax burden.
reaLIty: Property tax rates are not a good
measure of property tax burden because high
tax rates can reflect a high level of local
government services or restrictive zoning
practices rather than low fiscal capacity;
high tax rates can also reduce house prices,
which partially compensates new home-
owners for high taxes.
are an indication of an unfair property tax burden (Kenyon 2003). “Tax rates by themselves tell us nothing about differences in the economic burden of the property tax among communities” (Fischel 2001a, 138).
MyTh 5 : DEMonIzIng ThE PRoPERTy TAx Policy makers and policy analysts often argue that the local property tax is an inequitable means of funding K–12 education, and that reliance on the local property tax should be reduced. For example, Jonathan Kozol criti-cizes property taxes in his influential book Savage Inequalities (1990), and in an interview in the journal Educational Leadership:
What we ought to do ultimately is get rid of the property tax completely as the primary means of funding public education, because it is inherently un-just. To use the local property tax as even a portion of school funding is unjust because it will always benefit the children of the most privileged people…We ought to finance the edu-cation of every child in America equi-tably, with adjustments made only for the greater or lesser needs of certain children. And that funding should all come from the collective wealth of our society, mainly from a steeply gradu-ated progressive income tax. (Scherer 1992–1993, 4)
Such thinking has influenced certain policy positions, such as a resolution passed by the National Education Association (2002), which states: “The state and local share of educa-tion finance must be derived from a tax system that is balanced and complementary in na-ture, includes all broad-based taxes, reduces excessive reliance on property taxes...(emphasis added).” This myth that reliance on property taxes is generally problematic will be de-bunked in two steps: critiquing commonly

�� p o l i c y F o c u S r e p o r T ● L i n c o L n i n s t i t u t e o f L a n d P o L i c y K e n y o n ● T h e p r o p e r T y Ta x – S c h o o l F u n d i n g d i l e m m a ��
. . . . . . . . . . . . . . . . . . .
raised objections, and offering a range of advantages.
Disadvantages of Using Property Taxes to Fund SchoolsOne of the most common criticisms is that property values per pupil vary among school districts. To the extent that the property tax base varies, some communities can fund high per-pupil expenditures with low tax rates while other communities need to impose high tax rates to fund even modest expenditures per pupil. This property tax phenomenon is often labeled as a problem of “fiscal disparities.” However, communities cannot solve the problem of fiscal disparities simply by switching to funding through a local sales or income tax. Some studies have shown that disparities in local tax bases persist or even increase with these alternative taxes (Ladd and Hansen 1999, 239–240). A second criticism of property tax funding of schools is the perceived inequity of the tax, including the previously de-
scribed myth that property taxes are regres-sive. Another view is that the property tax is flawed because its relationship to taxpayer ability to pay is inexact. Assuming current income is the best measure of one’s ability to pay current taxes, it is true that property taxes do not change as current income changes. For example, a person who loses her job does not typically sell her home at the same time. Thus, her ability to pay taxes has decreased, but her property tax burden has not. However, this criticism does not make the property tax inherently bad. One of several policy options to fix this problem is a circuit breaker, which limits property tax liability for those property tax payments that are par-ticularly onerous in light of the taxpayer’s current income (see box 4). A third criticism is that the property tax can lead to fiscalization of land use. That is, local governments can employ land use planning to maximize revenues and mini-mize costs. A current issue in New Hamp-shire is the attempt by towns to attract senior citizens (who are thought to pay property
A property tax circuit breaker is a form of property tax relief targeted to those whose current income makes it difficult to
afford their property tax payments. “The term ‘circuit breaker’ is used because the refunds act much like an electrical
circuit breaker, providing a relief switch for taxpayers whose burden of property taxes reaches a pre-defined ‘circuit breaker’
threshold” (Allen and Woodbury 2006, 673). At present, 35 states have circuit breaker programs, but two-thirds of the
states limit such programs to the elderly (Reschovsky 2006).
A simple circuit breaker would prevent taxpayers from paying more than some specified percentage of income in property
taxes. Thus, if a circuit breaker “kicked in” at 6 percent of income, a household with $40,000 in annual income would re-
ceive a rebate for any property tax liability over $2,400. One problem with this approach is that taxpayers subject to it may
rightly view increased local government spending as “free” because, on the margin, they would incur no additional tax liabil-
ity. Another problem is that tax refunds might go to taxpayers with very high incomes or high value homes.
For these reasons, and also to limit the cost to state government, states often place limits on circuit breaker eligibility, such
as limits on total dollars refunded per taxpayer. Alternatively, states may exclude taxpayers from the program if their incomes
or home values exceed a certain value. However, if the income limits are set too low, many otherwise deserving low- and
middle-income taxpayers may be excluded.
Box 4
what is a Property Tax Circuit Breaker?

�0 p o l i c y F o c u S r e p o r T ● L i n c o L n i n s t i t u t e o f L a n d P o L i c y
. . . . . . . . . . . . . . . . . . .
K e n y o n ● T h e p r o p e r T y Ta x – S c h o o l F u n d i n g d i l e m m a ��
taxes, but not impose school costs) and to minimize immigration of families with chil-dren (whose ratio of taxes paid to services received is thought to be lower). California’s reduced reliance on property taxation has stimulated another type of fiscalization of land use. Because California cities have no direct control over property or sales tax rates, cities compete for commercial devel-opment in hopes of increasing their sales tax revenues (Crane 2006, 49–51). Fourth, from a political standpoint, an important failing of the property tax is its unpopularity. Polling data from 1972 to
1999 suggest which tax voters perceive as the least fair tax:
Since the poll began, the federal income tax and local property tax have always been ranked first or second as “least fair,” with the local property tax usually finishing first in the 1970s and the federal income tax first in the 1980s. The two alternated positions in the 1990s. (Fisher 2007, 318)
Some attribute the unpopularity of the property tax to its visibility. Unless taxpayers pay property taxes as part of their mortgage payments, they typically pay large payments twice annually. This makes the property tax burden appear more onerous than the sales tax, which is paid in small amounts with each transaction, or the income tax, which is with-held from wages and for which many tax-payers receive refunds shortly after the annual filing date. Public finance analysts sometimes con-sider the unpopularity of the property tax a good thing by praising the virtues of govern-ment transparency. They argue it is benefi-cial for taxpayers to weigh the benefits of government services against taxes paid be-cause it makes government more efficient and more responsive to citizens. If citizens dislike the property tax primarily because of its visibility, this is taken as a necessary evil. Taxpayers may focus on their dislike for the property tax because they have few other avenues for registering their frustration with government. Citizens may have little opportunity to protest income tax payments made to the federal government or sales tax payments made to state government, but they can voice their wishes at the local gov-ernment level, which is also where government typically relies most heavily on property taxes. In recent years home values have in-creased dramatically in certain parts of the country, leading to increased assessed values

�0 p o l i c y F o c u S r e p o r T ● L i n c o L n i n s t i t u t e o f L a n d P o L i c y K e n y o n ● T h e p r o p e r T y Ta x – S c h o o l F u n d i n g d i l e m m a ��
. . . . . . . . . . . . . . . . . . .
and higher property tax bills for many tax-payers. Such dramatic increases in property tax liability for certain taxpayers have con-tributed to this unpopularity, but this phen-omenon is a result of the current real estate market, not a permanent condition. It is also important to distinguish between property taxes levied by local governments and those levied by state governments. Certain states have replaced a portion of their local property taxes with a state property tax whose rate will not vary by community. In this case, neither the issue of fiscal dispari-ties nor fiscalization of land use arises, but the argument that the property tax is a benefit tax will be undermined. Neverthe-less, other drawbacks of centralizing educa-tion funding at the state level may exist. For example, some recent research has found that a larger state role in school financing can reduce student achievement (Ladd and Hansen 1999, 254–256).
Advantages of Using Property Taxes to Fund SchoolsOne important advantage of property taxation is its stability as a revenue source. Figure 8 shows the pattern of state and local income, sales, and property tax revenue from 1990 to 2004. That period begins in the middle of the 1990–1991 recession and encompasses the 2001 recession. It is clear that the income tax is a far less stable revenue source than either sales or property taxes. The sales tax appears to be about as stable as the property tax, but with one important difference. At the time of the 2001 reces-sion, sales tax revenues dropped while prop-erty tax revenues rose. It would be necessary to examine the patterns of property tax versus sales tax revenues for other business cycles in order to reach a conclusion regard-ing the general behavior of those two taxes during recessions.
If the alternative to local property taxa-tion is state aid, local governments have less control over the amount of revenue they receive. In good economic times, state gov-ernments may generously disburse aid to local governments, including state aid for education; in recessions, state legislatures are likely to cut state aid. Thus, moving from local property tax revenue to state revenue to fund K–12 education may make educa-tion more vulnerable to swings in the busi-ness cycle and to politics in the state capitol (Murray and Rueben 2007). The Michigan case study provides an example of this phenomenon. Another advantage of the property tax is its particular suitability as a revenue source for local governments. If one wishes to sup-port strong local governments, it is neces-sary to provide these governments with a viable tax base. Taxpayers find it easier to escape local sales and income taxes, making those taxes less workable as a revenue source for local governments. Property taxes are imposed on a much less mobile tax base than income or sales taxes.
Source: Bureau of Economic Analysis; see Appendix for details.
FIGURe 8
Volatility of State and Local Tax Revenue, 1990–2006
0.15
0.10
0.05
0
-0.05
-0.10
-0.15
Perc
ent
Cha
nge
1990
1991
1992
1993
1994
1995
1996
1997
1998
1999
2000
2001
2002
2003
2004
2005
2006
PropertySalesIncome
Rec
essi
on J
uly
19
90
–Mar
ch 1
99
1
Rec
essi
on M
arch
–Nov
embe
r 2
00
1

�� p o l i c y F o c u S r e p o r T ● L i n c o L n i n s t i t u t e o f L a n d P o L i c y
. . . . . . . . . . . . . . . . . . .
K e n y o n ● T h e p r o p e r T y Ta x – S c h o o l F u n d i n g d i l e m m a ��
Economists who study the appropriate match between type of government and source of revenue generally conclude prop-erty taxes and user fees and charges are the revenue sources best suited to local govern-ments, while sales or income taxes are more appropriate for state or national govern-ments (Kenyon 1997, 72). Indeed, the National Research Council has concluded, “the local property tax remains the best way to raise local revenue for education” (Ladd and Hansen 1999, 232–233). Fischel (2001a) has produced an enlight-ening analysis of the role of property taxa-tion in local government, which he labels the “homevoter hypothesis.” He argues that the use of property taxation by local govern-ment motivates homeowners who are voters (homevoters) to pay close attention to govern-ment. Because the most important asset of most homevoters is their homes, and because the benefits of local government expenditures and tax burdens are reflected in home values, homevoters are motivated to carefully weigh the cost of additional taxes against
Myth 5: Reducing reliance on property
taxation is usually beneficial.
reaLIty: There are advantages to relying
on property taxes; they provide stable reve-
nue and promote local fiscal autonomy and
civic engagement, among other virtues.
the benefit of particular government expen-ditures as a means of maximizing the value of their homes. A final argument in favor of relying on the property tax for funding education is that switching to reliance on other taxes may re-duce the total tax base available to all levels of government in a state (Murray and Rueben 2007, 3). This assumes school finance restruc-turing is closely tied to an effort to reduce overall reliance on property taxation, and that other functions, such as municipal services, do not increase their reliance on property taxation. It also assumes a limit to the extent that state and local govern-ments can rely on sales and income taxes.

�� p o l i c y F o c u S r e p o r T ● L i n c o L n i n s t i t u t e o f L a n d P o L i c y K e n y o n ● T h e p r o p e r T y Ta x – S c h o o l F u n d i n g d i l e m m a ��
. . . . . . . . . . . . . . . . . . .c h a p t e r 4
Two School Funding Litigation Myths
MyTh 6 : STATE ConSTITUTIonAL LAngUAgE Statements such as the following imply state supreme court school finance rulings rely directly on the language of state constitutions:
“It is the essential job of the courts to ensure that state officials obey the law.” (ACCESS 2007b)
“The Supreme Court a long time ago decided that our state’s constitu-tion requires the state to fund an adequate education for the state’s children.” (Robinson 2007, 8)
However, the case studies of Massachu-setts and New Hampshire raise questions about this presumption, since the rulings in those states have been very different, despite nearly identical language in their state constitutions. Both states have an education clause that requires legislators to “cherish the interest of literature and the sciences” (Massachusetts Constitution, Part 2, Chap-ter V, Section II; New Hampshire Constitu-tion, Part 2, Article 83). Both states also are required to levy “proportional and reason-able taxes” (Massachusetts Constitution, Part 2, Chapter I, Section I, Article IV; New Hampshire Constitution, Part 2, Article 5). The only differences between the two constitutions, with respect to the clauses relevant to the school funding court deci-
sions, are quite trivial: New Hampshire prefers to be called a state, and Massachu-setts a commonwealth. Such close parallels are not surprising, as New Hampshire’s con-stitution borrowed liberally from the Massa-chusetts constitution, and was approved only four years later (Kenyon 2005, 461). Legal scholars who have examined state constitutions across the country have con-cluded that “distinctions between education clauses apparently have not made a differ-ence in those school finance cases decided between 1973 and 1992” (Thro 1993, 22). Or more recently,
…state constitutional language appar-ently has little relationship to court deci-sions. Adequacy suits have failed in states with stronger language, such as Maine and Illinois, but won in states with weaker language, such as North Caro-lina and New York. (Dunn and Derthick 2007b, 332)
Thus, Illinois, which has not been subject to a court mandate to restructure its school finance system, has the following strong constitutional language:
�� p o l i c y F o c u S r e p o r T ● L i n c o L n i n s t i t u t e o f L a n d P o L i c y
. . . . . . . . . . . . . . . . . . .
K e n y o n ● T h e p r o p e r T y Ta x – S c h o o l F u n d i n g d i l e m m a ��
A fundamental goal of the People of the State is the educational development of all persons to the limits of their ca-pacities. The State shall provide for an efficient system of high quality public educational institutions and services. Education in public schools through the secondary level shall be free. There may be such other free education as the General Assembly provides by law. The State has the primary responsibil-ity for financing the system of public education. (Illinois Constitution, Article X, Section 1)
have helped improve the quality of educa-tion for millions of students” (ACCESS 2007b). Or, “…the push for resource equity and adequacy has long rested on the assump-tion that shifts in the level or distribution of funding will have real consequences for stu-dents’ educational opportunities and success” (Corcoran and Evans forthcoming 2008). What is the research evidence to support this assertion? The case study states in this report present a mixed picture of the rela-tionship between school funding lawsuits and student achievement. For California, test scores fell after the Serrano cases and Proposition 13; but, unless one attributes passage of Proposition 13 to Serrano as Fischel (2001b) does, one cannot conclude that school finance litigation reduced student achievement. Test scores in Massachusetts increased after the school finance system was restruc-tured, but one cannot attribute this to school finance litigation. The Massachusetts Education Reform Act was nearing comple-tion before the McDuffy ruling was decided, and this report classifies Massachusetts as a state that restructured its school funding system in the absence of a court mandate. Test scores in Texas increased after the school finance system was restructured, but again one cannot attribute this to school finance litigation. That litigation focused largely on questions of tax equity and a de facto state property tax; the state aid formula resulting from school finance restructuring was not designed to ensure education adequacy. Recent reviewers of about 200 school finance litigation studies note, “…the debate about the impact of school finance litigation is not now resolved” (Thompson and Cramp-ton 2002, 164). Another study finds that school finance litigation leads to greater spending by state governments on educa-tion, but that this spending is offset to some
Myth 6: State supreme court school
finance rulings rely directly on the language
of state constitutions.
reaLIty: No direct relationship exists
between constitutional language and state
supreme court school finance rulings; court
mandates have differed markedly in two
states with nearly identical constitutional
language.
On the other hand, New York’s highest court has mandated the legislature to restruc-ture despite this relatively weak language in the education article of the New York State Constitution (Article XI, Section 1):
The legislature shall provide for the maintenance and support of a system of free common schools, wherein all the children of this state may be educated.
My Th 7 : EFFECTS oF LITIgATIon on EDUCATIon Statements by advocates of education fund-ing lawsuits imply school funding litigation has been an effective means of improving educational outcomes. For example, “Courts

�� p o l i c y F o c u S r e p o r T ● L i n c o L n i n s t i t u t e o f L a n d P o L i c y K e n y o n ● T h e p r o p e r T y Ta x – S c h o o l F u n d i n g d i l e m m a ��
. . . . . . . . . . . . . . . . . . .
Corcoran and Evans and Berry agree that school finance litigation has led to greater equality in spending per pupil within states. For example, disparities in per-pupil spend-ing within states fell between 15 and 19 per-cent between 1972 and 2002 in states with court mandated school finance reform rela-tive to those states without such mandates (Corcoran and Evans forthcoming 2008). However, researchers disagree about the implications of this greater equality in spend-ing. Susanna Loeb (2001, 236) comments on another article:
The authors [Evans, Murray, and Schwab 2001] provide strong evidence that on average spending has become more equal across districts based on property wealth. But this may not be the question we care most about. The impetus for reform in many states has been the low quality of education pro-
degree by reduced spending on education by local governments (Berry 2007). This author finds that when considering state plus local education spending, it is unclear whether overall spending has increased or decreased in response to school finance litigation. More recent empirical work by Corcoran and Evans (forthcoming 2008) using data from 1972 to 2002 concludes that:
…court-ordered reform—particularly when based on equity considerations —has increased the level of spending at the low end of the distribution of school districts while leaving expendi-ture in high-spending districts relatively unchanged. Further, the increase in per-pupil revenues necessary to sup-port these changes has occurred almost entirely through increased state funding with only a minimal decline in local funds.

�� p o l i c y F o c u S r e p o r T ● L i n c o L n i n s t i t u t e o f L a n d P o L i c y
. . . . . . . . . . . . . . . . . . .
K e n y o n ● T h e p r o p e r T y Ta x – S c h o o l F u n d i n g d i l e m m a ��
vided to low-income students. As such, it is important to ask what has happened to the resources received by this group.
A second and more important issue than the distribution or level of school spending is the impact of litigation on student achieve-ment. Some studies conclude that school finance litigation tends to improve achieve-ment statistics such as test scores and drop-out rates (Downes 2002), and others con-clude that such litigation tends to worsen these achievement statistics (Betts 2002). “...the existing literature on court mandated school finance changes has yet to deliver a consistent message about the impact on either the level or distribution of student outcomes” (Betts 2002, 168). Another review of the impact of school finance reform on SAT scores, state test scores, and high school dropout rates con-cludes that the evidence regarding whether school finance litigation and resulting reform improves student achievement is “decidedly mixed” (Corcoran and Evans forthcoming 2008). These authors draw three lessons from the research on the effects of school funding reform on student outcomes:• “Reform is no guarantee of improved
adequacy or equity in student achieve-ment.”
• “…the institutional details of school fund-ing reforms, the unique circumstances of individual states and local and state responses to changes in finance systems vary considerably.”
• “…the most successful reforms pay as much attention to the use of funds as to the level of expenditure.”
Many challenges face those doing em-pirical work on the effects of school finance litigation on both education spending and student achievement; these challenges help account for the inconclusive results of the current literature. Some states enacted tax and expenditure limitations at the same time they restructured school finance systems, mak-ing it difficult to disentangle the impacts of these two important policy changes. It is also difficult to determine the likely timing of the impact of school finance liti-gation. Does the threat of litigation have a significant effect on legislation? Should researchers look for an impact of litigation before the state’s highest court rules, or after, or both? Finally, researchers have disagreed about whether particular states should be classified as having “successful” school fund-ing litigation or not. Because of these impedi-ments to conducting national studies of the fiscal impacts of school finance litigation, several scholars have recommended that more attention be paid to individual case studies (Downes 2002, 150).
Myth 7: School funding litigation has been
a generally effective means of improving
education outcomes.
reaLIty: Researchers generally find court-
mandated school finance restructuring re-
duces within-state inequality in education
spending per pupil, but they do not find a
consistent impact on the level of school
spending or on student achievement.

�� p o l i c y F o c u S r e p o r T ● L i n c o L n i n s t i t u t e o f L a n d P o L i c y K e n y o n ● T h e p r o p e r T y Ta x – S c h o o l F u n d i n g d i l e m m a ��
. . . . . . . . . . . . . . . . . . .c h a p t e r 5
State education aid and Two Related Myths
Before debunking two myths about general state aid for education, it is important to understand the changing state role in funding
K–12 education, the types of general state aid for education, and the targeting of aid.
ThE InCREAS Ing S TATE Ro LE In FUnD Ing EDUCAT I onIn 1952 local governments in the United States provided nearly 60 percent of total K–12 funding, and state governments pro-vided almost 40 percent. Over time the local contribution has decreased and the state contribution increased (see figure 9). In 1978–1979 the state contribution first exceeded the local contribution, and for most of the period since 1979, the state financial contribution to K–12 education has continued to exceed the local contribution. Over the last 50 years the federal contribu-tion has never exceeded 10 percent. There are two important qualifications to this general description, however. First, despite the trend towards a greater state role in funding K–12 education in the United Sates, that role varies greatly among the states. Second, it is often difficult to distinguish between a state-levied or local-levied property tax in the first place. Figure 10 shows the wide-ranging share of K–12 education revenue from state gov-ernment by state. In 2004–2005, Hawaii and Vermont were the most centralized states, with state government providing nearly 90 percent of total education revenue. Hawaii has a single school district, and Vermont has converted all local school property taxes to a state-levied property tax. At the other end of the spectrum, Illinois and Nevada were the most decentralized states, providing about
30 percent of total education revenue. Among the case study states, Michigan and Califor-nia have more highly centralized school funding systems than the U.S. average, while Massachusetts, New Hampshire, New Jersey, Ohio, and Texas are less centralized.
TyPES oF gEnERAL S TATE A ID FoR S ChooLSThere are three types of general education grants: foundation, flat, and guaranteed tax base.
Foundation AidFoundation aid is designed to ensure that per-pupil expenditure exceeds a certain minimum or foundation amount in all school districts. It fills the gap between the amount of funding that the district can provide by levying a particular tax rate and the foundation amount. In Figure 11, the property-poor district can obtain $1,000 per pupil with
Source: National Center for Education Statistics (2007a).
FIGURe 9
Sources of Public K–12 Revenues
Perc
enta
ge
1976
1980
1984
1988
1992
1996
2000
2004
1964
1968
1972
1956
1960
1952
70
60
50
40
30
20
10
0
Federal
State
Local

�� p o l i c y F o c u S r e p o r T ● L i n c o L n i n s t i t u t e o f L a n d P o L i c y
. . . . . . . . . . . . . . . . . . .
K e n y o n ● T h e p r o p e r T y Ta x – S c h o o l F u n d i n g d i l e m m a ��
the designated local tax rate, so the state contributes an extra $5,000 to reach the foundation target of $6,000. The property-rich district can obtain $5,000 per pupil with the designated local tax rate, so the state contributes an extra $1,000 to reach the same target.
If the property-rich district can raise more than $6,000 at the designated local tax rate, typically the district is not entitled to any foundation aid. Occasionally a state will “recapture” funds from such a property-rich district. Thus a district that could raise $7,000 at the specified minimum tax rate would have to pay $1,000 per pupil to a state fund. This was the case in New Hampshire when the school funding system created donor towns. The recapture or Robin Hood provision of Texas’ state aid program is a more complex version of the same phenomenon. Three complications in foundation aid should be noted, however. First, not all stu-dents are equally costly to educate. For ex-ample, a district is likely to need greater resources for English Language Learners in a particular grade than for those whose first language is English. School aid for-mulas often take these cost differences into account by weighting students. That is, a student who is an English Language Learner, attends special education classes, or whose
FIGURe 10
State Aid as a Percent of Total K–12 Revenue, 2004–2005
100
90
80
70
60
50
40
30
20
10
0
Perc
ent
of T
otal
Rev
enue
fo
r K
–12
Edu
catio
n
U.S. Average
New Jersey
Michigan
NevadaIllinois
New HampshireTexas
MassachusettsOhio
Vermont
Hawaii
New MexicoMinnesota
California
Extreme StatesCase Study StatesOther States
Source: National Center for Education Statistics (2007b).
family falls below the poverty line might be counted as 1.2 to 1.5 students in a foun-dation aid formula rather than as a 1.0 student. Second, school aid formulas can adjust for differences in the cost of living across a state, particularly if the state is large or is split between urban and rural areas. The third complication involves deter-mining what a particular community can afford in a foundation aid system. In the hypothetical example presented above, foundation aid assumes a community can afford a contribution equal to the mandated property tax rate times the community’s property tax base. In essence, the communi-ty’s fiscal capacity is assumed to depend only on the ability to pay property taxes. A num-ber of states use a broader measure of fiscal capacity. That measure may depend on in- come or sales tax revenues, or it may depend on household income even if the community has no access to local option taxes (American Education Finance Association 1995, 27).
Flat and Guaranteed Tax Base GrantsFlat grants were the first type employed. Initially they provided a certain number of dollars per school, and later a specific num-ber of dollars per classroom, teacher, or pupil (Odden and Picus 2000, 161). Before the 1970s flat grants were common, but today
FIGURe 11
Foundation Aid in Two hypothetical Districts
$7,000
$6,000
$5,000
$4,000
$3,000
$2,000
$1,000
$0Property-Poor
DistrictProperty-Rich
District
F o U N D aT I o N a I D l I N e
Per
Pupi
l Spe
ndin
g
State District
Source: Author’s example.

�� p o l i c y F o c u S r e p o r T ● L i n c o L n i n s t i t u t e o f L a n d P o L i c y K e n y o n ● T h e p r o p e r T y Ta x – S c h o o l F u n d i n g d i l e m m a ��
. . . . . . . . . . . . . . . . . . .
they are used infrequently, except as minor adjuncts to other grants provided by the state. For example, the main grant used in Texas is a foundation grant, but each dis-trict also receives a small per-pupil grant, a type of flat grant. Guaranteed tax base grants are a form of matching grant, whereby the match varies with the per-pupil property value of the school district. These tax base grants are also known as district power equalizing grants. In essence, this type of grant ensures that each school district can raise the same amount of revenue for each $1 per $1,000 of assessed value increase in the tax rate. Thus, “the state’s share of spending per pupil is much higher for low-wealth districts than for high-wealth districts” (Yinger 2004, 12). In the Texas example, the third tier of the school aid system, provided on top of the basic foun-dation and flat grants, is a guaranteed tax base grant.
Summary of General Aid GrantsForty-one states employ foundation grants either alone or with another type of grant. All of the case study states use foundation grants, but Texas also relies heavily on a guaranteed tax base grant. Foundation grants are currently the most commonly recommended type of general education grant (Yinger 2004, 46; Stiefel 2006, 386). Yinger argues that different aid formulas are suited to different policy objec-tives. Based on a review of the literature, he concludes that foundation formulas are best for achieving educational adequacy, but guaranteed tax base formulas are best for achieving access equality.
State supreme courts, policy makers, and scholars appear to have reached a consensus that a foundation plan with a foundation level based on a generous notion of educational adequacy, a
required minimum tax rate, and some kind of educational cost adjustment forms the core of an acceptable reform of state education finance. (Yinger 2004, 46)
TARgET I ng gEnERAL SChooL A IDAlthough most states use some form of foun-dation grant in sending aid to local govern-ments, states differ a great deal in the extent to which they target their aid to the neediest children. Education Trust (a nonprofit or-ganization founded by the American Asso-ciation for Higher Education) calculates the degree to which states and localities target revenues to high-poverty districts across the United States by calculating average state and local revenues per student by quartile. One would expect high-poverty districts would have lower local revenues per pupil than low-poverty districts; the question is whether state aid is sufficiently targeted to high-poverty districts to compensate for the inequitable pattern of local government resources. Figure 12 compares the degree of state-local revenue targeting for the seven case study states. This measure adjusts for differences
Source: Author’s example.
FIGURe 12
Is 2004 State-Local School Funding Targeted to high-Poverty School Districts?
noFewer dollars per pupil to high-poverty districts
yesMore dollars per pupil to high-poverty districts
New Jersey
Massachusetts
Ohio
California
Texas
Michigan
New Hampshire
-$1,500 -$1,000 -$500 $0 $500 $1,000 $1,500State-local school spending per pupil in high-poverty
districts minus spending per pupil in low-poverty districts
-$1,297
-$1,072
-$757
-$259
$1,069
$694
$113
Source: Education Trust (2006, 7).

�0 p o l i c y F o c u S r e p o r T ● L i n c o L n i n s t i t u t e o f L a n d P o L i c y
. . . . . . . . . . . . . . . . . . .
K e n y o n ● T h e p r o p e r T y Ta x – S c h o o l F u n d i n g d i l e m m a ��
in the cost of living across the state and for the additional costs of educating low-income students or those with disabilities. Only New Jersey, Massachusetts, and Ohio target enough state aid so that state-local spending per pupil is higher for high-poverty districts than for low-poverty districts.
My Th 8 : SChooL AID AS PRoPERTy TAx RELIEF Can school aid provided by the state to local governments also serve as property tax relief ? This section argues it can, but other tools are more likely to achieve a tax relief goal. The economics literature notes that state aid effectively increases the income of the local government; it can also change the rela-tive prices of different government programs, depending upon the provisions of the grant. Increases in school aid can increase spend-ing on education, reduce property taxes, in-crease spending on other local government services, or some combination of these (Yinger 2001). The political science literature also notes that school aid is not always spent on the educational programs the grantor has intended. To be more specific, school aid can supplant local funds that would have been spent on the grant activity, but which are now freed up for local governments to use for a variety of other purposes, including tax re-lief or other spending programs (Wong 1999). Thus, one problem with increasing state school aid to indirectly provide property tax relief is that the local government can use the additional resources for a variety of pur-poses, of which property tax relief is only one. Second, depending upon how school aid is structured, it can either limit or stimu-late additional school spending (Hoxby 2001). If school aid stimulates additional spending, the very provision meant to offer property tax relief is at the same time increasing the need for such relief (Yinger 2001).
Third, school aid and property tax relief have inherently different objectives and characteristics. The aim of school aid is to improve children’s education, and it should take into account factors that make it more difficult to provide some children with an adequate education than others (e.g., special weights for English Language Learners or special education). The aim of property tax relief is to aid taxpayers who otherwise may not be able to pay their prop-erty tax bills given their current incomes. Factors that should be taken into account in this goal relate to the magnitude of property tax bills and income levels of households (Reschovsky 1994). For example, the prop-erty tax circuit breaker is a better policy tool than increased education aid when the objective is property tax relief for low- and moderate-income households.
MyTh 9 : ShIFT To STATE FUnDIng FoR SChooLSMany policy makers or policy analysts argue that the state role in school funding should be increased and the local role decreased. Two legal scholars recommend that state governments provide at least 60 percent of the financial support for public schools (Carr and Griffith 2005, 168). The National Center on Education and the Economy (2007, xxviii) calls for shifting the burden for funding education completely to the states. Ohio’s current governor set the goal of
Myth 8: State aid for schools is one form
of property tax relief.
reaLIty: State aid for schools may or may
not provide property tax relief, depending
upon how it is structured. State-funded
circuit breakers are more likely to achieve
that relief.

�0 p o l i c y F o c u S r e p o r T ● L i n c o L n i n s t i t u t e o f L a n d P o L i c y K e n y o n ● T h e p r o p e r T y Ta x – S c h o o l F u n d i n g d i l e m m a ��
. . . . . . . . . . . . . . . . . . .
increasing that state’s share of funding for schools to 54 percent (Willard 2007). In contrast, this report argues that state policy makers should not aim to provide any specific percentage of the total funding for K–12 education, for several reasons. First, the percentage of school funding pro-vided by the state government can be an arbitrary number depending upon whether state governments use property taxes for funding schools and whether the Census classifies the tax as a state or local tax. For example, Kansas state legislators mandated a minimum local property tax as part of their school finance restructuring; Michigan, New Hampshire, and Vermont enacted statewide property taxes. Although the state use of the property tax to fund education in these four states was virtually identical, the Census classifies Kansas’ mandated local property tax as a local tax source, but classifies the state property taxes in Michigan, New Hamp-shire, and Vermont as state tax sources. It is often difficult to distinguish between state and local property taxes when the state exerts substantial control over local property taxes as part of its school funding program (Kenyon 2007). Figure 13 attempts to treat all education property taxes the same way by subtracting state property taxes for edu-cation from total state revenues for K–12 education. After making this adjustment, the percent of total revenue provided by the state for K–12 education falls significantly for Michigan, and dramatically for both New Hampshire and Vermont. In addition to this technical point regard-ing measurement challenges, another rea-son to question the goal of raising the state’s percentage contribution to total K–12 reve-nues to a specific level is that it tackles neither of the important goals examined earlier: raising educational achievement, or reduc-ing property tax burdens for families whose property tax payments are large relative to
their incomes. It is also important to remem-ber that state taxpayers are liable for both state and local taxes. Whether raising revenue at the state or local level is best depends on a host of com-plex tax policy questions discussed previ-ously. For example, shifting from local to state revenue sources could increase the progressivity of the state’s revenue structure if the state revenue source were an income tax, but could decrease the progressivity if the state’s revenue source were a sales tax. Shifting from local to state revenue sources also could make school funding unstable, an issue that has been important for both Cali-fornia and Michigan, the two case study states with the highest state share of K–12 revenue.
Myth 9: State policy makers should aim to
provide more than half of total K–12 funding.
reaLIty: State policy makers should not
aim to provide any specific percentage of the
total funding for K–12 education. Better policy
goals focus on student achievement or limit-
ing property tax burdens to some percentage
of household income.
FIGURe 13
State Aid as a Percent of K–12 Revenue, 2001–2002, with State Property Taxes Reclassified
100
90
80
70
60
50
40
30
20
10
0
Perc
ent
of T
otal
R
even
ue for
K–1
2 E
duca
tion
Extreme StatesStates with State Property Taxes
hawaii
new hampshire
Michigan
nevada
U.S. Average
Vermont
Source: National Education Association (2003) and author computations based on additional data from state government Web sites.

�� p o l i c y F o c u S r e p o r T ● L i n c o L n i n s t i t u t e o f L a n d P o L i c y
. . . . . . . . . . . . . . . . . . .
K e n y o n ● T h e p r o p e r T y Ta x – S c h o o l F u n d i n g d i l e m m a ��
c h a p t e r 6
ConclusionLESSon S FRo M ThE C ASE STUDy STATES
In taking a final look at the seven case study states, we ask: Which states have been the most successful in their school finance restructuring policies to im-
prove student achievement, and which states have been the least successful? Secondarily, which states have been most and least suc-cessful in appropriately limiting property tax burdens?
Student AchievementTable 3 in chapter 2 presents two measures of student outcomes by state: scores on the National Assessment of Educational Progress (NAEP) and graduation rates. Although both are important, this report relies less heavily on graduation rates because not all states measure graduation rates accurately or in the same way, and most are changing the way they measure those rates. At present, the best tool for measuring student achieve-ment and making interstate comparisons is the NAEP. Recent studies have shown that many state-specific tests vary markedly from NAEP, making it an even more important way to compare one state with another (Manzo 2007).
Figure 14 shows a wide range in stu- dent achievement among the case study states. Massachusetts clearly ranks highest and California lowest. This figure also shows that, with the exception of Texas which scores disproportionately higher in math than in reading, a state that ranks well on fourth grade reading, also ranks well on fourth grade math, and eighth grade reading and math. There are two important caveats about this conclusion, however, because the demo-graphic challenge faced by each state also varies considerably. Whereas 28 percent of Massachusetts children are eligible for free and reduced lunch (a proxy for low income), California and Texas have almost double that percentage of eligible students. To adjust for this, one needs to look at more disaggregated NAEP scores by state (see table 14). Overall Massachusetts (81 percent) still ranks highest and California (53 percent) still lowest among the case study states. However, the evaluation of some of the other states changes when test scores are disaggregated. For example, although New Hampshire’s overall fourth grade reading scores are high relative to the United States average and Texas’ scores are equal to the
TaBle 14
Percent of Students at or above Basic Level in Fourth grade Reading, 2007
Type of Student
United States California Massachusetts Michigan
new hampshire
new Jersey ohio Texas
All 66 53 81 66 76 77 73 66
white 77 74 87 74 77 86 80 80
School Lunch Eligible
50 38 60 48 58 56 58 53
w/ Disability 36 26 54 36 40 46 41 40
Note: Other categories (i.e., Black, English Language Learner) have no entry for New Hampshire so have not been included.Source: National Assessment of Educational Progress (2007).

�� p o l i c y F o c u S r e p o r T ● L i n c o L n i n s t i t u t e o f L a n d P o L i c y K e n y o n ● T h e p r o p e r T y Ta x – S c h o o l F u n d i n g d i l e m m a ��
. . . . . . . . . . . . . . . . . . .FIGURe 14
Rank of nAEP Test Scores for Case Study States
5040302010
08th Grade Reading
4th Grade Reading
8th Grade Math
4th Grade Math
CALIFoRnIA
5040302010
08th Grade Reading
4th Grade Reading
8th Grade Math
4th Grade Math
nEw JERSEy
5040302010
08th Grade Reading
4th Grade Reading
8th Grade Math
4th Grade Math
ohIo
8th Grade Reading
4th Grade Reading
8th Grade Math
4th Grade Math
MASSAChUSETTS
5040302010
0
5040302010
08th Grade Reading
4th Grade Reading
8th Grade Math
4th Grade Math
nEw hAMPShIRE
5040302010
08th Grade Reading
4th Grade Reading
8th Grade Math
4th Grade Math
MIChIgAn
5040302010
0
4th Grade Math
TExAS
8th Grade Reading
4th Grade Reading
8th Grade Math
Note: 50 = highest rank on all four axes.
Source: National Assessment of Educational Progress (2007).

�� p o l i c y F o c u S r e p o r T ● L i n c o L n i n s t i t u t e o f L a n d P o L i c y
. . . . . . . . . . . . . . . . . . .
K e n y o n ● T h e p r o p e r T y Ta x – S c h o o l F u n d i n g d i l e m m a ��
average, the disaggregated scores present a different impression. For white students, New Hampshire’s test scores are equal to the United States average, while Texas exceeds the average; for students eligible for school lunch programs, both New Hampshire and Texas are above average, with New Hamp-shire significantly higher than Texas; and for students classified as having a disability, the New Hampshire and Texas scores are identical. In addition, one can compare student achievement to per-pupil expenditures. Cer-tainly, New Jersey’s test scores are much higher than California’s, but per-pupil spending in New Jersey is the highest in the nation ($10,908) compared with California, which ranks forty-second ($6,765 per pupil).
Property Tax ReliefThe second desired outcome is adequately funded property tax relief targeted to low- and moderate-income households. Here the data requirements are even more challenging. Chapter 1 noted that the best available mea-sure of a state’s property tax burden—property taxes as a percent of personal income—
combines property taxes paid by individuals, businesses, and second homeowners. Ideally one would like a measure of property taxes paid by homeowners (excluding second home-owners) as a percent of personal income. Also, there are no state-by-state measures of the extent to which circuit breakers ameliorate household property tax burdens. In order to evaluate the case study states according to their property tax relief policies, one can only look at whether they offer circuit breaker programs or other property tax relief programs targeted to low- and moderate-income taxpayers, and how such programs are structured. This evaluation should also consider whether property taxes are a minor or major revenue source. Table 15 indicates a wide range in the use of circuit breakers among the seven case study states. Ohio and Texas have no property tax circuit breakers, Massachusetts has a circuit breaker limited to the elderly, and Michigan’s circuit breaker is available to taxpayers of all ages. Michigan’s circuit breaker program appears to be the most promising, whereas Texas relies heavily on property taxes but has no such program. New Hampshire, which relies more
TaBle 15
Circuit Breaker Programs, Case Study States, 2007
State Eligibility
household Income Ceiling (Single/
Joint Filer)* Maximum Benefit*
Rebates as Percent of 2004 Property Tax Collections
Property Taxes as Percent of 2005 Personal Income
CaliforniaSenior or disabled
homeowners or renters$42,770 $473(h); $348(r) n.a. 2.7%
Massachusetts Senior homeowners or renters $46,000/$70,000 $870 0.22% 3.9%
Michigan All homeowners or renters $82,650 $1,200 6.52% 4.0%
new hampshireAll homeowners,
only for state education tax $40,000/$20,000 None n.a. 5.6%
new JerseyAll senior or disabled
homeowners or renters$250,000(h); $100,000(r)
$2,000(h); $860(r) 4.15% 5.3%
ohio No circuit breaker 3.4%
Texas No circuit breaker 4.9%
*(h) indicates homeowners; (r) indicates renters. Source: Baer (2006); Bowman (2007); Lyons, Farkas, and Johnson (2007); RIPEC (2007).
�� p o l i c y F o c u S r e p o r T ● L i n c o L n i n s t i t u t e o f L a n d P o L i c y K e n y o n ● T h e p r o p e r T y Ta x – S c h o o l F u n d i n g d i l e m m a ��
. . . . . . . . . . . . . . . . . . .
heavily on property taxes than any other state, has a very limited circuit breaker program. It applies only to the state education prop-erty tax, and the income ceiling is the lowest among all the case study states.
Overall RatingAmong the case study states, Massachusetts appears to rank the highest, and California the lowest, although no state ranks uniformly high on all measures. In Massachusetts school finance restructuring efforts have focused on student equity, the state targets aid to high- poverty communities, and student test scores on the NAEP are the highest in the nation. On the downside, Massachusetts continues to grapple with the issue of property tax relief. In contrast, California has a highly stable but dysfunctional system of school finance and property tax relief. Its school funding lawsuit focused only on tax equity, and the restructuring and tax revolt that followed reduced school spending and allowed student achievement to fall. Proposition 13 addressed the property tax relief issue, but created an inequitable, overly complex property tax system. The upside of California’s system is stability in the property tax structure because of broad public support for Proposition 13. Massachusetts’ relative success may have much to do with its “unraveling” of the property tax–school funding knot. The state addressed the property tax revolt first, with the passage of Proposition 2½ in 1980, and then tackled school finance issues a decade later. Thus, separate policy measures ad-dressed student achievement and property tax relief. In California, however, school funding and property tax issues were inex-tricably entwined. Not only did California begin with a strong emphasis on tax equity, but knowledgeable observers argue the state’s school finance restructuring caused passage of Proposition 13, the state’s signature prop-
erty tax limitation measure. Now California’s taxpayers are unhappy with their schools and government, but loyal to their tax limit.
Two Po L IC IES To AVo IDDo not try to reform school funding and improve property tax fairness at the same time with the single policy tool of state aid.If property-poor school districts were also predominantly low-income school districts, this strategy of “killing two birds with one stone” might be a more effective one. How-ever, as described in chapter 4, several research reports have found that the correlation between low per-pupil property values and low income is modest. Another reason not to use school aid for both student achievement and prop-erty tax fairness goals is that a superior policy tool is available for funding property tax relief—the property tax circuit breaker.
Do not adopt a state policy goal of having state government provide a particular percentage of total K–12 school funding.Although this idea has become a popular call to action, this report concludes that it is a misguided goal. Although data are regularly reported on the percentage contribution that state governments make to total K–12 revenue, there are problems with this data series because it is difficult to distinguish between state-levied and local-levied education property taxes. Indeed, when Vermont’s education property tax is reclassified from a state revenue source to a local one, Vermont switches from being a state with an above-average state contribution to K–12 funding to a state with a contribution that falls far short of average. On a more substantive level, other goals, such as improving student achievement or provid-ing property tax relief for low- and moderate-income households, are more important.

�� p o l i c y F o c u S r e p o r T ● L i n c o L n i n s t i t u t e o f L a n d P o L i c y
. . . . . . . . . . . . . . . . . . .
K e n y o n ● T h e p r o p e r T y Ta x – S c h o o l F u n d i n g d i l e m m a ��
Two RECoMMEnDED PoL IC IESTarget property tax relief to needy taxpayers through state-funded property tax circuit breakers.Focusing school finance policies on student outcomes does not mean ignoring taxpayer concerns. However, property tax burdens that are excessive in relation to a household’s current income can be alleviated directly, rather than indirectly through increasing state aid for education. Furthermore, in the face of scarce resources, states should make limited use of measures that extend relief to all taxpayers, including high-income and wealthy ones. This report is among several which conclude that circuit breakers are the best means of targeting property tax relief to ability to pay (Bowman 2005; 2006). As noted in chapter 4, a number of states have no circuit breaker programs, and many states with circuit breakers limit the programs to the elderly. Thus, states can make more effective use of circuit breakers to alleviate taxpayer concerns.
Target school aid to needy school districts, schools, and students.States differ markedly in the degree to which they target aid to the school districts with the greatest school achievement challenges. In some states, the state aid is targeted to districts in which low student test scores are a concern; in others, state aid is spread widely to provide tax relief as much as to improve educational outcomes. NAEP scores show that test scores of low-income students tend to fall far short of average test scores. Studies of the impacts of school finance litigation and restructuring have typically distinguished between equity and adequacy rulings, or focused on the incentives created for total state spending (Hoxby 2001). Studies have not looked at the degree to which state aid has been targeted to students with the
greatest achievement gaps. At the same time, a number of studies using student-level or district-level data have found that increased school spending can make a difference in student achievement (Ferguson and Ladd 1996). Recent research by Corcoran and Evans (forthcoming 2008) concludes, “…the most successful reforms pay as much atten-tion to the use of funds as to the level of expenditure.” Targeting concerns are not limited to school districts, as a recent Education Trust report indicates. Within school districts, funding is often disproportionately allocated to high-income schools rather than low-income ones (Education Trust 2005, 7). This comes about because many districts tell schools how many teaching positions they are allocated, and teachers sort themselves among schools. When union contracts give senior teachers priority in school choice, and senior teachers are more highly paid than junior teachers, highly paid teachers are often disproportionately allocated to high-income schools.
School district budgeting practices siphon money away from higher-poverty and higher-minority schools to subsidize higher salaries in more affluent schools with fewer minority students. These within-district gaps are just now starting to get the attention they deserve and need to be fixed. (Education Trust 2005, 7)
One advantage of the more stringent testing requirements of the No Child Left Behind program is that school districts across the country will have better information on children who are not achieving proficiency in basic academic subjects. To the extent possible, states should not only make efforts to target school funding to needy school dis-tricts, and needy schools within those districts, but they should also ensure that the funding does “follow the child.”

�� p o l i c y F o c u S r e p o r T ● L i n c o L n i n s t i t u t e o f L a n d P o L i c y K e n y o n ● T h e p r o p e r T y Ta x – S c h o o l F u n d i n g d i l e m m a ��
. . . . . . . . . . . . . . . . . . .a p p e N D I x
Data Information for Selected Figures and Tables
F IgURES 2 A n D 3Data for these figures come from two different publications of the U.S. Census Bureau. Data for years through 2002 are from the Census of Governments, conducted once every five years (http://www.census.gov/govs/www/estimate02.html). These reports include actual state and local government revenue and expenditure figures for every state and local government in the United States. Data for 2005 come from the Annual Survey of Government Finances (http://www.census.gov/govs/www/estimate05.html). The data in this survey are less precise because they are estimates based on a sample of state and local governments.
F IgURE 4 : SC hoo L F In A n CE R ESTRUCTUR Ing By S TATEStates subject to highest court mandate: The primary source for this information was ACCESS (2007a), which separates states into the following categories: school finance litiga-tion resulting in a plaintiff victory, defendant victory, or no court decision. For the most part, each state that ACCESS categorized as a plaintiff victory was classified as a state with a court mandate. Each state with a case filed and only a defendant victory or with no court decision was classified as a state without a highest court mandate. Those states in which no school finance litigation was filed were classified separately. Some exceptions occurred because ACCESS classified some states as having a plaintiff victory when that victory was not at the highest court level. Another exception occurred when a state restructured its school finance system before a highest level court mandate. In the case of Massachusetts, in which restructuring and the highest court mandate both occurred in 1993, this policy focus report classified the state as restructuring without a court mandate. One of the challenges of this classification exercise was that some states had multiple court cases which were decided in different ways. For example, in 1993 Alabama’s highest court ruled the state’s school funding system unconstitutional. But in 2002, the highest court reopened the case and dismissed it. This report classifies Alabama as a state subject to a highest court mandate that did not prompt restructuring. States with school finance restructuring: The two primary sources for determining whether a school finance system was restructured were National Center for Education Statis-tics (NCES) descriptions of the school finance system in each state (Sielke et al. 2001) and NCES data on change over time in the percentage of revenue for public K–12 schools from state governments. Large increases in state support for K–12 schools were taken as an indi-cation of school finance restructuring. NCES narratives of major reforms of school funding arrangements were also taken as an indication of school finance restructuring. In addition, other sources were sometimes consulted (see Wong 1996). If a state restructured funding for capital costs only, it was not classified as a state under-going restructuring of its school funding system. Any major reorganization of a state’s school funding system was classified as a restructuring, whether or not public finance scholars view the change as a reform. For additional information on how each state was classified, please contact the author.

�� p o l i c y F o c u S r e p o r T ● L i n c o L n i n s t i t u t e o f L a n d P o L i c y
. . . . . . . . . . . . . . . . . . .
K e n y o n ● T h e p r o p e r T y Ta x – S c h o o l F u n d i n g d i l e m m a ��
TABLE 3 : SChooL F InAnCE In A nUTShELL , CASE STUDy STATESReliance on property tax: U.S. Census, Annual Survey of Government Finances,
http://www.census.gov/govs/www/estimate05.htmlSpending per pupil and rank: Education Weekly Research Center,
http://edcounts/edweek.orgNumber of school districts: National Center for Education Statistics, Common Core
of Data, http://nces.ed.gov/ccd/Number of students: National Center for Education Statistics, State Education Data
Profiles, http://nces.ed.gov/programs/stateprofiles/index.aspLimited English proficiency: Computed using data from National Center for Education
Statistics, Common Core of Data, http://nces.ed.gov/ccd/Percent special education: Computed using data from National Center for Education
Statistics, Common Core of Data, http://nces.ed.gov/ccd/Percent eligible for free or reduced-price meals: Computed using data from
National Center for Education Statistics, Common Core of Data, http://nces.ed.gov/ccd/Graduation rates: Diplomas Count 2007: Ready for What? Preparing Students for College,
Careers, and Life after High School, Editorial Projects in Education Weekly Research Center, 2007, http://www.edweek.org/ew/toc/2007/06/12/index.html. Data to estimate graduation rates were obtained from the U.S. Department of Education’s Common Core of Data. Diplomas Count uses the cumulative promotion index method to calculate grad-uation rates. This method estimates the percentage of ninth graders who will complete high school on time with a regular diploma, given the schooling conditions prevalent during a given school year.
Test scores: National Assessment of Educational Progress, State Profiles, http://nces.ed.gov/nationsreportcard/states/profile.asp
Test score ranks: Generated with National Assessment of Educational Progress, Data Explorer, http://nces.ed.gov/nationsreportcard.nde. The NAEP test is administered in every state in Math, Reading, Science, and Writing. The four possible achievement levels are below basic, basic, proficient, and advanced, from low to high respectively.
F Ig URE 5 : Co MPoS IT I on oF S TATE AnD Lo CAL REVEnUE AS Sh ARE o F gEnERAL REVEnUESee explanation for Figures 2 and 3 for information on U.S. Census sources. Income taxes include taxes collected from both individuals and corporations. Sales taxes include both general and selective sales taxes. “Other” includes charges and miscellaneous, license and other taxes, and grants-in-aid from the federal government.
F Ig URE 8 : Vo LAT I L I T y o F S TATE AnD Lo CAL TAx REVEnUE , 1990–2006Data for this figure come from two Bureau of Economic Analysis sources. Data for years 1994 to 2004 are from Receipts and Expenditures of State Governments and of Local Governments, October 2005, Figure 16, page 39, http://www.bea.gov/bea/ARTICLES/2003/06June/0603%20Rcpt&Exp.pdf Data for years 2005 and 2006 are from National Income and Product Accounts, Table 3.3, State and Local Government Current Receipts and Expenditures, 2007, http://www.bea.gov/national/nipaweb/Index.asp

�� p o l i c y F o c u S r e p o r T ● L i n c o L n i n s t i t u t e o f L a n d P o L i c y K e n y o n ● T h e p r o p e r T y Ta x – S c h o o l F u n d i n g d i l e m m a ��
. . . . . . . . . . . . . . . . . . .
A+ Illinois. 2007. Facts about Illinois’ education crisis. www.aplusillinois.org
ACCESS. 2007a. National Access Network, Teachers College, Columbia University. State by State page. www.schoolfunding.info/states/state_by_state.php3
———. 2007b. National Access Network, Teachers College, Columbia University. Know the Issues page. www.schoolfunding.info/issues/issues.php3
———. 2007c. National Access Network, Teachers College, Columbia University. Conference Proceedings page. www.schoolfunding.info/conference/2007/proceedings/php3
———. 2007d. National Access Network, Teachers College, Columbia University. Policy page. www.schoolfunding.info/policy/policy.php3
———. 2007e. National Access Network, Teachers College, Columbia University. News page. www.schoolfunding.info/news/news.php3
Allen, Michael, and Richard Woodbury. 2006. Containing the individual burden of property taxes: A case study of circuit breaker expansion in Maine. 59 National Tax Journal 665–683.
American Education Finance Association. 1995. Public school finance programs of the United States and Canada, 1993–1994, Vol. one. Albany, NY: American Education Finance Association and Center for the Study of the States, The Nelson A. Rockefeller Institute of Government, State University of New York.
Arsen, David, and David N. Plank. 2003. Michigan school finance under Proposal A: State control, local consequences. East Lansing, MI: The Education Policy Center at Michigan State University.
Baer, David. 2006. State handbook of economic, demographic and fiscal indicators 2006, 6th ed. Washington, DC: AARP.
Bahl, Roy, David Sjoquist, and W. Loren Williams. 1990. School finance reform and impact on property taxes. Proceedings of the Eighty-third Annual Conference, National Tax Association–Tax Institute of America, 163–171.
Berry, Christopher. 2007. The impact of school finance judgments on state fiscal policy. In School money trials: The legal pursuit of educational adequacy, eds. Martin R. West and Paul E. Peterson. Washington, DC: Brookings Institution Press.
Betts, Julian R. 2002. Discussion. In Education in the 21st century: Meeting the challenges of a changing world, ed. Yolanda K. Kodrzycki. Boston, MA: Federal Reserve Bank of Boston.
Bluestone, Barry, Alan Clayton-Matthews, and David Soule. 2006. Revenue sharing and the future of the Massachusetts economy. Boston: Massachusetts Municipal Association and Center for Urban and Regional Policy, Northeastern University.
Bowman, John H. 2005. Targeting property tax relief. Powerpoints for Economic Perspectives on State and Local Taxes Seminar, Lincoln Institute of Land Policy, Cambridge, Massachusetts, October 17.
———. 2006. Property tax responses to rapidly rising home values: District of Columbia, Maryland, and Virginia. 59 National Tax Journal 717–733.
———. 2007. State circuit breaker programs: Information for applicants in 2007, Table A-1. Personal correspondence.
Brunner, Eric J., and Jon Sonstelie. 2006. California’s school finance reform: An experiment in fiscal federalism. In The Tiebout model at fifty: Essays in public economics in honor of Wallace Oates, ed. William A. Fischel. Cambridge, MA: Lincoln Institute of Land Policy.
Brunori, David. 2006. New Jersey property tax relief—now comes the hard part. State Tax Notes, December 4.
Carr, Jennifer, and Cara Griffith. 2005. School finance litigation and property tax reform—part II: Reform. State Tax Notes, July 11: 167–172.
———. 2006. A resolution for Texas school finance litigation? State Tax Notes, June 5: 795–799.
———. 2007. New Jersey’s property tax reform: Potential legal challenges. State Tax Notes, February 26: 557–559.
Christoff, Chris, and Dawson Bell. 2007. Finally, there’s a deal. Detroit Free Press, May 26.
Colquhoun, Lorna. 2006. New Hampshire Supreme Court sets deadline for school funding formula. State Tax Notes, September 18.
Corcoran, Sean P., and William N. Evans. Forthcoming 2008. Equity, adequacy and the evolving state role in education finance. In Handbook of research on education finance and policy, eds. Helen F. Ladd and Edward B. Fiske. New York: Routledge.
Costrell, Robert M. 2005. Equity v. equity. Education Next Summer: 77–81.
Crane, Randall. 2006. Public finance concepts for planners. Working Paper. Lincoln Institute of Land Policy, Cambridge, MA.
Cutler, David M., Douglas W. Elmendorf, and Richard Zeckhauser. 1997. Restraining the Levia-than: Property tax limitation in Massachusetts. Working Paper no. 6196. National Bureau of Economics Research, Cambridge, MA.
Downes, Thomas. 2002. Do state governments matter? In Education in the 21st century: Meeting the challenges of a changing world, ed. Yolanda K. Kodrzycki. Boston, MA: Federal Reserve Bank of Boston.
Dressel, Scott. 2005. FY05 average single-family tax bills and assessed values. City & Town, September: 3–7.
Dunn, Josh, and Martha Derthick. 2007a. Adequately fatigued: Court rulings disappoint plaintiffs. Education Next, Summer.
———. 2007b. Judging money: When courts decide how to spend taxpayer dollars. Education Next, Winter.
Education Law Center. 2007. History of education law center. www.edlawcenter.org/ELCPublic/AboutELC/History.htm
Education Trust. 2005. The funding gap, 2005. www2.edtrust.org/NR/rdonlyres/31D276EF– 72E1–458A–8C71–E3D262A4C91E/0/FundingGap2005.pdf
———. 2006. Funding gaps, 2006. http://www2.edtrust.org/EdTrust/Press+Room/Funding+Gap+2006.htm
Evans, William N., Sheila E. Murray, and Robert
r e F e r e N c e S

�0 p o l i c y F o c u S r e p o r T ● L i n c o L n i n s t i t u t e o f L a n d P o L i c y
. . . . . . . . . . . . . . . . . . .
K e n y o n ● T h e p r o p e r T y Ta x – S c h o o l F u n d i n g d i l e m m a ��
M. Schwab. 2001. The property tax and educa-tion finance. In Property taxation and local government finance, ed. Wallace E. Oates, 209–235. Camb-ridge, MA: Lincoln Institute of Land Policy.
Ferguson, Ronald F., and Helen F. Ladd. 1996. How and why money matters: An analysis of Alabama schools. In Holding schools accountable, ed. Helen F. Ladd. Washington, DC: The Brookings Institution.
Fischel, William. A. 1996. How Serrano caused Proposition 13. 12 Journal of Law and Politics 607–645.
———. 2001a. The homevoter hypothesis. Cambridge, MA: Harvard University Press.
———. 2001b. Municipal corporations, homeowners and the benefit view of the property tax. In Property taxation and local government finance, ed. Wallace E. Oates, 33–78. Cambridge, MA: Lincoln Institute of Land Policy.
Fisher, Ronald C. 2007. State and local public finance, 3rd ed. Mason, OH: Thomson/South-Western College Publishing.
Giertz, J. Fred. 2006. The property tax bound. 59 National Tax Journal 695–705.
Gottlob, Brian, and Daphne Kenyon. 2005. Dollars diverted: Taking a hard look at education finance reform in New Hampshire. State Tax Notes, March 21: 861–871.
Groves, Harold M. 1945. Financing government, rev. ed. New York: Henry Holt and Co.
Grubb, W. Norton. 2006. What should be equal-ized: Litigation, equity and the “improved” school finance. Prepared for the Earl Warren Institute on Race, Ethnicity, and Diversity project at Univer-sity of California, Berkeley, Law School on “Re-thinking Rodriguez: Education as a Fundamental Right.” www.law.berkeley.edu/centers/ewi/research_k12education.html
Guthrie, James W. 2006. “Modern” education finance: How it differs from the “old” and the analytic and data collection changes it implies. Education Finance and Policy 1: 3–16.
Hall, Douglas. 2003. Budget history and drivers: Budget of the State of New Hampshire. Prepared for House and Senate Finance Committees, January 16. www.unh.edu/nhcpps
Hall, Douglas E., and Richard A. Minard, Jr. 2003. School finance reform: Trends and unintended consequences. Concord: New Hampshire Center for Public Policy Studies, April.
Hamilton, Billy. 2007a. Michigan’s SBT— The last hurrah. State Tax Notes, July 23, 45(4): 255–259.
———. 2007b. Standing at the crossroads—again. State Tax Notes, April 23, 44(4): 285–288.
Hansen, Janet S., Julie Marsh, Gina S. Ikemoto, and Heather Barney. 2007. School finance sys-tems and their responsiveness to performance pressure: A case study of Texas. Working paper 10. School Finance Redesign Project, Center on Reinventing Public Education, Daniel J. Evans School of Public Affairs, University of Washington, Seattle.
Hanushek, Eric A., ed. 2006. Courting failure: How school finance lawsuits exploit judges’ good intentions and harm our children. Stanford, CA: Education Next Books.
Heise, Michael. 2007. Adequacy litigation in an era of accountability. In School money trials: The legal pursuit of educational adequacy, eds. Martin R. West and Paul E. Peterson. Washington, DC: Brookings Institution Press.
Hess, Frederick M. 2007. Adequacy judgements and school reform. In School money trials: The legal pursuit of educational adequacy, eds. Martin R. West and Paul E. Peterson. Washington, DC: Brookings Institution Press.
Hoxby, Caroline M. 2001. All school finance equalizations are not created equal. Quarterly Journal of Economics 116: 1189–1231.
Imazeki, Jennifer, and Andrew Reschovsky. 2004. School finance reform in Texas: A never-ending story. In Helping children left behind: State aid and the pursuit of educational equity, ed. John Yinger. Cambridge, MA: MIT Press
Kenyon, Daphne A. 1997. Tax policy in an intergovernmental setting: Is it time for the U.S. to change? In Intergovernmental fiscal relations, ed. Ronald C. Fisher, 61–97. Boston: Kluwer Academic Publishers.
———. 2003. Tax equity is the wrong target, and property value per pupil is the wrong metric. State Tax Notes, November 17, 30(8): 644–648.
———. 2005. A school finance reform tale—constitutional twins but policy opposites. State Tax Notes, August 8, 37(6): 461–467.
———. 2007. Re-examining the role of the property tax in school funding. Presented at the American Education Finance Association meetings, March 23.
Kozol, Jonathan. 1991. Savage inequalities: Children in America’s schools. New York: Crown Publishers, Inc.
Ladd, Helen F., and Janet S. Hansen, eds. 1999. Making money matter: Financing America’s schools. Committee on Education Finance, Commission on Behavioral and Social Sciences and Educa-tion, National Research Council. Washington, DC: National Academy Press.
Loeb, Susanna. 2001. Commentary. In Property taxation and local government finance, ed. Wallace E. Oates, 236–241. Cambridge, MA: Lincoln Institute of Land Policy.
Lukemeyer, Anna. 2003. Courts as policymakers: School finance reform litigation. New York: LFB Scholarly Publishing LLC.
Lyons, Karen, Sarah Farkas, and Nicholas Johnson. 2007. The property tax circuit breaker: A survey of current programs. State Tax Notes 44(4): 261–273.
McDonald, Jane, Robert Kaplow, and Paul Chapman, 2006. School finance reform: The role of the courts from 1968 to1998. National Forum of Educational Administration and Supervision Journal-Electronic 23(4).
McGuire, Therese J. and Leslie E. Papke. Forthcoming 2008. Equity, adequacy and the evolving state role in education finance. In Handbook of research on education finance and policy, eds. Helen F. Ladd and Edward B. Fiske. New York: Routledge.
McKinley, Sandra K. 2005a. The journey to adequacy: The DeRolph saga. Journal of Education Finance 30(3): 288–312.
———. 2005b. The journey to adequacy: The DeRolph saga. Journal of Education Finance 30(4): 321–381.
McMillan, Kevin R. 1998. The turning tide: The emerging fourth wave of school finance litigation and the courts’ lingering institutional concerns. 58 Ohio State Law Journal 1867.
Manzo, Kathleen Kennedy. 2007. Report pans how states set the bar. Education Week. October 10.

�0 p o l i c y F o c u S r e p o r T ● L i n c o L n i n s t i t u t e o f L a n d P o L i c y K e n y o n ● T h e p r o p e r T y Ta x – S c h o o l F u n d i n g d i l e m m a ��
. . . . . . . . . . . . . . . . . . .
Michigan Department of Treasury, Office of Revenue and Tax Analysis. 2002. School finance reform in Michigan: Proposal A: Retrospective. December.
Minard, Richard A. 2004. Putting pressure on property taxes. Concord: New Hampshire Center for Public Policy. August.
Minorini, Paul A. and Stephen D. Sugarman. 1999. School finance litigation in the name of educational equity: Its evolution, impact, and future. In Equity and adequacy issues in education finance: Issues and perspectives, eds. Helen F. Ladd, Rosemary Chalk, and Janet S. Hansen. Washing-ton, DC: Committee on Education Finance, Commission on Behavioral and Social Sciences and Education, National Research Council.
Murray, Sheila E., and Kim Rueben. 2007. School finance over time: How changing struc-tures affect support for K–12 education. Work- ing paper. Lincoln Institute of Land Policy, Cambridge, Massachusetts.
National Assessment of Educational Progress. 2007. National Assessment of Educational Performance Data Explorer. http://nces.ed.gov/nationsreportcard.nde
National Center for Education Statistics. 2007a. Common Core of Data. http://nces.ed.gov/ccd/
———. 2007b. Digest of Education Statistics. http://nces.ed.gov
National Center on Education and the Economy. 2007. Tough choices or tough times. San Francisco: Jossey-Bass.
National Conference of State Legislatures. 2002. A guide to property taxes: Property tax relief. Washing-ton, DC: National Conference of State Legislatures.
National Education Association. 2002. Public education embroiled in a taxing situation. In NEA Today: News-March. www.nea.org/neatoday/0203/news18.html
———. 2003. Rankings of the States, 2002, and Estimates of School Statistics, 2003. http://www.nea.org/edstats/images/03rankings.pdf
Nechyba, Thomas J. 2001. The benefit view and the new view: Where do we stand, twenty-five years into the debate? In Property taxation and local government finance, ed. Wallace E. Oates, 113–122. Cambridge, MA: Lincoln Institute of Land Policy.
Oates, Wallace E. 2001. Property taxation and local government finance: An overview and some reflections. In Property taxation and local government finance, ed. Wallace E. Oates, 21–32. Cambridge, MA: Lincoln Institute of Land Policy.
Odden, Allan R. and Lawrence O. Picus. 2000. School finance: A policy perspective, 2nd ed. Boston: McGraw Hill.
Olabisi, Oyebola. 2006. New Hampshire’s quest for a constitutionally adequate education. New England Public Policy Center Discussion Paper 06–2. Federal Reserve Bank of Boston, October.
Peirce, Neal, and Curtis Johnson. 2006. Are New England communities too small to be governed efficiently? The Sunday Telegraph, January 1: E–4.
Public Policy Institute of California. 2000. Has school finance reform been good for California? Issue #30. Public Policy Institute of California, San Francisco.
Reschovsky, Andrew. 1994. Fiscal equalization and school finance. 47 National Tax Journal 185–197.
———. 2006. Can “reform” save the property tax? If so, how? Powerpoints for The Practice and Politics of Property Tax Limitations, 72nd Annual IAAO Conference, Milwaukee, Wisconsin. October 9.
Rhode Island Public Expenditure Council (RIPEC). 2007. How Rhode Island compares: State and local taxes per capita, per $1,000 of personal income. Providence: RIPEC.
Robinson, V. Gene. 2007. Why education funding is a religious issue. New Hampshire Episcopal News, June.
Rosen, Harvey S. 2005. Public finance, 7th ed. New York: McGraw-Hill/Irwin.
Rueben, Kim. 2006. California’s education financing system and state budget. Powerpoints for Economic Perspectives on Property Taxes and School Finance seminar. Lincoln Institute of Land Policy, Cambridge, Massachusetts. May 12.
Scherer, Marge. 1992–1993. On “Savage Inequalities”: A conversation with Jonathan Kozol. Educational Leadership 50(4): 4. www.whitman.edu/education/EdWebCourses/Web360/downloads/Kozol_Interview.pdf
Sheffrin, Steven M. 1998. The future of the prop-erty tax: A political economy perspective. In The future of state taxation, ed. David Brunori, 129–145. Washington, DC: Urban Institute Press.
Sielke, Catherine C., John Dayton, C. Thomas Holmes, and Anne L. Jefferson. 2001. Public school finance programs of the United States and Canada: 1998–1999. National Center for Education Statistics. http://nces.ed.gov/pubsearch/pubsinfo.asp?pubid=2001309
Smothers, Ronald. 2007. New Jersey Senate passes tax plan, ending impasse. New York Times, February 6.
Sonstelie, Jon, Eric Brunner, and Kenneth Ardon. 2000. For better or for worse? School reform in California. San Francisco: Public Policy Institute of California. Starr, Kenneth W. 2007. The uncertain future of adequacy remedies. In School money trials: The legal pursuit of educational adequacy, eds. Martin R. West and Paul E. Peterson. Washington, DC: Brookings Institution Press.
Stiefel, Leanna. 2006. Insight from hindsight: The new education finance of the next decade. Education Finance and Policy 1: 383–395.
Tax Foundation. 2006. Public education revenue by state and source, fiscal year 2004. www.taxfoundation.org/taxdata/show/1918.html
Thompson, David C. and Faith E. Crampton. 2002. The impact of school finance litigation: A long view. Journal of Education Finance 28(1): 133–172.
Thro, William E. 1993. The role of language of the state education clauses in school finance litigation. Education Law Reporter, 19–31.
Tractenberg, Paul L. 2006. The refusal to “feder-alize” the quest for equal educational opportunity, the role of state courts and the impact of differ-ent state constitutional theories: A tale of two states. Prepared for the Earl Warren Institute on Race, Ethnicity, and Diversity project at Univer-sity of California, Berkeley, Law School on “Re-thinking Rodriguez: Education as a Fundamental Right.” www.law.berkeley.edu/centers/ewi/research_k12education.html
U.S. Census. 2007a. Annual Survey of Govern-ment Finances, 2005. www.census.gov/govs/www/estimate05.html
———. 2007b. Public Education Finances, 2005. http://ftp2.census.gov/govs/school/05f33pub.pdf
Wassmer, Robert W. 2006. The “roller coaster” of California state budgeting after Proposition 13. FRC report no. 131. Fiscal Research Center, Andrew Young School of Policy Studies, Georgia State University, Atlanta, GA.

�� p o l i c y F o c u S r e p o r T ● L i n c o L n i n s t i t u t e o f L a n d P o L i c y
. . . . . . . . . . . . . . . . . . .
K e n y o n ● T h e p r o p e r T y Ta x – S c h o o l F u n d i n g d i l e m m a ��
West, Martin R., and Paul E. Peterson. 2007. Appendix: Significant school finance judgements, 1971–2005. In School money trials: The legal pursuit of educational adequacy, eds. Martin R. West and Paul E. Peterson. Washington, DC: Brookings Institution Press.
Willard, Dennis J. 2007. Governor to take up changes in school funding. Beacon Journal, July 5.
Wong, Kenneth K. 1999. Funding public schools: Politics and policies. Lawrence: University of Kansas Press.
Yinger, John. 2001. Alternative paths to property tax relief. In Property taxation and local government finance, ed. Wallace E. Oates. Cambridge, MA: Lincoln Institute of Land Policy.
———. 2004. State aid and the pursuit of educational equity: An overview. In Helping children left behind: State aid and the pursuit of educational equity, ed. John Yinger. Cambridge, MA: MIT Press.
Yinger, John, Howard S. Bloom, Azel Borsch-Supan, and Helen F. Ladd. 1988. Property taxes and house values: The theory and estimation of intrajurisdictional property tax capitalization. San Diego: Academic Press.
Youngman, Joan M. 2002. Enlarging the property tax debate—regressivity and fairness, State Tax Notes, October 7, 26(1): 45–52.
Zodrow, George R. 2001. Reflections on the new view and the benefit view of the property tax. In Property taxation and local government finance, ed. Wallace E. Oates, 79–112. Cambridge, MA: Lincoln Institute of Land Policy.
Legal Citations
Abbott v. Burke 100 N.J. 269, 495 A.2d 376 (1985) (Abbott I)
Abbott v. Burke 119 N.J. 287, 575 A.2d 359 (1990) (Abbott II)
Abbott v. Burke 153 N.J. 480, 710 A.2d 450 (1998) (Abbott V)
Abbott v. Burke 177 N.J. 596, 832 A 2d 906 (2003) (Abbott X)
Brown v. Board of Education of Topeka, 347 U.S. 483 (1954)
Burrus v. Wilkerson, 310 F. Supp. 572 (W.D. Va. 1969), aff ’d per curiam, 397 U.S. 44 (1970)
Claremont School District v. Governor, 138 N.H. 183, 635 A.2d 1375 (New Hampshire 1993) (Claremont I)
Claremont School District v. Governor, 142 N.H. 462, 703 A.2d 1353 (New Hampshire 1997) (Claremont II)
Claremont School District v. Governor, 147 N.H. 499, 794 A.2d 744 (New Hampshire 2002) (Claremont IV)
DeRolph v. State, 78 Ohio St. 3d 193, 677 N.E.2d 733 (1997) (DeRolph I)
DeRolph v. State, 89 Ohio St.3d 1, 728 N.E.2d 993 (2000) (DeRolph II)
DeRolph v. State, 93 Ohio St.3d 309, 310, 754 N.E.2d 1184 (2001) (DeRolph III)
DeRolph v. State, 97 Ohio St.3d 434 (2002) (DeRolph IV)
Edgewood Independent School Dist. v. Kirby, 33 Tex. Sup. J. 12, 777 S.W.2d 391 (1989) (Edgewood I)
Edgewood Independent School Dist. v. Meno, 893 S.W.2d 450 (Texas 1995) (Edgewood IV)
Gould v. Orr, 506 N.W.2d 349 (Nebraska 1993)
Governor v. State Treasurer, 203 N.W.2d 457 (Michigan 1972)
Hancock v. Driscoll, 443 Mass. 428 (2005)
Londonderry v. State, 907 A.2d 988 (New Hampshire 2006)
McDuffy v. Secretary of the Executive Office of Education, 415 Mass. 545, 615 N.E.2d 516 (1993) (McDuffy)
McInnis v. Shapiro, 293 F. Supp. 327 (ND Ill. 1968)
Milliken v. Green, 390 Mich. 389; 212 N.W.2d 711 (1973)
Neeley v. West-Orange Cove Consolidated School District, 176 S.W.2d 746, 794-98 (Texas 2005)
Robinson v. Cahill, 303 A.2d 273 (New Jersey 1973) (Robinson I)
Robinson v. Cahill, 358 A.2d 457, 459 (New Jersey 1976) (Robinson VI)
Robinson v. Cahill, 360 A.2d 400 (New Jersey 1976) (Robinson VII)
Rose v. Council for Better Education, Inc. 790 S.W.2d 186 (Kentucky 1989) (Rose)
San Antonio Independent School Dis. v. Rodriguez, 411 U.S. 1, 93 S. Ct. 1278, 36 L.Ed.2d 16 (1973) (Rodriguez)
Serrano v. Priest, 5 Cal.3d 584, 487 P.2d 1241 (California 1971) (Serrano I)
Serrano v. Priest, 18 Cal.3d 728, 5557 P.2d 929 (California 1976) (Serrano II)
Serrano v. Priest 226 Cal. Rptr. 584 (Court of Appeal, 2d District 1986) (Serrano III)
State ex rel. State v. Lewis, 98 Ohio St. 3d at 11, 2003 Ohio–2476 (2003) (State v. Lewis, DeRolph V)
�� p o l i c y F o c u S r e p o r T ● L i n c o L n i n s t i t u t e o f L a n d P o L i c y K e n y o n ● T h e p r o p e r T y Ta x – S c h o o l F u n d i n g d i l e m m a ��
. . . . . . . . . . . . . . . . . . .acknowledgments
Thanks to Kristen Margeson and Bethany Paquin for able and conscientious research assistance, which contributed significantly to the quality of this paper. Thanks for their helpful comments on the work in progress to Gregory K. Ingram, Stephen Lipscomb, Kristen Margeson, Sheila Murray, Bethany Paquin, Kim Rueben, Robert Toutkoushian, Henry Wulf, and Joan Youngman, and to the participants in a May 2006 New England Study Group seminar sponsored by the Federal Reserve Bank of Boston, and those in a session of the March 2007 annual meeting of the American Education Finance Association.
In addition, special thanks go to the following individuals who participated in a May 2007 seminar at the Lincoln Institute on the draft report:
• William Ardinger, Attorney, Rath, Young & Pignatelli, Concord, New Hampshire
• Carrie Conaway, Director of Planning, Research, and Evaluation, Massachusetts Department of Education
• Robert M. Costrell, Professor of Education Reform and Economics, University of Arkansas, Fayetteville
• Thomas Downes, Associate Professor of Economics, Tufts University, Medford, Massachusetts
• William A. Fischel, Professor of Economics, Dartmouth College, Hanover, New Hampshire
• Frederick Hess, Director of Education Policy Studies, American Enterprise Institute, Washington, DC
• Dan Hughes, former New Hampshire legislator, New Castle
• Ranjana Madhusudhan, Assistant Director, New Jersey Department of Treasury, Trenton
• Therese McGuire, Professor of Management and Strategy, Northwestern University, Evanston, Illinois
• Andrew Reschovsky, Professor of Public Affairs and Applied Economics, University of Wisconsin-Madison
• Douglas Roberts, Professor of Public Policy and Social Research, Michigan State University, East Lansing
• Kim Rueben, Senior Research Associate, Urban Institute, Washington, DC
• Amy Ellen Schwartz, Professor of Public Policy, Education, and Economics, New York University
Several Lincoln Institute staff and fellows also participated in the seminar: Anthony Flint, director of public affairs; Thomas Gemelli, department assistant, Department of Valuation and Taxation; Gregory K. Ingram, president and CEO; Ann LeRoyer, senior editor and director of publications; Jane Malme, fellow; Semida Munteanu, research and management coordinator, Department of Valuation and Taxation; and Joan Youngman, senior fellow and chairman, Department of Valuation and Taxation.

text

acknowledgments Thanks to Kristen Margeson and Bethany Paquin for able and con- scientious research assistance, which contributed significantly to the quality of this paper. Thanks for their helpful comments on the work in progress to Gregory K. Ingram, Stephen Lipscomb, Kristen Margeson, Sheila Murray, Bethany Paquin, Kim Rueben, Robert Toutkoushian, Henry Wulf, and Joan Youngman, and to the participants in a May 2006 New England Study Group seminar sponsored by the Federal Reserve Bank of Boston, and those in a session of the March 2007 annual meeting of the American Education Finance Association.
In addition, special thanks go to the following individuals who participated in a May 2007 seminar at the Lincoln Institute on the draft report: • William Ardinger, Attorney, Rath, Young & Pignatelli, Concord,
New Hampshire • Carrie Conaway, Director of Planning, Research, and Evaluation,
Massachusetts Department of Education • Robert M. Costrell, Professor of Education Reform and Economics,
University of Arkansas, Fayetteville • Thomas Downes, Associate Professor of Economics, Tufts University,
Medford, Massachusetts • William A Fischel, Professor of Economics, Dartmouth College,
Hanover, New Hampshire • Frederick Hess, Director of Education Policy Studies, American
Enterprise Institute, Washington, DC • Dan Hughes, former New Hampshire legislator, New Castle • Ranjana Madhusudhan, Assistant Director, New Jersey
Department of Treasury, Trenton • Therese McGuire, Professor of Management and Strategy,
Northwestern University, Evanston, Illinois • Andrew Reschovsky, Professor of Public Affairs and Applied
Economics, University of Wisconsin-Madison • Douglas Roberts, Professor of Public Policy and Social Research,
Michigan State University, East Lansing • Kim Rueben, Senior Research Associate, Urban Institute,
Washington, DC • Amy Ellen Schwartz, Professor of Public Policy, Education,
and Economics, New York University
Several Lincoln Institute staff and fellows also participated in the seminar: Anthony Flint, director of public affairs; Thomas Gemelli, department assistant, Department of Valuation and Taxation; Gregory K. Ingram, president and CEO; Ann LeRoyer, senior editor and director of publications; Jane Malme, fellow; Semida Munteanu, research and management coordinator, Department of Valuation and Taxation; and Joan Youngman, senior fellow and chairman, Department of Valuation and Taxation.
ordering Information
To order single or multiple copies of this policy focus report, visit the Lincoln Institute Web site at www.lincolninst.edu, and search by author or title. To request more information on the list price, discount prices for bookstores and multiple-copy orders, and shipping and handling costs, send e-mail to [email protected].
Production Credits
P RO J E C T M A NAG E R / E D I TO R : Ann LeRoyer
D E S I G N & P RO D U C T I O N : DG Communications/NonprofitDesign.com
P R I N T I N G : Recycled Paper Printing, Boston
Photographs
Page 34: Bethany P. Paquin
All other photos are provided byIndexOpen.com, Photos.com, iStockphoto.com, and Photodisc
113 Brattle StreetCambridge, MA 02138-3400 USA
Phone: 617-661-3016 x127 or 800-LAND-USE (800-526-3873)
Fax: 617-661-7235 or 800-LAND-944 (800-526-3944)
E-mail: [email protected]: www.lincolninst.edu
Printed on recycled paper using soy-based inks.

ISBn 978-1-55844-168-2Policy Focus Report/Code PF015
The Property Tax- School Funding Dilemma
States across the country have been under intense pressure over the last several decades to reduce the property tax burden on homeowners. At the same time, the demand has been equally clear for improved performance in public education, often in the context of litigation aimed at equitable statewide school funding. In this report Daphne A. Kenyon, visiting fellow at the Lincoln Institute of Land Policy, explores how states might best address these two timely policy objectives.
The report includes a comprehensive review of recent research on both the property tax and school funding, and case studies of seven states—California, Massachusetts, Michigan, New Hampshire, New Jersey, Ohio, and Texas—most of them heavily reliant on property tax revenues to fund schools. The information and analysis is intended to serve as a guide for policy makers who are grappling with the twin challenges of court mandates on school funding and the consistent public pressure to lower property taxes. While there is no one-size-fits-all solution, the report recommends addressing property taxes and school funding separately.
Arguing that the use of property tax revenue for schools is a fundamentally sound mechanism, the report points out that increasing state aid for education does not necessarily result in lower property taxes, and cautions against switching to greater reliance on a sales tax to fund schools. Instead, a more targeted effort can achieve tax fairness and relief through the use of circuit breakers that adjust property tax bills based on income and the ability to pay. Many states do not take advantage of this policy instrument, or limit its application to the elderly.
Addressing the complex issue of statewide funding for schools, the report also recommends a
targeted approach—distributing state aid for public education to apply to the neediest school districts, schools, and students. State policy makers should not aim to provide any specific percentage for the state’s share of funding K–12 education, the report concludes.
ISBN 978-1-55844-168-2


![The Dilemma [Chapter 1: The Dilemma , Exponential Future]](https://static.fdocuments.net/doc/165x107/58eeb6841a28ab38788b4593/the-dilemma-chapter-1-the-dilemma-exponential-future.jpg)