THE PROPERTIES OF FLUORINE CONTAINING DIAMOND-LIKE …
20
1 Draft: F-DLC-PACVD-18-6-10 THE PROPERTIES OF FLUORINE CONTAINING DIAMOND-LIKE CARBON FILMS PREPARED BY PULSED DC PLASMA-ACTIVATED CHEMICAL VAPOUR DEPOSITION A. Bendavid * , P.J. Martin, L. Randeniya, M.S. Amin, R. Rohanizadeh 1 CSIRO Materials Science and Engineering, PO Box 218 Lindfield, NSW 2070, Australia. 1 Faculty of Pharmacy, University of Sydney, NSW 2006, Australia. ABSTRACT Diamond-like carbon films containing up to 23.1 at. % of fluorine (DLC-F), were deposited onto silicon substrates by low-frequency, pulsed DC, plasma-activated, chemical vapour deposition (PACVD). The influence of fluorine on plasma current density, deposition rate, composition, bonding structure, surface energy, hardness, stress and biocompatibility were investigated and correlated with the fluorine content. X-ray photoelectron spectroscopy (XPS) analysis revealed the presence C-C, C-CF and C-F for F-DLC films with low fluorine concentration (1.5-12.1 at. %), however for films with higher fluorine content (23.0 at. %) an additional peak due to CF 2 bonding was detected. The addition of fluorine into the DLC film resulted in lower stress and hardness values. The reduction in these values was attributed to the substitution of strong C=C by weaker C-F bonds which induces a decrease in hardness. Ion scattering spectrometery (ISS) measurements revealed the presence of fluorine atoms in the outmost layer of the F-DLC films and there was no evidence of surface oxygen contamination. The water contact angle was found to increases with increasing fluorine content and has been attributed to the change of the bonding nature in the films, in particularly increasing CF and CF 2 bonds. Biocompatibility tests performed using MG-63 osteoblast-like cell cultures indicated homogeneous and optimal tissue integration for both the DLC and the F-DLC surfaces. This pulsed- PACVD technique has been shown to produce biocompatible DLC and F-DLC coatings with potential for large area applications. Keywords: Diamond-like carbon, DC PACVD, fluorine, biocompatibility, surface energy, mechanical properties * Corresponding author: [email protected] , Tel: (+61) 2 9413 7109, Fax: (+61) 2 9413 7200
Transcript of THE PROPERTIES OF FLUORINE CONTAINING DIAMOND-LIKE …

1
Draft: F-DLC-PACVD-18-6-10
THE PROPERTIES OF FLUORINE CONTAINING DIAMOND-LIKE CARBON FILMS PREPARED BY PULSED DC
PLASMA-ACTIVATED CHEMICAL VAPOUR DEPOSITION
A. Bendavid*, P.J. Martin, L. Randeniya, M.S. Amin, R. Rohanizadeh1
CSIRO Materials Science and Engineering, PO Box 218 Lindfield, NSW 2070,
Australia.
1 Faculty of Pharmacy, University of Sydney, NSW 2006, Australia. ABSTRACT Diamond-like carbon films containing up to 23.1 at. % of fluorine (DLC-F), were
deposited onto silicon substrates by low-frequency, pulsed DC, plasma-activated,
chemical vapour deposition (PACVD). The influence of fluorine on plasma current
density, deposition rate, composition, bonding structure, surface energy, hardness,
stress and biocompatibility were investigated and correlated with the fluorine content.
X-ray photoelectron spectroscopy (XPS) analysis revealed the presence C-C, C-CF
and C-F for F-DLC films with low fluorine concentration (1.5-12.1 at. %), however
for films with higher fluorine content (23.0 at. %) an additional peak due to CF2
bonding was detected. The addition of fluorine into the DLC film resulted in lower
stress and hardness values. The reduction in these values was attributed to the
substitution of strong C=C by weaker C-F bonds which induces a decrease in
hardness. Ion scattering spectrometery (ISS) measurements revealed the presence of
fluorine atoms in the outmost layer of the F-DLC films and there was no evidence of
surface oxygen contamination. The water contact angle was found to increases with
increasing fluorine content and has been attributed to the change of the bonding nature
in the films, in particularly increasing CF and CF2 bonds. Biocompatibility tests
performed using MG-63 osteoblast-like cell cultures indicated homogeneous and
optimal tissue integration for both the DLC and the F-DLC surfaces. This pulsed-
PACVD technique has been shown to produce biocompatible DLC and F-DLC
coatings with potential for large area applications.
Keywords: Diamond-like carbon, DC PACVD, fluorine, biocompatibility , surface energy, mechanical properties
*Corresponding author: [email protected], Tel: (+61) 2 9413 7109, Fax: (+61) 2 9413 7200
mci133
Text Box
NOTICE: this is the author’s version of a work that was accepted for publication in Diamond and Related Materials. Changes resulting from the publishing process, such as peer review, editing, corrections, structural formatting, and other quality control mechanisms may not be reflected in this document. Changes may have been made to this work since it was submitted for publication. A definitive version was subsequently published in Diamond and Related Materials, Vol. 19, no. 12, 2010, Pages 1466-1471, doi:10.1016/j.diamond.2010.10.001

2
1. INTRODUCTION
Diamond-like carbon (DLC) has been the focus of extensive research in recent years
due to its potential for a wide range of applications. The combination of low friction,
wear resistance, high hardness, biocompatibility and chemical inertness renders it
suitable for applications ranging from the coating of stents, heart valves and
orthopaedic prostheses in the biomedical industry [1], to the coating of magnetic
storage disks [2] in the semiconductor industry. In particular, the surface properties
such as hydrophobicity, low surface free energy and antithrombogeneity [3] have also
been the subject of recent studies. DLC films have several drawbacks related to high
compressive stress, which leads to poor adhesion on some practical substrates. In
order to overcome some of these limitations, additional elements such as silicon,
fluorine, oxygen, nitrogen and various metals have been introduced into DLC. There
has also been great interest in the fluorination of diamond-like carbon (F-DLC) films
due to its particularly low surface energy [4]. The focus of the research has been to
develop super hydrophobic thin films on various substrates [5]. Ishinhara et al. [6]
reported the reduction of bacterial adhesion by altering the surface properties of the
DLC by doping it with fluorine. Hauret et. al [7] showed that there was no adverse
effect on cell proliferation and attachment on F-DLC surfaces using in-vitro cell
culturing experiments.
A number of different deposition technologies have been described for synthesising
DLC films [8]. The most common deposition technique used is rf based (13.56 MHz)
plasma-enhanced chemical vapour deposition (PECVD). This technique allows high
quality DLC coatings to be deposited onto complex shaped items at low temperature,
although it is difficult to scale up the process to industrial size. In recent times, there
have been various studies to find alternatives to the standard RF processes. Bipolar-
pulsed direct current (DC) discharge was identified as a technique that is both suitable
for scale-up and also enables the deposition of thick DLC coatings because surface
charge-up during growth of the coatings can be avoided [9]. Pulsed DC-PACVD has
been successfully used to modify DLC by adding various elements and oxides such
Si, SiO2, ZrO2 and TiO2 [10-14] to form nanocomposite thin film at low deposition
temperature. This technique is preferred over RF PACVD because it enables closer
packing of the items to be coated and a deeper penetration of the plasma into holes or
around edges, , which therefore allows for a higher throughput of coated items.

3
In this study, DLC films containing a range of 0 to 23.1 at. % of fluorine was
deposited by low-frequency pulsed DC plasma-activated chemical vapour deposition
(PACVD). The influence of fluorine content on deposition rate, bonding structure,
surface energy, hardness, stress and biocompatibility of the films with MG63
osteoblast-like cells is investigated and discussed.
2. EXPERIMENTAL
The diamond like carbon (DLC) and fluorinated DLC (F-DLC) films were deposited
onto (100) conducting silicon wafers (resistivity 0.05 Ω cm) using pulsed dc PACVD
described in detail in [10]. Methane (CH4), carbon tetrafluoride (CF4)
tetramethylsilane (Si(CH3)4, TMS), (99.9 % purity, Sigma-Aldrich) and argon (Ar)
were used as process gases. The gases were introduced into the system through a gas
distributor using mass flow controllers. The deposition pressure was set independently
of the gas flow by adjusting a throttle valve. Prior to deposition, the substrate was
sputter cleaned in-situ for 10 mins in argon plasma operated at 200 Pa with the argon
flow rate set at 240 sccm. The substrate electrode was powered by a pulsed d.c. power
supply operated at a range of frequencies and pulsing conditions as described by
Bendavid et. al. [10]. The range of plasma parameters was as follows: effective bias
current Ib peak (as displayed by the d.c. power supply): 0.7 - 4.0 A (pulse current
density J = 1.5 to 8.0 mA cm-2); maximum bias voltage 1000V; negative pulse
duration range 5-1000 µs; negative pulse pause duration range 5-1000 µs. In order to
improve the adhesion, a thin layer of hydrogenated amorphous silicon carbide (a-
SiC:H) was first deposited onto the substrate using tetramethylsilane (TMS) as
precursor. The interlayer deposition was approximately 50 nm in thickness. The
DLC-F films were deposited using a mixture of CH4 and CF4 as precursors. The flow
rate of CH4 was kept constant at 280 sccm and the flow rate of CF4 was varied
between 0 and 90 sccm in order to obtain different fluorine contents in the films. The
deposition pressure was set at 200 Pa at peak voltage of 415 V. The film thickness
was about 1 µm, as measured by surface profilometry (Dektak 3030 stylus
profilometer). The chemical bonding and composition of the deposited films was
assessed by XPS using a Specs 150 SAGE instrument operated with a Mg Kα X-ray
source (Mg anode operated at 10 keV and 10 mA) [15]. The C1s peak at 284.6 eV
was used as a reference to compensate for any surface charging. Raman
measurements were performed using a Renishaw Raman Spectroscope 2000 at the
excitation wavelength of the 514 nm Ar laser line and with a spot size of 5 microns.

4
The spectral resolution was 1 cm-1. Prior to contact angle measurements, the samples
were ultrasonically cleaned in 99 % ethanol solution and distilled water in sequence.
Contact angles were obtained using the sessile drop technique. The system consists of
a CCD video camera, a micro-syringe and a temperature controlled environment
(22 oC). The contact angles were calculated from the shape of the drop image using an
image analysis system, with an accuracy of 2 degrees. Four test liquids were used for
the surface free energy measurements; distilled water, glycerol, diiodomethane and
ethylene glycol (Sigma Aldrich). Surface energies of the samples, their dispersive and
polar components were calculated using Good-Girifalco-Fowkes [16] approach. Ion
scattering spectrometry (ISS) was used to assess the elemental information of the
outermost monolayer of the surface of the film. The ISS system operated at a pressure
of ~ 2 x 10⁻⁵ Pa of helium [17]. The spectra were obtained with a 1 keV 4He+ ion
beam. The hardness of the films was measured with a CSIRO UMIS 2000 indentation
instrument fitted with a diamond Berkovich indentor. Indentation tests were
performed over a load range of 1 to 10 mN. The residual stress in the films was
determined by measuring the radius of curvature of the substrate before and after
deposition using the Dektak 3030 stylus profilometer [18]. Biocompatibility tests
were performed by using cell culture. The osteoblasts were cultured using standard
tissue culture protocols previously described [36]. Samples were dried and gold
sputter coated for SEM. A Phillips XL30 SEM was used at high vacuum to view
samples.
The ellipsometric parameters of the films were measured with a custom-made rotating
spectroscopic ellipsometer [19]. The optical band gap Eg of the DLC-F film was
determined by fitting the Tauc relation (αhυ)1/2 = m (hυ - Eg) where α is the
absorption coefficient of the film, h is the Planck constant, υ is the frequency of
radiation and m is a constant proportional to the joint density of states. The intercept
of the extrapolated linear fit to the experimental data of a plot of (αhυ)1/2 versus
photon energy, hυ is determined as the optical band gap Eg.
3. RESULTS AND DISCUSSION 3.1. Deposition rate and fluorine content as a function of fluorine-containing precursor gas The dependence of the fluorine content and deposition rate of the films as a function
of the volume fraction of CF4 in the total gas mixture is shown in Fig. 1. The fluorine

5
content in the film (measured by XPS) increases with the increase in the CF4 fraction
in the plasma up to 23.1 at. % (92 vol. % CF4). A number of researchers [20,21]
reported a linear relationship between the amount of CF4 in the gas phase and fluorine
content in the film for F-DLC films deposited by RF-PECVD. They reported much
higher flourine content in the films for similar gas composition than obtained in this
study which may be due to the higher plasma frequency (13.56 MHz) used, leading to
different dissociation rates in the plasma [20,21].
The deposition rate decreased from 75 nm min-1 with no CF4 to
12 nm min-1 at 92 vol. % CF4. This has been attributed to an increase in density of
–CFx groups and F+ in the plasma resulting in an increase in etching of the surface,
since F+ is an efficient etching species. The ion bombardment leads to increased
fragmentation of the hydrocarbon species arriving at the substrate to ever more
hydrogen deficient radicals species, resulting in an increased sticking coefficient on
the surface. As the amount of CF4 in the gas phase increases the pulse current density
decreased (Fig. 2) resulting in less ion bombardment. The increase amount F+ in the
plasma decreases the sticking coefficient resulting in lower deposition rate. In order to
make a process viable in industry the film deposition rate is a crucial factor in
determining the efficacy of the coating process (i.e. reducing the cycle time for the
deposition process). Figure 3 shows the pulse current density as a function of the
deposition rate, as the pulse current density increases the deposition rate increases.
For the current deposition conditions the deposition rate plateaus at about 75 nm min-1
corresponding to 4.5 mA cm-2 current density. The pulse current density could be used
as in-situ measurements indicator of the deposition rate, that is if other deposition
parameters remain the same.

6
0.0 0.2 0.4 0.6 0.8 1.0
0
20
40
60
80
0
5
10
15
20
25
Flo
urin
e C
onte
nt in
the
film
(at
. %)
Dep
ositi
on r
ate
(nm
/min
)
CF4/(CF
4+CH
4) (vol. %)
Figure 1. Deposition rate () and fluorine content in the films () as a function of CF4 fraction in the plasma.
0.0 0.2 0.4 0.6 0.8 1.00
1
2
3
4
5
6
7
8
CF4/(CF
4+CH
4) (vol. %)
Pul
se C
urre
nt D
ensi
ty (
mA
cm
-2)
Figure 2. Relationship between pulsed current density and CF4 fraction in the plasma.

7
1 2 3 4 5 6 7 8
10
20
30
40
50
60
70
80
Pulse Current Density (mA cm-2)
Dep
ositi
on r
ate
(nm
/min
)
Figure 3. Relationship between deposition rate and pulsed current density.
3.2. XPS measurements The fluorine content was determined from the comparison of normalised area
intensities of C1s and F1s peaks of the XPS measurements and the hydrogen
contribution was neglected since it could not be measured by XPS. In all the F-DLC
samples a single F1s peak was observed at 687 eV, which is consistent with the C-F
bond [22]. Figure 4 shows the deconvolution of the XPS C1s peaks obtained from the
DLC, F-DLC (1.5 at. %), F-DLC (12.1 at. %) and F-DLC (23.1 at. %) films. The
spectrum show that at low fluorine content (1.5 at. %) in the films three peaks were
observed with bonding energies of 284.6 eV, 286.7 eV and 289.3 eV and they were
assigned to C-C, C-CF and C-F, respectively [5]. As the fluorine content increases to
12.1 at. %, the C-F peak appear to be larger and for F-DLC (23.1 at %) an additional
peak was observed at 291.7 eV which was assigned to CF2 bonding [5]. M. Jiang et
al. [23] reported that the presence of CF2 bonding states significantly distort the
aromatic ring symmetry. The bonds concentration was also estimated according to the
relevant peak area divided by the sum of the areas of the peaks. Table 1 lists the
proportion of the bond concentrations from XPS results.

8
280285290
c
C-F
C-CF
C-C
F = 12.1 at. %
Inte
nsi
ty (
a.u
)
C-C
F = 0 at. %a
bC-C
C-CFC-F
F = 1.5 at. %
dC-C
C-CF
C-F
F = 23.1 at. %
Binding Energy (eV)
CF2
Figure 4. XPS spectra and deconvolution of the C1s peaks obtained from DLC and F-DLC films with different fluorine contents a. DLC, b. F-DLC (1.5 at. %),
c. F-DLC (12.1 at. %) and d. F-DLC (23.1 at. %).
Sample Percentage of C-C and C=C
bonding
Percentage of C-CF bonding
Percentage of C-F bonding
Percentage of C-F2 bonding
DLC
97.0 - - -
F-DLC (F=1.5 .at %)
88.2 8.2 3.6 -
F-DLC (F=12.1 at %)
77.1 18.1 4.8 -
F-DLC (F=23.1 .at %)
69.2 23.8 5.3 1.7
Table 1: The percentage of the C-C, C=C, C-CF, C-F and CF2 bonding of DLC and F-DLC films with different fluorine content. The fluorine content in the films is in the brackets in left column.

9
3.3. Raman Spectroscopy Fig. 5 shows the Raman spectra of the films deposited with differing fluorine content
and the effect of increasing fluorine content on the D and G-band positions and width.
The separation of D and G peaks for the fluorinated DLC is more pronounced than
DLC. Figure 5 shows that the G-band peak position shifts to higher frequencies with
increasing fluorine content in the films. This is consistent with the results obtained by
Yu et al. [24]. The shift of the G-band peak position to higher frequency can be
attributed to the increased number of sp2 bonds and the formation of sp2 hybridized
carbon domains [25]. In the case of DLC doped with Si [10] an opposite trend was
observed where the position of the G peak decreases with increasing Si, and it has
been reported to be due to an increase in sp3 bonding fraction in the film. The Raman
spectra had a main peak at about 1530–1560 cm−1 corresponding to the G-band and a
shoulder peak around 1380 cm−1 corresponding to the D-band. Their spectral widths
and shapes reflect the amorphous structure of the films. For films with low fluorine
content below 23.1 at. % the spectra shows a low intensity luminescence background,
typical of diamond-like films. On the other hand, for higher fluorine concentrations,
there is a strong increase in the luminescence intensity, which can be assigned to a
polymerlike structural arrangement.
800 1000 1200 1400 1600 1800 2000
F=6.8 at. %
F=12.1 at. %
F=23.1 at. %G-band
Ram
an In
tens
ity (
arbi
trar
y un
its)
Raman Shift (cm-1)
D-band
F=0 at. %
Figure 5. Raman spectra of DLC and DLC-F films with various fluorine content..
10
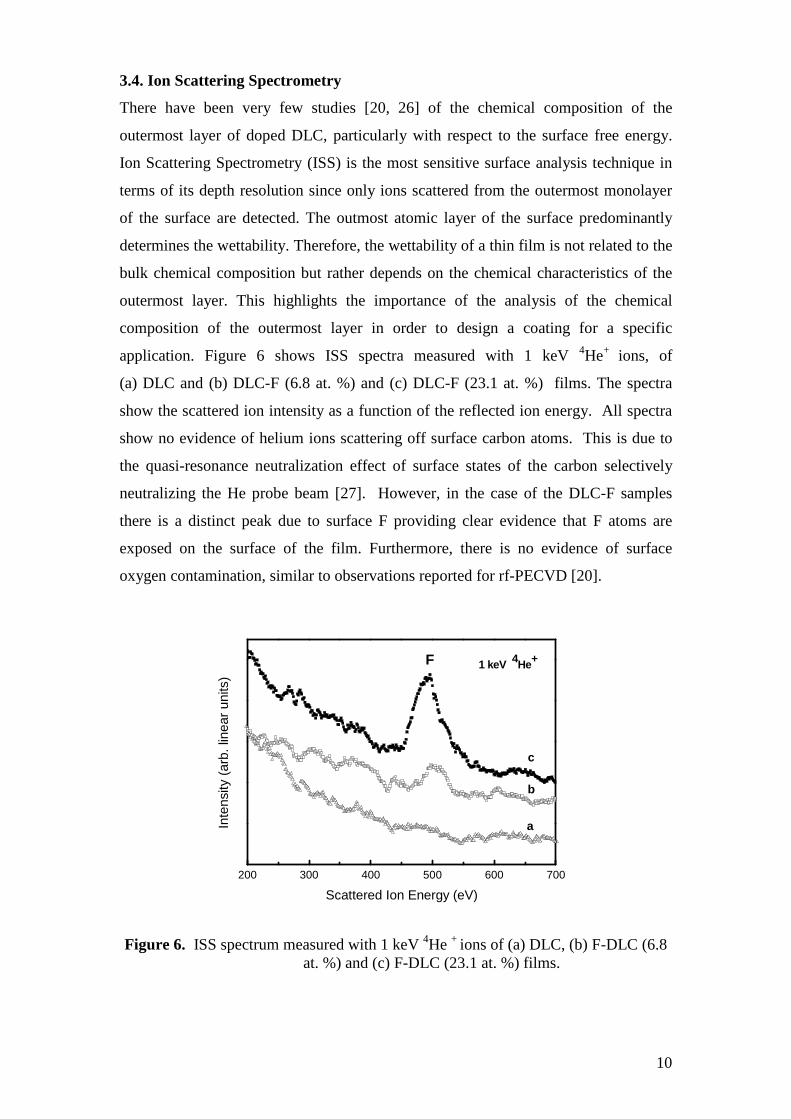
3.4. Ion Scattering Spectrometry
There have been very few studies [20, 26] of the chemical composition of the
outermost layer of doped DLC, particularly with respect to the surface free energy.
Ion Scattering Spectrometry (ISS) is the most sensitive surface analysis technique in
terms of its depth resolution since only ions scattered from the outermost monolayer
of the surface are detected. The outmost atomic layer of the surface predominantly
determines the wettability. Therefore, the wettability of a thin film is not related to the
bulk chemical composition but rather depends on the chemical characteristics of the
outermost layer. This highlights the importance of the analysis of the chemical
composition of the outermost layer in order to design a coating for a specific
application. Figure 6 shows ISS spectra measured with 1 keV 4He+ ions, of
(a) DLC and (b) DLC-F (6.8 at. %) and (c) DLC-F (23.1 at. %) films. The spectra
show the scattered ion intensity as a function of the reflected ion energy. All spectra
show no evidence of helium ions scattering off surface carbon atoms. This is due to
the quasi-resonance neutralization effect of surface states of the carbon selectively
neutralizing the He probe beam [27]. However, in the case of the DLC-F samples
there is a distinct peak due to surface F providing clear evidence that F atoms are
exposed on the surface of the film. Furthermore, there is no evidence of surface
oxygen contamination, similar to observations reported for rf-PECVD [20].
200 300 400 500 600 700
a
b
c
Inte
nsity
(ar
b. li
near
uni
ts)
Scattered Ion Energy (eV)
F 1 keV 4He+
Figure 6. ISS spectrum measured with 1 keV 4He + ions of (a) DLC, (b) F-DLC (6.8 at. %) and (c) F-DLC (23.1 at. %) films.

11
3.5. Surface Free Energy Figure 7 shows the effect of the fluorine content on the surface energy of the film. As
the fluorine content increases to 23.1 at. % there is a decrease in total surface energy
from 45.4 mN m -1 to 42.6 mN m-1 for DLC. A similar decrease was calculated for the
dispersive component (45.2 to 40.8 mN m -1). However, the polar component showed
an opposite effect with a slight increase from 0.2 to 1.8 mN m -1. Similar results were
observed in previous work for DLC-F deposited by rf-PECVD [20]. The surface
energy is influenced by the difference in the forces between atoms or molecules at the
interface. The polar component is controlled by different intermolecular forces,
permanent and induced dipoles and hydrogen bonds. As the sp2 content increases with
increase of fluorine in the films, the polar component increases due to more
unsaturated and dangling bonds on the surface. The dispersion component arises from
instantaneous dipole moments [24]. The reduction in the surface energy was largely
ascribed to the decrease in the dispersion component. It has been reported [24] that
the variation in C-CF, CF and CF2 bonds is the cause of the lower dispersive
component, and therefore the reduced surface energy of the film. As the fluorine
content increases in the films there are more C-Fx bonds formed and the surface
energy decreases. The increase in hydrophobicity in fluorinated DLC was attributed
not only to higher incorporation of fluorine but mostly due to the presence of CFn
groups on the surface [21]. Hasebe et al. [28] have reported that F-DLC films showed
significant reductions in platelet adhesion and activation when compared with DLC of
similar surface roughness, thus suggesting that the inherit chemical nature of the
surface, such as wettability and interfacial free energy might be more important in the
mechanism of F-DLC non-thrombogencity. The contact angle of water as a function
of fluorine content after 12 weeks (stored at humidity range of 50 – 65 %) is plotted in
figure 7a. The water contact angle was measured at 67.6 ± 2° for DLC and rapidly
increase up to 89.8 ± 2° for 23.1 at. % F. These values are in agreement with reported
results [6].

12
0 5 10 15 20 25
0
10
20
30
40
50
Sur
face
Fre
e E
nerg
y (m
N /
m)
Flourine content in the film (at. %)
TotalDispersivePolar
Figure 7. Surface energy of the films as a function of the fluorine content in the film.
0 5 10 15 20 25
65
70
75
80
85
90
Flourine content in the film (at. %)
Con
tact
ang
le (
degr
ees)
DI water
after 12 weeks
Figure 7a. Contact angle (DI water) as a function of the fluorine content in the film.
3.6. Mechanical properties
Figure 8 shows the the hardness and elastic modulus of the DLC and F-DLC films as
a function of the fluorine content in the films. The DLC films without F exhibit the
highest hardness of about 16.5 GPa and elastic modulus of about 152 GPa. As the
fluorine content increases to about 6.8 at. %, the hardness and elastic modulus values
drop to 10.7 GPa and 97 GPa, respectively. For the highest fluorine content of
23.1 at. %, the hardness and the elastic modulus decreased to values of about 8.4 GPa
and 85.0 GPa, respectively. A decrease in hardness is usually associated with a
decrease in the sp3 bonding fraction and/or residual stress [10]. Yao et al. [5]
attributed the decrease in the hardness and elastic modulus to changes in the

13
microstructure, and also due to the reduction in the internal stress of the film. The
substitution of strong C=C by weaker C-F bonds induces a decrease in hardness [29].
The fluorine is a termination radical in the C-C networks and consequently decreases
cross-linking leading to a new, more open structural arrangement and a decrease in
the hardness [30]. Ma et al. [31] reported that the CF2 bond group has the most effect
on the hardness and elastic modulus as the CF2 group proportion in the DLC-F film
increases the modulus and hardness of the film decrease linearly. This can be
explained by the CF2 groups breaching the carbon network resulting in the stiffness of
C-C network decreasing, hence causing a reduction in the modulus and hardness. The
decrease in the film density with increasing fluorine content, as reported by Jacobsohn
et al. [32], may contribute to the sharp degradation in the mechanical properties
measured in this study. Figure 9 shows the compressive stress a as of function the
fluorine content in the films. The data shows a similar behaviour as the hardness and
elastic modulus.
0 5 10 15 20 25
8
10
12
14
16
18
80
90
100
110
120
130
140
150
160
Ela
stic
Mod
ulus
(G
Pa)
Har
dnes
s (G
Pa)
Fluorine content in the film (at. %)
HardnessElastic Modulus
Figure 8. Hardness and elastic modulus of the films as a function of the fluorine content in the films.

14
0 5 10 15 20 250.3
0.4
0.5
0.6
0.7
0.8
8
10
12
14
16
18
Com
pres
sive
str
ess
(GP
a)
Fluorine content in the film (at. %)
Figure 9. Compressive stress of the films as a function of the fluorine content in the films.
3.7. Optical band gap
Figure 10. shows the optical band gap of DLC-F films on Si substrate as a function of
the fluorine content. The data clearly shows two regions of different optical band gap
values. In the case of a-C or a-C:H films, the optical band gap depends predominantly
on the sp2 fraction [33]. For the a-C:F films, the incorporation of F into C network can
affect the bonding structure by two means. Firstly, is that the C=C double bonds break
off and combine with F. The F is a monovalent atom, therefore, only s bond can be
formed when F combines with C and at the same time, the p bonds exist due to C-C
binding. Second effect is that F is substituting the H in the C networks. As a result of
that, the s and p bonds are coexistent in a-C:F films. The optical gap of a-C:F films
should be dependent on the abundance of C-C and F in DLC:F films [33]. The band
gap increases from 1.5 eV for DLC to 2.44 eV for DLC-F (23% at. F). The first region
of the spectra 1.5-1.63 eV and second region 2.38-2.44 for 12.0 -23. at.% F.
The optical gap Eg increases with increase in the amount of fluorine but decreases as
the amount of C-C bonding increased [33]. This has been attributed to the decrease in
the amount of ρ bonding formed by C-C and the increase in that of s bonding formed
by C–F. As a result, the density of state near band edge reduces and the optical gap
becomes wide [33]. It is suggested that in small concentrations fluorine atoms act as

15
an active dopant, lowering the optical gap, but when the F concentration exceeds a
critical limit the effect of decreasing the conjugation length (through electronic
localization) dominates, and the optical gap increases [33] . In our case the critical
limit appears to be at about 6.8 at. % of fluorine corresponding to C-C content of
75-80 %. The high content F incorporated can result in the increase in optical gap of
DLC-F films due to the to the reduction in the density of p–p* states and the
increasing in that of s–s* [34]. In DLC films, at a given sp2 C content, the energy
distribution of p states is strongly dependent on local stress and distortion and to the
shape of the sp2 C clusters. This can lead to large variation of Eg. The optical gap is
controlled by F atom and C-C concentration. The increase in amount of fluorine in
films can lead to an increase in optical gap. On a contrary, the increase in abundance
of C-C bond results in the decrease in optical gap. In DLC-F films, the width of gap is
controlled by the relative abundance of these two bonds [34].
0 5 10 15 20 251.4
1.6
1.8
2.0
2.2
2.4
2.6
region 1
Opt
ical
ban
d ga
p (e
V)
Flourine content in the film (at. %)
region 2
Figure 10. The optical band gap Eg as a function of the fluorine content in the films.
3.8. Biocompatibility of the films
There are a number of tests in terms of tissue biocompatibility and toxiticity that a
material must satisfy for it to be considered for use in biomedical applications.
In-vitro Cell culturing under controlled conditions is one of the most commonly used
technique of assessing biocompatibility. Allen et al. [35] reported no notable
difference between osteoblasts cells grown on DLC coatings and those grown on
control polystyrene plates. There have been a number of studies [10-14, 31-32] that
reported on the addition of specific elements into the DLC structure in order to
modify the surface bio-reactions. It is thought that modified DLC is expected to lead

16
to new applications for blood contacting applications, load bearing, by reducing wear.
In this study, we examine the effect of flourine incorporation in the DLC films on the
biocompatibility for bone fixation.
The SEM images taken after three days of cell culture confirmed similar size and
morphologies for cells growing on DLC and DLC-F samples (Figure 11). The images
show that the cells grown on on DLC, DLC-F (6.8 at. % F) and DLC-F (23.1 at. % F)
films have a similar shape, size and surface morphology. They show multiple
microvilli and spheric structure on the surface indicating an unaffected cell activity
and continuous exchange between the cell surface and the environment. The long and
fine cytoplasmic extensions in multiple directions indicate excellent adhesion of the
cells to the substrate surface . These cells also exhibit large lamellipodes indicating an
energetic cell migration resulting in a homogenous colonization and, subsequently,
homogeneous and optimal tissue integration of the substrates [36]. The measured
averaged cell area of the osteoblasts cells following three days of cell culture was
~ 1800 µm2 for DLC and DLC-F (6.8 at. % F). However, the averaged cell area of the
osteoblasts, in the case of the higher fluorine content film (23.1 at. % F), was
measured to be ~ 700 µm2 . The cell-culture results suggest that for the films studied
here, the osteoblast cells adhesion is sensitive to a range in surface energy
(corresponding to water contact angles ranging from 75o to 90o) or to the associated
changes in the concentration of surface hydroxyl groups [13] . In the past, there has
been some linking of increased cell adhesion to increased surface energy of metal,
polymer and hydroxyapatite materials [14,37,38]. At the same time, the cells feature
a highly complex, structurally inhomogeneous surface subjected to structural
rearrangement, changes in membrane protein expression, elasticity and other chemical
and physical properties [13].
Figure 11. SEM morphology of MG-63 osteoblasts cell line on (a) DLC, (b) DLC-F (6.8 at. % F) and (c) DLC-F (23.1 at. % F) deposited on silicon in 3 days of culture.
a. b. c.

17
4. CONCLUSION
The effects of fluorine incorporation on the composition, structure, surface energy,
mechanical properties and biocompatibility of F-DLC films deposited with
low-frequency pulsed DC- PACVD were studied using a combination of surface
analysis techniques and mechanical measurements. The deposition rate was found to
decrease from 75 nm min-1 for DLC to 12 nm min-1 for F-DLC (23.1 at. %). The
decrease was ascribed to an increased density of F+ in the plasma which enhances the
etching of the surface. XPS analysis revealed the presence C-C, C-CF and C-F for F-
DLC films with low fluorine concentration (1.5-12.1 at. %), however for films with
higher fluorine content (23.0 at. %) an additional peak due to CF2 bonding was
detected. Fluorine incorporation induced a strong increase in the luminescence
intensity, which can be assigned to a polymer like structural arrangement. ISS
measurements revealed that F atoms are exposed on the surface of the DLC-F films
and there is no evidence of surface oxygen contamination. The surface free energy of
the films was reduced with increasing fluorine content and is due to the bonding
modifications in the film with a decrease of C-CF bonds and increasing CF and CF2
bonds. The addition of fluorine also resulted in a decrease in the hardness and stress.
The water contact angle was found to increases with increasing fluorine content and
has been attributed to the change of the bonding nature in the films, in particularly
increasing CF and CF2 bonds. The contact angle values were maintained over a period
of 12 weeks. Biocompatibility tests indicated homogeneous and optimal tissue
integration for both the DLC and the F-DLC surfaces. This pulsed DC-PACVD
technique has been shown to produce biocompatible DLC and F-DLC coating with
potential for biomedical applications.

18
REFERENCES [1] G. Dearnaley, J.H. Arps, Surf. Coat. Technol., 200 (2005) 2518-2524.
[2] P.R. Golglia, J. Berkowitz, J. Hoehn, A. Hidis, L. Stover, Diamond Relat.
Mater. 10 (2001) 271.
[3] T. Hasebe, A. Shimada, T. Suzuki, Y. Matsuoka, T. Saito, S. Yohena,
A. Kamijo, N. Shiraga, M. Higuchi, K. Kimura, T. Yoshimura, S.
Kuribayashi, J. Biomed. Mater. Res., A 76 (2006) 86-94.
[4] D. Koshel, H. Ji, B. Terreault, A. Côté, G.G. Ross, G. Abel, M. Bolduc, Surf.
Coat. Technol., 173 (2003) 161-171.
[5] Zh. Q.Yao, P. Yang, N. Huang, H. Sun, J. Wang, Appl. Surf. Sci. 230 (2004)
172-178.
[6] M. Ishihara, T. Kosaka, T. Nakamura, K. Tsugawa, M. Hasegawa, F. Kokai,
Y. Koga, Diamond Related. Mater.15 (2006) 1011-1014.
[7] R. Hauert, U. Müller, G. Francz, F. Birchler, A. Schroeder, J. Mayer, E.
Wintermantel, Thin Solid Films 308-309 (1997) 191-194.
[8] J. Robertson, Materials Science and Engineering R 37 (2002) 129-281.
[9]. T. Michler, M. Grischke, I. Traus, K. Bewilogua, H. Dimigen, Diamond
Related. Mater. 7 (1998) 459-462.
[10] A. Bendavid, P.J. Martin, C. Comte, E.D. Preston, A.J. Haq, F.S. Magdon
Ismail, R.K. Singh, Diamond Related. Mater.16 (2007) 1616-1622.
[11]. L. K. Randeniya, A. Bendavid, P.J. Martin, Md. S. Amin, E.W. Preston,
F.S.Magdon Ismail and S. Coe, Acta Biomaterialia 5 (2009) 1791-1797.
[12]. L. K. Randeniya, A. Bendavid, P.J. Martin, Md. S. Amin and E.W. Preston,
Diamond Related Materials, 18 (2009) 1167-1173.
[13]. L.K Randeniya, A. Bendavid, P.J. Martin, Md Sadequl Amin, E.W. Preston,
R.Rohanizadeh, F. Tang, J.Cairney, Diamond & Related Materials 19 (2010)
329–335.
[14]. L. Randeniya, A. Bendavid, P.J. Martin, J. M. Cairney, A. Sullivan,
S.Webster, G. Proust, R. Rohanizadeh in press Acta Biomaterialia, (2010).
[15]. A. Bendavid, P.J. Martin, J. Cairney, M. Hoffman, A.C. Fischer-Cripps,
Appl. Phys. A81 (2005) 151-158.
[16] R.J. Good, L.A.J. Girifalco, J. Phys. Chem. 64 (1960) 561.
[17] P.J. Martin, R.P. Netterfield, Surf. Interface Anal. 10 (1987) 13-16.
[18]. Martin, P.J., Bendavid, A., Swain, M., Netterfield, R.P., Kinder, T.J., Sainty,
W.G., Drage, D., Wielunski, L, Thin Solid Films, 239 (2) (1994) 181-185.

19
[19] Bendavid, A., Martin, P.J., Netterfield, R.P., Kinder, 1996) Surf. Interface
Anal 24 (9) (1996) 627-633.
[20] A. Bendavid, P.J. Martin, L. Randeniya, M.S. Amin, Diamond and Related
Materials, 18 (2009) 66-71.
[21] R.S. Butter, D.R.Waterman, A.H. Lettington, R.T. Ramos, E.J. Fordham,
Thin Solid Films 311 (1997) 107-113.
[22] R. Hatada, K. Baba Nuclear Instrument and methods in physics research B 148
(1999) 655-658.
[23] M. Jiang, Z. Ning , Surf. Coat. Technol., 200 (2006) 3682-3686.
[24] G.Q. Yu, B.K. Tay, Z. Sun, L.K. Pan, Appl. Surf. Sci. 219 (2003) 228-237.
[25] A.C. Ferrari, J. Robertson, Phys. Rev. B61 (2000) 14095- 14107.
[26] A. Lamperti, P.M. Ossi, Appl. Surf. Sci. 205 (2003) 113-120.
[27] R.D.van de Grampel, W. Ming, A. Gildenpfennig, J. Laven, H.H. Brongersma,
G. de With, R. van der Linde, Langmuir 20 (2004) 145-149.
[28] T. Hasebe, T. Ishimaru, A. Kamijo, Y. Yoshimoto, T. Yoshimura, S. Yohena
H. Kodama, A. Hotta, K. Takahashi, T. Suzuki, Diamond Related. Mater. 16
(2007) 1343-1348.
[29] S.C. Trippe, R.D. Mansano, F.M. Costa, R.F. Silva, Thin Solid Films 446
(2004) 85-90.
[30] Freire F.L. Jr, Maia da Costa M.E.H, Jacobsohn L.G. Franceschini D.F,
Diamond Relat. Mater. 10 (2001) 125.
[31] X. Ma, G. Tang, M. Sun, Surf. Coat. Technol., 201 (2007) 7641-7644.
[32] L.G. Jacobsohn, M.E.H. Maia da Costa, V.J. Trava-Airoldi, F.L. Freire Jr,
Diamond Related. Mater.12 (2003) 2037-2041.
[33]. C. Ye, Z. Ning, S. Cheng, Y. Xin, S.Xu, Diamond Related. Mater. 13
(2004) 191-197.
[34] M. Jiang, Z. Ning, Surf. Coat. Technol., 200 (2006) 3682-3686.
[35] M.Allen, F. Law, N. Rushton, Clin. Mater. 17 (1994) 1.
[36] C. Meunier, Y. Stauffer, A. Daglar, F. Chai, S. Mikhailov, H.F. Hildebrand,
Surf. Coat. Technol., 200 (2006) 6346-6349.
[37] S.A. Redey, S. Razzouk, C. Rey, D. Bernache-Assollant, G. Leroy, M. ardin,
Cournot, J. Biomed. Mater. Res. 45 (1999) 140.
[38] T.G. van Kooten, J.M. Schakenraad, H.C. van der Mei, H.J. Busscher,
Biomaterials 13 (1992) 897.

20
FIGURE CAPTIONS
Figure 1. Deposition rate () and fluorine content in the films () as a function of
CF4 fraction in the plasma.
Figure 2. Relationship between pulsed current density and CF4 fraction in the
plasma.
Figure 3. Relationship between deposition rate and pulsed current density. Figure 4. XPS spectra and deconvolution of the C1s peaks obtained from DLC and
F-DLC films with different fluorine contents (a) DLC, (b) F-DLC (1.5 at. %), (c) F-DLC (12.1 at. %) and (d) F-DLC (23.1 at. %).
Figure 5. Raman spectra of DLC and DLC-F films with various fluorine content.
Figure 6. ISS spectrum measured with 1 keV 4He + ions of (a) DLC, (b) F-DLC (6.8
at. %) and (c) F-DLC (23.1 at. %) films. Figure 7. Contact angle (DI water) as a function of the fluorine content in the film. Figure 7a. Surface energy of the films as a function of the fluorine content in the
film. Figure 8. Hardness and elastic modulus of the films as a function of the fluorine
content in the films. Figure 9. Compressive stress of the films as a function of the fluorine content in the
films. Figure 10. The optical band gap Eg as a function of the fluorine content in the films.
Figure 11. SEM morphology of MG-63 osteoblasts cell line on (a) DLC, (b) DLC-F (6.8 at. % F) and (c) DLC-F (23.1 at. % F) deposited on silicon in 3 days of culture.