The Propagation Group - Georgia Institute of...
97
The Propagation Group GeorgiaInstitute of nology Tech Extended Indoor/Outdoor Location of Cellular Handsets Based on Received Signal Strength at Greenville, SC Document ID: PG-TR-050215-JZ Date: March 11, 2005 Jian Zhu and Prof. Gregory D. Durgin 777 Atlantic Ave. Atlanta, GA 30332-0250 E-mail: [email protected] Voice: (404)894-8169 Fax: (404)894-5935 http://users.ece.gatech.edu/ ˜ durgin No portion of this document may be copied or reproduced without written (e-mail) consent of the Georgia Institute of Technology.
-
Upload
hoanghuong -
Category
Documents
-
view
216 -
download
2
Transcript of The Propagation Group - Georgia Institute of...

ThePropagationGroup
GeorgiaInstituteof nologyTech
Extended Indoor/Outdoor
Location of Cellular Handsets
Based on Received Signal
Strength at Greenville, SC
Document ID: PG-TR-050215-JZ
Date: March 11, 2005
Jian Zhu and Prof. Gregory D. Durgin777 Atlantic Ave. Atlanta, GA 30332-0250
E-mail: [email protected]: (404)894-8169 Fax: (404)894-5935
http://users.ece.gatech.edu/˜durgin
No portion of this document may be copied or reproduced without written (e-mail)consent of the Georgia Institute of Technology.

CONTENTS
LIST OF FIGURES ix
LIST OF TABLES xiii
EXECUTIVE SUMMARY xv
1 INTRODUCTION 1
2 MEASUREMENT PLAN 3
2.1 Setup Overview 3
2.2 Equipment and Calibration 5
2.2.1 Ericssion TEMS Unit 5
2.2.2 Calibration Procedure 5
3 DATA COLLECTION 10
3.1 Building Construction 10
3.2 Frequency Plan Change 10
3.2.1 Drive Test Measurement 11
3.2.2 Walking Measurement 12
3.3 GIS Data 16
4 DATA ANALYSIS 18
4.1 Handset RSS Distribution 18
4.1.1 Indoor RSS Distribution 18
4.1.2 Outdoor RSS Distribution 19
GeorgiaInstituteof nologyTech
PropagationGroup vii

viii Indoor Radiolocation in 1920 MHz GSM
4.1.3 Indooor/Outdoor Comparison 20
4.2 Indoor/Outdoor Discrimination Rate 22
4.3 GPS effectiveness 22
4.4 RSS in high-rise building 24
5 PREPARING RF MAPS 28
5.1 Equivalent Modification on DCCH Change 28
5.2 GPS Manual Correction 33
5.3 Indoor Calibration 34
5.4 Network Measurement Report (NMR) Matlab File Format 35
5.4.1 NMR Matlab Matrix Structure 35
5.4.2 NMR file list 38
5.5 Scanner Drive Test Matlab File Format 39
5.5.1 Scanner Drive Test Matlab Matrix Structure 39
5.5.2 Scanner road measurment file list 39
6 LOCATION PERFORMANCE STATISTICS 40
6.1 Location Algorithm and Performance 40
6.1.1 Metric of Location Performance 40
6.1.2 Base Line: Relative method, 10 NMR-average 40
6.1.3 Search Area Reduction Based on Linear Regression 42
6.1.4 Continuous NMR VS. Average NMRs 50
7 CONCLUSIONS 53
8 ACKNOWLEDGEMENT 54
BIBLIOGRAPHY 55
A CAMPAIGN PHOTOGRAPH 56
B MAPS OF DCCH FREQUENCY PLAN 73
GeorgiaInstituteof nologyTech
PropagationGroup March 11, 2005

List of Figures
2.1 The 7000 m by 9000 m test area in Greenville, SC 4
2.2 Photograph of TEMS unit setup view 6
2.3 Photograph of TEMS unit connection view 7
3.1 Drive test measurement routes collected on Dec 16, 2004 in Greenville,SC. 12
3.2 Drive test measurement routes collected on Feb 01, 2005 in Greenville,SC. 13
3.3 Georgia Tech student research Albert Lu and Jian Zhu take an outdoorwalking measurement 14
3.4 Georgia Tech student research Albert Lu and Jian Zhu take an outdoorwalking measurement 14
3.5 Georgia Tech student research Jian Zhu and Professor Gregory Durgintake a walking measurement in a downtown Greenville eatery. 15
3.6 Georgia Tech student research Jian Zhu and Professor Gregory Durgintake a walking measurement on the 9th floor of an office building. 16
4.1 Indoor Received Signal Strength Aggregate (RSSA) distribution mea-sured in Greenville, SC. 19
4.2 Outdoor Received Signal Strength Aggregate (RSSA) distribution mea-sured in Greenville, SC. 20
4.3 Indoor and outdoor RSSA theoretical distribution. 21
4.4 Signal gain vs. floor number, taken from active call data, 6 DCCHchannels, slope +1.43 dB/floor. 25
4.5 Signal gain vs. floor number, taken from active call data, 6 DCCHchannels, slope +1.16 dB/floor. 26
GeorgiaInstituteof nologyTech
PropagationGroup ix
x Indoor Radiolocation in 1920 MHz GSM LIST OF FIGURES
4.6 Signal gain vs. floor number, taken from scanner data, 15 DCCHchannels slope +1.23 dB/floor. 27
5.1 Longitude/Latitude map of base stations (* and O) at Greenville, SCusing DCCH 786 on Dec 14, 2004. The thick path s a single drive-testroute through the test area. 29
5.2 Longitude/Latitude map of base stations (* and O) at Greenville, SCusing DCCH 512 on Dec 31, 2004. 30
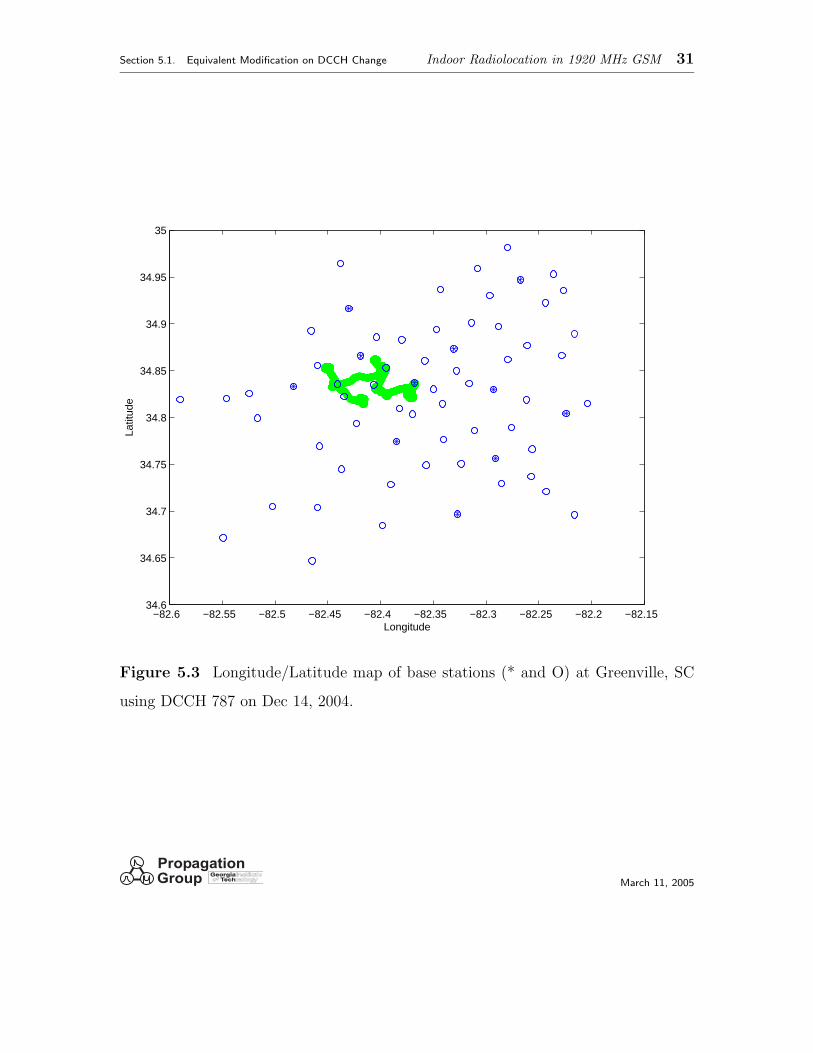
5.3 Longitude/Latitude map of base stations (* and O) at Greenville, SCusing DCCH 787 on Dec 14, 2004. 31
5.4 Longitude/Latitude map of base stations (* and O) at Greenville, SCusing DCCH 513 on Dec 31, 2004. 32
6.1 Histogram of base station and user separation distance error betweencalculated and measured radii. The mean is 13 m and the standarddeviation is 289 m. 47
A.1 Downtown Greenville at the start of the December measurement cam-paign. 56
A.2 Photograph of downtown Greenville shopping arcade. 57
A.3 Photograph of a small shop in downtown Greenville. 58
A.4 Indoor measurements conducted in a dressing store in downtown Greenville. 59
A.5 Researcher entering a UPS store in downtown Greenville. 60
A.6 Indoor measurement inside the UPS store in downtown Greenvillemade by Jian J. Zhu. 60
A.7 Researchers Jian J. Zhu and Prof. Gregory D. Durgin entering a giftshop in downtown Greenville. 61
A.8 Shop in downtown Greenville. 61
A.9 Indoor measurement inside the gift shop in downtown Greenville. 62
A.10 Indoor measurement inside a restaurant in Greenville. 62
A.11 A restaurant build of brick in downtown Greenville. 63
A.12 Indoor measurement inside a restaurant in Greenville. 63
A.13 “Sticky Fingers” restaurant in downtown Greenville. 64
A.14 Yenpao A. Lu and Jian J. Zhu take indoor measurements in downtownGreenville. 65
A.15 Indoor measurement in a small office room in downtown Greenville. 65
GeorgiaInstituteof nologyTech
PropagationGroup March 11, 2005

LIST OF FIGURES Indoor Radiolocation in 1920 MHz GSM xi
A.16 Indoor measurement ina clothing store in downtown Greenville. 66
A.17 Indoor measurement in a day care/kindergarten in Greenville. 66
A.18 “Family Dollar”grocery store in Greenville. 67
A.19 “Hardee’s” measured in Greenville. 68
A.20 McDonalds measured in Greenville. 68
A.21 A laundromat in Greenville. 69
A.22 Inside the laundromat in Greenville. 69
A.23 Student researcher Jian J. Zhu is calibrating GPS on rooftop of a park-ing deck in downtown Greenville, SC. 70
A.24 The 8-story Greenville Summit Building close to downtown Greenville. 71
A.25 Student researcher Jian Zhu and Prof. Gregory Durgin measure RSSfor an office high-rise building in downtown Greenville, SC. 72
B.1 Longitude/Latitude map of base stations (* and O) in Greenville, SCusing DCCH 788. 74
B.2 Longitude/Latitude map of base stations (* and O) in Greenville, SCusing DCCH 514 74
B.3 Longitude/Latitude map of base stations (* and O) in Greenville, SCusing DCCH 789. 75
B.4 Longitude/Latitude map of base stations (* and O) in Greenville, SCusing DCCH 515. 75
B.5 Longitude/Latitude map of base stations (* and O) in Greenville, SCusing DCCH 790. 76
B.6 Longitude/Latitude map of base stations (* and O) in Greenville, SCusing DCCH 516. 76
B.7 Longitude/Latitude map of base stations (* and O) in Greenville, SCusing DCCH 791. 77
B.8 Longitude/Latitude map of base stations (* and O) in Greenville, SCusing DCCH 517 77
B.9 Longitude/Latitude map of base stations (* and O) in Greenville, SCusing DCCH 792 78
B.10 Longitude/Latitude map of base stations (* and O) in Greenville, SCusing DCCH 518 78
B.11 Longitude/Latitude map of base stations (* and O) in Greenville, SCusing DCCH 793 79
GeorgiaInstituteof nologyTech
PropagationGroup March 11, 2005

xii Indoor Radiolocation in 1920 MHz GSM LIST OF FIGURES
B.12 Longitude/Latitude map of base stations (* and O) in Greenville, SCusing DCCH 519. 79
B.13 Longitude/Latitude map of base stations (* and O) in Greenville, SCusing DCCH 794. 80
B.14 Longitude/Latitude map of base stations (* and O) in Greenville, SCusing DCCH 520. 80
B.15 Longitude/Latitude map of base stations (* and O) in Greenville, SCusing DCCH 795. 81
B.16 Longitude/Latitude map of base stations (* and O) in Greenville, SCusing DCCH 521. 81
B.17 Longitude/Latitude map of base stations (* and O) in Greenville, SCusing DCCH 796. 82
B.18 Longitude/Latitude map of base stations (* and O) in Greenville, SCusing DCCH 522. 82
B.19 Longitude/Latitude map of base stations (* and O) in Greenville, SCusing DCCH 797. 83
B.20 Longitude/Latitude map of base stations (* and O) in Greenville, SCusing DCCH 523. 83
B.21 Longitude/Latitude map of base stations (* and O) in Greenville, SCusing DCCH 798. 84
B.22 Longitude/Latitude map of base stations (* and O) in Greenville, SCusing DCCH 524. 84
B.23 Longitude/Latitude map of base stations (* and O) in Greenville, SCusing DCCH 799. 85
B.24 Longitude/Latitude map of base stations (* and O) in Greenville, SCusing DCCH 525. 85
B.25 Longitude/Latitude map of base stations (* and O) in Greenville, SCusing DCCH 800. 86
B.26 Longitude/Latitude map of base stations (* and O) in Greenville, SCusing DCCH 526. 86
GeorgiaInstituteof nologyTech
PropagationGroup March 11, 2005

List of Tables
4.1 Discrimination rate by using handset RSSA distribution. 22
4.2 Garmin V GPS effectiveness statistics based on 60,624 indoor and out-door measurement records. 23
4.3 Garmin V GPS effective statistics. Percentages are compared withindoor or outdoor separately. 23
5.1 Row format of matlab matrix file ”NMRxx.mat” from active call/networkmeasurement report 36
5.2 Row format of matlab cell matrix file “NMRc.mat” only from activecall/network measurement report. 38
5.3 Row format of Matlab matrix file “xxxxdrscn.mat” from road scannertesting. 39
6.1 Location error statistics of relative RSS-method. (Linear averaging of10 NMRs, 6 sectors) 42
6.2 Coefficient calculated by linear regression method 48
6.3 Location error statistics of relative RSS-method with limited searcharea. (Linear averaging of 10 NMRs, 6 sectors) 49
6.4 Location error statistics for the relative RSS-method with limited searcharea and distance matrix aggregate. (10 NMRs, 6 sectors) 52
GeorgiaInstituteof nologyTech
PropagationGroup xiii
xiv Indoor Radiolocation in 1920 MHz GSM LIST OF TABLES
GeorgiaInstituteof nologyTech
PropagationGroup March 11, 2005
EXECUTIVE SUMMARY
This report documents an intensive, two-month measurement campaign exploring the
performance of cellular handset location systems based on received signal strength
(RSS). Building upon the success of the original Georgia Tech campus E911 location
experiments, the new results in this report demonstrate the feasibility of RSS-based
location in a 1920 MHz GSM network where the majority of calls originate indoors.
Since most cell phone calls nowadays are believed to originate indoors (exactly where
most proposed position location solutions fail), the ability to locate in-building E911
calls is a huge public safety problem.
The results from this experiment are quite promising, however. The highest level
of accuracy achieved by our location algorithm across the entire network was 51% of
all test points having location error less than 100m and 79% having location error less
than 300m. Although these numbers are slightly below the respective 67% and 95%
safety targets set by the FCC, the Greenville trials represent a worst-case scenario for
an RSS location system: a largely rural area with low density of base stations and a
majority of indoor callers.
The engineers from Georgia Tech’s Propagation Group compiled test measure-
ments that included indoor data from 1 four-story hotel, 2 high-rise office buildings,
1 eight-story residential complex, 1 five-floor parking garage, 15 stand-alone restau-
rants, 23 small downtown shops, 1 grocery store, 2 department stores, and a variety of
GeorgiaInstituteof nologyTech
PropagationGroup xv

xvi Indoor Radiolocation in 1920 MHz GSM Executive Summary
retail and shopping center structures. All of this data had to be painstakingly logged
into georeferenced maps by hand since the GPS unit failed to acquire an indoor po-
sition 90% of the time. In addition to the extensive indoor measurements, the field
engineers also collected numerous tracks of outdoor pedestrian test data and outdoor
drive-test data. The end result is an extensive indoor/outdoor testbed for position
location experiments that covers 63 square-kilometers of urban, suburban, and rural
areas and contains nearly 90,000 measurement records.
In arriving at the performance statistics, a number of position location innovations
were made and documented along the way. These include
a new search-area limiting algorithm based on novel pieces of information in a
network measurement report (NMR) (Section 6.1.3)
an improved algorithm for estimating a handset location from a sequence of
multiple NMRs (Section 6.1.4)
new indoor penetration loss statistics for 1920 MHz (Section 4.1)
demonstration that an RSS location system can still function after a major
frequency plan change in the middle of a data collection (Section 5.1)
Overall, the results of this experiment reveal interesting behavior of RSS-based posi-
tion location that confirm the technology as an accurate, cost-effective way to improve
public safety.
GeorgiaInstituteof nologyTech
PropagationGroup March 11, 2005

Chapter 1
INTRODUCTION
This report documents the results of an extended set of experiments for mobile hand-
set location within a commercial cellular GSM network in Greenville, SC.
A previous measurement campaign on the Georgia Tech campus indicated that
RSS-based techniques can approach or even exceed the FCC guidelines of 100m ac-
curacy 67% of the time and 300m accuracy 95% of the time for a network with a
majority of indoor users. This performance was demonstrated on a 850MHz TDMA
network with average cell size of 600m in diameter. A limitation of this previous mea-
surement campaign was the small size of the testing and simulation area is limited
(2000 m by 2500 m), which may hide some of the egregious errors that can happen
in a full-sized network.
The Greenville measurement campaign documented in this report was performed
within a GSM network, which has an average cell radius of 1800m. Since the cell ra-
dius has increased about 4 times compared to the previous location in urban Atlanta,
the cell coverage area has increased by a factor of 16. Furthermore, the total test
area is a much larger area (7000m by 9000m) to allow for the possibility of egregious
errors in the location estimate.
The results in this extended study show that RSS location techniques can approach
the FCC E911 requirements for indoor handset locations— even in a mix of urban,
GeorgiaInstituteof nologyTech
PropagationGroup 1

2 Indoor Radiolocation in 1920 MHz GSM Introduction Chapter 1
suburban, and rural areas. The tabulated performance results of the location engine
are discussed in detail in Section 6.1.4 using a relative RSS method with a new search-
area limiting algorithm, a sequence of 10 network measurement reports, and RF maps
calibrated with both outdoor and indoor measurements. The error distance in this
case is 100m or less 51% of the time and 300m or less 79% of the time. The location
algorithm must be improved to meet FCC E911 requirement for a stand-alone system,
but the result shows excellent potential for cellular networks with large amounts of
indoor callers.
The Greenville test zone contains a mix of urban, suburban, and rural areas. The
measurement campaign lasted for 3 weeks (Dec 13,2004 -Dec 31, 2004). The major
sources of error for this analysis include the following: 1) old Geographic Information
System (GIS) data, 2) Global Positioning System (GPS) errors in data logging, and
3) compensation for a major frequency plan change that occured in mid-campaign.
GeorgiaInstituteof nologyTech
PropagationGroup March 11, 2005

Chapter 2
MEASUREMENT PLAN
All measurements were taken in Greenville, SC, which is the area surrounded by the
box in Figure 2.1. This 7000 m by 9000 m region was selected as the experimental
test area. In this large area, 9 small test areas (test spots), and over 50 buildings
were measured. Nearly 90,000 active call network measurement reports (NMRs) were
recorded from the Ericsson TEMs handset.
The distance between base stations in Greenville was approximately 1700-2000
meters. 24 microcells and no macro cells exist in the testing area. Another 24
microcells exist in the surrounding area. The building construction style varies from
steel and concrete with brick surfaces to wood frame and pre-fabicated/ mobile home
units. Terrain in the Greenville area is relatively flat with small hills, but becomes
mountainous outside the suburban area.
2.1 Setup Overview
Our measurement was performed with an Ericsson’s TEMS measurement unit. The
scanner data was collected by running the measurement handset in scanner mode and
using an external whip antenna, which has higher gain than the handset antenna. This
antenna was placed on top of the moving car during collections. The scanner data
is used to calibrate the Predicted Signal Database (PSD). Handset active call data
GeorgiaInstituteof nologyTech
PropagationGroup 3

4 Indoor Radiolocation in 1920 MHz GSM Measurement Plan Chapter 2
Figure 2.1 The 7000 m by 9000 m test area in Greenville, SC
was collected by the same TEMS unit but with the handset antenna—a short whip
connected to the phone.
To measure as much area as possible, drive-test measurements, outdoor walking
measurements, and indoor walking measurements were taken. The drive-test mea-
surements were used to construct a calibrated RF map database. These measurements
provide a fast way to measure across a large outdoor area. The walking measurements
collected active call network measurement reports and filled in the holes where the
drive-testing could not access.
GeorgiaInstituteof nologyTech
PropagationGroup March 11, 2005

Section 2.2. Equipment and Calibration Indoor Radiolocation in 1920 MHz GSM 5
2.2 Equipment and Calibration
2.2.1 Ericssion TEMS Unit
The Ericssion TEMS is a portable device for RF scanning and active call measure-
ment. The hardware components of the system include one ERICSSON TEMS hand-
set, a Garmin GPS V, and a laptop with 2 serial ports. The total weight of this system
is about 7 lbs. The scanning function of this TEMS unit was used to collect data
for PSD calibration. We programmed the 30 channels (Absolute Radio Frequency
Channel Number 512-526 and 786-800) to correspond with the base stations around
the test area in Greenville, SC. The Ericssion TEMS unit also provides the function
to record the active call data that includes network measurement reports (NMRs).
This active call function is used to collect NMRs for testing the performance of the
RSS location engine.
2.2.2 Calibration Procedure
A standard free-space calibration procedure was employed on each day of RF mea-
surement to monitor the integrity and consistency of the test system. The calibration
consisted of spatially-averaged power measurements taken in an outdoor area with-
out large obstacles in the nearby area. The calibration data was taken at the start
and the end of each day. The spatially-averaged power measurements were compared
to verify the consistency of the RF equipment and to monitor any cellular network
change at the calibration area.
For the period Dec 13, 2004 to Dec 17, 2004, the calibration was performed in
front of the parking lot of the Budget Inn at 10 Mills Avenue Greenville, SC 29605.
For the day of Dec 23, 2004, the calibration was performed in the parking lot of the
shopping mall at 3401 W Blue Ridge Drive Greenville, SC 29611. For the peroid Dec
GeorgiaInstituteof nologyTech
PropagationGroup March 11, 2005

6 Indoor Radiolocation in 1920 MHz GSM Measurement Plan Chapter 2
29, 2004 to Dec 31, 2004 the calibration was performed in front of the parking lot of
the Valu-Lodge Inn at 107 Duvall Drive Greenville, SC 29607.
The basic calibration procedure for the RSSI measurement system was as follows:
1. Define Calibration Paths: The calibration path should be selected in an outdoor
open area without any large or mobile obstacles. The surroundings of the
selected calibration area should be relatively open and have good vision to the
sky in all directions. The path of the calibration is a straight line of length 30
m from start point A to end point B, whatever the orientation. The calibration
route is large enough to provide a variety of RSSI measurements within a local
area, but small enough not to introduce significant large-scale variations in the
average RF power.
Figure 2.2 Photograph of TEMS unit setup view
2. System Setup: To begin a day of measurements, the RF measurement system
was connected according to the diagram in Figure 2.2 and 2.3. The handset
GeorgiaInstituteof nologyTech
PropagationGroup March 11, 2005

Section 2.2. Equipment and Calibration Indoor Radiolocation in 1920 MHz GSM 7
Figure 2.3 Photograph of TEMS unit connection view
should be held vertically and over the field engineer’s head to avoid any head-
shoulder shadowing effects. The Garmin V GPS antenna should also be held
above the shoulder, set at a vertical orientation, and kept free from obstacles
to 80% of the sky. The laptop was held in front of the field engineer’s chest in
a custom harness.
3. Acquire Data: The equipment is set to measure using the handset. Data is
acquired by moving slowly from start point A towards end point B and then
returning to point A, This sequence is repeated 3 times. Movement during
calibration is slower than 1.3 miles-per-hour to ensure sufficient amounts of
data is logged.
4. Post-processing: The data is then immediately downloaded to a computer for
analysis. For every dedicated control channel (DCCH) measurement, the RSSI
GeorgiaInstituteof nologyTech
PropagationGroup March 11, 2005

8 Indoor Radiolocation in 1920 MHz GSM Measurement Plan Chapter 2
values taken around each calibration route are linearly-averaged to produce a
single average signal strength measurement in dBm free from small-scale fading
effects. Four checks for the DCCH records with RSSI values higher than -105
dBm are performed at this point in the procedure:
[a] Long-Term Consistency Check: The average RSSI values are compared
with those taken on previous days. If RSSI values differ from previous measure-
ments by +/- 3 dB, a thorough system check is performed.
[b] Short-Term Consistency Check: For an end-of-day calibration, average
RSSI values are compared to the start-of-day calibration.
[c] GPS Position Check: GPS operation is verified by comparing the read-
ings to previous GPS measurements.
[d] Record and Save Average RSSI Values: The average values are dated
and recorded for future use. In constructing an RSSI database that uses mea-
surements spanning multiple days, it may be necessary to normalize each day’s
measurement against the calibration measurements.
5. Repeat Procedure: The calibration procedure is repeated using the identical
procedure at the end of a measurement day.
6. On-site Check: The following procedure should be performed before taking
measurements at any location:
[a] Clock synchronization check: Since the time stamp is the only link be-
tween NMRs and the GPS fix program, the synchronization between the TEMS
system clock and the laptop system clock should agree with less than 1 second
of difference.
GeorgiaInstituteof nologyTech
PropagationGroup March 11, 2005

Section 2.2. Equipment and Calibration Indoor Radiolocation in 1920 MHz GSM 9
[b] Active call check: Run the script to repeat dialing 611 for customer
service to get continuous active call network measurement reports.
[c] Record file size check: Once the system begins recording a file, the record
file size should keep increasing. Begin data collection after the recording file size
is larger than 18kB to ensure that the TEMS software is setup correctly.
By going through the calibration procedure, a network frequency optimization
was instantly detected on Dec 17, 2004. DCCHs at testing areas were changed from
Absolute Radio Frequency Channel Number (ARFCN) 786-800 to ARFCN 512-526.
Section 5.1 discusses how this change was accommodated in the experiment without
having to re-collect a week’s worth of data.
GeorgiaInstituteof nologyTech
PropagationGroup March 11, 2005

Chapter 3
DATA COLLECTION
3.1 Building Construction
Building material and design of exterior walls determine the penetration loss experi-
enced by radio waves that enter a building. This penetration loss information is very
useful in discriminating between indoor and outdoor calls. In the previous Georgia
Tech campus experiment, the penetration loss for typical urban office buildings from a
statistical point of view was reported to be 12.3 dB [Zhu04]. The buildings set in this
Greenville experiment are quite different from the Georgia Tech campus buildings,
which were mainly steel, concrete, and brick. The building materials at Greenville
are mainly brick and concrete in the downtown area and partially modular units and
wood in other areas.
3.2 Frequency Plan Change
A new complication to the Greenville experiment was the mid-measurement frequency
plan change made by the local cellular carrier. Our subsequent compensation for this
change demonstrates that real-life network modifications can be considered through
data adjustment and software with out have to re-collect existing data.
The DCCH channels were changed during the measurement campaign on Dec
10 March 11, 2005

Section 3.2. Frequency Plan Change Indoor Radiolocation in 1920 MHz GSM 11
17, 2005. This frequency plan change was applied to the entire network. DCCHs
originally at ARFCN 786-800 range were moved to ARFCN 512-526 by the carrier, a
55MHz change in carrier frequency in the 1920 MHz band. This network optimization
change was limited to the DCCH frequency plan only. No tower transmit powers were
reassigned. One drive test was performed before the frequency plan change on Dec
16, 2004 and another drive test was performed after the frequency change on Feb 01,
2005.
3.2.1 Drive Test Measurement
Drive test measurements were used to calibrate the PSD. The procedure is similar
to the drive test measurements conducted by wireless service providers to optimize
their network. The TEMS unit was placed in a vehicle with an external scanner whip
antenna mounted on the vehicle rooftop. A GPS antenna was also placed on the
rooftop of the vehicle. RSS information from ARFCN 512-526 and ARFCN786-800
was collected in the testing area. Two drive test measurements were performed in this
measurement campaign. The first one occurred before the frequency plan change, the
other one after the change.
Figure 3.1 and Fig. 3.2 show the routes of the drive test measurements. Data was
collected on all high ways and major roads within the test area. Only a portion of
minor streets were driven, although all streets in the downtown urban section were
driven at least once.
GeorgiaInstituteof nologyTech
PropagationGroup March 11, 2005

12 Indoor Radiolocation in 1920 MHz GSM Data Collection Chapter 3
Figure 3.1 Drive test measurement routes collected on Dec 16, 2004 in Greenville,
SC.
3.2.2 Walking Measurement
Because the drive test measurements are limited to roadways, the RSS inside a build-
ing or on a pedestrian path cannot be measured. Walking measurements become the
key for filling in the gaps in the RF maps database (also called PSD). The field engi-
neer must walk and collect data both inside and outside a building while holding the
handset in a realistic position to make the RSS have the same propagation features as
an active call made by a cellular phone customer. Thus, our active call data contains
polarization, body shadowing, and pedestrian-speed, small-scale fading effects.
The outdoor walking measurements collect the RSS and serving cell information
in the form of an NMR. Most importantly, the outdoor walking measurements may
contain a GPS fix reported from the Garmin GPS V unit with accuracy better than
GeorgiaInstituteof nologyTech
PropagationGroup March 11, 2005

Section 3.2. Frequency Plan Change Indoor Radiolocation in 1920 MHz GSM 13
Figure 3.2 Drive test measurement routes collected on Feb 01, 2005 in Greenville,
SC.
10 m. These outdoor walking measurements can be used to verify the GPS correction
for walking measurements made inside adjacent buildings. All the NMRs collected
during the outdoor walking measurement were split into two groups: one group to
calibrate the PSD and the other group to test the RSS location. These groups of data
are kept separate so that we are not testing the location engine with the same data
used to calibrated it, thereby making the results seem overly optimistic.
Because the outdoor walking measurements are primarily meant to assist indoor
GPS corrections and help in penetration loss calculations, they should follow two
requirements: 1) they must be performed under a clear sky condition (if possible) to
provide a good satellite channel for the GPS unit to have an accurate location fix.
2) they must follow a pedestrian style walk while the field engineer maintains the
posture of a typical cell-phone call with handset pressed to head.
GeorgiaInstituteof nologyTech
PropagationGroup March 11, 2005

14 Indoor Radiolocation in 1920 MHz GSM Data Collection Chapter 3
Figure 3.3 and Figure 3.4 show typical outdoor walking measurements.
Figure 3.3 Georgia Tech student research Albert Lu and Jian Zhu take an outdoor
walking measurement
Figure 3.4 Georgia Tech student research Albert Lu and Jian Zhu take an outdoor
walking measurement
The indoor walking measurements collect NMRs for calls originating indoors. Be-
GeorgiaInstituteof nologyTech
PropagationGroup March 11, 2005

Section 3.2. Frequency Plan Change Indoor Radiolocation in 1920 MHz GSM 15
cause there is no “open sky conditions” the GPS unit is not providing any location
fix during the indoor walking measurement. The GPS fix program “GPSFixerV3.fig”
was used to correct the GPS location by converting the selected path on an aerial
photograph of the test spot into a GPS location fix. Thus, all of our indoor data is
stamped with a precise longitude and latitude.
Figure 3.5 and Figure 3.6 show typical outdoor walking measurements.
Figure 3.5 Georgia Tech student research Jian Zhu and Professor Gregory Durgin
take a walking measurement in a downtown Greenville eatery.
The following procedure for indoor measurement should be followed to ensure an
accurate data collection:
1. Decide a measurement route in each room that covers most of the area, space
permitting.
2. Move at a constant speed. If the route is less than 10 meters, move backward
and forward several times to make sure the measurement time lasts at least 30
seconds.
GeorgiaInstituteof nologyTech
PropagationGroup March 11, 2005

16 Indoor Radiolocation in 1920 MHz GSM Data Collection Chapter 3
Figure 3.6 Georgia Tech student research Jian Zhu and Professor Gregory Durgin
take a walking measurement on the 9th floor of an office building.
3. Mark the route on a map in real time at each turn point.
4. Repeat 1-3 for all routes within the same building.
5. Walk around the outdoor perimeter and mark down the outdoor route in real-
time for GPS correction verification.
3.3 GIS Data
The principle source of GIS in the study is a high-resolution database of aerial pho-
tographs of the city of Greenville. This GIS image contains photographic pixels with
1 m × 1 m resolution. The image was constructed in 1994 – nearly 10 years prior to
the measurement campaign. Some of the buildings are not on this image and some
buildings have been replaced.
Ths source of this GIS data is Terra Server USA at terraserver-usa.com. Small
map pieces are downloaded in 200 m by 200 m size and reassembled to form an aerial
GeorgiaInstituteof nologyTech
PropagationGroup March 11, 2005

Section 3.3. GIS Data Indoor Radiolocation in 1920 MHz GSM 17
photograph for the entire test region.
GeorgiaInstituteof nologyTech
PropagationGroup March 11, 2005

Chapter 4
DATA ANALYSIS
4.1 Handset RSS Distribution
Just as in the previous location experiment on the Georgia Tech campus, the informa-
tion used to discriminate between the indoor and outdoor calls is mainly embedded
in the absolute value of the RSS. Received signal strength aggregate (RSSA) was used
to decide whether a call comes from an indoor or outdoor location.
4.1.1 Indoor RSS Distribution
RSSA is defined as the linear average RSS over the six neighbor DCCH channel
[Zhu04]. The RSSA is assumed to be log-normally distributed. Figure 4.1 shows the
comparison between the theoretical log-normal assumption and the statistical result.
The biggest discrepency between the empirical distribution and the empirical log-
normal distribution is the noise floor of the handset RF chain. The handset can only
measure signals with strengths higher than -109 dBm and the linearity for the signal
with strengths between -109 to -100 dBm is poor. For the indoor case, the peak at
-107 dBm is mainly the result of this noise floor.
Based on our experiment, the mean of indoor RSSA is -96.0 dB and the stan-
dard deviation is 7.1 dB. The statistics from the measurement and the theoretical
18 March 11, 2005

Section 4.1. Handset RSS Distribution Indoor Radiolocation in 1920 MHz GSM 19
distributions are shown in Figure 4.1.
−120 −110 −100 −90 −80 −70 −60 −500
0.01
0.02
0.03
0.04
0.05
0.06
Indoor received signal strength dB−average over the 6 neighbor DCCHs
Measurement StastisticsTheoretical Distribution
Figure 4.1 Indoor Received Signal Strength Aggregate (RSSA) distribution mea-
sured in Greenville, SC.
4.1.2 Outdoor RSS Distribution
The local peaks at -101 and -110 dBm are also the results of noise-induced nonlinearity
of the handset RF chain.
Based on the active call data, the mean outdoor RSSA is -86.7 dBm and the
standard deviation is 5.6 dB. Figure 4.2 shows the empirical distribution for outdoor
RSSA.
GeorgiaInstituteof nologyTech
PropagationGroup March 11, 2005

20 Indoor Radiolocation in 1920 MHz GSM Data Analysis Chapter 4
−120 −110 −100 −90 −80 −70 −60 −500
0.01
0.02
0.03
0.04
0.05
0.06
0.07
0.08
0.09
Outdoor received signal strength dB−average over the 6 neighbor DCCHs
Measurement StastisticsTheoretical Distribution
Figure 4.2 Outdoor Received Signal Strength Aggregate (RSSA) distribution mea-
sured in Greenville, SC.
4.1.3 Indooor/Outdoor Comparison
Figure 4.3 shows the difference between indoor calls and outdoor calls in side-by-side
plots. Recall that there is a large standard deviation of indoor RSSA (14.1 dB) when
compared to outdoor RSSA (9.7 dB) in the Georgia Tech campus measurement cam-
paign. The trends of a large standard deviation of indoor RSSA (7.1 dB) compared to
outdoor RSSA (5.6 dB) is also observable in the Greenville measurement campaign.
The mean indoor RSSA is 9.4 dB lower than the outdoor RSSA, which is a smaller
difference than that observed in the Georgia Tech campus campaign (12.3 dB). There
GeorgiaInstituteof nologyTech
PropagationGroup March 11, 2005

Section 4.1. Handset RSS Distribution Indoor Radiolocation in 1920 MHz GSM 21
are several reasons for the difference. First, the building construction materials are
different. Most of the buildings in the Georgia Tech campus are made of brick and
concrete. The buildings in Greenville measurement campaign are made of mixed
materials such as modular pieces and wood as well as brick and concrete. Second,
the difference between the RF chains of GSM vs. IS-136 handsets may also lead to
discrepancies. Third, the carrier frequency was 850MHz for the Georgia Tech campus
measurement and 1920MHz for the Greenville measurements; this difference is likely
large enough to change large-scale path loss characteristics.
−120 −110 −100 −90 −80 −70 −60 −500
0.01
0.02
0.03
0.04
0.05
0.06
0.07
0.08
Received signal strength dB−average over the 6 neighbor DCCHs (dBm)
OutdoorIndoor
Figure 4.3 Indoor and outdoor RSSA theoretical distribution.
GeorgiaInstituteof nologyTech
PropagationGroup March 11, 2005

22 Indoor Radiolocation in 1920 MHz GSM Data Analysis Chapter 4
4.2 Indoor/Outdoor Discrimination Rate
Based on the RSSA theoretical distribution. The threshold (xth=-91.8 dBm) is cal-
culated in Equation 4.2.1:
1√2πσi
e−
(xth−µi)2
2σ2
i =1√
2πσo
e−
(xth−µo)2
2σ2o (4.2.1)
The decision of Indoor/Outdoor is made by comparing RSSA with the threshold.
If the RSSA is lower than the threshold, the decision is “indoor”. Otherwise, the
decision is “outdoor”.
Table 4.1 shows the proposed discrimination method made correct decisions 76%
of the time, which is the number of indoor test points that were correctly identified
(35.9%) plus the number of outdoor points that were also correctly identified (40.1%).
Table 4.1 Discrimination rate by using handset RSSA distribution.
Decision Sub-Total
Indoor Outdoor
Actual Indoor 26,576 (35.9%) 12,690 (17.1%) 39,266 (53.0%)
Outdoor 5,140 (6.9%) 29,719 (40.1%) 34,859 (47.0%)
Correct Rate 76%
4.3 GPS effectiveness
Global Positioning System (GPS) is an accurate location technology which provides
location fixes with less than 10 m of two-dimensional error in the best-case scenarios.
However, these “best-case scenarios” require line-of-sights from the GPS receiver to
several GPS satellites. Such conditions generally do not exist for indoor cases and
are infrequent outdoors when the GPS receiver is close to a building or comparable
GeorgiaInstituteof nologyTech
PropagationGroup March 11, 2005

Section 4.3. GPS effectiveness Indoor Radiolocation in 1920 MHz GSM 23
shadower. This means that conspicuous position errors may exist even if a GPS
location fix is reported by the hardware.
A Garmin GPS V device is used in our experiment to provide GPS location
information. The Garmin GPS unit updates location fixes every two seconds. Because
the Garmin GPS V unit cannot always get a GPS fix, the GPS correction program
“GpsFixerV3” was written to fill the GPS information.
Our experiment takes measurements inside a building as well as the outside
perimeter of the building. Among all the outdoor data points, 9.2% of the NMRs do
not have a location fix from the Garmin GPS unit. That means that the GPS unit
is less than 91% effective outdoors when it is close to a building. As for the indoor
cases, the GPS unit is only 10.4% effective.
Table 4.2 Garmin V GPS effectiveness statistics based on 60,624 indoor and outdoor
measurement records.
GPS valid GPS not valid Sub-total
Indoor 4,069 (6.71%) 35,197 (58.06%) 39,266 (64.77%)
Outdoor 19,394 (31.99%) 1,964 (3.24%) 21,358 (35.23%)
Sub-total 23,490 (38.70%) 37,161 (61.30%) 60,624 (100%)
Table 4.3 Garmin V GPS effective statistics. Percentages are compared with indoor
or outdoor separately.
GPS valid GPS not valid Measurement Count
Indoor 10.36% (4,069) 89.64% (35,197) 39,266(100%)
Outdoor 90.8% (19,394) 9.2% (1,964) 21,358(100%)
During each field measurement, we measure indoor locations first, followed by a
measurement of the outdoor perimeter of that building. Considering the satellite
GeorgiaInstituteof nologyTech
PropagationGroup March 11, 2005

24 Indoor Radiolocation in 1920 MHz GSM Data Analysis Chapter 4
acquisition time for GPS, our statistics may be biased towards poor outdoor GPS
effectiveness. Considering the “guess” ability of the Garmin V GPS, which uses the
last known GPS location when a full satellite fix is unavailable, our statistics may be
biased towards optimistic indoor GPS effectiveness.
Another issue is that the above statistics are measured by a $250 commercial
Garmin V unit which is especially designed to acquire and maintain GPS location.
It was designed to optimize the GPS estimate from the single-band antenna and RF-
chain. This optimized structure does not exist in a GPS-enabled handset. Therefore
a GPS-enabled handset will likely be worse in acquiring a GPS fix than the statistics
above would suggest.
4.4 RSS in high-rise building
This section discuss the relationships between RSS and vertical position within a
high-rise building. There are only several high-rise buildings in Greenville, so access
is limited. We received access to two office buildings which are more than 10 stories
in downtown Greenville. One of them has 18 floors and the other one has 12 floors.
Active call data is collected in the stairwells of both building and on selected floors.
Scanner data is also collected in the second stairwell of the 18-floor building.
Figures 4.4–4.6 show the relationship between the floor number and the received
signal strength aggregate (RSSA). A clear trend of higher RSSA for higher floor
level is apparent. In Figure 4.4, the lowest 3 floors have similarly low RSSA due
to the surrounding buildings and trees. These nearby buildings and trees block the
propagation path to the lower floors in the high-rise building. A high increase in
RSSA occus at the 7-th floor due to renovations that were being performed at the
time. There were no window blinds or furnishings on the 7-th floor, which led to
GeorgiaInstituteof nologyTech
PropagationGroup March 11, 2005

Section 4.4. RSS in high-rise building Indoor Radiolocation in 1920 MHz GSM 25
much less shielding and obstruction for penetrating radio waves. The same trend is
shown in Figure 4.6 which is taken in the same building but in a different stairwell.
Figure 4.5 does not show the increase loss for the 7-th floor, since it is taken in a
different building in which the 7-th floor is not under renovation.
0 2 4 6 8 10 12 14 160
5
10
15
20
25
Floor
Gai
ns w
.r.t
first
floo
r (d
B)
Figure 4.4 Signal gain vs. floor number, taken from active call data, 6 DCCH
channels, slope +1.43 dB/floor.
GeorgiaInstituteof nologyTech
PropagationGroup March 11, 2005

26 Indoor Radiolocation in 1920 MHz GSM Data Analysis Chapter 4
1 2 3 4 5 6 7 8 9 10 110
2
4
6
8
10
12
14
16
18
Floor
Gai
ns w
.r.t
first
floo
r (d
B)
Figure 4.5 Signal gain vs. floor number, taken from active call data, 6 DCCH
channels, slope +1.16 dB/floor.
GeorgiaInstituteof nologyTech
PropagationGroup March 11, 2005

Section 4.4. RSS in high-rise building Indoor Radiolocation in 1920 MHz GSM 27
0 2 4 6 8 10 12 14 160
2
4
6
8
10
12
14
16
18
20
Floor
Gai
ns w
.r.t
first
floo
r (d
B)
Figure 4.6 Signal gain vs. floor number, taken from scanner data, 15 DCCH
channels slope +1.23 dB/floor.
GeorgiaInstituteof nologyTech
PropagationGroup March 11, 2005

Chapter 5
PREPARING RF MAPS
5.1 Equivalent Modification on DCCH Change
Network optimization is a routine procedure that every wireless service provider must
perform from time to time. During the Greenville measurement campaign, the Ded-
icated Control Channel (DCCH) frequency plan was changed at the end of the first
week (December 17, 2004). The change covered the entire test area. The DCCHs
of all cells shifted down from Absolute Radio Frequency Channel Number(ARFCN)
range 786-800 to (ARFCN) range 512-526, a total change of only 55 MHz on the
carrier frequency of 1900 MHz. The new ARFCN of the DCCH became the old
ARFCN of the DCCH minus 274. Few base stations in the surrounding area had
previously used ARFCNs in the range of 512-526 before the frequency plan change.
Furthermore, no transmit power was modified for any cell during the measurement
campaign. Based on the fact above, one assumption for calibration of the PSD is that
the propagation characteristics of ARFCN 786-800 were the same as or very close to
the propagation characteristic of ARFCN 512-526. Another assumption is that the
carrier-to-interference ratio (CIR) did not change much during this frequency plan
update, because the entire area has almost the same relative DCCH pattern as before
the frequency change.
28 March 11, 2005

Section 5.1. Equivalent Modification on DCCH Change Indoor Radiolocation in 1920 MHz GSM 29
Figure 5.1 and Figure 5.2 compare the DCCH setup in the test area before and
after the frequency plan change for DCCH 786 and DCCH 512. Figure 5.3 and Figure
5.4 compare the DCCH setup in the test area before and after the frequency plan
change for DCCH 787 and DCCH 513. These figures show that the base station
distribution of DCCH 786 before the frequency change is almost the same as the base
station distribution of DCCH 512. More comparison figures are available in Appendix
A.
−82.6 −82.55 −82.5 −82.45 −82.4 −82.35 −82.3 −82.25 −82.2 −82.1534.6
34.65
34.7
34.75
34.8
34.85
34.9
34.95
35
Longitude
Latit
ude
Figure 5.1 Longitude/Latitude map of base stations (* and O) at Greenville, SC
using DCCH 786 on Dec 14, 2004. The thick path s a single drive-test route through
the test area.
GeorgiaInstituteof nologyTech
PropagationGroup March 11, 2005

30 Indoor Radiolocation in 1920 MHz GSM PREPARING RF MAPS Chapter 5
−82.6 −82.55 −82.5 −82.45 −82.4 −82.35 −82.3 −82.25 −82.2 −82.1534.6
34.65
34.7
34.75
34.8
34.85
34.9
34.95
35
Longitude
Latit
ude
Figure 5.2 Longitude/Latitude map of base stations (* and O) at Greenville, SC
using DCCH 512 on Dec 31, 2004.
GeorgiaInstituteof nologyTech
PropagationGroup March 11, 2005
Section 5.1. Equivalent Modification on DCCH Change Indoor Radiolocation in 1920 MHz GSM 31
−82.6 −82.55 −82.5 −82.45 −82.4 −82.35 −82.3 −82.25 −82.2 −82.1534.6
34.65
34.7
34.75
34.8
34.85
34.9
34.95
35
Longitude
Latit
ude
Figure 5.3 Longitude/Latitude map of base stations (* and O) at Greenville, SC
using DCCH 787 on Dec 14, 2004.
GeorgiaInstituteof nologyTech
PropagationGroup March 11, 2005

32 Indoor Radiolocation in 1920 MHz GSM PREPARING RF MAPS Chapter 5
−82.6 −82.55 −82.5 −82.45 −82.4 −82.35 −82.3 −82.25 −82.2 −82.1534.6
34.65
34.7
34.75
34.8
34.85
34.9
34.95
35
Longitude
Latit
ude
Figure 5.4 Longitude/Latitude map of base stations (* and O) at Greenville, SC
using DCCH 513 on Dec 31, 2004.
GeorgiaInstituteof nologyTech
PropagationGroup March 11, 2005

Section 5.2. GPS Manual Correction Indoor Radiolocation in 1920 MHz GSM 33
5.2 GPS Manual Correction
The measurement campaign used a Garmin GPS V system to record real-time latitude
and longitude for collected data. The unit provides GPS location estimates within
10 m of ground-truth in an open sky outdoor environment, and sometimes in excess
of 25 m under thick cloud, trees, or besides large buildings. In these situations, the
GPS often cannot even estimate position because it cannot acquire the minimum
3 satellites required for triangulation. Most of the time, the GPS signals vanish
completely in an indoor environment.
The TEMS program collected data from both the testing handset and the Garmin
GPS V unit. Network measurement reports were generated at a rate of 2 reports per
second, which are stamped with system time and all network measurement report
data from the handset.
The custom Matlab program GPSFixerV3 is used to correct location information
from poor or missing GPS records. As handset measurements are collected, the field
engineer clicks on the endpoints of the measurement collection path as seen from a
geo-referenced satellite photograph (or aerial photo) of the test area loaded on the
laptop computer. After clicking, the program GPSFixerV3 adds GPS coordinates to
the scanner or active call records by assuming that the measurements are uniformly
distributed along the line connecting the two end points.
During the measurement campaign, most of the indoor path is carefully estimated
from the aerial photo. To prevent the marking of a wrong building, outdoor measure-
ment collections were conducted under clear sky conditions around the building. The
indoor GPS locations corrected by GPSFixerV3 were compared with any outdoor
GPS locations from the Garmin V unit and aligned with the aerial photo. In this
case the error of indoor GPS data should be less than 10 m.
GeorgiaInstituteof nologyTech
PropagationGroup March 11, 2005

34 Indoor Radiolocation in 1920 MHz GSM PREPARING RF MAPS Chapter 5
5.3 Indoor Calibration
For indoor calibration of PSDs, we used the active call data collections with the
Ericsson TEMS unit. The long list of 74,125 NMRs is grouped into 530 blocks of
continuous NMRs taken during the same phone call. Each NMR in a single block
is assigned a number showing how many NMRs come after the current NMR in the
same block. The active call data is then separated into two groups. The first group
contains all odd-numbered NMRs and the second group contains all even-numbered
NMRs. The first group is used as indoor calibration data while the second group is
used as location engine test data. In this case 37,064 NMRs were used to calibrate the
indoor PSD and the remaining 37,063 NMRs were used to test location performance.
Thus, we ensure that we are not tainting our tests by double-counting test data and
calibration data.
The active call data was taken with a handset antenna. The GSM NMRs collected
from active call contain Received Signal Strengths (RSS) of 6 DCCHs from neighbor
base stations. The scanner data was collected with a high-gain antenna. The scanner
data reports contain all RSSs for all DCCHs. Because scanner data is collected with
a different antenna than a handset antenna, the RSSs taken from active call and
scanning data have a dB offset between them. To get rid off the offset, the following
operation is used in calibrating the indoor data.
Let ACRSSm,n denote the RSS of the n-th neighbor of the m-th active call
record; let ACDCCHm,n denote the corresponding DCCH channels of the m-th
active call record; let PSD denote a drive-test calibrated PSD; let the operation
(PSD(DCCHm,n)) give the RSS of the n-th neighbor DCCH channel of the corre-
sponding m-th NMR at the same longitude and latitude as the location active call
GeorgiaInstituteof nologyTech
PropagationGroup March 11, 2005

Section 5.4. Network Measurement Report (NMR) Matlab File FormatIndoor Radiolocation in 1920 MHz GSM 35
NMR was measured. The dB-Offset will be calculated by
Offset =1
6
6∑
i=1
(ACRSSm,i − PSD(ACDCCHm,i)) (5.3.1)
This offset will be removed from the active call measurements. The corrected RSS
value is then blended into the PSD with radius of 1 cell (10 m) to complete the
indoor calibration. This RSS map blending process was described in detail in the
first Georgia Tech radiolocation report [Zhu04].
5.4 Network Measurement Report (NMR) Matlab File Format
5.4.1 NMR Matlab Matrix Structure
The road measurements by the TEMS unit have been stored in a Matlab matrix
format. For reproducibility and future research, the format of the Matlab file is
briefly described in Table 5.1 and Table 5.2:
For easy access and fast indexing, the whole NMR matrix is in real number format.
Date stores date information, i.e. 20041213. The functions floor() and/or
round() functions can be used to extract year/month/day out of the date.
Time cell stores time information count in seconds from 00:00:00 am. For
example 9:15:12 am is equal to 9*60*60+15*60+12.
Frame cell stores the frame number count by base station.
Lat/Lon cell saves the GPS information either from GPS receiver or from indoor
GPS correction program.
GpsValid cell holds the information on how the GPS fix was generated. A value
of “2” indicates that the GPS fix came from the Garmin GPS V unit and no
GeorgiaInstituteof nologyTech
PropagationGroup March 11, 2005

36 Indoor Radiolocation in 1920 MHz GSM PREPARING RF MAPS Chapter 5
Table 5.1 Row format of matlab matrix file ”NMRxx.mat” from active call/networkmeasurement report
1 2 3 4 5Date Time Frame Number Latitude Longitude
6 7 8 9 10GPS Valid IndoorMark Cell ID DCCH Number Tn
11 12 13 14 15Maio HSN CI BSIC ARFCN
16 17 18 19 20MCC MNC LAC Rx Level Rx Qual
21 22 23 24 25Rx Level sub Rx Qual sub Time Advance Tx Power RLink Act
26 27 28 29 30Rlink Max C1 C2 DTX DL FER
31 32 33 34 35 · · · 40FER sub SQI GPS Correctable Elevation Reserved
41 42 43 44 45No. 1 DCCH No. 1 Rx Lvl No. 1 BSIC No. 1 C1 No. 1 C2
46 47 48 49 50No. 2 DCCH No. 2 Rx Lvl No. 2 BSIC No. 2 C1 No. 2 C2
51 52 53 54 55No. 3 DCCH No. 3 Rx Lvl No. 3 BSIC No. 3 C1 No. 3 C2
56 57 58 59 60No. 4 DCCH No. 4 Rx Lvl No. 4 BSIC No. 4 C1 No. 4 C2
61 62 63 64 65No. 5 DCCH No. 5 Rx Lvl No. 5 BSIC No. 5 C1 No. 5 C2
66 67 68 69 70No. 6 DCCH No. 6 Rx Lvl No. 6 BSIC No. 6 C1 No. 6 C2
71 · · · 86 87 88 89 90Reserved continuity* RSV Base station Lat.* Base station Lon.*
*: Only exist in NMR6n.mat and NMR6tn.mat
corresponding time stamp was recorded in the GPS correction program; the
final GPS fix is from the Garmin GPS unit. A value of “1” indicates that the
GPS fix from Garmin GPS V is available, and that the time stamp was recorded
in the GPS correction program; the final GPS fix is from the GPS correction
GeorgiaInstituteof nologyTech
PropagationGroup March 11, 2005

Section 5.4. Network Measurement Report (NMR) Matlab File FormatIndoor Radiolocation in 1920 MHz GSM 37
program. A value of “0” indicates that the GPS fix from the Garmin GPS V is
not available and the time stamp was recorded in the GPS correction program;
the final GPS fix is taken from the GPS correction program. The NMRs that
have no GPS fix from either the Garmin GPS unit or the time stamp recorded
in the GPS correction program are discarded.
IndoorMark cell identifies whether the NMR is taken indoors or outdoors. A
value of “1” indicates that the NMR is gathered during an indoor call.
CellId cell stores the cellID information. Since the cellID is a combination of
numbers and alphabet, a combination of the ASCII value of each upper-case
character is used instead of the original CellID. For easy indexing, no Matlab
cell format is used. For example, ’A1E2’ will be convert into 65496950. (’a1e2’
will be changed to ’A1E2’ first.) For details and Matlab code, please check
“ShowCellId.m”
Continuity cell gives how many continuous NMRs follow the current NMR. For
example, a number of 76 indicates that the following 76 NMRs are recorded
from the same call. The number is generated by the program “ContinueNmr-
Counter.m”. NMRs are considered continuous if two adjacent NMRs have less
that 10m change in each direction, and less than 5 seconds change in time, and
have the same indoor/outdoor properties. * This only exists in NMR6n.mat
and NMR6tn.mat.
Base station Lat. cell and Base station Lon. cell are used to save base station
latitude and longitude information. This data was mostly used for correlating
radio environment information and user-to-basestation distance. * This is only
exist in NMR6n.mat and NMR6tn.mat.
GeorgiaInstituteof nologyTech
PropagationGroup March 11, 2005

38 Indoor Radiolocation in 1920 MHz GSM PREPARING RF MAPS Chapter 5
The second matrix keeps “Hex String”, “Channel Type”,“Channel Mode”,“Sub-
Channel Number”,“Hopping”, and “CellID” information which is in string format, as
shown in Table 5.2.
Table 5.2 Row format of matlab cell matrix file “NMRc.mat” only from active
call/network measurement report.
1 2 3
Hex String Channel Type Channel Mode
4 5 6
Sub-Channel Number Hopping Cell ID
5.4.2 NMR file list
The following NMR files are available:
NMR.mat: This file contains original data in two matrices from the active call
collections. The rows of this matrix correspond to the same NMR recorded in each
matrix. The NMR matrix is a real number matrix and the NMRc matrix is a cell-
format matrix. The NMR matrix follows the format in Table 5.1. The NMRc matrix
follows the format in Table 5.2. Total row size is 89,651.
NMR6.mat and NMR6n.mat: These matrices contain only the NMRs with 6 sector
information. The Cell ID information in NMRc matrix has been converted and saved
in NMR matrix, as described in Section 5.4.1. The NMRc matrix has been discarded.
NMR6n.mat also contains a continuous call counter. The total row size is 74,125.
NMR6t.mat and NMR6tn.mat: the even-numberd rows in NMR6 are used for
testing location algorithms. (The odd-numbered rows were used in indoor calibra-
tion.) The total row size is 37,062.
GeorgiaInstituteof nologyTech
PropagationGroup March 11, 2005

Section 5.5. Scanner Drive Test Matlab File Format Indoor Radiolocation in 1920 MHz GSM 39
5.5 Scanner Drive Test Matlab File Format
5.5.1 Scanner Drive Test Matlab Matrix Structure
Scanner drive test data is used to calibrated the PSD. This file’s format is described
in Table 5.3.
Table 5.3 Row format of Matlab matrix file “xxxxdrscn.mat” from road scanner
testing.
1 2 3 4 5
Date Time RSV Latitude Longitude
6 · · · 35 36 37 38 39
RSV DCCH 512 RSSI DCCH 512 BSIC DCCH 513 RSSI DCCH 513 BSIC
40 41 · · · 64 65
DCCH 514 RSSI DCCH 514 BSIC · · · DCCH 526 RSSI DCCH 526 BSIC
66 67 · · · 94 95
DCCH 786 RSSI DCCH 786 BSIC · · · DCCH 800 RSSI DCCH 800 BSIC
5.5.2 Scanner road measurment file list
Two scanner road test files are available.
1216drscn.mat is the scanner testing on Dec-16-2004. This file records RSS and
BSIC info of DCCH 512-526 and DCCH 786-800.
0201drscn.mat is the scanner testing on Feb-01-2005. Because of the network
DCCH change on Dec-17-2004, only DCCH 512-526 are active in the testing
area. This file records only RSS and BSIC for DCCH 512-526.
GeorgiaInstituteof nologyTech
PropagationGroup March 11, 2005

Chapter 6
LOCATION PERFORMANCE
STATISTICS
6.1 Location Algorithm and Performance
6.1.1 Metric of Location Performance
The distance in meters between a location estimate and the handset’s groundtruth
position is the error distance. For every location experiment in this study, we calculate
and report the percentages of error distance values below 100m and 300m and the error
distances corresponding to the 66.7% and 95% thresholds for cumulative distribution
of location error.
6.1.2 Base Line: Relative method, 10 NMR-average
The relative method with RSS averaged over 10 NMR is reported because it was
comparable to the location algorithm used in the Georgia Tech campus tests. As
the average cell size increased from 500m in radius to 2000m in radius, the location
performance drops when compared with the original Georgia Tech campus measure-
ments.
We see from Table 6.1 that the location performance drops significantly. The
40 March 11, 2005

Section 6.1. Location Algorithm and Performance Indoor Radiolocation in 1920 MHz GSM 41
main reason is that we are performing the test in a large area where large errors
are possible. Because of the frequency reuse, a location estimate may fall at a point
far away from the ground truth where DCCHs configuration and RSS are similar to
those measured at original point. For this initial algorithm, the 300 m statistics (39%
and 50%) in this Greenville test are even worse then the 100 m statistics (62% and
70%) in Georgia Tech campus test [Zhu04]. Because the average cell radius increased
from 500 m to nearly 2000 m, the error statistics for this algorithm have increased by
the same factor of 4– the 400 m statistic is close to the Georgia Tech campus 100 m
statistics.
Because of the large test area, it is almost impossible to produce an indoor mask
by hand. An egde detection algorithm in PhotoShop software was used to mark out
the indoor areas, but misidentification occurred for more than 75% of the entire area.
Manual indoor mask correction is required at most locations where we have collected
active call data. The performance of the location algorithm is almost the same as
that using Level 1 PSD (a PSD calibrated with only outdoor drive-test measruement)
in the baseline algorithm. All indoor and pedestrian outdoor collections are omitted
from this PSD. Furthermore, there is no attempt to model signal penetration through
buildings. This type of RF map database represents the general purpose RSS position
location solution proposed in [PB00],[Rao99]. It is the most practical solution since
all measured signal strength data can be collected using standard cellular drive test
procedures. Thus, the data collection is quick and economical. In this report we have
not included the performance of Level 2 PSD (a PSD that is calibrated with outdoor
measurements and indoor modeling) because of the inaccuracy of the indoor mask.
To improve the performance of the location method, we developed a novel search-
area reduction technique which is discussed in the next section.
GeorgiaInstituteof nologyTech
PropagationGroup March 11, 2005

42 Indoor Radiolocation in 1920 MHz GSM Location Performance Statistics Chapter 6
Table 6.1 Location error statistics of relative RSS-method. (Linear averaging of 10
NMRs, 6 sectors)
PSD level Level 1 Level 3
Outdoor Meas. Indoor/Outdoor Meas.
Error <100m 17% 31%
statistics <300m 39% 50%
Percentage 66.7% 1080 m 310 m
statistics 95% 5030 m 5120 m
6.1.3 Search Area Reduction Based on Linear Regression
Linear regression is a general method for spotting trends in large, complicated data
sets. This technique is used here to calculate the relationship between the information
recorded in NMRs, the ground truth of the caller, and the serving base station. This
information is not limited to only the RSS data in the NMR. By estimating this
distance we can improve the position estimate in the RSS-matching portion of the
location algorithm.
In a network measurement report, serving sector information and radio environ-
ment information such as timing advance, received signal strength, and received signal
quality are reported together with neighbor cell DCCH signal strength. Those pieces
of information are very useful in reducing the initial search area. By limiting the
initial search area, the final location estimate can be calculated much faster and with
better accuracy.
Because timing advance (TA) is designed to correct the propagation delay of the
wireless radio signal, the timing advance has a direct relationship to the distance
from caller to basestation. Among all the additional information, TA is the most
important information in reducing the searching area of a location engine. The TA’s
GeorgiaInstituteof nologyTech
PropagationGroup March 11, 2005

Section 6.1. Location Algorithm and Performance Indoor Radiolocation in 1920 MHz GSM 43
value is between 0 and 63 that is corresponding to a propagation distance between 0
km to 35 km. Theoretically, one step in TA is about 547 m (35 km/64 TA units).
However, through careful data mining, we show that one step of TA change is
about 496 m of extra distance from the serving basestation and other information also
contributes to the search area reduction. The pieces of information tested in this re-
port include TXPOWER, RXLEVFULL, RXQUALFULL, RXLEVSUB, RXQUAL-
SUB, TA, DTXDL, FER, FERSUB, and SQI. These pieces of information are reported
in NMRs for the purpose of mobile-assisted hand over (MAHO). Detailed description
for these pieces of information is available in [Hei99], [Meh97], [Red98]:
TXPOWER is the transmit power.
RXLEVFULL is the received signal strength (more specified C1=(RxLev-RxLevAm-
MAX((MSTxPwr-MSMaxTxPwr),0)) ) calculated from continuous transmis-
sion.
RXLEVSUB is the received signal strength (C1) calculated during discontinuous
transmission.
RXQUALFULL is the received signal quality derived from the BER (Bit Error
Rate) with continuous transmission from the base station.
RXQUALSUB is the received signal quality calculated from BER with discon-
tinuous transmission from the base station.
TA is timing advance.
DTXDL is the status of the discontinuous transmission down-link.
FER is the frame error rate of the down-link voice channel with continuous
transmission.
GeorgiaInstituteof nologyTech
PropagationGroup March 11, 2005

44 Indoor Radiolocation in 1920 MHz GSM Location Performance Statistics Chapter 6
FERSUB is the frame error rate of the down-link voice channel with discontin-
uous transmission.
SQI is service quality index, which shows the quality of the current communi-
cation status.
Let us assume that all available information in an NMR (timing advance, received
signal level, received signal quanlity, etc.) is linearly related to the separation distance
between a base station and a mobile user. Thus, we could relate a set of m distance
measurements to a set of m corresponding pieces of NMR info with the following
system of equations:
Ta11c1 + RxLvl12c2 + · · · + RxQual1ncn = Dist1
Ta21c1 + RxLvl22c2 + · · · + RxQual2ncn = Dist2
. . . . . . . . . . . . . . . . . . . . . . . . . . . . . . . . . . . . . . . . . . . . . . . . . .
Tam1c1 + RxLvlm2c2 + · · · + RxQualmncn = Distm
(6.1.1)
Where xxxxmn denotes the nth piece of information from the mth NMR.
The variable cn represents the correlation between measured data (Ta, TxLvl, RxQual,
TxLvlSub, TxQualSub) and the distance from the base station to the caller (Distm).
This system of equations can be written in matrix format
Ta11 RxLvl12 · · · RxQual1n
Ta21 RxLvl22 · · · RxQual2n
. . . . . . . . . . . . . . . . . . . . . . . . . . . . . .
Tam1 RxLvlm2 · · · RxQualmn
c1
c2
...
cn
=
Dist1
Dist2...
Distm
(6.1.2)
Let A denote the matrix of measured data with each row corresponding to a collection
GeorgiaInstituteof nologyTech
PropagationGroup March 11, 2005

Section 6.1. Location Algorithm and Performance Indoor Radiolocation in 1920 MHz GSM 45
of data during one NMR.
A =
Ta11 RxLvl12 · · · RxQual1n
Ta21 RxLvl22 · · · RxQual2n
. . . . . . . . . . . . . . . . . . . . . . . . . . . . . .
Tam1 RxLvlm2 · · · RxQualmn
(6.1.3)
Let ~c denote the best possible parameter vector that relates the measurements in A
to the distances:
~c =
c1
c2
...
cn
(6.1.4)
Let ~d denote the distance vector for each measured point:
~d =
Dist1
Dist2...
Distm
(6.1.5)
In our data set, we trying to find the best values for 5 of the most important param-
eters in ~c from 37,063 NMR data points; thus we have many more equations than
unknowns in the system represented by Equation 6.1.2. This type of system is solved
using the normal equation:
~c = (AT A)−1AT ~d (6.1.6)
Equation 6.1.6 produces a set of parameters ~c that minimizes the mean-square
error between the right and left-hand sides of Equation 6.1.2. Once this vector is
calculated from the measurement data, it can be used to estimate the handset’s
GeorgiaInstituteof nologyTech
PropagationGroup March 11, 2005

46 Indoor Radiolocation in 1920 MHz GSM Location Performance Statistics Chapter 6
distance from the serving base station and generate the distance by using the equation:
distC = [Ta1 RxLvl2 · · · RxQualn]~c (6.1.7)
From Equation 6.1.7, we can use information in the NMR other than RSS to
calculate an approximate distance between user and serving base station. We can
then filter the location estimate through a “probabilistic ring” around the serving
base station to sharpen our final position estimate.
The Figure 6.1 shows the distribution of the error between the actual distance
separating handset and server cell and the calculated distance for 37,062 NMRs an-
alyzed with the regression analysis. On the horizontal axis is the difference between
the measured radius and the radius estimated by Equation 6.1.7. On the vertical axis
is the occurance of each error, which has been binned into 10 m increments.
Figure 6.1, we found 98% of calculated distances lie within ±600m of the measured
distance and 99% within ±800m range.
This extra knowledge of predicted distance from the serving base station limits
the searching area by a ring with median radius of the calculated distance (distC)
and with a width of 1200 m (600 m towards inside and outside).
To decide which information is useful we calculate the effectiveness of each kind of
information. The effectiveness of one kind of information is calculated as the distance
corresponding to one unit change of that information multiplied by the average value
of that kind of information.
Table 6.2 listed the information we found useful in the NMRs. Received signal
strength level full, received strength level sub, and service quality index are also
considered to be useful information besides timing advance.
The relationship between timing advance and user-base station separation distance
is obvious because of the constant-velocity propagation of wireless signal; signals with
GeorgiaInstituteof nologyTech
PropagationGroup March 11, 2005

Section 6.1. Location Algorithm and Performance Indoor Radiolocation in 1920 MHz GSM 47
−800 −600 −400 −200 0 200 400 600 800 1000
0
100
200
300
400
500
600
700
Distance difference between actural distance and calculated distance (m)
Pop
ulat
ion
Figure 6.1 Histogram of base station and user separation distance error between
calculated and measured radii. The mean is 13 m and the standard deviation is 289
m.
longer delays have usually travelled farther. The relationship of the received signal
strength level sub and service quality index can be explained in this way: the further
away the user from the base station, the lower the signal is received and the worse the
service quality becomes. That is why the coefficient corresponding to received signal
strength level sub and service quality index is a negative number. As for the received
signal strength level full, this value is calculated from continuous transmission. To
reduce the interference and conserve energy, the power control mechanism lowers the
GeorgiaInstituteof nologyTech
PropagationGroup March 11, 2005

48 Indoor Radiolocation in 1920 MHz GSM Location Performance Statistics Chapter 6
power level during a silence period for both the base station and the handset. This
RXLEVFULL is more affected by this power control mechanism which makes it less
correlated with the user-base station distance.
Table 6.2 Coefficient calculated by linear regression method
Timing Advance 474 m/TA step
Received signal strength level full 3.7 m/RXLEV change
Received signal strength level sub -1.7 m/RXLEVSUB change
Service quality index -3.8 m /SQI change
The base line algorithm in Section 6.1.2 searches the entire area for the location
estimate based on the RSS of neighbor DCCHs. There is more information available
in NMRs such as serving cell information and radio environment information. This
extra information can be used to limit the searching area to a ring area surrounding
the serving base station as discussed above. By using this method, location accuracy
increases significantly as shown in Table 6.3.
In the Level 1 PSD results, position estimates are less than 100 m from ground
truth 26% of the time and 300 m from the ground truth 62% of the time, which
improved the 100 m statistics by 9% and 300 m statistics by 23%. For the Level 3
PSD, The searching-area reduction brings similar improvements. Position estimates
are 100 m from ground truth 43% of the time and 300 m from the ground truth 71%
of the time, which corresponding to increases of 12% and 21%, respectively.
GeorgiaInstituteof nologyTech
PropagationGroup March 11, 2005

Section 6.1. Location Algorithm and Performance Indoor Radiolocation in 1920 MHz GSM 49
Table 6.3 Location error statistics of relative RSS-method with limited search area.
(Linear averaging of 10 NMRs, 6 sectors)
PSD level Level 1 Level 3
Outdoor Meas. Indoor/Outdoor Meas.
Error <100m 26% 43%
statistics <300m 62% 71%
Percentage 66.7% 330 m 250 m
statistics 95% 1060 m 1120 m
GeorgiaInstituteof nologyTech
PropagationGroup March 11, 2005

50 Indoor Radiolocation in 1920 MHz GSM Location Performance Statistics Chapter 6
6.1.4 Continuous NMR VS. Average NMRs
In our baseline algorithm, 10 NMRs are linearly-averaged to get one averaged NMR
that has less noise and fading than the individual NMRs. This averaged NMR will run
through our simple relative RSS location algorithm to get a location estimate. The
averaging process limits the availability of NMRs. First of all, it requires 10 continuous
NMRs reporting from the same neighbor cells, which is not always possible in a GSM
network. Second, the handover and neighbor list change provides extra information,
which is very useful in limiting the searching area and improving the location accuracy.
Third, the method of averaging is still vulnerable to measurement error and noise.
The improved method uses the search area reduction technique of Section 6.1.3.
At the same time, continuous NMRs are not just averaged but used more effectively
by making individual estimates on each NMR and post-processing these results.
In the relative RSSI location algorithm description in Section 6.2.2 of [Zhu04], the
mean of each vector in the PSD is calculated in dBm. This mean is subtracted from
the vector:
Prssrx,y,i = Prssx,y,i −1
N
N∑
j=1
Prssx,y,j (6.1.8)
where Prssrx,y,i denotes the received signal strength of the ith control channel at the
location coordinates x, y.
The mean of the measured NMR vector is subtracted from the measured vector
to form a new vector:
Nrssri = Nrssi −1
N
N∑
j=1
Nrssj (6.1.9)
where Nrssri is the received signal strength reported in the NMR in the ith channel.
After normalization, all vectors of received signal strength become independent of
any Antenna/RF chain bias.
The relative signal vectors from the NMR and PSD are used to calculate the
GeorgiaInstituteof nologyTech
PropagationGroup March 11, 2005

Section 6.1. Location Algorithm and Performance Indoor Radiolocation in 1920 MHz GSM 51
measurement distance for each raster point as in Equation (6.1.10).
M(x, y) =
√
√
√
√
N∑
i=1
(Prssrx,y,i − Nrssri)2 (6.1.10)
This M(x, y) matrix is called “distance matrix” which represent the Euclidean dis-
tance between the RSS from the NMR and the RSS in the PSD. The coordinates x, y
that yield the lowest measurement distance are chosen to be the location estimate.
In our improved algorithm, continuous NMRs are not just averaged and fed into
the algorithm described above. Based on the assumption that the distance that
the caller moves during a phone call or the period of 10 NMRs is relatively short
(compared to the PSD raster point size), a “distance matrix aggregate (DMA)” is
used instead of the averaged 10 NMRs. In the distance matrix aggregate method,
each NMR will be used to calculate a distance matrix, all the distance matrices will
be added together to form a distance matrix aggregate. Each roster point in this
distance matrix aggregate is a measurement distance aggregate. The coordinates
(x, y) that yield the lowest measurement distance aggregate are chosen to be the
location estimate.
The Table 6.4 reports the performance of using 10 NMRs by calculating with the
“Distance matrix aggregate” based on the assumption of the user will not move faster
than walking speed.
GeorgiaInstituteof nologyTech
PropagationGroup March 11, 2005

52 Indoor Radiolocation in 1920 MHz GSM Location Performance Statistics Chapter 6
Table 6.4 Location error statistics for the relative RSS-method with limited search
area and distance matrix aggregate. (10 NMRs, 6 sectors)
PSD level Level 1 Level 3
Outdoor Meas. Indoor/Outdoor Meas.
Error <100m 30% 51%
statistics <300m 71% 79%
Percentage 66.7% 270 m 180 m
statistics 95% 580 m 530 m
GeorgiaInstituteof nologyTech
PropagationGroup March 11, 2005

Chapter 7
CONCLUSIONS
Overall, the Greenville, SC indoor/outdoor position location trials yielded some
promising results for cellular carriers that are concerned about FCC E911 compliance
in a GSM network loaded with indoor users. The only disappointing set of num-
bers was the indoor/outdoor discrimination rate, which dropped to 76% compared
to a high value of 92% witnessed on the campus of Georgia Tech. This discrepancy
is likely due to the more homogeneous building style that made the college campus
much more predictable.
Still, the Greenville trial must represent a worst-case scenario for E911 position
location: a rural network with low base station density. That the 100m and 300m
cumulative location error distributions reach 51% and 79%, respectively, in such an
environment is a testament to the resiliency of the technique. These numbers could be
further improved by honing the location algorithm, incorporating better propagation
modeling, and driving minor roads.
GeorgiaInstituteof nologyTech
PropagationGroup 53

Chapter 8
ACKNOWLEDGEMENT
The authors would like to thank Suncom for their help in accessing the GSM network
in Greenville, SC. Suncom Inc. member Shawn Phillips was especially helpful.
Thanks to Georgia Tech student Yenpao Albert Lu for many hours in the field
helping with the measurement campaign.
The authors would also like to thank Polaris wireless Inc. for their technical
suggestions and advice during this project.
54 March 11, 2005

BIBLIOGRAPHY
[Hei99] G. Heine, GSM Netwroks: Protocols, Terminology, and Implementation, Artech
House Publishers, 1999.
[Meh97] A. Mehrotra, GSM System Engineering, Artech House Publishers, 1997.
[PB00] L. Perez-Breva, C.-Y. Chong, R. M. Dressler, P. R. Rao, P. Siccardo, and D. S. Spain,
“Location and Determination Using RF Fingerprinting,” U.S. Patent No. 6,393,294, 22
Issued to Polaris Wireless Inc., March 2000.
[Rao99] P. R. Rao, “Multiple Location Estimates in a Cellular Communication System,”
U.S.Patent No. 6,449,486 Issued to Polaris Wireless Inc., May 1999.
[Red98] S. M. Redl, M. K. Weber, and M. W. Oliphant, GSM and Personal Communications
Handbook, Artech House Publishers, 1998.
[Zhu04] J. J. Zhu and G. D. Durgin, “Indoor/Outdoor Location of Cellular Handsets Based
on Received Signal Strength,” Tech. Rep., Georgia Institute of Technology, 777 Atlantic
Drive, Atlanta, GA 30332, June 2004.
GeorgiaInstituteof nologyTech
PropagationGroup 55
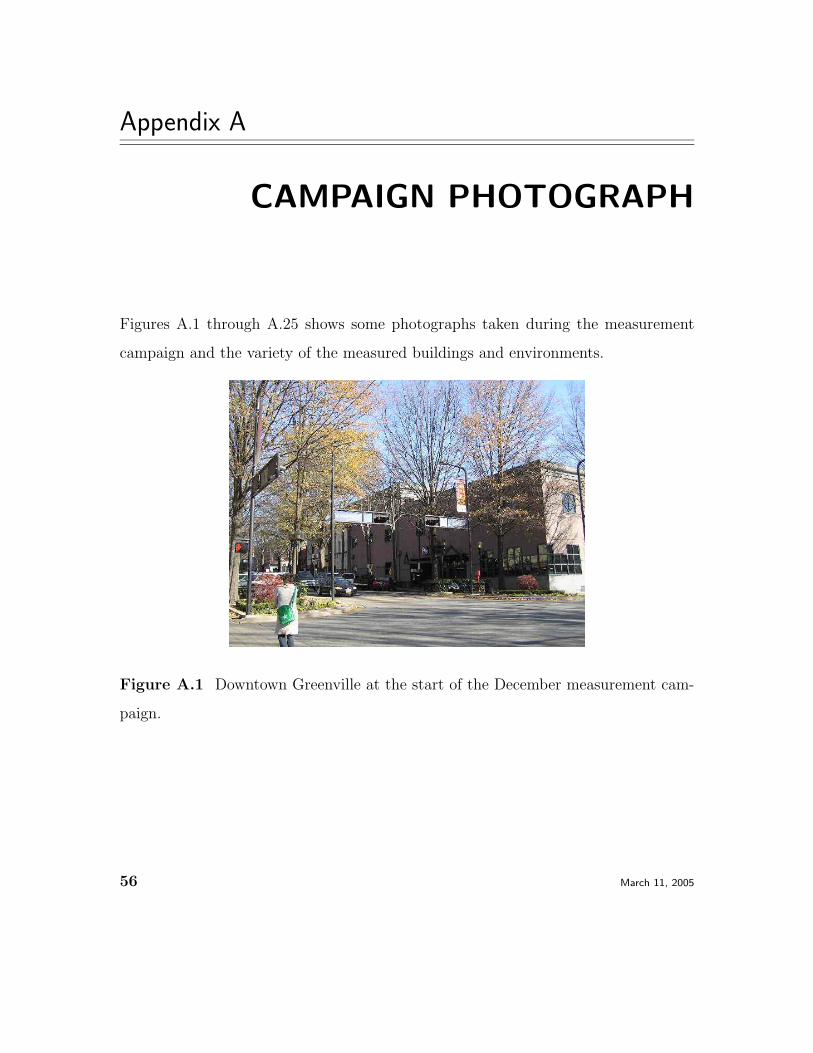
Appendix A
CAMPAIGN PHOTOGRAPH
Figures A.1 through A.25 shows some photographs taken during the measurement
campaign and the variety of the measured buildings and environments.
Figure A.1 Downtown Greenville at the start of the December measurement cam-
paign.
56 March 11, 2005

Indoor Radiolocation in 1920 MHz GSM 57
Figure A.2 Photograph of downtown Greenville shopping arcade.
GeorgiaInstituteof nologyTech
PropagationGroup March 11, 2005

58 Indoor Radiolocation in 1920 MHz GSM Campaign Photograph Appendix A
Figure A.3 Photograph of a small shop in downtown Greenville.
GeorgiaInstituteof nologyTech
PropagationGroup March 11, 2005

Indoor Radiolocation in 1920 MHz GSM 59
Figure A.4 Indoor measurements conducted in a dressing store in downtown
Greenville.
GeorgiaInstituteof nologyTech
PropagationGroup March 11, 2005

60 Indoor Radiolocation in 1920 MHz GSM Campaign Photograph Appendix A
Figure A.5 Researcher entering a UPS store in downtown Greenville.
Figure A.6 Indoor measurement inside the UPS store in downtown Greenville made
by Jian J. Zhu.
GeorgiaInstituteof nologyTech
PropagationGroup March 11, 2005

Indoor Radiolocation in 1920 MHz GSM 61
Figure A.7 Researchers Jian J. Zhu and Prof. Gregory D. Durgin entering a gift
shop in downtown Greenville.
Figure A.8 Shop in downtown Greenville.
GeorgiaInstituteof nologyTech
PropagationGroup March 11, 2005

62 Indoor Radiolocation in 1920 MHz GSM Campaign Photograph Appendix A
Figure A.9 Indoor measurement inside the gift shop in downtown Greenville.
Figure A.10 Indoor measurement inside a restaurant in Greenville.
GeorgiaInstituteof nologyTech
PropagationGroup March 11, 2005

Indoor Radiolocation in 1920 MHz GSM 63
Figure A.11 A restaurant build of brick in downtown Greenville.
Figure A.12 Indoor measurement inside a restaurant in Greenville.
GeorgiaInstituteof nologyTech
PropagationGroup March 11, 2005

64 Indoor Radiolocation in 1920 MHz GSM Campaign Photograph Appendix A
Figure A.13 “Sticky Fingers” restaurant in downtown Greenville.
GeorgiaInstituteof nologyTech
PropagationGroup March 11, 2005

Indoor Radiolocation in 1920 MHz GSM 65
Figure A.14 Yenpao A. Lu and Jian J. Zhu take indoor measurements in downtown
Greenville.
Figure A.15 Indoor measurement in a small office room in downtown Greenville.
GeorgiaInstituteof nologyTech
PropagationGroup March 11, 2005
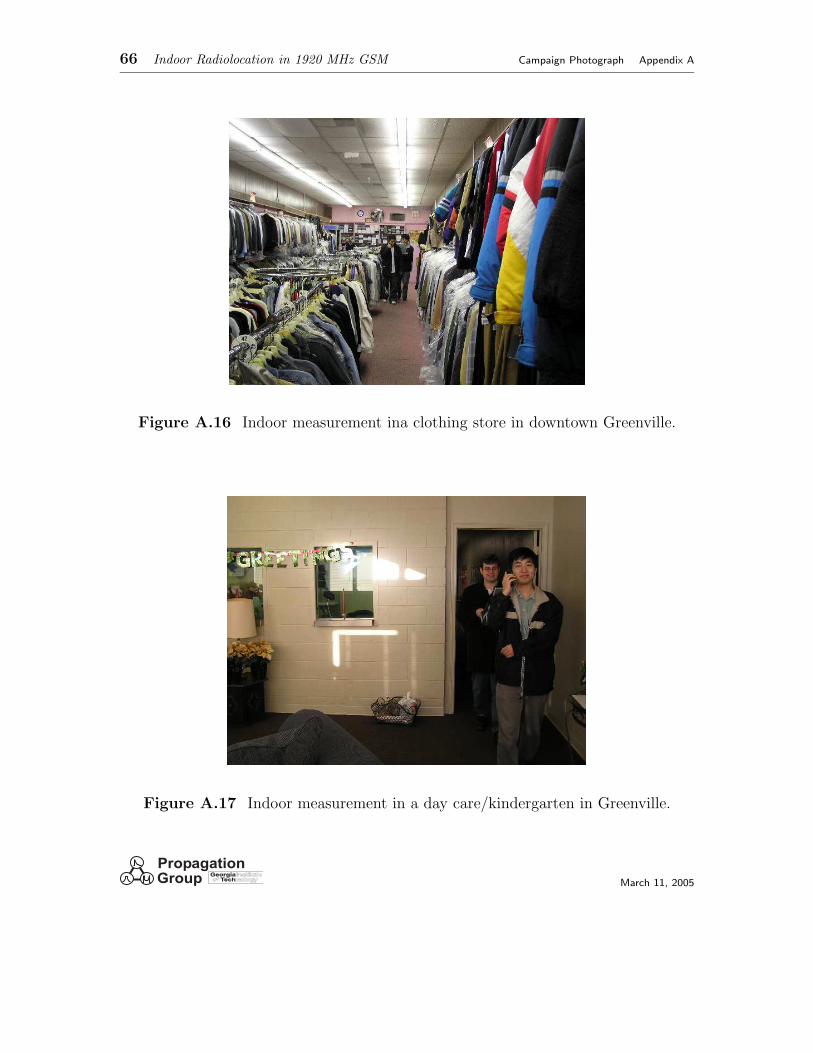
66 Indoor Radiolocation in 1920 MHz GSM Campaign Photograph Appendix A
Figure A.16 Indoor measurement ina clothing store in downtown Greenville.
Figure A.17 Indoor measurement in a day care/kindergarten in Greenville.
GeorgiaInstituteof nologyTech
PropagationGroup March 11, 2005

Indoor Radiolocation in 1920 MHz GSM 67
Figure A.18 “Family Dollar”grocery store in Greenville.
GeorgiaInstituteof nologyTech
PropagationGroup March 11, 2005

68 Indoor Radiolocation in 1920 MHz GSM Campaign Photograph Appendix A
Figure A.19 “Hardee’s” measured in Greenville.
Figure A.20 McDonalds measured in Greenville.
GeorgiaInstituteof nologyTech
PropagationGroup March 11, 2005

Indoor Radiolocation in 1920 MHz GSM 69
Figure A.21 A laundromat in Greenville.
Figure A.22 Inside the laundromat in Greenville.
GeorgiaInstituteof nologyTech
PropagationGroup March 11, 2005

70 Indoor Radiolocation in 1920 MHz GSM Campaign Photograph Appendix A
Figure A.23 Student researcher Jian J. Zhu is calibrating GPS on rooftop of a
parking deck in downtown Greenville, SC.
GeorgiaInstituteof nologyTech
PropagationGroup March 11, 2005

Indoor Radiolocation in 1920 MHz GSM 71
Figure A.24 The 8-story Greenville Summit Building close to downtown Greenville.
GeorgiaInstituteof nologyTech
PropagationGroup March 11, 2005

72 Indoor Radiolocation in 1920 MHz GSM Campaign Photograph Appendix A
Figure A.25 Student researcher Jian Zhu and Prof. Gregory Durgin measure RSS
for an office high-rise building in downtown Greenville, SC.
GeorgiaInstituteof nologyTech
PropagationGroup March 11, 2005

Appendix B
MAPS OF DCCH FREQUENCY
PLAN
Figures B.1 through B.26 record the longitudes and latitudes of Greenville, SC base
stations, grouped by DCCH. Maps for each DCCH are shown both before and after
the major frequency plan change.
GeorgiaInstituteof nologyTech
PropagationGroup 73

74 Indoor Radiolocation in 1920 MHz GSM Maps of DCCH Frequency Plan Appendix B
−82.6 −82.55 −82.5 −82.45 −82.4 −82.35 −82.3 −82.25 −82.2 −82.1534.6
34.65
34.7
34.75
34.8
34.85
34.9
34.95
35
Longitude
Latit
ude
Figure B.1 Longitude/Latitude map of base stations (* and O) in Greenville, SC
using DCCH 788.
−82.6 −82.55 −82.5 −82.45 −82.4 −82.35 −82.3 −82.25 −82.2 −82.1534.6
34.65
34.7
34.75
34.8
34.85
34.9
34.95
35
Longitude
Latit
ude
Figure B.2 Longitude/Latitude map of base stations (* and O) in Greenville, SC
using DCCH 514
GeorgiaInstituteof nologyTech
PropagationGroup March 11, 2005

Indoor Radiolocation in 1920 MHz GSM 75
−82.6 −82.55 −82.5 −82.45 −82.4 −82.35 −82.3 −82.25 −82.2 −82.1534.6
34.65
34.7
34.75
34.8
34.85
34.9
34.95
35
Longitude
Latit
ude
Figure B.3 Longitude/Latitude map of base stations (* and O) in Greenville, SC
using DCCH 789.
−82.6 −82.55 −82.5 −82.45 −82.4 −82.35 −82.3 −82.25 −82.2 −82.1534.6
34.65
34.7
34.75
34.8
34.85
34.9
34.95
35
Longitude
Latit
ude
Figure B.4 Longitude/Latitude map of base stations (* and O) in Greenville, SC
using DCCH 515.
GeorgiaInstituteof nologyTech
PropagationGroup March 11, 2005

76 Indoor Radiolocation in 1920 MHz GSM Maps of DCCH Frequency Plan Appendix B
−82.6 −82.55 −82.5 −82.45 −82.4 −82.35 −82.3 −82.25 −82.2 −82.1534.6
34.65
34.7
34.75
34.8
34.85
34.9
34.95
35
Longitude
Latit
ude
Figure B.5 Longitude/Latitude map of base stations (* and O) in Greenville, SC
using DCCH 790.
−82.6 −82.55 −82.5 −82.45 −82.4 −82.35 −82.3 −82.25 −82.2 −82.1534.6
34.65
34.7
34.75
34.8
34.85
34.9
34.95
35
Longitude
Latit
ude
Figure B.6 Longitude/Latitude map of base stations (* and O) in Greenville, SC
using DCCH 516.
GeorgiaInstituteof nologyTech
PropagationGroup March 11, 2005

Indoor Radiolocation in 1920 MHz GSM 77
−82.6 −82.55 −82.5 −82.45 −82.4 −82.35 −82.3 −82.25 −82.2 −82.1534.6
34.65
34.7
34.75
34.8
34.85
34.9
34.95
35
Longitude
Latit
ude
Figure B.7 Longitude/Latitude map of base stations (* and O) in Greenville, SC
using DCCH 791.
−82.6 −82.55 −82.5 −82.45 −82.4 −82.35 −82.3 −82.25 −82.2 −82.1534.6
34.65
34.7
34.75
34.8
34.85
34.9
34.95
35
Longitude
Latit
ude
Figure B.8 Longitude/Latitude map of base stations (* and O) in Greenville, SC
using DCCH 517
GeorgiaInstituteof nologyTech
PropagationGroup March 11, 2005

78 Indoor Radiolocation in 1920 MHz GSM Maps of DCCH Frequency Plan Appendix B
−82.6 −82.55 −82.5 −82.45 −82.4 −82.35 −82.3 −82.25 −82.2 −82.1534.6
34.65
34.7
34.75
34.8
34.85
34.9
34.95
35
Longitude
Latit
ude
Figure B.9 Longitude/Latitude map of base stations (* and O) in Greenville, SC
using DCCH 792
−82.6 −82.55 −82.5 −82.45 −82.4 −82.35 −82.3 −82.25 −82.2 −82.1534.6
34.65
34.7
34.75
34.8
34.85
34.9
34.95
35
Longitude
Latit
ude
Figure B.10 Longitude/Latitude map of base stations (* and O) in Greenville, SC
using DCCH 518
GeorgiaInstituteof nologyTech
PropagationGroup March 11, 2005

Indoor Radiolocation in 1920 MHz GSM 79
−82.6 −82.55 −82.5 −82.45 −82.4 −82.35 −82.3 −82.25 −82.2 −82.1534.6
34.65
34.7
34.75
34.8
34.85
34.9
34.95
35
Longitude
Latit
ude
Figure B.11 Longitude/Latitude map of base stations (* and O) in Greenville, SC
using DCCH 793
−82.6 −82.55 −82.5 −82.45 −82.4 −82.35 −82.3 −82.25 −82.2 −82.1534.6
34.65
34.7
34.75
34.8
34.85
34.9
34.95
35
Longitude
Latit
ude
Figure B.12 Longitude/Latitude map of base stations (* and O) in Greenville, SC
using DCCH 519.
GeorgiaInstituteof nologyTech
PropagationGroup March 11, 2005

80 Indoor Radiolocation in 1920 MHz GSM Maps of DCCH Frequency Plan Appendix B
−82.6 −82.55 −82.5 −82.45 −82.4 −82.35 −82.3 −82.25 −82.2 −82.1534.6
34.65
34.7
34.75
34.8
34.85
34.9
34.95
35
Longitude
Latit
ude
Figure B.13 Longitude/Latitude map of base stations (* and O) in Greenville, SC
using DCCH 794.
−82.6 −82.55 −82.5 −82.45 −82.4 −82.35 −82.3 −82.25 −82.2 −82.1534.6
34.65
34.7
34.75
34.8
34.85
34.9
34.95
35
Longitude
Latit
ude
Figure B.14 Longitude/Latitude map of base stations (* and O) in Greenville, SC
using DCCH 520.
GeorgiaInstituteof nologyTech
PropagationGroup March 11, 2005

Indoor Radiolocation in 1920 MHz GSM 81
−82.6 −82.55 −82.5 −82.45 −82.4 −82.35 −82.3 −82.25 −82.2 −82.1534.6
34.65
34.7
34.75
34.8
34.85
34.9
34.95
35
Longitude
Latit
ude
Figure B.15 Longitude/Latitude map of base stations (* and O) in Greenville, SC
using DCCH 795.
−82.6 −82.55 −82.5 −82.45 −82.4 −82.35 −82.3 −82.25 −82.2 −82.1534.6
34.65
34.7
34.75
34.8
34.85
34.9
34.95
35
Longitude
Latit
ude
Figure B.16 Longitude/Latitude map of base stations (* and O) in Greenville, SC
using DCCH 521.
GeorgiaInstituteof nologyTech
PropagationGroup March 11, 2005

82 Indoor Radiolocation in 1920 MHz GSM Maps of DCCH Frequency Plan Appendix B
−82.6 −82.55 −82.5 −82.45 −82.4 −82.35 −82.3 −82.25 −82.2 −82.1534.6
34.65
34.7
34.75
34.8
34.85
34.9
34.95
35
Longitude
Latit
ude
Figure B.17 Longitude/Latitude map of base stations (* and O) in Greenville, SC
using DCCH 796.
−82.6 −82.55 −82.5 −82.45 −82.4 −82.35 −82.3 −82.25 −82.2 −82.1534.6
34.65
34.7
34.75
34.8
34.85
34.9
34.95
35
Longitude
Latit
ude
Figure B.18 Longitude/Latitude map of base stations (* and O) in Greenville, SC
using DCCH 522.
GeorgiaInstituteof nologyTech
PropagationGroup March 11, 2005

Indoor Radiolocation in 1920 MHz GSM 83
−82.6 −82.55 −82.5 −82.45 −82.4 −82.35 −82.3 −82.25 −82.2 −82.1534.6
34.65
34.7
34.75
34.8
34.85
34.9
34.95
35
Longitude
Latit
ude
Figure B.19 Longitude/Latitude map of base stations (* and O) in Greenville, SC
using DCCH 797.
−82.6 −82.55 −82.5 −82.45 −82.4 −82.35 −82.3 −82.25 −82.2 −82.1534.6
34.65
34.7
34.75
34.8
34.85
34.9
34.95
35
Longitude
Latit
ude
Figure B.20 Longitude/Latitude map of base stations (* and O) in Greenville, SC
using DCCH 523.
GeorgiaInstituteof nologyTech
PropagationGroup March 11, 2005

84 Indoor Radiolocation in 1920 MHz GSM Maps of DCCH Frequency Plan Appendix B
−82.6 −82.55 −82.5 −82.45 −82.4 −82.35 −82.3 −82.25 −82.2 −82.1534.6
34.65
34.7
34.75
34.8
34.85
34.9
34.95
35
Longitude
Latit
ude
Figure B.21 Longitude/Latitude map of base stations (* and O) in Greenville, SC
using DCCH 798.
−82.6 −82.55 −82.5 −82.45 −82.4 −82.35 −82.3 −82.25 −82.2 −82.1534.6
34.65
34.7
34.75
34.8
34.85
34.9
34.95
35
Longitude
Latit
ude
Figure B.22 Longitude/Latitude map of base stations (* and O) in Greenville, SC
using DCCH 524.
GeorgiaInstituteof nologyTech
PropagationGroup March 11, 2005

Indoor Radiolocation in 1920 MHz GSM 85
−82.6 −82.55 −82.5 −82.45 −82.4 −82.35 −82.3 −82.25 −82.2 −82.1534.6
34.65
34.7
34.75
34.8
34.85
34.9
34.95
35
Longitude
Latit
ude
Figure B.23 Longitude/Latitude map of base stations (* and O) in Greenville, SC
using DCCH 799.
−82.6 −82.55 −82.5 −82.45 −82.4 −82.35 −82.3 −82.25 −82.2 −82.1534.6
34.65
34.7
34.75
34.8
34.85
34.9
34.95
35
Longitude
Latit
ude
Figure B.24 Longitude/Latitude map of base stations (* and O) in Greenville, SC
using DCCH 525.
GeorgiaInstituteof nologyTech
PropagationGroup March 11, 2005

86 Indoor Radiolocation in 1920 MHz GSM Maps of DCCH Frequency Plan Appendix B
−82.6 −82.55 −82.5 −82.45 −82.4 −82.35 −82.3 −82.25 −82.2 −82.1534.6
34.65
34.7
34.75
34.8
34.85
34.9
34.95
35
Longitude
Latit
ude
Figure B.25 Longitude/Latitude map of base stations (* and O) in Greenville, SC
using DCCH 800.
−82.6 −82.55 −82.5 −82.45 −82.4 −82.35 −82.3 −82.25 −82.2 −82.1534.6
34.65
34.7
34.75
34.8
34.85
34.9
34.95
35
Longitude
Latit
ude
Figure B.26 Longitude/Latitude map of base stations (* and O) in Greenville, SC
using DCCH 526.
GeorgiaInstituteof nologyTech
PropagationGroup March 11, 2005