The Project Team Project Team Battelle is the world’s largest nonprofit independent research and...
149
Transcript of The Project Team Project Team Battelle is the world’s largest nonprofit independent research and...


June 2012
Battelle does not engage in research for advertising, sales promotion, or endorsement of our clients’ interests including raising investment capital or recommending investments decisions, or other publicity purposes, or for any use in litigation.
Battelle endeavors at all times to produce work of the highest quality, consistent with our contract commitments. However, because of the research and/or experimental nature of this work the client undertakes the sole responsibility for the consequence of any use or misuse of, or inability to use, any information, apparatus, process or result obtained from Battelle, and Battelle, its employees, officers, or Trustees have no legal liability for the accuracy, adequacy, or efficacy thereof.

The Project Team
Battelle is the world’s largest nonprofit independent research and development organization, providing innovative solutions to the world’s most pressing needs through its four global businesses: Laboratory Management, National Security, Energy Technology, and Health and Life Sciences. In 1991, Battelle
created the Technology Partnership Practice (TPP). We focus Battelle’s broad experience to better serve economic development organizations, universities, and nonprofit technology organizations across the U.S.
For further information, please contact Mitch Horowitz at [email protected].
BIO—Biotechnology Industry Organization—represents more than 1,100 biotechnology companies, academic institutions, state biotechnology centers and related organizations across the United States and in more than 30 other nations. BIO members are involved in the research and development of
innovative healthcare, agricultural, industrial and environmental biotechnology products. BIO also produces the BIO International Convention, the world’s largest gathering of the biotechnology industry,
along with industry-leading investor and partnering meetings held around the world. BIO produces BIOtechNOW, a multiblog platform and monthly newsletter that aims to create an online biotech
community where the the industry can connect to discuss the latest news.
PMP Public Affairs Consulting, Inc. is an independent consulting firm serving the public and constituent relations needs of bioscience-related companies and associations.


CONTENTS
EXECUTIVE SUMMARY ................................................................................................................................. 1
MEASURING BIOSCIENCE INDUSTRY DEVELOPMENT: KEEPING PACE WITH AN EVOLVING INDUSTRY ....... 3
KEY FINDINGS ............................................................................................................................................... 5
CLOSER LOOK AT BIOSCIENCE INDUSTRY SUBSECTOR TRENDS .................................................................... 8
STATE‐BY‐STATE BIOSCIENCE INDUSTRY TRENDS ...................................................................................... 10
LOOKING TO THE FUTURE .......................................................................................................................... 14
U.S. BIOSCIENCE INDUSTRY: CURRENT STATUS AND RECENT TRENDS ......................................................... 16
INTRODUCTION .......................................................................................................................................... 16
THE SIZE, COMPOSITION, GROWTH, AND IMPACT OF THE U.S. BIOSCIENCE SECTOR ................................ 19
AGRICULTURAL FEEDSTOCK & CHEMICALS ................................................................................................ 25
DRUGS & PHARMACEUTICALS ................................................................................................................... 27
MEDICAL DEVICES & EQUIPMENT .............................................................................................................. 29
RESEARCH, TESTING, & MEDICAL LABORATORIES ..................................................................................... 31
BIOSCIENCE‐RELATED DISTRIBUTION ........................................................................................................ 33
INDUSTRY SUMMARY AND CONCLUSION .................................................................................................. 34
APPENDIX: DATA & METHODOLOGY ........................................................................................................... 35
INDUSTRY EMPLOYMENT, ESTABLISHMENTS, AND WAGES ...................................................................... 35
BIOSCIENCE INDUSTRY STATE PROFILES ...................................................................................................... 39


BATTELLE/BIO STATE BIOSCIENCE INDUSTRY DEVELOPMENT 2012
Page
1
Executive Summary
At a time when the global economy struggles to recover from a severe recession and uncertainty remains regarding future economic growth, bioscience industry development is generating significant attention both globally and at home. A number of recent studies have detailed the mounting global competition for bioscience industry development as both developed and developing nations seek to grow and advance in this high-wage, high-growth industry.1 This April, the U.S. government released the National Bioeconomy Blueprint noting that bioscience industries are “a large and rapidly growing segment of the world economy that provides substantial public benefit.”2
Indeed, the bioscience industry stands out in job growth. While not immune from the global recession, the bioscience industry has demonstrated that it is a generally strong and steady job generator, growing jobs over the past decade at a pace well above the national average. It also has fared much better than the overall economy through the recent U.S. recession and into the first year of the recovery. When compared with other major knowledge economy industries, which are critical for advancing high quality jobs, the bioscience industry has led in job creation during the 2001 to 2010 period (see key findings below).
A primary reason for the resiliency of the bioscience industry is the diverse set of markets it serves. These markets span: biomedical drugs; diagnostics and devices; agricultural products from animal health to seeds and crop protection; and bio-based industrial products such as enzymes for industry chemical processes and bio-remediation, bio-fuels, and bio-plastics. In addition, the bioscience industry involves not only high value, export-oriented manufacturing activities, but encompasses specialty commercial research, development and testing industries to advance bioscience product development as well as specialty distribution to bring bioscience products to market.
Another factor spurring the attractiveness of bioscience industry development is how closely its growth is shaped by the fast pace of advances in biological sciences, making it truly one of the most innovative industries today. The close connections between basic research discoveries, often advanced in academic and federal laboratory settings, and industry product development within the biosciences are well-documented—setting bioscience industry development apart from many other leading technology areas.3
Significant levels of research and development in bioscience industries continuously drive innovation and new product development. A recent report by the U.S. Department of Commerce, published jointly through its Patent and Trademark Office and Economics and Statistics Administration, found that
1 See ITIF and United for Medical Research, Leadership in Decline: Assessing U.S. International Competitiveness in Biomedical Research, May 2012 and Battelle, The Biopharmaceutical Research and Development Enterprise: Growth Platform for Economies Around the World, May 2012. 2 Obama Administration, National Bioeconomy Blueprint, April 2012, page 1. 3 An extensive study in the late 1990s found that 31 percent of new drugs and medical products would not have been developed (or would have been substantially delayed) in the absence of academic research, more than twice the rate found for all technology industries (see Edwin Mansfield, “Academic Research and Industrial Innovation,” Research Policy, 1998, 26:773-776; A 2003 National Academy of Engineering report entitled The Impact of Academic Research on Industrial Performance found that “one of the defining characteristics of the medical devices and equipment sector is a strong dependency between universities and industry…Academic research has had a substantial impact on the industry’s performance…including a high degree of involvement in product development, product evaluation and introduction, and product modification.” Advances in basic biosciences research are having similar transformative impacts on agriculture in improving and protecting plants as well as in industrial biotechnology applications that are leading to bio-based fuels, chemicals and products.

● U.S. BIOSCIENCE SECTOR
Page
2
bioscience industries are among those with the highest levels of patent intensity. The report also cites the results from an earlier study by Carnegie-Mellon that found the bioscience industry to be among the leading industries in which patent protection led to capturing competitive advantages in the market place.4
The message is clear—a strong bioscience industry base offers the United States of America, as well as each of the 50 states, Puerto Rico and the District of Columbia, a high value economic driver. It stands out in its creation of high quality jobs, the breadth of markets it serves, and its research and development intensity. An excellent example of how this all comes together is what has been accomplished with the human genome project in the U.S. This $10.4 billion investment in basic sciences during the 1993 to 2010 period drove $796 billion in economic impact, and created 3.8 million job-years of employment over this period.5 Just as important, it launched the genomic revolution whose technologies, tools and basic biological knowledge have found applications across a wide range of economic activities beyond human healthcare, including agriculture and veterinary medicine as well as environmental remediation to biofuels and other industrial applications (see text box below for more details).
4 U.S. Department of Commerce, Intellectual Property and the U.S. Economy: Industries in Focus, March 2012 5 A job year is the concept where, for example, 10 job years reflects one job created that lasts for 10 years or conversely where 10 jobs are created each lasting for one year.
Human Genome Project: A Case Study of How Basic Research and Industry Development Come Together in the Biosciences
One tangible example of the close linkages between basic research discoveries and bioscience industry development is the results from the Human Genome Project. The U.S. government invested $3.8 billion in human genome sequencing programs during the 1988 to 2003 period, and has continued to invest in further genomics research with an additional $6.6 billion from 2004 to 2010. The decoding of the human genome was both a technological as well as scientific achievement. An industry has grown up to supply the scientific research community with the tools needed to conduct genomics research and development and associated product development, such as gene sequencers, sample preparation technologies, sample amplification technology, and a range of other analytical tools and technologies. Moreover, a majority of bioscience companies are now using genomics-based tools to advance new product development.
In a recent study, a database of individual companies engaged in genomics-related activities was developed ranging from new instruments and equipment, R&D, and testing services to bioinformatics and new product development. Altogether, this industry employed more than 44,000 in 2010 and over the 1993 to 2010 period generated 591,138 job years from those it employed.
Considering the full economic multipliers from the direct scientific research and industry-generated growth from the U.S. government’s funding of the Human Genome Project, during the 1993 to 2010 period, finds that it has generated a total of 3.8 million job-years of employment or an additional 4.38 job years for every one direct job year. The overall economic activity was so substantial that the U.S. government reaped total tax revenues of $48.9 billion compared to the just slightly more than $10 billion it invested in human genome research from 1993 to 2010.
Economic Impact of the Human Genome Project, Prepared by Battelle Technology Partnership Practice with Support from the Life Technologies Foundation, May 2011

BATTELLE/BIO STATE BIOSCIENCE INDUSTRY DEVELOPMENT 2012
Page
3
Measuring Bioscience Industry Development: Keeping Pace with an Evolving Industry
Given the importance of the biosciences as an economic driver, BIO has worked with the Battelle Technology Partnership Practice in tracking the development of the U.S. bioscience industry on a state by state basis every two years since 2004. Examining both the national and unfolding state-by-state footprint of the bioscience industry offers an important perspective, particularly given that the national economy is built from the bottom up and that economic development is a shared national, state, and local responsibility.
Measuring the bioscience industry is not straight-forward. Instead of falling neatly into a single high level industry classification, the biosciences are best understood as a grouping of diverse industries with a common link—the application of biological scientific knowledge. Defining biosciences industries requires analyzing standard industrial classifications at the most detailed level to identify those involved in bioscience-related activities. These bioscience industries fall into a broad array of higher level industries, such as chemical and food manufacturing, professional, scientific and technical services, and increasingly distribution services.
The changing nature of biological research and its applications further complicates this task as the bioscience industry continues to evolve in the types of companies engaged and how they are represented within the standard industry classifications. It is important then to periodically re-examine how bioscience companies classify themselves within detailed industries and to consider how the evolving demands of new bioscience products and innovations are changing the range of companies involved in these activities.
For the first four reports tracking bioscience industry development, Battelle and BIO identified 27 detailed industries within the North American Industry Classification System (NAICs) at the most detailed six-digit level that aggregated into four major subsectors of the bioscience industry:
Agricultural Feedstock and Chemicals, involving industries, for example, that utilize advances in biochemistry and biotechnology for producing products involved in crop protection, advanced seed, agricultural processing, bio-fuels, biodegradable materials from plant-based feedstock, sustainable industrial oils, lubricants and enzymes and bio-based catalysts for industrial processes.
Drugs and Pharmaceuticals, involving industries that produce vaccines, biopharmaceuticals, and tissue and cell culture media.
Medical Devices and Equipment, involving industries that produce a variety of biomedical products such as surgical instruments, orthopedic implants, bioimaging equipment, dental instruments, and patient care products (such as walkers, wheelchairs and beds).
Research, Testing, and Medical Laboratories, involving emerging companies working to develop and commercialize new drug discovery/delivery systems and gene and cell therapies as well as more service-oriented firms involved in pre-clinical drug development, clinical trials, and research/laboratory support services. While primarily focused on human health, these companies also include those that are focused on research and testing for agriculture and veterinary uses.

● U.S. BIOSCIENCE SECTOR
Page
4
For this fifth biennial report, Battelle and BIO have worked together to re-examine which detailed industries are best understood to comprise the bioscience industry. This examination has led to two important refinements from previous reports:
The first refinement is to drop a number of detailed industries that have become more closely connected with the delivery of clinical services to patients than the development of new bioscience products. This includes three specific industries: ophthalmic goods manufacturing, which is involved in filling prescriptions for eyeglasses and contact lenses; dental laboratories, which fill orders for customized dentures, crowns, implants and orthodontic appliances; and diagnostic imaging centers that offer access to high end MRI, CAT scan, PET and ultrasound imaging services. Upon examination of the range of companies, these three industries are found to be less involved in creating products and services using biological knowledge and more engaged in direct patient services that use existing bioscience products and technologies.
The second refinement involves the inclusion of a new fifth subsector for the bioscience industry in light of the changing nature of bioscience technology and applications. This new subsector is categorized as bioscience-related distribution. Increasingly bioscience-related distribution involves specialized approaches such as cold storage and highly regulated product monitoring, and new technologies for distribution such as automated pharmaceutical distribution systems. These include three detailed distribution industries: one associated with medical equipment and device distribution; another with drug distribution; and a third with agricultural-related chemicals and seed distribution. Each of these bioscience-related industries are becoming integral in the primary production of bioscience goods in an age of advanced logistics and the increasing specialized nature of biosciences product development.
This revised definition of the bioscience industry is depicted in Figure 1.
Figure 1. Revised Definition of the Bioscience Industry
The data and methodology appendix sets out a comparison table of the detailed industries under each bioscience industry subsector noting the changes made.
Going from industry classifications to measuring actual job performance requires having a comprehensive and longitudinal data source. Battelle and BIO continue to utilize the Quarterly Census of Employment and Wages (QCEW) managed by the U.S. Bureau of Labor Statistics. The QCEW is based on actual payroll data
AGRICULTURAL FEEDSTOCK & CHEMICALS
•Processing of Agricultural Feedstock for Bio‐based Products•Organic & Agricultural Chemicals including Biofuels
DRUGS & PHARMECEUTICALS
•Pharmaceutical Preparation & Mfg
•Diagnostic Substances•Biopharmaceuticals•Vaccines
MEDICAL DEVICES & EQUIPMENT
•Biomedical Instruments•Electromedical Equipment & Devices•Healthcare Products & Supplies•Lab Instrumentation
RESEARCH, TESTING & MEDICAL LABS
•Biotech & Other Life Sciences R&D
•Testing Labs•Medical Labs
BIOSCIENCE‐RELATED DISTRIBUTION
Distribution of:
•Agricultural Chemicals & Seeds
•Biomedical Equipment & Supplies
•Drugs & Pharmaceuticals
Original Core Definition New Addition

BATTELLE/BIO STATE BIOSCIENCE INDUSTRY DEVELOPMENT 2012
Page
5
required of employers that pay into the unemployment insurance system. This offers a built-in mechanism for accuracy and nearly comprehensive coverage, even at the county and state levels.
The QCEW tracks each place of business associated with a company, which it refers to as a business establishment. This means separately located branch plants and field offices of a company are typically measured as their own business unit. This has significant advantages in ensuring that employment is measured where workers actually work rather than where a company’s headquarters is located. Another advantage of measuring at the business establishment level is that many companies span multiple industries, particularly at a detailed industry level. The different industry activities can be noted by having each business establishment separately coded based on their primary industry activity and not just the main activity of the overall company. Therefore, the establishment numbers in this report are not interchangeable with the number of companies in each state. In most instances, the number of establishments greatly exceeds the actual number of corporate entities as many companies have numerous establishments within a given state.
Key Findings
This fifth biennial report on the bioscience industry tracks employment trends through 2010, the most recent year available. This updated look at bioscience industry trends accounts for the full impact of the recent deep recession and the first year of the economic recovery.
In light of the refinements made in measuring the evolving composition of the bioscience industry, Battelle and BIO provide an analysis with the refined industry definitions going back to 2001. This offers an updated view of the resiliency of the bioscience industry over different phases of the recent business cycle, as well as allowing for a long term view of bioscience industry growth, even after a recession.
NATIONAL BIOSCIENCE INDUSTRY TRENDS
During the 2001 to 2010 period, the U.S. bioscience industry gained jobs, despite job losses in overall U.S. total private sector industry employment and among other leading knowledge-based industries.
The period from 2001 to 2010 represents a time of significant economic growth from 2001 through 2007, a severe economic recession from the end of 2007 through 2009, and the first full year of a recovery from 2009 to 2010. It offers a unique perspective on the resiliency of an industry over a long-term period with the inevitable ups and downs of a business cycle.
The bioscience industry has demonstrated its growth and staying power during the longer term period, encompassing two business cycles. During the 2001 to 2010 period, the bioscience industry grew by 6.4 percent, adding more than 96,000 jobs. By comparison, total employment for all private sector industries in the U.S. fell by 2.9 percent, losing more than 3 million jobs (see Figure 2).
By comparison, other leading knowledge-based industries, including information technology services, aerospace, computer equipment and finance and insurance, all recorded net job losses over this same period.
Figure 2 depicts the difference in employment change during the 2001 to 2010 period for the bioscience industry, total private sector industries, and other leading knowledge-based industries.

● U.S. BIOSCIENCE SECTOR
Page
6
Figure 2. Employment Trends in the Biosciences and Other Leading Knowledge-based Industries, 2001–10
Source: Battelle analysis of Bureau of Labor Statistics, QCEW; enhanced file from IMPLAN.
Still, the bioscience industry was not immune from the recession and was still finding its footing in the first year of the recovery.
From 2007 to 2010, which represents the peak year before the onset of the recession through the first year of the recovery, bioscience industry employment fell by 1.4 percent or nearly 23,000 jobs. This decline, while disappointing, was quite muted. Total private sector employment, by comparison, fell 6.9 percent from 2007 to 2010, and other leading knowledge-based industries declined further than the biosciences as well (see Figure 3).
6.4%
-2.8% -2.9%-6.1%
-9.7%
-47.3%-50%
-40%
-30%
-20%
-10%
0%
10%
Biosciences Finance & Insurance
U.S. Total Private Sector
Aerospace Products &
Parts
IT Services & Telecomm
Computer & Peripheral Equipment
Em
plo
ym
en
t P
erc
en
t C
ha
ng
e,
20
01
-10

BATTELLE/BIO STATE BIOSCIENCE INDUSTRY DEVELOPMENT 2012
Page
7
Figure 3. Employment Trends in the Biosciences and Other Leading Knowledge-based Industries, 2007–10
Source: Battelle analysis of Bureau of Labor Statistics, QCEW; enhanced file from IMPLAN.
What are particularly illuminating are the recent annual trends for the bioscience industry. As reported in the 2010 Battelle/BIO state-by-state study, the bioscience industry completed seven consecutive years of employment growth through the first year of the recession in 2008, though jobs increased by a mere 0.9 percent in 2008. In the second year of the recession in 2009, bioscience industry employment fell by 2 percent, well below the 5.5 percent decline recorded in national total private sector employment for 2009. In the first year of the recovery in 2010, the bioscience industry held generally steady, with a mere 0.3 percent job decline. This reflects the sluggish labor market conditions and reluctance to hire during the first year of the nascent recovery (see Figure 4).
-1.4%-2.4% -2.5%
-6.9%
-8.4%
-18.1%-20%
-18%
-16%
-14%
-12%
-10%
-8%
-6%
-4%
-2%
0%
Biosciences IT Services & Telecomm
Aerospace Products & Parts
U.S. Total Private Sector
Finance & Insurance
Computer & Peripheral Equipment
Em
plo
ym
en
t P
erc
en
t C
ha
ng
e,
20
07
-10

● U.S. BIOSCIENCE SECTOR
Page
8
Figure 4. U.S. Bioscience and Total Private Sector Employment, 2001–10, Indexed (2001=100)
Jobs in the bioscience industry remain among our nation’s highest paying, with growth in average wages exceeding the national private industry sector.
Robust demand for today’s high skilled bioscience workforce yields a significant wage premium and one that continues to widen with strong wage growth in recent years. Average wages paid to bioscience industry workers reached $82,697 in 2010, more than $36,000 or 79 percent greater than the average paid in the overall national private sector. Bioscience wage growth well outpaces that for the private sector, increasing by 13.1 percent in real (inflation-adjusted) terms since 2001 compared with just 4.4 percent pay raise among all industries.
CLOSER LOOK AT BIOSCIENCE INDUSTRY SUBSECTOR TRENDS
Within the bioscience industry, the research, testing, and medical laboratories subsector has grown consistently and significantly over the decade.
The job gains for the research, testing, and medical laboratories subsector through the 2001 to 2010 period reached a hefty 23.8 percent, adding nearly 87,000 jobs. More impressively, this subsector grew in employment every year from 2001 to 2010, even through the recession years of 2008 and 2009. The gains in this subsector demonstrate the importance of commercial research and development for the biosciences. It also reflects the outsourcing of many research and testing services previously done in-house by major biopharmaceutical companies, as well as the rise of molecular diagnostic testing as a key component of the industry.
90
92
94
96
98
100
102
104
106
108
110
2001 2002 2003 2004 2005 2006 2007 2008 2009 2010
Em
plo
yme
nt
Ind
ex
(2
00
1 =
10
0)
U.S. Bioscience Industry
U.S. Total Private Sector

BATTELLE/BIO STATE BIOSCIENCE INDUSTRY DEVELOPMENT 2012
Page
9
The bioscience-related distribution subsector also fared well overall during the 2001 to 2010 period, but has faced job losses in recent years with the onset of the recession.
Bioscience-related distribution firms increased employment by a solid 6 percent over the decade, which translated into nearly 25,000 net new jobs. These gains were generated in the 2001 to 2007 expansion, when the subsector added more than 44,000 jobs, and have slowly eroded through the recession and first year of the recovery. Altogether, the bioscience-related distribution subsector has declined by 4.2 percent from 2007 to 2010, a loss of over 19,000 jobs, though still more moderate losses than those experienced by the private sector (-6.9 percent). This suggests that bioscience-related distribution may be very cyclical and highly responsive to the growth in other manufacturing related sectors of the bioscience industry.
The medical devices and equipment subsector has held its own overall, but with distinct ups and downs during the 2001 to 2010 period.
The medical devices and equipment subsector was generally flat during the 2001 to 2010 period. Employment declined a mere 0.3 percent overall, representing a loss of fewer than 1,000 jobs over the decade. This generally flat performance can be considered an achievement since there is a strong push towards increasing productivity in medical device and equipment manufacturing, akin to other advanced manufacturing industries. Still, the overall period masks a more interesting pattern of ups and downs that do not correspond exactly to the timing of the business cycles during the 2001 to 2010 period. Interestingly, medical devices and equipment lost employment steadily from 2001 to 2004, then picked up from 2005 to 2008 before declining again in 2009 and 2010.
Competitive challenges have marked the drop in employment in the drugs and pharmaceuticals subsector.
The drugs and pharmaceuticals subsector recorded a decline in employment from 2001 to 2010, falling 3.1 percent, a loss of nearly 9,400 jobs. However, this subsector had a more consistent pattern of growth with the business cycle. It grew at a slow but steady pace during the 2001 to 2007 growth period, increasing employment by 4.2 percent with a gain of nearly 13,000 jobs. From 2007 to 2010, declines in the drug and pharmaceutical subsector more than offset its earlier gains, falling 7 percent from 2007 to 2010, a loss of more than 22,000 jobs. This decline is on par with that of total private sector industry employment losses during the 2007 to 2010 period (-6.9 percent). The subsector appears to be facing considerable competitive challenges posed by the rise of generics, the slow pace of regulatory approval for new drugs and biopharmaceuticals, and the continued fast pace of mergers and acquisitions as firms in the subsector seek long-term profitability. In 2010, the subsector again paid the highest annual wages in the biosciences with the average industry worker earning more than $99,000—20 percent more than the average worker in the biosciences and twice the national average for the private sector. Despite the recent job losses, the high wages paid to pharmaceutical employees reflect the high value-adding activities in the subsector that demand a high-skilled workforce.
Agricultural feedstock and chemicals has had a rocky time during the 2001 to 2010 period but for different underlying reasons.
The sharpest decline among the bioscience industry subsectors was in agricultural feedstock and chemicals, where employment fell by 5.9 percent or 4,570 jobs overall from 2001 to 2010. The subsector had added jobs in five of the last six years though the steep job losses in the depths of the recession in 2008 have not been offset by the recent gains and is down overall by 5.5 percent since 2007. Ethanol production has remained the subsector’s strength, steadily adding jobs throughout the decade and even over the recession.

● U.S. BIOSCIENCE SECTOR
Page
10
STATE-BY-STATE BIOSCIENCE INDUSTRY TRENDS
The bioscience industry remains well distributed across the United States, with many states continuing to have strong niches in certain specializations.
Thirty four states and Puerto Rico have an employment specialization6 in at least one of the five bioscience subsectors in 2010 (see Table 1). These include:
16 states specialized in Agricultural Feedstock & Chemicals
11 states and Puerto Rico specialized in Bioscience-related Distribution
12 states and Puerto Rico specialized in Drugs & Pharmaceuticals
14 states and Puerto Rico specialized in Medical Devices & Equipment
12 states and Puerto Rico specialized in Research, Testing, and Medical Labs.
Remarkably, 18 states and Puerto Rico are specialized in at least two of the five bioscience subsectors, suggesting that there are clear spillover impacts into multiple areas of industry focus from this knowledge-based industry cluster.
Indiana, New Jersey, and Puerto Rico stand out in having a specialization in four of the five bioscience subsectors.
The longer term growth of the bioscience industry during the 2001 to 2010 period is widely distributed across the nation, with 34 states sharing in job gains.
The 34 states that gained bioscience industry jobs over the 2001 to 2010 period (see Figure 5) represented every region of the nation, indicating a broad impact as a result of the continued development of the bioscience industry:
Northeast (Vermont, Maine, Massachusetts, and Rhode Island)
South (Georgia, Florida, Kentucky, Maryland, North Carolina, South Carolina, Virginia, Texas, West Virginia)
Midwest (Indiana, Iowa, Kansas, Minnesota, Missouri, Nebraska, North Dakota, Ohio, South Dakota, and Wisconsin)
West (Alaska, Arizona, California, Colorado, Hawaii, Idaho, Montana, New Mexico, Oregon, Utah and Washington)
6 Employment concentration is a useful way in which to gauge a region’s subsectors relative to the national average. State and regional location quotients (LQs) measure the degree of job concentration within the region relative to the nation. States or regions with an LQ greater than 1.0 are said to have a concentration in the subsector. When the LQ is significantly above average, 1.20 or greater, the state is said to have a “specialization” in the subsector.

BATTELLE/BIO STATE BIOSCIENCE INDUSTRY DEVELOPMENT 2012
Page
11
Figure 5. Bioscience Employment Change by State, 2001–10
There also was a healthy mix of states realizing growth in total bioscience industry employment during the 2001–2010 period, including many states with well established, highly concentrated levels of bioscience industry as well as those emerging in bioscience industry development. Emerging states that grew by more than 30 percent during the 2001 to 2010 period included Vermont, South Carolina, Rhode Island, New Mexico, North Dakota, South Dakota, Oregon, and Arizona. The higher percentage growth levels reflected the smaller base of employment within these emerging states. Other fast growing states (20 to 30 percent growth) with well-established bioscience industry development included Utah, North Carolina and Minnesota.
Nearly half of the states added bioscience jobs from 2007—2010, covering the recession years and first year of the economic recovery—and all states grew in at least one subsector of the biosciences.
Even though national bioscience industry employment fell 1.4 percent from 2007 to 2010, 22 states gained jobs in the 3-year period and another 4 states declined by less than 1 percent. Among the leading states in total bioscience industry growth with 5 percent or greater job gains were North Dakota, Vermont, Utah, Arizona, Oregon, West Virginia, Nebraska and Wisconsin. States that grew employment but at a rate of less than 5 percent include Kentucky, Colorado, Texas, Massachusetts, Idaho, Virginia, South Dakota, Alaska, Washington, California, Louisiana, North Carolina, Wyoming, and Ohio.
What also stands out, as shown in Table 1, is that all states had at least one bioscience subsector in which they added jobs in recent years. This demonstrates that the breadth of bioscience industry development affords opportunities for all.

● U.S. BIOSCIENCE SECTOR
Page
12
Figure 6. Bioscience Employment Change by State, 2007–10

BATTELLE/BIO STATE BIOSCIENCE INDUSTRY DEVELOPMENT 2012
Page
13
Table 1. State Specializations and Employment Growth by Major Bioscience Subsector, 2010
Source: Battelle analysis of Bureau of Labor Statistics, QCEW; enhanced file from IMPLAN.
Note: A subsector specialization requires a state location quotient at or above 1.20.
Specialization Growth, 2007–10
Specialization Growth, 2007–10
Specialization Growth, 2007–10
Specialization Growth, 2007–10
Specialization Growth, 2007–10
Alabama
Alaska
Arizona
Arkansas
California
Colorado
Connecticut
Delaware
District of Columbia
Florida
Georgia
Hawaii
Idaho
Illinois
Indiana
Iowa
Kansas
Kentucky
Louisiana
Maine
Maryland
Massachusetts
Michigan
Minnesota
Mississippi
Missouri
Montana
Nebraska
Nevada
New Hampshire
New Jersey
New Mexico
New York
North Carolina
North Dakota
Ohio
Oklahoma
Oregon
Pennsylvania
Puerto Rico
Rhode Island
South Carolina
South Dakota
Tennessee
Texas
Utah
Vermont
Virginia
Washington
West Virginia
Wisconsin
Wyoming
Bioscience-related Distribution
States Agricultural Feedstock & Chemicals
Drugs & Pharmaceuticals Medical Devices & Equipment
Research, Testing, & Medical Laboratories

● U.S. BIOSCIENCE SECTOR
Page
14
Looking to the Future
The bioscience industry is clearly an important innovation-led sector with much promise for future growth. As the National Research Council explains in its study A New Biology for the 21st Century, advances in the life sciences have the potential to contribute innovative and mutually reinforcing solutions to global-reaching, societal challenges related to food, environment, energy and health, and at the same time, serve as the basis for new industries that will anchor the economies of the future.7 Further amplifying this conclusion, an OECD study of the bioeconomy was able to estimate just how much advances in biological sciences would drive future bioscience industry growth. Based solely on recognized advances in biological sciences with a high probability of reaching the market, the OECD study of the bioeconomy estimates that by 2030, it is expected that bioscience innovations could contribute up to 35 percent of the output of chemicals and other industrial products, 80 percent of pharmaceuticals and diagnostic production, and 50 percent of agricultural output worldwide.8
While the potential future impacts of the bioscience industry are quite significant, it is important to note that the business models driving bioscience innovation are being constantly reshaped. As a result, the industry structure will continue to adapt and evolve. One emerging change is the importance of strategic collaborations for furthering innovation and competitiveness. An OECD study entitled The Bioeconomy to 2030: Designing a Policy Agenda notes that “the advantages of collaboration are greater network involvement in problem solving and testing, a reduction in transaction costs to acquire new knowledge, and a reduction in licensing costs when firms can access knowledge produced by the collaborative network at low or no cost.”9 Within the biosciences, these drivers for strategic collaborations are truly pronounced in the area of biopharmaceutical innovation. As a result of the continuing need to rationalize R&D expenditures due to impending patent expirations as well as the decline in productivity in the development and commercialization of new medical products, there is a growing desire to form value-added strategic collaborations. As Battelle and R&D Magazine report in the 2012 Global R&D Funding Forecast:
“The retrenchment of pharma’s conventional model has created significant R&D opportunities for universities, non-profits and governments…consider the Pfizer example, while reducing internal R&D, it has expanded its presence in Cambridge, MA, specifically to have better collaborative access to the great research institutions of the area and to adopt an open innovation posture. In a larger example intended to accelerate drug development, GlaxoSmithKline, Novartis, Pfizer and Eli Lilly have joined the Structural Genomics Consortium, a public-private partnership that supports the discovery of new medicines through open access research…At the same time, the federal government has become oriented to a larger role in early-stage drug R&D with initiatives like the National Center for Advancing Translational Sciences and the NIH’s Common Fund. Foundations are also taking a more active role in funding and R&D toward treatments for the often difficult diseases in which they have an interest. This convergence of public and private life science R&D toward open innovation and open source information—especially in areas needing considerable fundamental research—is a major change in the approach to funding and performing life science R&D.”10
7 National Research Council, A New Biology for the 21st Century, National Academy of Sciences, 2009. 8 OECD, The Bioeconomy to 2030, 2009, page 199. 9 IBID, page 171. 10 Battelle and R&D Magazine, “2012 Global R&D Funding Forecast”, December 2011, page 15.

BATTELLE/BIO STATE BIOSCIENCE INDUSTRY DEVELOPMENT 2012
Page
15
Another driver of change is what MIT calls the “Third Revolution”—that of the convergence of life sciences, physical sciences and engineering:
“There have been two dramatic developments in life science research in the last 50 years—the molecular and cellular biology revolution and the genomics revolution. These two revolutions paved the way for the convergence revolution now taking shape. We believe that combining knowledge of engineering and physical science with life science expertise will build on recent advances in molecular and cellular biology and genomics and produce new breakthroughs.”11
Examples of this convergence are already at hand, including the way nanotechnology is improving how drugs can be delivered and how information technology is unlocking a multitude of “hidden” secrets, from analyzing the human genome to advances in digital technology, which are improving how we diagnose diseases and monitor patients. Because of this convergence, the biosciences offer enormous potential for linking basic research innovations across a myriad of other disciplines, which in combination create new products and processes with new market opportunities.
This rise of convergence, in turn, reinforces the importance of strategic collaborations. With convergence, there is a strong need for a “bigger bench” of scientists—both within academia and industry—undertaking discovery and development. Convergence will require capabilities not typically possessed in a single organization and so lead to more collaboration and strategic partnering.
So, while the promise of bioscience-led innovations in the years to come is both realistic and far-reaching, its development will be very dynamic and will reshape its industries. Battelle and BIO will be in the trenches tracking this unfolding phenomenon.
11 MIT, The Third Revolution: The Convergence of the Life Sciences, Physical Sciences and Engineering, January 2011, page 6.

● U.S. BIOSCIENCE SECTOR
Page
16
U.S. Bioscience Industry: Current Status and Recent Trends
Introduction
The U.S. bioscience industry has a well documented track record of exceptionally strong performance in establishment, wage, and employment growth. Since 2001 the bioscience industry has followed a strong upward trajectory, maintaining resilient growth through the first year of the recent, deep recession.
Now in 2012, we again assess the state of the industry and recent trends. Key questions emerged, including: How did the industry weather the recession years and a nascent recovery? Would individual states or major subsectors show uneven performance? In this updated analysis we set out to answer these questions.
Bioscience firms were indeed impacted by the recession that began in late 2007 and lasted through mid-2009, though the employment impacts were generally muted. The sector continued to add jobs in 2008 at a modest pace, thus recording its seventh consecutive year of job gains—as far back as comparable detailed data are available. In 2009, with the global economy reeling in recession, the national bioscience industry shed 2 percent of its jobs. This compares favorably to a much steeper 5.5 percent job loss for the
overall national private sector in 2009. By 2010, national employment numbers leveled off, with the biosciences remaining essentially flat (a -0.3 percent decline).
The robustness and resilience of the biosciences is further evidenced when compared with other major knowledge-based industries. Since 2007, the biosciences shed 1.4 percent of its jobs, while other industries fared much worse: IT services and telecommunications (down 2.4 percent); aerospace (down 2.5 percent); finance and insurance (down 8.4 percent); and computer hardware (down 18.1 percent).
It is important to examine the various and diverse subsectors of the bioscience industry in order to better understand the strengths and challenges of the industry. The diverse nature of the U.S. bioscience industry is evidenced by varied performance among subsectors as well as across states and regions. Furthermore, many states and regions have developed specialization in one or more of the industry's subsectors.
Defining the Biosciences: An Evolving Industry Requires a Re-examined Approach
Measuring the bioscience industry is not straight-forward because of its diversity of commercial applications. Instead of falling neatly into a single high level industry classification, the biosciences are best understood as a grouping of diverse industries with a common link—the application of biological scientific knowledge. Defining the bioscience industry requires analysis of standard industrial classifications at the most detailed level, so as to accurately identify establishments and individuals engaged in appropriately related enterprise. These bioscience industries fall into a broad array of higher level industries, such as chemical and food manufacturing, professional, scientific and technical services and, increasingly, distribution services.
Instead of falling neatly into a single high level industry classification, the biosciences are best understood as a grouping of diverse industries with a common link—the application of biological scientific knowledge.

BATTELLE/BIO STATE BIOSCIENCE INDUSTRY DEVELOPMENT 2012
Page
17
As the bioscience industry has evolved, so too has the manner in which the North American Industry Classification System (NAICS) has been interpreted and used by companies, as well as state and federal statistical systems. For this reason, Battelle and BIO have worked to re-examine and re-evaluate the NAICS-based definition used in this report.
Prior editions of Battelle-BIO State Initiatives Reports aggregated four major bioscience industry subsectors from twenty-seven detailed industries within the NAICS system, using the most detailed 6-digit level data available. Those subsectors are:
Agricultural feedstock and chemicals
o Firms engaged in agricultural production and processing, organic chemical manufacturing, and fertilizer manufacturing. The subsector includes the emerging industry activity in the production of ethanol and other biofuels.
Drugs and pharmaceuticals
o Firms that develop and produce biological and medicinal products and manufacture pharmaceuticals and diagnostic substances.
Medical devices and equipment
o Firms that develop and manufacture surgical and medical instruments and supplies, laboratory equipment, electromedical apparatus including MRI and ultrasound equipment, dental equipment and supplies, and ophthalmic products.
Research, testing, and medical laboratories
o Firms engaged in research and development in biotechnology and other life sciences, life science testing laboratories, and medical laboratories and other diagnostic centers.
For this fifth biennial report, re-examination of the definition by Battelle and BIO has led to two important refinements:
We've chosen to drop a number of detailed industries that have become more closely connected with the delivery of clinical services to patients than the development of new bioscience products. This includes three specific industries: ophthalmic goods manufacturing, which is involved in filling prescriptions for eyeglasses and contact lenses; dental laboratories, which fill orders for customized dentures, crowns, implants and orthodontic appliances; and diagnostic imaging centers that offer access to high end MRI, CAT scan, PET and ultrasound imaging services. Upon examination of the range of companies and primary activities, these three industries are found to be less involved in creating products and services using biological knowledge and more engaged in direct patient services involving using existing bioscience products and technologies.
We've added a new fifth subsector for the bioscience industry in light of the changing nature of bioscience technology and applications. This new subsector is categorized as bioscience-related distribution. Increasingly, bioscience-related distribution involves new and specialized approaches —such as cold storage, highly regulated product monitoring, and automated pharmaceutical distribution systems. These dedicated bioscience-related distribution networks are comprised of three detailed distribution industries: one associated with medical equipment and device distribution; another with drug distribution; and a third with agricultural related chemicals and seed distribution. Each of these bioscience-related industries are becoming integral in the primary production of bioscience goods in an age of advanced logistics and the increasing specialized nature of biosciences product development.
This revised definition of the bioscience industry is depicted in Figure 7.

● U.S. BIOSCIENCE SECTOR
Page
18
Figure 7. Revised Definition of the Bioscience Industry
The data and methodology section that follows sets out a comparison table of the detailed industries under each bioscience industry subsector noting the changes made.
Research and economic activity within a sixth center of bioscience activity might include academic health centers, research hospitals, and other biomedical research-driven institutions. Many U.S. hospitals partner with universities and other research institutes to further advances in the biosciences with a particular focus on biomedical and healthcare applications. Unfortunately, current industrial classifications and available data do not allow for an isolation of these research-oriented establishments outside of the larger hospitals sector. Though it cannot be reliably quantified, the research-oriented hospitals sector should be recognized as an important element of the bioscience industry cluster.
Industry Employment Data Source
To measure the size, relative concentration, and overall employment impacts of the biosciences in the United States, Battelle tabulated employment, establishment, and wage data for each state, the District of Columbia, and Puerto Rico. With revisions to the industry definition in this report, the data were updated for each of the five bioscience industry subsectors for the full 2001 through 2010 period, the most current, detailed, and comparable annual data available.
The Bureau of Labor Statistics (BLS) Quarterly Census of Employment and Wages (QCEW) program data are used as the primary data source for this industry analysis. The QCEW provides the most accurate employment data for detailed industries at the sub-national level. The data represent a virtual “census” of workers covered under the Unemployment Insurance system, as reported by employers.
AGRICULTURAL FEEDSTOCK & CHEMICALS
•Processing of Agricultural Feedstock for Bio‐based Products•Organic & Agricultural Chemicals including Biofuels
DRUGS & PHARMECEUTICALS
•Pharmaceutical Preparation & Mfg
•Diagnostic Substances•Biopharmaceuticals•Vaccines
MEDICAL DEVICES & EQUIPMENT
•Biomedical Instruments•Electromedical Equipment & Devices•Healthcare Products & Supplies•Lab Instrumentation
RESEARCH, TESTING & MEDICAL LABS
•Biotech & Other Life Sciences R&D
•Testing Labs•Medical Labs
BIOSCIENCE‐RELATED DISTRIBUTION
Distribution of:
•Agricultural Chemicals & Seeds
•Biomedical Equipment & Supplies
•Drugs & Pharmaceuticals
Original Core Definition New Addition

BATTELLE/BIO STATE BIOSCIENCE INDUSTRY DEVELOPMENT 2012
Page
19
The Size, Composition, Growth, and Impact of the U.S. Bioscience Sector
Overview
National employment in the bioscience industry totaled 1.61 million in 2010, with these jobs spanning 70,006 individual business establishments.12 Going back nearly a decade, bioscience companies have added nearly 97,000 new jobs or 6.4 percent to their employment base since 2001. The recession that began in late 2007 and intensified in 2008 slowed the industry’s momentum and led to a modest contraction, with the industry shedding 1.4 percent of its base since the economic peak in 2007. The job losses occurred in 2008 and 2009 with the majority in 2008 when the industry shed 2 percent of jobs (Figure 8).
Figure 8. U.S. Bioscience and Total Private Sector Employment Trend, 2001–10, Indexed (2001=100)
Source: Battelle analysis of BLS, QCEW data; enhanced file from IMPLAN.
The biosciences have over the past decade consistently outpaced the overall national private sector. During the economic expansion from 2001 through 2007, the industry added new jobs at a rate nearly twice that for the private sector. Since 2007, U.S. private sector employment has contracted by 6.9 percent compared with just 1.4 percent for the biosciences.
While employment growth stalled in a difficult business cycle relative to the previous rapid gains, bioscience firms have extended their reach and presence in their physical footprint in the expansion of individual business establishments. Bioscience companies now operate just over 70,000 establishments across the U.S. Steady gains continued even through the recession years and since 2001 the industry has added more than 7,900 establishments—a nearly 13 percent increase overall. The vast majority of the gain in bioscience establishments has come from firms in the research, testing, and medical laboratories subsector, where service-driven companies tend to have smaller operations compared with the larger operations of their manufacturing-oriented counterparts (Table 2).
12 An establishment in the QCEW program is commonly understood as a single economic unit, such as a farm, a mine, a factory, or a store, that produces goods or services. Establishments are typically at one physical location and engaged in one, or predominantly one, type of economic activity for which a single industrial classification may be applied. A firm, or a company, is a business and may consist of one or more establishments, where each establishment may participate in different predominant economic activity.
90
92
94
96
98
100
102
104
106
108
110
2001 2002 2003 2004 2005 2006 2007 2008 2009 2010
Em
ploy
men
t In
dex
(200
1 =
100
)
U.S. Bioscience Industry
U.S. Total Private Sector

● U.S. BIOSCIENCE SECTOR
Page
20
Table 2. U.S. Bioscience Employment and Establishments, 2010 and Changes, 2001–10 and 2007–10
Source: Battelle analysis of BLS, QCEW data; enhanced file from IMPLAN.
The research, testing, and medical labs subsector is largest of the five, employing more than 450,000 in 2010 or nearly 3 in 10 U.S. bioscience industry workers (see Figure 9). The subsector has few equals among all industries in terms of its robust performance year after year through the turmoil of business cycles including the recent deep recession. Over the past decade, research, testing, and medical lab jobs have increased by 24 percent—translating into nearly 87,000 new jobs. The gains have continued during and through the recent recession, with the subsector adding 6 percent to its employment base since 2007.
The bioscience-related distribution subsector is also quite large, spanning more than 36,000 establishments that employ over 440,000 in 2010, and accounting for 27 percent of bioscience industry employment. Subsector performance has been cyclical with firms steadily adding jobs from 2002 through the economic peak in 2007. However, this subsector has since been impacted by the recent recession, with firms shedding some of these job gains in 2008 and 2009 and unable to fully rebound with modest job losses again in 2010. Since 2007, subsector jobs have declined by 4.2 percent, a rate still below that for the overall private sector (-6.9 percent). Despite the recent contraction, employment overall is up since 2001 by nearly 25,000 jobs or 6 percent.
Figure 9. Employment Composition of the U.S. Bioscience Industry, 2010
The medical devices and equipment subsector employs about one in five workers in the bioscience industry, totaling more than 343,000 jobs in 2010 that span nearly 7,000 advanced manufacturing establishments. The subsector entered the recession with momentum—from 2005 through even the first year of the recession in 2008, the subsector steadily added jobs before decreasing by a modest 9,000 jobs or 2.6 percent over the 2008–2010 period.
Looking out over the decade, medical devices has weathered relatively minor ups and downs in employment and ended 2010 essentially flat compared with 2001, down just 0.3 percent over the decade.
The national drugs and pharmaceuticals subsector has steadily shed jobs since the recession began in late 2007, employing nearly 297,000 by 2010. This rate of job loss essentially matches that for the overall U.S. private sector since 2007 and both are down overall by 7 percent since the national economy peaked in 2007. The decade’s peak employment for the subsector was reached back in 2002 and 2003 at 320,000 jobs and though pharmaceutical manufacturers had modest job gains from 2005 through 2007, the subsector remains below this level.
Bioscience Subsector 2010 Establishments
Change in Establishments,
2001–10
Change in Establishments,
2007–10
2010Employment
Change in Employment,
2001–10
Change in Employment,
2007–10Agricultural Feedstock & Chemicals 1,760 2.2% 4.5% 72,988 -5.9% -5.5%Bioscience-related Distribution 36,170 -1.1% -0.3% 440,394 6.0% -4.2%Drugs & Pharmaceuticals 2,908 11.3% 6.5% 296,759 -3.1% -7.0%Medical Devices & Equipment 6,957 11.7% 7.7% 343,468 -0.3% -0.8%Research, Testing, & Medical Laboratories 22,212 48.9% 20.1% 451,923 23.8% 6.1%Total Biosciences 70,006 12.8% 6.7% 1,605,533 6.4% -1.4%
28%
27%21%
19%
5%
Research, Testing, & Medical Labs
Bioscience-related Distribution
Medical Devices & Equipment
Drugs & Pharmaceuticals
Agricultural Feedstock & Chemicals

BATTELLE/BIO STATE BIOSCIENCE INDUSTRY DEVELOPMENT 2012
Page
21
At 5 percent of bioscience industry employment, the agricultural feedstock and chemicals subsector is the smallest of the five with nearly 73,000 employed in 2010 across 1,760 individual establishments. The subsector rode the ups and downs of the business cycle in recent years and resumed job growth in 2010. Agricultural bioscience companies have added jobs in five of the last six years though the steep job losses in the depths of the recession in 2008 have not been offset by the recent gain and since 2007 the subsector is down overall by 5.5 percent.
Figure 10. U.S. Employment by Bioscience Subsector, 2007–10
Broader Impacts of the Bioscience Industry: Employment Multipliers
The biosciences, like other industries, have interdependent relationships with suppliers of other goods and services. The sector both supports and depends upon other entities to supply everything from business services to commodity inputs. As a result, the industry has a regional and national economic reach and impact that is greater than its total direct employment or earnings might suggest.
State employment multipliers are used to measure the additional impact of bioscience jobs. Multipliers quantify the broad ripple effect where an industry creates and supports additional economic activities. The Bureau of Economic Analysis (BEA) has developed regional factors to conduct this type of impact analysis using its Regional Input-Output Modeling System—also known as RIMS II.
Battelle has calculated state and national employment impact factors for each bioscience subsector using the direct-effect employment multipliers provided by BEA. The multipliers represent the total change in number of jobs in all industries (direct, indirect, and induced effects) that result from a change of one job in the corresponding industry sector. At the national level, the multipliers range from 2.4 for bioscience-related distribution, to 5.6 for agricultural feedstock and chemicals.
The total indirect and induced employment impact of the 1.6 million U.S. bioscience jobs is an additional 3.4 million jobs throughout the remainder of the economy. Together, these direct, indirect, and induced
-
50,000
100,000
150,000
200,000
250,000
300,000
350,000
400,000
450,000
500,000
Agricultural Feedstock & Chemicals
Drugs & Pharmaceuticals
Medical Devices & Equipment
Research, Testing, & Medical
Laboratories
Bioscience-related Distribution
Employment, 2007Employment, 2008Employment, 2009Employment, 2010

● U.S. BIOSCIENCE SECTOR
Page
22
bioscience job impacts account for a total employment impact of 5.1 million jobs (rounded figures do not sum to rounded total). This amounts to an overall bioscience direct-effect employment multiplier of 3.2.13
Bioscience Wages
The biosciences continue to generate high-skilled jobs, drawing its workforce from a national and often international talent pool that include scientists, lab technicians, engineers, computer scientists, statisticians, and advanced production occupations. In turn, bioscience workers earn a substantial wage premium relative to the overall private sector. In 2010, U.S. bioscience industry employees earned $82,697 on average—79 percent greater than the national private sector average. This wage gap has widened since 2001 when it stood at 65 percent (see Table 3).
Table 3. Average Annual Wages in the Biosciences and Other Major Industries, 2010
Source: Battelle analysis of BLS, QCEW data; enhanced file from IMPLAN.
Despite its employment challenges, the drugs and pharmaceuticals subsector continues to pay the highest wages among the major subsectors, with the average industry worker earning more than $99,000—20 percent more than the average worker in the biosciences and twice the national average for the private sector. The high wages paid to pharmaceutical employees reflect the high value-adding activities in the subsector that require a high-skilled workforce.
Growth in bioscience industry average wages continues to exceed that for the national private sector. Since 2001, real (inflation-adjusted) earnings have increased by 13 percent compared with 4 percent for the private sector overall. Most subsectors have increased real wages to workers by double-digits over the decade with drugs and pharmaceuticals and medical devices leading the way in wage gains at 15 percent and 14 percent, respectively (Figure 11).
Beginning in 2007, wage growth has slowed with real total bioscience wages increasing just 0.6 percent through 2010. Four of five industry subsectors have increased wages since 2007 by 1 percent. The only
13 National employment impact analysis in this report is no longer comparable with that from prior editions due to both a change in the industry definition as well as changes in BEA methodology. BEA no longer calculates employment multipliers at the national level which had included interstate activity; therefore, the U.S. multipliers presented here for the bioscience industry are lower and no longer comparable with those from prior Battelle/BIO reports.
Drugs & Pharmaceuticals 99,486$
Finance & Insurance 84,516$
Research, Testing, & Medical Laboratories 84,065$
Total Biosciences 82,697$
Bioscience‐related Distribution 80,049$
Profess iona l , Scienti fi c, & Technica l Services 77,313$
Information 74,382$
Medical Devices & Equipment 72,301$
Agricultural Feedstock & Chemicals 70,869$
Manufacturing 57,511$
Construction 49,588$
U.S. Total Private Sector 46,317$
Transportation & Warehous ing 44,198$
Real Estate & Rental & Leas ing 43,779$
Health Care & Socia l Ass is tance 43,732$
Retai l Trade 26,655$
U.S. Average Annual Wages per Employee, 2010

BATTELLE/BIO STATE BIOSCIENCE INDUSTRY DEVELOPMENT 2012
Page
23
subsector to decline was bioscience-related distribution, which has seen average wages fall slightly by 0.4 percent in real terms.
Figure 11. Change in Real Average Annual Wages in the Biosciences and the Total Private Sector, 2001–10
The following section provides a more in-depth examination of employment trends among each of the five major bioscience subsectors. Data were tabulated for each state, the District of Columbia, and Puerto Rico to determine the size and relative job concentration within each subsector. In addition, employment growth and loss were calculated to present recent trends.
Employment size measures the absolute level of jobs within each region. To allow for meaningful comparisons, each region’s share of total U.S. employment was analyzed. States with more than 5 percent of national employment are designated “large”; states with more than 3 percent but less than 5 percent are referred to as “sizable.”
Employment concentration is a useful way in which to gauge a region’s subsectors relative to the national average. State and regional location quotients (LQs) measure the degree of job concentration within the region relative to the nation. States or regions with an LQ greater than 1.0 are said to have a concentration in the subsector. When the LQ is significantly above average, 1.20 or greater, the state is said to have a “specialization” in the subsector.
The level of employment growth or loss during 2007 to 2010 provides a snapshot of recent progress in growing a state’s bioscience sector. This is useful when examining the recent recession and early stage of the recovery. In this analysis, job growth or loss was measured by absolute employment gains or losses, as percent changes may overstate trends in those states with a smaller subsector employment base.
15.3%
13.9%13.1%
12.3% 12.2%
8.7%
4.4%
0%
2%
4%
6%
8%
10%
12%
14%
16%
18%
Drugs & Pharmaceuticals
Medical Devices & Equipment
Total Biosciences Research, Testing, & Medical
Laboratories
Bioscience-related Distribution
Agricultural Feedstock & Chemicals
Total Private Sector

● U.S. BIOSCIENCE SECTOR
Page
24
AGRICULTURAL FEEDSTOCK and CHEMICALS
The agricultural feedstock and chemicals subsector applies life sciences knowledge, biochemistry, and biotechnologies to the processing of agricultural goods and the production of organic and agricultural chemicals. The subsector also includes activities around the production of biofuels.
Examples of Products
Fertilizers, pesticides, herbicides, and fungicides
Corn and soybean oil
Ethanol and biodiesel fuels
Biodegradable materials synthesized from plant-based feedstock
Biocatalysts
Examples of Companies
Abengoa
Archer Daniels Midland
BASF Plant Science
Bayer CropScience
Cargill
Dow AgroSciences
DuPont
Intrepid Potash
Monsanto
Novozymes
Poet
Scotts Miracle-Gro
Syngenta
States that are Both Large and Specialized*
Illinois
Iowa
Florida
Indiana *States are listed in descending order by subsector employment levels.

BATTELLE/BIO STATE BIOSCIENCE INDUSTRY DEVELOPMENT 2012
Page
25
Agricultural Feedstock & Chemicals
Employment in the national agricultural feedstock and chemicals subsector made up 5 percent of bioscience employment in 2010 after weathering the ups and downs of the business cycle in recent years and resuming job growth in 2010. U.S. agricultural biosciences firms employed 72,988 in 2010 across nearly 1,800 individual business establishments. The subsector has added jobs in five of the last six years, though the steep job losses in the depths of the recession in 2008 have not been offset by the recent gain and since 2007 is down overall by 5.5 percent.
The subsector has two major components—agricultural feedstock which includes the processing of agricultural goods and those that drive the supply chain for bio-based products; and organic and agricultural chemicals which span the production of fertilizers, pesticides, herbicides, to biofuels. The larger of the two, organic and agricultural chemicals, has experienced some employment gain since 2007 driven by the steady hiring in ethanol production facilities. Since 2001, the ethanol sector has increased employment by 200 percent.
State Leaders & Highlights
EMPLOYMENT SIZE: Agricultural bioscience employment is well distributed across the U.S. with the largest 10 states accounting for just 62 percent of jobs.
Large States: Illinois, Iowa, Florida, Texas, Indiana
Sizable States: Ohio, Tennessee, California, Missouri, Louisiana, North Carolina, Nebraska
EMPLOYMENT CONCENTRATION: Sixteen states have a specialized concentration of jobs in the agricultural feedstock and chemicals subsector, more than for any other subsector. These concentrations are generally more in the Midwest and South.
Specialized States: Iowa, Nebraska, South Dakota, Idaho, Indiana, Louisiana, Illinois, North Dakota, Wyoming, Tennessee, Mississippi, Missouri, Alabama, Florida, Kansas, North Carolina
Concentrated States: Ohio, Minnesota
EMPLOYMENT GROWTH: From 2007–10, half of all states experienced some increase in subsector jobs with New York and Iowa having substantial increases.
LARGE and SPECIALIZED STATES: Four states have both a large employment base and a specialized concentration of jobs in agricultural feedstock and chemicals (Table 4).
Table 4. States with Large and Specialized Employment in Agricultural Feedstock and Chemicals, 2010
Source: Battelle analysis of BLS, QCEW data; enhanced file from IMPLAN.
State Establishments, 2010
Employment, 2010
Location Quotient,
2010
Share of U.S.
Employment Illinois 89 8,263 2.58 11.3%Iowa 128 7,578 9.24 10.4%Florida 110 5,450 1.32 7.5%Indiana 45 4,544 2.89 6.2%

● U.S. BIOSCIENCE SECTOR
Page
26
DRUGS and PHARMACEUTICALS
The drugs and pharmaceuticals subsector produces commercially available medicinal and diagnostic substances. The subsector is generally characterized by large multinational firms heavily engaged in R&D and manufacturing activities to bring drugs to market.
Examples of Products
Vaccines
Targeted disease therapeutics
Biopharmaceuticals
Tissue and cell culture media
Dermatological/topical treatments
Diagnostic substances
Animal therapeutics and vaccines
Examples of Companies
Abbott Laboratories
Amgen
Biogen Idec
Cornerstone Therapeutics
Eli Lilly & Co.
Merck & Co.
Novartis
Pfizer
Roche Group – Genentech
Sanofi-Aventis/Sanofi Pasteur
States that are Both Large and Specialized*
California
New Jersey
Pennsylvania
North Carolina
Illinois
Puerto Rico
Indiana *States are listed in descending order by subsector employment levels.

BATTELLE/BIO STATE BIOSCIENCE INDUSTRY DEVELOPMENT 2012
Page
27
Drugs & Pharmaceuticals
The national drugs and pharmaceuticals subsector has steadily shed jobs since the recession began with average annual declines of 2.4 percent since 2007 and subsector employment stood at 296,759 by 2010. This rate of job loss mirrors that of the overall U.S. private sector since 2007.
A distinguishing characteristic of the drugs and pharmaceuticals subsector is its high wages. In 2010, the subsector again had the highest annual wages in the biosciences with the average industry worker paid more than $99,000—20 percent more than the average worker in the biosciences and twice the national average for the private sector. The high wages paid to pharmaceutical employees reflect the high value-adding activities in a subsector that demands a high-skilled workforce.
While pharmaceutical preparation is by far the largest component of this subsector and has accounted for the majority of job losses in recent years, two other smaller sectors have added jobs since 2007. In-vitro diagnostic substances and biological product manufacturing have increased their employment by 8 percent and 5 percent, respectively.
State Leaders & Highlights
EMPLOYMENT SIZE: In terms of geography, drugs and pharmaceuticals manufacturing is more highly concentrated among fewer states than the other bioscience subsectors. The two largest employment states—California and New Jersey—combine to employ one in four subsector workers nationally.
Large States: California, New Jersey, Pennsylvania, North Carolina, New York, Illinois, Puerto Rico, Indiana
Sizable States: Texas, Massachusetts
EMPLOYMENT CONCENTRATION: Twelve states and Puerto Rico have a specialized concentration of jobs in the drugs and pharmaceuticals subsector.
Specialized States: Puerto Rico, New Jersey, Indiana, North Carolina, Connecticut, Utah, West Virginia, Pennsylvania, Illinois, California, Massachusetts, Rhode Island, Maryland
Concentrated States: Maine, New York
EMPLOYMENT GROWTH: From 2007–10, 24 states experienced some increase in subsector jobs. West Virginia, North Carolina, Kansas, and Tennessee recorded substantial job increases.
LARGE and SPECIALIZED STATES: Six states and Puerto Rico have both a large employment base and a specialized concentration of jobs in drugs and pharmaceuticals (Table 5).
Table 5. States with Large and Specialized Employment in Drugs and Pharmaceuticals, 2010
State Establishments, 2010
Employment, 2010
Location Quotient,
2010
Share of U.S.
Employment California 466 43,162 1.29 14.5%New Jersey 253 32,794 3.77 11.1%Pennsylvania 113 21,352 1.62 7.2%North Carolina 108 20,120 2.34 6.8%Illinois 128 18,032 1.39 6.1%Puerto Rico 61 17,896 9.69 6.0%Indiana 47 17,141 2.68 5.8%

● U.S. BIOSCIENCE SECTOR
Page
28
MEDICAL DEVICES and EQUIPMENT
Firms in the medical device and equipment subsector produce a variety of biomedical instruments and other health care products and supplies for diagnostics, surgery, patient care, and laboratories. The subsector is continually advancing the application of electronics and information technologies to improve and automate testing and patient care capabilities.
Examples of Products
Bioimaging equipment
Surgical supplies and instruments
Orthopedic/prosthetic implants and devices
Laser eye surgery instruments
Automated external defibrillators (AEDs)
Vascular stents and other implantable devices
Dental instruments and orthodontics
Examples of Companies
Alcon
Becton, Dickinson and Co.
Boston Scientific Corp.
GE Healthcare
Medtronic
Roche Group – Ventana
Siemens Medical Solutions
STERIS
Stryker
Zimmer
3M Health Care
States that are Both Large and Specialized*
California
Minnesota
Massachusetts
Indiana *States are listed in descending order by subsector employment levels.

BATTELLE/BIO STATE BIOSCIENCE INDUSTRY DEVELOPMENT 2012
Page
29
Medical Devices & Equipment
U.S. medical device and equipment companies employed 343,468 in 2010 or 21 percent of the national bioscience sector. These advanced manufacturing jobs produce an array of medical devices, supplies, and equipment at nearly 7,000 individual establishments. The subsector entered the recession with momentum—from 2005 through the first year of the recession in 2008, the subsector steadily added jobs before decreasing by a modest 9,000 jobs or 2.6 percent over the 2008–2010 period. Looking out over the decade, medical devices has weathered relatively minor ups and downs in employment and ended 2010 essentially flat compared with 2001, down just 0.3 percent.
Most of the component industries within this subsector have seen job declines since peaking in 2008, with the steeper job losses in lab instruments and electromedical equipment manufacturing. However, one detailed industry gained jobs over this period—surgical and medical instrument manufacturers added jobs over the 2-year period.
State Leaders & Highlights
EMPLOYMENT SIZE: The industrial footprint of the medical device and equipment subsector is far-reaching with establishments in every state, the District of Columbia, and Puerto Rico. The top 10 employer states account for 61 percent of national subsector jobs.
Large States: California, Minnesota, Massachusetts, Indiana
Sizable States: Florida, Pennsylvania, New Jersey, New York, Puerto Rico, Illinois, Wisconsin, Michigan
EMPLOYMENT CONCENTRATION: Fourteen states and Puerto Rico have a specialized concentration of jobs in the medical device and equipment subsector.
Specialized States: Puerto Rico, Minnesota, Utah, Delaware, Indiana, Massachusetts, Connecticut, South Dakota, Nebraska, Colorado, New Hampshire, California, Wisconsin, Vermont, New Jersey
Concentrated States: Tennessee, Rhode Island, Pennsylvania, Michigan
EMPLOYMENT GROWTH: From 2007–10, 27 states experienced some increase in subsector jobs with 11 states having substantial increases led by Tennessee, Indiana, and Colorado.
LARGE and SPECIALIZED STATES: Four states have both a large employment base and a specialized concentration of jobs in medical devices and equipment (Table 6).
Table 6. States with Large and Specialized Employment in Medical Devices and Equipment, 2010
Source: Battelle analysis of BLS, QCEW data; enhanced file from IMPLAN.
State Establishments, 2010
Employment, 2010
Location Quotient,
2010
Share of U.S.
Employment California 995 59,450 1.54 17.3%Minnesota 332 26,774 3.81 7.8%Massachusetts 281 20,182 2.30 5.9%Indiana 143 18,936 2.56 5.5%

● U.S. BIOSCIENCE SECTOR
Page
30
RESEARCH, TESTING, and MEDICAL LABORATORIES
The research, testing, and medical laboratories subsector includes a range of activities; from highly research-oriented companies working to develop and commer-cialize new drug discovery/delivery systems, and gene and cell therapies, to more service-oriented firms engaged in medical and other life sciences testing services.
Examples of Products
Preclinical drug development
Drug delivery systems
Diagnostic imaging and testing
Stem cell/regenerative research
Biomarkers
Research/laboratory support services
Examples of Companies
Albany Molecular Research
Celera
Charles River Laboratories
Covance
Laboratory Corp. of America
NeoGenomics
Orchid Cellmark
Pacific Biomarkers
Pharmaceutical Product Development
Quest Diagnostics
States that are Both Large and Specialized*
California
Massachusetts
Pennsylvania
New Jersey *States are listed in descending order by subsector employment levels.

BATTELLE/BIO STATE BIOSCIENCE INDUSTRY DEVELOPMENT 2012
Page
31
Research, Testing, & Medical Laboratories
Research, testing, and medical laboratories continues to be the largest U.S. bioscience subsector and a source of steady and strong job gains. The subsector has few equals among all other industries in terms of its robust performance year after year through the turmoil of business cycles including the recent deep recession. In 2010, the subsector reached 451,923 jobs, or 28 percent of the biosciences, and spanned 22,212 individual establishments. Over the past decade, research, testing, and medical lab jobs have increased by 24 percent, translating into nearly 87,000 new jobs. The gains have continued, though moderated somewhat, through the recent recession, as the subsector added 6 percent to its employment base since 2007. The full 9-year period saw subsector firms add, on average, 2.4 percent in annual increases while the private sector average rate was flat. In the last three years, the subsector has averaged 2.0 percent in annual job gains and buoyed the overall biosciences during relatively difficult years.
The subsector is unique among the biosciences in a number of ways. Chiefly, companies classified within this subsector primarily focus on services, rather than production. Secondly, as these companies expand, they may “graduate” out of the subsector and into classification among drugs and pharmaceuticals if new therapeutics are developed.
Biotechnology and other life sciences R&D and testing lab establishments employ sixty five percent of the subsector. Both the R&D and the other major component, medical laboratories, have experienced strong overall growth since 2001, increasing by 19 percent and 30 percent, respectively.
State Leaders & Highlights
EMPLOYMENT SIZE: The largest of the bioscience subsectors, employment is widespread and growing. Similar to other subsectors, the 10 largest employer states account for 62 percent of all jobs.
Large States: California, Massachusetts, Pennsylvania, New Jersey, New York
Sizable States: Texas, Maryland, North Carolina, Florida, Illinois
EMPLOYMENT CONCENTRATION: Twelve states and Puerto Rico have a specialized concentration of jobs in the research, testing, and medical laboratories subsector.
Specialized States: Massachusetts, Maryland, New Mexico, New Jersey, Puerto Rico, Idaho, California, Utah, North Carolina, Washington, Pennsylvania, Delaware, Hawaii
Concentrated States: Maine, Kansas, Missouri
EMPLOYMENT GROWTH: From 2007–10, 39 states experienced some increase in subsector jobs with 18 states having substantial increases led by California and Massachusetts.
LARGE and SPECIALIZED STATES: Four states have both a large employment base and a specialized concentration of jobs in research, testing, and medical laboratories (Table 7).
Table 7. States with Large and Specialized Employment in Research, Testing, and Medical Labs, 2010
Source: Battelle analysis of BLS, QCEW data; enhanced file from IMPLAN.
State Establishments, 2010
Employment, 2010
Location Quotient,
2010
Share of U.S.
Employment California 2,986 75,907 1.49 16.8%Massachusetts 1,154 37,789 3.27 8.4%Pennsylvania 971 26,976 1.35 6.0%New Jersey 896 26,721 2.01 5.9%

● U.S. BIOSCIENCE SECTOR
Page
32
BIOSCIENCE-RELATED DISTRIBUTION
The bioscience-related distribution subsector coordinates the delivery of bioscience-related products spanning pharmaceuticals, medical devices, and agbiosciences. The subsector increasingly deploys specialized technologies such as cold storage, highly regulated product monitoring, and automated drug distribution systems.
Examples of Services
Distribution of:
Pharmaceuticals
Vaccines
Plasma/Blood
Veterinary Medicines
Surgical Instruments/Appliances
Diagnostic Equipment
Bioimaging Equipment
Plant Seeds
Agricultural Chemicals
Examples of Companies
Mckesson
Cardinal Health
AmerisourceBergen
Monsanto
Express Scripts/Medco Health
Omnicare
Wilbur-Ellis
Owens & Minor
Henry Schein
Patterson Companies
States that are Both Large and Specialized*
Florida
Illinois *States are listed in descending order by subsector employment levels.

BATTELLE/BIO STATE BIOSCIENCE INDUSTRY DEVELOPMENT 2012
Page
33
Bioscience-Related Distribution
Companies engaged in the distribution of bioscience-related products deploy unique technologies and competencies in the logistics and transportation of biological products and other sensitive equipment. This subsector spans more than 36,000 establishments that employed 440,394 in 2010, accounting for 27 percent of total bioscience industry employment. Bioscience-related distribution steadily added jobs from 2002 through the economic peak in 2007, but was impacted by the recent recession with firms shedding some of these job gains as the recession took hold in 2008 and 2009 and was unable to fully rebound, with modest job losses again in 2010. Since 2007, jobs in this subsector have declined by 4.2 percent, a rate still below that of the overall private sector (-6.9 percent). Despite the recent contraction, employment overall is up since 2001 by nearly 25,000 jobs or 6 percent.
Three major components, each relatively distinct in its product focus, comprise the bioscience-related distribution sector—drugs and sundries; medical, dental, and hospital equipment and supplies; and farm supplies. Battelle has developed methodology to isolate only those pieces of each distinct component that most closely relate to biosciences, specifically, removing sundries from drugs distribution; and only including agricultural seeds and chemicals from farm supplies. Medical, dental, and hospital equipment is the largest individual component, accounting for 43 percent of subsector jobs and the sole source of the net job gains over the decade—the sector increased by 24 percent overall since 2001.
State Leaders & Highlights
EMPLOYMENT SIZE: Employment in the bioscience-distribution subsector is widely distributed with 12 states having a specialized concentration and eight others with a location quotient that is well concentrated. The top ten states in the subsector combine to employ just 54 percent.
Large States: California, Florida, Texas, Illinois
Sizable States: Ohio, New Jersey, Pennsylvania, New York, Tennessee, North Carolina
EMPLOYMENT CONCENTRATION: Eleven states and Puerto Rico have a specialized concentration of jobs in the bioscience-related distribution subsector.
Specialized States: Puerto Rico, Iowa, North Dakota, Nebraska, Tennessee, South Dakota, Delaware, Idaho, Illinois, New Jersey, Florida, Indiana
Concentrated States: Minnesota, Arizona, Wisconsin, Kansas, Ohio, Kentucky, North Carolina, Colorado
EMPLOYMENT GROWTH: From 2007–10, 13 states experienced some increase in subsector jobs with Texas and Arizona having substantial increases.
LARGE and SPECIALIZED STATES: Two states have both a large employment base and a specialized concentration of jobs in bioscience-related distribution (Table 8).
Table 8. States with Large and Specialized Employment in Bioscience-Related Distribution, 2010
Source: Battelle analysis of BLS, QCEW data; enhanced file from IMPLAN.
State Establishments, 2010
Employment, 2010
Location Quotient,
2010
Share of U.S.
Employment Florida 2,982 34,514 1.39 7.8%Illinois 2,006 26,869 1.39 6.1%

● U.S. BIOSCIENCE SECTOR
Page
34
Industry Summary and Conclusion
The national bioscience sector, while not immune from cyclical impacts and the recent global recession, is a proven generator of quality, high-wage jobs. During the severe economic downturn of the late 2000s, the industry maintained a relatively steady position with modest job losses while other comparable knowledge-based industries and the overall private sector significantly lost their footing. By 2010, the early stage of the recovery found the biosciences leveling off and two of its five major subsectors again adding jobs. Total employment reached 1.61 million jobs with firms operating just over 70,000 establishments. Research, testing, and medical lab companies have continued to be the steady source of job growth even through the recession.
The biosciences represent an economic development opportunity for all states and regions across diverse markets. Each of the 50 states, the District of Columbia, and Puerto Rico have a presence in the bioscience industry, with a majority of states claiming at least one niche strength as indicated by a subsector specialization.
Highlights from the state-by-state industry employment analysis include:
In employment concentration, 34 states and Puerto Rico have an employment specialization in at least one of the five major bioscience subsectors. Remarkably, 18 states and Puerto Rico are specialized in two or more subsectors, suggesting clear spillover impacts into multiple areas of industry focus from this knowledge-based industry cluster. Indiana, New Jersey, and Puerto Rico have a specialization in four of the five subsectors, representing truly diverse strengths across the entire industry. No state is specialized in all five areas.
In size, 12 states and Puerto Rico have a large employment base (5 percent or more of national employment) in at least one subsector. Nine of those states—California, Illinois, Indiana, Florida, Massachusetts, New Jersey, New York, Pennsylvania, and Texas—have a large base in at least two subsectors. Just three of those—California, Illinois, and Indiana—have a large job base in three or more subsectors with California a large state in four of the five major subsectors.
Despite the difficult recession years, 22 states added jobs to their overall bioscience industry from 2007 through 2010 demonstrating the continued strength and resiliency of the industry.
By 2010, the early stage of the recovery found the biosciences leveling off and two of its five major subsectors again adding jobs.

BATTELLE/BIO STATE BIOSCIENCE INDUSTRY DEVELOPMENT 2012
Page
35
Appendix: Data & Methodology
Industry Employment, Establishments, and Wages
The bioscience industry employment analysis in this report examines national and state data and corresponding trends in the biosciences from 2001 through 2010. For employment analysis, Battelle used the Bureau of Labor Statistics (BLS) Quarterly Census of Employment and Wages (QCEW) data. The QCEW data (formerly known as the ES-202 program) provide the most current, detailed industry employment, establishment, and wage figures available at both a national and subnational level. Battelle receives an enhanced version of these data from a private vendor, the Minnesota IMPLAN Group, Inc.
The QCEW program is a cooperative program involving BLS and the State Employment Security Agencies (SESAs). The QCEW program produces a comprehensive tabulation of employment and wage information for workers covered by state unemployment insurance (UI) laws and federal workers covered by the Unemployment Compensation for Federal Employees (UCFE) program. Publicly available files include data on the number of establishments, monthly employment, and quarterly wages, by NAICS (North American Industry Classification System) industry, by county, and by ownership sector, for the entire United States. These data are aggregated to annual levels, to higher industry levels (NAICS industry groups, sectors, and supersectors), and to higher geographic levels (national, state, and metropolitan statistical area [MSA]).
Since 2001, the QCEW has been producing and publishing data according to the NAICS. Federal statistical agencies have a mandate to publish industry data according to this improved classification system. Compared with the prior classification system—the 1987 Standard Industrial Classification (SIC) system, NAICS better incorporates new and emerging industries. Employment, establishment, and wage data produced by the QCEW program for 2001 to present are not comparable with SIC-based industry data from prior years. This limits the ability to construct a longer time series for data analysis; however, 10 years of NAICS-based data (2001-2010) are now available.
Twenty-five NAICS industries at the most detailed (6-digit) level make up the updated Battelle definition of the biosciences and its subsectors. These detailed industries are aggregated up to five major subsectors of the bioscience industry. Four of the detailed NAICS industries, Testing Laboratories (NAICS 541380); R&D in the Physical, Engineering, and Life Sciences (NAICS 54171); Drug and Druggists’ Sundries Merchant Wholesalers (NAICS 424210); and Farm Supplies Merchant Wholesalers (NAICS 424910) are adjusted in this analysis by Battelle to include only the share of these industries directly involved in biological or other life science activities. To isolate these relevant life science components, Battelle used information and data from the U.S. Census Bureau’s Economic Census.
Much more than other sectors, the biosciences are dynamic and evolve with the latest research and scientific discoveries with tremendous widespread impact on food, medicine, and the environment. In light of this substantive evolvement as well as the nature in which the North American Industry Classification System (NAICS) has also evolved in its interpretation and use by companies as well as state and federal statistical systems, Battelle and BIO have worked to re-examine and re-evaluate the NAICS-based definition used in this report.

● U.S. BIOSCIENCE SECTOR
Page
36
The updated NAICS definition of the bioscience industry is presented in figure A-1 along with a crosswalk to show the changes made from prior Battelle-BIO reports.
Figure A-1. The Bioscience Industry, Revised for 2012
*Includes only the portion of these industries engaged in relevant life science activities.
National and state data were tabulated and presented in both summary analytical and state profile tables in the following section of the report. Data for Puerto Rico and the District of Columbia are included in this report at both the “state” and national level. U.S. employment, establishment, and wage totals in this report reflect the sum of all state data and include both Puerto Rico and DC. All state and DC data are from the Minnesota IMPLAN Group; data for Puerto Rico are directly from BLS.
NAICS Code NAICS Description
Included in Prior Battelle-BIO Definition
Included in Updated Industry Definition, 2012
AGRICULTURAL FEEDSTOCK & CHEMICALS
311221 Wet Corn Milling
311222 Soybean Processing
311223 Other Oilseed Processing
325193 Ethyl Alcohol Manufacturing
325199 All Other Basic Organic Chemical Manufacturing
325221 Cellulosic Organic Fiber Manufacturing
325311 Nitrogenous Fertilizer Manufacturing
325312 Phosphatic Fertilizer Manufacturing
325314 Fertilizer (Mixing Only) Manufacturing
325320 Pesticide and Other Agricultural Chemical Manufacturing
DRUGS & PHARMACEUTICALS325411 Medicinal and Botanical Manufacturing
325412 Pharmaceutical Preparation Manufacturing
325413 In-Vitro Diagnostic Substance Manufacturing
325414 Biological Product (except Diagnostic) Manufacturing
MEDICAL DEVICES & EQUIPMENT334510 Electromedical and Electrotherapeutic Apparatus Manufacturing
334516 Analytical Laboratory Instrument Manufacturing
334517 Irradiation Apparatus Manufacturing
339112 Surgical and Medical Instrument Manufacturing
339113 Surgical Appliance and Supplies Manufacturing
339114 Dental Equipment and Supplies Manufacturing
339115 Ophthalmic Goods Manufacturing
339116 Dental Laboratories
RESEARCH, TESTING, & MEDICAL LABORATORIES541380* Testing Laboratories
54171* Research and Development in the Physical, Engineering, and Life Sciences
621511 Medical Laboratories
621512 Diagnostic Imaging Centers
BIOSCIENCE-RELATED DISTRIBUTION423450 Medical, Dental, and Hospital Equipment and Supplies Merchant Wholesalers
424210* Drugs and Druggists' Sundries Merchant Wholesalers
424910* Farm Supplies Merchant Wholesalers

BATTELLE/BIO STATE BIOSCIENCE INDUSTRY DEVELOPMENT 2012
Page
37
For more information on the BLS Quarterly Census of Employment and Wages, see http://www.bls.gov/cew/home.htm.
Employment multipliers from the Bureau of Economic Analysis (BEA) were used to estimate the employment impact on all other industries of adding bioscience jobs at both the state and national levels. BEA’s Regional Input-Output Modeling System (RIMS II) is based on an Input-Output (I-O) table in an accounting framework. I-O tables are calculated for each industry and show the distribution of inputs purchased and outputs sold. These tables are derived from two major data sources: BEA’s national I-O table for almost 500 U.S. industries and BEA’s regional economic accounts used to adjust the data for a region’s industrial structure and trading patterns. It is important to note that, like all impact models, RIMS provides an approximate order-of-magnitude estimate of impacts, and the multipliers are best used to estimate impacts of small changes on a regional economy.
National employment impact analysis in this report is no longer comparable with that from prior editions due to both a change in the industry definition as well as changes in BEA methodology. BEA no longer calculates employment multipliers at the national level which had included interstate activity; therefore, the U.S. multipliers presented here for the bioscience industry are lower and no longer comparable with those from prior Battelle/BIO reports.
Multipliers and the resulting employment impacts are shown in each state profile table, for each major bioscience subsector. BEA does not provide employment multipliers for Puerto Rico.
For more information on the Bureau of Economic Analysis RIMS II Multipliers, see http://www.bea.gov/regional/rims/index.cfm.
In the time series analysis of earnings estimates in this report, the Consumer Price Index for All Urban Consumers (CPI-U) was used to adjust for inflation. The Consumer Price Index is a measure of the average change in prices over time of goods and services purchased by households.

● U.S. BIOSCIENCE SECTOR
Page
38

BATTELLE/BIO STATE BIOSCIENCE INDUSTRY DEVELOPMENT 2012
Page
39
Bioscience Industry State Profiles

ALA
BAM
A
Battelle/BIO State Bioscience Industry Development 2012
AL ALABAMA ● Alabama employs
nearly 12,000 in the biosciences
across more than 600 individual
establishments. The state has
a specialized employment
concentration in the
agricultural feedstock and
chemicals subsector with
39 percent more jobs in the
agbiosciences relative to its
private sector compared with
the national average in 2010
(location quotient of 1.39).
Bioscience Summary of State Performance Employment Tier in Industry Related Metrics
Metrics Alabama United States Rank* Bioscience Industry, 2010 Total Bioscience Industry Employment 11,945 1,605,533 III
Bioscience Industry Location Quotient 0.55 n/a IV
Biosciences Industry Establishments 607 70,006 IV
*State ranking figures for bioscience industry employment metrics are calculated as quintiles (I=Top Quintile; V=Bottom Quintile).
70
80
90
100
110
120
130
2001 2002 2003 2004 2005 2006 2007 2008 2009 2010
Em
plo
yme
nt I
ndex
(2
001
= 1
00)
Alabama Bioscience Industry
Alabama Total Private Sector

Bioscience Industry Base, 2010
Alabama Highlights:
Alabama United States INDUSTRY SUBSECTOR 2010 2001–10
Change 2007–10 Change 2010 2001–10
Change 2007–10 Change
AGRICULTURAL FEEDSTOCK & CHEMICALS Establishments 26 -26.2% -7.1% 1,760 2.2% 4.5% Employment 1,374 -53.0% -29.9% 72,988 -5.9% -5.5% Location Quotient 1.39 n/a Direct-Effect Employment Multiplier 5.1 5.6 Total Employment Impact 7,027 405,197 Average Annual Wage (constant 2010 dollars) $70,606 -1.0% 0.5% $70,869 8.7% 1.5%
DRUGS & PHARMACEUTICALS Establishments 15 15.4% -6.3% 2,908 11.3% 6.5% Employment 993 246.0% 40.9% 296,759 -3.1% -7.0% Location Quotient 0.25 n/a Direct-Effect Employment Multiplier 2.9 5.3
Total Employment Impact 2,922 1,464,492 Average Annual Wage (constant 2010 dollars) $56,014 12.6% 12.0% $99,486 15.3% 1.1%
MEDICAL DEVICES & EQUIPMENT Establishments 49 -13.1% 0.0% 6,957 11.7% 7.7% Employment 1,440 -29.9% -31.5% 343,468 -0.3% -0.8% Location Quotient 0.31 n/a Direct-Effect Employment Multiplier 2.1 2.9 Total Employment Impact 2,956 956,767 Average Annual Wage (constant 2010 dollars) $44,619 5.6% 0.4% $72,301 13.9% 1.0%
RESEARCH, TESTING, & MEDICAL LABORATORIES Establishments 193 30.4% 9.1% 22,212 48.9% 20.1% Employment 3,751 -8.7% 21.8% 451,923 23.8% 6.1% Location Quotient 0.61 n/a Direct-Effect Employment Multiplier 2.4 2.6 Total Employment Impact 9,091 1,178,741 Average Annual Wage (constant 2010 dollars) $65,107 9.5% 4.7% $84,065 12.3% 1.5%
BIOSCIENCE-RELATED DISTRIBUTION Establishments 324 -45.7% -24.4% 36,170 -1.1% -0.3% Employment 4,387 -35.5% -21.0% 440,394 6.0% -4.2% Location Quotient 0.74 n/a Direct-Effect Employment Multiplier 2.2 2.4 Total Employment Impact Multiplier 9,848 1,046,594 Average Annual Wage (constant 2010 dollars) $74,177 17.2% 3.8% $80,049 12.2% -0.4%
TOTAL BIOSCIENCE INDUSTRY Establishments 607 -28.5% -13.1% 70,006 12.8% 6.7% Employment 11,945 -26.2% -10.9% 1,605,533 6.4% -1.4% Location Quotient 0.55 n/a Direct-Effect Employment Multiplier 2.7 3.2 Total Employment Impact 31,844 5,051,791 Average Annual Wage (constant 2010 dollars) $65,845 8.2% 3.2% $82,697 13.1% 0.6% TOTAL PRIVATE SECTOR
Establishments 109,932 3.3% -3.1% 8,752,494 12.5% 0.1% Employment 1,443,743 -5.0% -9.3% 106,863,403 -2.9% -6.9% Average Annual Wage (constant 2010 dollars) $47,137 8.0% 1.9% $46,317 4.4% -0.4%
Note: U.S. employment metrics include Puerto Rico. Estimates of total employment impacts do not include Puerto Rico.
Employment, Establishment, and Wage Data: U.S. Bureau of Labor Statistics, Quarterly Census of Employment and Wages (QCEW); enhanced file from IMPLAN.
Employment Multipliers: U.S. Bureau of Economic Analysis RIMS II Employment Multipliers, 2008 (most current available).

ALA
SKA
Battelle/BIO State Industry Development 2012
AK ALASKA ● Alaska’s bioscience
industry employs more than
700 spanning 107 individual
establishments. The state
subsector with the largest
employment is research,
testing, and medical
laboratories with just over
300 jobs in 2010. While the
industry is modest in size, it
has experienced job growth in
recent years and pays average
wages significantly above
those for the overall private
sector.
Bioscience Summary of State Performance Employment Tier in Industry Related Metrics
Metrics Alaska United States Rank* Bioscience Industry, 2010 Total Bioscience Industry Employment 735 1,605,533 V
Bioscience Industry Location Quotient 0.21 n/a V
Biosciences Industry Establishments 107 70,006 V
*State ranking figures for bioscience industry employment metrics are calculated as quintiles (I=Top Quintile; V=Bottom Quintile).
85
90
95
100
105
110
115
2001 2002 2003 2004 2005 2006 2007 2008 2009 2010
Em
plo
yme
nt I
ndex
(2
001
= 1
00)
Alaska Bioscience Industry
Alaska Total Private Sector

Bioscience Industry Base, 2010
Alaska Highlights:
Alaska United States INDUSTRY SUBSECTOR 2010 2001–10
Change 2007–10 Change 2010 2001–10
Change 2007–10 Change
AGRICULTURAL FEEDSTOCK & CHEMICALS Establishments 3 17.9% 200.0% 1,760 2.2% 4.5% Employment 26 -89.8% 64.5% 72,988 -5.9% -5.5% Location Quotient 0.16 n/a Direct-Effect Employment Multiplier 4.2 5.6 Total Employment Impact 108 405,197 Average Annual Wage (constant 2010 dollars) $75,762 -10.4% -13.0% $70,869 8.7% 1.5%
DRUGS & PHARMACEUTICALS Establishments 0 -100.0% -100.0% 2,908 11.3% 6.5% Employment 0 -100.0% -100.0% 296,759 -3.1% -7.0% Location Quotient 0.00 n/a Direct-Effect Employment Multiplier 0.0 5.3
Total Employment Impact 0 1,464,492 Average Annual Wage (constant 2010 dollars) $0 -100.0% -100.0% $99,486 15.3% 1.1%
MEDICAL DEVICES & EQUIPMENT Establishments 11 450.0% 57.1% 6,957 11.7% 7.7% Employment 71 1805.9% 27.8% 343,468 -0.3% -0.8% Location Quotient 0.09 n/a Direct-Effect Employment Multiplier 1.3 2.9 Total Employment Impact 94 956,767 Average Annual Wage (constant 2010 dollars) $73,836 53.8% 4.5% $72,301 13.9% 1.0%
RESEARCH, TESTING, & MEDICAL LABORATORIES Establishments 52 98.3% 18.1% 22,212 48.9% 20.1% Employment 324 39.7% 17.8% 451,923 23.8% 6.1% Location Quotient 0.32 n/a Direct-Effect Employment Multiplier 1.8 2.6 Total Employment Impact 573 1,178,741 Average Annual Wage (constant 2010 dollars) $50,107 -6.2% 0.6% $84,065 12.3% 1.5%
BIOSCIENCE-RELATED DISTRIBUTION Establishments 41 22.3% 26.1% 36,170 -1.1% -0.3% Employment 314 29.8% -1.5% 440,394 6.0% -4.2% Location Quotient 0.32 n/a Direct-Effect Employment Multiplier 1.8 2.4 Total Employment Impact Multiplier 550 1,046,594 Average Annual Wage (constant 2010 dollars) $58,421 0.8% 7.6% $80,049 12.2% -0.4%
TOTAL BIOSCIENCE INDUSTRY Establishments 107 64.9% 25.1% 70,006 12.8% 6.7% Employment 735 0.5% 2.4% 1,605,533 6.4% -1.4% Location Quotient 0.21 n/a Direct-Effect Employment Multiplier 1.8 3.2 Total Employment Impact 1,324 5,051,791 Average Annual Wage (constant 2010 dollars) $56,862 -13.5% -5.2% $82,697 13.1% 0.6% TOTAL PRIVATE SECTOR
Establishments 19,212 9.5% 0.6% 8,752,494 12.5% 0.1% Employment 237,543 13.3% 1.4% 106,863,403 -2.9% -6.9% Average Annual Wage (constant 2010 dollars) $39,267 9.4% 4.2% $46,317 4.4% -0.4%
Note: U.S. employment metrics include Puerto Rico. Estimates of total employment impacts do not include Puerto Rico.
Employment, Establishment, and Wage Data: U.S. Bureau of Labor Statistics, Quarterly Census of Employment and Wages (QCEW); enhanced file from IMPLAN.
Employment Multipliers: U.S. Bureau of Economic Analysis RIMS II Employment Multipliers, 2008 (most current available).

ARIZ
ON
A
Battelle/BIO State Bioscience Industry Development 2012
AZ ARIZONA ● Arizona’s bioscience industry continues to grow at a rapid rate. Industry firms have increased employment by 30 percent overall since 2001 and have even added jobs since 2007, a period which includes the deep national recession. These growth rates continue to outpace those for the national bioscience sector. Since 2001, all five major subsectors have experienced net job growth in the state, led by research, testing, and medical labs which has grown its employ-ment base by more than 50 percent since 2001. The state is well concentrated in bioscience-related distribution with a location quotient of 1.10.
Bioscience Summary of State Performance Employment Tier in Industry Related Metrics
Metrics Arizona United States Rank* Bioscience Industry, 2010 Total Bioscience Industry Employment 21,084 1,605,533 III
Bioscience Industry Location Quotient 0.72 n/a IV
Biosciences Industry Establishments 1,219 70,006 III
*State ranking figures for bioscience industry employment metrics are calculated as quintiles (I=Top Quintile; V=Bottom Quintile).
60
70
80
90
100
110
120
130
140
2001 2002 2003 2004 2005 2006 2007 2008 2009 2010
Em
plo
yme
nt I
ndex
(2
001
= 1
00)
Arizona Bioscience Industry
Arizona Total Private Sector

Bioscience Industry Base, 2010
Arizona Highlights:
Arizona United States INDUSTRY SUBSECTOR 2010 2001–10
Change 2007–10 Change 2010 2001–10
Change 2007–10 Change
AGRICULTURAL FEEDSTOCK & CHEMICALS Establishments 18 -39.1% 5.9% 1,760 2.2% 4.5% Employment 538 2.7% -2.7% 72,988 -5.9% -5.5% Location Quotient 0.40 n/a Direct-Effect Employment Multiplier 3.9 5.6 Total Employment Impact 2,072 405,197 Average Annual Wage (constant 2010 dollars) $44,801 17.2% 5.9% $70,869 8.7% 1.5%
DRUGS & PHARMACEUTICALS Establishments 38 35.7% 5.6% 2,908 11.3% 6.5% Employment 1,181 5.0% 6.6% 296,759 -3.1% -7.0% Location Quotient 0.22 n/a Direct-Effect Employment Multiplier 3.3 5.3
Total Employment Impact 3,842 1,464,492 Average Annual Wage (constant 2010 dollars) $49,788 -11.2% -24.3% $99,486 15.3% 1.1%
MEDICAL DEVICES & EQUIPMENT Establishments 90 3.9% -4.3% 6,957 11.7% 7.7% Employment 3,890 25.8% -0.4% 343,468 -0.3% -0.8% Location Quotient 0.62 n/a Direct-Effect Employment Multiplier 2.3 2.9 Total Employment Impact 8,913 956,767 Average Annual Wage (constant 2010 dollars) $62,010 13.3% 6.1% $72,301 13.9% 1.0%
RESEARCH, TESTING, & MEDICAL LABORATORIES Establishments 319 46.3% 23.2% 22,212 48.9% 20.1% Employment 6,613 53.3% 19.4% 451,923 23.8% 6.1% Location Quotient 0.80 n/a Direct-Effect Employment Multiplier 2.2 2.6 Total Employment Impact 14,755 1,178,741 Average Annual Wage (constant 2010 dollars) $60,751 11.3% -0.5% $84,065 12.3% 1.5%
BIOSCIENCE-RELATED DISTRIBUTION Establishments 754 -20.1% -10.0% 36,170 -1.1% -0.3% Employment 8,862 24.0% 7.3% 440,394 6.0% -4.2% Location Quotient 1.10 n/a Direct-Effect Employment Multiplier 2.3 2.4 Total Employment Impact Multiplier 20,606 1,046,594 Average Annual Wage (constant 2010 dollars) $87,671 20.2% -18.6% $80,049 12.2% -0.4%
TOTAL BIOSCIENCE INDUSTRY Establishments 1,219 -6.6% -2.0% 70,006 12.8% 6.7% Employment 21,084 30.1% 8.9% 1,605,533 6.4% -1.4% Location Quotient 0.72 n/a Direct-Effect Employment Multiplier 2.4 3.2 Total Employment Impact 50,187 5,051,791 Average Annual Wage (constant 2010 dollars) $71,277 14.5% -11.1% $82,697 13.1% 0.6% TOTAL PRIVATE SECTOR
Establishments 142,619 21.9% -8.8% 8,752,494 12.5% 0.1% Employment 1,958,224 3.5% -12.9% 106,863,403 -2.9% -6.9% Average Annual Wage (constant 2010 dollars) $35,702 5.0% -0.7% $46,317 4.4% -0.4%
Note: U.S. employment metrics include Puerto Rico. Estimates of total employment impacts do not include Puerto Rico.
Employment, Establishment, and Wage Data: U.S. Bureau of Labor Statistics, Quarterly Census of Employment and Wages (QCEW); enhanced file from IMPLAN.
Employment Multipliers: U.S. Bureau of Economic Analysis RIMS II Employment Multipliers, 2008 (most current available).

ARKAN
SAS
Battelle/BIO State Bioscience Industry Development 2012
AR ARKANSAS ● Arkansas’
bioscience industry employs
more than 6,200 across 618
individual business
establishments. Two of the
five major industry subsectors
have experienced job growth
in recent years—drugs and
pharmaceuticals which has a
small base in the state but has
added jobs; and research,
testing, and medical labs
which represents nearly 1,200
jobs and has grown by 14
percent overall since 2001.
Bioscience Summary of State Performance Employment Tier in Industry Related Metrics
Metrics Arkansas United States Rank* Bioscience Industry, 2010 Total Bioscience Industry Employment 6,223 1,605,533 IV
Bioscience Industry Location Quotient 0.45 n/a V
Biosciences Industry Establishments 618 70,006 IV
*State ranking figures for bioscience industry employment metrics are calculated as quintiles (I=Top Quintile; V=Bottom Quintile).
60
70
80
90
100
110
120
130
140
2001 2002 2003 2004 2005 2006 2007 2008 2009 2010
Em
plo
ymen
t In
dex
(20
01 =
100
)
Arkansas Bioscience Industry
Arkansas Total Private Sector

Bioscience Industry Base, 2010
Arkansas Highlights:
Arkansas United States INDUSTRY SUBSECTOR 2010 2001–10
Change 2007–10 Change 2010 2001–10
Change 2007–10 Change
AGRICULTURAL FEEDSTOCK & CHEMICALS Establishments 21 -38.5% -19.2% 1,760 2.2% 4.5% Employment 517 -62.6% -32.2% 72,988 -5.9% -5.5% Location Quotient 0.82 n/a Direct-Effect Employment Multiplier 5.2 5.6 Total Employment Impact 2,670 405,197 Average Annual Wage (constant 2010 dollars) $53,375 9.9% 14.4% $70,869 8.7% 1.5%
DRUGS & PHARMACEUTICALS Establishments 13 85.7% -18.8% 2,908 11.3% 6.5% Employment 173 63.2% 21.8% 296,759 -3.1% -7.0% Location Quotient 0.07 n/a Direct-Effect Employment Multiplier 2.7 5.3
Total Employment Impact 460 1,464,492 Average Annual Wage (constant 2010 dollars) $42,823 20.9% 14.1% $99,486 15.3% 1.1%
MEDICAL DEVICES & EQUIPMENT Establishments 34 1.4% -12.8% 6,957 11.7% 7.7% Employment 608 -81.9% -63.9% 343,468 -0.3% -0.8% Location Quotient 0.20 n/a Direct-Effect Employment Multiplier 1.8 2.9 Total Employment Impact 1,103 956,767 Average Annual Wage (constant 2010 dollars) $46,899 30.7% 20.3% $72,301 13.9% 1.0%
RESEARCH, TESTING, & MEDICAL LABORATORIES Establishments 121 35.1% 21.4% 22,212 48.9% 20.1% Employment 1,196 14.4% 4.4% 451,923 23.8% 6.1% Location Quotient 0.31 n/a Direct-Effect Employment Multiplier 1.8 2.6 Total Employment Impact 2,175 1,178,741 Average Annual Wage (constant 2010 dollars) $54,330 17.4% 7.7% $84,065 12.3% 1.5%
BIOSCIENCE-RELATED DISTRIBUTION Establishments 429 -0.1% 5.4% 36,170 -1.1% -0.3% Employment 3,728 -10.6% -4.5% 440,394 6.0% -4.2% Location Quotient 0.98 n/a Direct-Effect Employment Multiplier 2.0 2.4 Total Employment Impact Multiplier 7,625 1,046,594 Average Annual Wage (constant 2010 dollars) $45,733 15.2% 4.9% $80,049 12.2% -0.4%
TOTAL BIOSCIENCE INDUSTRY Establishments 618 4.1% 5.2% 70,006 12.8% 6.7% Employment 6,223 -38.2% -18.6% 1,605,533 6.4% -1.4% Location Quotient 0.45 n/a Direct-Effect Employment Multiplier 2.3 3.2 Total Employment Impact 14,034 5,051,791 Average Annual Wage (constant 2010 dollars) $48,054 19.3% 9.7% $82,697 13.1% 0.6% TOTAL PRIVATE SECTOR
Establishments 80,779 17.5% 2.6% 8,752,494 12.5% 0.1% Employment 928,309 -1.8% -4.9% 106,863,403 -2.9% -6.9% Average Annual Wage (constant 2010 dollars) $42,858 7.7% 0.7% $46,317 4.4% -0.4%
Note: U.S. employment metrics include Puerto Rico. Estimates of total employment impacts do not include Puerto Rico.
Employment, Establishment, and Wage Data: U.S. Bureau of Labor Statistics, Quarterly Census of Employment and Wages (QCEW); enhanced file from IMPLAN.
Employment Multipliers: U.S. Bureau of Economic Analysis RIMS II Employment Multipliers, 2008 (most current available).

CALI
FORN
IA
Battelle/BIO State Bioscience Industry Development 2012
CA CALIFORNIA ● California has
the largest state bioscience
employment base with more
than 228,000 jobs, a figure
which has steadily grown and
outpaced the nation. The state
has a specialized concentration
of jobs in three of the five
major bioscience subsectors
and in the industry overall
(bioscience location quotient of
1.26). Its largest subsector—
research, testing, and medical
labs, has increased
employment by 36 percent
since 2001 and maintained
strong job growth even during
the recent recession years.
Bioscience Summary of State Performance Employment Tier in Industry Related Metrics
Metrics California United States Rank* Bioscience Industry, 2010 Total Bioscience Industry Employment 228,700 1,605,533 I
Bioscience Industry Location Quotient 1.26 n/a I
Biosciences Industry Establishments 7,468 70,006 I
*State ranking figures for bioscience industry employment metrics are calculated as quintiles (I=Top Quintile; V=Bottom Quintile).
85
90
95
100
105
110
115
2001 2002 2003 2004 2005 2006 2007 2008 2009 2010
Em
plo
ymen
t In
dex
(20
01 =
100
)
California Bioscience Industry
California Total Private Sector

Bioscience Industry Base, 2010
California Highlights:
California United States INDUSTRY SUBSECTOR 2010 2001–10
Change 2007–10 Change 2010 2001–10
Change 2007–10 Change
AGRICULTURAL FEEDSTOCK & CHEMICALS Establishments 126 -26.0% -4.5% 1,760 2.2% 4.5% Employment 2,645 -31.6% -11.2% 72,988 -5.9% -5.5% Location Quotient 0.32 n/a Direct-Effect Employment Multiplier 4.3 5.6 Total Employment Impact 11,247 405,197 Average Annual Wage (constant 2010 dollars) $58,748 16.1% 5.0% $70,869 8.7% 1.5%
DRUGS & PHARMACEUTICALS Establishments 466 7.9% 19.5% 2,908 11.3% 6.5% Employment 43,162 10.2% -1.8% 296,759 -3.1% -7.0% Location Quotient 1.29 n/a Direct-Effect Employment Multiplier 5.9 5.3
Total Employment Impact 256,362 1,464,492 Average Annual Wage (constant 2010 dollars) $114,273 14.0% -1.5% $99,486 15.3% 1.1%
MEDICAL DEVICES & EQUIPMENT Establishments 995 -11.8% 3.3% 6,957 11.7% 7.7% Employment 59,450 -7.1% -2.5% 343,468 -0.3% -0.8% Location Quotient 1.54 n/a Direct-Effect Employment Multiplier 3.3 2.9 Total Employment Impact 194,392 956,767 Average Annual Wage (constant 2010 dollars) $88,843 13.6% -2.4% $72,301 13.9% 1.0%
RESEARCH, TESTING, & MEDICAL LABORATORIES Establishments 2,986 44.5% 18.4% 22,212 48.9% 20.1% Employment 75,907 36.3% 13.8% 451,923 23.8% 6.1% Location Quotient 1.49 n/a Direct-Effect Employment Multiplier 3.0 2.6 Total Employment Impact 226,607 1,178,741 Average Annual Wage (constant 2010 dollars) $102,451 18.1% 4.4% $84,065 12.3% 1.5%
BIOSCIENCE-RELATED DISTRIBUTION Establishments 2,895 15.7% 6.0% 36,170 -1.1% -0.3% Employment 47,535 19.9% -3.5% 440,394 6.0% -4.2% Location Quotient 0.96 n/a Direct-Effect Employment Multiplier 2.5 2.4 Total Employment Impact Multiplier 116,813 1,046,594 Average Annual Wage (constant 2010 dollars) $84,760 10.3% -4.1% $80,049 12.2% -0.4%
TOTAL BIOSCIENCE INDUSTRY Establishments 7,468 18.6% 10.8% 70,006 12.8% 6.7% Employment 228,700 13.0% 2.2% 1,605,533 6.4% -1.4% Location Quotient 1.26 n/a Direct-Effect Employment Multiplier 3.5 3.2 Total Employment Impact 805,421 5,051,791 Average Annual Wage (constant 2010 dollars) $96,962 15.4% -0.1% $82,697 13.1% 0.6% TOTAL PRIVATE SECTOR
Establishments 1,301,372 25.6% 3.0% 8,752,494 12.5% 0.1% Employment 12,047,390 -4.9% -8.9% 106,863,403 -2.9% -6.9% Average Annual Wage (constant 2010 dollars) $52,536 4.1% 0.0% $46,317 4.4% -0.4%
Note: U.S. employment metrics include Puerto Rico. Estimates of total employment impacts do not include Puerto Rico.
Employment, Establishment, and Wage Data: U.S. Bureau of Labor Statistics, Quarterly Census of Employment and Wages (QCEW); enhanced file from IMPLAN.
Employment Multipliers: U.S. Bureau of Economic Analysis RIMS II Employment Multipliers, 2008 (most current available).

CO
LORAD
O
Battelle/BIO State Bioscience Industry Development 2012
CO COLORADO ● Colorado’s
bioscience industry is large
and has outpaced national
growth since 2001 by
continuing to add jobs overall
since 2007. Its companies
employ nearly 27,000 with
the large and highly
specialized state medical
device and equipment
subsector growing by 16
percent since 2001. Job
growth in research, testing,
and medical labs has also
driven overall sector growth
since 2001.
Bioscience Summary of State Performance Employment Tier in Industry Related Metrics
Metrics Colorado United States Rank* Bioscience Industry, 2010 Total Bioscience Industry Employment 26,830 1,605,533 II
Bioscience Industry Location Quotient 0.99 n/a II
Biosciences Industry Establishments 1,519 70,006 II
*State ranking figures for bioscience industry employment metrics are calculated as quintiles (I=Top Quintile; V=Bottom Quintile).
85
90
95
100
105
110
115
2001 2002 2003 2004 2005 2006 2007 2008 2009 2010
Em
plo
ymen
t In
dex
(20
01 =
100
)Colorado Bioscience Industry
Colorado Total Private Sector

Bioscience Industry Base, 2010
Colorado Highlights:
Colorado United States INDUSTRY SUBSECTOR 2010 2001–10
Change 2007–10 Change 2010 2001–10
Change 2007–10 Change
AGRICULTURAL FEEDSTOCK & CHEMICALS Establishments 27 59.0% 28.6% 1,760 2.2% 4.5% Employment 388 46.9% 15.6% 72,988 -5.9% -5.5% Location Quotient 0.32 n/a Direct-Effect Employment Multiplier 4.7 5.6 Total Employment Impact 1,845 405,197 Average Annual Wage (constant 2010 dollars) $54,990 11.9% -8.8% $70,869 8.7% 1.5%
DRUGS & PHARMACEUTICALS Establishments 48 -11.1% -9.4% 2,908 11.3% 6.5% Employment 2,930 -0.5% -5.5% 296,759 -3.1% -7.0% Location Quotient 0.59 n/a Direct-Effect Employment Multiplier 5.5 5.3
Total Employment Impact 16,124 1,464,492 Average Annual Wage (constant 2010 dollars) $87,196 18.7% 5.9% $99,486 15.3% 1.1%
MEDICAL DEVICES & EQUIPMENT Establishments 154 19.5% -1.3% 6,957 11.7% 7.7% Employment 9,138 16.1% 14.7% 343,468 -0.3% -0.8% Location Quotient 1.58 n/a Direct-Effect Employment Multiplier 3.0 2.9 Total Employment Impact 26,958 956,767 Average Annual Wage (constant 2010 dollars) $69,988 23.8% -0.9% $72,301 13.9% 1.0%
RESEARCH, TESTING, & MEDICAL LABORATORIES Establishments 512 65.5% 11.6% 22,212 48.9% 20.1% Employment 6,853 23.0% 1.9% 451,923 23.8% 6.1% Location Quotient 0.90 n/a Direct-Effect Employment Multiplier 3.1 2.6 Total Employment Impact 20,913 1,178,741 Average Annual Wage (constant 2010 dollars) $86,471 10.3% -8.9% $84,065 12.3% 1.5%
BIOSCIENCE-RELATED DISTRIBUTION Establishments 778 -26.0% -5.1% 36,170 -1.1% -0.3% Employment 7,521 0.3% 0.1% 440,394 6.0% -4.2% Location Quotient 1.01 n/a Direct-Effect Employment Multiplier 2.6 2.4 Total Employment Impact Multiplier 19,791 1,046,594 Average Annual Wage (constant 2010 dollars) $88,486 20.8% -3.0% $80,049 12.2% -0.4%
TOTAL BIOSCIENCE INDUSTRY Establishments 1,519 -2.6% 0.7% 70,006 12.8% 6.7% Employment 26,830 11.1% 4.6% 1,605,533 6.4% -1.4% Location Quotient 0.99 n/a Direct-Effect Employment Multiplier 3.2 3.2 Total Employment Impact 85,631 5,051,791 Average Annual Wage (constant 2010 dollars) $81,046 17.9% -3.9% $82,697 13.1% 0.6% TOTAL PRIVATE SECTOR
Establishments 168,177 11.3% -4.1% 8,752,494 12.5% 0.1% Employment 1,802,104 -3.8% -6.8% 106,863,403 -2.9% -6.9% Average Annual Wage (constant 2010 dollars) $47,917 1.8% -0.2% $46,317 4.4% -0.4%
Note: U.S. employment metrics include Puerto Rico. Estimates of total employment impacts do not include Puerto Rico.
Employment, Establishment, and Wage Data: U.S. Bureau of Labor Statistics, Quarterly Census of Employment and Wages (QCEW); enhanced file from IMPLAN.
Employment Multipliers: U.S. Bureau of Economic Analysis RIMS II Employment Multipliers, 2008 (most current available).

CO
NN
ECTI
CU
T
Battelle/BIO State Bioscience Industry Development 2012
CT CONNECTICUT ● Connecticut
has a specialized concentration
of jobs in the overall bioscience
industry and two of the five
major subsectors—medical
devices and equipment
(location quotient of 1.98) and
drugs and pharmaceuticals
(location quotient of 1.92).
Though the state sector has
contracted overall since 2001,
its medical device subsector
has experienced 2 percent job
growth since 2001 and has
even grown in recent years,
despite the economic
downturn.
Bioscience Summary of State Performance Employment Tier in Industry Related Metrics
*SState ranking figures for bioscience industry employment metrics are calculated as quintiles (I=Top Quintile; V=Bottom Quintile).
Metrics Connecticut United States Rank* Bioscience Industry, 2010 Total Bioscience Industry Employment 25,650 1,605,533 III
Bioscience Industry Location Quotient 1.26 n/a II
Biosciences Industry Establishments 868 70,006 III
85
90
95
100
105
110
115
2001 2002 2003 2004 2005 2006 2007 2008 2009 2010
Em
plo
yme
nt I
ndex
(2
001
= 1
00)
Connecticut Bioscience Industry
Connecticut Total Private Sector

Bioscience Industry Base, 2010
Connecticut Highlights:
Connecticut United States INDUSTRY SUBSECTOR 2010 2001–10
Change 2007–10 Change 2010 2001–10
Change 2007–10 Change
AGRICULTURAL FEEDSTOCK & CHEMICALS Establishments 10 -44.4% -9.1% 1,760 2.2% 4.5% Employment 316 17.8% 19.8% 72,988 -5.9% -5.5% Location Quotient 0.34 n/a Direct-Effect Employment Multiplier 3.7 5.6 Total Employment Impact 1,158 405,197 Average Annual Wage (constant 2010 dollars) $62,845 -54.9% -8.2% $70,869 8.7% 1.5%
DRUGS & PHARMACEUTICALS Establishments 36 24.1% 2.9% 2,908 11.3% 6.5% Employment 7,225 -33.1% -18.1% 296,759 -3.1% -7.0% Location Quotient 1.92 n/a Direct-Effect Employment Multiplier 5.2 5.3
Total Employment Impact 37,643 1,464,492 Average Annual Wage (constant 2010 dollars) $135,434 13.3% 4.2% $99,486 15.3% 1.1%
MEDICAL DEVICES & EQUIPMENT Establishments 134 0.8% -4.3% 6,957 11.7% 7.7% Employment 8,598 2.1% 1.6% 343,468 -0.3% -0.8% Location Quotient 1.98 n/a Direct-Effect Employment Multiplier 2.6 2.9 Total Employment Impact 22,496 956,767 Average Annual Wage (constant 2010 dollars) $67,677 -12.6% 9.0% $72,301 13.9% 1.0%
RESEARCH, TESTING, & MEDICAL LABORATORIES Establishments 366 22.2% 12.8% 22,212 48.9% 20.1% Employment 5,092 -9.5% -3.4% 451,923 23.8% 6.1% Location Quotient 0.89 n/a Direct-Effect Employment Multiplier 2.5 2.6 Total Employment Impact 12,636 1,178,741 Average Annual Wage (constant 2010 dollars) $98,919 21.4% -3.4% $84,065 12.3% 1.5%
BIOSCIENCE-RELATED DISTRIBUTION Establishments 322 -8.9% -2.0% 36,170 -1.1% -0.3% Employment 4,419 -4.2% -9.0% 440,394 6.0% -4.2% Location Quotient 0.79 n/a Direct-Effect Employment Multiplier 2.3 2.4 Total Employment Impact Multiplier 10,285 1,046,594 Average Annual Wage (constant 2010 dollars) $84,511 3.0% -2.3% $80,049 12.2% -0.4%
TOTAL BIOSCIENCE INDUSTRY Establishments 868 4.2% 3.5% 70,006 12.8% 6.7% Employment 25,650 -13.7% -7.3% 1,605,533 6.4% -1.4% Location Quotient 1.26 n/a Direct-Effect Employment Multiplier 3.3 3.2 Total Employment Impact 84,217 5,051,791 Average Annual Wage (constant 2010 dollars) $95,806 1.1% 0.1% $82,697 13.1% 0.6% TOTAL PRIVATE SECTOR
Establishments 107,406 2.6% -1.3% 8,752,494 12.5% 0.1% Employment 1,353,928 -5.3% -5.9% 106,863,403 -2.9% -6.9% Average Annual Wage (constant 2010 dollars) $60,394 2.8% -3.0% $46,317 4.4% -0.4%
Note: U.S. employment metrics include Puerto Rico. Estimates of total employment impacts do not include Puerto Rico.
Employment, Establishment, and Wage Data: U.S. Bureau of Labor Statistics, Quarterly Census of Employment and Wages (QCEW); enhanced file from IMPLAN.
Employment Multipliers: U.S. Bureau of Economic Analysis RIMS II Employment Multipliers, 2008 (most current available).

DEL
AW
ARE
Battelle/BIO State Bioscience Industry Development 2012
DE DELAWARE ● Delaware has a
diverse and highly specialized
concentration of jobs in its
bioscience industry. Three of
the five major state bioscience
subsectors show employment
specialization—medical devices
and equipment (location
quotient of 2.86); bioscience-
related distribution (LQ of
1.59); and research, testing,
and medical labs (LQ of 1.33).
Bioscience Summary of State Performance Employment Tier in Industry Related Metrics
Metrics Delaware United States Rank* Bioscience Industry, 2010 Total Bioscience Industry Employment 7,938 1,605,533 IV
Bioscience Industry Location Quotient 1.56 n/a I
Biosciences Industry Establishments 285 70,006 V *State ranking figures for bioscience industry employment metrics are calculated as quintiles (I=Top Quintile; V=Bottom Quintile).
75
80
85
90
95
100
105
110
115
120
125
2001 2002 2003 2004 2005 2006 2007 2008 2009 2010
Em
plo
ymen
t In
dex
(20
01 =
100
)
Delaware Bioscience Industry
Delaware Total Private Sector

Bioscience Industry Base, 2010
Delaware Highlights:
Delaware United States INDUSTRY SUBSECTOR 2010 2001–10
Change 2007–10 Change 2010 2001–10
Change 2007–10 Change
AGRICULTURAL FEEDSTOCK & CHEMICALS Establishments 5 66.7% 25.0% 1,760 2.2% 4.5% Employment 149 39.4% -59.1% 72,988 -5.9% -5.5% Location Quotient 0.64 n/a Direct-Effect Employment Multiplier 1.5 5.6 Total Employment Impact 219 405,197 Average Annual Wage (constant 2010 dollars) $74,421 42.9% -26.7% $70,869 8.7% 1.5%
DRUGS & PHARMACEUTICALS Establishments 13 225.0% 44.4% 2,908 11.3% 6.5% Employment 559 -33.3% -17.4% 296,759 -3.1% -7.0% Location Quotient 0.59 n/a Direct-Effect Employment Multiplier 2.6 5.3
Total Employment Impact 1,469 1,464,492 Average Annual Wage (constant 2010 dollars) $76,951 5.4% -7.6% $99,486 15.3% 1.1%
MEDICAL DEVICES & EQUIPMENT Establishments 35 75.0% 25.0% 6,957 11.7% 7.7% Employment 3,114 50.6% 21.4% 343,468 -0.3% -0.8% Location Quotient 2.86 n/a Direct-Effect Employment Multiplier 3.1 2.9 Total Employment Impact 9,648 956,767 Average Annual Wage (constant 2010 dollars) $86,681 34.8% -3.1% $72,301 13.9% 1.0%
RESEARCH, TESTING, & MEDICAL LABORATORIES Establishments 82 91.1% 23.7% 22,212 48.9% 20.1% Employment 1,903 -57.2% -28.6% 451,923 23.8% 6.1% Location Quotient 1.33 n/a Direct-Effect Employment Multiplier 2.8 2.6 Total Employment Impact 5,392 1,178,741 Average Annual Wage (constant 2010 dollars) $113,258 12.2% 5.3% $84,065 12.3% 1.5%
BIOSCIENCE-RELATED DISTRIBUTION Establishments 150 -34.6% 8.9% 36,170 -1.1% -0.3% Employment 2,213 3.7% -28.3% 440,394 6.0% -4.2% Location Quotient 1.59 n/a Direct-Effect Employment Multiplier 2.3 2.4 Total Employment Impact Multiplier 5,054 1,046,594 Average Annual Wage (constant 2010 dollars) $156,762 75.1% 28.5% $80,049 12.2% -0.4%
TOTAL BIOSCIENCE INDUSTRY Establishments 285 -4.9% 16.3% 70,006 12.8% 6.7% Employment 7,938 -17.3% -15.2% 1,605,533 6.4% -1.4% Location Quotient 1.56 n/a Direct-Effect Employment Multiplier 2.7 3.2 Total Employment Impact 21,783 5,051,791 Average Annual Wage (constant 2010 dollars) $111,674 27.6% 6.0% $82,697 13.1% 0.6% TOTAL PRIVATE SECTOR
Establishments 27,927 11.8% -6.0% 8,752,494 12.5% 0.1% Employment 338,854 -4.1% -7.0% 106,863,403 -2.9% -6.9% Average Annual Wage (constant 2010 dollars) $73,055 2.1% -2.0% $46,317 4.4% -0.4%
Note: U.S. employment metrics include Puerto Rico. Estimates of total employment impacts do not include Puerto Rico.
Employment, Establishment, and Wage Data: U.S. Bureau of Labor Statistics, Quarterly Census of Employment and Wages (QCEW); enhanced file from IMPLAN.
Employment Multipliers: U.S. Bureau of Economic Analysis RIMS II Employment Multipliers, 2008 (most current available).

Was
hing
ton,
D.C
.
Battelle/BIO State Bioscience Industry Development 2012
D.C. District of Columbia ●
Washington, D.C. bioscience
industry employment totaled
nearly 2,000 jobs in 2010
across 167 individual
establishments. Nearly all of
this employment is in the
service-based research,
testing, and medical labs
subsector which has shed jobs
in recent years. The District
has virtually no employment in
the more manufacturing-
oriented subsectors.
Bioscience Summary of State Performance Employment Tier in Industry Related Metrics
*State ranking figures for bioscience industry employment metrics are calculated as quintiles (I=Top Quintile; V=Bottom Quintile).
Metrics Washington D.C. United States Rank* Bioscience Industry, 2010 Total Bioscience Industry Employment 1,962 1,605,533 V
Bioscience Industry Location Quotient 0.29 n/a V
Biosciences Industry Establishments 167 70,006 V
50
60
70
80
90
100
110
120
130
140
150
2001 2002 2003 2004 2005 2006 2007 2008 2009 2010
Em
plo
yme
nt I
ndex
(2
001
= 1
00)
Washington D.C. Bioscience Industry
Washington D.C. Total Private Sector

Bioscience Industry Base, 2010
Washington, D.C. Highlights:
District of Columbia United States INDUSTRY SUBSECTOR 2010 2001–10
Change 2007–10 Change 2010 2001–10
Change 2007–10 Change
AGRICULTURAL FEEDSTOCK & CHEMICALS Establishments 2 -63.3% 0.0% 1,760 2.2% 4.5% Employment 5 -26.4% 6.8% 72,988 -5.9% -5.5% Location Quotient 0.02 n/a Direct-Effect Employment Multiplier 2.8 5.6 Total Employment Impact 15 405,197 Average Annual Wage (constant 2010 dollars) $211,599 86.3% -21.6% $70,869 8.7% 1.5%
DRUGS & PHARMACEUTICALS Establishments 10 -52.4% -28.6% 2,908 11.3% 6.5% Employment 121 -12.3% -6.9% 296,759 -3.1% -7.0% Location Quotient 0.10 n/a Direct-Effect Employment Multiplier 1.3 5.3
Total Employment Impact 155 1,464,492 Average Annual Wage (constant 2010 dollars) $212,917 -0.9% 2.6% $99,486 15.3% 1.1%
MEDICAL DEVICES & EQUIPMENT Establishments 3 -67.9% 50.0% 6,957 11.7% 7.7% Employment 9 -9.9% 25.8% 343,468 -0.3% -0.8% Location Quotient 0.01 n/a Direct-Effect Employment Multiplier 1.2 2.9 Total Employment Impact 11 956,767 Average Annual Wage (constant 2010 dollars) $112,107 15.5% -4.3% $72,301 13.9% 1.0%
RESEARCH, TESTING, & MEDICAL LABORATORIES Establishments 104 21.4% 16.4% 22,212 48.9% 20.1% Employment 1,681 -49.8% -28.9% 451,923 23.8% 6.1% Location Quotient 0.89 n/a Direct-Effect Employment Multiplier 1.8 2.6 Total Employment Impact 2,971 1,178,741 Average Annual Wage (constant 2010 dollars) $86,478 0.4% -1.6% $84,065 12.3% 1.5%
BIOSCIENCE-RELATED DISTRIBUTION Establishments 47 -0.9% -16.2% 36,170 -1.1% -0.3% Employment 145 -10.0% -50.6% 440,394 6.0% -4.2% Location Quotient 0.08 n/a Direct-Effect Employment Multiplier 1.5 2.4 Total Employment Impact Multiplier 224 1,046,594 Average Annual Wage (constant 2010 dollars) $184,048 53.3% 2.2% $80,049 12.2% -0.4%
TOTAL BIOSCIENCE INDUSTRY Establishments 167 -1.7% 1.5% 70,006 12.8% 6.7% Employment 1,962 -46.5% -29.9% 1,605,533 6.4% -1.4% Location Quotient 0.29 n/a Direct-Effect Employment Multiplier 1.7 3.2 Total Employment Impact 3,376 5,051,791 Average Annual Wage (constant 2010 dollars) $101,939 10.2% -1.5% $82,697 13.1% 0.6% TOTAL PRIVATE SECTOR
Establishments 34,373 21.9% 5.0% 8,752,494 12.5% 0.1% Employment 447,934 7.5% -0.2% 106,863,403 -2.9% -6.9% Average Annual Wage (constant 2010 dollars) $48,648 11.9% 0.5% $46,317 4.4% -0.4%
Note: U.S. employment metrics include Puerto Rico. Estimates of total employment impacts do not include Puerto Rico.
Employment, Establishment, and Wage Data: U.S. Bureau of Labor Statistics, Quarterly Census of Employment and Wages (QCEW); enhanced file from IMPLAN.
Employment Multipliers: U.S. Bureau of Economic Analysis RIMS II Employment Multipliers, 2008 (most current available).

FLO
RID
A
Battelle/BIO State Bioscience Industry Development 2012
FL FLORIDA ● Florida maintains
a large and diverse bioscience
industry, with more than
78,000 jobs that span 5,102
individual establishments.
The state industry has grown
overall by 19 percent since
2001 though it has experienced
a modest 1 percent job loss
since 2007. Florida has a
specialized employment
concentration in two of the
five major subsectors—
bioscience-related distribution
and agricultural feedstock and
chemicals.
Bioscience Summary of State Performance Employment Tier in Industry Related Metrics
Metrics Florida United States Rank*
Bioscience Industry, 2010 Total Bioscience Industry Employment 78,062 1,605,533 I
Bioscience Industry Location Quotient 0.86 n/a III
Biosciences Industry Establishments 5,102 70,006 I
*State ranking figures for bioscience industry employment metrics are calculated as quintiles (I=Top Quintile; V=Bottom Quintile).
70
80
90
100
110
120
130
2001 2002 2003 2004 2005 2006 2007 2008 2009 2010
Em
plo
yme
nt I
ndex
(2
001
= 1
00)
Florida Bioscience Industry
Florida Total Private Sector

Bioscience Industry Base, 2010
Florida Highlights:
Florida United States INDUSTRY SUBSECTOR 2010 2001–10
Change 2007–10 Change 2010 2001–10
Change 2007–10 Change
AGRICULTURAL FEEDSTOCK & CHEMICALS Establishments 110 30.4% 35.3% 1,760 2.2% 4.5% Employment 5,450 -5.3% 1.3% 72,988 -5.9% -5.5% Location Quotient 1.32 n/a Direct-Effect Employment Multiplier 5.0 5.6 Total Employment Impact 27,518 405,197 Average Annual Wage (constant 2010 dollars) $67,186 11.5% 7.5% $70,869 8.7% 1.5%
DRUGS & PHARMACEUTICALS Establishments 155 74.2% 47.6% 2,908 11.3% 6.5% Employment 5,182 21.6% 2.1% 296,759 -3.1% -7.0% Location Quotient 0.31 n/a Direct-Effect Employment Multiplier 3.4 5.3
Total Employment Impact 17,506 1,464,492 Average Annual Wage (constant 2010 dollars) $58,256 -11.9% -7.2% $99,486 15.3% 1.1%
MEDICAL DEVICES & EQUIPMENT Establishments 498 50.9% 32.1% 6,957 11.7% 7.7% Employment 16,237 7.3% -7.5% 343,468 -0.3% -0.8% Location Quotient 0.84 n/a Direct-Effect Employment Multiplier 2.4 2.9 Total Employment Impact 39,405 956,767 Average Annual Wage (constant 2010 dollars) $59,354 15.6% 6.1% $72,301 13.9% 1.0%
RESEARCH, TESTING, & MEDICAL LABORATORIES Establishments 1,357 73.7% 28.7% 22,212 48.9% 20.1% Employment 16,678 17.4% 6.9% 451,923 23.8% 6.1% Location Quotient 0.65 n/a Direct-Effect Employment Multiplier 2.3 2.6 Total Employment Impact 37,669 1,178,741 Average Annual Wage (constant 2010 dollars) $64,461 5.1% 2.0% $84,065 12.3% 1.5%
BIOSCIENCE-RELATED DISTRIBUTION Establishments 2,982 16.6% -0.5% 36,170 -1.1% -0.3% Employment 34,514 31.4% -2.2% 440,394 6.0% -4.2% Location Quotient 1.39 n/a Direct-Effect Employment Multiplier 2.4 2.4 Total Employment Impact Multiplier 83,700 1,046,594 Average Annual Wage (constant 2010 dollars) $82,493 9.4% -1.4% $80,049 12.2% -0.4%
TOTAL BIOSCIENCE INDUSTRY Establishments 5,102 32.8% 10.5% 70,006 12.8% 6.7% Employment 78,062 18.9% -1.1% 1,605,533 6.4% -1.4% Location Quotient 0.86 n/a Direct-Effect Employment Multiplier 2.6 3.2 Total Employment Impact 205,798 5,051,791 Average Annual Wage (constant 2010 dollars) $71,150 9.7% 0.7% $82,697 13.1% 0.6% TOTAL PRIVATE SECTOR
Establishments 586,095 30.6% -1.9% 8,752,494 12.5% 0.1% Employment 6,044,165 -1.8% -12.0% 106,863,403 -2.9% -6.9% Average Annual Wage (constant 2010 dollars) $40,558 6.1% -1.0% $46,317 4.4% -0.4%
Note: U.S. employment metrics include Puerto Rico. Estimates of total employment impacts do not include Puerto Rico.
Employment, Establishment, and Wage Data: U.S. Bureau of Labor Statistics, Quarterly Census of Employment and Wages (QCEW); enhanced file from IMPLAN.
Employment Multipliers: U.S. Bureau of Economic Analysis RIMS II Employment Multipliers, 2008 (most current available).

GEO
RG
IA
Battelle/BIO State Bioscience Industry Development 2012
GA GEORGIA ● Georgia’s
bioscience industry employs
nearly 28,000 across 1,640
establishments. Since 2001,
the sector has grown its
employment base by 6.5
percent overall, matching
national industry job growth.
The research, testing, and
medical labs subsector has
provided a source of steady
job gains, increasing by 28
percent overall since 2001 in
Georgia and maintaining
growth in recent years by
adding 4 percent to its
employment base since 2007.
Bioscience Summary of State Performance Employment Tier in Industry Related Metrics
Metrics Georgia United States Rank* Bioscience Industry, 2010 Total Bioscience Industry Employment 27,720 1,605,533 II
Bioscience Industry Location Quotient 0.60 n/a IV
Biosciences Industry Establishments 1,640 70,006 II
*State ranking figures for bioscience industry employment metrics are calculated as quintiles (I=Top Quintile; V=Bottom Quintile).
85
90
95
100
105
110
115
2001 2002 2003 2004 2005 2006 2007 2008 2009 2010
Em
plo
yme
nt I
ndex
(2
001
= 1
00)
Georgia Bioscience Industry
Georgia Total Private Sector

Bioscience Industry Base, 2010
Georgia Highlights:
Georgia United States INDUSTRY SUBSECTOR 2010 2001–10
Change 2007–10 Change 2010 2001–10
Change 2007–10 Change
AGRICULTURAL FEEDSTOCK & CHEMICALS Establishments 56 -6.0% -1.8% 1,760 2.2% 4.5% Employment 1,916 12.6% 5.2% 72,988 -5.9% -5.5% Location Quotient 0.91 n/a Direct-Effect Employment Multiplier 4.0 5.6 Total Employment Impact 7,735 405,197 Average Annual Wage (constant 2010 dollars) $49,587 2.9% -1.5% $70,869 8.7% 1.5%
DRUGS & PHARMACEUTICALS Establishments 55 44.7% 12.2% 2,908 11.3% 6.5% Employment 3,089 -2.6% -5.3% 296,759 -3.1% -7.0% Location Quotient 0.36 n/a Direct-Effect Employment Multiplier 5.8 5.3
Total Employment Impact 17,987 1,464,492 Average Annual Wage (constant 2010 dollars) $94,368 22.5% 0.1% $99,486 15.3% 1.1%
MEDICAL DEVICES & EQUIPMENT Establishments 137 54.1% 52.2% 6,957 11.7% 7.7% Employment 3,668 -4.7% 1.1% 343,468 -0.3% -0.8% Location Quotient 0.37 n/a Direct-Effect Employment Multiplier 2.8 2.9 Total Employment Impact 10,219 956,767 Average Annual Wage (constant 2010 dollars) $63,798 10.8% -4.6% $72,301 13.9% 1.0%
RESEARCH, TESTING, & MEDICAL LABORATORIES Establishments 541 69.6% 21.9% 22,212 48.9% 20.1% Employment 6,915 27.5% 3.6% 451,923 23.8% 6.1% Location Quotient 0.53 n/a Direct-Effect Employment Multiplier 2.3 2.6 Total Employment Impact 15,662 1,178,741 Average Annual Wage (constant 2010 dollars) $58,977 0.7% 0.8% $84,065 12.3% 1.5%
BIOSCIENCE-RELATED DISTRIBUTION Establishments 851 -18.6% 1.5% 36,170 -1.1% -0.3% Employment 12,132 2.0% -5.6% 440,394 6.0% -4.2% Location Quotient 0.95 n/a Direct-Effect Employment Multiplier 2.7 2.4 Total Employment Impact Multiplier 32,521 1,046,594 Average Annual Wage (constant 2010 dollars) $88,144 9.4% -1.2% $80,049 12.2% -0.4%
TOTAL BIOSCIENCE INDUSTRY Establishments 1,640 5.8% 10.9% 70,006 12.8% 6.7% Employment 27,720 6.5% -1.8% 1,605,533 6.4% -1.4% Location Quotient 0.60 n/a Direct-Effect Employment Multiplier 3.0 3.2 Total Employment Impact 84,124 5,051,791 Average Annual Wage (constant 2010 dollars) $75,676 8.1% -1.9% $82,697 13.1% 0.6% TOTAL PRIVATE SECTOR
Establishments 257,648 14.1% -1.5% 8,752,494 12.5% 0.1% Employment 3,085,647 -5.8% -9.4% 106,863,403 -2.9% -6.9% Average Annual Wage (constant 2010 dollars) $44,326 1.3% -1.3% $46,317 4.4% -0.4%
Note: U.S. employment metrics include Puerto Rico. Estimates of total employment impacts do not include Puerto Rico.
Employment, Establishment, and Wage Data: U.S. Bureau of Labor Statistics, Quarterly Census of Employment and Wages (QCEW); enhanced file from IMPLAN.
Employment Multipliers: U.S. Bureau of Economic Analysis RIMS II Employment Multipliers, 2008 (most current available).

HAW
AII
Battelle/BIO State Bioscience Industry Development 2012
HI HAWAII ● Hawaii is home to
a specialized and growing
research, testing, and medical
labs subsector. This largest
subsector in the state
accounts for two of three
bioscience industry jobs and
has a location quotient of 1.24
in 2010. Since 2001, the
subsector has increased
employment by 44 percent
though growth has slowed in
recent years.
Bioscience Summary of State Performance Employment Tier in Industry Related Metrics
*State ranking figures for bioscience industry employment metrics are calculated as quintiles (I=Top Quintile; V=Bottom Quintile).
Metrics Hawaii United States Rank* Bioscience Industry, 2010 Total Bioscience Industry Employment 3,644 1,605,533 V
Bioscience Industry Location Quotient 0.52 n/a V
Biosciences Industry Establishments 208 70,006 V
85
90
95
100
105
110
115
2001 2002 2003 2004 2005 2006 2007 2008 2009 2010
Em
plo
yme
nt I
ndex
(2
001
= 1
00)
Hawaii Bioscience Industry
Hawaii Total Private Sector

Bioscience Industry Base, 2010
Hawaii Highlights:
Hawaii United States INDUSTRY SUBSECTOR 2010 2001–10
Change 2007–10 Change 2010 2001–10
Change 2007–10 Change
AGRICULTURAL FEEDSTOCK & CHEMICALS Establishments 6 -51.4% 0.0% 1,760 2.2% 4.5% Employment 75 -68.2% -8.8% 72,988 -5.9% -5.5% Location Quotient 0.24 n/a Direct-Effect Employment Multiplier 3.3 5.6 Total Employment Impact 250 405,197 Average Annual Wage (constant 2010 dollars) $37,556 -23.2% -4.8% $70,869 8.7% 1.5%
DRUGS & PHARMACEUTICALS Establishments 5 0.0% 25.0% 2,908 11.3% 6.5% Employment 72 -10.3% 20.2% 296,759 -3.1% -7.0% Location Quotient 0.06 n/a Direct-Effect Employment Multiplier 3.2 5.3
Total Employment Impact 231 1,464,492 Average Annual Wage (constant 2010 dollars) $44,161 2.9% -9.4% $99,486 15.3% 1.1%
MEDICAL DEVICES & EQUIPMENT Establishments 2 -73.8% 0.0% 6,957 11.7% 7.7% Employment 25 -92.4% 21.2% 343,468 -0.3% -0.8% Location Quotient 0.02 n/a Direct-Effect Employment Multiplier 2.0 2.9 Total Employment Impact 49 956,767 Average Annual Wage (constant 2010 dollars) $45,369 -51.1% -28.1% $72,301 13.9% 1.0%
RESEARCH, TESTING, & MEDICAL LABORATORIES Establishments 80 28.2% 16.0% 22,212 48.9% 20.1% Employment 2,444 44.1% 0.1% 451,923 23.8% 6.1% Location Quotient 1.24 n/a Direct-Effect Employment Multiplier 2.1 2.6 Total Employment Impact 5,120 1,178,741 Average Annual Wage (constant 2010 dollars) $58,068 7.9% 3.7% $84,065 12.3% 1.5%
BIOSCIENCE-RELATED DISTRIBUTION Establishments 115 -5.6% 4.2% 36,170 -1.1% -0.3% Employment 1,028 -0.9% -1.7% 440,394 6.0% -4.2% Location Quotient 0.54 n/a Direct-Effect Employment Multiplier 2.0 2.4 Total Employment Impact Multiplier 2,034 1,046,594 Average Annual Wage (constant 2010 dollars) $54,015 11.6% 5.1% $80,049 12.2% -0.4%
TOTAL BIOSCIENCE INDUSTRY Establishments 208 -0.6% 8.7% 70,006 12.8% 6.7% Employment 3,644 7.9% -0.2% 1,605,533 6.4% -1.4% Location Quotient 0.52 n/a Direct-Effect Employment Multiplier 2.1 3.2 Total Employment Impact 7,684 5,051,791 Average Annual Wage (constant 2010 dollars) $56,143 1.5% 3.5% $82,697 13.1% 0.6% TOTAL PRIVATE SECTOR
Establishments 36,667 7.7% 0.1% 8,752,494 12.5% 0.1% Employment 464,848 4.2% -8.3% 106,863,403 -2.9% -6.9% Average Annual Wage (constant 2010 dollars) $39,304 7.1% -0.2% $46,317 4.4% -0.4%
Note: U.S. employment metrics include Puerto Rico. Estimates of total employment impacts do not include Puerto Rico.
Employment, Establishment, and Wage Data: U.S. Bureau of Labor Statistics, Quarterly Census of Employment and Wages (QCEW); enhanced file from IMPLAN.
Employment Multipliers: U.S. Bureau of Economic Analysis RIMS II Employment Multipliers, 2008 (most current available).

IDAH
O
Battelle/BIO State Bioscience Industry Development 2012
ID IDAHO ● Idaho bioscience
firms employ more than 7,700
across 532 individual
establishments. The state
sector is diverse with a
specialized concentration of
jobs in three of the five major
subsectors—agricultural
feedstock and chemicals;
research, testing, and medical
labs; and bioscience-related
distribution. Since 2001, total
bioscience industry
employment is flat at 0
percent net change though it
has rebounded since the early
2000s as the line chart shows.
Bioscience Summary of State Performance Employment Tier in Industry Related Metrics
Metrics Idaho United States Rank* Bioscience Industry, 2010 Total Bioscience Industry Employment 7,707 1,605,533 IV
Bioscience Industry Location Quotient 1.04 n/a II
Biosciences Industry Establishments 532 70,006 IV
*State ranking figures for bioscience industry employment metrics are calculated as quintiles (I=Top Quintile; V=Bottom Quintile).
80
85
90
95
100
105
110
115
120
2001 2002 2003 2004 2005 2006 2007 2008 2009 2010
Em
plo
ymen
t In
dex
(20
01 =
100
)
Idaho Bioscience Industry
Idaho Total Private Sector

Bioscience Industry Base, 2010
Idaho Highlights:
Idaho United States INDUSTRY SUBSECTOR 2010 2001–10
Change 2007–10 Change 2010 2001–10
Change 2007–10 Change
AGRICULTURAL FEEDSTOCK & CHEMICALS Establishments 37 7.9% -14.0% 1,760 2.2% 4.5% Employment 1,035 -0.7% -36.2% 72,988 -5.9% -5.5% Location Quotient 3.08 n/a Direct-Effect Employment Multiplier 4.1 5.6 Total Employment Impact 4,230 405,197 Average Annual Wage (constant 2010 dollars) $60,154 13.8% 8.8% $70,869 8.7% 1.5%
DRUGS & PHARMACEUTICALS Establishments 19 241.0% 5.6% 2,908 11.3% 6.5% Employment 235 -33.4% 28.4% 296,759 -3.1% -7.0% Location Quotient 0.17 n/a Direct-Effect Employment Multiplier 2.3 5.3
Total Employment Impact 549 1,464,492 Average Annual Wage (constant 2010 dollars) $48,082 -46.9% -9.9% $99,486 15.3% 1.1%
MEDICAL DEVICES & EQUIPMENT Establishments 49 72.7% 16.7% 6,957 11.7% 7.7% Employment 286 -61.1% -14.1% 343,468 -0.3% -0.8% Location Quotient 0.18 n/a Direct-Effect Employment Multiplier 1.7 2.9 Total Employment Impact 477 956,767 Average Annual Wage (constant 2010 dollars) $41,440 19.1% 2.8% $72,301 13.9% 1.0%
RESEARCH, TESTING, & MEDICAL LABORATORIES Establishments 125 40.0% 28.0% 22,212 48.9% 20.1% Employment 3,239 1.0% 39.4% 451,923 23.8% 6.1% Location Quotient 1.55 n/a Direct-Effect Employment Multiplier 2.3 2.6 Total Employment Impact 7,325 1,178,741 Average Annual Wage (constant 2010 dollars) $75,551 7.5% 6.8% $84,065 12.3% 1.5%
BIOSCIENCE-RELATED DISTRIBUTION Establishments 302 30.8% 4.0% 36,170 -1.1% -0.3% Employment 2,912 23.5% -3.3% 440,394 6.0% -4.2% Location Quotient 1.43 n/a Direct-Effect Employment Multiplier 1.9 2.4 Total Employment Impact Multiplier 5,484 1,046,594 Average Annual Wage (constant 2010 dollars) $55,377 28.6% 11.7% $80,049 12.2% -0.4%
TOTAL BIOSCIENCE INDUSTRY Establishments 532 37.0% 8.4% 70,006 12.8% 6.7% Employment 7,707 0.2% 3.1% 1,605,533 6.4% -1.4% Location Quotient 1.04 n/a Direct-Effect Employment Multiplier 2.3 3.2 Total Employment Impact 18,064 5,051,791 Average Annual Wage (constant 2010 dollars) $63,758 11.6% 11.7% $82,697 13.1% 0.6% TOTAL PRIVATE SECTOR
Establishments 51,877 18.8% -3.5% 8,752,494 12.5% 0.1% Employment 492,887 5.6% -10.2% 106,863,403 -2.9% -6.9% Average Annual Wage (constant 2010 dollars) $37,397 2.3% -1.4% $46,317 4.4% -0.4%
Note: U.S. employment metrics include Puerto Rico. Estimates of total employment impacts do not include Puerto Rico.
Employment, Establishment, and Wage Data: U.S. Bureau of Labor Statistics, Quarterly Census of Employment and Wages (QCEW); enhanced file from IMPLAN.
Employment Multipliers: U.S. Bureau of Economic Analysis RIMS II Employment Multipliers, 2008 (most current available).

ILLI
NO
IS
Battelle/BIO State Bioscience Industry Development 2012
IL ILLINOIS ● Illinois has a
large, diverse, and well
concentrated industry base in
the biosciences with nearly
80,000 jobs that span 3,424
individual business establish-
ments. The state has a
specialized employment
concentration in three of the
five major industry
subsectors—agricultural
feedstock and chemicals;
bioscience-related distribution;
and drugs and pharmaceuticals.
While the industry has shed
jobs since 2001, its medical
device industry has added
10 percent to its base during
that period.
Bioscience Summary of State Performance Employment Tier in Industry Related Metrics
Metrics Illinois United States Rank* Bioscience Industry, 2010 Total Bioscience Industry Employment 79,961 1,605,533 I
Bioscience Industry Location Quotient 1.14 n/a II
Biosciences Industry Establishments 3,424 70,006 I
*State ranking figures for bioscience industry employment metrics are calculated as quintiles (I=Top Quintile; V=Bottom Quintile).
90
92
94
96
98
100
102
104
106
108
110
2001 2002 2003 2004 2005 2006 2007 2008 2009 2010
Em
plo
ymen
t In
dex
(20
01 =
100
)
Illinois Bioscience Industry
Illinois Total Private Sector

Bioscience Industry Base, 2010
Illinois Highlights:
Illinois United States INDUSTRY SUBSECTOR 2010 2001–10
Change 2007–10 Change 2010 2001–10
Change 2007–10 Change
AGRICULTURAL FEEDSTOCK & CHEMICALS Establishments 89 46.0% 5.1% 1,760 2.2% 4.5% Employment 8,263 5.0% -2.6% 72,988 -5.9% -5.5% Location Quotient 2.58 n/a Direct-Effect Employment Multiplier 8.7 5.6 Total Employment Impact 72,202 405,197 Average Annual Wage (constant 2010 dollars) $78,188 19.5% -3.7% $70,869 8.7% 1.5%
DRUGS & PHARMACEUTICALS Establishments 128 2.4% 12.3% 2,908 11.3% 6.5% Employment 18,032 -11.1% -3.3% 296,759 -3.1% -7.0% Location Quotient 1.39 n/a Direct-Effect Employment Multiplier 6.9 5.3
Total Employment Impact 123,897 1,464,492 Average Annual Wage (constant 2010 dollars) $117,761 29.1% 0.6% $99,486 15.3% 1.1%
MEDICAL DEVICES & EQUIPMENT Establishments 412 37.3% 24.1% 6,957 11.7% 7.7% Employment 11,822 10.1% 8.2% 343,468 -0.3% -0.8% Location Quotient 0.79 n/a Direct-Effect Employment Multiplier 3.2 2.9 Total Employment Impact 37,958 956,767 Average Annual Wage (constant 2010 dollars) $91,678 20.2% -3.5% $72,301 13.9% 1.0%
RESEARCH, TESTING, & MEDICAL LABORATORIES Establishments 789 27.1% 13.7% 22,212 48.9% 20.1% Employment 14,975 -25.2% 2.0% 451,923 23.8% 6.1% Location Quotient 0.76 n/a Direct-Effect Employment Multiplier 2.8 2.6 Total Employment Impact 41,401 1,178,741 Average Annual Wage (constant 2010 dollars) $84,371 -4.5% -8.6% $84,065 12.3% 1.5%
BIOSCIENCE-RELATED DISTRIBUTION Establishments 2,006 1.9% -1.4% 36,170 -1.1% -0.3% Employment 26,869 -0.3% -2.2% 440,394 6.0% -4.2% Location Quotient 1.39 n/a Direct-Effect Employment Multiplier 2.7 2.4 Total Employment Impact Multiplier 71,548 1,046,594 Average Annual Wage (constant 2010 dollars) $85,743 18.5% -7.7% $80,049 12.2% -0.4%
TOTAL BIOSCIENCE INDUSTRY Establishments 3,424 11.3% 5.1% 70,006 12.8% 6.7% Employment 79,961 -6.9% -0.3% 1,605,533 6.4% -1.4% Location Quotient 1.14 n/a Direct-Effect Employment Multiplier 4.3 3.2 Total Employment Impact 347,006 5,051,791 Average Annual Wage (constant 2010 dollars) $92,803 15.4% -4.8% $82,697 13.1% 0.6% TOTAL PRIVATE SECTOR
Establishments 369,110 18.4% 5.2% 8,752,494 12.5% 0.1% Employment 4,686,326 -7.7% -7.3% 106,863,403 -2.9% -6.9% Average Annual Wage (constant 2010 dollars) $34,608 2.6% -1.9% $46,317 4.4% -0.4%
Note: U.S. employment metrics include Puerto Rico. Estimates of total employment impacts do not include Puerto Rico.
Employment, Establishment, and Wage Data: U.S. Bureau of Labor Statistics, Quarterly Census of Employment and Wages (QCEW); enhanced file from IMPLAN.
Employment Multipliers: U.S. Bureau of Economic Analysis RIMS II Employment Multipliers, 2008 (most current available).

IND
IAN
A
Battelle/BIO State Bioscience Industry Development 2012
IN INDIANA ● Indiana is home
to a large, highly specialized,
and diverse bioscience
industry. Since 2001, the
state has increased bioscience
jobs by 14 percent to nearly
60,000 by 2010. Indiana is
one of only two states with
a specialized employment
concentration in four of the
five major subsectors, its
specializations include:
agricultural feedstock and
chemicals; drugs and
pharmaceuticals; medical
devices and equipment; and
bioscience-related distribution.
Bioscience Summary of State Performance Employment Tier in Industry Related Metrics
Metrics Indiana United States Rank* Bioscience Industry, 2010 Total Bioscience Industry Employment 59,786 1,605,533 I
Bioscience Industry Location Quotient 1.73 n/a I
Biosciences Industry Establishments 2,030 70,006 I
*State ranking figures for bioscience industry employment metrics are calculated as quintiles (I=Top Quintile; V=Bottom Quintile).
80
85
90
95
100
105
110
115
120
2001 2002 2003 2004 2005 2006 2007 2008 2009 2010
Em
plo
ymen
t In
dex
(20
01 =
100
)
Indiana Bioscience Industry
Indiana Total Private Sector

Bioscience Industry Base, 2010
Indiana Highlights:
Indiana United States INDUSTRY SUBSECTOR 2010 2001–10
Change 2007–10 Change 2010 2001–10
Change 2007–10 Change
AGRICULTURAL FEEDSTOCK & CHEMICALS Establishments 45 56.8% 32.4% 1,760 2.2% 4.5% Employment 4,544 -4.9% 3.9% 72,988 -5.9% -5.5% Location Quotient 2.89 n/a Direct-Effect Employment Multiplier 6.4 5.6 Total Employment Impact 29,043 405,197 Average Annual Wage (constant 2010 dollars) $79,050 -3.1% -3.7% $70,869 8.7% 1.5%
DRUGS & PHARMACEUTICALS Establishments 47 14.6% 6.8% 2,908 11.3% 6.5% Employment 17,141 -7.5% -12.2% 296,759 -3.1% -7.0% Location Quotient 2.68 n/a Direct-Effect Employment Multiplier 5.7 5.3
Total Employment Impact 97,337 1,464,492 Average Annual Wage (constant 2010 dollars) $127,580 20.8% 20.2% $99,486 15.3% 1.1%
MEDICAL DEVICES & EQUIPMENT Establishments 143 27.7% 17.2% 6,957 11.7% 7.7% Employment 18,936 47.2% 7.8% 343,468 -0.3% -0.8% Location Quotient 2.56 n/a Direct-Effect Employment Multiplier 2.7 2.9 Total Employment Impact 50,547 956,767 Average Annual Wage (constant 2010 dollars) $65,181 3.4% -3.6% $72,301 13.9% 1.0%
RESEARCH, TESTING, & MEDICAL LABORATORIES Establishments 349 54.2% 24.6% 22,212 48.9% 20.1% Employment 7,746 10.4% 9.4% 451,923 23.8% 6.1% Location Quotient 0.80 n/a Direct-Effect Employment Multiplier 2.2 2.6 Total Employment Impact 17,375 1,178,741 Average Annual Wage (constant 2010 dollars) $59,158 5.1% 0.7% $84,065 12.3% 1.5%
BIOSCIENCE-RELATED DISTRIBUTION Establishments 1,446 29.8% -2.1% 36,170 -1.1% -0.3% Employment 11,419 23.4% -1.9% 440,394 6.0% -4.2% Location Quotient 1.20 n/a Direct-Effect Employment Multiplier 2.3 2.4 Total Employment Impact Multiplier 25,707 1,046,594 Average Annual Wage (constant 2010 dollars) $74,531 11.8% -3.0% $80,049 12.2% -0.4%
TOTAL BIOSCIENCE INDUSTRY Establishments 2,030 33.4% 3.8% 70,006 12.8% 6.7% Employment 59,786 14.0% -0.7% 1,605,533 6.4% -1.4% Location Quotient 1.73 n/a Direct-Effect Employment Multiplier 3.7 3.2 Total Employment Impact 220,008 5,051,791 Average Annual Wage (constant 2010 dollars) $85,131 7.1% 3.9% $82,697 13.1% 0.6% TOTAL PRIVATE SECTOR
Establishments 152,293 4.1% -0.4% 8,752,494 12.5% 0.1% Employment 2,304,339 -7.3% -7.9% 106,863,403 -2.9% -6.9% Average Annual Wage (constant 2010 dollars) $49,524 0.3% -0.8% $46,317 4.4% -0.4%
Note: U.S. employment metrics include Puerto Rico. Estimates of total employment impacts do not include Puerto Rico.
Employment, Establishment, and Wage Data: U.S. Bureau of Labor Statistics, Quarterly Census of Employment and Wages (QCEW); enhanced file from IMPLAN.
Employment Multipliers: U.S. Bureau of Economic Analysis RIMS II Employment Multipliers, 2008 (most current available).

IOW
A
Battelle/BIO State Bioscience Industry Development 2012
IA IOWA ● Iowa has a specialized
employment concentration in
the biosciences with firms
employing nearly 24,000
across 1,250 establishments.
Since 2001, the state industry
has increased employment by
9 percent overall, though
during the recent recession
some of those gains were
erased. Two bioscience
subsectors are specialized in
Iowa—agricultural feedstock
and chemicals (with the
nation’s highest location
quotient of 9.24) and
bioscience-related distribution
(LQ of 2.11).
Bioscience Summary of State Performance Employment Tier in Industry Related Metrics
Metrics Iowa United States Rank* Bioscience Industry, 2010 Total Bioscience Industry Employment 23,729 1,605,533 III
Bioscience Industry Location Quotient 1.32 n/a I
Biosciences Industry Establishments 1,250 70,006 II
*State ranking figures for bioscience industry employment metrics are calculated as quintiles (I=Top Quintile; V=Bottom Quintile).
80
85
90
95
100
105
110
115
120
2001 2002 2003 2004 2005 2006 2007 2008 2009 2010
Em
plo
yme
nt I
ndex
(2
001
= 1
00)
Iowa Bioscience Industry
Iowa Total Private Sector

Bioscience Industry Base, 2010
Iowa Highlights:
Iowa United States INDUSTRY SUBSECTOR 2010 2001–10
Change 2007–10 Change 2010 2001–10
Change 2007–10 Change
AGRICULTURAL FEEDSTOCK & CHEMICALS Establishments 128 28.9% 14.3% 1,760 2.2% 4.5% Employment 7,578 34.5% 12.0% 72,988 -5.9% -5.5% Location Quotient 9.24 n/a Direct-Effect Employment Multiplier 4.8 5.6 Total Employment Impact 36,645 405,197 Average Annual Wage (constant 2010 dollars) $70,192 7.5% 9.0% $70,869 8.7% 1.5%
DRUGS & PHARMACEUTICALS Establishments 44 4.8% 10.0% 2,908 11.3% 6.5% Employment 2,633 9.9% -6.8% 296,759 -3.1% -7.0% Location Quotient 0.79 n/a Direct-Effect Employment Multiplier 2.6 5.3
Total Employment Impact 6,936 1,464,492 Average Annual Wage (constant 2010 dollars) $61,369 22.1% 9.5% $99,486 15.3% 1.1%
MEDICAL DEVICES & EQUIPMENT Establishments 51 -2.8% -8.9% 6,957 11.7% 7.7% Employment 1,144 -11.5% -62.0% 343,468 -0.3% -0.8% Location Quotient 0.30 n/a Direct-Effect Employment Multiplier 1.7 2.9 Total Employment Impact 1,931 956,767 Average Annual Wage (constant 2010 dollars) $53,075 40.5% -24.6% $72,301 13.9% 1.0%
RESEARCH, TESTING, & MEDICAL LABORATORIES Establishments 168 13.3% 10.2% 22,212 48.9% 20.1% Employment 1,916 57.7% 21.3% 451,923 23.8% 6.1% Location Quotient 0.38 n/a Direct-Effect Employment Multiplier 1.7 2.6 Total Employment Impact 3,220 1,178,741 Average Annual Wage (constant 2010 dollars) $54,871 22.8% 5.3% $84,065 12.3% 1.5%
BIOSCIENCE-RELATED DISTRIBUTION Establishments 860 -11.7% -6.2% 36,170 -1.1% -0.3% Employment 10,457 -6.7% 0.2% 440,394 6.0% -4.2% Location Quotient 2.11 n/a Direct-Effect Employment Multiplier 1.9 2.4 Total Employment Impact Multiplier 19,384 1,046,594 Average Annual Wage (constant 2010 dollars) $63,276 15.8% 1.4% $80,049 12.2% -0.4%
TOTAL BIOSCIENCE INDUSTRY Establishments 1,250 -4.9% -2.0% 70,006 12.8% 6.7% Employment 23,729 9.1% -3.6% 1,605,533 6.4% -1.4% Location Quotient 1.32 n/a Direct-Effect Employment Multiplier 2.9 3.2 Total Employment Impact 68,116 5,051,791 Average Annual Wage (constant 2010 dollars) $64,103 15.8% 2.5% $82,697 13.1% 0.6% TOTAL PRIVATE SECTOR
Establishments 88,098 3.2% 0.5% 8,752,494 12.5% 0.1% Employment 1,200,853 -0.1% -4.1% 106,863,403 -2.9% -6.9% Average Annual Wage (constant 2010 dollars) $39,229 7.0% 0.9% $46,317 4.4% -0.4%
Note: U.S. employment metrics include Puerto Rico. Estimates of total employment impacts do not include Puerto Rico.
Employment, Establishment, and Wage Data: U.S. Bureau of Labor Statistics, Quarterly Census of Employment and Wages (QCEW); enhanced file from IMPLAN.
Employment Multipliers: U.S. Bureau of Economic Analysis RIMS II Employment Multipliers, 2008 (most current available).

KAN
SAS
Battelle/BIO State Bioscience Industry Development 2012
KS KANSAS ● Kansas’ bioscience
industry employs more than
13,000 across 761
establishments with a
specialized employment
concentration in agricultural
feedstock and chemicals. Two
other subsectors are highly
concentrated and represent
the largest of the five major
subsectors—research, testing,
and medical labs (location
quotient of 1.12) and
bioscience-related distribution
(LQ of 1.08). Bioscience
industry employment peaked
in Kansas in 2008 and, similar
to the national sector, has
shed jobs since then.
Bioscience Summary of State Performance Employment Tier in Industry Related Metrics
Metrics Kansas United States Rank* Bioscience Industry, 2010 Total Bioscience Industry Employment 13,266 1,605,533 III
Bioscience Industry Location Quotient 0.84 n/a III
Biosciences Industry Establishments 761 70,006 IV
*State ranking figures for bioscience industry employment metrics are calculated as quintiles (I=Top Quintile; V=Bottom Quintile).
75
80
85
90
95
100
105
110
115
120
125
2001 2002 2003 2004 2005 2006 2007 2008 2009 2010
Em
plo
yme
nt I
ndex
(2
001
= 1
00)
Kansas Bioscience Industry
Kansas Total Private Sector

Bioscience Industry Base, 2010
Kansas Highlights:
Kansas United States INDUSTRY SUBSECTOR 2010 2001–10
Change 2007–10 Change 2010 2001–10
Change 2007–10 Change
AGRICULTURAL FEEDSTOCK & CHEMICALS Establishments 33 -12.9% -8.3% 1,760 2.2% 4.5% Employment 877 -28.3% -29.4% 72,988 -5.9% -5.5% Location Quotient 1.23 n/a Direct-Effect Employment Multiplier 4.2 5.6 Total Employment Impact 3,654 405,197 Average Annual Wage (constant 2010 dollars) $56,888 6.2% -0.1% $70,869 8.7% 1.5%
DRUGS & PHARMACEUTICALS Establishments 20 -13.0% 3.6% 2,908 11.3% 6.5% Employment 2,032 99.8% 50.4% 296,759 -3.1% -7.0% Location Quotient 0.70 n/a Direct-Effect Employment Multiplier 3.0 5.3
Total Employment Impact 6,038 1,464,492 Average Annual Wage (constant 2010 dollars) $66,775 10.3% 10.1% $99,486 15.3% 1.1%
MEDICAL DEVICES & EQUIPMENT Establishments 44 -22.0% -4.3% 6,957 11.7% 7.7% Employment 753 -43.9% -0.9% 343,468 -0.3% -0.8% Location Quotient 0.22 n/a Direct-Effect Employment Multiplier 1.7 2.9 Total Employment Impact 1,254 956,767 Average Annual Wage (constant 2010 dollars) $41,540 -0.1% -0.4% $72,301 13.9% 1.0%
RESEARCH, TESTING, & MEDICAL LABORATORIES Establishments 209 63.6% 6.6% 22,212 48.9% 20.1% Employment 4,955 34.0% -8.1% 451,923 23.8% 6.1% Location Quotient 1.12 n/a Direct-Effect Employment Multiplier 1.9 2.6 Total Employment Impact 9,261 1,178,741 Average Annual Wage (constant 2010 dollars) $57,463 15.3% 0.3% $84,065 12.3% 1.5%
BIOSCIENCE-RELATED DISTRIBUTION Establishments 454 -22.2% -0.8% 36,170 -1.1% -0.3% Employment 4,649 8.1% 2.6% 440,394 6.0% -4.2% Location Quotient 1.08 n/a Direct-Effect Employment Multiplier 2.0 2.4 Total Employment Impact Multiplier 9,476 1,046,594 Average Annual Wage (constant 2010 dollars) $68,818 4.5% -3.0% $80,049 12.2% -0.4%
TOTAL BIOSCIENCE INDUSTRY Establishments 761 -8.2% 0.7% 70,006 12.8% 6.7% Employment 13,266 14.6% -0.1% 1,605,533 6.4% -1.4% Location Quotient 0.84 n/a Direct-Effect Employment Multiplier 2.2 3.2 Total Employment Impact 29,684 5,051,791 Average Annual Wage (constant 2010 dollars) $61,927 10.3% 0.9% $82,697 13.1% 0.6% TOTAL PRIVATE SECTOR
Establishments 82,212 8.5% 2.7% 8,752,494 12.5% 0.1% Employment 1,047,659 -3.3% -5.7% 106,863,403 -2.9% -6.9% Average Annual Wage (constant 2010 dollars) $39,427 5.1% -0.1% $46,317 4.4% -0.4%
Note: U.S. employment metrics include Puerto Rico. Estimates of total employment impacts do not include Puerto Rico.
Employment, Establishment, and Wage Data: U.S. Bureau of Labor Statistics, Quarterly Census of Employment and Wages (QCEW); enhanced file from IMPLAN.
Employment Multipliers: U.S. Bureau of Economic Analysis RIMS II Employment Multipliers, 2008 (most current available).

KEN
TUCKY
Battelle/BIO State Bioscience Industry Development 2012
KY KENTUCKY ● Bioscience
industry employment reached
11,351 in Kentucky in 2010
spanning 927 business
establishments. Its largest
component subsector,
bioscience-related distribution,
employed more than 6,000
and has led job gains in recent
years. The distribution
subsector has increased jobs
by 7 percent just since 2007
and has helped to drive total
bioscience job growth over
that period as well (up
5 percent).
Bioscience Summary of State Performance Employment Tier in Industry Related Metrics
Metrics Kentucky United States Rank* Bioscience Industry, 2010 Total Bioscience Industry Employment 11,351 1,605,533 III
Bioscience Industry Location Quotient 0.54 n/a IV
Biosciences Industry Establishments 927 70,006 III
*State ranking figures for bioscience industry employment metrics are calculated as quintiles (I=Top Quintile; V=Bottom Quintile).
90
92
94
96
98
100
102
104
106
108
110
2001 2002 2003 2004 2005 2006 2007 2008 2009 2010
Em
plo
yme
nt I
ndex
(2
001
= 1
00)
Kentucky Bioscience Industry
Kentucky Total Private Sector

Bioscience Industry Base, 2010
Kentucky Highlights:
Kentucky United States INDUSTRY SUBSECTOR 2010 2001–10
Change 2007–10 Change 2010 2001–10
Change 2007–10 Change
AGRICULTURAL FEEDSTOCK & CHEMICALS Establishments 23 15.0% 35.3% 1,760 2.2% 4.5% Employment 507 33.4% -3.9% 72,988 -5.9% -5.5% Location Quotient 0.53 n/a Direct-Effect Employment Multiplier 6.7 5.6 Total Employment Impact 3,407 405,197 Average Annual Wage (constant 2010 dollars) $52,693 16.4% -1.3% $70,869 8.7% 1.5%
DRUGS & PHARMACEUTICALS Establishments 23 64.3% 21.1% 2,908 11.3% 6.5% Employment 1,256 29.5% 3.0% 296,759 -3.1% -7.0% Location Quotient 0.32 n/a Direct-Effect Employment Multiplier 4.2 5.3
Total Employment Impact 5,275 1,464,492 Average Annual Wage (constant 2010 dollars) $65,417 -1.3% -6.6% $99,486 15.3% 1.1%
MEDICAL DEVICES & EQUIPMENT Establishments 54 55.3% 14.9% 6,957 11.7% 7.7% Employment 1,400 -28.6% -0.5% 343,468 -0.3% -0.8% Location Quotient 0.31 n/a Direct-Effect Employment Multiplier 2.1 2.9 Total Employment Impact 3,010 956,767 Average Annual Wage (constant 2010 dollars) $45,751 9.3% -6.6% $72,301 13.9% 1.0%
RESEARCH, TESTING, & MEDICAL LABORATORIES Establishments 273 144.8% 55.3% 22,212 48.9% 20.1% Employment 2,149 10.3% 5.5% 451,923 23.8% 6.1% Location Quotient 0.36 n/a Direct-Effect Employment Multiplier 2.0 2.6 Total Employment Impact 4,348 1,178,741 Average Annual Wage (constant 2010 dollars) $50,349 5.3% 1.6% $84,065 12.3% 1.5%
BIOSCIENCE-RELATED DISTRIBUTION Establishments 554 8.7% 21.4% 36,170 -1.1% -0.3% Employment 6,039 0.6% 7.1% 440,394 6.0% -4.2% Location Quotient 1.04 n/a Direct-Effect Employment Multiplier 2.3 2.4 Total Employment Impact Multiplier 13,949 1,046,594 Average Annual Wage (constant 2010 dollars) $70,010 13.0% -5.6% $80,049 12.2% -0.4%
TOTAL BIOSCIENCE INDUSTRY Establishments 927 34.3% 29.6% 70,006 12.8% 6.7% Employment 11,351 0.8% 4.8% 1,605,533 6.4% -1.4% Location Quotient 0.54 n/a Direct-Effect Employment Multiplier 2.6 3.2 Total Employment Impact 29,988 5,051,791 Average Annual Wage (constant 2010 dollars) $62,013 11.1% -4.3% $82,697 13.1% 0.6% TOTAL PRIVATE SECTOR
Establishments 103,907 1.5% -3.3% 8,752,494 12.5% 0.1% Employment 1,403,420 -3.1% -6.5% 106,863,403 -2.9% -6.9% Average Annual Wage (constant 2010 dollars) $38,368 4.1% 0.8% $46,317 4.4% -0.4%
Note: U.S. employment metrics include Puerto Rico. Estimates of total employment impacts do not include Puerto Rico.
Employment, Establishment, and Wage Data: U.S. Bureau of Labor Statistics, Quarterly Census of Employment and Wages (QCEW); enhanced file from IMPLAN.
Employment Multipliers: U.S. Bureau of Economic Analysis RIMS II Employment Multipliers, 2008 (most current available).

LOU
ISIA
NA
Battelle/BIO State Bioscience Industry Development 2012
LA LOUISIANA ● Louisiana has a
highly specialized
concentration of jobs in
agricultural feedstock and
chemicals with more than
2,600 employed and a location
quotient of 2.60 in 2010.
Since 2007, the subsector
has increased employment by
4 percent. The state has also
grown its research, testing,
and medical labs and drugs
and pharmaceuticals
subsectors since 2007 and
together have driven overall
job gains in the biosciences
during these difficult economic
years (up 1 percent).
Bioscience Summary of State Performance Employment Tier in Industry Related Metrics
Metrics Louisiana United States Rank* Bioscience Industry, 2010 Total Bioscience Industry Employment 10,378 1,605,533 IV
Bioscience Industry Location Quotient 0.47 n/a V
Biosciences Industry Establishments 913 70,006 III
*State ranking figures for bioscience industry employment metrics are calculated as quintiles (I=Top Quintile; V=Bottom Quintile).
80
85
90
95
100
105
110
115
120
2001 2002 2003 2004 2005 2006 2007 2008 2009 2010
Em
plo
yme
nt I
ndex
(2
001
= 1
00)
Louisiana Bioscience Industry
Louisiana Total Private Sector

Bioscience Industry Base, 2010
Louisiana Highlights:
Louisiana United States INDUSTRY SUBSECTOR 2010 2001–10
Change 2007–10 Change 2010 2001–10
Change 2007–10 Change
AGRICULTURAL FEEDSTOCK & CHEMICALS Establishments 38 -12.8% 5.6% 1,760 2.2% 4.5% Employment 2,628 -14.9% 4.4% 72,988 -5.9% -5.5% Location Quotient 2.60 n/a Direct-Effect Employment Multiplier 6.9 5.6 Total Employment Impact 18,240 405,197 Average Annual Wage (constant 2010 dollars) $88,944 9.4% 1.0% $70,869 8.7% 1.5%
DRUGS & PHARMACEUTICALS Establishments 27 12.5% 80.0% 2,908 11.3% 6.5% Employment 448 55.0% 85.1% 296,759 -3.1% -7.0% Location Quotient 0.11 n/a Direct-Effect Employment Multiplier 2.7 5.3
Total Employment Impact 1,212 1,464,492 Average Annual Wage (constant 2010 dollars) $54,750 11.3% 15.7% $99,486 15.3% 1.1%
MEDICAL DEVICES & EQUIPMENT Establishments 57 8.5% 26.7% 6,957 11.7% 7.7% Employment 226 -39.2% -29.1% 343,468 -0.3% -0.8% Location Quotient 0.05 n/a Direct-Effect Employment Multiplier 1.9 2.9 Total Employment Impact 437 956,767 Average Annual Wage (constant 2010 dollars) $48,136 29.4% 5.9% $72,301 13.9% 1.0%
RESEARCH, TESTING, & MEDICAL LABORATORIES Establishments 210 44.0% 19.7% 22,212 48.9% 20.1% Employment 1,817 -8.7% 16.2% 451,923 23.8% 6.1% Location Quotient 0.29 n/a Direct-Effect Employment Multiplier 2.0 2.6 Total Employment Impact 3,626 1,178,741 Average Annual Wage (constant 2010 dollars) $46,890 20.4% 7.4% $84,065 12.3% 1.5%
BIOSCIENCE-RELATED DISTRIBUTION Establishments 581 -13.9% 10.4% 36,170 -1.1% -0.3% Employment 5,259 -13.7% -6.0% 440,394 6.0% -4.2% Location Quotient 0.86 n/a Direct-Effect Employment Multiplier 2.2 2.4 Total Employment Impact Multiplier 11,455 1,046,594 Average Annual Wage (constant 2010 dollars) $73,833 19.5% -3.1% $80,049 12.2% -0.4%
TOTAL BIOSCIENCE INDUSTRY Establishments 913 -2.9% 14.5% 70,006 12.8% 6.7% Employment 10,378 -12.3% 1.4% 1,605,533 6.4% -1.4% Location Quotient 0.47 n/a Direct-Effect Employment Multiplier 3.4 3.2 Total Employment Impact 34,971 5,051,791 Average Annual Wage (constant 2010 dollars) $71,559 15.5% -1.3% $82,697 13.1% 0.6% TOTAL PRIVATE SECTOR
Establishments 123,078 11.9% 7.4% 8,752,494 12.5% 0.1% Employment 1,480,434 -2.2% -3.1% 106,863,403 -2.9% -6.9% Average Annual Wage (constant 2010 dollars) $41,437 15.2% 2.5% $46,317 4.4% -0.4%
Note: U.S. employment metrics include Puerto Rico. Estimates of total employment impacts do not include Puerto Rico.
Employment, Establishment, and Wage Data: U.S. Bureau of Labor Statistics, Quarterly Census of Employment and Wages (QCEW); enhanced file from IMPLAN.
Employment Multipliers: U.S. Bureau of Economic Analysis RIMS II Employment Multipliers, 2008 (most current available).

MAIN
E
Battelle/BIO State Bioscience Industry Development 2012
ME MAINE ● Maine’s bioscience
industry employs 6,253 across
238 individual establishments.
The state sector has added 17
percent to its jobs base overall
since 2001 though has shed 1
percent of jobs since 2007.
Two subsectors are highly
concentrated in Maine—
research, testing, and medical
labs (location quotient of 1.16)
and drugs and pharmaceuticals
(LQ of 1.15). Both subsectors
had strong job growth over
the decade though research
and testing has slowed in
recent years.
Bioscience Summary of State Performance Employment Tier in Industry Related Metrics
Metrics Maine United States Rank* Bioscience Industry, 2010 Total Bioscience Industry Employment 6,253 1,605,533 IV
Bioscience Industry Location Quotient 0.87 n/a II
Biosciences Industry Establishments 238 70,006 V
*State ranking figures for bioscience industry employment metrics are calculated as quintiles (I=Top Quintile; V=Bottom Quintile).
75
80
85
90
95
100
105
110
115
120
125
2001 2002 2003 2004 2005 2006 2007 2008 2009 2010
Em
plo
yme
nt I
ndex
(2
001
= 1
00)
Maine Bioscience Industry
Maine Total Private Sector

Bioscience Industry Base, 2010
Maine Highlights:
Maine United States INDUSTRY SUBSECTOR 2010 2001–10
Change 2007–10 Change 2010 2001–10
Change 2007–10 Change
AGRICULTURAL FEEDSTOCK & CHEMICALS Establishments 10 -20.7% -28.6% 1,760 2.2% 4.5% Employment 105 -46.9% -42.0% 72,988 -5.9% -5.5% Location Quotient 0.32 n/a Direct-Effect Employment Multiplier 3.2 5.6 Total Employment Impact 334 405,197 Average Annual Wage (constant 2010 dollars) $41,735 -1.4% -0.9% $70,869 8.7% 1.5%
DRUGS & PHARMACEUTICALS Establishments 23 4.5% 4.5% 2,908 11.3% 6.5% Employment 1,528 63.2% 13.1% 296,759 -3.1% -7.0% Location Quotient 1.15 n/a Direct-Effect Employment Multiplier 4.4 5.3
Total Employment Impact 6,723 1,464,492 Average Annual Wage (constant 2010 dollars) $100,898 53.9% 39.0% $99,486 15.3% 1.1%
MEDICAL DEVICES & EQUIPMENT Establishments 27 42.7% 3.8% 6,957 11.7% 7.7% Employment 1,091 42.7% 7.9% 343,468 -0.3% -0.8% Location Quotient 0.71 n/a Direct-Effect Employment Multiplier 1.9 2.9 Total Employment Impact 2,080 956,767 Average Annual Wage (constant 2010 dollars) $37,105 0.6% 10.5% $72,301 13.9% 1.0%
RESEARCH, TESTING, & MEDICAL LABORATORIES Establishments 73 31.7% -6.2% 22,212 48.9% 20.1% Employment 2,342 16.0% -1.9% 451,923 23.8% 6.1% Location Quotient 1.16 n/a Direct-Effect Employment Multiplier 2.0 2.6 Total Employment Impact 4,722 1,178,741 Average Annual Wage (constant 2010 dollars) $50,346 8.8% 5.3% $84,065 12.3% 1.5%
BIOSCIENCE-RELATED DISTRIBUTION Establishments 105 -37.3% -13.3% 36,170 -1.1% -0.3% Employment 1,187 -16.5% -14.8% 440,394 6.0% -4.2% Location Quotient 0.60 n/a Direct-Effect Employment Multiplier 2.2 2.4 Total Employment Impact Multiplier 2,562 1,046,594 Average Annual Wage (constant 2010 dollars) $55,166 15.6% 10.4% $80,049 12.2% -0.4%
TOTAL BIOSCIENCE INDUSTRY Establishments 238 -13.9% -8.8% 70,006 12.8% 6.7% Employment 6,253 17.1% -1.1% 1,605,533 6.4% -1.4% Location Quotient 0.87 n/a Direct-Effect Employment Multiplier 2.6 3.2 Total Employment Impact 16,421 5,051,791 Average Annual Wage (constant 2010 dollars) $61,159 26.0% 19.6% $82,697 13.1% 0.6% TOTAL PRIVATE SECTOR
Establishments 46,063 6.5% -2.0% 8,752,494 12.5% 0.1% Employment 478,810 -3.5% -4.8% 106,863,403 -2.9% -6.9% Average Annual Wage (constant 2010 dollars) $58,319 4.6% 0.9% $46,317 4.4% -0.4%
Note: U.S. employment metrics include Puerto Rico. Estimates of total employment impacts do not include Puerto Rico.
Employment, Establishment, and Wage Data: U.S. Bureau of Labor Statistics, Quarterly Census of Employment and Wages (QCEW); enhanced file from IMPLAN.
Employment Multipliers: U.S. Bureau of Economic Analysis RIMS II Employment Multipliers, 2008 (most current available).

MARYL
AN
D
Battelle/BIO State Bioscience Industry Development 2012
MD MARYLAND ● Maryland has a sizable and highly concentrated employment base in the biosciences that exceeded 33,000 jobs in 2010 and spans 1,842 business establishments. Two of its five major subsectors have a specialized employment concentration—research, testing, and medical labs (location quotient of 2.20) and drugs and pharmaceuticals (LQ of 1.20). Both specialized subsectors have seen considerable job growth since 2001 and maintained that growth even over the recession years. Despite a national decline in employment, Maryland’s drugs and pharmaceuticals sector has grown by 37 percent since 2001.
Bioscience Summary of State Performance Employment Tier in Industry Related Metrics
Metrics Maryland United States Rank* Bioscience Industry, 2010 Total Bioscience Industry Employment 33,257 1,605,533 II
Bioscience Industry Location Quotient 1.12 n/a II
Biosciences Industry Establishments 1,842 70,006 II
*State ranking figures for bioscience industry employment metrics are calculated as quintiles (I=Top Quintile; V=Bottom Quintile).
85
90
95
100
105
110
115
2001 2002 2003 2004 2005 2006 2007 2008 2009 2010
Em
plo
yme
nt I
ndex
(2
001
= 1
00)
Maryland Bioscience Industry
Maryland Total Private Sector

Bioscience Industry Base, 2010
Maryland Highlights:
Maryland United States INDUSTRY SUBSECTOR 2010 2001–10
Change 2007–10 Change 2010 2001–10
Change 2007–10 Change
AGRICULTURAL FEEDSTOCK & CHEMICALS Establishments 16 -28.3% 14.3% 1,760 2.2% 4.5% Employment 214 -61.7% -24.2% 72,988 -5.9% -5.5% Location Quotient 0.16 n/a Direct-Effect Employment Multiplier 3.3 5.6 Total Employment Impact 716 405,197 Average Annual Wage (constant 2010 dollars) $66,722 -5.2% -11.0% $70,869 8.7% 1.5%
DRUGS & PHARMACEUTICALS Establishments 66 -2.9% -4.3% 2,908 11.3% 6.5% Employment 6,574 36.9% 5.7% 296,759 -3.1% -7.0% Location Quotient 1.20 n/a Direct-Effect Employment Multiplier 4.2 5.3
Total Employment Impact 27,930 1,464,492 Average Annual Wage (constant 2010 dollars) $102,080 15.3% -14.3% $99,486 15.3% 1.1%
MEDICAL DEVICES & EQUIPMENT Establishments 89 -7.5% 1.1% 6,957 11.7% 7.7% Employment 1,977 -11.2% -24.1% 343,468 -0.3% -0.8% Location Quotient 0.31 n/a Direct-Effect Employment Multiplier 2.6 2.9 Total Employment Impact 5,102 956,767 Average Annual Wage (constant 2010 dollars) $67,611 10.1% -1.6% $72,301 13.9% 1.0%
RESEARCH, TESTING, & MEDICAL LABORATORIES Establishments 964 52.3% 28.2% 22,212 48.9% 20.1% Employment 18,336 14.5% 1.3% 451,923 23.8% 6.1% Location Quotient 2.20 n/a Direct-Effect Employment Multiplier 2.7 2.6 Total Employment Impact 48,732 1,178,741 Average Annual Wage (constant 2010 dollars) $91,650 20.0% 6.1% $84,065 12.3% 1.5%
BIOSCIENCE-RELATED DISTRIBUTION Establishments 707 -19.5% 0.2% 36,170 -1.1% -0.3% Employment 6,157 -13.4% -4.6% 440,394 6.0% -4.2% Location Quotient 0.76 n/a Direct-Effect Employment Multiplier 2.4 2.4 Total Employment Impact Multiplier 14,728 1,046,594 Average Annual Wage (constant 2010 dollars) $81,997 -2.0% 2.1% $80,049 12.2% -0.4%
TOTAL BIOSCIENCE INDUSTRY Establishments 1,842 8.5% 13.1% 70,006 12.8% 6.7% Employment 33,257 8.3% -1.2% 1,605,533 6.4% -1.4% Location Quotient 1.12 n/a Direct-Effect Employment Multiplier 2.9 3.2 Total Employment Impact 97,208 5,051,791 Average Annual Wage (constant 2010 dollars) $90,336 14.7% 0.6% $82,697 13.1% 0.6% TOTAL PRIVATE SECTOR
Establishments 160,115 10.4% -1.7% 8,752,494 12.5% 0.1% Employment 1,968,759 -0.6% -5.6% 106,863,403 -2.9% -6.9% Average Annual Wage (constant 2010 dollars) $49,495 8.5% 1.4% $46,317 4.4% -0.4%
Note: U.S. employment metrics include Puerto Rico. Estimates of total employment impacts do not include Puerto Rico.
Employment, Establishment, and Wage Data: U.S. Bureau of Labor Statistics, Quarterly Census of Employment and Wages (QCEW); enhanced file from IMPLAN.
Employment Multipliers: U.S. Bureau of Economic Analysis RIMS II Employment Multipliers, 2008 (most current available).

MASSACH
USET
TS
Battelle/BIO State Bioscience Industry Development 2012
MA MASSACHUSETTS ● Massachusetts is home to a large, highly specialized, and growing bioscience industry. Since 2001 the sector has grown by 15 percent and managed to maintain job gains during the more recent period since 2007 which includes the deep national recession. The state is diverse across the subsectors with three of five having a specialized employment concentration in 2010—research, testing, and medical labs (location quotient of 3.27); medical devices and equipment (LQ of 2.30); and drugs and pharmaceuticals (LQ of 1.25).
Bioscience Summary of State Performance Employment Tier in Industry Related Metrics
Metrics Massachusetts United States Rank* Bioscience Industry, 2010 Total Bioscience Industry Employment 77,762 1,605,533 I
Bioscience Industry Location Quotient 1.89 n/a I
Biosciences Industry Establishments 1,979 70,006 I
*State ranking figures for bioscience industry employment metrics are calculated as quintiles (I=Top Quintile; V=Bottom Quintile).
75
80
85
90
95
100
105
110
115
120
125
2001 2002 2003 2004 2005 2006 2007 2008 2009 2010
Em
plo
ymen
t In
dex
(20
01 =
100
)Massachusetts Bioscience Industry
Massachusetts Total Private Sector

Bioscience Industry Base, 2010
Massachusetts Highlights:
Massachusetts United States INDUSTRY SUBSECTOR 2010 2001–10
Change 2007–10 Change 2010 2001–10
Change 2007–10 Change
AGRICULTURAL FEEDSTOCK & CHEMICALS Establishments 13 -53.6% -13.3% 1,760 2.2% 4.5% Employment 229 -40.5% -20.9% 72,988 -5.9% -5.5% Location Quotient 0.12 n/a Direct-Effect Employment Multiplier 3.3 5.6 Total Employment Impact 753 405,197 Average Annual Wage (constant 2010 dollars) $68,545 14.3% -6.3% $70,869 8.7% 1.5%
DRUGS & PHARMACEUTICALS Establishments 82 -4.7% -12.8% 2,908 11.3% 6.5% Employment 9,513 22.1% 4.2% 296,759 -3.1% -7.0% Location Quotient 1.25 n/a Direct-Effect Employment Multiplier 5.3 5.3
Total Employment Impact 50,110 1,464,492 Average Annual Wage (constant 2010 dollars) $105,499 0.6% -21.7% $99,486 15.3% 1.1%
MEDICAL DEVICES & EQUIPMENT Establishments 281 -8.1% -5.4% 6,957 11.7% 7.7% Employment 20,182 -19.0% -1.2% 343,468 -0.3% -0.8% Location Quotient 2.30 n/a Direct-Effect Employment Multiplier 3.4 2.9 Total Employment Impact 69,480 956,767 Average Annual Wage (constant 2010 dollars) $102,229 20.0% 6.9% $72,301 13.9% 1.0%
RESEARCH, TESTING, & MEDICAL LABORATORIES Establishments 1,154 36.5% 17.4% 22,212 48.9% 20.1% Employment 37,789 44.5% 8.4% 451,923 23.8% 6.1% Location Quotient 3.27 n/a Direct-Effect Employment Multiplier 2.9 2.6 Total Employment Impact 110,460 1,178,741 Average Annual Wage (constant 2010 dollars) $108,554 18.4% 4.6% $84,065 12.3% 1.5%
BIOSCIENCE-RELATED DISTRIBUTION Establishments 449 -19.8% 0.2% 36,170 -1.1% -0.3% Employment 10,049 21.3% -4.3% 440,394 6.0% -4.2% Location Quotient 0.89 n/a Direct-Effect Employment Multiplier 2.4 2.4 Total Employment Impact Multiplier 24,120 1,046,594 Average Annual Wage (constant 2010 dollars) $101,888 29.6% 4.4% $80,049 12.2% -0.4%
TOTAL BIOSCIENCE INDUSTRY Establishments 1,979 8.4% 7.7% 70,006 12.8% 6.7% Employment 77,762 15.1% 3.4% 1,605,533 6.4% -1.4% Location Quotient 1.89 n/a Direct-Effect Employment Multiplier 3.3 3.2 Total Employment Impact 254,923 5,051,791 Average Annual Wage (constant 2010 dollars) $105,559 18.6% 1.2% $82,697 13.1% 0.6% TOTAL PRIVATE SECTOR
Establishments 213,693 14.8% 4.5% 8,752,494 12.5% 0.1% Employment 2,733,845 -4.5% -3.1% 106,863,403 -2.9% -6.9% Average Annual Wage (constant 2010 dollars) $36,582 4.0% -0.7% $46,317 4.4% -0.4%
Note: U.S. employment metrics include Puerto Rico. Estimates of total employment impacts do not include Puerto Rico.
Employment, Establishment, and Wage Data: U.S. Bureau of Labor Statistics, Quarterly Census of Employment and Wages (QCEW); enhanced file from IMPLAN.
Employment Multipliers: U.S. Bureau of Economic Analysis RIMS II Employment Multipliers, 2008 (most current available).

MIC
HIG
AN
Battelle/BIO State Bioscience Industry Development 2012
MI MICHIGAN ● The Michigan
bioscience industry employs
more than 39,000 across
1,595 individual business
establishments. Its largest
major subsector is bioscience-
related distribution with more
than 11,000 jobs in 2010 and
growth of 13 percent overall
since 2001, well above the
national growth rate. Two
other subsectors—medical
devices and equipment and
agricultural feedstock and
chemicals—have each added
jobs in Michigan in recent
years despite employment
declines at the national level.
Bioscience Summary of State Performance Employment Tier in Industry Related Metrics
Metrics Michigan United States Rank* Bioscience Industry, 2010 Total Bioscience Industry Employment 39,282 1,605,533 II
Bioscience Industry Location Quotient 0.82 n/a III
Biosciences Industry Establishments 1,595 70,006 II
*State ranking figures for bioscience industry employment metrics are calculated as quintiles (I=Top Quintile; V=Bottom Quintile).
80
85
90
95
100
105
110
115
120
2001 2002 2003 2004 2005 2006 2007 2008 2009 2010
Em
plo
ymen
t In
dex
(20
01 =
100
)
Michigan Bioscience Industry
Michigan Total Private Sector

Bioscience Industry Base, 2010
Michigan Highlights:
Michigan United States INDUSTRY SUBSECTOR 2010 2001–10
Change 2007–10 Change 2010 2001–10
Change 2007–10 Change
AGRICULTURAL FEEDSTOCK & CHEMICALS Establishments 28 -6.0% 54.6% 1,760 2.2% 4.5% Employment 802 96.6% 13.0% 72,988 -5.9% -5.5% Location Quotient 0.37 n/a Direct-Effect Employment Multiplier 4.4 5.6 Total Employment Impact 3,492 405,197 Average Annual Wage (constant 2010 dollars) $57,069 -12.2% 7.9% $70,869 8.7% 1.5%
DRUGS & PHARMACEUTICALS Establishments 60 5.3% -9.1% 2,908 11.3% 6.5% Employment 7,305 -34.8% -11.5% 296,759 -3.1% -7.0% Location Quotient 0.83 n/a Direct-Effect Employment Multiplier 4.9 5.3
Total Employment Impact 35,890 1,464,492 Average Annual Wage (constant 2010 dollars) $81,271 -0.4% -5.8% $99,486 15.3% 1.1%
MEDICAL DEVICES & EQUIPMENT Establishments 211 -1.4% 3.9% 6,957 11.7% 7.7% Employment 10,328 1.6% 8.1% 343,468 -0.3% -0.8% Location Quotient 1.01 n/a Direct-Effect Employment Multiplier 2.8 2.9 Total Employment Impact 29,024 956,767 Average Annual Wage (constant 2010 dollars) $63,629 16.9% 2.2% $72,301 13.9% 1.0%
RESEARCH, TESTING, & MEDICAL LABORATORIES Establishments 408 50.3% 20.1% 22,212 48.9% 20.1% Employment 9,802 1.3% -21.7% 451,923 23.8% 6.1% Location Quotient 0.73 n/a Direct-Effect Employment Multiplier 3.0 2.6 Total Employment Impact 29,047 1,178,741 Average Annual Wage (constant 2010 dollars) $84,817 -5.7% -13.4% $84,065 12.3% 1.5%
BIOSCIENCE-RELATED DISTRIBUTION Establishments 887 -3.5% -7.5% 36,170 -1.1% -0.3% Employment 11,045 13.0% -4.2% 440,394 6.0% -4.2% Location Quotient 0.84 n/a Direct-Effect Employment Multiplier 2.5 2.4 Total Employment Impact Multiplier 27,204 1,046,594 Average Annual Wage (constant 2010 dollars) $81,151 13.2% -2.7% $80,049 12.2% -0.4%
TOTAL BIOSCIENCE INDUSTRY Establishments 1,595 6.9% 0.5% 70,006 12.8% 6.7% Employment 39,282 -4.7% -7.7% 1,605,533 6.4% -1.4% Location Quotient 0.82 n/a Direct-Effect Employment Multiplier 3.2 3.2 Total Employment Impact 124,657 5,051,791 Average Annual Wage (constant 2010 dollars) $76,989 3.5% -7.2% $82,697 13.1% 0.6% TOTAL PRIVATE SECTOR
Establishments 240,789 -4.6% -3.5% 8,752,494 12.5% 0.1% Employment 3,178,935 -17.1% -10.8% 106,863,403 -2.9% -6.9% Average Annual Wage (constant 2010 dollars) $43,632 -5.6% -3.8% $46,317 4.4% -0.4%
Note: U.S. employment metrics include Puerto Rico. Estimates of total employment impacts do not include Puerto Rico.
Employment, Establishment, and Wage Data: U.S. Bureau of Labor Statistics, Quarterly Census of Employment and Wages (QCEW); enhanced file from IMPLAN.
Employment Multipliers: U.S. Bureau of Economic Analysis RIMS II Employment Multipliers, 2008 (most current available).

MIN
NES
OTA
Battelle/BIO State Bioscience Industry Development 2012
MN MINNESOTA ● Minnesota has a large and specialized bioscience industry base with just over 48,000 jobs in 2010 spanning 1,653 business establishments. The state is a national leader in medical device manufacturing with 26,774 jobs in 2010 and a highly specialized location quotient of 3.81. Despite the difficult period since 2007 which includes the deep national recession, three of the state’s five major subsectors managed to add jobs—drugs and pharmaceuticals (up 15 percent since 2007); agricultural feedstock and chemicals (up 5 percent); and research, testing, and medical labs (up 4 percent).
Bioscience Summary of State Performance Employment Tier in Industry Related Metrics
Metrics Minnesota United States Rank* Bioscience Industry, 2010 Total Bioscience Industry Employment 48,001 1,605,533 I
Bioscience Industry Location Quotient 1.46 n/a I
Biosciences Industry Establishments 1,653 70,006 II
*State ranking figures for bioscience industry employment metrics are calculated as quintiles (I=Top Quintile; V=Bottom Quintile).
75
80
85
90
95
100
105
110
115
120
125
2001 2002 2003 2004 2005 2006 2007 2008 2009 2010
Em
plo
yme
nt I
ndex
(2
001
= 1
00)
Minnesota Bioscience Industry
Minnesota Total Private Sector

Bioscience Industry Base, 2010
Minnesota Highlights:
Minnesota United States INDUSTRY SUBSECTOR 2010 2001–10
Change 2007–10 Change 2010 2001–10
Change 2007–10 Change
AGRICULTURAL FEEDSTOCK & CHEMICALS Establishments 58 45.0% 7.4% 1,760 2.2% 4.5% Employment 1,589 23.5% 4.6% 72,988 -5.9% -5.5% Location Quotient 1.07 n/a Direct-Effect Employment Multiplier 5.4 5.6 Total Employment Impact 8,529 405,197 Average Annual Wage (constant 2010 dollars) $57,189 5.7% 1.1% $70,869 8.7% 1.5%
DRUGS & PHARMACEUTICALS Establishments 54 5.9% 10.2% 2,908 11.3% 6.5% Employment 3,478 54.6% 14.9% 296,759 -3.1% -7.0% Location Quotient 0.57 n/a Direct-Effect Employment Multiplier 3.7 5.3
Total Employment Impact 12,760 1,464,492 Average Annual Wage (constant 2010 dollars) $69,191 8.9% 0.7% $99,486 15.3% 1.1%
MEDICAL DEVICES & EQUIPMENT Establishments 332 53.9% 10.3% 6,957 11.7% 7.7% Employment 26,774 31.3% -0.3% 343,468 -0.3% -0.8% Location Quotient 3.81 n/a Direct-Effect Employment Multiplier 3.4 2.9 Total Employment Impact 90,533 956,767 Average Annual Wage (constant 2010 dollars) $87,819 21.3% 7.9% $72,301 13.9% 1.0%
RESEARCH, TESTING, & MEDICAL LABORATORIES Establishments 317 41.6% 17.2% 22,212 48.9% 20.1% Employment 6,218 15.8% 4.4% 451,923 23.8% 6.1% Location Quotient 0.67 n/a Direct-Effect Employment Multiplier 2.5 2.6 Total Employment Impact 15,545 1,178,741 Average Annual Wage (constant 2010 dollars) $80,729 15.6% 6.1% $84,065 12.3% 1.5%
BIOSCIENCE-RELATED DISTRIBUTION Establishments 892 17.4% 9.8% 36,170 -1.1% -0.3% Employment 9,942 -5.5% -10.9% 440,394 6.0% -4.2% Location Quotient 1.11 n/a Direct-Effect Employment Multiplier 2.5 2.4 Total Employment Impact Multiplier 24,983 1,046,594 Average Annual Wage (constant 2010 dollars) $85,201 25.3% 4.0% $80,049 12.2% -0.4%
TOTAL BIOSCIENCE INDUSTRY Establishments 1,653 28.1% 11.2% 70,006 12.8% 6.7% Employment 48,001 20.6% -1.1% 1,605,533 6.4% -1.4% Location Quotient 1.46 n/a Direct-Effect Employment Multiplier 3.2 3.2 Total Employment Impact 152,351 5,051,791 Average Annual Wage (constant 2010 dollars) $83,995 20.3% 5.9% $82,697 13.1% 0.6% TOTAL PRIVATE SECTOR
Establishments 155,038 4.7% -2.8% 8,752,494 12.5% 0.1% Employment 2,184,054 -2.5% -5.7% 106,863,403 -2.9% -6.9% Average Annual Wage (constant 2010 dollars) $46,985 3.8% 0.1% $46,317 4.4% -0.4%
Note: U.S. employment metrics include Puerto Rico. Estimates of total employment impacts do not include Puerto Rico.
Employment, Establishment, and Wage Data: U.S. Bureau of Labor Statistics, Quarterly Census of Employment and Wages (QCEW); enhanced file from IMPLAN.
Employment Multipliers: U.S. Bureau of Economic Analysis RIMS II Employment Multipliers, 2008 (most current available).

MIS
SIS
SIP
PI
Battelle/BIO State Bioscience Industry Development 2012
MS MISSISSIPPI ● Mississippi’s
bioscience industry employs
more than 6,500 across 469
business establishments. The
state has a specialized
concentration of employment
in the agricultural feedstock
and chemicals subsector with
nearly 1,200 jobs and a
location quotient of 2.04 in
2010. Despite overall
employment declines in the
state’s bioscience sector in
recent years, two of the five
major subsectors have added
jobs since 2007—medical
devices and research, testing,
and medical labs.
Bioscience Summary of State Performance Employment Tier in Industry Related Metrics
Metrics Mississippi United States Rank* Bioscience Industry, 2010 Total Bioscience Industry Employment 6,522 1,605,533 IV
Bioscience Industry Location Quotient 0.52 n/a V
Biosciences Industry Establishments 469 70,006 IV
*State ranking figures for bioscience industry employment metrics are calculated as quintiles (I=Top Quintile; V=Bottom Quintile).
90
92
94
96
98
100
102
104
106
108
110
2001 2002 2003 2004 2005 2006 2007 2008 2009 2010
Em
plo
ymen
t In
dex
(20
01 =
100
)
Mississippi Bioscience Industry
Mississippi Total Private Sector

Bioscience Industry Base, 2010
Mississippi Highlights:
Mississippi United States INDUSTRY SUBSECTOR 2010 2001–10
Change 2007–10 Change 2010 2001–10
Change 2007–10 Change
AGRICULTURAL FEEDSTOCK & CHEMICALS Establishments 20 5.1% 0.0% 1,760 2.2% 4.5% Employment 1,162 -9.1% -8.8% 72,988 -5.9% -5.5% Location Quotient 2.04 n/a Direct-Effect Employment Multiplier 4.5 5.6 Total Employment Impact 5,273 405,197 Average Annual Wage (constant 2010 dollars) $51,006 8.9% 13.0% $70,869 8.7% 1.5%
DRUGS & PHARMACEUTICALS Establishments 14 7.7% -17.6% 2,908 11.3% 6.5% Employment 930 -19.3% -24.9% 296,759 -3.1% -7.0% Location Quotient 0.40 n/a Direct-Effect Employment Multiplier 2.4 5.3
Total Employment Impact 2,272 1,464,492 Average Annual Wage (constant 2010 dollars) $41,601 4.8% 4.7% $99,486 15.3% 1.1%
MEDICAL DEVICES & EQUIPMENT Establishments 27 -11.1% -10.0% 6,957 11.7% 7.7% Employment 550 -27.9% 19.3% 343,468 -0.3% -0.8% Location Quotient 0.21 n/a Direct-Effect Employment Multiplier 1.8 2.9 Total Employment Impact 973 956,767 Average Annual Wage (constant 2010 dollars) $39,131 19.7% -17.3% $72,301 13.9% 1.0%
RESEARCH, TESTING, & MEDICAL LABORATORIES Establishments 98 35.7% 12.1% 22,212 48.9% 20.1% Employment 861 -0.7% 11.8% 451,923 23.8% 6.1% Location Quotient 0.24 n/a Direct-Effect Employment Multiplier 1.8 2.6 Total Employment Impact 1,561 1,178,741 Average Annual Wage (constant 2010 dollars) $48,418 15.6% -0.7% $84,065 12.3% 1.5%
BIOSCIENCE-RELATED DISTRIBUTION Establishments 310 -10.4% -1.2% 36,170 -1.1% -0.3% Employment 3,018 0.5% -10.1% 440,394 6.0% -4.2% Location Quotient 0.88 n/a Direct-Effect Employment Multiplier 2.0 2.4 Total Employment Impact Multiplier 6,108 1,046,594 Average Annual Wage (constant 2010 dollars) $65,652 8.3% -18.9% $80,049 12.2% -0.4%
TOTAL BIOSCIENCE INDUSTRY Establishments 469 -2.5% 0.2% 70,006 12.8% 6.7% Employment 6,522 -7.7% -8.2% 1,605,533 6.4% -1.4% Location Quotient 0.52 n/a Direct-Effect Employment Multiplier 2.5 3.2 Total Employment Impact 16,187 5,051,791 Average Annual Wage (constant 2010 dollars) $55,099 11.6% -10.6% $82,697 13.1% 0.6% TOTAL PRIVATE SECTOR
Establishments 65,138 9.1% -1.0% 8,752,494 12.5% 0.1% Employment 833,480 -5.8% -7.2% 106,863,403 -2.9% -6.9% Average Annual Wage (constant 2010 dollars) $40,860 6.4% 0.6% $46,317 4.4% -0.4%
Note: U.S. employment metrics include Puerto Rico. Estimates of total employment impacts do not include Puerto Rico.
Employment, Establishment, and Wage Data: U.S. Bureau of Labor Statistics, Quarterly Census of Employment and Wages (QCEW); enhanced file from IMPLAN.
Employment Multipliers: U.S. Bureau of Economic Analysis RIMS II Employment Multipliers, 2008 (most current available).

MIS
SO
URI
Battelle/BIO State Bioscience Industry Development 2012
MO MISSOURI ● Missouri’s bioscience industry maintains a specialized employment concentration in the agricultural feedstock and chemicals subsector with more than 2,600 state jobs and a location quotient of 1.80 in 2010. Despite national declines in the agbioscience subsector, Missouri has managed to add jobs since 2007. Its largest subsector, research, testing, and medical labs, emerged over the decade with 60 percent job growth overall since 2001 and is highly concentrated with a 1.08 location quotient.
Bioscience Summary of State Performance Employment Tier in Industry Related Metrics
Metrics Missouri United States Rank* Bioscience Industry, 2010 Total Bioscience Industry Employment 27,180 1,605,533 II
Bioscience Industry Location Quotient 0.84 n/a III
Biosciences Industry Establishments 1,309 70,006 II
*State ranking figures for bioscience industry employment metrics are calculated as quintiles (I=Top Quintile; V=Bottom Quintile).
85
90
95
100
105
110
115
2001 2002 2003 2004 2005 2006 2007 2008 2009 2010
Em
plo
yme
nt I
ndex
(2
001
= 1
00)
Missouri Bioscience Industry
Missouri Total Private Sector

Bioscience Industry Base, 2010
Missouri Highlights:
Missouri United States INDUSTRY SUBSECTOR 2010 2001–10
Change 2007–10 Change 2010 2001–10
Change 2007–10 Change
AGRICULTURAL FEEDSTOCK & CHEMICALS Establishments 74 -3.5% -12.6% 1,760 2.2% 4.5% Employment 2,630 -7.2% 3.4% 72,988 -5.9% -5.5% Location Quotient 1.80 n/a Direct-Effect Employment Multiplier 5.8 5.6 Total Employment Impact 15,221 405,197 Average Annual Wage (constant 2010 dollars) $58,836 -15.5% -8.7% $70,869 8.7% 1.5%
DRUGS & PHARMACEUTICALS Establishments 67 -20.2% -11.8% 2,908 11.3% 6.5% Employment 4,573 -13.0% -12.1% 296,759 -3.1% -7.0% Location Quotient 0.77 n/a Direct-Effect Employment Multiplier 5.1 5.3
Total Employment Impact 23,187 1,464,492 Average Annual Wage (constant 2010 dollars) $76,123 -12.6% 9.3% $99,486 15.3% 1.1%
MEDICAL DEVICES & EQUIPMENT Establishments 96 -12.8% 7.9% 6,957 11.7% 7.7% Employment 2,508 -26.0% -21.3% 343,468 -0.3% -0.8% Location Quotient 0.36 n/a Direct-Effect Employment Multiplier 2.2 2.9 Total Employment Impact 5,606 956,767 Average Annual Wage (constant 2010 dollars) $50,052 -1.4% -1.4% $72,301 13.9% 1.0%
RESEARCH, TESTING, & MEDICAL LABORATORIES Establishments 427 39.0% 13.2% 22,212 48.9% 20.1% Employment 9,758 59.8% -2.1% 451,923 23.8% 6.1% Location Quotient 1.08 n/a Direct-Effect Employment Multiplier 3.1 2.6 Total Employment Impact 30,436 1,178,741 Average Annual Wage (constant 2010 dollars) $78,787 -1.2% -13.4% $84,065 12.3% 1.5%
BIOSCIENCE-RELATED DISTRIBUTION Establishments 645 -31.1% -12.7% 36,170 -1.1% -0.3% Employment 7,711 -13.3% -11.5% 440,394 6.0% -4.2% Location Quotient 0.87 n/a Direct-Effect Employment Multiplier 2.4 2.4 Total Employment Impact Multiplier 18,792 1,046,594 Average Annual Wage (constant 2010 dollars) $65,030 -3.8% -6.1% $80,049 12.2% -0.4%
TOTAL BIOSCIENCE INDUSTRY Establishments 1,309 -13.6% -4.2% 70,006 12.8% 6.7% Employment 27,180 2.6% -8.2% 1,605,533 6.4% -1.4% Location Quotient 0.84 n/a Direct-Effect Employment Multiplier 3.4 3.2 Total Employment Impact 93,242 5,051,791 Average Annual Wage (constant 2010 dollars) $69,853 -3.4% -5.9% $82,697 13.1% 0.6% TOTAL PRIVATE SECTOR
Establishments 163,962 6.6% -0.6% 8,752,494 12.5% 0.1% Employment 2,143,636 -4.4% -6.6% 106,863,403 -2.9% -6.9% Average Annual Wage (constant 2010 dollars) $33,524 1.7% -0.1% $46,317 4.4% -0.4%
Note: U.S. employment metrics include Puerto Rico. Estimates of total employment impacts do not include Puerto Rico.
Employment, Establishment, and Wage Data: U.S. Bureau of Labor Statistics, Quarterly Census of Employment and Wages (QCEW); enhanced file from IMPLAN.
Employment Multipliers: U.S. Bureau of Economic Analysis RIMS II Employment Multipliers, 2008 (most current available).

MO
NTA
NA
Battelle/BIO State Bioscience Industry Development 2012
MT MONTANA ● Montana
employs nearly 2,500 in its
bioscience industry across
354 business establishments.
Though modest in size, the
state industry has grown by
9 percent overall since 2001.
Its largest major subsector,
bioscience-related distribution,
represents just over 1,300
jobs in 2010.
Bioscience Summary of State Performance Employment Tier in Industry Related Metrics
Metrics Montana United States Rank* Bioscience Industry, 2010 Total Bioscience Industry Employment 2,464 1,605,533 V
Bioscience Industry Location Quotient 0.49 n/a V
Biosciences Industry Establishments 354 70,006 IV
*State ranking figures for bioscience industry employment metrics are calculated as quintiles (I=Top Quintile; V=Bottom Quintile).
80
85
90
95
100
105
110
115
120
2001 2002 2003 2004 2005 2006 2007 2008 2009 2010
Em
plo
ymen
t In
dex
(20
01 =
100
)
Montana Bioscience Industry Montana Total Private Sector

Bioscience Industry Base, 2010
Montana Highlights:
Montana United States INDUSTRY SUBSECTOR 2010 2001–10
Change 2007–10 Change 2010 2001–10
Change 2007–10 Change
AGRICULTURAL FEEDSTOCK & CHEMICALS Establishments 11 -47.0% -21.4% 1,760 2.2% 4.5% Employment 117 -18.9% -40.5% 72,988 -5.9% -5.5% Location Quotient 0.51 n/a Direct-Effect Employment Multiplier 3.3 5.6 Total Employment Impact 379 405,197 Average Annual Wage (constant 2010 dollars) $41,680 -3.1% -18.7% $70,869 8.7% 1.5%
DRUGS & PHARMACEUTICALS Establishments 12 50.0% 20.0% 2,908 11.3% 6.5% Employment 240 211.7% 47.2% 296,759 -3.1% -7.0% Location Quotient 0.26 n/a Direct-Effect Employment Multiplier 2.3 5.3
Total Employment Impact 540 1,464,492 Average Annual Wage (constant 2010 dollars) $38,780 -0.1% -21.5% $99,486 15.3% 1.1%
MEDICAL DEVICES & EQUIPMENT Establishments 26 28.6% 13.0% 6,957 11.7% 7.7% Employment 238 12.4% 7.6% 343,468 -0.3% -0.8% Location Quotient 0.22 n/a Direct-Effect Employment Multiplier 1.5 2.9 Total Employment Impact 365 956,767 Average Annual Wage (constant 2010 dollars) $40,382 11.8% 6.1% $72,301 13.9% 1.0%
RESEARCH, TESTING, & MEDICAL LABORATORIES Establishments 86 31.3% 22.5% 22,212 48.9% 20.1% Employment 563 58.9% 3.9% 451,923 23.8% 6.1% Location Quotient 0.40 n/a Direct-Effect Employment Multiplier 1.9 2.6 Total Employment Impact 1,094 1,178,741 Average Annual Wage (constant 2010 dollars) $55,878 22.7% 1.8% $84,065 12.3% 1.5%
BIOSCIENCE-RELATED DISTRIBUTION Establishments 219 -24.6% -1.7% 36,170 -1.1% -0.3% Employment 1,307 -11.0% -9.3% 440,394 6.0% -4.2% Location Quotient 0.95 n/a Direct-Effect Employment Multiplier 1.9 2.4 Total Employment Impact Multiplier 2,514 1,046,594 Average Annual Wage (constant 2010 dollars) $56,091 12.3% 1.7% $80,049 12.2% -0.4%
TOTAL BIOSCIENCE INDUSTRY Establishments 354 -12.5% 4.1% 70,006 12.8% 6.7% Employment 2,464 9.2% -3.8% 1,605,533 6.4% -1.4% Location Quotient 0.49 n/a Direct-Effect Employment Multiplier 2.0 3.2 Total Employment Impact 4,893 5,051,791 Average Annual Wage (constant 2010 dollars) $52,160 10.7% -1.5% $82,697 13.1% 0.6% TOTAL PRIVATE SECTOR
Establishments 39,939 4.6% -0.6% 8,752,494 12.5% 0.1% Employment 334,983 9.2% -6.1% 106,863,403 -2.9% -6.9% Average Annual Wage (constant 2010 dollars) $33,236 11.9% 2.1% $46,317 4.4% -0.4%
Note: U.S. employment metrics include Puerto Rico. Estimates of total employment impacts do not include Puerto Rico.
Employment, Establishment, and Wage Data: U.S. Bureau of Labor Statistics, Quarterly Census of Employment and Wages (QCEW); enhanced file from IMPLAN.
Employment Multipliers: U.S. Bureau of Economic Analysis RIMS II Employment Multipliers, 2008 (most current available).

NEB
RASKA
Battelle/BIO State Bioscience Industry Development 2012
NE NEBRASKA ● Nebraska’s
bioscience industry is diverse,
sizable, and growing. The
state has added nearly
7 percent to its industry
employment base since 2007,
a period which includes the
deep national recession. Three
of its five major subsectors
have a specialized employment
concentration—agricultural
feedstock and chemicals
(location quotient of 4.90);
bioscience-related distribution
(LQ of 1.81); and medical
devices (LQ of 1.64).
Bioscience Summary of State Performance Employment Tier in Industry Related Metrics
Metrics Nebraska United States Rank* Bioscience Industry, 2010 Total Bioscience Industry Employment 14,978 1,605,533 III
Bioscience Industry Location Quotient 1.35 n/a I
Biosciences Industry Establishments 910 70,006 III
*State ranking figures for bioscience industry employment metrics are calculated as quintiles (I=Top Quintile; V=Bottom Quintile).
90
92
94
96
98
100
102
104
106
108
110
2001 2002 2003 2004 2005 2006 2007 2008 2009 2010
Em
plo
yme
nt I
ndex
(2
001
= 1
00)
Nebraska Bioscience Industry
Nebraska Total Private Sector

Bioscience Industry Base, 2010
Nebraska Highlights:
Nebraska United States INDUSTRY SUBSECTOR 2010 2001–10
Change 2007–10 Change 2010 2001–10
Change 2007–10 Change
AGRICULTURAL FEEDSTOCK & CHEMICALS Establishments 49 34.9% -14.0% 1,760 2.2% 4.5% Employment 2,464 86.2% 5.7% 72,988 -5.9% -5.5% Location Quotient 4.90 n/a Direct-Effect Employment Multiplier 3.3 5.6 Total Employment Impact 8,240 405,197 Average Annual Wage (constant 2010 dollars) $55,806 0.8% -5.1% $70,869 8.7% 1.5%
DRUGS & PHARMACEUTICALS Establishments 22 -12.0% 10.0% 2,908 11.3% 6.5% Employment 1,646 -3.5% -12.5% 296,759 -3.1% -7.0% Location Quotient 0.80 n/a Direct-Effect Employment Multiplier 2.8 5.3
Total Employment Impact 4,662 1,464,492 Average Annual Wage (constant 2010 dollars) $67,565 11.0% 12.4% $99,486 15.3% 1.1%
MEDICAL DEVICES & EQUIPMENT Establishments 26 -8.0% -13.3% 6,957 11.7% 7.7% Employment 3,873 -1.7% 24.6% 343,468 -0.3% -0.8% Location Quotient 1.64 n/a Direct-Effect Employment Multiplier 1.8 2.9 Total Employment Impact 6,855 956,767 Average Annual Wage (constant 2010 dollars) $49,135 10.3% -3.7% $72,301 13.9% 1.0%
RESEARCH, TESTING, & MEDICAL LABORATORIES Establishments 91 59.5% 3.7% 22,212 48.9% 20.1% Employment 1,492 12.7% -8.3% 451,923 23.8% 6.1% Location Quotient 0.48 n/a Direct-Effect Employment Multiplier 1.8 2.6 Total Employment Impact 2,662 1,178,741 Average Annual Wage (constant 2010 dollars) $61,565 21.1% 8.7% $84,065 12.3% 1.5%
BIOSCIENCE-RELATED DISTRIBUTION Establishments 722 25.0% 16.7% 36,170 -1.1% -0.3% Employment 5,503 -5.6% 7.5% 440,394 6.0% -4.2% Location Quotient 1.81 n/a Direct-Effect Employment Multiplier 1.9 2.4 Total Employment Impact Multiplier 10,369 1,046,594 Average Annual Wage (constant 2010 dollars) $55,966 16.4% 3.4% $80,049 12.2% -0.4%
TOTAL BIOSCIENCE INDUSTRY Establishments 910 25.6% 11.9% 70,006 12.8% 6.7% Employment 14,978 6.1% 6.5% 1,605,533 6.4% -1.4% Location Quotient 1.35 n/a Direct-Effect Employment Multiplier 2.2 3.2 Total Employment Impact 32,788 5,051,791 Average Annual Wage (constant 2010 dollars) $56,006 13.0% 1.3% $82,697 13.1% 0.6% TOTAL PRIVATE SECTOR
Establishments 56,046 13.3% 1.7% 8,752,494 12.5% 0.1% Employment 736,840 0.2% -3.3% 106,863,403 -2.9% -6.9% Average Annual Wage (constant 2010 dollars) $40,866 6.3% 0.0% $46,317 4.4% -0.4%
Note: U.S. employment metrics include Puerto Rico. Estimates of total employment impacts do not include Puerto Rico.
Employment, Establishment, and Wage Data: U.S. Bureau of Labor Statistics, Quarterly Census of Employment and Wages (QCEW); enhanced file from IMPLAN.
Employment Multipliers: U.S. Bureau of Economic Analysis RIMS II Employment Multipliers, 2008 (most current available).

NEV
AD
A
Battelle/BIO State Bioscience Industry Development 2012
NV NEVADA ● The Nevada
bioscience industry employs
nearly 5,000 across 352
business establishments. Its
largest major subsector,
research, testing, and medical
labs, represents about half of
these jobs at 2,400 in 2010.
Average annual wages in the
state industry are just over
$60,000 or 58 percent higher
than the average for the
overall Nevada private sector.
Bioscience Summary of State Performance Employment Tier in Industry Related Metrics
Metrics Nevada United States Rank* Bioscience Industry, 2010 Total Bioscience Industry Employment 4,979 1,605,533 V
Bioscience Industry Location Quotient 0.35 n/a V
Biosciences Industry Establishments 352 70,006 IV
*State ranking figures for bioscience industry employment metrics are calculated as quintiles (I=Top Quintile; V=Bottom Quintile).
70
80
90
100
110
120
130
2001 2002 2003 2004 2005 2006 2007 2008 2009 2010
Em
plo
yme
nt I
ndex
(2
001
= 1
00)
Nevada Bioscience Industry
Nevada Total Private Sector

Bioscience Industry Base, 2010
Nevada Highlights:
Nevada United States INDUSTRY SUBSECTOR 2010 2001–10
Change 2007–10 Change 2010 2001–10
Change 2007–10 Change
AGRICULTURAL FEEDSTOCK & CHEMICALS Establishments 8 192.7% -20.0% 1,760 2.2% 4.5% Employment 85 123.5% -20.8% 72,988 -5.9% -5.5% Location Quotient 0.13 n/a Direct-Effect Employment Multiplier 3.4 5.6 Total Employment Impact 288 405,197 Average Annual Wage (constant 2010 dollars) $55,068 -9.1% -8.5% $70,869 8.7% 1.5%
DRUGS & PHARMACEUTICALS Establishments 19 11.8% -17.4% 2,908 11.3% 6.5% Employment 459 33.8% -5.4% 296,759 -3.1% -7.0% Location Quotient 0.17 n/a Direct-Effect Employment Multiplier 3.0 5.3
Total Employment Impact 1,358 1,464,492 Average Annual Wage (constant 2010 dollars) $45,838 -18.3% 1.5% $99,486 15.3% 1.1%
MEDICAL DEVICES & EQUIPMENT Establishments 30 11.1% 15.4% 6,957 11.7% 7.7% Employment 535 -0.7% 32.6% 343,468 -0.3% -0.8% Location Quotient 0.17 n/a Direct-Effect Employment Multiplier 2.0 2.9 Total Employment Impact 1,089 956,767 Average Annual Wage (constant 2010 dollars) $60,167 2.0% -3.0% $72,301 13.9% 1.0%
RESEARCH, TESTING, & MEDICAL LABORATORIES Establishments 164 45.1% 12.1% 22,212 48.9% 20.1% Employment 2,408 -13.5% -23.5% 451,923 23.8% 6.1% Location Quotient 0.59 n/a Direct-Effect Employment Multiplier 2.1 2.6 Total Employment Impact 5,131 1,178,741 Average Annual Wage (constant 2010 dollars) $64,687 14.8% -6.8% $84,065 12.3% 1.5%
BIOSCIENCE-RELATED DISTRIBUTION Establishments 132 -14.8% 0.4% 36,170 -1.1% -0.3% Employment 1,493 -6.7% -10.3% 440,394 6.0% -4.2% Location Quotient 0.38 n/a Direct-Effect Employment Multiplier 2.1 2.4 Total Employment Impact Multiplier 3,147 1,046,594 Average Annual Wage (constant 2010 dollars) $57,143 0.0% -12.1% $80,049 12.2% -0.4%
TOTAL BIOSCIENCE INDUSTRY Establishments 352 12.2% 4.8% 70,006 12.8% 6.7% Employment 4,979 -6.1% -14.2% 1,605,533 6.4% -1.4% Location Quotient 0.35 n/a Direct-Effect Employment Multiplier 2.2 3.2 Total Employment Impact 11,014 5,051,791 Average Annual Wage (constant 2010 dollars) $60,038 5.6% -8.2% $82,697 13.1% 0.6% TOTAL PRIVATE SECTOR
Establishments 70,879 42.6% -4.1% 8,752,494 12.5% 0.1% Employment 958,130 4.0% -15.3% 106,863,403 -2.9% -6.9% Average Annual Wage (constant 2010 dollars) $38,028 3.2% -5.6% $46,317 4.4% -0.4%
Note: U.S. employment metrics include Puerto Rico. Estimates of total employment impacts do not include Puerto Rico.
Employment, Establishment, and Wage Data: U.S. Bureau of Labor Statistics, Quarterly Census of Employment and Wages (QCEW); enhanced file from IMPLAN.
Employment Multipliers: U.S. Bureau of Economic Analysis RIMS II Employment Multipliers, 2008 (most current available).

NEW
HAM
SH
IRE
Battelle/BIO State Bioscience Industry Development 2012
NH NEW HAMPSHIRE ●
New Hampshire’s bioscience
industry employs more than
5,100 spanning 258 business
establishments and featuring a
specialized employment
concentration in the medical
device and equipment
subsector. The state subsector
employs 2,597 with a location
quotient of 1.57 in 2010.
Medical device manufacturers
employ half of the New
Hampshire bioscience industry.
Bioscience Summary of State Performance Employment Tier in Industry Related Metrics
Metrics New Hampshire United States Rank* Bioscience Industry, 2010 Total Bioscience Industry Employment 5,143 1,605,533 IV
Bioscience Industry Location Quotient 0.67 n/a IV
Biosciences Industry Establishments 258 70,006 V
*State ranking figures for bioscience industry employment metrics are calculated as quintiles (I=Top Quintile; V=Bottom Quintile).
85
90
95
100
105
110
115
2001 2002 2003 2004 2005 2006 2007 2008 2009 2010
Em
plo
yme
nt I
ndex
(2
001
= 1
00)
New Hampshire Bioscience Industry
New Hampshire Total Private Sector

Bioscience Industry Base, 2010
New Hampshire Highlights:
New Hampshire United States INDUSTRY SUBSECTOR 2010 2001–10
Change 2007–10 Change 2010 2001–10
Change 2007–10 Change
AGRICULTURAL FEEDSTOCK & CHEMICALS Establishments 3 -45.5% 130.8% 1,760 2.2% 4.5% Employment 14 223.4% 435.9% 72,988 -5.9% -5.5% Location Quotient 0.04 n/a Direct-Effect Employment Multiplier 1.0 5.6 Total Employment Impact 14 405,197 Average Annual Wage (constant 2010 dollars) $38,363 2.8% -47.4% $70,869 8.7% 1.5%
DRUGS & PHARMACEUTICALS Establishments 11 37.5% -8.3% 2,908 11.3% 6.5% Employment 917 35.1% -1.9% 296,759 -3.1% -7.0% Location Quotient 0.64 n/a Direct-Effect Employment Multiplier 3.5 5.3
Total Employment Impact 3,181 1,464,492 Average Annual Wage (constant 2010 dollars) $66,315 15.5% -2.3% $99,486 15.3% 1.1%
MEDICAL DEVICES & EQUIPMENT Establishments 63 27.3% 10.5% 6,957 11.7% 7.7% Employment 2,597 -8.8% -18.1% 343,468 -0.3% -0.8% Location Quotient 1.57 n/a Direct-Effect Employment Multiplier 2.3 2.9 Total Employment Impact 5,972 956,767 Average Annual Wage (constant 2010 dollars) $59,548 23.5% -5.5% $72,301 13.9% 1.0%
RESEARCH, TESTING, & MEDICAL LABORATORIES Establishments 96 -9.4% 13.4% 22,212 48.9% 20.1% Employment 878 -30.2% 8.8% 451,923 23.8% 6.1% Location Quotient 0.40 n/a Direct-Effect Employment Multiplier 2.6 2.6 Total Employment Impact 2,305 1,178,741 Average Annual Wage (constant 2010 dollars) $84,909 26.5% 3.8% $84,065 12.3% 1.5%
BIOSCIENCE-RELATED DISTRIBUTION Establishments 84 -4.4% 8.2% 36,170 -1.1% -0.3% Employment 737 -30.8% -6.0% 440,394 6.0% -4.2% Location Quotient 0.35 n/a Direct-Effect Employment Multiplier 2.4 2.4 Total Employment Impact Multiplier 1,796 1,046,594 Average Annual Wage (constant 2010 dollars) $72,024 4.1% -8.8% $80,049 12.2% -0.4%
TOTAL BIOSCIENCE INDUSTRY Establishments 258 0.0% 10.5% 70,006 12.8% 6.7% Employment 5,143 -12.1% -9.8% 1,605,533 6.4% -1.4% Location Quotient 0.67 n/a Direct-Effect Employment Multiplier 2.6 3.2 Total Employment Impact 13,268 5,051,791 Average Annual Wage (constant 2010 dollars) $66,813 16.9% -2.7% $82,697 13.1% 0.6% TOTAL PRIVATE SECTOR
Establishments 45,756 3.6% -2.2% 8,752,494 12.5% 0.1% Employment 513,524 -3.3% -5.6% 106,863,403 -2.9% -6.9% Average Annual Wage (constant 2010 dollars) $36,684 4.5% -0.7% $46,317 4.4% -0.4%
Note: U.S. employment metrics include Puerto Rico. Estimates of total employment impacts do not include Puerto Rico.
Employment, Establishment, and Wage Data: U.S. Bureau of Labor Statistics, Quarterly Census of Employment and Wages (QCEW); enhanced file from IMPLAN.
Employment Multipliers: U.S. Bureau of Economic Analysis RIMS II Employment Multipliers, 2008 (most current available).

NEW
JER
SEY
Battelle/BIO State Bioscience Industry Development 2012
NJ NEW JERSEY ● New Jersey is a leading state in the biosciences with more than 91,000 employed in 2010 across 2,554 business establishments. The state sector is highly specialized overall and diverse, recognized in this report as one of just two states to have a specialized employment concentration in four of five major subsectors. These include: drugs and pharmaceuticals; research, testing, and medical labs; bioscience-related distribution; and medical devices.
Bioscience Summary of State Performance Employment Tier in Industry Related Metrics
Metrics New Jersey United States Rank* Bioscience Industry, 2010 Total Bioscience Industry Employment 91,167 1,605,533 I
Bioscience Industry Location Quotient 1.93 n/a I
Biosciences Industry Establishments 2,554 70,006 I
*State ranking figures for bioscience industry employment metrics are calculated as quintiles (I=Top Quintile; V=Bottom Quintile).
90
92
94
96
98
100
102
104
106
108
110
2001 2002 2003 2004 2005 2006 2007 2008 2009 2010
Em
plo
yme
nt I
ndex
(2
001
= 1
00)
New Jersey Bioscience Industry
New Jersey Total Private Sector

Bioscience Industry Base, 2010
New Jersey Highlights:
New Jersey United States INDUSTRY SUBSECTOR 2010 2001–10
Change 2007–10 Change 2010 2001–10
Change 2007–10 Change
AGRICULTURAL FEEDSTOCK & CHEMICALS Establishments 21 -16.0% -4.5% 1,760 2.2% 4.5% Employment 569 58.7% 35.6% 72,988 -5.9% -5.5% Location Quotient 0.27 n/a Direct-Effect Employment Multiplier 6.2 5.6 Total Employment Impact 3,552 405,197 Average Annual Wage (constant 2010 dollars) $95,880 50.3% 18.2% $70,869 8.7% 1.5%
DRUGS & PHARMACEUTICALS Establishments 253 24.6% 2.8% 2,908 11.3% 6.5% Employment 32,794 -13.5% -22.4% 296,759 -3.1% -7.0% Location Quotient 3.77 n/a Direct-Effect Employment Multiplier 6.9 5.3
Total Employment Impact 225,547 1,464,492 Average Annual Wage (constant 2010 dollars) $143,184 40.1% 9.7% $99,486 15.3% 1.1%
MEDICAL DEVICES & EQUIPMENT Establishments 293 20.1% 14.0% 6,957 11.7% 7.7% Employment 13,148 -3.6% 4.7% 343,468 -0.3% -0.8% Location Quotient 1.30 n/a Direct-Effect Employment Multiplier 3.0 2.9 Total Employment Impact 39,470 956,767 Average Annual Wage (constant 2010 dollars) $93,696 21.7% 1.6% $72,301 13.9% 1.0%
RESEARCH, TESTING, & MEDICAL LABORATORIES Establishments 896 54.4% 17.4% 22,212 48.9% 20.1% Employment 26,721 3.0% 6.9% 451,923 23.8% 6.1% Location Quotient 2.02 n/a Direct-Effect Employment Multiplier 2.9 2.6 Total Employment Impact 78,097 1,178,741 Average Annual Wage (constant 2010 dollars) $108,361 12.1% 1.4% $84,065 12.3% 1.5%
BIOSCIENCE-RELATED DISTRIBUTION Establishments 1,091 29.0% 9.7% 36,170 -1.1% -0.3% Employment 17,935 -13.3% -3.9% 440,394 6.0% -4.2% Location Quotient 1.39 n/a Direct-Effect Employment Multiplier 2.6 2.4 Total Employment Impact Multiplier 47,253 1,046,594 Average Annual Wage (constant 2010 dollars) $116,326 6.5% 14.2% $80,049 12.2% -0.4%
TOTAL BIOSCIENCE INDUSTRY Establishments 2,554 34.6% 11.9% 70,006 12.8% 6.7% Employment 91,167 -7.5% -7.8% 1,605,533 6.4% -1.4% Location Quotient 1.94 n/a Direct-Effect Employment Multiplier 4.3 3.2 Total Employment Impact 393,918 5,051,791 Average Annual Wage (constant 2010 dollars) $120,261 22.0% 5.5% $82,697 13.1% 0.6% TOTAL PRIVATE SECTOR
Establishments 261,477 3.8% -1.6% 8,752,494 12.5% 0.1% Employment 3,136,163 -5.1% -6.4% 106,863,403 -2.9% -6.9% Average Annual Wage (constant 2010 dollars) $46,281 2.5% -1.1% $46,317 4.4% -0.4%
Note: U.S. employment metrics include Puerto Rico. Estimates of total employment impacts do not include Puerto Rico.
Employment, Establishment, and Wage Data: U.S. Bureau of Labor Statistics, Quarterly Census of Employment and Wages (QCEW); enhanced file from IMPLAN.
Employment Multipliers: U.S. Bureau of Economic Analysis RIMS II Employment Multipliers, 2008 (most current available).

NEW
MEX
ICO
Battelle/BIO State Bioscience Industry Development 2012
NM NEW MEXICO ● New Mexico’s
bioscience industry employs
more than 7,400 across 526
business establishments.
About two in three state
bioscience jobs are in the
research, testing, and medical
labs subsector in which the
state has a specialized
employment concentration
with a location quotient of
2.03 in 2010. This subsector
has increased employment
steadily over the decade,
adding 67 percent to its base
since 2001 and continuing
growth since 2007.
Bioscience Summary of State Performance Employment Tier in Industry Related Metrics
Metrics New Mexico United States Rank* Bioscience Industry, 2010 Total Bioscience Industry Employment 7,443 1,605,533 IV
Bioscience Industry Location Quotient 0.84 n/a III
Biosciences Industry Establishments 526 70,006 IV
*State ranking figures for bioscience industry employment metrics are calculated as quintiles (I=Top Quintile; V=Bottom Quintile).
40
60
80
100
120
140
160
2001 2002 2003 2004 2005 2006 2007 2008 2009 2010
Em
plo
ymen
t In
dex
(20
01 =
100
)
New Mexico Bioscience Industry
New Mexico Total Private Sector

Bioscience Industry Base, 2010
New Mexico Highlights:
New Mexico United States INDUSTRY SUBSECTOR 2010 2001–10
Change 2007–10 Change 2010 2001–10
Change 2007–10 Change
AGRICULTURAL FEEDSTOCK & CHEMICALS Establishments 9 5.9% 12.5% 1,760 2.2% 4.5% Employment 85 28.7% 1.2% 72,988 -5.9% -5.5% Location Quotient 0.21 n/a Direct-Effect Employment Multiplier 4.0 5.6 Total Employment Impact 344 405,197 Average Annual Wage (constant 2010 dollars) $48,767 81.0% -2.8% $70,869 8.7% 1.5%
DRUGS & PHARMACEUTICALS Establishments 11 10.0% 0.0% 2,908 11.3% 6.5% Employment 528 50.9% -19.6% 296,759 -3.1% -7.0% Location Quotient 0.32 n/a Direct-Effect Employment Multiplier 3.1 5.3
Total Employment Impact 1,633 1,464,492 Average Annual Wage (constant 2010 dollars) $51,688 1.4% -4.5% $99,486 15.3% 1.1%
MEDICAL DEVICES & EQUIPMENT Establishments 25 12.5% -13.8% 6,957 11.7% 7.7% Employment 283 -15.1% -65.9% 343,468 -0.3% -0.8% Location Quotient 0.15 n/a Direct-Effect Employment Multiplier 1.8 2.9 Total Employment Impact 501 956,767 Average Annual Wage (constant 2010 dollars) $42,755 -0.9% -20.2% $72,301 13.9% 1.0%
RESEARCH, TESTING, & MEDICAL LABORATORIES Establishments 150 23.0% 18.3% 22,212 48.9% 20.1% Employment 5,098 67.4% 6.2% 451,923 23.8% 6.1% Location Quotient 2.03 n/a Direct-Effect Employment Multiplier 2.5 2.6 Total Employment Impact 12,496 1,178,741 Average Annual Wage (constant 2010 dollars) $74,668 21.7% 2.6% $84,065 12.3% 1.5%
BIOSCIENCE-RELATED DISTRIBUTION Establishments 331 22.6% -1.5% 36,170 -1.1% -0.3% Employment 1,449 -8.3% -20.6% 440,394 6.0% -4.2% Location Quotient 0.59 n/a Direct-Effect Employment Multiplier 2.0 2.4 Total Employment Impact Multiplier 2,825 1,046,594 Average Annual Wage (constant 2010 dollars) $69,108 25.0% 12.4% $80,049 12.2% -0.4%
TOTAL BIOSCIENCE INDUSTRY Establishments 526 21.6% 3.0% 70,006 12.8% 6.7% Employment 7,443 38.5% -9.2% 1,605,533 6.4% -1.4% Location Quotient 0.84 n/a Direct-Effect Employment Multiplier 2.4 3.2 Total Employment Impact 17,799 5,051,791 Average Annual Wage (constant 2010 dollars) $70,448 22.9% 5.8% $82,697 13.1% 0.6% TOTAL PRIVATE SECTOR
Establishments 51,089 12.8% 2.0% 8,752,494 12.5% 0.1% Employment 592,878 5.4% -7.0% 106,863,403 -2.9% -6.9% Average Annual Wage (constant 2010 dollars) $55,724 11.3% 2.5% $46,317 4.4% -0.4%
Note: U.S. employment metrics include Puerto Rico. Estimates of total employment impacts do not include Puerto Rico.
Employment, Establishment, and Wage Data: U.S. Bureau of Labor Statistics, Quarterly Census of Employment and Wages (QCEW); enhanced file from IMPLAN.
Employment Multipliers: U.S. Bureau of Economic Analysis RIMS II Employment Multipliers, 2008 (most current available).

NEW
YO
RK
Battelle/BIO State Bioscience Industry Development 2012
NY NEW YORK ● New York has a large and varied bioscience industry with no one industry subsector demonstrating a specialized employment concentration but with four of the five major components having more than 13,000 jobs each. The state’s largest subsector, research, testing, and medical labs, has increased employment by 12 percent since 2001 and maintained growth even through the more difficult economic period since 2007. The state has a well concentrated drugs and pharmaceuticals subsector with just over 20,000 jobs.
Bioscience Summary of State Performance Employment Tier in Industry Related Metrics
Metrics New York United States Rank* Bioscience Industry, 2010 Total Bioscience Industry Employment 74,873 1,605,533 I
Bioscience Industry Location Quotient 0.72 n/a III
Biosciences Industry Establishments 2,948 70,006 I
*State ranking figures for bioscience industry employment metrics are calculated as quintiles (I=Top Quintile; V=Bottom Quintile).
90
92
94
96
98
100
102
104
106
108
110
2001 2002 2003 2004 2005 2006 2007 2008 2009 2010
Em
plo
yme
nt I
ndex
(2
001
= 1
00)
New York Bioscience Industry
New York Total Private Sector

Bioscience Industry Base, 2010
New York Highlights:
New York United States INDUSTRY SUBSECTOR 2010 2001–10
Change 2007–10 Change 2010 2001–10
Change 2007–10 Change
AGRICULTURAL FEEDSTOCK & CHEMICALS Establishments 41 -13.4% 0.0% 1,760 2.2% 4.5% Employment 1,573 84.1% 50.9% 72,988 -5.9% -5.5% Location Quotient 0.33 n/a Direct-Effect Employment Multiplier 2.5 5.6 Total Employment Impact 3,985 405,197 Average Annual Wage (constant 2010 dollars) $69,487 29.7% 5.0% $70,869 8.7% 1.5%
DRUGS & PHARMACEUTICALS Establishments 162 5.2% -5.3% 2,908 11.3% 6.5% Employment 20,070 -2.8% -7.6% 296,759 -3.1% -7.0% Location Quotient 1.05 n/a Direct-Effect Employment Multiplier 3.4 5.3
Total Employment Impact 67,612 1,464,492 Average Annual Wage (constant 2010 dollars) $77,108 6.5% 4.8% $99,486 15.3% 1.1%
MEDICAL DEVICES & EQUIPMENT Establishments 364 20.9% -1.1% 6,957 11.7% 7.7% Employment 13,135 -12.6% -13.2% 343,468 -0.3% -0.8% Location Quotient 0.59 n/a Direct-Effect Employment Multiplier 2.1 2.9 Total Employment Impact 27,621 956,767 Average Annual Wage (constant 2010 dollars) $60,531 6.2% -5.8% $72,301 13.9% 1.0%
RESEARCH, TESTING, & MEDICAL LABORATORIES Establishments 1,009 31.9% 10.2% 22,212 48.9% 20.1% Employment 23,599 12.3% 8.6% 451,923 23.8% 6.1% Location Quotient 0.81 n/a Direct-Effect Employment Multiplier 1.9 2.6 Total Employment Impact 45,172 1,178,741 Average Annual Wage (constant 2010 dollars) $72,526 11.9% 5.5% $84,065 12.3% 1.5%
BIOSCIENCE-RELATED DISTRIBUTION Establishments 1,372 3.5% 0.0% 36,170 -1.1% -0.3% Employment 16,495 -5.9% -5.4% 440,394 6.0% -4.2% Location Quotient 0.58 n/a Direct-Effect Employment Multiplier 2.1 2.4 Total Employment Impact Multiplier 35,083 1,046,594 Average Annual Wage (constant 2010 dollars) $82,813 11.2% 1.9% $80,049 12.2% -0.4%
TOTAL BIOSCIENCE INDUSTRY Establishments 2,948 13.7% 2.8% 70,006 12.8% 6.7% Employment 74,873 -0.3% -2.9% 1,605,533 6.4% -1.4% Location Quotient 0.72 n/a Direct-Effect Employment Multiplier 2.4 3.2 Total Employment Impact 179,472 5,051,791 Average Annual Wage (constant 2010 dollars) $73,852 9.5% 2.5% $82,697 13.1% 0.6% TOTAL PRIVATE SECTOR
Establishments 575,890 8.6% 2.0% 8,752,494 12.5% 0.1% Employment 6,907,058 -1.7% -3.0% 106,863,403 -2.9% -6.9% Average Annual Wage (constant 2010 dollars) $37,921 4.9% -4.6% $46,317 4.4% -0.4%
Note: U.S. employment metrics include Puerto Rico. Estimates of total employment impacts do not include Puerto Rico.
Employment, Establishment, and Wage Data: U.S. Bureau of Labor Statistics, Quarterly Census of Employment and Wages (QCEW); enhanced file from IMPLAN.
Employment Multipliers: U.S. Bureau of Economic Analysis RIMS II Employment Multipliers, 2008 (most current available).

NO
RTH
CARO
LIN
A
Battelle/BIO State Bioscience Industry Development 2012
NC NORTH CAROLINA ● North
Carolina maintains a large,
specialized, varied, and
growing bioscience industry.
It is one of 11 states and
Puerto Rico to claim a
specialized employment
concentration in three of the
five major industry subsectors.
These include: drugs and
pharmaceuticals; research,
testing, and medical labs;
and agricultural feedstock and
chemicals. Overall, the
industry has grown at a rapid
pace over the decade,
increasing employment by
nearly 24 percent since 2001.
Bioscience Summary of State Performance Employment Tier in Industry Related Metrics
Metrics North Carolina United States Rank* Bioscience Industry, 2010 Total Bioscience Industry Employment 62,386 1,605,533 I
Bioscience Industry Location Quotient 1.34 n/a I
Biosciences Industry Establishments 2,509 70,006 I
*State ranking figures for bioscience industry employment metrics are calculated as quintiles (I=Top Quintile; V=Bottom Quintile).
70
80
90
100
110
120
130
2001 2002 2003 2004 2005 2006 2007 2008 2009 2010
Em
plo
ymen
t In
dex
(20
01 =
100
)North Carolina Bioscience Industry
North Carolina Total Private Sector

Bioscience Industry Base, 2010
North Carolina Highlights:
North Carolina United States INDUSTRY SUBSECTOR 2010 2001–10
Change 2007–10 Change 2010 2001–10
Change 2007–10 Change
AGRICULTURAL FEEDSTOCK & CHEMICALS Establishments 43 -12.3% 7.5% 1,760 2.2% 4.5% Employment 2,540 -33.0% -23.0% 72,988 -5.9% -5.5% Location Quotient 1.20 n/a Direct-Effect Employment Multiplier 5.9 5.6 Total Employment Impact 14,913 405,197 Average Annual Wage (constant 2010 dollars) $84,334 4.0% 8.5% $70,869 8.7% 1.5%
DRUGS & PHARMACEUTICALS Establishments 108 35.0% 35.0% 2,908 11.3% 6.5% Employment 20,120 7.1% 4.6% 296,759 -3.1% -7.0% Location Quotient 2.34 n/a Direct-Effect Employment Multiplier 5.2 5.3
Total Employment Impact 104,874 1,464,492 Average Annual Wage (constant 2010 dollars) $89,592 6.7% -4.4% $99,486 15.3% 1.1%
MEDICAL DEVICES & EQUIPMENT Establishments 175 42.3% 12.9% 6,957 11.7% 7.7% Employment 8,236 20.3% 12.0% 343,468 -0.3% -0.8% Location Quotient 0.83 n/a Direct-Effect Employment Multiplier 2.4 2.9 Total Employment Impact 19,664 956,767 Average Annual Wage (constant 2010 dollars) $53,875 12.4% 0.6% $72,301 13.9% 1.0%
RESEARCH, TESTING, & MEDICAL LABORATORIES Establishments 954 100.3% 60.4% 22,212 48.9% 20.1% Employment 18,168 81.3% 11.4% 451,923 23.8% 6.1% Location Quotient 1.39 n/a Direct-Effect Employment Multiplier 2.5 2.6 Total Employment Impact 45,885 1,178,741 Average Annual Wage (constant 2010 dollars) $80,595 23.3% 6.1% $84,065 12.3% 1.5%
BIOSCIENCE-RELATED DISTRIBUTION Establishments 1,229 17.5% 27.9% 36,170 -1.1% -0.3% Employment 13,322 20.4% -14.6% 440,394 6.0% -4.2% Location Quotient 1.04 n/a Direct-Effect Employment Multiplier 2.3 2.4 Total Employment Impact Multiplier 30,852 1,046,594 Average Annual Wage (constant 2010 dollars) $72,289 10.2% 11.0% $80,049 12.2% -0.4%
TOTAL BIOSCIENCE INDUSTRY Establishments 2,509 41.4% 37.1% 70,006 12.8% 6.7% Employment 62,386 23.5% 1.0% 1,605,533 6.4% -1.4% Location Quotient 1.34 n/a Direct-Effect Employment Multiplier 3.5 3.2 Total Employment Impact 216,188 5,051,791 Average Annual Wage (constant 2010 dollars) $78,348 10.1% 2.8% $82,697 13.1% 0.6% TOTAL PRIVATE SECTOR
Establishments 243,640 12.9% -0.4% 8,752,494 12.5% 0.1% Employment 3,101,379 -2.8% -8.5% 106,863,403 -2.9% -6.9% Average Annual Wage (constant 2010 dollars) $40,900 4.0% 0.6% $46,317 4.4% -0.4%
Note: U.S. employment metrics include Puerto Rico. Estimates of total employment impacts do not include Puerto Rico.
Employment, Establishment, and Wage Data: U.S. Bureau of Labor Statistics, Quarterly Census of Employment and Wages (QCEW); enhanced file from IMPLAN.
Employment Multipliers: U.S. Bureau of Economic Analysis RIMS II Employment Multipliers, 2008 (most current available).

NO
RTH
DAKO
TA
Battelle/BIO State Bioscience Industry Development 2012
ND NORTH DAKOTA ● North
Dakota’s bioscience industry
employs more than 3,600 in
jobs that span 401 business
establishments. Though modest
in size, the state has a
specialized employment
concentration in two of the
five major subsectors—
agricultural feedstock and
chemicals and bioscience-
related distribution. Overall,
the state has experienced
steady growth in the biosciences,
adding 38 percent to its
employment base since 2001.
Bioscience Summary of State Performance Employment Tier in Industry Related Metrics
Metrics North Dakota United States Rank* Bioscience Industry, 2010 Total Bioscience Industry Employment 3,638 1,605,533 V
Bioscience Industry Location Quotient 0.83 n/a III
Biosciences Industry Establishments 401 70,006 IV
*State ranking figures for bioscience industry employment metrics are calculated as quintiles (I=Top Quintile; V=Bottom Quintile).
50
60
70
80
90
100
110
120
130
140
150
2001 2002 2003 2004 2005 2006 2007 2008 2009 2010
Em
plo
yme
nt I
ndex
(2
001
= 1
00)
North Dakota Bioscience Industry
North Dakota Total Private Sector

Bioscience Industry Base, 2010
North Dakota Highlights:
North Dakota United States INDUSTRY SUBSECTOR 2010 2001–10
Change 2007–10 Change 2010 2001–10
Change 2007–10 Change
AGRICULTURAL FEEDSTOCK & CHEMICALS Establishments 17 54.9% 41.7% 1,760 2.2% 4.5% Employment 510 25.3% 8.2% 72,988 -5.9% -5.5% Location Quotient 2.56 n/a Direct-Effect Employment Multiplier 3.8 5.6 Total Employment Impact 1,957 405,197 Average Annual Wage (constant 2010 dollars) $58,441 9.1% 7.9% $70,869 8.7% 1.5%
DRUGS & PHARMACEUTICALS Establishments 0 0.0% 0.0% 2,908 11.3% 6.5% Employment 0 0.0% 0.0% 296,759 -3.1% -7.0% Location Quotient 0.00 n/a Direct-Effect Employment Multiplier 0.0 5.3
Total Employment Impact 0 1,464,492 Average Annual Wage (constant 2010 dollars) $0 0.0% 0.0% $99,486 15.3% 1.1%
MEDICAL DEVICES & EQUIPMENT Establishments 4 361.5% -33.3% 6,957 11.7% 7.7% Employment 39 -1.7% -20.4% 343,468 -0.3% -0.8% Location Quotient 0.04 n/a Direct-Effect Employment Multiplier 1.4 2.9 Total Employment Impact 56 956,767 Average Annual Wage (constant 2010 dollars) $46,052 -5.1% 35.4% $72,301 13.9% 1.0%
RESEARCH, TESTING, & MEDICAL LABORATORIES Establishments 56 65.9% 43.0% 22,212 48.9% 20.1% Employment 698 165.1% 41.4% 451,923 23.8% 6.1% Location Quotient 0.57 n/a Direct-Effect Employment Multiplier 1.7 2.6 Total Employment Impact 1,154 1,178,741 Average Annual Wage (constant 2010 dollars) $42,235 13.0% 8.6% $84,065 12.3% 1.5%
BIOSCIENCE-RELATED DISTRIBUTION Establishments 324 36.6% 8.7% 36,170 -1.1% -0.3% Employment 2,391 23.9% 12.7% 440,394 6.0% -4.2% Location Quotient 1.99 n/a Direct-Effect Employment Multiplier 1.7 2.4 Total Employment Impact Multiplier 4,103 1,046,594 Average Annual Wage (constant 2010 dollars) $52,538 27.7% 8.2% $80,049 12.2% -0.4%
TOTAL BIOSCIENCE INDUSTRY Establishments 401 41.8% 12.9% 70,006 12.8% 6.7% Employment 3,638 37.8% 16.0% 1,605,533 6.4% -1.4% Location Quotient 0.83 n/a Direct-Effect Employment Multiplier 2.0 3.2 Total Employment Impact 7,270 5,051,791 Average Annual Wage (constant 2010 dollars) $51,319 19.9% 7.7% $82,697 13.1% 0.6% TOTAL PRIVATE SECTOR
Establishments 23,924 11.8% 4.4% 8,752,494 12.5% 0.1% Employment 291,317 16.2% 4.9% 106,863,403 -2.9% -6.9% Average Annual Wage (constant 2010 dollars) $61,559 22.0% 10.2% $46,317 4.4% -0.4%
Note: U.S. employment metrics include Puerto Rico. Estimates of total employment impacts do not include Puerto Rico.
Employment, Establishment, and Wage Data: U.S. Bureau of Labor Statistics, Quarterly Census of Employment and Wages (QCEW); enhanced file from IMPLAN.
Employment Multipliers: U.S. Bureau of Economic Analysis RIMS II Employment Multipliers, 2008 (most current available).

OH
IO
Battelle/BIO State Bioscience Industry Development 2012
OH OHIO ● Ohio has a sizable and growing bioscience industry with 47,536 jobs that span 2,564 business establishments. Four of the state’s five major subsectors have added jobs overall since 2001 including: research, testing, and medical labs (up 40 percent since 2001); drugs and pharmaceuticals (up 21 percent); bioscience-related distribution (up 5 percent); and agricultural feedstock and chemicals (up 4 percent). Ohio’s agricultural biosciences subsector is nearly specialized in its employment concentration with a location quotient of 1.18 in 2010.
Bioscience Summary of State Performance Employment Tier in Industry Related Metrics
Metrics Ohio United States Rank* Bioscience Industry, 2010 Total Bioscience Industry Employment 47,536 1,605,533 II
Bioscience Industry Location Quotient 0.76 n/a III
Biosciences Industry Establishments 2,564 70,006 I
*State ranking figures for bioscience industry employment metrics are calculated as quintiles (I=Top Quintile; V=Bottom Quintile).
85
90
95
100
105
110
115
2001 2002 2003 2004 2005 2006 2007 2008 2009 2010
Em
plo
yme
nt I
ndex
(2
001
= 1
00)
Ohio Bioscience Industry
Ohio Total Private Sector

Bioscience Industry Base, 2010
Ohio Highlights:
Ohio United States INDUSTRY SUBSECTOR 2010 2001–10
Change 2007–10 Change 2010 2001–10
Change 2007–10 Change
AGRICULTURAL FEEDSTOCK & CHEMICALS Establishments 70 59.8% 52.8% 1,760 2.2% 4.5% Employment 3,371 4.1% 16.4% 72,988 -5.9% -5.5% Location Quotient 1.18 n/a Direct-Effect Employment Multiplier 7.5 5.6 Total Employment Impact 25,125 405,197 Average Annual Wage (constant 2010 dollars) $80,830 20.0% 6.5% $70,869 8.7% 1.5%
DRUGS & PHARMACEUTICALS Establishments 39 -27.8% -4.9% 2,908 11.3% 6.5% Employment 5,308 21.2% 4.6% 296,759 -3.1% -7.0% Location Quotient 0.46 n/a Direct-Effect Employment Multiplier 4.6 5.3
Total Employment Impact 24,163 1,464,492 Average Annual Wage (constant 2010 dollars) $65,757 -4.6% 1.0% $99,486 15.3% 1.1%
MEDICAL DEVICES & EQUIPMENT Establishments 218 -7.6% 4.3% 6,957 11.7% 7.7% Employment 8,564 -25.0% 3.9% 343,468 -0.3% -0.8% Location Quotient 0.64 n/a Direct-Effect Employment Multiplier 2.5 2.9 Total Employment Impact 21,668 956,767 Average Annual Wage (constant 2010 dollars) $50,296 -8.0% -0.5% $72,301 13.9% 1.0%
RESEARCH, TESTING, & MEDICAL LABORATORIES Establishments 779 49.4% 13.5% 22,212 48.9% 20.1% Employment 12,320 40.1% 5.2% 451,923 23.8% 6.1% Location Quotient 0.70 n/a Direct-Effect Employment Multiplier 2.5 2.6 Total Employment Impact 30,843 1,178,741 Average Annual Wage (constant 2010 dollars) $65,399 5.1% 1.2% $84,065 12.3% 1.5%
BIOSCIENCE-RELATED DISTRIBUTION Establishments 1,458 7.8% -3.9% 36,170 -1.1% -0.3% Employment 17,973 5.3% -7.1% 440,394 6.0% -4.2% Location Quotient 1.05 n/a Direct-Effect Employment Multiplier 2.5 2.4 Total Employment Impact Multiplier 45,255 1,046,594 Average Annual Wage (constant 2010 dollars) $72,223 9.0% -3.9% $80,049 12.2% -0.4%
TOTAL BIOSCIENCE INDUSTRY Establishments 2,564 16.1% 2.6% 70,006 12.8% 6.7% Employment 47,536 5.9% 0.5% 1,605,533 6.4% -1.4% Location Quotient 0.76 n/a Direct-Effect Employment Multiplier 3.1 3.2 Total Employment Impact 147,054 5,051,791 Average Annual Wage (constant 2010 dollars) $66,393 5.6% -1.2% $82,697 13.1% 0.6% TOTAL PRIVATE SECTOR
Establishments 270,904 -0.7% -2.1% 8,752,494 12.5% 0.1% Employment 4,169,671 -11.0% -8.5% 106,863,403 -2.9% -6.9% Average Annual Wage (constant 2010 dollars) $41,036 1.4% -1.1% $46,317 4.4% -0.4%
Note: U.S. employment metrics include Puerto Rico. Estimates of total employment impacts do not include Puerto Rico.
Employment, Establishment, and Wage Data: U.S. Bureau of Labor Statistics, Quarterly Census of Employment and Wages (QCEW); enhanced file from IMPLAN.
Employment Multipliers: U.S. Bureau of Economic Analysis RIMS II Employment Multipliers, 2008 (most current available).

OKLA
HO
MA
Battelle/BIO State Bioscience Industry Development 2012
OK OKLAHOMA ● Oklahoma’s
bioscience industry employment
totaled more than 8,800 in
2010 and spans 1,055
business establishments.
Its largest major subsector,
bioscience-related distribution,
has nearly 4,500 jobs and
since 2001 has grown by
8 percent. In research,
testing, and medical labs, the
state has increased jobs since
2007 by 1 percent to 2,439
in 2010.
Bioscience Summary of State Performance Employment Tier in Industry Related Metrics
Metrics Oklahoma United States Rank* Bioscience Industry, 2010 Total Bioscience Industry Employment 8,815 1,605,533 IV
Bioscience Industry Location Quotient 0.51 n/a V
Biosciences Industry Establishments 1,055 70,006 III
*State ranking figures for bioscience industry employment metrics are calculated as quintiles (I=Top Quintile; V=Bottom Quintile).
90
92
94
96
98
100
102
104
106
108
110
2001 2002 2003 2004 2005 2006 2007 2008 2009 2010
Em
plo
ymen
t In
dex
(20
01 =
100
)
Oklahoma Bioscience Industry
Oklahoma Total Private Sector

Bioscience Industry Base, 2010
Oklahoma Highlights:
Oklahoma United States INDUSTRY SUBSECTOR 2010 2001–10
Change 2007–10 Change 2010 2001–10
Change 2007–10 Change
AGRICULTURAL FEEDSTOCK & CHEMICALS Establishments 14 -14.3% 0.0% 1,760 2.2% 4.5% Employment 761 1.1% 38.3% 72,988 -5.9% -5.5% Location Quotient 0.96 n/a Direct-Effect Employment Multiplier 7.7 5.6 Total Employment Impact 5,894 405,197 Average Annual Wage (constant 2010 dollars) $71,475 28.2% 11.2% $70,869 8.7% 1.5%
DRUGS & PHARMACEUTICALS Establishments 25 8.7% 31.6% 2,908 11.3% 6.5% Employment 215 -53.5% 55.8% 296,759 -3.1% -7.0% Location Quotient 0.07 n/a Direct-Effect Employment Multiplier 3.5 5.3
Total Employment Impact 748 1,464,492 Average Annual Wage (constant 2010 dollars) $60,174 14.1% -13.9% $99,486 15.3% 1.1%
MEDICAL DEVICES & EQUIPMENT Establishments 76 12.8% -1.3% 6,957 11.7% 7.7% Employment 911 -8.5% -14.7% 343,468 -0.3% -0.8% Location Quotient 0.24 n/a Direct-Effect Employment Multiplier 2.0 2.9 Total Employment Impact 1,857 956,767 Average Annual Wage (constant 2010 dollars) $54,320 25.0% 10.8% $72,301 13.9% 1.0%
RESEARCH, TESTING, & MEDICAL LABORATORIES Establishments 217 70.8% 20.9% 22,212 48.9% 20.1% Employment 2,439 -5.1% 1.1% 451,923 23.8% 6.1% Location Quotient 0.50 n/a Direct-Effect Employment Multiplier 2.0 2.6 Total Employment Impact 4,988 1,178,741 Average Annual Wage (constant 2010 dollars) $51,827 5.6% 0.4% $84,065 12.3% 1.5%
BIOSCIENCE-RELATED DISTRIBUTION Establishments 723 25.1% -6.7% 36,170 -1.1% -0.3% Employment 4,489 8.3% -6.7% 440,394 6.0% -4.2% Location Quotient 0.94 n/a Direct-Effect Employment Multiplier 2.2 2.4 Total Employment Impact Multiplier 9,823 1,046,594 Average Annual Wage (constant 2010 dollars) $73,617 23.9% 1.7% $80,049 12.2% -0.4%
TOTAL BIOSCIENCE INDUSTRY Establishments 1,055 30.0% -0.9% 70,006 12.8% 6.7% Employment 8,815 -1.3% -1.9% 1,605,533 6.4% -1.4% Location Quotient 0.51 n/a Direct-Effect Employment Multiplier 2.6 3.2 Total Employment Impact 23,310 5,051,791 Average Annual Wage (constant 2010 dollars) $65,081 20.5% 2.5% $82,697 13.1% 0.6% TOTAL PRIVATE SECTOR
Establishments 96,562 13.3% 3.0% 8,752,494 12.5% 0.1% Employment 1,160,992 -0.8% -4.6% 106,863,403 -2.9% -6.9% Average Annual Wage (constant 2010 dollars) $38,021 11.8% 2.0% $46,317 4.4% -0.4%
Note: U.S. employment metrics include Puerto Rico. Estimates of total employment impacts do not include Puerto Rico.
Employment, Establishment, and Wage Data: U.S. Bureau of Labor Statistics, Quarterly Census of Employment and Wages (QCEW); enhanced file from IMPLAN.
Employment Multipliers: U.S. Bureau of Economic Analysis RIMS II Employment Multipliers, 2008 (most current available).

OREG
ON
Battelle/BIO State Bioscience Industry Development 2012
OR OREGON ● Oregon’s bioscience industry is sizable and growing at a rapid rate. Over the decade, the state increased employment in the biosciences by nearly 31 percent and maintained a growth trajectory even during the later, more difficult economic period of 2007 through 2010 (up 8 percent). Though Oregon does not have a specialized employment concentration in any one subsector, it is clearly emerging in each of the five major components with strong overall job gains since 2001 in each.
Bioscience Summary of State Performance Employment Tier in Industry Related Metrics
Metrics Oregon United States Rank* Bioscience Industry, 2010 Total Bioscience Industry Employment 13,423 1,605,533 III
Bioscience Industry Location Quotient 0.68 n/a IV
Biosciences Industry Establishments 762 70,006 III
*State ranking figures for bioscience industry employment metrics are calculated as quintiles (I=Top Quintile; V=Bottom Quintile).
60
70
80
90
100
110
120
130
140
2001 2002 2003 2004 2005 2006 2007 2008 2009 2010
Em
plo
yme
nt I
ndex
(2
001
= 1
00)
Oregon Bioscience Industry
Oregon Total Private Sector

Bioscience Industry Base, 2010
Oregon Highlights:
Oregon United States INDUSTRY SUBSECTOR 2010 2001–10
Change 2007–10 Change 2010 2001–10
Change 2007–10 Change
AGRICULTURAL FEEDSTOCK & CHEMICALS Establishments 32 70.3% 6.7% 1,760 2.2% 4.5% Employment 483 67.4% -13.8% 72,988 -5.9% -5.5% Location Quotient 0.54 n/a Direct-Effect Employment Multiplier 4.7 5.6 Total Employment Impact 2,261 405,197 Average Annual Wage (constant 2010 dollars) $54,743 13.3% 4.6% $70,869 8.7% 1.5%
DRUGS & PHARMACEUTICALS Establishments 36 -5.3% 0.0% 2,908 11.3% 6.5% Employment 873 14.1% 9.7% 296,759 -3.1% -7.0% Location Quotient 0.24 n/a Direct-Effect Employment Multiplier 2.9 5.3
Total Employment Impact 2,548 1,464,492 Average Annual Wage (constant 2010 dollars) $46,338 -5.4% 16.2% $99,486 15.3% 1.1%
MEDICAL DEVICES & EQUIPMENT Establishments 112 9.8% 3.7% 6,957 11.7% 7.7% Employment 3,962 31.3% -3.0% 343,468 -0.3% -0.8% Location Quotient 0.94 n/a Direct-Effect Employment Multiplier 2.7 2.9 Total Employment Impact 10,530 956,767 Average Annual Wage (constant 2010 dollars) $57,483 9.8% -12.2% $72,301 13.9% 1.0%
RESEARCH, TESTING, & MEDICAL LABORATORIES Establishments 238 32.5% 18.6% 22,212 48.9% 20.1% Employment 3,659 53.0% 29.6% 451,923 23.8% 6.1% Location Quotient 0.66 n/a Direct-Effect Employment Multiplier 2.3 2.6 Total Employment Impact 8,413 1,178,741 Average Annual Wage (constant 2010 dollars) $64,039 7.7% -4.6% $84,065 12.3% 1.5%
BIOSCIENCE-RELATED DISTRIBUTION Establishments 344 0.2% 0.4% 36,170 -1.1% -0.3% Employment 4,446 16.5% 7.0% 440,394 6.0% -4.2% Location Quotient 0.82 n/a Direct-Effect Employment Multiplier 2.5 2.4 Total Employment Impact Multiplier 11,027 1,046,594 Average Annual Wage (constant 2010 dollars) $53,673 5.2% 7.4% $80,049 12.2% -0.4%
TOTAL BIOSCIENCE INDUSTRY Establishments 762 11.8% 6.2% 70,006 12.8% 6.7% Employment 13,423 30.6% 8.1% 1,605,533 6.4% -1.4% Location Quotient 0.68 n/a Direct-Effect Employment Multiplier 2.6 3.2 Total Employment Impact 34,779 5,051,791 Average Annual Wage (constant 2010 dollars) $57,185 7.6% -2.1% $82,697 13.1% 0.6% TOTAL PRIVATE SECTOR
Establishments 123,153 12.2% -1.9% 8,752,494 12.5% 0.1% Employment 1,318,305 -1.9% -9.5% 106,863,403 -2.9% -6.9% Average Annual Wage (constant 2010 dollars) $40,981 1.6% -0.6% $46,317 4.4% -0.4%
Note: U.S. employment metrics include Puerto Rico. Estimates of total employment impacts do not include Puerto Rico.
Employment, Establishment, and Wage Data: U.S. Bureau of Labor Statistics, Quarterly Census of Employment and Wages (QCEW); enhanced file from IMPLAN.
Employment Multipliers: U.S. Bureau of Economic Analysis RIMS II Employment Multipliers, 2008 (most current available).

PEN
NSYL
VAN
IA
Battelle/BIO State Bioscience Industry Development 2012
PA PENNSYLVANIA ● Pennsylvania has a large and highly concentrated bioscience industry with employment measuring nearly 82,000 in 2010 across 2,240 business establishments. The state sector is diverse with specialized employment concentrations in two of the five major subsectors—drugs and pharmaceuticals (location quotient of 1.62) and research, testing, and medical labs (LQ of 1.35). Medical device manufacturing is also highly concentrated in Pennsylvania with more than 16,000 jobs in 2010.
Bioscience Summary of State Performance Employment Tier in Industry Related Metrics
Metrics Pennsylvania United States Rank* Bioscience Industry, 2010 Total Bioscience Industry Employment 81,796 1,605,533 I
Bioscience Industry Location Quotient 1.15 n/a II
Biosciences Industry Establishments 2,240 70,006 I
*State ranking figures for bioscience industry employment metrics are calculated as quintiles (I=Top Quintile; V=Bottom Quintile).
90
92
94
96
98
100
102
104
106
108
110
2001 2002 2003 2004 2005 2006 2007 2008 2009 2010
Em
plo
ymen
t In
dex
(20
01 =
100
)Pennsylvania Bioscience Industry
Pennsylvania Total Private Sector

Bioscience Industry Base, 2010
Pennsylvania Highlights:
Pennsylvania United States INDUSTRY SUBSECTOR 2010 2001–10
Change 2007–10 Change 2010 2001–10
Change 2007–10 Change
AGRICULTURAL FEEDSTOCK & CHEMICALS Establishments 41 -25.0% 0.0% 1,760 2.2% 4.5% Employment 754 -28.7% -48.0% 72,988 -5.9% -5.5% Location Quotient 0.23 n/a Direct-Effect Employment Multiplier 4.7 5.6 Total Employment Impact 3,561 405,197 Average Annual Wage (constant 2010 dollars) $52,711 7.1% -3.4% $70,869 8.7% 1.5%
DRUGS & PHARMACEUTICALS Establishments 113 -8.9% -4.2% 2,908 11.3% 6.5% Employment 21,352 -17.2% -3.4% 296,759 -3.1% -7.0% Location Quotient 1.62 n/a Direct-Effect Employment Multiplier 6.0 5.3
Total Employment Impact 127,749 1,464,492 Average Annual Wage (constant 2010 dollars) $106,644 8.4% 2.2% $99,486 15.3% 1.1%
MEDICAL DEVICES & EQUIPMENT Establishments 289 -14.2% -9.7% 6,957 11.7% 7.7% Employment 16,054 -13.7% -9.6% 343,468 -0.3% -0.8% Location Quotient 1.05 n/a Direct-Effect Employment Multiplier 2.9 2.9 Total Employment Impact 46,880 956,767 Average Annual Wage (constant 2010 dollars) $60,578 13.1% -0.3% $72,301 13.9% 1.0%
RESEARCH, TESTING, & MEDICAL LABORATORIES Establishments 971 27.7% 29.1% 22,212 48.9% 20.1% Employment 26,976 21.5% -7.3% 451,923 23.8% 6.1% Location Quotient 1.35 n/a Direct-Effect Employment Multiplier 3.0 2.6 Total Employment Impact 80,869 1,178,741 Average Annual Wage (constant 2010 dollars) $95,724 26.2% 4.0% $84,065 12.3% 1.5%
BIOSCIENCE-RELATED DISTRIBUTION Establishments 826 -33.6% -14.7% 36,170 -1.1% -0.3% Employment 16,661 -9.4% -4.5% 440,394 6.0% -4.2% Location Quotient 0.85 n/a Direct-Effect Employment Multiplier 2.6 2.4 Total Employment Impact Multiplier 43,064 1,046,594 Average Annual Wage (constant 2010 dollars) $92,894 15.4% 5.8% $80,049 12.2% -0.4%
TOTAL BIOSCIENCE INDUSTRY Establishments 2,240 -11.1% 1.9% 70,006 12.8% 6.7% Employment 81,796 -4.9% -6.9% 1,605,533 6.4% -1.4% Location Quotient 1.15 n/a Direct-Effect Employment Multiplier 3.7 3.2 Total Employment Impact 302,125 5,051,791 Average Annual Wage (constant 2010 dollars) $90,704 15.6% 3.8% $82,697 13.1% 0.6% TOTAL PRIVATE SECTOR
Establishments 326,490 1.5% 0.5% 8,752,494 12.5% 0.1% Employment 4,740,935 -2.2% -3.9% 106,863,403 -2.9% -6.9% Average Annual Wage (constant 2010 dollars) $45,323 6.6% 0.4% $46,317 4.4% -0.4%
Note: U.S. employment metrics include Puerto Rico. Estimates of total employment impacts do not include Puerto Rico.
Employment, Establishment, and Wage Data: U.S. Bureau of Labor Statistics, Quarterly Census of Employment and Wages (QCEW); enhanced file from IMPLAN.
Employment Multipliers: U.S. Bureau of Economic Analysis RIMS II Employment Multipliers, 2008 (most current available).

PUER
TO R
ICO
Battelle/BIO State Bioscience Industry Development 2012
PR PUERTO RICO ● Puerto Rico has a highly specialized and diverse bioscience industry. It has the distinction, along with just two other states, of having a specialized employment concentration in four of the five major bioscience subsectors—drugs and pharmaceuticals; medical devices and equipment; bioscience-related distribution; and research, testing, and medical labs. Though bioscience industry employment has contracted overall, two subsectors have added jobs in Puerto Rico since 2007—bioscience-related distribution (up 7 percent) and research and testing (up 6 percent).
Bioscience Summary of State Performance Employment Tier in Industry Related Metrics
Metrics Puerto Rico United States Rank* Bioscience Industry, 2010 Total Bioscience Industry Employment 41,230 1,605,533 II
Bioscience Industry Location Quotient 4.13 n/a I
Biosciences Industry Establishments 1,019 70,006 III
*State ranking figures for bioscience industry employment metrics are calculated as quintiles (I=Top Quintile; V=Bottom Quintile).
80
85
90
95
100
105
110
115
120
2001 2002 2003 2004 2005 2006 2007 2008 2009 2010
Em
plo
yme
nt I
ndex
(2
001
= 1
00)
Puerto Rico Bioscience Industry
Puerto Rico Total Private Sector

Bioscience Industry Base, 2010
Puerto Rico Highlights:
Puerto Rico United States INDUSTRY SUBSECTOR 2010 2001–10
Change 2007–10 Change 2010 2001–10
Change 2007–10 Change
AGRICULTURAL FEEDSTOCK & CHEMICALS Establishments n/a 1,760 2.2% 4.5% Employment n/a 72,988 -5.9% -5.5% Location Quotient n/a n/a Direct-Effect Employment Multiplier n/a 5.6 Total Employment Impact n/a 405,197 Average Annual Wage (constant 2010 dollars) $n/a $70,869 8.7% 1.5%
DRUGS & PHARMACEUTICALS Establishments 61 -24.7% -37.1% 2,908 11.3% 6.5% Employment 17,896 -27.4% -27.1% 296,759 -3.1% -7.0% Location Quotient 9.69 n/a Direct-Effect Employment Multiplier n/a 5.3
Total Employment Impact n/a 1,464,492 Average Annual Wage (constant 2010 dollars) $62,280 17.2% 0.8% $99,486 15.3% 1.1%
MEDICAL DEVICES & EQUIPMENT Establishments 59 -7.8% -21.3% 6,957 11.7% 7.7% Employment 12,912 13.3% -7.9% 343,468 -0.3% -0.8% Location Quotient 6.04 n/a Direct-Effect Employment Multiplier n/a 2.9 Total Employment Impact n/a 956,767 Average Annual Wage (constant 2010 dollars) $35,454 14.5% 3.1% $72,301 13.9% 1.0%
RESEARCH, TESTING, & MEDICAL LABORATORIES Establishments 621 28.1% 3.0% 22,212 48.9% 20.1% Employment 4,416 24.4% 6.0% 451,923 23.8% 6.1% Location Quotient 1.57 n/a Direct-Effect Employment Multiplier n/a 2.6 Total Employment Impact n/a 1,178,741 Average Annual Wage (constant 2010 dollars) $24,471 17.2% 7.1% $84,065 12.3% 1.5%
BIOSCIENCE-RELATED DISTRIBUTION Establishments 269 -13.2% -21.3% 36,170 -1.1% -0.3% Employment 6,006 10.5% 7.2% 440,394 6.0% -4.2% Location Quotient 2.19 n/a Direct-Effect Employment Multiplier n/a 2.4 Total Employment Impact Multiplier n/a 1,046,594 Average Annual Wage (constant 2010 dollars) $58,858 9.2% 5.5% $80,049 12.2% -0.4%
TOTAL BIOSCIENCE INDUSTRY Establishments 1,019 8.0% -9.6% 70,006 12.8% 6.7% Employment 41,230 -9.1% -14.7% 1,605,533 6.4% -1.4% Location Quotient 4.13 n/a Direct-Effect Employment Multiplier n/a 3.2 Total Employment Impact n/a 5,051,791 Average Annual Wage (constant 2010 dollars) $49,331 9.1% -1.0% $82,697 13.1% 0.6% TOTAL PRIVATE SECTOR
Establishments 47,347 -4.8% -21.1% 8,752,494 12.5% 0.1% Employment 665,148 -8.3% -9.3% 106,863,403 -2.9% -6.9% Average Annual Wage (constant 2010 dollars) $24,813 5.2% 1.9% $46,317 4.4% -0.4%
Note: U.S. employment metrics include Puerto Rico. Estimates of total employment impacts do not include Puerto Rico.
Employment, Establishment, and Wage Data: U.S. Bureau of Labor Statistics, Quarterly Census of Employment and Wages (QCEW); enhanced file from IMPLAN.
Employment Multipliers: U.S. Bureau of Economic Analysis RIMS II Employment Multipliers, 2008 (most current available).

RH
OD
E IS
LAN
D
Battelle/BIO State Bioscience Industry Development 2012
RI RHODE ISLAND ● Rhode Island’s bioscience sector employs just over 4,600 in jobs that span 277 business establishments. Despite employment declines in the recent recession, the state’s bioscience industry added 44 percent to its employment base overall since 2001. Its largest subsector, drugs and pharmaceuticals, has a specialized employment concentration with a location quotient of 1.25. The subsector emerged over the decade though has shed jobs in recent years.
Bioscience Summary of State Performance Employment Tier in Industry Related Metrics
Metrics Rhode Island United States Rank* Bioscience Industry, 2010 Total Bioscience Industry Employment 4,602 1,605,533 V
Bioscience Industry Location Quotient 0.79 n/a III
Biosciences Industry Establishments 277 70,006 V
*State ranking figures for bioscience industry employment metrics are calculated as quintiles (I=Top Quintile; V=Bottom Quintile).
20
40
60
80
100
120
140
160
180
2001 2002 2003 2004 2005 2006 2007 2008 2009 2010
Em
plo
yme
nt I
ndex
(2
001
= 1
00)
Rhode Island Bioscience Industry
Rhode Island Total Private Sector

Bioscience Industry Base, 2010
Rhode Island Highlights:
Rhode Island United States INDUSTRY SUBSECTOR 2010 2001–10
Change 2007–10 Change 2010 2001–10
Change 2007–10 Change
AGRICULTURAL FEEDSTOCK & CHEMICALS Establishments 0 -100.0% -100.0% 1,760 2.2% 4.5% Employment 0 -100.0% -100.0% 72,988 -5.9% -5.5% Location Quotient 0.00 n/a Direct-Effect Employment Multiplier 0.0 5.6 Total Employment Impact 0 405,197 Average Annual Wage (constant 2010 dollars) $0 -100.0% -100.0% $70,869 8.7% 1.5%
DRUGS & PHARMACEUTICALS Establishments 12 -7.7% -29.4% 2,908 11.3% 6.5% Employment 1,339 155.0% -30.5% 296,759 -3.1% -7.0% Location Quotient 1.25 n/a Direct-Effect Employment Multiplier 3.4 5.3
Total Employment Impact 4,616 1,464,492 Average Annual Wage (constant 2010 dollars) $91,479 36.1% -5.2% $99,486 15.3% 1.1%
MEDICAL DEVICES & EQUIPMENT Establishments 38 6.7% 8.6% 6,957 11.7% 7.7% Employment 1,311 21.3% -12.1% 343,468 -0.3% -0.8% Location Quotient 1.05 n/a Direct-Effect Employment Multiplier 2.3 2.9 Total Employment Impact 3,026 956,767 Average Annual Wage (constant 2010 dollars) $62,400 18.9% 2.6% $72,301 13.9% 1.0%
RESEARCH, TESTING, & MEDICAL LABORATORIES Establishments 90 67.4% 17.0% 22,212 48.9% 20.1% Employment 809 34.3% 12.3% 451,923 23.8% 6.1% Location Quotient 0.49 n/a Direct-Effect Employment Multiplier 2.0 2.6 Total Employment Impact 1,580 1,178,741 Average Annual Wage (constant 2010 dollars) $64,351 24.9% 12.0% $84,065 12.3% 1.5%
BIOSCIENCE-RELATED DISTRIBUTION Establishments 138 -33.9% -7.8% 36,170 -1.1% -0.3% Employment 1,143 18.0% -1.1% 440,394 6.0% -4.2% Location Quotient 0.72 n/a Direct-Effect Employment Multiplier 2.3 2.4 Total Employment Impact Multiplier 2,625 1,046,594 Average Annual Wage (constant 2010 dollars) $74,630 -8.0% 0.5% $80,049 12.2% -0.4%
TOTAL BIOSCIENCE INDUSTRY Establishments 277 -11.2% -0.9% 70,006 12.8% 6.7% Employment 4,602 44.3% -13.4% 1,605,533 6.4% -1.4% Location Quotient 0.79 n/a Direct-Effect Employment Multiplier 2.6 3.2 Total Employment Impact 11,847 5,051,791 Average Annual Wage (constant 2010 dollars) $74,242 17.1% -2.6% $82,697 13.1% 0.6% TOTAL PRIVATE SECTOR
Establishments 34,387 4.3% -2.9% 8,752,494 12.5% 0.1% Employment 387,004 -4.4% -7.4% 106,863,403 -2.9% -6.9% Average Annual Wage (constant 2010 dollars) $42,532 7.3% 1.5% $46,317 4.4% -0.4%
Note: U.S. employment metrics include Puerto Rico. Estimates of total employment impacts do not include Puerto Rico.
Employment, Establishment, and Wage Data: U.S. Bureau of Labor Statistics, Quarterly Census of Employment and Wages (QCEW); enhanced file from IMPLAN.
Employment Multipliers: U.S. Bureau of Economic Analysis RIMS II Employment Multipliers, 2008 (most current available).

SO
UTH
CARO
LIN
A
Battelle/BIO State Bioscience Industry Devlopment 2012
SC SOUTH CAROLINA ● South Carolina’s bioscience industry has emerged over the decade with strong employment growth, adding 45 percent to its employment base since 2001. Despite a slowdown and modest job losses in recent years, the state industry now employs nearly 15,000 across 985 business establishments. South Carolina is developing a diverse sector with four of the five major subsectors now employing more than 3,000. Its largest subsector, medical devices, has steadily grown, even since 2007 (up nearly 16 percent).
Bioscience Summary of State Performance Employment Tier in Industry Related Metrics
Metrics South Carolina United States Rank* Bioscience Industry, 2010 Total Bioscience Industry Employment 14,996 1,605,533 III
Bioscience Industry Location Quotient 0.70 n/a IV
Biosciences Industry Establishments 985 70,006 III
*State ranking figures for bioscience industry employment metrics are calculated as quintiles (I=Top Quintile; V=Bottom Quintile).
40
60
80
100
120
140
160
2001 2002 2003 2004 2005 2006 2007 2008 2009 2010
Em
plo
ymen
t In
dex
(20
01 =
100
)
South Carolina Bioscience Industry
South Carolina Total Private Sector
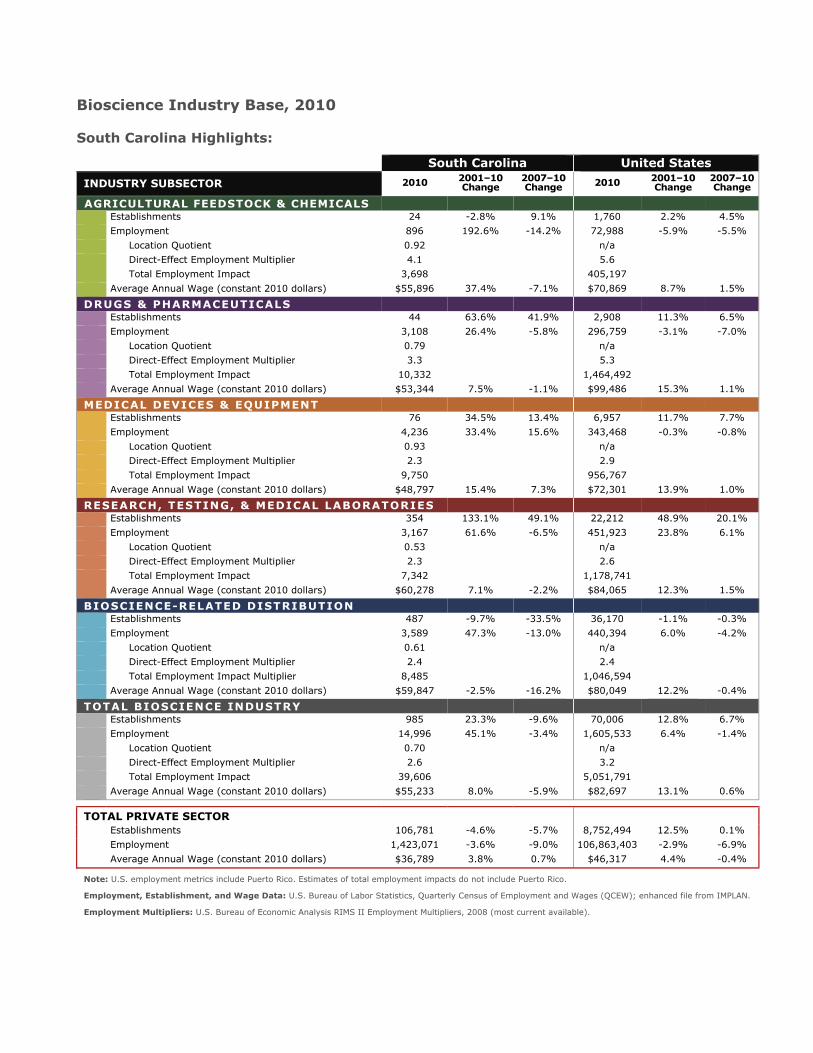
Bioscience Industry Base, 2010
South Carolina Highlights:
South Carolina United States INDUSTRY SUBSECTOR 2010 2001–10
Change 2007–10 Change 2010 2001–10
Change 2007–10 Change
AGRICULTURAL FEEDSTOCK & CHEMICALS Establishments 24 -2.8% 9.1% 1,760 2.2% 4.5% Employment 896 192.6% -14.2% 72,988 -5.9% -5.5% Location Quotient 0.92 n/a Direct-Effect Employment Multiplier 4.1 5.6 Total Employment Impact 3,698 405,197 Average Annual Wage (constant 2010 dollars) $55,896 37.4% -7.1% $70,869 8.7% 1.5%
DRUGS & PHARMACEUTICALS Establishments 44 63.6% 41.9% 2,908 11.3% 6.5% Employment 3,108 26.4% -5.8% 296,759 -3.1% -7.0% Location Quotient 0.79 n/a Direct-Effect Employment Multiplier 3.3 5.3
Total Employment Impact 10,332 1,464,492 Average Annual Wage (constant 2010 dollars) $53,344 7.5% -1.1% $99,486 15.3% 1.1%
MEDICAL DEVICES & EQUIPMENT Establishments 76 34.5% 13.4% 6,957 11.7% 7.7% Employment 4,236 33.4% 15.6% 343,468 -0.3% -0.8% Location Quotient 0.93 n/a Direct-Effect Employment Multiplier 2.3 2.9 Total Employment Impact 9,750 956,767 Average Annual Wage (constant 2010 dollars) $48,797 15.4% 7.3% $72,301 13.9% 1.0%
RESEARCH, TESTING, & MEDICAL LABORATORIES Establishments 354 133.1% 49.1% 22,212 48.9% 20.1% Employment 3,167 61.6% -6.5% 451,923 23.8% 6.1% Location Quotient 0.53 n/a Direct-Effect Employment Multiplier 2.3 2.6 Total Employment Impact 7,342 1,178,741 Average Annual Wage (constant 2010 dollars) $60,278 7.1% -2.2% $84,065 12.3% 1.5%
BIOSCIENCE-RELATED DISTRIBUTION Establishments 487 -9.7% -33.5% 36,170 -1.1% -0.3% Employment 3,589 47.3% -13.0% 440,394 6.0% -4.2% Location Quotient 0.61 n/a Direct-Effect Employment Multiplier 2.4 2.4 Total Employment Impact Multiplier 8,485 1,046,594 Average Annual Wage (constant 2010 dollars) $59,847 -2.5% -16.2% $80,049 12.2% -0.4%
TOTAL BIOSCIENCE INDUSTRY Establishments 985 23.3% -9.6% 70,006 12.8% 6.7% Employment 14,996 45.1% -3.4% 1,605,533 6.4% -1.4% Location Quotient 0.70 n/a Direct-Effect Employment Multiplier 2.6 3.2 Total Employment Impact 39,606 5,051,791 Average Annual Wage (constant 2010 dollars) $55,233 8.0% -5.9% $82,697 13.1% 0.6% TOTAL PRIVATE SECTOR
Establishments 106,781 -4.6% -5.7% 8,752,494 12.5% 0.1% Employment 1,423,071 -3.6% -9.0% 106,863,403 -2.9% -6.9% Average Annual Wage (constant 2010 dollars) $36,789 3.8% 0.7% $46,317 4.4% -0.4%
Note: U.S. employment metrics include Puerto Rico. Estimates of total employment impacts do not include Puerto Rico.
Employment, Establishment, and Wage Data: U.S. Bureau of Labor Statistics, Quarterly Census of Employment and Wages (QCEW); enhanced file from IMPLAN.
Employment Multipliers: U.S. Bureau of Economic Analysis RIMS II Employment Multipliers, 2008 (most current available).

SO
UTH
DAKO
TA
Battelle/BIO State Bioscience Industry Development 2012
SD South Dakota ● South Dakota has a diverse and emerging presence in the biosciences with three of its five major subsectors having a specialized employment concentration in 2010. Its specializations include agricultural feedstock and chemicals; medical devices and equipment; and bioscience-related distribution. Four of its five subsectors have experienced steady growth in recent years leading to an overall bioscience job growth rate of nearly 37 percent since 2001.
Bioscience Summary of State Performance Employment Tier in Industry Related Metrics
Metrics South Dakota United States Rank* Bioscience Industry, 2010 Total Bioscience Industry Employment 4,976 1,605,533 V
Bioscience Industry Location Quotient 1.05 n/a II
Biosciences Industry Establishments 325 70,006 IV
*State ranking figures for bioscience industry employment metrics are calculated as quintiles (I=Top Quintile; V=Bottom Quintile).
50
60
70
80
90
100
110
120
130
140
150
2001 2002 2003 2004 2005 2006 2007 2008 2009 2010
Em
plo
yme
nt I
ndex
(2
001
= 1
00)
South Dakota Bioscience Industry
South Dakota Total Private Sector

Bioscience Industry Base, 2010
South Dakota Highlights:
South Dakota United States INDUSTRY SUBSECTOR 2010 2001–10
Change 2007–10 Change 2010 2001–10
Change 2007–10 Change
AGRICULTURAL FEEDSTOCK & CHEMICALS Establishments 27 135.0% 3.8% 1,760 2.2% 4.5% Employment 760 366.9% 1.7% 72,988 -5.9% -5.5% Location Quotient 3.51 n/a Direct-Effect Employment Multiplier 2.9 5.6 Total Employment Impact 2,236 405,197 Average Annual Wage (constant 2010 dollars) $58,347 27.8% -35.0% $70,869 8.7% 1.5%
DRUGS & PHARMACEUTICALS Establishments 1 -66.7% -56.5% 2,908 11.3% 6.5% Employment 14 -77.2% -91.8% 296,759 -3.1% -7.0% Location Quotient 0.02 n/a Direct-Effect Employment Multiplier 2.0 5.3
Total Employment Impact 28 1,464,492 Average Annual Wage (constant 2010 dollars) $30,627 -30.6% -43.0% $99,486 15.3% 1.1%
MEDICAL DEVICES & EQUIPMENT Establishments 13 32.3% 0.0% 6,957 11.7% 7.7% Employment 1,726 13.1% 3.4% 343,468 -0.3% -0.8% Location Quotient 1.70 n/a Direct-Effect Employment Multiplier 1.8 2.9 Total Employment Impact 3,127 956,767 Average Annual Wage (constant 2010 dollars) $53,975 6.4% 1.8% $72,301 13.9% 1.0%
RESEARCH, TESTING, & MEDICAL LABORATORIES Establishments 45 107.4% 16.9% 22,212 48.9% 20.1% Employment 380 66.3% 4.4% 451,923 23.8% 6.1% Location Quotient 0.28 n/a Direct-Effect Employment Multiplier 1.7 2.6 Total Employment Impact 636 1,178,741 Average Annual Wage (constant 2010 dollars) $87,252 -0.6% 1.2% $84,065 12.3% 1.5%
BIOSCIENCE-RELATED DISTRIBUTION Establishments 239 -5.7% 2.9% 36,170 -1.1% -0.3% Employment 2,096 26.0% 10.4% 440,394 6.0% -4.2% Location Quotient 1.61 n/a Direct-Effect Employment Multiplier 1.7 2.4 Total Employment Impact Multiplier 3,562 1,046,594 Average Annual Wage (constant 2010 dollars) $54,181 11.8% 0.9% $80,049 12.2% -0.4%
TOTAL BIOSCIENCE INDUSTRY Establishments 325 8.5% 4.1% 70,006 12.8% 6.7% Employment 4,976 36.6% 2.6% 1,605,533 6.4% -1.4% Location Quotient 1.05 n/a Direct-Effect Employment Multiplier 1.9 3.2 Total Employment Impact 9,589 5,051,791 Average Annual Wage (constant 2010 dollars) $57,208 10.7% -6.9% $82,697 13.1% 0.6% TOTAL PRIVATE SECTOR
Establishments 28,419 12.6% 2.2% 8,752,494 12.5% 0.1% Employment 316,735 6.6% -1.8% 106,863,403 -2.9% -6.9% Average Annual Wage (constant 2010 dollars) $33,887 9.5% 3.0% $46,317 4.4% -0.4%
Note: U.S. employment metrics include Puerto Rico. Estimates of total employment impacts do not include Puerto Rico.
Employment, Establishment, and Wage Data: U.S. Bureau of Labor Statistics, Quarterly Census of Employment and Wages (QCEW); enhanced file from IMPLAN.
Employment Multipliers: U.S. Bureau of Economic Analysis RIMS II Employment Multipliers, 2008 (most current available).

TEN
NES
SEE
Battelle/BIO State Bioscience Industry Development 2012
TN TENNESSEE ● Tennessee’s bioscience industry is sizable and highly concentrated with just over 38,000 jobs and a location quotient of 1.18 in 2010. The state has a specialized employment base in two subsectors—agricultural feedstock and chemicals and bioscience-related distribution. A third subsector, medical devices, is right on the cusp of the specialized threshold used in this report. The devices subsector has experienced strong job growth over the decade, emerging with a 34 percent job gain overall and the state has continued this rapid pace in more recent years.
Bioscience Summary of State Performance Employment Tier in Industry Related Metrics
Metrics Tennessee United States Rank* Bioscience Industry, 2010 Total Bioscience Industry Employment 38,025 1,605,533 II
Bioscience Industry Location Quotient 1.18 n/a II
Biosciences Industry Establishments 1,228 70,006 II
*State ranking figures for bioscience industry employment metrics are calculated as quintiles (I=Top Quintile; V=Bottom Quintile).
90
92
94
96
98
100
102
104
106
108
110
2001 2002 2003 2004 2005 2006 2007 2008 2009 2010
Em
plo
yme
nt I
ndex
(2
001
= 1
00)
Tennessee Bioscience Industry
Tennessee Total Private Sector

Bioscience Industry Base, 2010
Tennessee Highlights:
Tennessee United States INDUSTRY SUBSECTOR 2010 2001–10
Change 2007–10 Change 2010 2001–10
Change 2007–10 Change
AGRICULTURAL FEEDSTOCK & CHEMICALS Establishments 33 -12.0% -5.7% 1,760 2.2% 4.5% Employment 3,102 -57.1% -44.5% 72,988 -5.9% -5.5% Location Quotient 2.12 n/a Direct-Effect Employment Multiplier 5.0 5.6 Total Employment Impact 15,458 405,197 Average Annual Wage (constant 2010 dollars) $94,588 22.1% 2.1% $70,869 8.7% 1.5%
DRUGS & PHARMACEUTICALS Establishments 33 57.1% 26.9% 2,908 11.3% 6.5% Employment 3,052 -2.1% 27.4% 296,759 -3.1% -7.0% Location Quotient 0.51 n/a Direct-Effect Employment Multiplier 3.8 5.3
Total Employment Impact 11,651 1,464,492 Average Annual Wage (constant 2010 dollars) $89,463 47.7% 1.7% $99,486 15.3% 1.1%
MEDICAL DEVICES & EQUIPMENT Establishments 102 -8.1% -3.8% 6,957 11.7% 7.7% Employment 8,151 33.7% 29.2% 343,468 -0.3% -0.8% Location Quotient 1.19 n/a Direct-Effect Employment Multiplier 3.0 2.9 Total Employment Impact 24,467 956,767 Average Annual Wage (constant 2010 dollars) $71,944 42.7% 7.5% $72,301 13.9% 1.0%
RESEARCH, TESTING, & MEDICAL LABORATORIES Establishments 276 29.3% -3.3% 22,212 48.9% 20.1% Employment 8,254 16.6% 10.8% 451,923 23.8% 6.1% Location Quotient 0.91 n/a Direct-Effect Employment Multiplier 2.5 2.6 Total Employment Impact 20,473 1,178,741 Average Annual Wage (constant 2010 dollars) $73,192 14.4% 4.1% $84,065 12.3% 1.5%
BIOSCIENCE-RELATED DISTRIBUTION Establishments 784 12.9% 4.8% 36,170 -1.1% -0.3% Employment 15,467 1.8% -13.4% 440,394 6.0% -4.2% Location Quotient 1.76 n/a Direct-Effect Employment Multiplier 2.4 2.4 Total Employment Impact Multiplier 36,888 1,046,594 Average Annual Wage (constant 2010 dollars) $72,446 12.8% -1.7% $80,049 12.2% -0.4%
TOTAL BIOSCIENCE INDUSTRY Establishments 1,228 14.0% 2.3% 70,006 12.8% 6.7% Employment 38,025 -1.8% -4.0% 1,605,533 6.4% -1.4% Location Quotient 1.18 n/a Direct-Effect Employment Multiplier 2.9 3.2 Total Employment Impact 108,937 5,051,791 Average Annual Wage (constant 2010 dollars) $75,673 17.9% 0.2% $82,697 13.1% 0.6% TOTAL PRIVATE SECTOR
Establishments 135,620 11.0% -1.3% 8,752,494 12.5% 0.1% Employment 2,138,027 -4.7% -8.5% 106,863,403 -2.9% -6.9% Average Annual Wage (constant 2010 dollars) $41,759 7.9% 1.4% $46,317 4.4% -0.4%
Note: U.S. employment metrics include Puerto Rico. Estimates of total employment impacts do not include Puerto Rico.
Employment, Establishment, and Wage Data: U.S. Bureau of Labor Statistics, Quarterly Census of Employment and Wages (QCEW); enhanced file from IMPLAN.
Employment Multipliers: U.S. Bureau of Economic Analysis RIMS II Employment Multipliers, 2008 (most current available).

TEXAS P
age
1
Battelle/BIO State Bioscience Industry Development 2012
TEXAS
TX TEXAS ● Texas has a large and growing bioscience industry. State bioscience employment reached more than 78,000 jobs in 2010 after rapid growth of nearly 19 percent over the decade. Texas firms have continued to add jobs in the sector even since 2007 which includes the difficult labor market conditions with the onset of the recession. Since 2001, four of its five major subsectors have grown and outpaced the national rate in job gains, these include: research, testing, and medical labs (up 49 percent since 2001); bioscience-related distribution (up 27 percent); agricultural feedstock and chemicals (up 19 percent); and drugs and pharmaceuticals (up 7 percent).
Bioscience Summary of State Performance Employment Tier in Industry Related Metrics
*State ranking figures for bioscience industry employment metrics are calculated as quintiles (I=Top Quintile; V=Bottom Quintile).
Metrics Texas United States Rank* Bioscience Industry, 2010 Total Bioscience Industry Employment 78,452 1,605,533 I
Bioscience Industry Location Quotient 0.62 n/a IV
Biosciences Industry Establishments 4,459 70,006 I
75
80
85
90
95
100
105
110
115
120
125
2001 2002 2003 2004 2005 2006 2007 2008 2009 2010
Em
plo
yme
nt I
ndex
(2
001
= 1
00)
Texas Bioscience Industry
Texas Total Private Sector

Bioscience Industry Base, 2010
Texas Highlights:
Texas United States INDUSTRY SUBSECTOR 2010 2001–10
Change 2007–10 Change 2010 2001–10
Change 2007–10 Change
AGRICULTURAL FEEDSTOCK & CHEMICALS Establishments 155 10.4% 7.6% 1,760 2.2% 4.5% Employment 4,946 18.8% 2.9% 72,988 -5.9% -5.5% Location Quotient 0.87 n/a Direct-Effect Employment Multiplier 6.3 5.6 Total Employment Impact 31,009 405,197 Average Annual Wage (constant 2010 dollars) $83,360 32.8% 5.8% $70,869 8.7% 1.5%
DRUGS & PHARMACEUTICALS Establishments 154 14.9% 6.2% 2,908 11.3% 6.5% Employment 9,596 7.1% -3.1% 296,759 -3.1% -7.0% Location Quotient 0.41 n/a Direct-Effect Employment Multiplier 5.1 5.3
Total Employment Impact 48,932 1,464,492 Average Annual Wage (constant 2010 dollars) $110,338 59.2% 10.5% $99,486 15.3% 1.1%
MEDICAL DEVICES & EQUIPMENT Establishments 378 23.1% 11.8% 6,957 11.7% 7.7% Employment 10,114 -23.4% -1.4% 343,468 -0.3% -0.8% Location Quotient 0.38 n/a Direct-Effect Employment Multiplier 2.9 2.9 Total Employment Impact 28,871 956,767 Average Annual Wage (constant 2010 dollars) $63,070 15.3% -0.5% $72,301 13.9% 1.0%
RESEARCH, TESTING, & MEDICAL LABORATORIES Establishments 1,235 83.2% 28.2% 22,212 48.9% 20.1% Employment 21,236 48.6% 8.7% 451,923 23.8% 6.1% Location Quotient 0.60 n/a Direct-Effect Employment Multiplier 2.6 2.6 Total Employment Impact 54,579 1,178,741 Average Annual Wage (constant 2010 dollars) $71,446 1.2% 0.7% $84,065 12.3% 1.5%
BIOSCIENCE-RELATED DISTRIBUTION Establishments 2,537 17.4% 5.8% 36,170 -1.1% -0.3% Employment 32,560 27.3% 4.6% 440,394 6.0% -4.2% Location Quotient 0.95 n/a Direct-Effect Employment Multiplier 2.7 2.4 Total Employment Impact Multiplier 89,243 1,046,594 Average Annual Wage (constant 2010 dollars) $81,751 15.1% 0.7% $80,049 12.2% -0.4%
TOTAL BIOSCIENCE INDUSTRY Establishments 4,459 30.5% 11.8% 70,006 12.8% 6.7% Employment 78,452 18.5% 3.7% 1,605,533 6.4% -1.4% Location Quotient 0.63 n/a Direct-Effect Employment Multiplier 3.2 3.2 Total Employment Impact 252,634 5,051,791 Average Annual Wage (constant 2010 dollars) $80,151 19.7% 2.2% $82,697 13.1% 0.6% TOTAL PRIVATE SECTOR
Establishments 555,759 15.9% 1.5% 8,752,494 12.5% 0.1% Employment 8,360,874 7.3% -2.0% 106,863,403 -2.9% -6.9% Average Annual Wage (constant 2010 dollars) $47,615 5.1% -0.5% $46,317 4.4% -0.4%
Note: U.S. employment metrics include Puerto Rico. Estimates of total employment impacts do not include Puerto Rico.
Employment, Establishment, and Wage Data: U.S. Bureau of Labor Statistics, Quarterly Census of Employment and Wages (QCEW); enhanced file from IMPLAN.
Employment Multipliers: U.S. Bureau of Economic Analysis RIMS II Employment Multipliers, 2008 (most current available).

UTA
H
Battelle/BIO State Bioscience Industry Development 2012
UT UTAH ● Utah’s bioscience industry is sizable, highly specialized, and rapidly growing. Since 2001, the industry has grown its industry employment base by 26 percent, reaching more than 23,000 jobs in 2010. Job growth over the decade has come from each of the five major subsectors and four of those five have continued overall growth since 2007, the period that includes the deep national recession. The state industry is diverse with three major subsectors have a specialized employment concentration—medical devices; drugs and pharmaceuticals; and research, testing, and medical labs.
Bioscience Summary of State Performance Employment Tier in Industry Related Metrics
Metrics Utah United States Rank* Bioscience Industry, 2010 Total Bioscience Industry Employment 23,406 1,605,533 III
Bioscience Industry Location Quotient 1.65 n/a I
Biosciences Industry Establishments 911 70,006 III
*State ranking figures for bioscience industry employment metrics are calculated as quintiles (I=Top Quintile; V=Bottom Quintile).
70
80
90
100
110
120
130
2001 2002 2003 2004 2005 2006 2007 2008 2009 2010
Empl
oym
ent
Inde
x (2
001
= 1
00)
Utah Bioscience Industry
Utah Total Private Sector

Bioscience Industry Base, 2010
Utah Highlights:
Utah United States INDUSTRY SUBSECTOR 2010 2001–10
Change 2007–10 Change 2010 2001–10
Change 2007–10 Change
AGRICULTURAL FEEDSTOCK & CHEMICALS Establishments 14 44.8% 16.7% 1,760 2.2% 4.5% Employment 231 51.2% -6.5% 72,988 -5.9% -5.5% Location Quotient 0.36 n/a Direct-Effect Employment Multiplier 5.1 5.6 Total Employment Impact 1,178 405,197 Average Annual Wage (constant 2010 dollars) $62,529 17.7% 17.3% $70,869 8.7% 1.5%
DRUGS & PHARMACEUTICALS Establishments 79 43.6% 8.2% 2,908 11.3% 6.5% Employment 4,702 22.9% 3.0% 296,759 -3.1% -7.0% Location Quotient 1.79 n/a Direct-Effect Employment Multiplier 4.6 5.3
Total Employment Impact 21,714 1,464,492 Average Annual Wage (constant 2010 dollars) $55,694 23.7% 12.1% $99,486 15.3% 1.1%
MEDICAL DEVICES & EQUIPMENT Establishments 95 20.6% 5.6% 6,957 11.7% 7.7% Employment 8,741 5.5% 5.4% 343,468 -0.3% -0.8% Location Quotient 2.88 n/a Direct-Effect Employment Multiplier 2.9 2.9 Total Employment Impact 24,971 956,767 Average Annual Wage (constant 2010 dollars) $55,744 16.8% -1.4% $72,301 13.9% 1.0%
RESEARCH, TESTING, & MEDICAL LABORATORIES Establishments 210 32.4% 17.9% 22,212 48.9% 20.1% Employment 5,857 60.7% 25.1% 451,923 23.8% 6.1% Location Quotient 1.46 n/a Direct-Effect Employment Multiplier 2.6 2.6 Total Employment Impact 15,171 1,178,741 Average Annual Wage (constant 2010 dollars) $57,142 0.6% -4.0% $84,065 12.3% 1.5%
BIOSCIENCE-RELATED DISTRIBUTION Establishments 512 101.8% 16.2% 36,170 -1.1% -0.3% Employment 3,876 45.2% 5.0% 440,394 6.0% -4.2% Location Quotient 0.99 n/a Direct-Effect Employment Multiplier 2.6 2.4 Total Employment Impact Multiplier 9,894 1,046,594 Average Annual Wage (constant 2010 dollars) $74,842 25.3% 8.7% $80,049 12.2% -0.4%
TOTAL BIOSCIENCE INDUSTRY Establishments 911 63.7% 14.7% 70,006 12.8% 6.7% Employment 23,406 26.0% 9.0% 1,605,533 6.4% -1.4% Location Quotient 1.65 n/a Direct-Effect Employment Multiplier 3.1 3.2 Total Employment Impact 72,929 5,051,791 Average Annual Wage (constant 2010 dollars) $59,313 16.9% 2.6% $82,697 13.1% 0.6% TOTAL PRIVATE SECTOR
Establishments 79,690 21.9% -4.0% 8,752,494 12.5% 0.1% Employment 946,118 8.5% -7.6% 106,863,403 -2.9% -6.9% Average Annual Wage (constant 2010 dollars) $38,932 6.5% 1.0% $46,317 4.4% -0.4%
Note: U.S. employment metrics include Puerto Rico. Estimates of total employment impacts do not include Puerto Rico.
Employment, Establishment, and Wage Data: U.S. Bureau of Labor Statistics, Quarterly Census of Employment and Wages (QCEW); enhanced file from IMPLAN.
Employment Multipliers: U.S. Bureau of Economic Analysis RIMS II Employment Multipliers, 2008 (most current available).

VER
MO
NT
Battelle/BIO State Bioscience Industry Development 2012
VT VERMONT ● Vermont’s
bioscience industry employs
nearly 2,000 across 212
business establishments. More
than half of its employment is
in the medical device and
equipment subsector which
has a specialized employment
concentration with a location
quotient of 1.40 in 2010.
Bioscience-related distribution
employs more than 600 and
has added jobs in recent
years. Over the decade, the
biosciences industry has grown
jobs in Vermont, increasing by
90 percent since 2001.
Bioscience Summary of State Performance Employment Tier in Industry Related Metrics
Metrics Vermont United States Rank* Bioscience Industry, 2010 Total Bioscience Industry Employment 1,957 1,605,533 V
Bioscience Industry Location Quotient 0.54 n/a IV
Biosciences Industry Establishments 212 70,006 V
*State ranking figures for bioscience industry employment metrics are calculated as quintiles (I=Top Quintile; V=Bottom Quintile).
0
50
100
150
200
2001 2002 2003 2004 2005 2006 2007 2008 2009 2010
Em
plo
ymen
t In
dex
(20
01 =
100
)
Vermont Bioscience Industry
Vermont Total Private Sector

Bioscience Industry Base, 2010
Vermont Highlights:
Vermont United States INDUSTRY SUBSECTOR 2010 2001–10
Change 2007–10 Change 2010 2001–10
Change 2007–10 Change
AGRICULTURAL FEEDSTOCK & CHEMICALS Establishments 5 66.7% 0.0% 1,760 2.2% 4.5% Employment 8 -60.9% -66.5% 72,988 -5.9% -5.5% Location Quotient 0.05 n/a Direct-Effect Employment Multiplier 2.3 5.6 Total Employment Impact 18 405,197 Average Annual Wage (constant 2010 dollars) $37,050 42.9% 26.5% $70,869 8.7% 1.5%
DRUGS & PHARMACEUTICALS Establishments 6 105.7% 20.0% 2,908 11.3% 6.5% Employment 67 130.3% 55.8% 296,759 -3.1% -7.0% Location Quotient 0.10 n/a Direct-Effect Employment Multiplier 2.6 5.3
Total Employment Impact 171 1,464,492 Average Annual Wage (constant 2010 dollars) $72,567 14.7% 23.4% $99,486 15.3% 1.1%
MEDICAL DEVICES & EQUIPMENT Establishments 20 4.2% -9.1% 6,957 11.7% 7.7% Employment 1,081 189.2% 21.8% 343,468 -0.3% -0.8% Location Quotient 1.40 n/a Direct-Effect Employment Multiplier 2.0 2.9 Total Employment Impact 2,209 956,767 Average Annual Wage (constant 2010 dollars) $58,941 14.5% 5.6% $72,301 13.9% 1.0%
RESEARCH, TESTING, & MEDICAL LABORATORIES Establishments 40 66.3% 5.1% 22,212 48.9% 20.1% Employment 139 23.8% -9.6% 451,923 23.8% 6.1% Location Quotient 0.14 n/a Direct-Effect Employment Multiplier 1.9 2.6 Total Employment Impact 265 1,178,741 Average Annual Wage (constant 2010 dollars) $67,626 61.8% 16.1% $84,065 12.3% 1.5%
BIOSCIENCE-RELATED DISTRIBUTION Establishments 141 50.4% 3.9% 36,170 -1.1% -0.3% Employment 662 34.9% 6.5% 440,394 6.0% -4.2% Location Quotient 0.67 n/a Direct-Effect Employment Multiplier 2.0 2.4 Total Employment Impact Multiplier 1,300 1,046,594 Average Annual Wage (constant 2010 dollars) $74,410 0.7% -12.6% $80,049 12.2% -0.4%
TOTAL BIOSCIENCE INDUSTRY Establishments 212 48.3% 3.0% 70,006 12.8% 6.7% Employment 1,957 90.7% 13.2% 1,605,533 6.4% -1.4% Location Quotient 0.54 n/a Direct-Effect Employment Multiplier 2.0 3.2 Total Employment Impact 3,962 5,051,791 Average Annual Wage (constant 2010 dollars) $65,173 6.9% -1.7% $82,697 13.1% 0.6% TOTAL PRIVATE SECTOR
Establishments 22,635 0.5% -2.8% 8,752,494 12.5% 0.1% Employment 240,159 -3.9% -4.4% 106,863,403 -2.9% -6.9% Average Annual Wage (constant 2010 dollars) $49,137 4.9% 1.1% $46,317 4.4% -0.4%
Note: U.S. employment metrics include Puerto Rico. Estimates of total employment impacts do not include Puerto Rico.
Employment, Establishment, and Wage Data: U.S. Bureau of Labor Statistics, Quarterly Census of Employment and Wages (QCEW); enhanced file from IMPLAN.
Employment Multipliers: U.S. Bureau of Economic Analysis RIMS II Employment Multipliers, 2008 (most current available).

VIR
GIN
IA
Battelle/BIO State Bioscience Industry Development 2012
VA VIRGINIA ● The bioscience
industry in Virginia has
experienced strong overall
growth, increasing its job base
by 11 percent since 2001 and
totaling more than 26,000 by
2010. Late in this period, the
state continued its bioscience
job growth despite the deep
recession and job losses in its
private sector. Virginia’s
largest major subsector,
research, testing, and medical
labs, is emerging, growing
jobs at a 61 percent rate since
2001.
Bioscience Summary of State Performance Employment Tier in Industry Related Metrics
Metrics Virginia United States Rank* Bioscience Industry, 2010 Total Bioscience Industry Employment 26,127 1,605,533 II
Bioscience Industry Location Quotient 0.61 n/a IV
Biosciences Industry Establishments 1,321 70,006 II
*State ranking figures for bioscience industry employment metrics are calculated as quintiles (I=Top Quintile; V=Bottom Quintile).
85
90
95
100
105
110
115
2001 2002 2003 2004 2005 2006 2007 2008 2009 2010
Em
plo
yme
nt I
nde
x (2
001
= 1
00)
Virginia Bioscience Industry
Virginia Total Private Sector

Bioscience Industry Base, 2010
Virginia Highlights:
Virginia United States INDUSTRY SUBSECTOR 2010 2001–10
Change 2007–10 Change 2010 2001–10
Change 2007–10 Change
AGRICULTURAL FEEDSTOCK & CHEMICALS Establishments 22 -12.4% -4.3% 1,760 2.2% 4.5% Employment 1,791 -28.1% 19.9% 72,988 -5.9% -5.5% Location Quotient 0.92 n/a Direct-Effect Employment Multiplier 4.1 5.6 Total Employment Impact 7,287 405,197 Average Annual Wage (constant 2010 dollars) $84,797 24.2% 4.3% $70,869 8.7% 1.5%
DRUGS & PHARMACEUTICALS Establishments 38 46.2% 31.0% 2,908 11.3% 6.5% Employment 3,416 -7.7% -5.1% 296,759 -3.1% -7.0% Location Quotient 0.43 n/a Direct-Effect Employment Multiplier 4.5 5.3
Total Employment Impact 15,520 1,464,492 Average Annual Wage (constant 2010 dollars) $80,793 8.7% -11.9% $99,486 15.3% 1.1%
MEDICAL DEVICES & EQUIPMENT Establishments 118 72.4% 57.3% 6,957 11.7% 7.7% Employment 1,986 -21.3% 9.9% 343,468 -0.3% -0.8% Location Quotient 0.22 n/a Direct-Effect Employment Multiplier 2.0 2.9 Total Employment Impact 4,014 956,767 Average Annual Wage (constant 2010 dollars) $55,711 23.2% 3.5% $72,301 13.9% 1.0%
RESEARCH, TESTING, & MEDICAL LABORATORIES Establishments 514 56.3% 14.7% 22,212 48.9% 20.1% Employment 11,792 60.7% 8.8% 451,923 23.8% 6.1% Location Quotient 0.98 n/a Direct-Effect Employment Multiplier 2.7 2.6 Total Employment Impact 31,387 1,178,741 Average Annual Wage (constant 2010 dollars) $78,504 16.2% 3.8% $84,065 12.3% 1.5%
BIOSCIENCE-RELATED DISTRIBUTION Establishments 629 -18.2% -3.6% 36,170 -1.1% -0.3% Employment 7,143 -3.6% -7.5% 440,394 6.0% -4.2% Location Quotient 0.61 n/a Direct-Effect Employment Multiplier 2.4 2.4 Total Employment Impact Multiplier 17,100 1,046,594 Average Annual Wage (constant 2010 dollars) $67,812 -1.7% -2.7% $80,049 12.2% -0.4%
TOTAL BIOSCIENCE INDUSTRY Establishments 1,321 8.5% 7.6% 70,006 12.8% 6.7% Employment 26,127 11.4% 2.6% 1,605,533 6.4% -1.4% Location Quotient 0.61 n/a Direct-Effect Employment Multiplier 2.9 3.2 Total Employment Impact 75,309 5,051,791 Average Annual Wage (constant 2010 dollars) $74,579 11.8% -0.4% $82,697 13.1% 0.6% TOTAL PRIVATE SECTOR
Establishments 223,124 17.5% 1.4% 8,752,494 12.5% 0.1% Employment 2,850,159 0.8% -5.1% 106,863,403 -2.9% -6.9% Average Annual Wage (constant 2010 dollars) $38,644 9.3% 2.7% $46,317 4.4% -0.4%
Note: U.S. employment metrics include Puerto Rico. Estimates of total employment impacts do not include Puerto Rico.
Employment, Establishment, and Wage Data: U.S. Bureau of Labor Statistics, Quarterly Census of Employment and Wages (QCEW); enhanced file from IMPLAN.
Employment Multipliers: U.S. Bureau of Economic Analysis RIMS II Employment Multipliers, 2008 (most current available).

WASH
ING
TON
Battelle/BIO State Bioscience Industry Development 2012
WA WASHINGTON ● Washington
is growing its bioscience
industry, which now employs
more than 30,000. Since
2001, the state industry has
experienced 16 percent job
growth, outpacing growth in
the national sector. Late in this
period, Washington bioscience
firms were able to largely
maintain this upward trajectory
despite the national recession.
The state has a specialized
employment concentration in
research, testing, and medical
labs with a location quotient of
1.36 and strong job growth
over the decade (up 56 percent).
Bioscience Summary of State Performance Employment Tier in Industry Related Metrics
Metrics Washington United States Rank* Bioscience Industry, 2010 Total Bioscience Industry Employment 30,127 1,605,533 II
Bioscience Industry Location Quotient 0.88 n/a II
Biosciences Industry Establishments 1,317 70,006 II
*State ranking figures for bioscience industry employment metrics are calculated as quintiles (I=Top Quintile; V=Bottom Quintile).
80
85
90
95
100
105
110
115
120
2001 2002 2003 2004 2005 2006 2007 2008 2009 2010
Em
plo
ymen
t In
dex
(20
01 =
100
)
Washington Bioscience Industry
Washington Total Private Sector

Bioscience Industry Base, 2010
Washington Highlights:
Washington United States INDUSTRY SUBSECTOR 2010 2001–10
Change 2007–10 Change 2010 2001–10
Change 2007–10 Change
AGRICULTURAL FEEDSTOCK & CHEMICALS Establishments 33 -7.1% 11.0% 1,760 2.2% 4.5% Employment 622 -8.9% 17.4% 72,988 -5.9% -5.5% Location Quotient 0.40 n/a Direct-Effect Employment Multiplier 4.8 5.6 Total Employment Impact 2,971 405,197 Average Annual Wage (constant 2010 dollars) $51,016 -7.7% -6.2% $70,869 8.7% 1.5%
DRUGS & PHARMACEUTICALS Establishments 53 -7.0% 1.9% 2,908 11.3% 6.5% Employment 2,085 -10.0% -18.2% 296,759 -3.1% -7.0% Location Quotient 0.33 n/a Direct-Effect Employment Multiplier 4.1 5.3
Total Employment Impact 8,468 1,464,492 Average Annual Wage (constant 2010 dollars) $52,512 -52.5% -33.6% $99,486 15.3% 1.1%
MEDICAL DEVICES & EQUIPMENT Establishments 132 15.6% -6.4% 6,957 11.7% 7.7% Employment 5,902 2.8% 0.0% 343,468 -0.3% -0.8% Location Quotient 0.80 n/a Direct-Effect Employment Multiplier 3.2 2.9 Total Employment Impact 18,849 956,767 Average Annual Wage (constant 2010 dollars) $77,349 5.0% -0.7% $72,301 13.9% 1.0%
RESEARCH, TESTING, & MEDICAL LABORATORIES Establishments 452 37.8% 10.7% 22,212 48.9% 20.1% Employment 13,130 56.0% 17.9% 451,923 23.8% 6.1% Location Quotient 1.36 n/a Direct-Effect Employment Multiplier 2.5 2.6 Total Employment Impact 33,403 1,178,741 Average Annual Wage (constant 2010 dollars) $82,492 25.0% 1.7% $84,065 12.3% 1.5%
BIOSCIENCE-RELATED DISTRIBUTION Establishments 646 -39.3% -9.6% 36,170 -1.1% -0.3% Employment 8,388 -5.4% -10.1% 440,394 6.0% -4.2% Location Quotient 0.89 n/a Direct-Effect Employment Multiplier 2.3 2.4 Total Employment Impact Multiplier 19,497 1,046,594 Average Annual Wage (constant 2010 dollars) $77,792 5.8% 1.0% $80,049 12.2% -0.4%
TOTAL BIOSCIENCE INDUSTRY Establishments 1,317 -17.7% -2.2% 70,006 12.8% 6.7% Employment 30,127 15.8% 2.3% 1,605,533 6.4% -1.4% Location Quotient 0.88 n/a Direct-Effect Employment Multiplier 2.8 3.2 Total Employment Impact 83,188 5,051,791 Average Annual Wage (constant 2010 dollars) $77,452 4.8% -1.3% $82,697 13.1% 0.6% TOTAL PRIVATE SECTOR
Establishments 227,817 5.3% 6.9% 8,752,494 12.5% 0.1% Employment 2,283,181 3.3% -5.5% 106,863,403 -2.9% -6.9% Average Annual Wage (constant 2010 dollars) $47,860 3.9% 2.0% $46,317 4.4% -0.4%
Note: U.S. employment metrics include Puerto Rico. Estimates of total employment impacts do not include Puerto Rico.
Employment, Establishment, and Wage Data: U.S. Bureau of Labor Statistics, Quarterly Census of Employment and Wages (QCEW); enhanced file from IMPLAN.
Employment Multipliers: U.S. Bureau of Economic Analysis RIMS II Employment Multipliers, 2008 (most current available).

WES
T VIR
GIN
IA
Battelle/BIO State Bioscience Industry Development 2012
WV WEST VIRGINIA ● West
Virginia employs more than
6,400 in its bioscience
industry in 2010 after a
decade in which it grew by
22 percent. Four in ten state
bioscience jobs are in drugs
and pharmaceuticals, which
has a specialized employment
concentration in West
Virginia with a location
quotient of 1.72. Drugs
manufacturing has grown its
job base by 28 percent since
2001 and continued these
gains in more recent years
despite job declines at the
national level.
Bioscience Summary of State Performance Employment Tier in Industry Related Metrics
Metrics West Virginia United States Rank* Bioscience Industry, 2010
Total Bioscience Industry Employment 6,439 1,605,533 IV
Bioscience Industry Location Quotient 0.78 n/a III
Biosciences Industry Establishments 302 70,006 V
*State ranking figures for bioscience industry employment metrics are calculated as quintiles (I=Top Quintile; V=Bottom Quintile).
60
70
80
90
100
110
120
130
140
2001 2002 2003 2004 2005 2006 2007 2008 2009 2010
Em
plo
ymen
t In
dex
(20
01 =
100
)
West Virginia Bioscience Industry
West Virginia Total Private Sector

Bioscience Industry Base, 2010
West Virginia Highlights:
West Virginia United States INDUSTRY SUBSECTOR 2010 2001–10
Change 2007–10 Change 2010 2001–10
Change 2007–10 Change
AGRICULTURAL FEEDSTOCK & CHEMICALS Establishments 5 -6.8% -28.6% 1,760 2.2% 4.5% Employment 166 339.3% -80.0% 72,988 -5.9% -5.5% Location Quotient 0.44 n/a Direct-Effect Employment Multiplier 2.8 5.6 Total Employment Impact 469 405,197 Average Annual Wage (constant 2010 dollars) $54,742 21.8% -3.3% $70,869 8.7% 1.5%
DRUGS & PHARMACEUTICALS Establishments 7 -14.4% 75.0% 2,908 11.3% 6.5% Employment 2,628 48.4% 57.8% 296,759 -3.1% -7.0% Location Quotient 1.72 n/a Direct-Effect Employment Multiplier 3.2 5.3
Total Employment Impact 8,297 1,464,492 Average Annual Wage (constant 2010 dollars) $77,685 -1.6% -0.4% $99,486 15.3% 1.1%
MEDICAL DEVICES & EQUIPMENT Establishments 9 -26.9% -25.0% 6,957 11.7% 7.7% Employment 820 56.0% 34.6% 343,468 -0.3% -0.8% Location Quotient 0.46 n/a Direct-Effect Employment Multiplier 1.8 2.9 Total Employment Impact 1,503 956,767 Average Annual Wage (constant 2010 dollars) $59,289 43.5% 27.0% $72,301 13.9% 1.0%
RESEARCH, TESTING, & MEDICAL LABORATORIES Establishments 119 149.3% 90.5% 22,212 48.9% 20.1% Employment 1,336 25.8% 19.6% 451,923 23.8% 6.1% Location Quotient 0.58 n/a Direct-Effect Employment Multiplier 1.8 2.6 Total Employment Impact 2,436 1,178,741 Average Annual Wage (constant 2010 dollars) $49,627 13.3% 2.9% $84,065 12.3% 1.5%
BIOSCIENCE-RELATED DISTRIBUTION Establishments 162 -30.9% -12.5% 36,170 -1.1% -0.3% Employment 1,489 -20.5% -15.1% 440,394 6.0% -4.2% Location Quotient 0.66 n/a Direct-Effect Employment Multiplier 1.9 2.4 Total Employment Impact Multiplier 2,890 1,046,594 Average Annual Wage (constant 2010 dollars) $69,380 4.9% -3.6% $80,049 12.2% -0.4%
TOTAL BIOSCIENCE INDUSTRY Establishments 302 -1.9% 11.7% 70,006 12.8% 6.7% Employment 6,439 22.2% 7.8% 1,605,533 6.4% -1.4% Location Quotient 0.78 n/a Direct-Effect Employment Multiplier 2.4 3.2 Total Employment Impact 15,596 5,051,791 Average Annual Wage (constant 2010 dollars) $67,008 5.8% 3.9% $82,697 13.1% 0.6% TOTAL PRIVATE SECTOR
Establishments 44,544 1.3% -0.7% 8,752,494 12.5% 0.1% Employment 549,664 -0.4% -3.5% 106,863,403 -2.9% -6.9% Average Annual Wage (constant 2010 dollars) $39,531 10.0% 5.6% $46,317 4.4% -0.4%
Note: U.S. employment metrics include Puerto Rico. Estimates of total employment impacts do not include Puerto Rico.
Employment, Establishment, and Wage Data: U.S. Bureau of Labor Statistics, Quarterly Census of Employment and Wages (QCEW); enhanced file from IMPLAN.
Employment Multipliers: U.S. Bureau of Economic Analysis RIMS II Employment Multipliers, 2008 (most current available).

WIS
CO
NSIN
Battelle/BIO State Bioscience Industry Development 2012
WI WISCONSIN ● Wisconsin’s
bioscience industry is sizable
and growing, with nearly
31,000 jobs in 2010 that span
1,366 business establishments.
The state has a specialized
employment concentration in
medical devices, a sector that
has added jobs overall since
2007 and has a location
quotient of 1.48. Its second
largest subsector, bioscience-
related distribution, employs
more than 10,000 and is well
concentrated in Wisconsin.
Bioscience Summary of State Performance Employment Tier in Industry Related Metrics
Metrics Wisconsin United States Rank*
Bioscience Industry, 2010
Total Bioscience Industry Employment 30,796 1,605,533 II
Bioscience Industry Location Quotient 0.91 n/a II
Biosciences Industry Establishments 1,366 70,006 II
*State ranking figures for bioscience industry employment metrics are calculated as quintiles (I=Top Quintile; V=Bottom Quintile).
85
90
95
100
105
110
115
2001 2002 2003 2004 2005 2006 2007 2008 2009 2010
Em
plo
yme
nt I
ndex
(2
001
= 1
00)
Wisconsin Bioscience Industry
Wisconsin Total Private Sector

Bioscience Industry Base, 2010
Wisconsin Highlights:
Wisconsin United States INDUSTRY SUBSECTOR 2010 2001–10
Change 2007–10 Change 2010 2001–10
Change 2007–10 Change
AGRICULTURAL FEEDSTOCK & CHEMICALS Establishments 45 -14.6% -21.5% 1,760 2.2% 4.5% Employment 1,246 29.9% -4.1% 72,988 -5.9% -5.5% Location Quotient 0.81 n/a Direct-Effect Employment Multiplier 4.3 5.6 Total Employment Impact 5,304 405,197 Average Annual Wage (constant 2010 dollars) $54,822 27.3% 14.9% $70,869 8.7% 1.5%
DRUGS & PHARMACEUTICALS Establishments 74 32.1% 13.8% 2,908 11.3% 6.5% Employment 3,835 47.3% 13.5% 296,759 -3.1% -7.0% Location Quotient 0.62 n/a Direct-Effect Employment Multiplier 3.9 5.3
Total Employment Impact 15,079 1,464,492 Average Annual Wage (constant 2010 dollars) $63,033 10.9% -11.2% $99,486 15.3% 1.1%
MEDICAL DEVICES & EQUIPMENT Establishments 196 42.0% 35.2% 6,957 11.7% 7.7% Employment 10,675 -2.4% 8.0% 343,468 -0.3% -0.8% Location Quotient 1.48 n/a Direct-Effect Employment Multiplier 3.6 2.9 Total Employment Impact 38,766 956,767 Average Annual Wage (constant 2010 dollars) $79,409 7.0% -3.7% $72,301 13.9% 1.0%
RESEARCH, TESTING, & MEDICAL LABORATORIES Establishments 250 42.4% 15.4% 22,212 48.9% 20.1% Employment 5,035 41.6% 18.0% 451,923 23.8% 6.1% Location Quotient 0.53 n/a Direct-Effect Employment Multiplier 2.3 2.6 Total Employment Impact 11,597 1,178,741 Average Annual Wage (constant 2010 dollars) $59,145 13.7% -5.1% $84,065 12.3% 1.5%
BIOSCIENCE-RELATED DISTRIBUTION Establishments 801 -22.7% -7.1% 36,170 -1.1% -0.3% Employment 10,005 2.7% -4.9% 440,394 6.0% -4.2% Location Quotient 1.08 n/a Direct-Effect Employment Multiplier 2.3 2.4 Total Employment Impact Multiplier 22,995 1,046,594 Average Annual Wage (constant 2010 dollars) $67,270 9.8% 0.0% $80,049 12.2% -0.4%
TOTAL BIOSCIENCE INDUSTRY Establishments 1,366 -6.3% 1.5% 70,006 12.8% 6.7% Employment 30,796 10.8% 5.0% 1,605,533 6.4% -1.4% Location Quotient 0.91 n/a Direct-Effect Employment Multiplier 3.0 3.2 Total Employment Impact 93,741 5,051,791 Average Annual Wage (constant 2010 dollars) $69,118 7.8% -3.0% $82,697 13.1% 0.6% TOTAL PRIVATE SECTOR
Establishments 149,573 6.0% -1.5% 8,752,494 12.5% 0.1% Employment 2,245,774 -3.9% -6.5% 106,863,403 -2.9% -6.9% Average Annual Wage (constant 2010 dollars) $36,990 2.9% -0.3% $46,317 4.4% -0.4%
Note: U.S. employment metrics include Puerto Rico. Estimates of total employment impacts do not include Puerto Rico.
Employment, Establishment, and Wage Data: U.S. Bureau of Labor Statistics, Quarterly Census of Employment and Wages (QCEW); enhanced file from IMPLAN.
Employment Multipliers: U.S. Bureau of Economic Analysis RIMS II Employment Multipliers, 2008 (most current available).

WYO
MIN
G
Battelle/BIO State Bioscience Industry Development 2012
WY WYOMING ● Wyoming’s
bioscience industry is modest
in size, with more than 800
employed across 124 business
establishments. The state has
a specialized concentration of
jobs in agricultural feedstock
and chemicals, with more than
300 jobs and a location
quotient of 2.37 in 2010.
Bioscience Summary of State Performance Employment Tier in Industry Related Metrics
Metrics Wyoming United States Rank*
Bioscience Industry, 2010
Total Bioscience Industry Employment 831 1,605,533 V
Bioscience Industry Location Quotient 0.27 n/a V
Biosciences Industry Establishments 124 70,006 V
*State ranking figures for bioscience industry employment metrics are calculated as quintiles (I=Top Quintile; V=Bottom Quintile).
60
70
80
90
100
110
120
130
140
2001 2002 2003 2004 2005 2006 2007 2008 2009 2010
Em
plo
yme
nt I
ndex
(2
001
= 1
00)
Wyoming Bioscience Industry
Wyoming Total Private Sector

Bioscience Industry Base, 2010
Wyoming Highlights:
Wyoming United States INDUSTRY SUBSECTOR 2010 2001–10
Change 2007–10 Change 2010 2001–10
Change 2007–10 Change
AGRICULTURAL FEEDSTOCK & CHEMICALS Establishments 5 10.6% 0.0% 1,760 2.2% 4.5% Employment 332 -20.0% 6.5% 72,988 -5.9% -5.5% Location Quotient 2.37 n/a Direct-Effect Employment Multiplier 4.4 5.6 Total Employment Impact 1453 405,197 Average Annual Wage (constant 2010 dollars) $77,479 -3.1% 5.5% $70,869 8.7% 1.5%
DRUGS & PHARMACEUTICALS Establishments 7 -12.5% 16.7% 2,908 11.3% 6.5% Employment 135 150.0% 64.6% 296,759 -3.1% -7.0% Location Quotient 0.24 n/a Direct-Effect Employment Multiplier 1.9 5.3
Total Employment Impact 253 1,464,492 Average Annual Wage (constant 2010 dollars) $46,819 -4.3% -4.8% $99,486 15.3% 1.1%
MEDICAL DEVICES & EQUIPMENT Establishments 5 -3.8% 0.0% 6,957 11.7% 7.7% Employment 15 190.7% -48.5% 343,468 -0.3% -0.8% Location Quotient 0.02 n/a Direct-Effect Employment Multiplier 1.8 2.9 Total Employment Impact 29 956,767 Average Annual Wage (constant 2010 dollars) $81,118 106.3% 92.6% $72,301 13.9% 1.0%
RESEARCH, TESTING, & MEDICAL LABORATORIES Establishments 23 8.6% 4.5% 22,212 48.9% 20.1% Employment 90 -51.2% -12.2% 451,923 23.8% 6.1% Location Quotient 0.10 n/a Direct-Effect Employment Multiplier 1.6 2.6 Total Employment Impact 142 1,178,741 Average Annual Wage (constant 2010 dollars) $48,735 28.6% 7.0% $84,065 12.3% 1.5%
BIOSCIENCE-RELATED DISTRIBUTION Establishments 84 4.8% 5.6% 36,170 -1.1% -0.3% Employment 258 -18.3% -13.7% 440,394 6.0% -4.2% Location Quotient 0.31 n/a Direct-Effect Employment Multiplier 1.8 2.4 Total Employment Impact Multiplier 453 1,046,594 Average Annual Wage (constant 2010 dollars) $94,476 105.3% 68.8% $80,049 12.2% -0.4%
TOTAL BIOSCIENCE INDUSTRY Establishments 124 4.1% 5.5% 70,006 12.8% 6.7% Employment 831 -14.8% 0.6% 1,605,533 6.4% -1.4% Location Quotient 0.27 n/a Direct-Effect Employment Multiplier 2.8 3.2 Total Employment Impact 2,329 5,051,791 Average Annual Wage (constant 2010 dollars) $74,718 26.5% 24.4% $82,697 13.1% 0.6% TOTAL PRIVATE SECTOR
Establishments 23,469 17.7% 2.4% 8,752,494 12.5% 0.1% Employment 205,188 13.2% -5.3% 106,863,403 -2.9% -6.9% Average Annual Wage (constant 2010 dollars) $41,261 21.4% 1.1% $46,317 4.4% -0.4%
Note: U.S. employment metrics include Puerto Rico. Estimates of total employment impacts do not include Puerto Rico.
Employment, Establishment, and Wage Data: U.S. Bureau of Labor Statistics, Quarterly Census of Employment and Wages (QCEW); enhanced file from IMPLAN.
Employment Multipliers: U.S. Bureau of Economic Analysis RIMS II Employment Multipliers, 2008 (most current available).