
The Professional Geographer Groundwater Rights in Mexican ...
16
PLEASE SCROLL DOWN FOR ARTICLE This article was downloaded by: [Scott, Christopher A.] On: 7 January 2010 Access details: Access Details: [subscription number 918383585] Publisher Routledge Informa Ltd Registered in England and Wales Registered Number: 1072954 Registered office: Mortimer House, 37- 41 Mortimer Street, London W1T 3JH, UK The Professional Geographer Publication details, including instructions for authors and subscription information: http://www.informaworld.com/smpp/title~content=t788352615 Groundwater Rights in Mexican Agriculture: Spatial Distribution and Demographic Determinants Christopher A. Scott a ; Sandy Dall'erba a ; Rolando Díaz Caravantes b a University of Arizona, b Universidad Autónoma de Ciudad Juárez, First published on: 04 December 2009 To cite this Article Scott, Christopher A., Dall'erba, Sandy and Caravantes, Rolando Díaz(2010) 'Groundwater Rights in Mexican Agriculture: Spatial Distribution and Demographic Determinants', The Professional Geographer, 62: 1, 1 — 15, First published on: 04 December 2009 (iFirst) To link to this Article: DOI: 10.1080/00330120903375837 URL: http://dx.doi.org/10.1080/00330120903375837 Full terms and conditions of use: http://www.informaworld.com/terms-and-conditions-of-access.pdf This article may be used for research, teaching and private study purposes. Any substantial or systematic reproduction, re-distribution, re-selling, loan or sub-licensing, systematic supply or distribution in any form to anyone is expressly forbidden. The publisher does not give any warranty express or implied or make any representation that the contents will be complete or accurate or up to date. The accuracy of any instructions, formulae and drug doses should be independently verified with primary sources. The publisher shall not be liable for any loss, actions, claims, proceedings, demand or costs or damages whatsoever or howsoever caused arising directly or indirectly in connection with or arising out of the use of this material.
Transcript of The Professional Geographer Groundwater Rights in Mexican ...

PLEASE SCROLL DOWN FOR ARTICLE
This article was downloaded by: [Scott, Christopher A.]On: 7 January 2010Access details: Access Details: [subscription number 918383585]Publisher RoutledgeInforma Ltd Registered in England and Wales Registered Number: 1072954 Registered office: Mortimer House, 37-41 Mortimer Street, London W1T 3JH, UK
The Professional GeographerPublication details, including instructions for authors and subscription information:http://www.informaworld.com/smpp/title~content=t788352615
Groundwater Rights in Mexican Agriculture: Spatial Distribution andDemographic DeterminantsChristopher A. Scott a; Sandy Dall'erba a; Rolando Díaz Caravantes b
a University of Arizona, b Universidad Autónoma de Ciudad Juárez,
First published on: 04 December 2009
To cite this Article Scott, Christopher A., Dall'erba, Sandy and Caravantes, Rolando Díaz(2010) 'Groundwater Rights inMexican Agriculture: Spatial Distribution and Demographic Determinants', The Professional Geographer, 62: 1, 1 — 15,First published on: 04 December 2009 (iFirst)To link to this Article: DOI: 10.1080/00330120903375837URL: http://dx.doi.org/10.1080/00330120903375837
Full terms and conditions of use: http://www.informaworld.com/terms-and-conditions-of-access.pdf
This article may be used for research, teaching and private study purposes. Any substantial orsystematic reproduction, re-distribution, re-selling, loan or sub-licensing, systematic supply ordistribution in any form to anyone is expressly forbidden.
The publisher does not give any warranty express or implied or make any representation that the contentswill be complete or accurate or up to date. The accuracy of any instructions, formulae and drug dosesshould be independently verified with primary sources. The publisher shall not be liable for any loss,actions, claims, proceedings, demand or costs or damages whatsoever or howsoever caused arising directlyor indirectly in connection with or arising out of the use of this material.

ARTICLES
Groundwater Rights in Mexican Agriculture: Spatial
Distribution and Demographic Determinants∗
Christopher A. Scott and Sandy Dall’erbaUniversity of Arizona
Rolando Dıaz CaravantesUniversidad Autonoma de Ciudad Juarez
Groundwater use intensity and aquifer depletion increase from south to north with decreasing rainfalland increasing economic activity in Mexico. To heighten scholarly understanding and offer new insightsthat strengthen policy responses to aquifer depletion, we analyze the spatial distribution of agriculturalgroundwater use from irrigation well titles in 2,429 municipalities and its relation to agricultural surface waterand population employed in agriculture. Exploratory spatial data analysis reveals spatial dependence amongall three variables implying that policy initiatives to address intensive groundwater use must be targeted atclusters of aquifers and municipalities. Key Words: groundwater, Mexico, spatial statistics, water rights.
La intensidad del uso de agua subterranea y el agotamiento de los acuıferos en Mexico se incrementan desur a norte en relacion con la disminucion de la lluvia y el incremento de la actividad economica. Paramejorar la comprension de estos problemas y explorar nuevas ideas que fortalezcan las polıticas de respuesta alagotamiento de acuıferos, analizamos la distribucion espacial del uso agrıcola de agua subterranea extraıda depozos autorizados en 2.429 municipios, y su relacion con el uso de agua agrıcola de superficie y la poblacionempleada en agricultura. El analisis exploratorio de los datos espaciales revela una dependencia espacial entretodas las tres variables, lo cual implica que las iniciativas sobre polıticas que afronten el uso intensivo de aguasubterranea deben concentrarse en agrupamientos especıficos de acuıferos y municipalidades. Palabras clave:agua subterranea, Mexico, estadıstica espacial, derechos del agua.
L and, population, and economic devel-opment are concentrated in arid and
semiarid northern Mexico, whereas much ofthe south has abundant water supplies and isprone to flooding (witness the catastrophiclate 2007 floods in Tabasco and Chiapas).
∗This work was carried out with the aid of a grant from the Inter-American Institute for Global Change Research (IAI) SGP-HD No. 005, whichis supported by the U.S. National Science Foundation (Grant GEO-0642841), and by the National Oceanic and Atmospheric Administration’sSectoral Application Research Program. The study design, data collection and analysis, and preparation of this article were entirely determinedby the authors.
Despite sustained investment in infrastructureto store surface water and in the developmentof groundwater, the availability of water inabsolute terms or in relation to states’ eco-nomic ranking is severely limited in the north;however, due to land concentration and the
The Professional Geographer, 62(1) 2010, pages 1–15 C© Copyright 2010 by Association of American Geographers.Initial submission, April 2008; revised submissions, December 2008 and March 2009; final acceptance, June 2009.
Published by Taylor & Francis Group, LLC.
Downloaded By: [Scott, Christopher A.] At: 16:23 7 January 2010

2 Volume 62, Number 1, February 2010
structure of commercial farming in the north,this is where water use per person employed inagriculture tends to be the greatest. The distri-bution of access to water varies by use, by typeof user, and spatially across the country andwithin regions and river basins. Throughoutthe twentieth-century development of waterresources in Mexico, however, water use wasnot quantified in sufficient detail to permit as-sessment of socioeconomic or location-specificdifferences. This changed with water rightstitling beginning in 1992, a process describedin further detail in what follows. This processallows us to provide a detailed analysis of thedistribution of groundwater across Mexicanmunicipalities.
It was during the 1990s that groundwaterreceived increased attention in Mexico andfaced growing demand as a critical resource(Vazquez Rodrıguez 1999; Maranon-Pimenteland Wester 2000). At the national level,groundwater currently accounts for two thirdsof the water supplied for urban populations,half of the water for industry, and a third of thewater for agriculture (Comision Nacional delAgua [CONAGUA] 2008). Driven by risingdemand and pumping of groundwater coupledwith variable recharge, many regions of thecountry, particularly the Baja California penin-sula and the adjoining northwest region ofMexico, are experiencing aquifer overexploita-tion, leading to depletion and deterioration ofwater quality in this critical resource. One hun-dred and four of Mexico’s principal aquifersare overexploited, up from thirty-two in 1975(CONAGUA 2008), a trend that is seen innumerous regions around the world (Shah et al.2003; Kettle, Harrington, and Harrington2007; Giordano and Villholth 2007). Mexico isthe largest user of groundwater in Latin Amer-ica, with more than 100,000 large-capacitypumps for agriculture alone (Scott and Shah2004). Each of these groundwater wells mustbe titled to the individual, commercial, orpublic owner, in distinction from surface waterrights, which are granted to groups of users.
Spatially explicit data on groundwater titlesrepresent an important decision-making inputto address aquifer exploitation and the relatedpolicy challenge of safeguarding societal depen-dence on groundwater. Spatial tools for waterresources management in Mexico are being de-veloped and applied, such as canal irrigation op-
erations and management (Ojeda-Bustamanteet al. 2007) and Global Positioning Systemlocational inventorying of infrastructure foroperational purposes. However, despite inno-vation with spatially explicit groundwater mod-els for decision support, for example, in thecentral state of Guanajuato (Sandoval-Minero2001), the Mexican government’s official esti-mates of groundwater availability and depletionare estimated based on aquifer-wide averagewater balances of supply (recharge) and de-mand (pumping). Decision makers have paidinadequate attention to the potential presenceof spatial dependence in the distribution ofgroundwater levels across municipalities, to therelationship between groundwater and popula-tion employed in agriculture, and to the con-junctive role of surface irrigation (importantboth for recharge of underlying aquifers andas an alternative source of irrigation water).This article presents specific spatial analysesthat might permit decision makers to addressthese policy gaps.
The article is organized as follows. The in-troduction has provided a brief overview of wa-ter resources in Mexico with an emphasis onaquifer depletion and associated managementand policy challenges. We augment this with asection discussing water rights, particularly inagriculture. Next we set forth our conceptualapproach and specific objectives, identifyingthe contribution this article makes to the rele-vant literature as well as potential policy uptaketo address aquifer depletion in Mexico. Theanalysis follows, with an exploratory spatial dataanalysis of the distribution of ground and sur-face water rights, coupled with labor in agricul-ture across Mexico’s municipalities. The articleconcludes with a discussion of Mexico’s in-tensive groundwater use and aquifer depletionchallenges and highlights policy implications.
Water Rights in Agriculture
In Mexico, the Public Register of Water Rights(Registro Publico de Derechos de Agua [REPDA]2008) codifies water rights as mandated by theLaw of the Nation’s Waters (Ley de AguasNacionales [LAN]) and its regulations. TheREPDA is managed by CONAGUA. Althoughthe LAN was promulgated in 1992, the REPDAhas only recently become operational as a reli-able database (Garduno 2005). As of the end of
Downloaded By: [Scott, Christopher A.] At: 16:23 7 January 2010

Groundwater Rights in Mexican Agriculture 3
2006, over 97 percent of the water rights titlingprocess was completed (CONAGUA 2008).
It is instructive to review other provisionsof the LAN that influence water managementand access, namely, the role of CONAGUA,the structure and functioning of river basincouncils as a mechanism for the managementof water resources, and public participation inwater management. A federal agency withinthe environment ministry, CONAGUA is re-sponsible for administering and managing wa-ter resources. Water is considered propertyof the nation; however, there is some defini-tional ambiguity regarding “state” waters (sur-face sources that originate and are depletedwithin a state). All groundwater is nationalproperty. During the 1990s, CONAGUA’sprincipal mandate was to manage surface wa-ter resources. In 1992, it initiated the trans-fer of large irrigation districts (3.2 millionhectares in total, largely relying on surfacewater sources) to water users. For the pur-poses of our analysis, it is important to notethat rights to surface water in this case weregranted at the level of the water user associ-ation, which typically encompasses thousandsof individual users (Rap, Wester, and Perez-Prado 2003). Small surface water irrigation sys-tems and some collective groundwater systemscalled irrigation units (unidades de riego) contin-ued under user management with group waterrights (Palerm Viqueira and Martınez Saldana2000; Silva-Ochoa 2000; Scott and Silva-Ochoa2001). Water users along with federal andstate agencies are represented on Mexico’s riverbasin councils, which have achieved consider-able acclaim internationally. Representation onthe councils and a series of related public par-ticipation initiatives for water management arebased on the water users holding rights codifiedin the REPDA.
CONAGUA administers the titling and con-cessioning of all water rights, both to surfaceand groundwater sources, which are writteninto the REPDA. Concessions are grantedfor a specified annual volume over the pe-riod of the concession (typically ten yearsfor groundwater) and must be renewed. Theapplication process requires that no damageto third parties be substantiated; however, inpractice this is just a formality. It has beennoted that for some aquifers, the sum to-tal of volumetric concession titles may ex-ceed sustainable yield (Moreno Vasquez 2006),
indicating overexploitation with negative im-plications for other groundwater users. In a bidto bring the actual use of groundwater in linewith the concessioned volume, all agriculturaltitles now specify that the user must installa volumetric flow meter and report pumpedvolumes to CONAGUA. Our primary observa-tions based on fieldwork in Sonora, Chihuahua,Guanajuato, and other states using large vol-umes of groundwater in agriculture indicatethat flow meters and volumetric reporting arebeginning to be enforced, but these recordsare not systematically kept or made availablefor research purposes.
The principal uses of groundwater recog-nized in the REPDA include public and ur-ban, industry, aquaculture, agricultural, andlivestock use. Public and urban and industrialusers pay for water rights. This represents anincreasingly important source of revenue forCONAGUA (Scott et al. 2004). Growth in de-mand must be met by acquiring additional wa-ter rights. Industrial users are similarly allottedan annual volume and must pay for water rights.Agriculture, which represents the largest shareof groundwater extraction, does not have to payCONAGUA for rights. However, individualwell owners (or groups of users) must formal-ize their concessions with a title. In additionto specifying the annual volume concessionedbased on the discharge of the well and the areaof irrigable land reported, the title spells outthe norms regarding repositioning of the well,cessation of rights for unutilized volumes (overthree consecutive years), and the transfer (sale)of rights, among other provisions.
Irrigation plays a critical role in agricul-tural and livestock production, particularly inarid and semiarid regions such as northernMexico, where rain-fed agriculture is severelyconstrained by soil moisture and changing cli-mate (Loaiciga 2003). Surface water irrigationconveyed from reservoirs through canals tofarmers’ fields tends to be inflexible in termsof timing and delivery; as a result, farmers’ de-cision making on which crops to plant, when,and in what area is limited by the supply of canalwater. Groundwater irrigators, on the otherhand, enjoy considerable flexibility in this re-gard. However, a major benefit associated withreceiving surface water is that irrigation feestend to be relatively low given that federal orstate governments have incurred the cost of in-frastructure development and in many cases
Downloaded By: [Scott, Christopher A.] At: 16:23 7 January 2010

4 Volume 62, Number 1, February 2010
continue to subsidize canal irrigation opera-tional costs (Wester 2008).
Conceptual Approach and Objectives
Llamas and Custodio (2003, 5, 16–17) heldthat “intensive use of groundwater” providesbetter explanatory insight into the sustainabil-ity of human dependence on aquifers than“safe yield” or related extraction-to-rechargeratios. Their intensive use framework assesseshuman demand and technology in the con-texts of physical hydrogeological process andspatial and temporal scale. Sustained “overex-ploitation” of aquifers that drops water lev-els and deteriorates water quality may only beviewed as an adaptation strategy in the shortterm. Intensive use of groundwater that relieson technology, such as more efficient pumpsand desalination, or spatially shifts demand toother locations within the aquifer without re-ducing overall extraction will generate seriousmedium- and long-term impacts. They assessintensive groundwater use in central Spain,which they explicitly acknowledge bears simi-larity with northwest Mexico. For the purposesof this article, we follow Llamas and Custodioby assessing the human drivers of aquifer de-pletion, and we expand on their spatial char-acterization of intensive groundwater use byanalyzing detailed data from Mexico using thetools of exploratory spatial data analysis thatallow us to identify and measure spatial depen-dence across our observations. Whereas theseauthors eschew value-based judgments in as-sessing groundwater management in Spain andleave policy implications to national and localauthorities (Llamas and Custodio 2003), we at-tempt to draw out specific policy implications.
To augment the intensive use frameworkwith specific management and policy consider-ations, we turn to Shah (2009), who provideda nuanced and extended historical view ofgroundwater use in South Asia where agricul-ture (irrigation) represents the dominant use,similar to Mexico. Shah’s analysis of the humandrivers and institutional dynamics in responseto the development of aquifers with distincthydrogeological characteristics has applica-bility beyond South Asia. Based on data fromMexico, we assess two of Shah’s propositionson irrigation development and the interrelation
between ground and surface water. First, asdistinct from South Asia, surface water remainsthe principal source of irrigation in Mexico inaggregate terms. However, groundwater canbe intensively used instead of surface waterat a specific location, although we recognizethat the interactions between irrigation usesof these two sources of water are complexand depend on hydrologic, economic, andother variables not fully captured by the spatialanalysis for Mexico we present in this article.Second, Shah contends that population andits spatial density drive intensive groundwateruse. Although our goal here is not to assess thedirection or the extent of the causality betweenboth variables, we provide in the sectionsthat follow a discussion of their relationship.Based on our field experience, groundwateruse and socioeconomic data from Mexico, andanalysis in this article, we selectively interpretrelevant conceptual frameworks advanced byLlamas and Custodio (2003) and Shah (2009).As objectives, we posit that intensive use ofgroundwater for agriculture and livestock inMexico follows two dependent relations.
Groundwater use tends to substitute for sur-face water use in Mexico; that is, areas with highaccess to groundwater do not necessarily havehigh access to surface water, in contrast to otherregions in which surface water irrigation playsan important complementary role in recharg-ing underlying groundwater aquifers throughirrigation return flows (Gale 2005). Addition-ally, groundwater access should be clustered,with adjacent areas sharing similar characteris-tics in access to groundwater. Given the com-plexity in the human uses of ground and surfacewater, we expect these results to be mixed andthat definitive claims will be localized basedon irrigation practice and hydrological pro-cesses and must therefore be supported by field-based evidence. Access to ground and surfacewater is posited to increase with agrarian la-bor population, despite significant variation inmechanization, agricultural labor absorption,and farm enterprise scale across regions inMexico; in other words, areas with access to wa-ter for agriculture have a high percentage of thelabor force employed in agriculture. Whetherlabor is the determining variable, followingBoserup’s (1965) contention that populationpressure drives innovation in food production,or the reverse, that water availability facilitates
Downloaded By: [Scott, Christopher A.] At: 16:23 7 January 2010

Groundwater Rights in Mexican Agriculture 5
labor absorption in agriculture (White 1994),remains an intriguing question.
The final objective of this article is to elu-cidate geographical (both physical and human)drivers of aquifer depletion with a view to in-forming policy. We consciously employ spa-tial and statistical tools to analyze the largeREPDA database given our intent to observepatterns across Mexico’s irrigated agriculturallandscapes, identify the potential presence ofspatial dependence in the distribution of thecharacteristics of these landscapes, and providepolicy implications based on our findings. Ad-ditional analyses based on fieldwork (e.g., ofaquifer properties or agrarian labor dynamics)are the necessary next step to gain a detailedcontextual knowledge of the Mexican agricul-tural sector. In addition, we intend at a laterstage to combine this approach with a for-mal econometric estimation of the dynamicsat stake in this sector. The goal of this article,then, is to elucidate the complexities and thespatial characteristics of the Mexican agricul-tural landscape by means of exploratory spatialdata analysis but to leave more complete explo-ration to future research.
Data and Methods
The municipality (municipio) is the administra-tive unit below the state that was chosen asthe unit of analysis to permit cross-comparisonof REPDA data with census data reportedby the National Institute for Statistics, Ge-ography, and Information Science (InstitutoNacional de Estadıstica, Geografıa e Informatica).The following REPDA data were downloadedin November 2006 for 423,179 records: num-ber and volume (cubic meters per year) of wa-ter rights titles by use category (aquaculture,agriculture, agroindustrial, domestic, powergeneration, industrial, multiple use, livestock,public and urban, or services). Each recorddistinguishes groundwater or surface water asthe source. Agricultural groundwater (AGW)and agricultural surface water (ASW) weresummed as the respective totals of agricul-ture and livestock uses and were aggregated atthe level of 2,429 municipalities and thirty-twostates.
In this article, we perform an exploratoryspatial data analysis (ESDA) of the distributionof water access across Mexican municipalities.
The strength of ESDA lies in its capacity to dis-cover patterns of spatial association, clusters, orhot spots and to suggest the presence of spatialheterogeneity (Haining 1990; Anselin 1995).The patterns we are particularly interested inare whether locations in close proximity regis-ter similar AGW levels with respect to ASWand population employed in agriculture (PEA).
GeoData Analysis software (GeoDa 0.9.5-i5) was utilized for ESDA of groundwaterand surface water access in Mexico. Withan explicit focus on the geographical char-acteristics of the data, ESDA is an increas-ingly popular GIScience-based technique thatallows users to describe and visualize spa-tial distributions; identify atypical locationsor spatial outliers; discover patterns of spa-tial association, clusters, or hot spots; and sug-gest spatial regimes or other forms of spatialheterogeneity. It utilizes a wide range of largelygraphical methods that explore the propertiesof data sets without the need for formal modelbuilding (Anselin 1988, 1999; Haining 1990).
Results and Discussion
Figure 1 shows the states in Mexico andcomplements Table 1, the municipality-levelsummary data of the variables of primaryinterest for our analysis, grouped by statesin northern and southern Mexico. Stateswith high mean municipality AGW includeBaja California Norte (BCN), which has thecountry’s largest area municipalities and highstandard deviations across AGW, ASW, andPEA; Guanajuato; Baja California South (BCS);and Chihuahua, all of which are northern statesfacing aquifer depletion. By contrast, the stateswith low mean AGW are Oaxaca (with thesmallest area municipalities that account for al-most a quarter of the country’s total numberof municipalities), Guerrero, and Veracruz inthe south, leading to a principal observationthat high AGW is an important driver of aquiferdepletion. In fact, no southern state experi-ences aquifer depletion. The distribution ofmean municipality ASW values presents mixedresults, with neither high nor low values cor-responding to aquifer depletion, with the ex-ception of urbanized Distrito Federal (MexicoCity), which has little agriculture to exert muchdemand for ASW or AGW, yet still experiences
Downloaded By: [Scott, Christopher A.] At: 16:23 7 January 2010

6 Volume 62, Number 1, February 2010
Figure 1 Mexican states.
depletion. The mean AGW/ASW ratios simi-larly are unclear in patterns that would shedlight on pressure and response to aquifer de-pletion. As discussed in more detail later, an-other finding is that across Mexico’s regionsAGW appears independent of ASW; that is,AGW can be high in the presence or absenceof ASW.
States with high mean municipality totalpopulation include Distrito Federal, BCN,and Mexico state, as well as agriculturallyimportant Sinaloa, Tabasco, and Guanajuato.From our interest in agriculture and irriga-tion, states with high mean municipality PEAinclude Sinaloa, BCN, Tabasco, and Chiapas.These observations on population—total oragricultural—in themselves are not notewor-thy for our analysis of intensive groundwateruse, so to better understand aquifer depletionwe must consider AGW and its relation to bothPEA and ASW. Table 1 shows high mean mu-nicipality AGW for BCN, Guanajuato, BCS,and Chihuahua—all with recognized aquiferdepletion problems. To support our hypoth-esis that agricultural population correlates withintensive use, an additional finding is that sim-
ple regression of mean AGW versus meanPEA yields a positive relationship significantat p < 0.05. The AGW/PEA ratio is high-est in Chihuahua, Aguascalientes, and Sonora.Aguascalientes represents the particular case ofa small area state dominated by a large citywhere aquifer depletion appears more related toconcentrated urban and industrial groundwaterpumping. Coahuila and Zacatecas have highAGW/PEA ratios and are experiencing aquiferdepletion, whereas the lowest ratios are foundin Guerrero, Veracruz, and Tabasco, whichdo not currently face depletion. We find,therefore, that high AGW with low PEAin northern Mexico corresponds to aquiferdepletion.
Figures 2 through 4 show the spatial distri-bution of AGW, ASW, and PEA by municipal-ity. It is apparent that AGW is concentratedin northwestern and north-central Mexico(Figure 2), with some additional AGW in thesoutheastern Yucatan Peninsula, largely forplantation agriculture including tropical fruits.As mentioned earlier, because rainfall declinesfrom south to north in Mexico, in the northernareas of high AGW, agriculture is only possible
Downloaded By: [Scott, Christopher A.] At: 16:23 7 January 2010

Tab
le1
Mun
icip
ality
-leve
lwat
eran
dpo
pula
tion
sum
mar
yda
taby
nort
hern
and
sout
hern
stat
es
AG
W(c
ub
icA
SW
(cu
bic
Po
pu
lati
on
PE
Ain
No
.o
ve
rm
ete
rs/y
ea
r)m
ete
rs/y
ea
r)in
20
00
20
00
AG
W/A
SW
AG
W/P
EA
AS
W/P
EA
exp
loit
ed
No
.
Sta
tea
qu
ifers
mu
nic
ipio
sM
SD
MS
DM
SD
MS
DM
SD
MS
DM
SD
Nor
ther
nM
exic
o10
11,
324
Agu
asca
lient
es4
1121
,646
,462
26,1
99,7
2510
,238
,282
16,9
62,9
5685
,844
185,
775
2,21
71,
815
7.3
6.1
13,5
3016
,947
3,30
72,
914
Baj
aC
alifo
rnia
N.
65
87,7
43,4
9411
1,00
0,00
03,
743,
321
5,01
3,94
749
7,47
349
0,10
611
,512
14,3
5732
.012
.28,
615
7,64
733
533
4B
aja
Cal
iforn
iaS.
46
35,8
13,4
9647
,322
,348
3,88
6,98
34,
912,
446
70,6
7472
,472
3,35
62,
700
12.0
12.0
6,89
97,
694
749
762
Chi
huah
ua7
6731
,553
,068
63,9
17,9
476,
642,
497
12,9
31,6
0645
,566
167,
813
1,48
01,
370
847,
722
6,71
4,35
615
,671
26,1
256,
222
13,1
38C
oahu
ila9
3817
,316
,939
34,1
61,4
063,
778,
317
6,38
0,51
460
,476
125,
183
1,14
71,
307
4,13
6,71
711
,300
,043
11,6
8010
,965
6,58
313
,473
Col
ima
010
20,0
54,5
5936
,037
,283
40,7
78,5
3661
,204
,247
54,2
6349
,279
3,39
03,
182
0.7
1.0
5,29
510
,597
10,8
7913
,716
Dis
trito
Fede
ral
216
1,33
0,05
32,
309,
350
211,
522
259,
923
537,
827
422,
092
1,28
81,
584
134,
377
298,
886
3,97
38,
378
530
991
Dur
ango
639
11,1
07,1
5619
,436
,377
3,45
5,07
24,
864,
502
37,1
4587
,159
1,70
81,
608
1,73
1,24
05,
431,
096
5,01
65,
591
2,41
23,
376
Gua
naju
ato
846
36,3
49,1
5738
,720
,647
7,09
8,85
717
,588
,856
101,
370
178,
166
4,20
03,
275
5,17
5,51
720
,395
,409
7,28
35,
016
2,66
511
,119
Hid
algo
184
1,19
8,84
93,
743,
876
2,85
3,66
26,
371,
097
26,6
1432
,014
2,18
92,
058
41,3
1929
9,76
068
71,
738
1,67
92,
777
Jalis
co1
123
5,77
1,70
210
,426
,479
3,25
7,95
96,
347,
992
50,9
3817
8,62
91,
890
1,55
649
,115
476,
327
2,22
43,
428
1,72
63,
025
Mex
ico
412
11,
429,
628
3,66
1,30
83,
985,
827
7,84
3,17
210
5,56
422
4,46
21,
918
2,00
522
0,49
795
7,15
01,
322
2,99
12,
531
8,70
2M
icho
acan
511
37,
190,
823
15,1
07,2
349,
754,
271
22,9
87,1
8735
,271
66,7
162,
573
2,07
556
6,12
32,
903,
060
2,53
83,
990
3,02
46,
873
Mor
elos
233
2,20
0,37
63,
819,
606
1,91
9,15
13,
624,
583
47,1
3065
,348
2,25
71,
413
486,
114
1,14
9,37
487
51,
203
898
1,52
4N
ayar
it0
212,
843,
693
3,37
4,99
810
,101
,890
15,5
06,4
9543
,818
63,8
504,
223
3,86
12.
06.
078
390
31,
819
1,90
1N
uevo
Leon
151
9,35
2,96
118
,928
,196
10,0
28,5
7121
,123
,088
75,1
7919
3,44
395
01,
097
2,44
1,30
812
,025
,164
8,96
126
,371
11,3
9624
,938
Pueb
la2
217
2,66
6,04
06,
217,
664
2,71
7,70
712
,408
,459
23,3
9593
,430
2,14
22,
063
900,
939
2,52
4,63
31,
312
2,02
41,
804
7,71
0Q
uere
taro
418
15,6
34,0
2227
,668
,265
4,78
8,40
35,
496,
233
78,0
1714
5,87
82,
304
1,29
410
.222
.15,
466
7,36
72,
341
2,77
7S
anLu
isPo
tosi
658
8,37
5,89
315
,986
,697
5,91
5,28
417
,738
,560
39,6
4490
,081
2,63
02,
278
1,32
8,64
04,
422,
149
4,51
87,
695
1,92
83,
629
Sin
aloa
018
13,8
46,1
6414
,157
,812
18,5
72,5
0538
,381
,865
140,
936
188,
905
13,7
4413
,328
16.2
33.3
1,39
11,
545
911
1,45
7S
onor
a17
7015
,922
,674
39,9
68,6
215,
974,
319
18,7
55,9
1431
,671
88,7
721,
839
3,85
866
,466
277,
780
12,0
7516
,687
11,3
4030
,916
Tam
aulip
as0
435,
805,
225
16,1
24,1
9015
,530
,075
25,3
89,8
3864
,028
110,
870
2,16
11,
682
21,7
4699
,956
2,08
15,
455
7,29
612
,061
Tlax
cala
360
1,72
3,86
54,
440,
494
709,
841
1,56
4,88
416
,044
16,8
5199
71,
012
1,07
1,11
54,
424,
617
1,57
72,
018
679
1,28
4Za
cate
cas
956
15,9
21,9
7631
,497
,623
3,10
3,75
34,
769,
510
23,9
3832
,456
1,29
81,
340
1,86
1,79
510
,206
,403
9,85
311
,776
3,53
48,
990
Sou
ther
nM
exic
o0
1,10
5C
ampe
che
09
25,7
15,7
9541
,515
,186
3,53
0,77
710
,223
,560
50,8
6966
,356
4,27
53,
236
5,00
5,12
67,
266,
455
4,48
05,
412
2,55
27,
602
Chi
apas
011
02,
946,
131
15,4
48,5
445,
719,
410
30,2
46,0
5135
,077
51,9
895,
071
4,27
84,
438
42,1
3149
91,
634
1,37
98,
675
Gue
rrer
o0
7668
4,39
12,
032,
029
3,70
5,04
115
,537
,039
40,5
2284
,883
3,12
72,
800
5,15
637
,299
143
459
888
2,96
7O
axac
a0
570
308,
490
1,12
3,04
056
6,87
71,
877,
660
6,00
314
,680
766
1,09
237
,340
267,
322
537
1,54
01,
290
4,26
0Q
uint
ana
Roo
09
9,05
8,47
421
,459
,976
43,2
0112
4,99
897
,218
135,
712
4,06
24,
849
249,
304
571,
570
857
1,42
93.
68.
6Ta
basc
o0
172,
131,
113
3,20
8,72
82,
824,
417
5,10
5,74
811
1,28
411
8,55
39,
842
5,62
391
,730
289,
144
398
1,02
234
155
3Ve
racr
uz0
208
887,
824
2,91
1,78
62,
254,
553
12,9
90,0
6832
,934
52,8
243,
544
3,39
998
,746
1,06
6,48
125
276
263
64,
648
Yuca
tan
010
63,
139,
697
11,0
30,5
950
015
,643
68,6
361,
002
1,14
63,
139,
697
11,0
30,5
952,
255
3,01
0—
—
Nat
iona
ltot
al10
12,
429
Not
e:A
GW
=ag
ricul
tura
lgro
undw
ater
;AS
W=
agric
ultu
rals
urfa
cew
ater
;PE
A=
popu
latio
nen
gage
din
agric
ultu
re.
7
Downloaded By: [Scott, Christopher A.] At: 16:23 7 January 2010

8 Volume 62, Number 1, February 2010
Figure 2 Agricultural groundwater (volume per municipality per year).
with irrigation. This raises a critical resourcedependence issue: Without surface water asan alternative source, agriculture in northernMexico is based primarily on groundwater ir-rigation. It should also be noted that northernMexico’s proximity to the United States givesit a strategic commercial advantage over otherregions of the country for export agriculture inthe context of the North American Free TradeAgreement. We have primary evidence fromthe northwestern state of Sonora of agriculturalinvestment and trade (through contract farm-ing), not just of U.S. capital but also of Chileaninvestors seeking a year-round supply of tablegrapes for U.S. markets; that is, November andDecember production in Chile complementedby May and June production in Mexico. The ir-rigation water requirements during these sum-mer production seasons are extremely high, andaquifers in Sonora continue to face depletion.It should also be noted that, even if surfacewater were available, high-precision drip irri-gation is better suited to on-demand ground-water from the farms’ own pumps, wherebyfarmers seek to protect themselves from er-ratic supplies that characterize public sur-
face irrigation systems. For example, the largeASW rights in north-central Mexico (Durangoand Coahuila) are predominantly to irrigatesorghum and alfalfa as fodder for the importantdairy industry in the La Laguna region. Nev-ertheless, there are notable examples of ASWused for high-value commercial agriculture,such as tomato and fresh vegetable farmingin Sinaloa that makes significant use of ASW(Figure 3).
However, intensive farming operations ofthe kind already described require significantfarm labor. Figure 4 shows PEA. It is evidentthat the spatial distribution of PEA acrossMexico corresponds more closely to AGWthan to ASW, suggesting that labor absorptionis higher in AGW-based farming than ASW-based farming. To quantitatively analyze thedata based on the spatial and demographicobjectives we have set out for this article, weturn next to ESDA of spatial clustering andspatial autocorrelation of the ratios of AGWwith ASW and PEA as described later. Spatialautocorrelation refers to the coincidence ofattribute similarity and locational similarity(Anselin 1988). In the context of our study,
Downloaded By: [Scott, Christopher A.] At: 16:23 7 January 2010

Groundwater Rights in Mexican Agriculture 9
Figure 3 Agricultural surface water (volume per municipality per year).
Figure 4 Population employed in agriculture (2000).
Downloaded By: [Scott, Christopher A.] At: 16:23 7 January 2010

10 Volume 62, Number 1, February 2010
positive spatial autocorrelation indicatesthat municipalities with high use of AGWrelative to ASW tend to be geographicallyclustered, whereas municipalities with lowAGW/ASW also tend to be clustered. Spatialautocorrelation may be due to (1) “substantive”factors, such as proximity to U.S. marketsfor agricultural exports, climatic conditions,and agricultural production structure thatphysically adjacent municipalities tend toshare; or (2) to a “nuisance” factor due toa mismatch between the boundaries of themunicipalities used to organize the data andthe actual boundaries of the processes we aretrying to capture (Anselin 1988).
Spatial Weight MatrixThe definition of a spatial weight matrix isnecessary to carry out the successive steps ofESDA. Spatial dependence can occur in any di-rection, so weight matrices are computed withreference to the k = 10 nearest neighbors asfollows:
⎧⎪⎪⎪⎪⎨⎪⎪⎪⎪⎩
wi j (k) = 0 if i = jwi j (k) = 1 if di j ≤ Di (k) and
∗wi j
(k) = wi j (k)/
∑j
wi j (k) for k = 10
wi j (k) = 0 if di j > Di (k)
(1)
where di j is the great circle (arc) distance be-tween centroids of region i and j. Di (k) is thecritical cutoff distance defined for each regioni, above which interactions are assumed neg-ligible. In other words, Di (k) is the kth-ordersmallest distance between regions i and j suchthat each region i has exactly k neighbors. Eachmatrix is row-standardized so that distance isrelative and not absolute, yielding the matrix∗w. Each nonzero entry in
∗w is therefore 0.1.
The choice of a spatial weight matrix is alwayssomewhat arbitrary. To limit the influence ofthe choice of the matrix on our results, we alsocompute a contiguity and two distance-basedmatrices (with cutoffs of 320 km and 800 km)to verify whether our findings are sensitive tothe choice of the weight matrix.
Spatial Autocorrelation Using Moran’s IBased on the spatial weight matrix defined inEquation 1, we proceed to analyze the spatial
distribution of our variables using Moran’s I,which captures the global spatial autocorrela-tion of the variables of interest; that is, for eachvariable, Moran’s I gives the degree of linearassociation between its value at one locationand the spatially weighted average of neigh-boring values. To draw inferences, we use arandom permutation procedure that recalcu-lates the statistic to generate a reference dis-tribution and a pseudo-significance level from10,000 permutations (Anselin 1995). For eachvariable of interest, Moran’s I is given by:
I =
n∑i=1
n∑j=1
∗wi j (k)xi x j
n∑i=1
n∑j=1
xi x j
(2)
where∗wi j
is the (row-standardized) degree
of connection between the spatial units iand j, and xi and x j are the variable ofinterest in regions i and j (measured as adeviation from the mean value). Moran’s Ivalues larger (or smaller) than the expectedvalue E(I ) = −1/(n − 1) indicate positive(or negative) spatial autocorrelation. Theresults indicate the presence of positive spatialautocorrelation; that is, regions with highAGW/ASW (Moran’s I = 0.1151), highAGW/PEA (I = 0.3687), and high ASW/PEA(I = 0.1714) tend to be geographically clus-tered, whereas regions with low values tend tobe close to each other as well. All the Moran’sI values just given have an expected value of–0.0004 and are significant (p value = 0.0001).These results are consistent with all the spatialweight matrices defined previously. As a result,the value of these variables in one location issignificantly related to the value of the samevariables in neighboring locations. If found tobe significant, spatial dependence is an impor-tant factor that needs to be included in policyformulation and assessment of regulations. Werecommend that groundwater management inMexico systematically include the character-istics of the agricultural landscape and waterdemand of the individual municipality but alsothose of neighboring municipalities where theaquifer is located. Some efforts have been madein this direction in recent years (Sandoval-Minero 2001), but this is the first time that the
Downloaded By: [Scott, Christopher A.] At: 16:23 7 January 2010

Groundwater Rights in Mexican Agriculture 11
extent of spatial dependence across Mexicanmunicipalities is formally measured.
Significance of Spatial Clustering UsingLocal Indicator of Spatial AssociationAlthough very useful, the Moran’s I doesnot give any indication of the significance orlocalization of spatial clustering. To addressthis problem, we continue our analysis witha local indicator of spatial association (LISA).The calculation of LISA statistics for eachobservation allows us to obtain an indica-tion of significant local spatial clusters (alsocalled hot spots) as well as for the diagnosticsof local instability, significant outliers, andspatial regimes. Anselin (1995) formalizes thelocal Moran’s statistics for each region i as:
Ii =(
xi
m0
)∑j
∗wi x j with m0 =
∑i
x2i t/n
(3)
where xi and x j are the variable of interestin regions i and j (measured as a deviationfrom the mean value). As for the preced-ing Moran’s I, the significance level is based
on a conditional permutation approach with10,000 random permutations of the neighbor-ing municipalities for each observation. Figures5 through 7 are the LISA maps for AGW/ASW,AGW/PEA, and ASW/PEA with k = 10 near-est neighbors. Note that the municipalities inwhite are those where the Moran’s statistics arenot significant at 5 percent.
Figure 5 demonstrates multiple clusters ofAGW/ASW spatial association. Low valuesof AGW/ASW surrounded by low values ofthe same variable in south-central Mexico andalong the Pacific Ocean and Gulf of Mexicocoastal regions result from high surface wa-ter availability. The low–high cluster in north-central Chihuahua appears to derive frommunicipalities with ASW from the Rıo Con-chos, a Mexican tributary to the Rio Grandethat forms the border with the United States,surrounded by others that are AGW depen-dent. Four clusters of high–high municipal-ities surrounded by low–high municipalitiesare important for our discussion of intensivegroundwater use and the targeted clusters ofmunicipalities that require additional policyand groundwater attention as alluded to ear-lier. The first such hot spot is centered on
Figure 5 LISA map of agricultural groundwater/agricultural surface water.
Downloaded By: [Scott, Christopher A.] At: 16:23 7 January 2010

12 Volume 62, Number 1, February 2010
Figure 6 LISA map of agricultural groundwater/population employed in agriculture.
Figure 7 LISA map of agricultural surface water/population employed in agriculture.
Downloaded By: [Scott, Christopher A.] At: 16:23 7 January 2010
Groundwater Rights in Mexican Agriculture 13
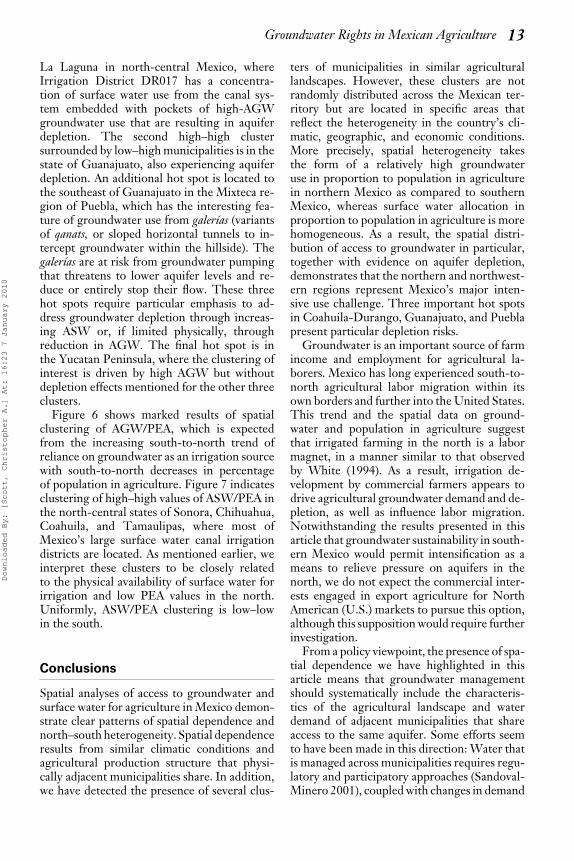
La Laguna in north-central Mexico, whereIrrigation District DR017 has a concentra-tion of surface water use from the canal sys-tem embedded with pockets of high-AGWgroundwater use that are resulting in aquiferdepletion. The second high–high clustersurrounded by low–high municipalities is in thestate of Guanajuato, also experiencing aquiferdepletion. An additional hot spot is located tothe southeast of Guanajuato in the Mixteca re-gion of Puebla, which has the interesting fea-ture of groundwater use from galerıas (variantsof qanats, or sloped horizontal tunnels to in-tercept groundwater within the hillside). Thegalerıas are at risk from groundwater pumpingthat threatens to lower aquifer levels and re-duce or entirely stop their flow. These threehot spots require particular emphasis to ad-dress groundwater depletion through increas-ing ASW or, if limited physically, throughreduction in AGW. The final hot spot is inthe Yucatan Peninsula, where the clustering ofinterest is driven by high AGW but withoutdepletion effects mentioned for the other threeclusters.
Figure 6 shows marked results of spatialclustering of AGW/PEA, which is expectedfrom the increasing south-to-north trend ofreliance on groundwater as an irrigation sourcewith south-to-north decreases in percentageof population in agriculture. Figure 7 indicatesclustering of high–high values of ASW/PEA inthe north-central states of Sonora, Chihuahua,Coahuila, and Tamaulipas, where most ofMexico’s large surface water canal irrigationdistricts are located. As mentioned earlier, weinterpret these clusters to be closely relatedto the physical availability of surface water forirrigation and low PEA values in the north.Uniformly, ASW/PEA clustering is low–lowin the south.
Conclusions
Spatial analyses of access to groundwater andsurface water for agriculture in Mexico demon-strate clear patterns of spatial dependence andnorth–south heterogeneity. Spatial dependenceresults from similar climatic conditions andagricultural production structure that physi-cally adjacent municipalities share. In addition,we have detected the presence of several clus-
ters of municipalities in similar agriculturallandscapes. However, these clusters are notrandomly distributed across the Mexican ter-ritory but are located in specific areas thatreflect the heterogeneity in the country’s cli-matic, geographic, and economic conditions.More precisely, spatial heterogeneity takesthe form of a relatively high groundwateruse in proportion to population in agriculturein northern Mexico as compared to southernMexico, whereas surface water allocation inproportion to population in agriculture is morehomogeneous. As a result, the spatial distri-bution of access to groundwater in particular,together with evidence on aquifer depletion,demonstrates that the northern and northwest-ern regions represent Mexico’s major inten-sive use challenge. Three important hot spotsin Coahuila-Durango, Guanajuato, and Pueblapresent particular depletion risks.
Groundwater is an important source of farmincome and employment for agricultural la-borers. Mexico has long experienced south-to-north agricultural labor migration within itsown borders and further into the United States.This trend and the spatial data on ground-water and population in agriculture suggestthat irrigated farming in the north is a labormagnet, in a manner similar to that observedby White (1994). As a result, irrigation de-velopment by commercial farmers appears todrive agricultural groundwater demand and de-pletion, as well as influence labor migration.Notwithstanding the results presented in thisarticle that groundwater sustainability in south-ern Mexico would permit intensification as ameans to relieve pressure on aquifers in thenorth, we do not expect the commercial inter-ests engaged in export agriculture for NorthAmerican (U.S.) markets to pursue this option,although this supposition would require furtherinvestigation.
From a policy viewpoint, the presence of spa-tial dependence we have highlighted in thisarticle means that groundwater managementshould systematically include the characteris-tics of the agricultural landscape and waterdemand of adjacent municipalities that shareaccess to the same aquifer. Some efforts seemto have been made in this direction: Water thatis managed across municipalities requires regu-latory and participatory approaches (Sandoval-Minero 2001), coupled with changes in demand
Downloaded By: [Scott, Christopher A.] At: 16:23 7 January 2010

14 Volume 62, Number 1, February 2010
behavior of pumpers (for early literature ongroundwater governance, see Blomquist 1992).Where groundwater use is largely agricultural,cropping changes and water demand can be in-fluenced by commodity prices; however, en-ergy pricing and supply can be determinants ofpumping behavior (Scott and Shah 2004). Re-gionally targeted caps to limit power supply asa groundwater demand management option toaddress clusters of groundwater depletion canface social and political challenges. Prices mustbe high enough to be in the elastic range of de-mand response, which is taking place in Mex-ico as power tariffs are raised (although not in adepletion-targeted sense) and pumping depthsincrease. Given high latent demand, however,noncommercial smallholder farmers who arefirst affected might choose to sell or rentgroundwater to commercial farmers (Wilderand Romero-Lankao 2006; Wester 2008) in-stead of shutting down (“retiring”) wells thatwould reduce overall demand on the aquifer.Either course of action has important agricul-tural production and social implications; there-fore, targeted well retirement programs mustbe viewed from the perspective of interregionalequity.
Water savings and efficiency measuresthrough government cost-share programs (e.g.,Uso Eficiente del Agua y la Energıa Electrica [Ef-ficient Water and Electrical Energy Use]) havebeen implemented in Mexico; however, the wa-ter saved is very often used to extend the areairrigated with little change in the amount of wa-ter extracted from the aquifer. The appropriatepolicy response would be to pursue efficiencywith conservation of the water saved, for exam-ple, through caps on planted area.
In Mexico, regulatory approaches to ground-water management have been in place—andhave been largely unsuccessful in address-ing groundwater depletion—for more thanfifty years (Wester, Hoogesteger, and Vincent2009). The current well concessioning andlicensing drive is important; now that thisprocess has largely been completed, users andregulators (whether government agencies orfarmers’ self-regulatory bodies) have the in-formation required to formulate regionalizedplans to address aquifer overdraft that ac-count for, among other variables, agriculturalgroundwater, surface water, and population inagriculture. �
Literature Cited
Anselin, L. 1988. Spatial econometrics: Methods andmodels. Dordrecht, The Netherlands: Kluwer.
———. 1995. Local indicator of spatial association—LISA. Geographical Analysis 27:93–115.
———. 1999. Interactive techniques and exploratoryspatial data analysis. In Geographic information sys-tem: Principles, techniques, management and applica-tions, ed. P. A. Longley, M. F. Goodchild, D. J.Maguire, and D. W. Rhind, 207–17. New York:Wiley.
Blomquist, W. 1992. Dividing the waters: Governinggroundwater in Southern California. San Francisco:ICS Press.
Boserup, E. 1965. The conditions of agricultural growth:The economics of agrarian change under populationpressure. London: Allen & Unwin.
Comision Nacional del Agua (CONAGUA). 2008.Estadısticas del agua en Mexico [Water statistics inMexico]. Mexico City: CONAGUA.
Gale, I., ed. 2005. Strategies for managed aquiferrecharge (MAR) in semi-arid areas. Paris: UnitedNations Educational, Scientific and CulturalOrganization.
Garduno, H. 2005. Lessons from implementing wa-ter rights in Mexico. In Water rights reform: Lessonsfor institutional design, ed. B. R. Bruns, C. Ringler,and R. Meinzen-Dick, 85–112. Washington, DC:International Food Policy Research Institute.
GeoDa, Version 0.9.5-i (Beta). Urbana and Cham-paign: Luc Anselin and the Regents of the Univer-sity of Illinois.
Giordano, M., and K. G. Villholth, eds. 2007.The agricultural groundwater revolution: Opportuni-ties and threats to development. Wallingford, CT:CAB International.
Haining, R. 1990. Spatial data analysis in the social andenvironmental sciences. Cambridge, UK: CambridgeUniversity Press.
Kettle, N., L. Harrington, and J. Harrington Jr. 2007.Groundwater depletion and agricultural land usein the high plains: A case study from WichitaCounty, Kansas. The Professional Geographer 59 (2):221–35.
Llamas, R., and E. Custodio, eds. 2003. Intensive useof groundwater: Challenges and opportunities. Lisse,The Netherlands: Swets & Zeitlinger.
Loaiciga, H. A. 2003. Climate change and groundwater. Annals of the Association of American Geogra-phers 93 (1): 30–41.
Maranon-Pimentel, B., and P. Wester. 2000. Respues-tas institucionales para el manejo de los acuıferos en lacuenca Lerma-Chapala, Mexico [Groundwater man-agement institution responses in the Lerma-ChapalaBasin, Mexico]. Serie Latinoamericana No. 17.Mexico City: Instituto Internacional del Manejodel Agua.
Downloaded By: [Scott, Christopher A.] At: 16:23 7 January 2010

Groundwater Rights in Mexican Agriculture 15
Moreno Vasquez, J. L. 2006. Por abajo del agua; So-breexplotacion y agotamiento del acuıfero de la Costa deHermosillo, 1945–2005 [Below water: Overexploita-tion and depletion of the Hermosillo coast acquifer,1945–2005]. Hermosillo, Mexico: El Colegio deSonora.
Ojeda-Bustamante, W., J. M. Gonzalez-Camacho,E. Sifuentes-Ibarra, E. Isidro, and L. Rendon-Pimentel. 2007. Using spatial information systemsto improve water management in Mexico. Agricul-tural Water Management 89:81–88.
Palerm Viqueira, J., and T. Martınez Saldana. 2000.Antologıa sobre pequeno riego, Vol. II organizacionesautogestivas [Small-scale irrigation anthology: Vol. IIself-managing organizations]. Montecillo, Mexico:Editores Plaza y Valdes, y El Colegio de Postgrad-uados.
Rap, E., P. Wester, and L. N. Perez-Prado. 2003.The politics of creating commitment: Irrigationreforms and the reconstitution of the hydraulic bu-reaucracy in Mexico. In The politics of irrigation re-form, ed. P. P. Mollinga and A. Bolding, 57–95.London: Ashgate.
Registro Publico de Derechos de Agua(REPDA). 2008. Public Registry of WaterRights. http://www.conagua.gob.mx/conagua/REPDA/consultarepda.aspx?id=Consulta+a+la+base+de+datos+del+REPDA%7cRegistro+P%u00fablico+de+Derechos+de+Agua+(REPDA)%7c0%7c104%7c0%7c0%7c0 (last accessed 15November 2008).
Sandoval-Minero, R. 2001. Capacity building for aparticipatory and decentralized water managementmodel: The Guanajuato state water plan. In Inte-grated water resources management, ed. M. A. Marinoand S. P. Simonovic, 133–38. Wallingford, CT: In-ternational Association of Hydrological Sciences.
Scott, C. A., and T. Shah. 2004. Groundwater over-draft reduction through agricultural energy pol-icy: Insights from India and Mexico. InternationalJournal of Water Resources Development 20 (2):149–64.
Scott, C. A., T. Shah, S. J. Buechler, and P. Silva-Ochoa. 2004. La fijacion de precios y el suministrode energıa para el manejo de la demanda de aguasubterranea: Ensenanzas de la agricultura mexicana[Energy pricing and supply for groundwater de-mand management: Lessons from Mexican agri-culture]. In Hacia una gestion integral del agua enMexico: Retos y alternativas [Towards integrated watermanagement in Mexico: Challenges and alternatives],ed. C. Tortajada, V. Guerrero, and R. Sandoval,201–28. Mexico City: Miguel Angel Porrua.
Scott, C. A., and P. Silva-Ochoa. 2001. Collectiveaction for water harvesting irrigation in the Lerma-Chapala basin, Mexico. Water Policy 3:555–72.
Shah, T. 2009. Taming the anarchy: Groundwater gov-ernance in South Asia. Washington, DC: Resourcesfor the Future Press.
Shah, T., A. Debroy, A. S. Qureshi, and J. Wang.2003. Sustaining Asia’s groundwater boom: Anoverview of issues and evidence. Natural ResourcesForum 27:130–41.
Silva-Ochoa, P., ed. 2000. Unidades de riego: La otramitad del sector agrıcola bajo riego en Mexico [Irrigationunits: The other half of the irrigated agriculture sectorin Mexico]. Serie Latinoamericana No. 19. MexicoCity: Instituto Internacional del Manejo del Agua.
Vazquez Rodrıguez, M. L. 1999. Decretos de vedaen el estado de Guanajuato [Groundwater bansin the state of Guanajuato]. Aqua Forum 4 (15):20–21.
Wester, P. 2008. Shedding the waters. Wageningen,The Netherlands: Wageningen University.
Wester, P., J. Hoogesteger, and L. Vincent. 2009.Local IWRM organizations for groundwaterregulation: The experiences of the Aquifer Man-agement Councils (COTAS) in Guanajuato, Mex-ico. Natural Resources Forum 33 (1): 29–38.
White, S. E. 1994. Ogallala oases: Water use, pop-ulation redistribution, and policy implications inthe high plains of western Kansas, 1980–1990. An-nals of the Association of American Geographers 84 (1):29–45.
Wilder, M., and P. Romero-Lankao. 2006. Paradoxesof decentralization: Water reform and social im-plications in Mexico. World Development 34 (11):1977–95.
CHRISTOPHER A. SCOTT is an Assistant Pro-fessor in the School of Geography and Devel-opment and Assistant Research Professor at theUdall Center for Studies in Public Policy at theUniversity of Arizona, Tucson, AZ 85721. E-mail:[email protected]. His research interests in-clude water management and policy, climate andwater variability, urban water demand, water reuse,the energy–water nexus, and groundwater in theSouthwest United States, Mexico, and South Asia.
SANDY DALL’ERBA is an Assistant Professor inthe School of Geography and Development at theUniversity of Arizona, Tucson, AZ 85721. E-mail:[email protected]. His research interestsinclude economic growth, economic geography, re-gional and local development, and public policy withspecial emphasis on the European Union.
ROLANDO DIAZ CARAVANTES is a Professor-Investigator at the Universidad Autonoma de CiudadJuarez, Oyameles #3016, Colonia FOVISSSTE, C.P. 31560, Ciudad Cuauhtemoc, Chihuahua, Mexico.E-mail: [email protected]. His research interestsinclude human–environment interactions, watermanagement and policy, and spatial analysis with em-phasis on Mexico.
Downloaded By: [Scott, Christopher A.] At: 16:23 7 January 2010


