
The private benefit of public funding: The FIFA World Cup… … · · 2014-04-24The private...
22
The private benefit of public funding: The FIFA World Cup, UEFA European Championship and attendance at host country league football Bastien Drut and Stefan Szymanski 1 April 2014 Abstract: This paper examines the evolution of attendance at league football matches before and after hosting one of the two major international football championships, the FIFA World Cup and the UEFA European Championships. We use data from 10 championships and eleven years of attendance data at league football clubs (5 years before the event, the season in which the event was held, and 5 years after). We identify those clubs which play in stadiums that were used for the championship and estimate the impact on average annual attendance for each club. Our main finding is that clubs in host countries enjoy a substantial boost in league attendance in years following a major championship. We estimate that attendance increases by around 15-25% in the top two divisions of the domestic league, compared to the season prior to the event. The economic value of this benefit depends on the ticket prices charged which vary significantly by host country, but even in the most optimistic cases we do not find the value large enough to cover the costs of hosting that have been reported for recent tournaments. 1 Corresponding address: Department of Kinesiology, University of Michigan, 3118 Observatory Lodge 1402 Washington Heights, Ann Arbor, MI 48109-2013.Tel: (734) 647-0950, Fax: (734) 647-2808, email [email protected]. 1
Transcript of The private benefit of public funding: The FIFA World Cup… … · · 2014-04-24The private...

The private benefit of public funding: The FIFA World Cup, UEFA European Championship and attendance at host country league football
Bastien Drut and Stefan Szymanski1
April 2014
Abstract: This paper examines the evolution of attendance at league football matches before and after hosting one of the two major international football championships, the FIFA World Cup and the UEFA European Championships. We use data from 10 championships and eleven years of attendance data at league football clubs (5 years before the event, the season in which the event was held, and 5 years after). We identify those clubs which play in stadiums that were used for the championship and estimate the impact on average annual attendance for each club. Our main finding is that clubs in host countries enjoy a substantial boost in league attendance in years following a major championship. We estimate that attendance increases by around 15-25% in the top two divisions of the domestic league, compared to the season prior to the event. The economic value of this benefit depends on the ticket prices charged which vary significantly by host country, but even in the most optimistic cases we do not find the value large enough to cover the costs of hosting that have been reported for recent tournaments.
1 Corresponding address: Department of Kinesiology, University of Michigan, 3118 Observatory Lodge 1402 Washington Heights, Ann Arbor, MI 48109-2013.Tel: (734) 647-0950, Fax: (734) 647-2808, email [email protected].
1

1. Introduction
Mega sporting events – notably the Olympic games (summer and winter) and the FIFA World Cup are extensively subsidized by governments. The subsidy is justified on the grounds that while private benefits do not exceed the costs, public benefits are substantial. Much research has been devoted to estimating these public benefits. However, little attention is focused on the private benefits.
This paper examines the private benefits to football clubs in nations that host either the FIFA World Cup or the UEFA European Championships. These private benefits fall into two categories. Firstly, the owners of the venues for these events are often the clubs themselves. Sometimes a new stadium is constructed and sometimes existing facilities are renovated, improved and/or expanded. Transport infrastructure around the stadium is usually enhanced. These benefits may be paid for entirely or significantly subsidized by the public authorities, be it the central government or local authorities. Second, even clubs that do not host tournament matches may benefit from the enhanced reputation of the game after the event, and the feelgood factor that is usually associated with hosting a mega sports event.
This paper uses data from ten international football championships- six World Cups (1966, 1974, 1990, 1998, 2002 and 2006) and four European Championships (1988, 1996, 2000 and 2008) – to examine the impact on attendance at domestic league games on a club by club basis. We also examine individual club revenue data for the two championships held in England (the 1966 World Cup and 1996 European Championships).
We find that club attendance increases significantly in the years following a major championship. For clubs whose stadium is used to host tournament games, the average increase in attendance is 17-21% in the five seasons following the event compared to the season before the event. For teams playing the top national league division that did not host tournament games the increase is almost as large, ranging from 8-20% in the each of the following five seasons.
Competitive club football is played at different levels (divisions) which are connected via promotion and relegation (the worst performing teams at the end of the season are relegated to the next level down, to be replaced by the best performing teams from the lower level). We find that hosting mega events increases attendance at the second tier down, but not by as much as in the first tier- the impact ranging from 9-17% over the five years following the event. We also have data for the third and fourth tiers in England, and find no impact attributable to hosting the mega event. We do find significant effects on revenues for English clubs following the 1966 FIFA World Cup and 1996 UEFA European Championship.
2

The next section briefly discusses the literature on the benefits of mega sporting events. The following section describes the data and summarises our results. The final section concludes.
2. The Benefits of hosting mega sporting events
Hosting major sporting events such as the World Cup or the European Championships are often portrayed by governments as generating large economic benefits. The types of economic benefits fall under a number of categories
Private benefits directly associated with attending the event:
• ticket sales • broadcast rights • sponsorship income • merchandising
Private benefits indirectly associated with attending the event:
• transport revenues • accommodation • sales of food and beverage • ancillary tourism revenues
Private benefits associated with preparing for the event:
• employment in construction and related industries
Private benefits accruing after the event:
• the use value of new facilities and infrastructure (legacy)
Public benefits:
• the Keynesian stimulus to the economy involved with investment and tourism • greater efficiency due to infrastructure improvements • increased skill-base of the economy • improved image of the nation leading to increased trade and investment • stimulus to development of depressed regions
3

There are non-pecuniary benefits as well (e.g. feelgood factors), but the public discourse has historically tended to emphasise the pecuniary benefits. Hosting of these events typically involves a large public subsidy, and a government guarantee to meet all cost overruns. The basis for this subsidy is the argument that the public benefits exceed the private benefits, and that the private benefits are not large enough to ensure private sector provision, at least to the standards set by international sports organisations that award the events to host nations (in our case, FIFA and UEFA).
There is now a large literature in economics challenging the view that the public benefits are large. Work in this vein includes Crompton (1995), Porter (1999), Szymanski (2002), Baade and Matheson (2004a, 2004b, 2010), Maennig and Du Plessis (2007), Allmers and Maennig (2009), Preuss, Kurscheidt and Schütte (2009) Feddersen and Maennig (2009, 2013, 2013), Matheson (2009), Preuss (2011). However, there has been very little research in the literature about the private benefits, particularly in relation to sports organisations closely connected to the staging of the events.2 In the case of the Olympics, there are very few sports involved that are able to generate a significant commercial income from regular domestic competition. Football is obviously different. Football is generally the dominant sport in the host nation of the European Championship, and often for the World Cup (Japan, Korea and the USA being recent exceptions).
Domestic leagues often attract large numbers of fans and in recent decades revenue sources, especially from broadcasting, have grown rapidly. It is therefore possible to consider whether hosting a major football championship represents a substantial private benefit for the clubs that play in the domestic league, judging by attendance and, for some cases, revenues. Yet there are few studies that considered this issue. One of the few studies that has examined the effect on football clubs in host nations is Feddersen et al (2006). They examined the effect of new stadiums on attendance in the Bundesliga between 1963 and 2004. As they observe “Apart from a few exceptions (e.g., Bochum, 1979; Leverkusen, 1990; Nuremberg, 1991; Stuttgart, 1993 ), stadium construction activities for soccer clubs in Germany’s Bundesliga can fundamentally be divided into the periods leading up to the two World Cup Championships that have taken place in Germany.” They find that new or renovated stadiums generated an increase in attendance of around 2700 on average, equal to 10.7% over five years. These effects are identified only with stadium construction, so that there is no wider effect identified with increasing popularity of the game due to hosting the major event.
2 Although see Preuss et al (2014) on the cost of maintaining publicly funded stadiums after a major sporting event
4
3. Data and results
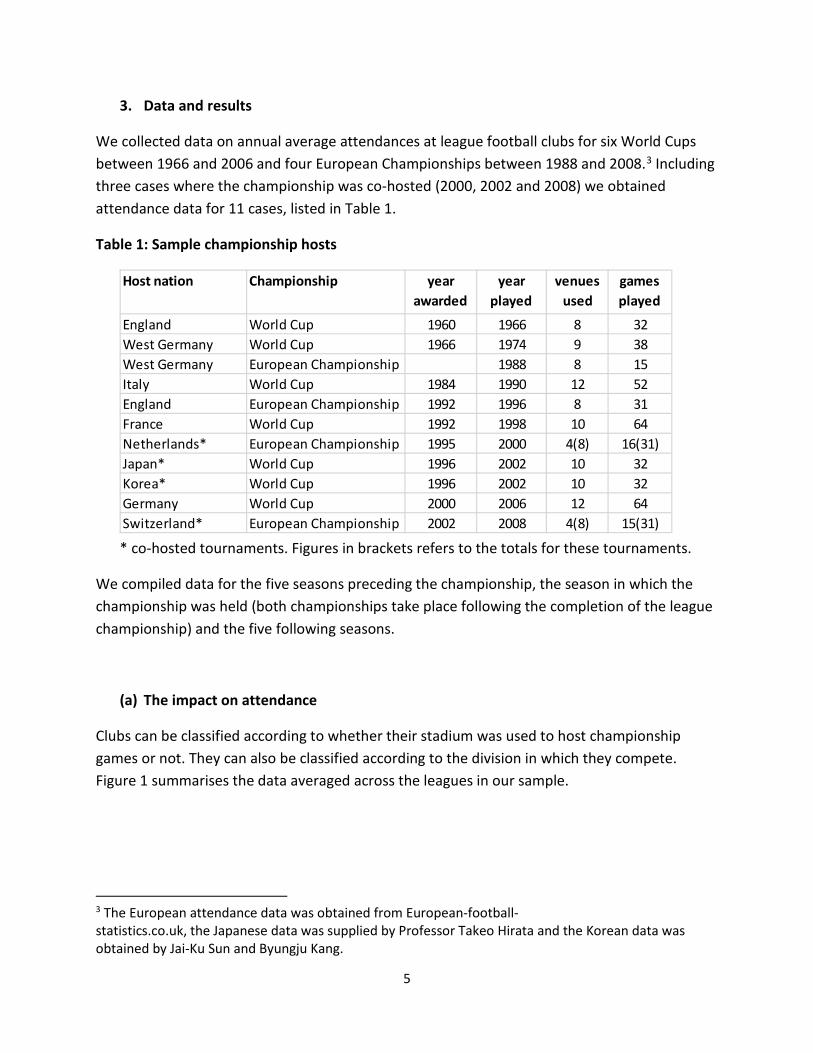
We collected data on annual average attendances at league football clubs for six World Cups between 1966 and 2006 and four European Championships between 1988 and 2008.3 Including three cases where the championship was co-hosted (2000, 2002 and 2008) we obtained attendance data for 11 cases, listed in Table 1.
Table 1: Sample championship hosts
* co-hosted tournaments. Figures in brackets refers to the totals for these tournaments.
We compiled data for the five seasons preceding the championship, the season in which the championship was held (both championships take place following the completion of the league championship) and the five following seasons.
(a) The impact on attendance
Clubs can be classified according to whether their stadium was used to host championship games or not. They can also be classified according to the division in which they compete. Figure 1 summarises the data averaged across the leagues in our sample.
3 The European attendance data was obtained from European-football- statistics.co.uk, the Japanese data was supplied by Professor Takeo Hirata and the Korean data was obtained by Jai-Ku Sun and Byungju Kang.
Host nation Championship year awarded
year played
venues used
games played
England World Cup 1960 1966 8 32West Germany World Cup 1966 1974 9 38West Germany European Championship 1988 8 15Italy World Cup 1984 1990 12 52England European Championship 1992 1996 8 31France World Cup 1992 1998 10 64Netherlands* European Championship 1995 2000 4(8) 16(31)Japan* World Cup 1996 2002 10 32Korea* World Cup 1996 2002 10 32Germany World Cup 2000 2006 12 64Switzerland* European Championship 2002 2008 4(8) 15(31)
5

Figure 1
Figure 1 shows the trend for clubs that host games (which are almost always in the top division of the national league), non-host clubs from the top division and clubs from the second division. While there are fluctuations from year to year, there is no clear trend for the five seasons prior to the tournament in each of the three cases. Then there is a significant increase in the season during which the championship occurs- i.e. in the build-up to the event. There are further increases in each of the two seasons immediately following the championship after which attendance appears to stabilize again. Overall the increase from t-1 to t+2 is of the order 15-25%.
The data here refers clubs in countries that hosted a major event. It might be objected that other nations might also benefit from these events if they tend to raise the popularity of the game internationally. Ideally, we would like a control group that did not host tournaments, but collecting data is problematic since all of the major countries on which we could obtain data hosted a tournament at some point in the period covered by our sample, while data tends to be sparse for smaller countries. We attempted to deal with this by creating benchmarks for each
6
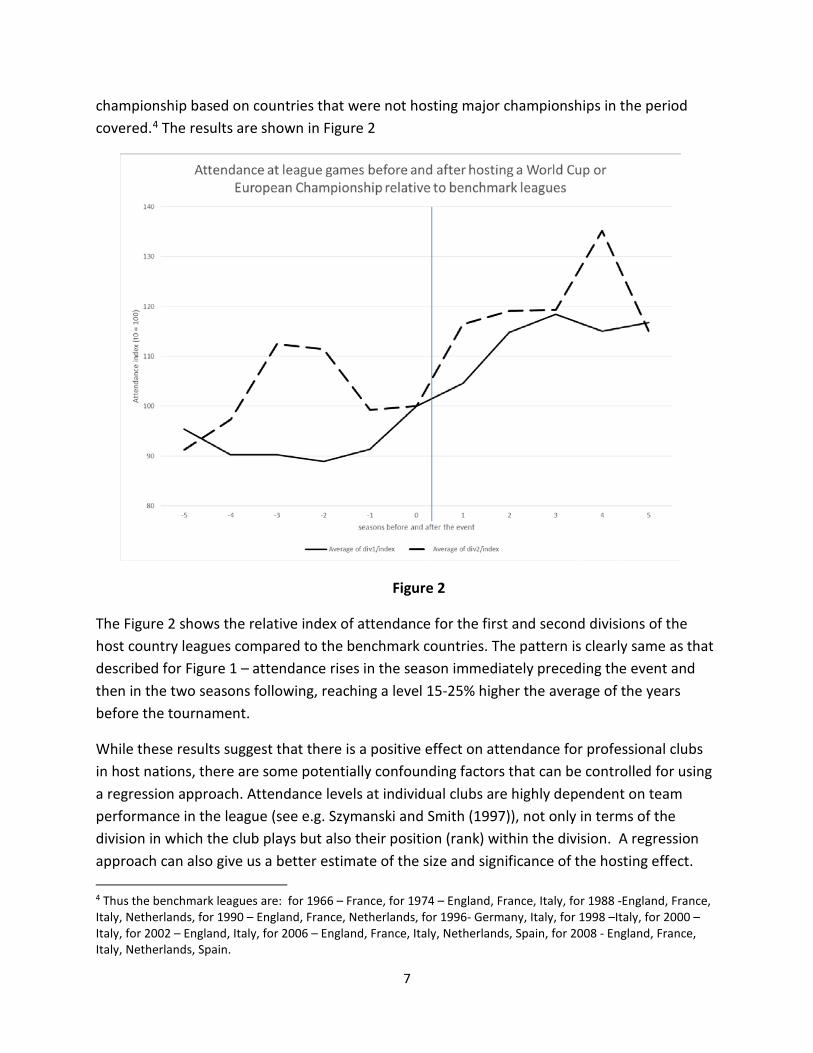
championship based on countries that were not hosting major championships in the period covered.4 The results are shown in Figure 2
Figure 2
The Figure 2 shows the relative index of attendance for the first and second divisions of the host country leagues compared to the benchmark countries. The pattern is clearly same as that described for Figure 1 – attendance rises in the season immediately preceding the event and then in the two seasons following, reaching a level 15-25% higher the average of the years before the tournament.
While these results suggest that there is a positive effect on attendance for professional clubs in host nations, there are some potentially confounding factors that can be controlled for using a regression approach. Attendance levels at individual clubs are highly dependent on team performance in the league (see e.g. Szymanski and Smith (1997)), not only in terms of the division in which the club plays but also their position (rank) within the division. A regression approach can also give us a better estimate of the size and significance of the hosting effect.
4 Thus the benchmark leagues are: for 1966 – France, for 1974 – England, France, Italy, for 1988 -England, France, Italy, Netherlands, for 1990 – England, France, Netherlands, for 1996- Germany, Italy, for 1998 –Italy, for 2000 – Italy, for 2002 – England, Italy, for 2006 – England, France, Italy, Netherlands, Spain, for 2008 - England, France, Italy, Netherlands, Spain.
7

Table 2 reports four versions of the attendance regression. There are 4263 observations in our data covering 296 clubs in eight nations across eleven tournaments. We have data on every top division clubs for every country, accounting for 44% of our observations. We have data on the second tier club attendance for eight tournaments which accounts for 30% of our observations. The remaining observations relate to the third and fourth tier of England, which hosted two tournaments in our dataset. 5
We estimate a very simple model. Average annual attendance at each club is regressed on league position at the end of the season (running from 1 to a maximum of 24), a dummy the division in which the team played, dummies for whether the club was a tournament host, and then various dummies allowing for the before and after effects of hosting. Given that average attendance varies significantly between divisions, we allow that the positional effect also varies in size depending on the division.
The first two columns of Table 2 incorporate dummies which treat the before and after effects as if they were equal for all clubs. The first column includes club fixed effects and the second column includes fixed effect for the tournament hosted.
The model shows that each additional position in the highest league division accrues an extra 384 to 695 fans per game. For example, this would imply that the difference between being bottom of the English Premier League (20th) and winning the championship (1st) is worth between 7,296 and 13,205 fans per game. In the second tier, the effect is slightly smaller. Assuming a twenty team second division the difference between first and last place would range between 7,296 and 4,412 per game.
In addition to the effect of league position, the divisional dummies are all highly significant and indicate that attendance drops as clubs move to successively lower divisions.
Clubs whose stadium is used to host games in the mega event tend to enjoy significantly higher average attendance, independently of the club’s league performance. This is a selection effect – not surprisingly the larger stadiums in any country are used to host major events. Note also that in the club fixed effects model, a dummy for whether the competition is the World Cup (i.e. not the European Championship) is also large and significant, suggesting that the European Championship tends to select smaller host stadiums. This seems natural since this the European Championship is also more likely to be hosted by nations with smaller national leagues.
5 In most countries, the third and fourth tiers are semi-professional, attract very low levels of attendance and data is not easy to obtain.
8

Table 2: Regression results- dependent variable is average annual attendance at league games
Club Tournament Club Tournament VARIABLES fixed effects
(1) fixed effects
(1) fixed effects
(2) fixed effects
(2) League position division 1 -384.2*** -695.6*** -391.4*** -699.4*** (24.92) (29.05) (24.33) (28.76) League position division 2 -218.8*** -384.0*** -228.5*** -387.3*** (23.33) (30.41) (22.76) (30.08) League position division 3 -161.5*** -214.0*** -166.3*** -216.4*** (26.93) (37.43) (26.27) (37.00) League position division 4 -150.1*** -176.8*** -144.5*** -173.6*** (30.41) (42.84) (29.65) (42.35) Second division -9,262*** -14,353*** -8,342*** -13,341*** (435.8) (479.2) (465.1) (548.0) Third division -13,800*** -23,630*** -12,288*** -21,836*** (576.1) (643.5) (595.7) (702.9) Fourth division -15,221*** -26,289*** -13,776*** -24,528*** (646.6) (718.8) (657.2) (767.4) Tournament Stadium 5,227*** 9,829*** 4,126*** 8,669*** (613.1) (293.3) (632.5) (416.4) World Cup 3,600*** 3,591*** (190.3) (185.4) S – 4 -364.4 -489.2 -343.7 -468.4 (319.6) (470.9) (311.4) (465.3) S – 3 264.0 99.51 280.6 115.4 (318.5) (469.2) (310.4) (463.7) S – 2 241.2 295.5 256.3 303.8 (315.7) (464.8) (307.6) (459.4) S – 1 325.3 374.1 337.7 380.2 (314.2) (462.6) (306.1) (457.1) Season of Tournament 966.1*** 1,015** -20.40 -70.10 (314.4) (462.8) (506.3) (753.8) S + 1 1,940*** 1,992*** -130.9 -317.1 (314.2) (462.5) (502.9) (748.3) S + 2 2,571*** 2,652*** 133.9 -41.14 (314.2) (462.6) (503.7) (748.3) S + 3 2,893*** 3,015*** 490.4 487.1 (314.2) (462.6) (498.5) (740.8) S + 4 2,845*** 2,938*** 290.8 194.6 (315.6) (464.6) (507.8) (753.6) S + 5 2,611*** 2,713*** 136.3 -2.448 (316.3) (465.4) (515.3) (764.5)
9

Table 2 (continued): Regression results- dependent variable is average annual attendance at league games
Club Tournament Club Tournament VARIABLES fixed effects (1) fixed effects
(1) fixed effects
(2) fixed effects
(2) Host S0 883.5 824.5 (661.4) (984.9) Host S+1 3,099*** 2,637*** (646.2) (962.0) Host S+2 2,730*** 2,645*** (645.1) (961.2) Host S+3 2,792*** 2,653*** (649.2) (966.7) Host S+4 1,743*** 1,689* (650.6) (966.9) Host S+5 1,998*** 2,041** (639.4) (950.7) Division 1 S0 1,313** 1,343 (651.6) (966.6) Division 1 S+1 2,233*** 2,739*** (640.5) (948.4) Division 1 S+2 3,061*** 3,364*** (643.8) (952.6) Division 1 S+3 3,444*** 3,747*** (642.7) (949.7) Division 1 S+4 3,935*** 4,346*** (649.8) (957.9) Division 1 S+5 3,876*** 4,440*** (646.2) (952.2) Division 2 S0 764.5 1,062 (638.3) (941.7) Division 2 S+1 1,499** 1,843** (638.4) (937.8) Division 2 S+2 1,769*** 2,205** (638.5) (936.7) Division 2 S+3 1,104* 1,150 (637.3) (934.6) Division 2 S+4 1,556** 1,607* (645.7) (945.1) Division 2 S+5 1,141* 1,054 (654.3) (958.4) Constant 19,401*** 26,623*** 19,027*** 26,123*** (436.2) (480.4) (442.0) (506.8) Observations 4,263 4,263 4,263 4,263 R-squared 0.343 0.687 0.379 0.696 Number of club fixed effects 296 296 Number of tournament fixed effects 10 10
10

The season dummies show a clear change before and after the mega event. The reference year is six full seasons before the event takes place, around the time when the host nation is usually announced (see Table 1). All dummies up until and include S-1, are statistically insignificant. In the season in which the tournament takes place (S0, recalling that the league competition is played before the mega event takes place) there is a significant increase in average attendance of around 1000 fans per game. In the season immediately following the event average attendance rises by around a further 1000, and then on average in the following three seasons it is around 700 higher per game.
Although the estimates of the effect of league position and divisional dummies are quite different in size depending on whether we use tournament of club fixed effects, the estimated impacts of hosting are very close to each other.
In columns 3 and 4, we identify separate effects for host clubs, clubs in the top division and clubs in the second division. None of the post tournament dummies from the first two columns are significant now – suggesting that the third and fourth division teams derived no benefit in terms of increased attendance from hosting mega events. The effects for the three groups we isolate - hosts, first division and second division teams- are generally large and significant. The effect in the season in which the tournament is staged (S0) which we might call the “anticipation effect”, is now barely significant, although the estimated coefficient is similar in size for the three groups to the coefficients in columns 1 and 2. For host clubs, the peak effect appears in the year immediately following the tournament and is worth about 2600-3100 fans per game. The effect declines to around 2000 per game five seasons after the event, but this is still a substantial effect.
Division one teams see an increase of 1300 fans per game in the season the tournament takes place, but this estimate is only significant in one version. In the season following attendance increases by around 2200-2700 per game and continues to grow, reaching around 3900-4400 per game after five years.
Division two teams seem more modest increases. The anticipation effect is not significant, and the increase in the season following is around 1500-1800 per game. Two seasons after the event the effect peaks at around 1800-2200 per game, declining thereafter and of borderline significance five seasons after the event.
11

(b) The economic size of benefit
These results suggest that the effect of hosting is largest for the biggest clubs playing at the highest level of competition, and in particular for those clubs which host games. We can provide some idea of the economic size of this effect based on current ticket prices in England (generally deemed very expensive), Germany (generally deemed relatively cheap) and Brazil. According to figures from Deloitte the average match day income per fan in Germany in 2011 was €31.48 and in England was €45.53, while a newspaper report in 20126 stated that average ticket prices in Brazil are R$24 on average (=€7.77 at April 2014 exchange rates).
Table 3: the total estimated benefit to clubs in the five seasons following hosting a mega event €m
host clubs non host top
division
second division
Total
English prices 261.5 154.5 100.2 516.1 German prices 194.1 57.4 46.5 297.9 Brazilian prices 81.0 31.9 21.5 134.4
Assuming (i) the number of host clubs equal to the number used in the most recent tournament hosted (ii) the number of team in each division the same as currently in their domestic leagues; Brazilian figures based on the assumption that the top two national divisions are the ones affected, while the total number of home games is assumed to 29, allowing 10 games on average in the regional championship.
The figures in Table 3 suggest that the private benefit can be substantial but is highly dependent on average ticket prices. The highest total impact is for England, with a potential benefit of €516 million and the smallest is for Brazil with only €134m. Feddersen et al. (2009) state that €1.6 billion was spent on stadium refurbishment for the World Cup in Germany in 2006, more than five times the size of the estimated benefit. In the case of Brazil, it was reported at the end of 2013 that stadium costs amounted to $3.5 billion7 (€2.5 billion) – almost twenty times the size of the estimated benefit.
However, there is reason to believe that the figures in Table 3 may understate the benefits. First, although the figures have not been discounted, they only cover five seasons, while in the case of refurbished or newly built stadiums it may be argued that the benefits may persist for
6 http://blogs.independent.co.uk/2012/10/25/prices-soaring-and-attendances-plummeting-the-great-soap-opera-of-brazilian-football/ 7 http://www.goal.com/en-za/news/4633/soccerex/2013/11/28/4439338/price-tag-rises-for-brazils-world-cup-stadiums
12

much longer. Second, the figures do not allow for any price increases, but according to Deloitte figures, matchday income per fan increased by 45% comparing two seasons before the 2006 World Cup in Germany and five seasons after. Third, we have not included potential revenues from games other than league games- domestic and international cup games. Fourth, these benefits relate only to tickets sold- it may be that new or refurbished stadiums can generate income from other activities (e.g .concerts). Fifth, more attractive stadiums and the exposure effect of major football championships may also increase the attractiveness of league football on TV, so that income from these sources may also grow.
It is also worth noting that our estimates suggest that only about half of the benefits accrue to clubs that host games- the benefits seem to be spread fairly widely.
(c) Attendance and revenues in England: World Cup 66 and Euro96
While revenue data for football clubs is hard to obtain in most countries, they are available for English clubs and hence it is possible to examine the revenue effects on English clubs before and after the 1966 World Cup and the European Championship in 1996 (Euro96). Both Championships are associated with a significant jump in attendance at clubs in the top two divisions following the event.
Figure 3 groups teams by the top two and bottom two divisions. Comparing two full seasons before and two full seasons after, attendance rose by 15% around the World Cup in 1966 and 24% around Euro96. Prior to the 66 World Cup attendances were flat, while it is evident that in 1996 there was already an upward trend in attendance prior to the event. These two events are drawn from different eras. Between 1949 and 1985 there was a secular decline in attendance at English football, usually associated with poor quality facilities and hooliganism. From the mid-1980s attendances started to rise and from the early 1990s there was significant in stadium improvement (see e.g. Szymanski (2011)) and a general increase in the popularity of the game.8 However, it is also evident from figure 3 that there was little or no change in attendance at the lowest two tiers of professional football in England (what used to be called the Third and Fourth Divisions, but are now called Football League One and Football League Two9).
Revenue data for English football can be obtained from the company accounts of each club. In England almost all professional clubs are limited liability companies and under English law limited liability companies must file their annual accounts at Companies House which then makes these accounts available for public inspection. The principal business of the limited
8 Government mandated stadium improvements were a consequence of the independent inquiry into the Hillsborough stadium disaster of 1989 in which 96 fans were crushed to death. 9 The top two divisions are currently known as the Premier League and the Football League Championship
13

liability company that owns the football club is running the football club, and there are very few cases where the company operates a subsidiary engaged in an unrelated business of any size.
Figure 3
Tables 4 and 5 report regression results analogous to Table 2 for the 1966 World Cup and 1996 European Championships respectively. In each season there is a total of 92 teams in the four divisions, and the attendance covers almost the entire population, as does the revenue data for Euro96, but there is data for only seventy clubs (76%) around the 1966 World Cup. The first three columns of each table reports an attendance equation analogous to Table 2, while the last three columns report a revenue equation. For each variable we consider three alternatives – an OLS model, a model with club fixed effects that does not allow for variations among host clubs and divisional status after the event, and a club fixed effects model which allows for different impacts on host clubs, top division clubs and second division clubs.
Considering first the attendance results, the effects of league position and the divisional effects are highly significant and similar for both tournaments. Clubs in lower divisions have significantly lower attendance, and lower league positions are also associated with lower attendance. Stadiums chosen to host games in the tournament are significantly larger after controlling for the division and position effects. From Table 4 it appears that when we make no distinction between divisions there was no significant impact following the 1966 World Cup, but
14

when we account for the top two divisions separately (column (3)) then there is large impact associated with the top division- between about 2,800 in the season immediately following (1966/67) and 3,900 four seasons after the event. The effect is smaller for the second division, but still significant in the four seasons after the event. From Table 5, we can see that there is a significant impact on attendance associated with Euro96 even without controlling for the different impact on the divisions. However, when we control for the top two divisions (column (3)) the estimated effect for the league as a whole is quite small. By contrast, there are large estimated effects for the top division (between around 3,900 and 7,500) and for the second tier (between about 1,500 and 3,100). It is noticeable that the attendance effects for host stadiums are not statistically significant for either the 1966 World Cup or Euro96 (in contrast with the results of Table 2).
The revenue regressions are reported in columns (4)-(6) of Tables 4 and 5. Note that in the 30 year period football club revenue grew quite significantly. Thus average football club revenue in 1966 across the four divisions was £113,361 and by 1996 had risen to £6,624,261, a compound annual growth rate of 14.5%. By comparison the UK Retail Price Index (RPI) grew at an annual rate of 7.9% over the period. For the regression analysis the revenue figures are deflated to constant £1961 for the World Cup 1966 period and to constant £1991 for the Euro96 period, in both cases using the RPI.
The tables show that there is a financial cost associated with lower league position and participation in a lower division which reflects the lower attendance estimates of columns (1) - (3), although this is no doubt further compounded by lower ticket prices and fewer opportunities to generate commercial income. In the later period the impact of position in the lower two divisions is not statistically significant- this probably reflects the growing polarization of football – in 1966 the ratio of average revenue in the top division compared to the fourth tier was 3.9:1, by 1996 it had risen to 13.2:1.
While the impact of the 1966 World Cup on attendance seemed to relate exclusively to the top two divisions, the revenue effects are significant across all four divisions – see e.g. column (4) of Table 4. While revenues had already been increasing in the three seasons prior to the World Cup, they double in the year following the event, and only rise by a small amount in the following four seasons. A very similar pattern emerges in column (4) of Table 5 – so the experience of both tournaments in revenue terms seems quite similar. In both cases the top division also enjoyed a significantly larger revenue boost and in both cases the revenue effect of the event is not consistently present for the second tier compared to the third and fourth tiers. One difference between the two periods, however, is that revenue impact of 1966 World Cup is not significantly larger for the host clubs (taking all other factors into account), while in 1996 the revenue effects for host clubs is large and significant.
15

Table 4: Attendance and revenue estimates for English clubs before and after World Cup 66
(1) (2) (3) (4) (5) (6) VARIABLES Attendance
OLS Attendance
Fixed effects Attendance
Fixed effects Revenue
£1961 OLS
Revenue £1961
Fixed effects
Revenue £1961
Fixed effects League position division 1 -837.8*** -387.3*** -394.0*** -5,984*** -2,775*** -2,892*** (45.34) (33.70) (32.95) (434.7) (416.5) (381.3) League position division 2 -499.3*** -348.6*** -360.0*** -1,344*** -582.5 -862.3*** (45.22) (30.52) (29.52) (409.8) (368.6) (331.8) League position division 3 -287.4*** -203.7*** -208.9*** -1,548*** -1,030*** -1,047*** (39.65) (25.43) (24.48) (374.0) (312.1) (279.0) League position division 4 -235.9*** -201.3*** -202.4*** -942.5** -815.6** -784.2** (39.99) (25.57) (24.55) (397.6) (341.0) (304.1) Second division -16,435*** -8,404*** -7,543*** -138,281*** -83,781*** -60,339*** (843.6) (645.3) (673.9) (7,935) (7,856) (7,779) Third division -25,485*** -14,572*** -12,981*** -163,941*** -99,339*** -70,698*** (832.2) (748.5) (770.4) (8,125) (9,394) (9,147) Fourth division -28,729*** -15,945*** -14,425*** -191,577*** -114,219*** -85,160*** (835.9) (794.5) (808.3) (8,153) (9,887) (9,530) Tournament Stadium 6,838*** 47,943*** (598.0) (5,007) S – 4 -285.5 -283.2 -283.3 3,757 4,148 4,000 (661.0) (391.0) (375.4) (6,303) (4,913) (4,377) S – 3 70.86 55.07 51.34 9,512 6,384 6,400 (659.2) (390.0) (374.5) (6,283) (4,904) (4,370) S – 2 -46.86 -62.66 -66.39 12,303** 9,534* 9,332** (659.2) (390.0) (374.5) (6,241) (4,869) (4,338) S – 1 -486.6 -502.4 -506.1 13,473** 10,995** 10,762** (659.2) (390.0) (374.5) (6,280) (4,904) (4,369) Season of Tournament -739.5 -755.3* -511.5 16,847*** 14,011*** 11,961** (659.2) (390.0) (468.3) (6,283) (4,909) (5,500) S + 1 190.9 175.1 -849.1* 33,698*** 29,475*** 12,253** (659.2) (390.0) (470.1) (6,327) (4,959) (5,579) S + 2 803.4 787.6** -775.9* 36,821*** 33,492*** 15,732*** (659.2) (390.0) (469.8) (6,308) (4,951) (5,482) S + 3 385.8 370.0 -816.2* 36,281*** 33,374*** 14,780*** (659.2) (390.0) (470.1) (6,260) (4,913) (5,444) S + 4 538.8 523.0 -970.7** 32,878*** 30,785*** 10,775** (659.2) (390.0) (471.0) (6,248) (4,899) (5,411) S + 5 -182.0 -187.5 -1,194** 40,150*** 36,832*** 16,280*** (661.0) (391.2) (475.1) (6,260) (4,913) (5,406)
16

Table 4 (cont): Attendance and revenue estimates for English clubs before and after World Cup 66
(1) (2) (3) (4) (5) (6) VARIABLES Attendance
OLS Attendance
Fixed effects Attendance
Fixed effects Revenue £1961 OLS
Revenue £1961
Fixed effects
Revenue £1961
Fixed effects Host S0 -1,455 6,926 (1,273) (13,135) Host S+1 -120.6 12,305 (1,264) (13,157) Host S+2 418.2 -14,064 (1,234) (12,753) Host S+3 -45.37 832.7 (1,236) (12,672) Host S+4 -59.06 2,817 (1,241) (12,787) Host S+5 -1,512 15,589 (1,221) (12,349) Division 1 S0 -559.9 5,668 (777.1) (9,348) Division 1 S+1 2,819*** 42,518*** (771.1) (9,589) Division 1 S+2 4,619*** 65,713*** (763.7) (9,633) Division 1 S+3 3,356*** 68,841*** (767.5) (9,337) Division 1 S+4 3,878*** 75,560*** (771.3) (9,381) Division 1 S+5 3,254*** 74,115*** (748.8) (9,053) Division 2 S0 -78.58 238.6 (737.5) (8,494) Division 2 S+1 1,482** 24,231*** (745.7) (8,643) Division 2 S+2 1,790** 15,954* (755.5) (8,726) Division 2 S+3 1,601** 8,165 (760.6) (8,764) Division 2 S+4 2,369*** 7,795 (766.5) (8,810) Division 2 S+5 1,328* 9,883 (771.8) (8,776) Constant 37,433*** 27,760*** 26,817*** 226,956*** 170,462*** 151,199*** (758.2) (634.6) (638.7) (7,387) (7,778) (7,445) Observations 1,009 1,009 1,009 726 726 726 R-squared 0.830 0.477 0.527 0.753 0.359 0.506 Number of fixed effects 92 92 70 70
Standard errors in parentheses *** p<0.01, ** p<0.05, * p<0.1
17

Table 5: Attendance and revenue estimates for English clubs before and after Euro96
(1) (2) (3) (4) (5) (6) VARIABLES Attendance
OLS Attendance
Fixed effects Attendance
Fixed effects Revenue £m1991
OLS
Revenue £m1991
Fixed effects
Revenue £m1991
Fixed effects League position division 1 -704.2*** -209.4*** -186.9*** -1.185*** -0.477*** -0.423*** (53.09) (36.38) (31.83) (0.0852) (0.0851) (0.0618) League position division 2 -349.5*** -176.7*** -192.4*** -0.146** -0.0723 -0.117*** (39.67) (24.77) (21.59) (0.0643) (0.0588) (0.0425) League position division 3 -216.2*** -126.3*** -131.0*** -0.0646 -0.0560 -0.0463 (39.84) (24.58) (21.37) (0.0657) (0.0589) (0.0424) League position division 4 -130.9*** -117.5*** -100.2*** -0.0684 -0.0837 -0.0270 (44.55) (26.53) (23.09) (0.0799) (0.0698) (0.0504) Second division -15,037*** -7,073*** -4,835*** -23.93*** -12.35*** -5.479*** (910.6) (658.7) (630.6) (1.460) (1.527) (1.214) Third division -22,882*** -10,783*** -7,507*** -27.35*** -14.19*** -7.201*** (929.3) (734.7) (680.3) (1.487) (1.712) (1.315) Fourth division -26,453*** -12,226*** -9,064*** -28.26*** -14.80*** -8.091*** (946.8) (787.5) (721.1) (1.571) (1.874) (1.419) Tournament Stadium 8,633*** 4.748*** (642.1) (1.017) S – 4 -239.6 -137.1 -80.96 0.386 0.651 0.668 (674.1) (374.3) (325.1) (1.101) (0.890) (0.641) S – 3 -114.9 -5.173 33.53 1.125 1.394 1.469** (672.2) (373.3) (324.2) (1.105) (0.895) (0.645) S – 2 446.9 554.5 573.8* 1.715 1.737* 1.866*** (670.3) (372.3) (323.4) (1.102) (0.894) (0.643) S – 1 545.2 651.3* 668.7** 2.331** 2.384*** 2.454*** (670.3) (372.4) (323.4) (1.102) (0.895) (0.644) Season of Tournament 1,357** 1,376*** 353.5 2.830** 2.915*** 1.613* (670.5) (372.4) (408.5) (1.101) (0.895) (0.836) S + 1 1,813*** 1,835*** 499.6 4.080*** 4.166*** 1.795** (670.3) (372.2) (408.7) (1.101) (0.894) (0.837) S + 2 2,794*** 2,813*** 650.4 5.892*** 6.105*** 1.870** (670.4) (372.3) (410.5) (1.112) (0.905) (0.859) S + 3 3,183*** 3,200*** 1,136*** 6.568*** 6.794*** 2.000** (670.5) (372.4) (410.1) (1.108) (0.902) (0.842) S + 4 3,198*** 3,198*** 1,060** 7.468*** 7.693*** 2.112** (674.0) (374.5) (416.6) (1.108) (0.902) (0.852) S + 5 3,640*** 3,640*** 1,024** 9.370*** 9.592*** 2.227** (674.0) (374.5) (417.5) (1.115) (0.907) (0.879)
18

Table 5 (continued): Attendance and revenue estimates for English clubs before and after Euro96
(1) (2) (3) (4) (5) (6) VARIABLES Attendance
OLS Attendance
Fixed effects Attendance
Fixed effects Revenue
OLS Revenue
Fixed effects Revenue
Fixed effects Host S0 -2,418** 3.370 (1,099) (2.097) Host S+1 204.5 9.590*** (1,101) (2.101) Host S+2 -570.4 6.583*** (1,041) (2.026) Host S+3 -1,533 6.732*** (1,103) (2.105) Host S+4 -1,531 7.135*** (1,041) (1.989) Host S+5 2,374** 15.79*** (1,006) (1.921) Division 1 S0 4,308*** 3.443** (742.5) (1.448) Division 1 S+1 3,904*** 4.771*** (747.0) (1.458) Division 1 S+2 5,958*** 12.19*** (717.5) (1.484) Division 1 S+3 6,685*** 14.49*** (750.0) (1.467) Division 1 S+4 6,850*** 17.35*** (724.1) (1.418) Division 1 S+5 7,465*** 20.88*** (702.9) (1.394) Division 2 S0 753.8 0.373 (609.0) (1.215) Division 2 S+1 1,517** 1.131 (616.1) (1.232) Division 2 S+2 3,121*** 2.236* (624.0) (1.245) Division 2 S+3 2,415*** 1.632 (618.3) (1.274) Division 2 S+4 2,457*** 1.678 (628.4) (1.272) Division 2 S+5 2,560*** 1.605 (636.2) (1.293) Constant 30,046*** 19,848*** 17,619*** 26.43*** 15.05*** 9.794*** (863.5) (636.2) (581.2) (1.383) (1.468) (1.111) Observations 980 980 980 890 890 890 R-squared 0.823 0.472 0.610 0.614 0.301 0.646 Number of fixed effects 90 90 88 88
Standard errors in parentheses *** p<0.01, ** p<0.05, * p<0.
19

4. Conclusions
This paper has examined the private benefit to football clubs of the host nations of the FIFA World Cup and UEFA European Championship. We find that there are significant benefits measured by attendance in the five seasons immediately following the event, of the order of 15-25%. We find that these effects are largest for clubs that host games in the tournament, but are also significant for other clubs participating in the top two divisions of domestic league competition.
To some extent these results must reflect the benefits of investment in construction of new stadiums and renovation of existing facilities, but the effect on non-host clubs suggests that there is also a significant stimulus to the popularity of professional league football arising from publicity, the feelgood factor, national pride and other non-tangible effects.
Estimating the economic value of this private benefit is hazardous, given the range of assumptions required about revenue sources, prices, and the number of clubs affected, which may all vary significantly by country. We estimate that the benefit to English clubs, which currently set among the highest ticket prices in the world of hosting a World Cup today would be of the order of €500m in total across the five years following the event, while the benefit to Brazilian clubs, which is hosting the World Cup in 2014, will be little more than €100m. While these sums are significant and a substantial private benefit to the football clubs, they are not close to the estimated costs associated with hosting these events, which typically run in the billons of euros.
20

References
Allmers, S. and W. Maennig (2009). “Economic Impacts of the FIFA Soccer World Cups in France 1998, Germany 2006, and Outlook for South Africa 2010”, Eastern Economic Journal, Vol. 35:4, 500-519.
Baade, R.A. and V. Matheson (2004a). “The Quest for the Cup: Assessing the Economic Impact of the World Cup”, Regional Studies, Vol. 38:4, 343-354.
Baade, R.A. and V. Matheson (2004b). “Mega-Sporting Events in Developing Nations: Playing the Way to Prosperity?”, South African Journal of Economics, Vol. 72:5, 1084-1095
Baade, R. A. and V. Matheson (2012). “Financing Professional Sports Facilities”, in Financing Economic Development in the 21st Century, 2nd ed., Zenia Kotval and Sammis White, eds., (New York: M.E.
Crompton, J. (1995). “Economic impact analysis of sports facilities and events: eleven sources of misapplication”, Journal of Sport Management, Vol. 9:1, 14-35.
Feddersen, A., W. Maennig, and M. Borcherding (2006) New Stadia for the World Cup 2006 in Germany: Is the Novelty Effect Big Enough? International Journal of Sport Finance, 3: 174–188.
Feddersen A. , André Leão Grötzinger, and Wolfgang Maennig (2009) Investment in Stadia and Regional Economic Development—Evidence from FIFA World Cup 2006 International Journal of Sport Finance, , 4, 221-239
A. Feddersen, W. Maennig (2012), Sectoral Labour Market Effects of the 2006 FIFA World Cup, in Labour Economics (19), 860–869
A.Feddersen, W. Maennig (2013): Mega-events and sectoral employment: the case of the 1996 Olympic
Games, Contemporary Economic Policy 30 (3), 580-603
Maennig, W. and S. Du Plessis (2007). “World Cup 2010: South African economic perspectives and policy challenges informed by the experience of Germany 2006”, Contemporary Economic Policy, Vol. 25, No. 4, p. 578-590.
Matheson, V. (2009). “Economic Multipliers and Mega-Event Analysis”, International Journal of Sport Finance, Vol. 4:1, 63-70.
Porter, P.K. (1999). “Mega-Sports Events as Municipal Investments: A Critique of Impact Analysis”, in J. Fizel, E. Gustafson, & L. Hadley, eds., Sports Economics: Current Research, (Westport, CT: Praeger Publishers), 61-74.
Preuss, H. (2011). A method for calculating the crowding-out effect in sport mega-event impact studies: The 2010 FIFA World Cup. Development Southern Africa, 28(3), S. 367-385.
Preuss, H. Solberg, H. and Alm, J. (2014) Managing the World Cup – The challenge of utilising the venues, discussion paper
21

Szymanski, S. (2002). "The Economic Impact of the World Cup", World Economics, vol. 3(1), pages 169-177, January.
Szymanski, S. (2011) Written evidence to House of Commons Culture, Media and Sport Committee, downloadable at http://www.publications.parliament.uk/pa/cm201012/cmselect/cmcumeds/792/792we13.htm
22