Prevalence and Characteristics of Autism Spectrum Disorder ...

ARTICLE
The Prevalence of Parent-Reported Autism Spectrum Disorder Among US ChildrenMichael D. Kogan, PhD, a Catherine J. Vladutiu, PhD, MPH, a Laura A. Schieve, PhD, b Reem M. Ghandour, DrPH, a Stephen J. Blumberg, PhD, c Benjamin Zablotsky, PhD, c James M. Perrin, MD, d Paul Shattuck, PhD, e Karen A. Kuhlthau, PhD, d Robin L. Harwood, PhD, a Michael C. Lu, MD, MPHf
OBJECTIVES: To estimate the national prevalence of parent-reported autism spectrum disorder (ASD) diagnosis among US children aged 3 to 17 years as well as their treatment and health care experiences using the 2016 National Survey of Children’s Health (NSCH).METHODS: The 2016 NSCH is a nationally representative survey of 50 212 children focused on the health and well-being of children aged 0 to 17 years. The NSCH collected parent-reported information on whether children ever received an ASD diagnosis by a care provider, current ASD status, health care use, access and challenges, and methods of treatment. We calculated weighted prevalence estimates of ASD, compared health care experiences of children with ASD to other children, and examined factors associated with increased likelihood of medication and behavioral treatment.RESULTS: Parents of an estimated 1.5 million US children aged 3 to 17 years (2.50%) reported that their child had ever received an ASD diagnosis and currently had the condition. Children with parent-reported ASD diagnosis were more likely to have greater health care needs and difficulties accessing health care than children with other emotional or behavioral disorders (attention-deficit/hyperactivity disorder, anxiety, behavioral or conduct problems, depression, developmental delay, Down syndrome, intellectual disability, learning disability, Tourette syndrome) and children without these conditions. Of children with current ASD, 27% were taking medication for ASD-related symptoms, whereas 64% received behavioral treatments in the last 12 months, with variations by sociodemographic characteristics and co-occurring conditions.CONCLUSIONS: The estimated prevalence of US children with a parent-reported ASD diagnosis is now 1 in 40, with rates of ASD-specific treatment usage varying by children’s sociodemographic and co-occurring conditions.
abstract
NIH
aHealth Resources and Services Administration, Maternal and Child Health Bureau, Rockville, Maryland; bNational Center on Birth Defects and Developmental Disabilities and cNational Center for Health Statistics, Centers for Disease Control and Prevention, Hyattsville, Maryland; dDepartment of Pediatrics, Harvard Medical School, Harvard University and MassGeneral Hospital for Children, Boston, Massachusetts; eAJ Drexel Autism Institute, School of Public Health, Drexel University, Philadelphia, Pennsylvania; and fOffice of the Dean, Milken Institute School of Public Health, George Washington University, Washington, District of Columbia
Dr Kogan conceptualized and designed the study and drafted most of the initial manuscript; Dr Vladutiu conducted the data analyses and assisted with drafting of the initial manuscript; Dr Schieve assisted with drafting of the initial manuscript and provided critical review of subsequent manuscript drafts; Drs Ghandour, Blumberg, Zablotsky, Perrin, Shattuck, Kuhlthau, Harwood, and Lu provided critical reviews on all manuscript drafts; and all authors approved the final manuscript as submitted.
PEDIATRICS Volume 142, number 6, December 2018:e20174161
WHAT’S KNOWN ON THIS SUBJECT: Previous studies over the last 20 years have shown an increasing prevalence of autism spectrum disorder (ASD) among US children. Moreover, families of children with ASD have reported greater health care needs and challenges compared with children with other emotional or behavioral conditions.
WHAT THIS STUDY ADDS: In this study, we present new nationally representative data on the prevalence of ASD, reported health care challenges, and estimates on ASD-specific behavioral and medication treatments. The estimated prevalence of US children with parent-reported diagnosis of ASD is now 1 in 40.
To cite: Kogan MD, Vladutiu CJ, Schieve LA, et al. The Prevalence of Parent-Reported Autism Spectrum Disorder Among US Children. Pediatrics. 2018;142(6):e20174161
by guest on March 4, 2020www.aappublications.org/newsDownloaded from

Autism spectrum disorder (ASD) is a complex neurodevelopmental disorder characterized by persistent deficits in social communication and interactions and restricted, repetitive patterns of behaviors or interests.1 The prevalence of diagnosed ASD has increased in the United States and globally within the last 30 to 40 years.2 – 17 Although not fully understood, this increase likely results from multiple factors including broadening diagnostic criteria, increased provider ascertainment at earlier ages, increased parent awareness, and an increase in some risk factors such as births to older parents.18 –20
The challenges of ASD are many and varied. Compared with the general population, children with ASD experience an increased prevalence of co-occurring conditions, such as asthma, eczema, gastrointestinal disturbances, and seizures.21 In addition, 83% of children with ASD have a co-occurrence of ≥1 non-ASD developmental diagnosis.22 Children with ASD have greater health services needs, including therapy, 23 emergency department care, 24 physician visits, and hospitalizations.25 Increased and unpredictable needs for health care visits can also affect parents’ employment, 26 increase financial and time burdens, 27 and disrupt family routines.28 Few national studies have compared the disparities in health services and challenges for families having a child with ASD.27 Although ASD currently has no known cure, the most common treatments to ameliorate the symptoms include behavioral, language, speech, physical, and occupational therapies.29 Pharmacological agents have been Food and Drug Administration–approved to treat irritability associated with ASD symptoms.30 The costs of caring
for a child with ASD in the United States, including health care and non–health care services, was estimated at $17 081 per year beyond the costs of caring for a child without ASD, with total societal costs of caring for children with ASD estimated at $11.5 billion in 2011.31
The 2016 National Survey of Children’s Health (NSCH), a nationally and state-representative survey of 50 212 children, ages 0 to 17 years, offers the opportunity to address certain gaps in our knowledge. This study provides the most recent nationally representative estimate on children with ASD. Although the National Health Interview Survey (NHIS) can provide ASD prevalence estimates, 9 the NSCH has a larger sample, and can explore other aspects of the child’s condition, including ASD-specific treatments, plus an in-depth examination of their health care needs and experiences. The 2016 NSCH also offers the first opportunity to provide national estimates on ASD-specific drug and behavioral treatments.
METHODS
The 2016 NSCH was designed, directed, and funded by the Health Resources and Services Administration’s Maternal and Child Health Bureau. The survey was conducted by the US Census Bureau, which used a national address-based sample for data collection by either Web or mail. The NSCH provides information on the health and well-being of children on the basis of information from their parents or other caregivers (hereafter referred to as “parents”). Questionnaires were available in English or Spanish. The 2016 NSCH used a 2-phased data collection approach: (1) an initial household screener assessed the presence of children, their basic
demographic characteristics, and special health care need status and (2) a substantive, age-specific topical questionnaire completed by parents of one randomly selected child per household. Children with special health care needs had a higher probability of selection compared with other children to increase the sample size among this population.
From June 2016 to February 2017, topical questionnaires were completed. The proportion of households known to include children that completed the topical questionnaire was 69.7%. The overall weighted response rate, which includes nonresponse to the screener to identify whether households include children, was 40.7%. Additional details about the survey methodology are available elsewhere.32 This study was a secondary analysis of publicly available data. The data were collected under Title 13, US Code, Section 8(b). All data products are reviewed for adherence to privacy protection and disclosure avoidance guidelines by the Census Bureau’s Disclosure Review Board.
Analyses for this study were limited to 43 283 children aged 3 to 17 years and excluded children ≤2 years (n = 6929). Parents were asked if a doctor or other health care provider had ever told them that their child had “Autism or Autism Spectrum Disorder, including diagnoses of Asperger’s Disorder or Pervasive Developmental Disorder.” Parents who responded “Yes” were subsequently asked if their child currently has the condition (see Fig 1). For this analysis, children identified as having ASD were those with a parent report of (1) ever told by a doctor and/or other health care provider that their child had ASD and (2) child currently has ASD. In
KOGAN et al2 by guest on March 4, 2020www.aappublications.org/newsDownloaded from

87 cases, the parent reported that the child was ever diagnosed with ASD but did not currently have the condition (7.1%). These cases were not considered as having ASD for this analysis. Children whose parents did not know or refused to answer either of the ASD questions were excluded from analyses (n = 262; 0.6%)
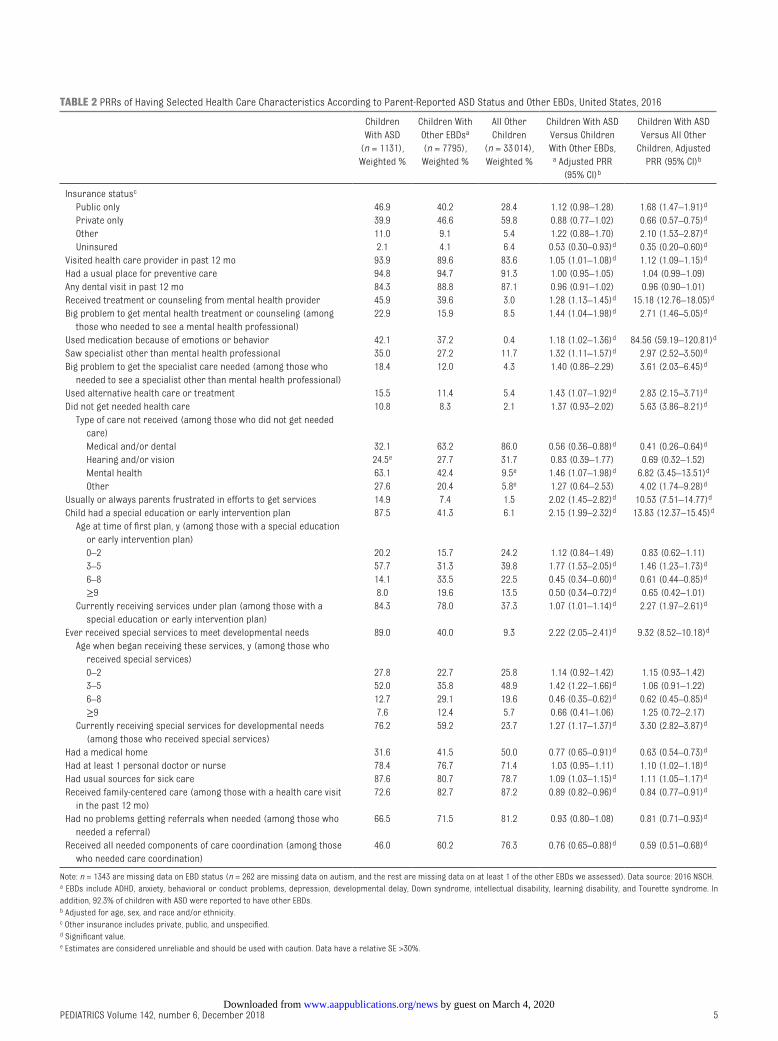
The prevalence of ASD was estimated overall and by selected demographic, socioeconomic, and childbirth characteristics in Table 1. We also provided unadjusted and adjusted prevalence rate ratios (PRRs). In Table 2 we examined (1) health care service use including medical and behavioral treatments for ASD symptoms and receipt of specialist care other than mental health treatment and/or counseling; and (2) parental frustration, access to treatment, and quality of care received including receipt of care in a medical home. We defined medical home using the American Academy of Pediatrics framework, specifically whether33 (1) the child had a personal physician or nurse; (2) the child had a usual place for sick care; (3) the family reported no problems obtaining needed referrals; (4) the family reported receipt of family centered care; and (5) the family reported receipt of effective care coordination, if needed. All 5 criteria
needed to be met for a child to have a medical home.
We additionally explored how the health care experiences of children with ASD and their families differed from children with other diagnosed emotional, behavioral, and developmental conditions (EBDs) (attention-deficit/hyperactivity disorder [ADHD], anxiety, behavioral and/or conduct problems, depression, developmental delay, Down syndrome, intellectual disability, learning disability, Tourette syndrome), and those without ASD or other EBDs. EBDs were identified analogously to ASD: affirmative responses to both questions of whether the parent was “ever told child had condition” and whether “child currently has the condition.” Health care experiences included services used, difficulties accessing needed care, and current receipt of services under a special education or early intervention plan. We estimated weighted percentages, PRRs, and 95% confidence intervals (CIs) comparing children with ASD to children with other EBDs but not ASD, and all other children without EBDs or ASD. The PRRs were adjusted for child age, sex, and race and/or ethnicity.
Finally, we examined factors associated with the likelihood
of receiving medication and/or behavioral treatment of ASD-related symptoms among children with ASD and health insurance using multivariable logistic regression. Covariates included sociodemographic characteristics, years since diagnosis (calculated by subtracting age at diagnosis from child’s current age), provider type for ASD diagnosis, and presence of co-occurring conditions. (Supplemental Table 4 provides prevalence estimates of co-occurring conditions.) Additionally, the medication model included behavioral treatment, whereas the behavioral treatment model included medication. Adjusted PRRs and 95% CIs are reported.
Missing data for child sex, race, and ethnicity were imputed by using hot deck methods during the weighting process, whereas the household income-to-poverty ratio was imputed by using regression methods. All estimates were weighted by using survey sampling weights available from the Census Bureau to produce estimates that are representative of the US noninstitutionalized child population aged 3 to 17 years. These weights reflect the inverse of the probability that the address was selected for the survey and were adjusted to account for the higher likelihood that children with special health care needs would be selected for the topical interview, as well as nonresponse. Weighted analyses were conducted by using SAS 9.4 (SAS Institute, Inc, Cary, NC) and SAS-callable SUDAAN 11.0 (RTI International, Research Triangle Park, NC).
RESULTS
From these nationally representative data, we estimated the point-prevalence of parent-reported ASD diagnosis in 2016
PEDIATRICS Volume 142, number 6, December 2018 3
FIGURE 1Flow diagram of survey-participant progress through the autism and ASD questions, NSCH, 2016.
by guest on March 4, 2020www.aappublications.org/newsDownloaded from
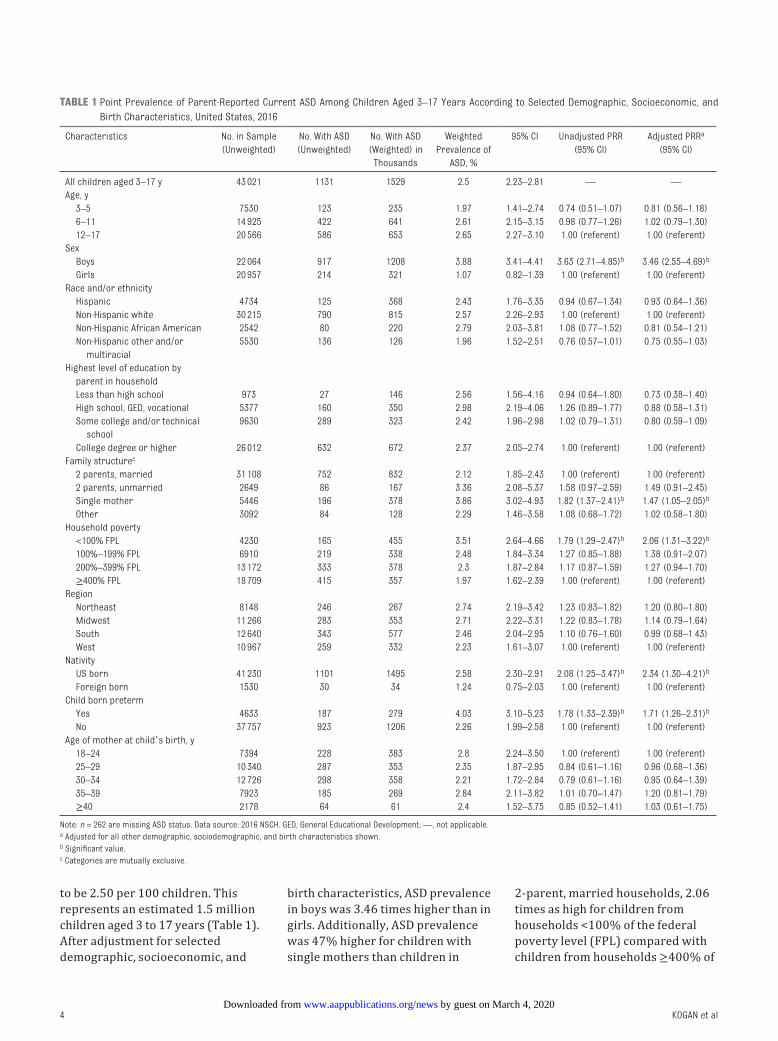
to be 2.50 per 100 children. This represents an estimated 1.5 million children aged 3 to 17 years (Table 1). After adjustment for selected demographic, socioeconomic, and
birth characteristics, ASD prevalence in boys was 3.46 times higher than in girls. Additionally, ASD prevalence was 47% higher for children with single mothers than children in
2-parent, married households, 2.06 times as high for children from households <100% of the federal poverty level (FPL) compared with children from households ≥400% of
KOGAN et al4
TABLE 1 Point Prevalence of Parent-Reported Current ASD Among Children Aged 3–17 Years According to Selected Demographic, Socioeconomic, and Birth Characteristics, United States, 2016
Characteristics No. in Sample (Unweighted)
No. With ASD (Unweighted)
No. With ASD (Weighted) in
Thousands
Weighted Prevalence of
ASD, %
95% CI Unadjusted PRR (95% CI)
Adjusted PRRa (95% CI)
All children aged 3–17 y 43 021 1131 1529 2.5 2.23–2.81 — —Age, y 3–5 7530 123 235 1.97 1.41–2.74 0.74 (0.51–1.07) 0.81 (0.56–1.18) 6–11 14 925 422 641 2.61 2.15–3.15 0.98 (0.77–1.26) 1.02 (0.79–1.30) 12–17 20 566 586 653 2.65 2.27–3.10 1.00 (referent) 1.00 (referent)Sex Boys 22 064 917 1208 3.88 3.41–4.41 3.63 (2.71–4.85)b 3.46 (2.55–4.69)b
Girls 20 957 214 321 1.07 0.82–1.39 1.00 (referent) 1.00 (referent)Race and/or ethnicity Hispanic 4734 125 368 2.43 1.76–3.35 0.94 (0.67–1.34) 0.93 (0.64–1.36) Non-Hispanic white 30 215 790 815 2.57 2.26–2.93 1.00 (referent) 1.00 (referent) Non-Hispanic African American 2542 80 220 2.79 2.03–3.81 1.08 (0.77–1.52) 0.81 (0.54–1.21) Non-Hispanic other and/or
multiracial5530 136 126 1.96 1.52–2.51 0.76 (0.57–1.01) 0.75 (0.55–1.03)
Highest level of education by parent in household
Less than high school 973 27 146 2.56 1.56–4.16 0.94 (0.64–1.80) 0.73 (0.38–1.40) High school, GED, vocational 5377 160 350 2.98 2.19–4.06 1.26 (0.89–1.77) 0.88 (0.58–1.31) Some college and/or technical
school9630 289 323 2.42 1.96–2.98 1.02 (0.79–1.31) 0.80 (0.59–1.09)
College degree or higher 26 012 632 672 2.37 2.05–2.74 1.00 (referent) 1.00 (referent)Family structurec
2 parents, married 31 108 752 832 2.12 1.85–2.43 1.00 (referent) 1.00 (referent) 2 parents, unmarried 2649 86 167 3.36 2.08–5.37 1.58 (0.97–2.59) 1.49 (0.91–2.45) Single mother 5446 196 378 3.86 3.02–4.93 1.82 (1.37–2.41)b 1.47 (1.05–2.05)b
Other 3092 84 128 2.29 1.46–3.58 1.08 (0.68–1.72) 1.02 (0.58–1.80)Household poverty <100% FPL 4230 165 455 3.51 2.64–4.66 1.79 (1.29–2.47)b 2.06 (1.31–3.22)b
100%–199% FPL 6910 219 338 2.48 1.84–3.34 1.27 (0.85–1.88) 1.38 (0.91–2.07) 200%–399% FPL 13 172 333 378 2.3 1.87–2.84 1.17 (0.87–1.59) 1.27 (0.94–1.70) ≥400% FPL 18 709 415 357 1.97 1.62–2.39 1.00 (referent) 1.00 (referent)Region Northeast 8148 246 267 2.74 2.19–3.42 1.23 (0.83–1.82) 1.20 (0.80–1.80) Midwest 11 266 283 353 2.71 2.22–3.31 1.22 (0.83–1.78) 1.14 (0.79–1.64) South 12 640 343 577 2.46 2.04–2.95 1.10 (0.76–1.60) 0.99 (0.68–1.43) West 10 967 259 332 2.23 1.61–3.07 1.00 (referent) 1.00 (referent)Nativity US born 41 230 1101 1495 2.58 2.30–2.91 2.08 (1.25–3.47)b 2.34 (1.30–4.21)b
Foreign born 1530 30 34 1.24 0.75–2.03 1.00 (referent) 1.00 (referent)Child born preterm Yes 4633 187 279 4.03 3.10–5.23 1.78 (1.33–2.39)b 1.71 (1.26–2.31)b
No 37 757 923 1206 2.26 1.99–2.58 1.00 (referent) 1.00 (referent)Age of mother at child’s birth, y 18–24 7394 228 383 2.8 2.24–3.50 1.00 (referent) 1.00 (referent) 25–29 10 340 287 353 2.35 1.87–2.95 0.84 (0.61–1.16) 0.96 (0.68–1.36) 30–34 12 726 298 358 2.21 1.72–2.84 0.79 (0.61–1.16) 0.95 (0.64–1.39) 35–39 7923 185 269 2.84 2.11–3.82 1.01 (0.70–1.47) 1.20 (0.81–1.79) ≥40 2178 64 61 2.4 1.52–3.75 0.85 (0.52–1.41) 1.03 (0.61–1.75)
Note: n = 262 are missing ASD status. Data source: 2016 NSCH. GED, General Educational Development; —, not applicable.a Adjusted for all other demographic, sociodemographic, and birth characteristics shown.b Significant value.c Categories are mutually exclusive.
by guest on March 4, 2020www.aappublications.org/newsDownloaded from
PEDIATRICS Volume 142, number 6, December 2018 5
TABLE 2 PRRs of Having Selected Health Care Characteristics According to Parent-Reported ASD Status and Other EBDs, United States, 2016
Children With ASD
(n = 1131), Weighted %
Children With Other EBDsa (n = 7795), Weighted %
All Other Children
(n = 33 014), Weighted %
Children With ASD Versus Children With Other EBDs,
a Adjusted PRR (95% CI)b
Children With ASD Versus All Other
Children, Adjusted PRR (95% CI)b
Insurance statusc
Public only 46.9 40.2 28.4 1.12 (0.98–1.28) 1.68 (1.47–1.91)d
Private only 39.9 46.6 59.8 0.88 (0.77–1.02) 0.66 (0.57–0.75)d
Other 11.0 9.1 5.4 1.22 (0.88–1.70) 2.10 (1.53–2.87)d
Uninsured 2.1 4.1 6.4 0.53 (0.30–0.93)d 0.35 (0.20–0.60)d
Visited health care provider in past 12 mo 93.9 89.6 83.6 1.05 (1.01–1.08)d 1.12 (1.09–1.15)d
Had a usual place for preventive care 94.8 94.7 91.3 1.00 (0.95–1.05) 1.04 (0.99–1.09)Any dental visit in past 12 mo 84.3 88.8 87.1 0.96 (0.91–1.02) 0.96 (0.90–1.01)Received treatment or counseling from mental health provider 45.9 39.6 3.0 1.28 (1.13–1.45)d 15.18 (12.76–18.05)d
Big problem to get mental health treatment or counseling (among those who needed to see a mental health professional)
22.9 15.9 8.5 1.44 (1.04–1.98)d 2.71 (1.46–5.05)d
Used medication because of emotions or behavior 42.1 37.2 0.4 1.18 (1.02–1.36)d 84.56 (59.19–120.81)d
Saw specialist other than mental health professional 35.0 27.2 11.7 1.32 (1.11–1.57)d 2.97 (2.52–3.50)d
Big problem to get the specialist care needed (among those who needed to see a specialist other than mental health professional)
18.4 12.0 4.3 1.40 (0.86–2.29) 3.61 (2.03–6.45)d
Used alternative health care or treatment 15.5 11.4 5.4 1.43 (1.07–1.92)d 2.83 (2.15–3.71)d
Did not get needed health care 10.8 8.3 2.1 1.37 (0.93–2.02) 5.63 (3.86–8.21)d
Type of care not received (among those who did not get needed care)
Medical and/or dental 32.1 63.2 86.0 0.56 (0.36–0.88)d 0.41 (0.26–0.64)d
Hearing and/or vision 24.5e 27.7 31.7 0.83 (0.39–1.77) 0.69 (0.32–1.52) Mental health 63.1 42.4 9.5e 1.46 (1.07–1.98)d 6.82 (3.45–13.51)d
Other 27.6 20.4 5.8e 1.27 (0.64–2.53) 4.02 (1.74–9.28)d
Usually or always parents frustrated in efforts to get services 14.9 7.4 1.5 2.02 (1.45–2.82)d 10.53 (7.51–14.77)d
Child had a special education or early intervention plan 87.5 41.3 6.1 2.15 (1.99–2.32)d 13.83 (12.37–15.45)d
Age at time of first plan, y (among those with a special education or early intervention plan)
0–2 20.2 15.7 24.2 1.12 (0.84–1.49) 0.83 (0.62–1.11) 3–5 57.7 31.3 39.8 1.77 (1.53–2.05)d 1.46 (1.23–1.73)d
6–8 14.1 33.5 22.5 0.45 (0.34–0.60)d 0.61 (0.44–0.85)d
≥9 8.0 19.6 13.5 0.50 (0.34–0.72)d 0.65 (0.42–1.01) Currently receiving services under plan (among those with a
special education or early intervention plan)84.3 78.0 37.3 1.07 (1.01–1.14)d 2.27 (1.97–2.61)d
Ever received special services to meet developmental needs 89.0 40.0 9.3 2.22 (2.05–2.41)d 9.32 (8.52–10.18)d
Age when began receiving these services, y (among those who received special services)
0–2 27.8 22.7 25.8 1.14 (0.92–1.42) 1.15 (0.93–1.42) 3–5 52.0 35.8 48.9 1.42 (1.22–1.66)d 1.06 (0.91–1.22) 6–8 12.7 29.1 19.6 0.46 (0.35–0.62)d 0.62 (0.45–0.85)d
≥9 7.6 12.4 5.7 0.66 (0.41–1.06) 1.25 (0.72–2.17) Currently receiving special services for developmental needs
(among those who received special services)76.2 59.2 23.7 1.27 (1.17–1.37)d 3.30 (2.82–3.87)d
Had a medical home 31.6 41.5 50.0 0.77 (0.65–0.91)d 0.63 (0.54–0.73)d
Had at least 1 personal doctor or nurse 78.4 76.7 71.4 1.03 (0.95–1.11) 1.10 (1.02–1.18)d
Had usual sources for sick care 87.6 80.7 78.7 1.09 (1.03–1.15)d 1.11 (1.05–1.17)d
Received family-centered care (among those with a health care visit in the past 12 mo)
72.6 82.7 87.2 0.89 (0.82–0.96)d 0.84 (0.77–0.91)d
Had no problems getting referrals when needed (among those who needed a referral)
66.5 71.5 81.2 0.93 (0.80–1.08) 0.81 (0.71–0.93)d
Received all needed components of care coordination (among those who needed care coordination)
46.0 60.2 76.3 0.76 (0.65–0.88)d 0.59 (0.51–0.68)d
Note: n = 1343 are missing data on EBD status (n = 262 are missing data on autism, and the rest are missing data on at least 1 of the other EBDs we assessed). Data source: 2016 NSCH.a EBDs include ADHD, anxiety, behavioral or conduct problems, depression, developmental delay, Down syndrome, intellectual disability, learning disability, and Tourette syndrome. In addition, 92.3% of children with ASD were reported to have other EBDs.b Adjusted for age, sex, and race and/or ethnicity.c Other insurance includes private, public, and unspecified.d Significant value.e Estimates are considered unreliable and should be used with caution. Data have a relative SE >30%.
by guest on March 4, 2020www.aappublications.org/newsDownloaded from

the FPL and 71% higher in children born preterm than term. Prevalence was 2.34 times as high for US-born than foreign-born children. The same variables were also significant when unadjusted.
Children with a parent-reported ASD diagnosis (including those who had other EBDs) had more needs and difficulties regarding health care access and use compared with children without an ASD diagnosis but who had other EBDs, and children with parent-reported ASD also had more needs and difficulties compared with other children without ASD or EBDs (Table 2). Compared with children with other EBDs, children with ASD were more likely in the past 12 months to have received mental health counseling, seen a specialist besides a mental health professional, used alternative health care or treatments, ever have a special education or early intervention plan, and currently receive special services for developmental needs. However, children with ASD were also more likely to have parents who reported difficulties with health care. They were 44% more likely to report problems getting mental health treatment, 46% more likely to report not receiving needed mental health care, 2.02 times more likely to report being usually or always frustrated in getting services, 23% less likely to have a medical home, and 24% less likely to receive needed care coordination. Children with ASD also had greater needs and difficulties compared with all other children (without other EBDs).
Of children with a parent-reported ASD diagnosis, ∼27% were taking medication for ASD-related symptoms. Children with ASD from households where the highest level of education was less than high school were 74% more likely to be currently taking medication for ASD symptoms compared with children from households with at least a college
degree (Table 3). In addition, current medication use varied regionally and was higher among children who were diagnosed >7 years ago, who had attention-deficit disorder (ADD) and/or ADHD or behavioral and/or conduct problems, and who received behavioral treatment of their ASD symptoms in the past 12 months. Children in 2-parent, unmarried households were less likely than children in 2-parent, married households to be taking medication for ASD.
Approximately 64% of children with a parent-reported ASD diagnosis received behavioral treatment in the past 12 months. Children with behavioral and/or conduct problems had a higher prevalence of behavioral treatment, as well as those currently taking medications for ASD-related symptoms. US-born children or those diagnosed with ADD and/or ADHD were less likely to have received behavioral treatment.
DISCUSSION
We used the recently released 2016 NSCH to estimate a nationally representative prevalence for children with a parent-reported ASD diagnosis of 2.50%. This is the fourth ASD prevalence report from the NSCH; however, because of several notable updates to the NSCH data collection, comparisons of the ASD prevalence estimates presented here with previously published NSCH estimates must be done cautiously because we cannot tell what proportion was explained by internal survey changes rather than external factors. The 2016 NSCH was conducted by using an address-based sample. Families responded by either mail or the Internet, whereas previous surveys were administered by telephone. In addition, question wording was changed twice. In the 2007 survey, the wording was expanded to add specificity and align with the
Diagnostic and Statistical Manual of Mental Disorders fourth edition.1 Also, beginning with the 2007 survey, the ASD case definition was more strictly defined on the basis of parents’ affirmative responses to 2 questions (“ever diagnosed with ASD” and “currently has ASD”) to exclude diagnoses that may have been lost because of maturation, treatment, or new information.34 Questions were also modified slightly in the 2016 NSCH to reflect changes in the most recent American Psychiatric Association criteria.1
In addition to the NSCH, population-based ASD prevalence estimates for US children have been reported from the NHIS, a nationally representative in-person household survey that includes ASD questions similar to those in the NSCH, 5, 9, 17 and the Autism and Developmental Disabilities Monitoring Network (ADDM), an ongoing surveillance system in local population-based areas in which ASD cases are identified through education and health records review.35 The most recent published NHIS ASD prevalence estimate (2.76%) is higher than that reported here but is based solely on ever receiving a diagnosis.36 The estimate of current ASD from the 2016 NHIS is 2.47%, which virtually matches the NSCH estimate reported here.37
The most recent composite ADDM prevalence estimate (1.68%), using 2014 data, was higher than the previous estimate of 1.46% using 2012 data, although this was still lower than the ASD estimate from the 2016 NSCH.35, 38 Any conclusions from this latter comparison must be tempered given that estimates from these different systems reflect different years, populations (11 local US populations versus the entire United States), and ages (children aged 8 years in ADDM vs 3–17 years
KOGAN et al6 by guest on March 4, 2020www.aappublications.org/newsDownloaded from

PEDIATRICS Volume 142, number 6, December 2018 7
TABLE 3 Percentage of Children Aged 3–17 Years Who Took Medication for ASD or Received Behavioral Treatment of ASD, Among Children Aged 3–17 Years Who Currently Have ASD and are Insured, United States, 2016
Medication for ASD (n = 323) Behavioral Treatment of ASD (n = 686)
Weighted % Adjusted PRRa
95% CI Weighted % Adjusted PRRa 95% CI
Overall 27.4 — — 64.2 — —Sex Boys 30.1 1.30 0.89–1.89 63.1 0.96 0.81–1.14 Girls 17.4 1.00 Referent 68.4 1.00 ReferentRace and/or ethnicity Hispanic 15.5 0.89 0.60–1.31 67.7 1.19 0.99–1.42 Non-Hispanic white 30.1 1.00 Referent 62.5 1.00 Referent Non-Hispanic African American 41.2 1.12 0.79–1.58 67.2 1.10 0.89–1.34 Non-Hispanic other and/or multiracial 21.1 0.90 0.58–1.39 59.9 0.92 0.71–1.19Highest level of education by parent in household Less than high school 55.5b 1.74c 1.17–2.59c 49.5b 0.64 0.39–1.05 High school, GED, vocational 23.4 0.99 0.67–1.47 75.0 1.10 0.91–1.34 Some college and/or technical school 23.8 0.88 0.61–1.26 63.5 1.00 0.83–1.20 College degree or higher 24.3 1.00 Referent 63.6 1.00 ReferentFamily structure 2 parents, married 24.5 1.00 Referent 64.8 1.00 Referent 2 parents, unmarried 19.9b 0.40c 0.19–0.82c 71.7 1.13 0.91–1.40 Single mother 37.7 0.88 0.63–1.22 56.1 0.80 0.63–1.02 Other 26.9 0.76 0.49–1.19 80.1 1.21 0.98–1.49Household poverty <100% FPL 27.6 1.03 0.57–1.84 68.7 1.08 0.81–1.43 100%–199% FPL 34.3 1.33 0.77–2.27 58.6 0.98 0.71–1.35 200%–399% FPL 22.5 1.09 0.73–1.63 64.9 1.00 0.82–1.24 ≥400% FPL 26.2 1.00 Referent 63.1 1.00 ReferentInsurance statusd
Public only 32.4 1.08 0.73–1.60 67.3 0.98 0.80–1.19 Private only 22.4 1.00 Referent 64.4 1.00 Referent Other 24.6 1.03 0.71–1.49 50.2 0.80 0.62–1.03Region Northeast 26.3 1.41 0.89–2.24 67.5 1.11 0.88–1.41 Midwest 34.4 1.95c 1.26–3.00c 61.0 1.03 0.81–1.31 South 32.4 1.48 0.99–2.23 66.0 1.11 0.88–1.41 West 12.4 1.00 Referent 61.9 1.00 ReferentNativity US born 27.2 0.73 0.42–1.27 64.0 0.77c 0.63–0.93c
Foreign born 39.4b 1.00 Referent 76.1b 1.00 ReferentYears since first diagnosise
0–2 18.1 1.00 Referent 68.9 1.00 Referent 3–6 22.5 1.12 0.76–1.65 65.1 0.98 0.81–1.18 ≥7 42.9 1.66c 1.19–2.32c 62.8 0.92 0.77–1.12Type of health care provider to give diagnosis Primary care provider 28.7 1.00 Referent 55.7 1.00 Referent Specialist 24.4 0.82 0.61–1.11 65.7 1.15 0.89–1.49 Psychologist (school and nonschool) 23.6 0.70 0.49–1.01 59.7 1.16 0.90–1.51 Psychiatrist 35.2 1.03 0.74–1.44 69.7 1.18 0.89–1.57 Other or don’t know 34.0 0.70 0.45–1.10 75.3 1.42c 1.10–1.84c
Co-occurring conditions ADD and/or ADHD (ref = no ADD and/or ADHD) 47.5 3.30c 2.14–5.07c 62.8 0.84c 0.70–0.99c
Anxiety problems (ref = no anxiety problems) 39.9 1.16 0.89–1.51 68.0 1.05 0.89–1.24 Developmental delay (ref = no developmental delay) 32.1 1.30 0.98–1.73 68.2 1.08 0.93–1.26 Behavioral or conduct problems (ref = no behavioral or
conduct problems)39.2 1.72c 1.26–2.33c 72.0 1.39c 1.16–1.66c
Currently taking medication for ASD — — — 75.3 1.31c 1.13–1.52c
Received behavioral treatment of ASD 32.0 1.64c 1.18–2.28c — — —
Data source: 2016 NSCH. GED, General Educational Development; ref, referent; —, not applicable.a Adjusted for all other demographic, sociodemographic, and birth characteristics shown.b Estimates are considered unreliable and should be used with caution. Data have a relative SE >30% or unweighted denominator n < 30.c Significant value.d Other insurance includes private, public, and unspecified.e The analyses included those with missing information on age at diagnosis (n = 95).
by guest on March 4, 2020www.aappublications.org/newsDownloaded from

in NSCH).35 The estimates derived from previous versions of the NSCH and ADDM are similar when comparing overlapping years.7, 39 In addition, the estimate from the NSCH falls within the range of estimates (1.31%–2.93%) from the 11 ADDM sites, and sites able to access both health and education records had higher prevalence estimates compared with sites accessing only health records.
Because there is no biological marker, ASD is a particularly challenging condition to track; thus, multiple systems with different case ascertainment strategies and supplemental data collection for children with ASD are useful in developing a full picture of ASD prevalence. Findings from the NHIS, NSCH, and ADDM each contribute unique information that, when combined, helps form a comprehensive picture of ASD among children in the United States.
Estimates reported here indicate less variation in prevalence rates across child age, race and/or ethnicity, or socioeconomic groups than observed in earlier ASD prevalence studies.7, 40 Policy changes such as the 2007 AAP recommendations for universal screening by 18 to 24 months may have helped to increase ASD diagnosis among young children, thus reducing the prevalence disparity by age.41 These types of recommendations might have also had broader impacts by increasing provider and parent awareness of ASD generally, possibly contributing to increased diagnoses in traditionally underserved racial-ethnic groups. In addition, among the 87 cases of ever but not current autism, we do not know if the children achieved optimal outcomes or were initially misdiagnosed.42
The current study demonstrates that families face challenges in accessing healthcare services.
Because children with ASD are likely to need multiple types of services and accompanying care coordination, 43 – 46 the challenge of achieving a medical home appears evident among children with ASD in that they were less likely to meet the medical home criteria than other children. Although children with ASD were more likely to have a personal doctor or nurse and have a usual source for sick care, they were less likely to get needed referrals for specialty care. Consistent with previous studies, we found that children with ASD also had high rates of co-occurring mental health conditions or EBD diagnoses.21, 22, 35 We were not able to determine if some of the co-occurring EBD diagnoses were precursor diagnoses made as part of the diagnostic trajectory of a child receiving an ASD diagnosis versus being distinct co-occurring conditions. Nonetheless, our findings indicate that children with ASD face many developmental challenges; they particularly need referrals and care coordination.
Treatments for ASD-related symptoms have primarily been focused on behavior change and/or skill building.19 Psychotropic medications have been used to relieve some emotional and behavioral symptoms, such as challenging behaviors, irritability, anxiety, and hyperactivity.47 However, there are no pharmacologic options for treating the core deficits of ASD.48 In the current study, we found that 27% of US children with ASD took medication for ASD-related symptoms and 64% received behavioral treatment. Children with ASD who had reported diagnoses of behavioral and/or conduct problems were significantly more likely to have their ASD symptoms treated with medication and receive behavioral treatment. Children with ASD who were also reported to be diagnosed
with ADD and/or ADHD were 3.30 times as likely to be treated with medication for their ASD symptoms, whereas they were only 84% as likely to receive behavioral therapy. Other studies have revealed a higher rate of psychotropic medication use for children with ASD when there was a comorbid diagnosis of ADHD.49
Our study has several strengths, including its large, nationally representative sample, which enabled examination by subgroups, and the comprehensive set of questions on ASD, co-occurring conditions, and health care experiences. However, there are also limitations. The data are cross-sectional and based on parent report of diagnoses. Undiagnosed ASD could not be assessed, so the prevalence of ASD may be underestimated, especially for younger children. Parents’ reports of diagnoses were not clinically validated; however, studies have revealed a high concordance rate (93%–98%) between parent reports of their child receiving a definite ASD diagnosis and clinician’s diagnosis in verbal children.50, 51 An ASD registry in the United Kingdom revealed the reliability of parent-reported ASD diagnoses of children was 96% when compared with clinical reports.52 In addition, there was a high level of agreement between parents and clinicians on ASD-related behaviors at 12 months of age.53 However, family characteristics may affect the degree of parent-clinician agreement.54 Studies have also revealed a high test-retest reliability on maternal report of their child’s mental health conditions.55 Other studies found good agreement between parental report and pediatricians’ records, 56 and fair-to-excellent agreement between parents and day care providers on recall of early symptoms associated with ASD.57 Although the specific autism diagnosis question from NHIS and NSCH has not been
KOGAN et al8 by guest on March 4, 2020www.aappublications.org/newsDownloaded from

externally validated, the consistency of results from the NSCH, NHIS, and ADDM when compared from the same approximate period suggests a degree of reliability of these estimates.5 There is also the potential for nonresponse bias. The Census Bureau applied a nonresponse weighting adjustment that significantly mitigated any identified differential nonresponse.58 However, there could be additional sources of bias, such as selection bias, that are not controlled by the weighting adjustments. In addition, the NSCH applied poststratification adjustments to ensure that sociodemographic subgroups were appropriately represented in the estimates.
From the 2016 NSCH data, we estimated that 1 in 40 children in the United States have a parent-reported ASD diagnosis. Because ASD is a lifelong condition for most children, an important area of future research would be to study life course development and understand what factors influence health and well-being in young adulthood and beyond for these children.
ACKNOWLEDGMENT
We thank Alicia A. Livinski, MPH, MLS, at the National Institutes of Health Library, for her dedication and thorough library research work.
PEDIATRICS Volume 142, number 6, December 2018 9
The views expressed in this article are those of the authors and do not necessarily reflect the official policies of the US Department of Health and Human Services, the Health Resources and Services Administration, or the Centers for Disease Control and Prevention, nor does mention of the department or agency names imply endorsement by the US government.
DOI: https:// doi. org/ 10. 1542/ peds. 2017- 4161
Accepted for publication Aug 27, 2018
Address correspondence to Michael D. Kogan, PhD, Office of Epidemiology and Research, Health Resources and Services Administration, Maternal and Child Health Bureau, 5600 Fishers Lane, Room 18N128, Rockville, MD 20857. E-mail: [email protected]
PEDIATRICS (ISSN Numbers: Print, 0031-4005; Online, 1098-4275).
Copyright © 2018 by the American Academy of Pediatrics
FINANCIAL DISCLOSURE: The authors have indicated they have no financial relationships relevant to this article to disclose.
FUNDING: Dr Shattuck is supported by grant R01MH104423 from the National Institute of Mental Health. Funded by the National Institutes of Health (NIH).
POTENTIAL CONFLICT OF INTEREST: The authors have indicated they have no potential conflicts of interest to disclose.
COMPANION PAPER: A companion to this article can be found online at www. pediatrics. org/ cgi/ doi/ 10. 1542/ peds. 2018- 2950.
ABBREVIATIONS
ADD: attention-deficit disorderADDM: Autism and Developmental
Disabilities Monitoring Network
ADHD: attention-deficit/ hyperactivity disorder
ASD: autism spectrum disorderCI: confidence intervalEBD: emotional, behavioral, and
developmental conditionFPL: federal poverty levelNHIS: National Health Interview
SurveyNSCH: National Survey of
Children’s HealthPRR: prevalence rate ratio
REFERENCES
1. American Psychiatric Association. Diagnostic and Statistical Manual of Mental Disorders. 5th ed. Arlington, VA: American Psychiatric Association; 2013
2. Ritvo ER, Freeman BJ, Pingree C, et al. The UCLA-University of Utah epidemiologic survey of autism: prevalence. Am J Psychiatry. 1989;146(2):194–199
3. Van Naarden Braun K, Christensen D, Doernberg N, et al. Trends in the prevalence of autism spectrum disorder, cerebral palsy, hearing loss, intellectual disability, and vision impairment, metropolitan Atlanta, 1991-2010. PLoS One. 2015;10(4):e0124120
4. Newschaffer CJ, Falb MD, Gurney JG. National autism prevalence trends from United States special education data. Pediatrics. 2005;115(3). Available at: www. pediatrics. org/ cgi/ content/ full/ 115/ 3/ e277
5. Centers for Disease Control and Prevention (CDC). Mental health in the United States: parental report of diagnosed autism in children aged 4-17 years–United States, 2003-2004. MMWR Morb Mortal Wkly Rep. 2006;55(17):481–486
6. Parner ET, Schendel DE, Thorsen P. Autism prevalence trends over time in Denmark: changes in prevalence and
age at diagnosis. Arch Pediatr Adolesc Med. 2008;162(12):1150–1156
7. Kogan MD, Blumberg SJ, Schieve LA, et al. Prevalence of parent-reported diagnosis of autism spectrum disorder among children in the US, 2007. Pediatrics. 2009;124(5):1395–1403
8. Blumberg SJ, Bramlett MD, Kogan MD, Schieve LA, Jones JR, Lu MC. Changes in prevalence of parent-reported autism spectrum disorder in school-aged U.S. children: 2007 to 2011-2012. Natl Health Stat Report. 2013;(65):1–11
9. Zablotsky B, Black LI, Maenner MJ, Schieve LA, Blumberg SJ. Estimated prevalence of autism and other developmental disabilities following
by guest on March 4, 2020www.aappublications.org/newsDownloaded from

questionnaire changes in the 2014 National Health Interview Survey. Natl Health Stat Report. 2015;(87):1–20
10. May T, Sciberras E, Brignell A, Williams K. Autism spectrum disorder: updated prevalence and comparison of two birth cohorts in a nationally representative Australian sample. BMJ Open. 2017;7(5):e015549
11. Kim YS, Leventhal BL, Koh YJ, et al. Prevalence of autism spectrum disorders in a total population sample. Am J Psychiatry. 2011;168(9):904–912
12. Jensen CM, Steinhausen HC, Lauritsen MB. Time trends over 16 years in incidence-rates of autism spectrum disorders across the lifespan based on nationwide Danish register data. J Autism Dev Disord. 2014;44(8):1808–1818
13. Coo H, Ouellette-Kuntz H, Lloyd JE, Kasmara L, Holden JJ, Lewis ME. Trends in autism prevalence: diagnostic substitution revisited. J Autism Dev Disord. 2008;38(6):1036–1046
14. Gal G, Abiri L, Reichenberg A, Gabis L, Gross R. Time trends in reported autism spectrum disorders in Israel, 1986-2005. J Autism Dev Disord. 2012;42(3):428–431
15. Lundström S, Reichenberg A, Anckarsäter H, Lichtenstein P, Gillberg C. Autism phenotype versus registered diagnosis in Swedish children: prevalence trends over 10 years in general population samples. BMJ. 2015;350:h1961
16. Maenner MJ, Durkin MS. Trends in the prevalence of autism on the basis of special education data. Pediatrics. 2010;126(5). Available at: www. pediatrics. org/ cgi/ content/ full/ 126/ 5/ e1018
17. Boyle CA, Boulet S, Schieve LA, et al. Trends in the prevalence of developmental disabilities in US children, 1997-2008. Pediatrics. 2011;127(6):1034–1042
18. Lyall K, Croen L, Daniels J, et al. The changing epidemiology of autism spectrum disorders. Annu Rev Public Health. 2017;38:81–102
19. Lai MC, Lombardo MV, Baron-Cohen S. Autism. Lancet. 2014;383(9920):896–910
20. National Academies of Sciences, Engineering, and Medicine. Mental
Disorders and Disabilities Among Low-Income Children. Washington, DC: The National Academies Press; 2015
21. Schieve LA, Gonzalez V, Boulet SL, et al. Concurrent medical conditions and health care use and needs among children with learning and behavioral developmental disabilities, National Health Interview Survey, 2006-2010. Res Dev Disabil. 2012;33(2):467–476
22. Levy SE, Giarelli E, Lee LC, et al. Autism spectrum disorder and co-occurring developmental, psychiatric, and medical conditions among children in multiple populations of the United States. J Dev Behav Pediatr. 2010;31(4):267–275
23. Benevides TW, Carretta HJ, Lane SJ. Unmet need for therapy among children with autism spectrum disorder: results from the 2005-2006 and 2009-2010 National Survey of Children with special health care needs. Matern Child Health J. 2016;20(4):878–888
24. Deavenport-Saman A, Lu Y, Smith K, Yin L. Do children with autism overutilize the emergency department? Examining visit urgency and subsequent hospital admissions. Matern Child Health J. 2016;20(2):306–314
25. Wu CM, Kung PT, Li CI, Tsai WC. The difference in medical utilization and associated factors between children and adolescents with and without autism spectrum disorders. Res Dev Disabil. 2015;36C:78–86
26. Montes G, Halterman JS. Child care problems and employment among families with preschool-aged children with autism in the United States. Pediatrics. 2008;122(1). Available at: www. pediatrics. org/ cgi/ content/ full/ 122/ 1/ e202
27. Kogan MD, Strickland BB, Blumberg SJ, Singh GK, Perrin JM, van Dyck PC. A national profile of the health care experiences and family impact of autism spectrum disorder among children in the United States, 2005-2006. Pediatrics. 2008;122(6). Available at: www. pediatrics. org/ cgi/ content/ full/ 122/ 6/ e1149:
28. Becerra TA, Massolo ML, Yau VM, et al. A survey of parents with children on the autism spectrum: experience with services and treatments. Perm J. 2017;21
29. Eldevik S, Hastings RP, Hughes JC, Jahr E, Eikeseth S, Cross S. Meta-analysis of early intensive behavioral intervention for children with autism. J Clin Child Adolesc Psychol. 2009;38(3):439–450
30. Masi A, DeMayo MM, Glozier N, Guastella AJ. An overview of autism spectrum disorder, heterogeneity and treatment options. Neurosci Bull. 2017;33(2):183–193
31. Lavelle TA, Weinstein MC, Newhouse JP, Munir K, Kuhlthau KA, Prosser LA. Economic burden of childhood autism spectrum disorders. Pediatrics. 2014;133(3). Available at: www. pediatrics. org/ cgi/ content/ full/ 133/ 3/ e520
32. Health Resources and Services Administration. Frequently asked questions: 2016 National Survey of Children’s Health. Available at: https:// mchb. hrsa. gov/ data/ national- surveys/ data- user. Accessed October 19, 2017
33. American Academy of Pediatrics Medical Home Initiatives for Children With Special Needs Project Advisory Committee. Policy statement: organizational principles to guide and define the child health care system and/or improve the health of all children. Pediatrics. 2004;113(suppl 5):1545–1547
34. Blumberg SJ, Zablotsky B, Avila RM, Colpe LJ, Pringle BA, Kogan MD. Diagnosis lost: differences between children who had and who currently have an autism spectrum disorder diagnosis. Autism. 2016;20(7):783–795
35. Baio J, Wiggins L, Christensen DL, et al. Prevalence of autism spectrum disorder among children aged 8 years - autism and developmental disabilities monitoring network, 11 sites, United States, 2014. MMWR Surveill Summ. 2018;67(6):1–23
36. Zablotsky B, Black LI, Blumberg SJ. Estimated prevalence of children with diagnosed developmental disabilities in the United States, 2014-2016. NCHS Data Brief. 2017;(291):1–8
37. Xu G, Strathearn L, Liu B, Bao W. Prevalence of autism spectrum disorder among US children and adolescents, 2014-2016. JAMA. 2018;319(1):81–82
38. Christensen DL, Baio J, Van Naarden Braun K, et al; Centers for Disease
KOGAN et al10 by guest on March 4, 2020www.aappublications.org/newsDownloaded from

Control and Prevention (CDC). Prevalence and characteristics of autism spectrum disorder among children aged 8 years–autism and developmental disabilities monitoring network, 11 sites, United States, 2012. MMWR Surveill Summ. 2016;65(3):1–23
39. Autism and Developmental Disabilities Monitoring Network Surveillance Year 2008 Principal Investigators; Centers for Disease Control and Prevention. Prevalence of autism spectrum disorders–autism and developmental disabilities monitoring network, 14 sites, United States, 2008. MMWR Surveill Summ. 2012;61(3):1–19
40. Durkin MS, Maenner MJ, Meaney FJ, et al. Socioeconomic inequality in the prevalence of autism spectrum disorder: evidence from a U.S. cross-sectional study. PLoS One. 2010;5(7):e11551
41. Johnson CP, Myers SM; American Academy of Pediatrics Council on Children With Disabilities. Identification and evaluation of children with autism spectrum disorders. Pediatrics. 2007;120(5):1183–1215
42. Fein D, Barton M, Eigsti IM, et al. Optimal outcome in individuals with a history of autism. J Child Psychol Psychiatry. 2013;54(2):195–205
43. Zablotsky B, Pringle BA, Colpe LJ, Kogan MD, Rice C, Blumberg SJ. Service and treatment use among children diagnosed with autism spectrum disorders. J Dev Behav Pediatr. 2015;36(2):98–105
44. Ruble LA, Heflinger CA, Renfrew JW, Saunders RC. Access and service use by children with autism spectrum
disorders in Medicaid managed care. J Autism Dev Disord. 2005;35(1):3–13
45. Krauss MW, Gulley S, Sciegaj M, Wells N. Access to specialty medical care for children with mental retardation, autism, and other special health care needs. Ment Retard. 2003;41(5):329–339
46. Thomas KC, Ellis AR, McLaurin C, Daniels J, Morrissey JP. Access to care for autism-related services. J Autism Dev Disord. 2007;37(10):1902–1912
47. Accordino RE, Kidd C, Politte LC, Henry CA, McDougle CJ. Psychopharmacological interventions in autism spectrum disorder. Expert Opin Pharmacother. 2016;17(7):937–952
48. Kaplan G, McCracken JT. Psychopharmacology of autism spectrum disorders. Pediatr Clin North Am. 2012;59(1):175–187, xii
49. Coury DL, Anagnostou E, Manning-Courtney P, et al. Use of psychotropic medication in children and adolescents with autism spectrum disorders. Pediatrics. 2012;130(suppl 2):S69–S76
50. Lee H, Marvin AR, Watson T, et al. Accuracy of phenotyping of autistic children based on Internet implemented parent report. Am J Med Genet B Neuropsychiatr Genet. 2010;153B(6):1119–1126
51. Daniels AM, Rosenberg RE, Anderson C, Law JK, Marvin AR, Law PA. Verification of parent-report of child autism spectrum disorder diagnosis to a web-based autism registry. J Autism Dev Disord. 2012;42(2):257–265
52. Warnell F, George B, McConachie H, Johnson M, Hardy R, Parr JR. Designing and recruiting to UK autism spectrum disorder research databases: do they include representative children with valid ASD diagnoses? BMJ Open. 2015;5(9):e008625
53. Macari SL, Wu GC, Powell KK, Fontenelle S IV, Macris DM, Chawarska K. Do parents and clinicians agree on ratings of autism-related behaviors at 12 months of age? A study of infants at high and low risk for ASD. J Autism Dev Disord. 2018;48(4):1069–1080
54. Neuhaus E, Beauchaine TP, Bernier RA, Webb SJ. Child and family characteristics moderate agreement between caregiver and clinician report of autism symptoms. Autism Res. 2018;11(3):476–487
55. Kentgen LM, Klein RG, Mannuzza S, Davies M. Test-retest reliability of maternal reports of lifetime mental disorders in their children. J Abnorm Child Psychol. 1997;25(5):389–398
56. Pless CE, Pless IB. How well they remember. The accuracy of parent reports. Arch Pediatr Adolesc Med. 1995;149(5):553–558
57. Larsen K, Aasland A, Diseth TH. Brief report: agreement between parents and day-care professionals on early symptoms associated with autism spectrum disorders. J Autism Dev Disord. 2018;48(4):1063–1068
58. U.S. Census Bureau. 2016 National Survey of Children’s Health: Nonresponse Bias Analysis. Washington, DC: U.S. Census Bureau; 2017
PEDIATRICS Volume 142, number 6, December 2018 11 by guest on March 4, 2020www.aappublications.org/newsDownloaded from

DOI: 10.1542/peds.2017-4161 originally published online November 26, 2018; 2018;142;Pediatrics
Kuhlthau, Robin L. Harwood and Michael C. LuStephen J. Blumberg, Benjamin Zablotsky, James M. Perrin, Paul Shattuck, Karen A.
Michael D. Kogan, Catherine J. Vladutiu, Laura A. Schieve, Reem M. Ghandour,Children
The Prevalence of Parent-Reported Autism Spectrum Disorder Among US
ServicesUpdated Information &
http://pediatrics.aappublications.org/content/142/6/e20174161including high resolution figures, can be found at:
Referenceshttp://pediatrics.aappublications.org/content/142/6/e20174161#BIBLThis article cites 52 articles, 13 of which you can access for free at:
Subspecialty Collections
http://www.aappublications.org/cgi/collection/autism:asd_subAutism/ASDal_issues_subhttp://www.aappublications.org/cgi/collection/development:behaviorDevelopmental/Behavioral Pediatricsfollowing collection(s): This article, along with others on similar topics, appears in the
Permissions & Licensing
http://www.aappublications.org/site/misc/Permissions.xhtmlin its entirety can be found online at: Information about reproducing this article in parts (figures, tables) or
Reprintshttp://www.aappublications.org/site/misc/reprints.xhtmlInformation about ordering reprints can be found online:
by guest on March 4, 2020www.aappublications.org/newsDownloaded from

DOI: 10.1542/peds.2017-4161 originally published online November 26, 2018; 2018;142;Pediatrics
Kuhlthau, Robin L. Harwood and Michael C. LuStephen J. Blumberg, Benjamin Zablotsky, James M. Perrin, Paul Shattuck, Karen A.
Michael D. Kogan, Catherine J. Vladutiu, Laura A. Schieve, Reem M. Ghandour,Children
The Prevalence of Parent-Reported Autism Spectrum Disorder Among US
http://pediatrics.aappublications.org/content/142/6/e20174161located on the World Wide Web at:
The online version of this article, along with updated information and services, is
http://pediatrics.aappublications.org/content/suppl/2018/11/19/peds.2017-4161.DCSupplementalData Supplement at:
1073-0397. ISSN:60007. Copyright © 2018 by the American Academy of Pediatrics. All rights reserved. Print
the American Academy of Pediatrics, 141 Northwest Point Boulevard, Elk Grove Village, Illinois,has been published continuously since 1948. Pediatrics is owned, published, and trademarked by Pediatrics is the official journal of the American Academy of Pediatrics. A monthly publication, it
by guest on March 4, 2020www.aappublications.org/newsDownloaded from