The Presidency: Department of Planning, Monitoring and Evaluation 1 THE PRESIDENCY DEPARTMENT OF...
19
The Presidency: Department of Planning, Monitoring and Evaluation 1 THE PRESIDENCY DEPARTMENT OF PLANNING MONITORING AND EVALUATION REPUBLIC OF SOUTH AFRICA FRONTLINE SERVICE DELIVERY MONITORING PROGRAMME B. Leon
-
Upload
may-leonard -
Category
Documents
-
view
218 -
download
2
Transcript of The Presidency: Department of Planning, Monitoring and Evaluation 1 THE PRESIDENCY DEPARTMENT OF...
The Presidency: Department of Planning, Monitoring and Evaluation 1
THE PRESIDENCYDEPARTMENT OF PLANNING MONITORING AND EVALUATION
REPUBLIC OF SOUTH AFRICA
FRONTLINE SERVICE DELIVERY MONITORING PROGRAMME
B. Leon
The Presidency: Department of Planning, Monitoring and Evaluation
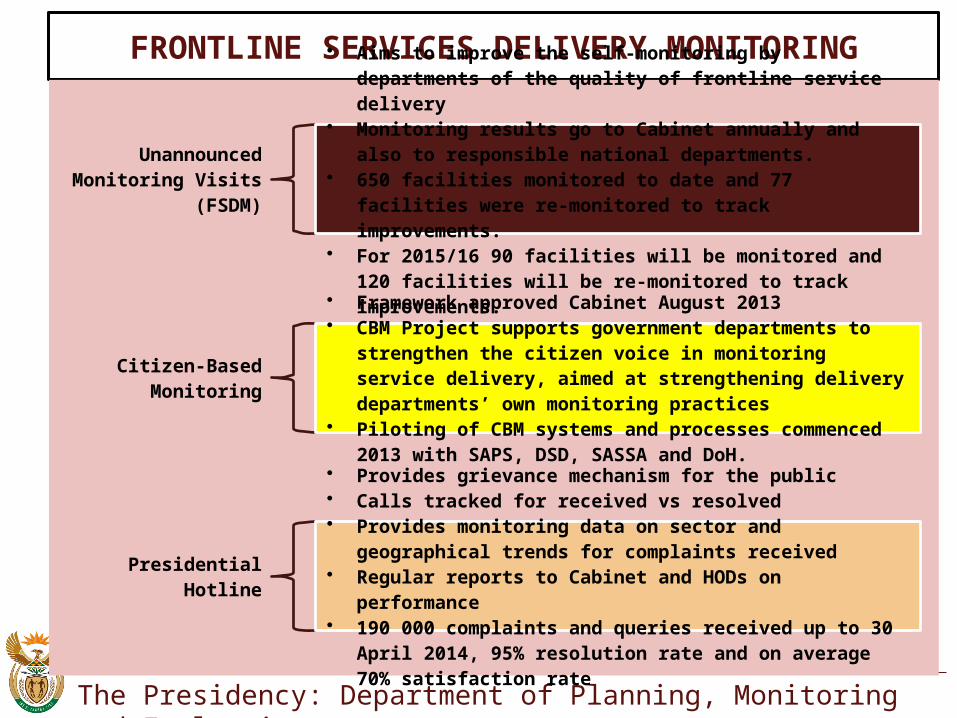
FRONTLINE SERVICES DELIVERY MONITORING
Unannounced Monitoring Visits
(FSDM)
• Aims to improve the self-monitoring by departments of the quality of frontline service delivery
• Monitoring results go to Cabinet annually and also to responsible national departments.
• 650 facilities monitored to date and 77 facilities were re-monitored to track improvements.
• For 2015/16 90 facilities will be monitored and 120 facilities will be re-monitored to track improvements.
Citizen-Based Monitoring
• Framework approved Cabinet August 2013• CBM Project supports government departments to strengthen
the citizen voice in monitoring service delivery, aimed at strengthening delivery departments’ own monitoring practices
• Piloting of CBM systems and processes commenced 2013 with SAPS, DSD, SASSA and DoH.
Presidential Hotline
• Provides grievance mechanism for the public• Calls tracked for received vs resolved• Provides monitoring data on sector and geographical trends
for complaints received• Regular reports to Cabinet and HODs on performance• 190 000 complaints and queries received up to 30 April 2014,
95% resolution rate and on average 70% satisfaction rate
The Presidency: Department of Planning, Monitoring and Evaluation 3
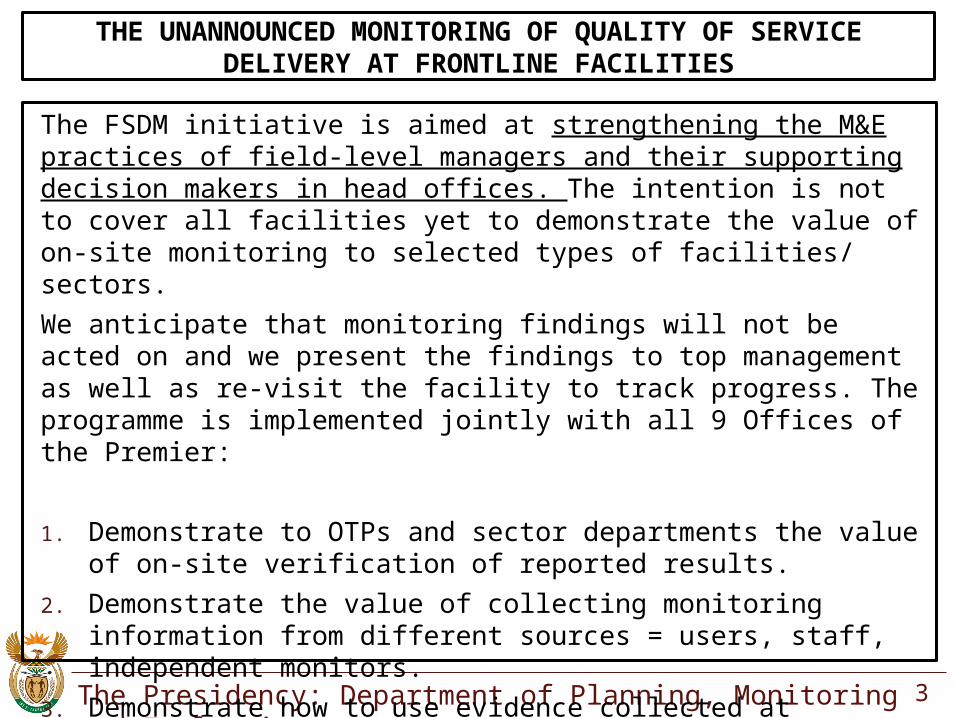
THE UNANNOUNCED MONITORING OF QUALITY OF SERVICE DELIVERY AT FRONTLINE FACILITIES
The FSDM initiative is aimed at strengthening the M&E practices of field-level managers and their supporting decision makers in head offices. The intention is not to cover all facilities yet to demonstrate the value of on-site monitoring to selected types of facilities/ sectors.
We anticipate that monitoring findings will not be acted on and we present the findings to top management as well as re-visit the facility to track progress. The programme is implemented jointly with all 9 Offices of the Premier:
1. Demonstrate to OTPs and sector departments the value of on-site verification of reported results.
2. Demonstrate the value of collecting monitoring information from different sources = users, staff, independent monitors.
3. Demonstrate how to use evidence collected at facility-level for catalysing improvements – conduct improvements monitoring.
The Presidency: Department of Planning, Monitoring and Evaluation 4
THE UNANNOUNCED MONITORING OF QUALITY OF SERVICE DELIVERY AT FRONTLINE FACILITIES
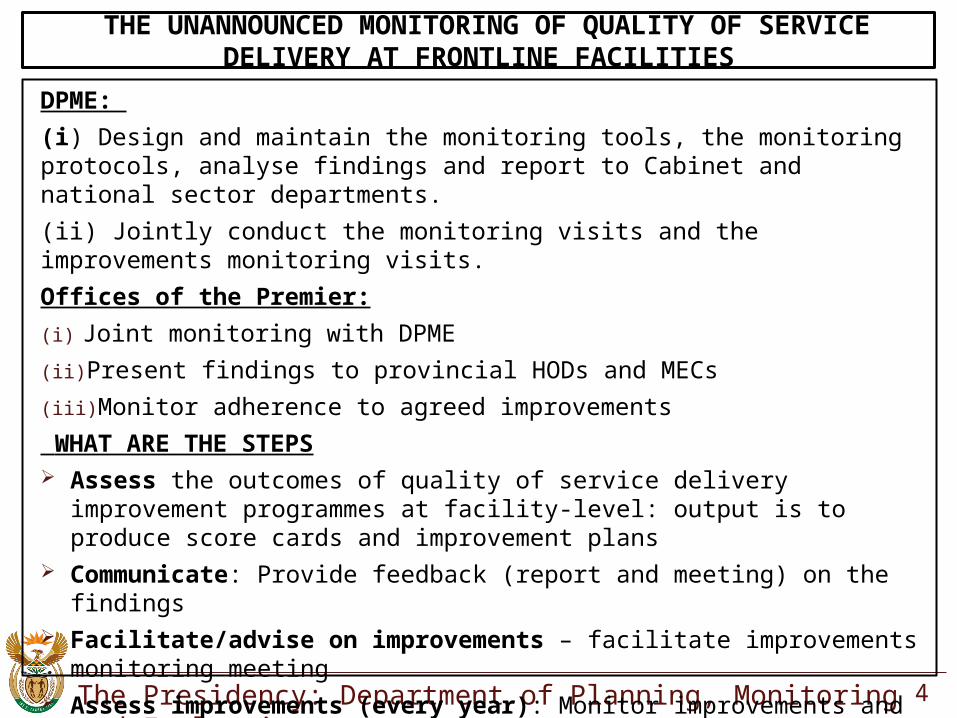
DPME:
(i) Design and maintain the monitoring tools, the monitoring protocols, analyse findings and report to Cabinet and national sector departments.
(ii) Jointly conduct the monitoring visits and the improvements monitoring visits.
Offices of the Premier:
(i) Joint monitoring with DPME
(ii) Present findings to provincial HODs and MECs
(iii) Monitor adherence to agreed improvements
WHAT ARE THE STEPS Assess the outcomes of quality of service delivery improvement programmes at
facility-level: output is to produce score cards and improvement plans Communicate: Provide feedback (report and meeting) on the findings Facilitate/advise on improvements – facilitate improvements monitoring
meeting Assess improvements (every year): Monitor improvements and report on
findings
The Presidency: Department of Planning, Monitoring and Evaluation 5
THE UNANNOUNCED MONITORING OF QUALITY OF SERVICE DELIVERY AT FRONTLINE FACILITIES
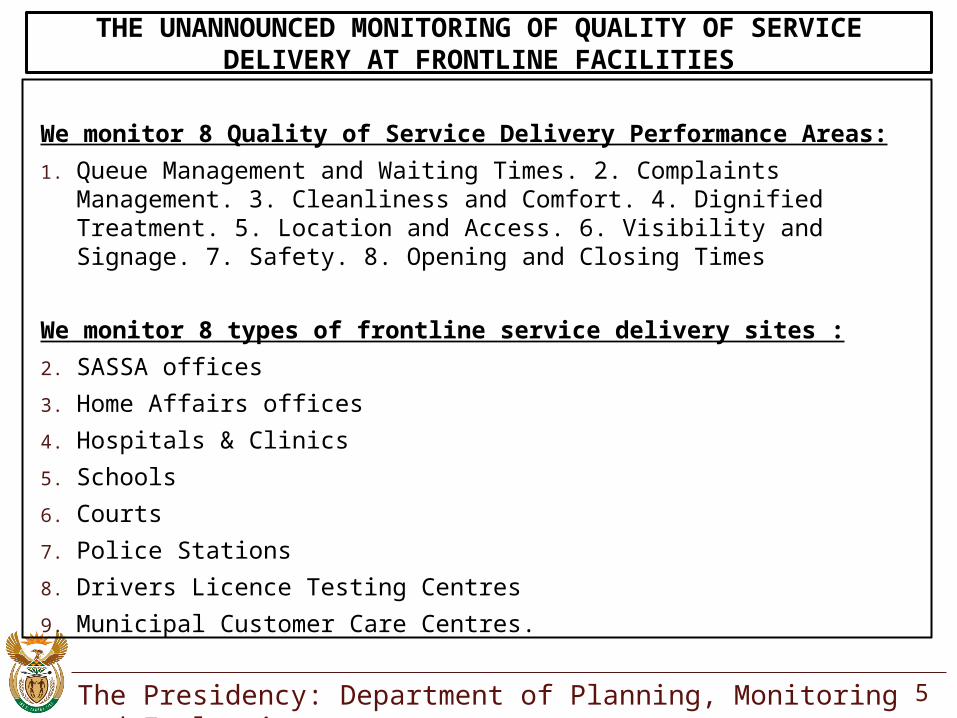
We monitor 8 Quality of Service Delivery Performance Areas:
1. Queue Management and Waiting Times. 2. Complaints Management. 3. Cleanliness and Comfort. 4. Dignified Treatment. 5. Location and Access. 6. Visibility and Signage. 7. Safety. 8. Opening and Closing Times
We monitor 8 types of frontline service delivery sites :
2. SASSA offices
3. Home Affairs offices
4. Hospitals & Clinics
5. Schools
6. Courts
7. Police Stations
8. Drivers Licence Testing Centres
9. Municipal Customer Care Centres.
The Presidency: Department of Planning, Monitoring and Evaluation
THE UNANNOUNCED MONITORING OF QUALITY OF SERVICE DELIVERY AT FRONTLINE FACILITIES
6
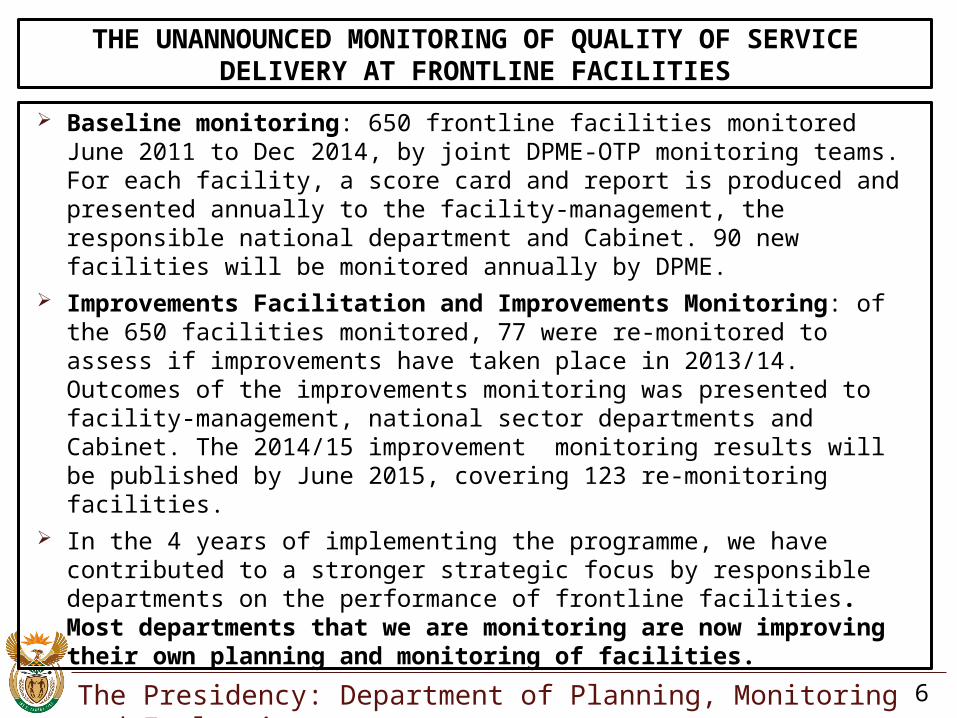
Baseline monitoring: 650 frontline facilities monitored June 2011 to Dec 2014, by joint DPME-OTP monitoring teams. For each facility, a score card and report is produced and presented annually to the facility-management, the responsible national department and Cabinet. 90 new facilities will be monitored annually by DPME.
Improvements Facilitation and Improvements Monitoring: of the 650 facilities monitored, 77 were re-monitored to assess if improvements have taken place in 2013/14. Outcomes of the improvements monitoring was presented to facility-management, national sector departments and Cabinet. The 2014/15 improvement monitoring results will be published by June 2015, covering 123 re-monitoring facilities.
In the 4 years of implementing the programme, we have contributed to a stronger strategic focus by responsible departments on the performance of frontline facilities. Most departments that we are monitoring are now improving their own planning and monitoring of facilities.
The Presidency: Department of Planning, Monitoring and Evaluation
EXAMPLE OF ONE SCORE CARD: PART A
7
Name of Facility
Province
Sector
Date of Summary Report
Visit X X
KEY: IMPROVEMENT TRENDS
Improvement 4
No improvement 3
Regressed 2
Sustaining good practice
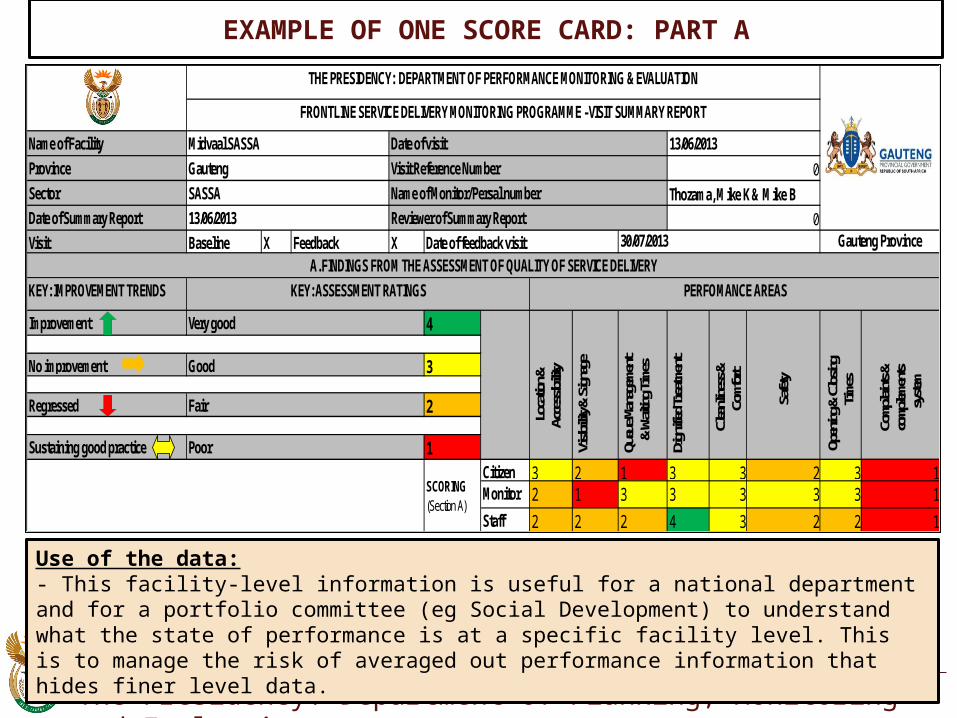
Citizen 3 2 1 3 3 2 3 1Monitor 2 1 3 3 3 3 3 1Staff 2 2 2 4 3 2 2 1
SCORING (Section A)
Good
Fair
Queu
e Man
agem
ent
& Wa
iting T
imes
Loca
tion &
Ac
cess
ibility
Visibi
lity &
Sign
age
Poor 1
PERFOMANCE AREAS
Very good
Gauteng Province
Open
ing &
Clos
ing
Times
Dign
ified T
reatm
ent
Clea
nline
ss &
Co
mfort
Safet
y
Comp
laints
&
comp
lemen
ts sy
stem
THE PRESIDENCY: DEPARTMENT OF PERFORMANCE MONITORING & EVALUATION
FRONTLINE SERVICE DELIVERY MONITORING PROGRAMME - VISIT SUMMARY REPORT
Midvaal SASSA
13/06/2013
Baseline Feedback
Gauteng
SASSA
Date of feedback visit 30/07/2013Reviewer of Summary Report 0
Date of visit 13/06/2013
Name of Monitor/ Persal number
Visit Reference Number 0Thozama, Mike K & Mike B
A. FINDINGS FROM THE ASSESSMENT OF QUALITY OF SERVICE DELIVERY
KEY: ASSESSMENT RATINGS
Use of the data:- This facility-level information is useful for a national department and for a portfolio committee (eg Social Development) to understand what the state of performance is at a specific facility level. This is to manage the risk of averaged out performance information that hides finer level data.
The Presidency: Department of Planning, Monitoring and Evaluation
EXAMPLE OF ONE SCORE CARD: PART B
8
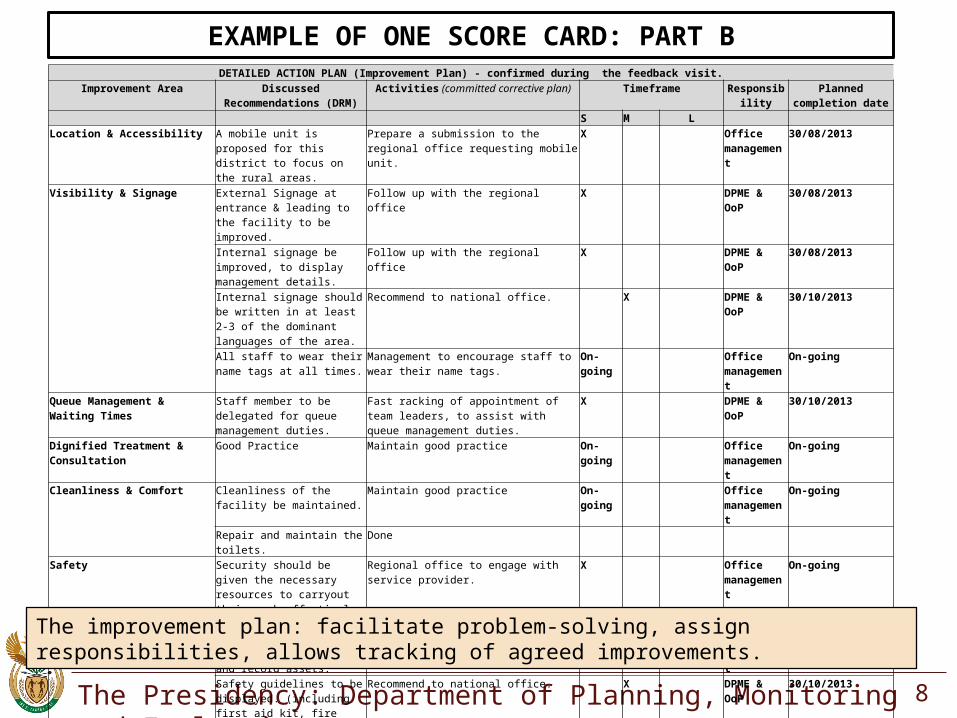
DETAILED ACTION PLAN (Improvement Plan) - confirmed during the feedback visit.Improvement Area Discussed Recommendations
(DRM)Activities (committed corrective plan) Timeframe Responsibility Planned completion
date S M L
Location & Accessibility A mobile unit is proposed for this district to focus on the rural areas.
Prepare a submission to the regional office requesting mobile unit.
X Office management
30/08/2013
Visibility & Signage External Signage at entrance & leading to the facility to be improved.
Follow up with the regional office X DPME & OoP 30/08/2013
Internal signage be improved, to display management details.
Follow up with the regional office X DPME & OoP 30/08/2013
Internal signage should be written in at least 2-3 of the dominant languages of the area.
Recommend to national office. X DPME & OoP 30/10/2013
All staff to wear their name tags at all times.
Management to encourage staff to wear their name tags.
On-going Office management
On-going
Queue Management & Waiting Times Staff member to be delegated for queue management duties.
Fast racking of appointment of team leaders, to assist with queue management duties.
X DPME & OoP 30/10/2013
Dignified Treatment & Consultation Good Practice Maintain good practice On-going Office management
On-going
Cleanliness & Comfort Cleanliness of the facility be maintained.
Maintain good practice On-going Office management
On-going
Repair and maintain the toilets. Done
Safety Security should be given the necessary resources to carryout their work effectively, e.g. Metal detectors.
Regional office to engage with service provider. X Office management
On-going
Security to search all visitors & officials and record assets.
Regional office to engage with service provider. On-going Office management
On-going
Safety guidelines to be displayed. (including first aid kit, fire extinguishers).
Recommend to national office. X DPME & OoP 30/10/2013
Opening & closing times Good Practice Maintain good practice On-going Office management
On-going
Complaint Management System Complaint Management System to be put in place. Display complaints procedure and including a suggestion box and stationery. Run awareness programmes to make the community aware of its existence and purpose.
Suggestion box in place Done Complaint Management System to be improved, by appointment of team leaders.
X DPME & OoP 30/10/2013
Continuous awareness to the citizen to provide comments.
On-going Office management
On-going
Other: All old chairs in the waiting area needs to be replaced.
Prepare a submission to the regional office requesting new chairs.
X Office management
30/08/2013
The improvement plan: facilitate problem-solving, assign responsibilities, allows tracking of agreed improvements.
The Presidency: Department of Planning, Monitoring and Evaluation
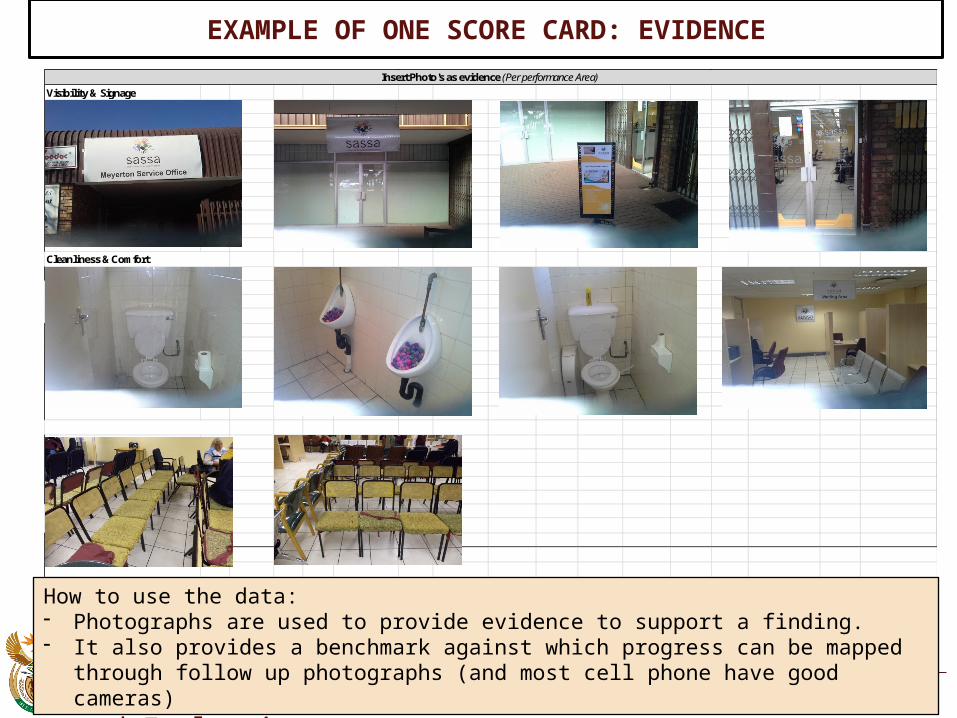
EXAMPLE OF ONE SCORE CARD: EVIDENCE
9
Visibility & Signage
Cleanliness & Comfort
Insert Photo's as evidence (Per performance Area)
How to use the data:- Photographs are used to provide evidence to support a finding.- It also provides a benchmark against which progress can be mapped through follow up
photographs (and most cell phone have good cameras)
The Presidency: Department of Planning, Monitoring and Evaluation
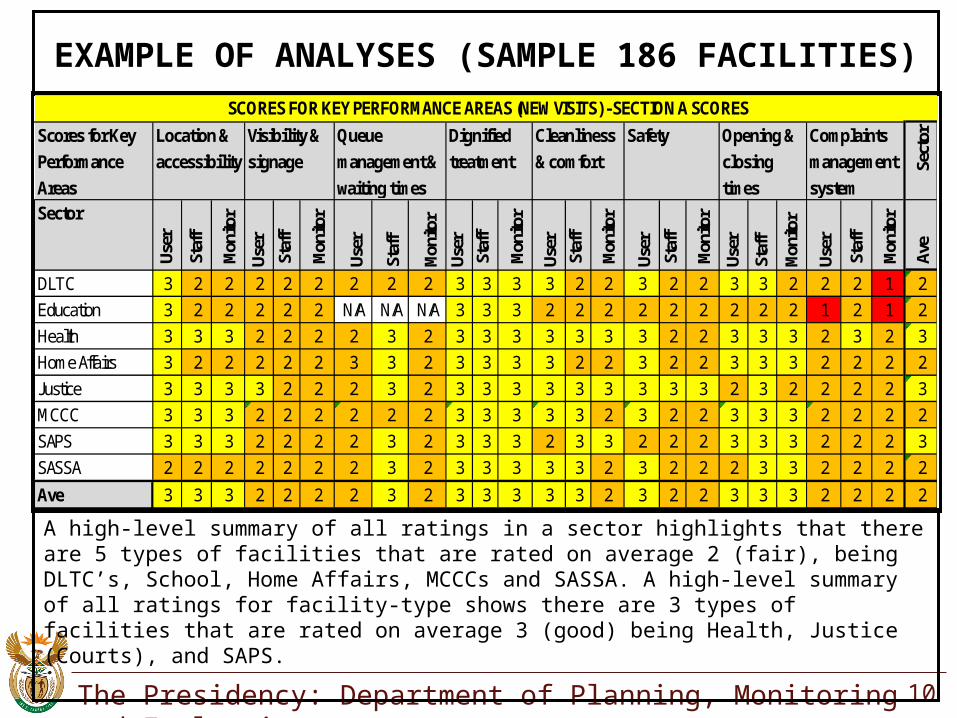
EXAMPLE OF ANALYSES (SAMPLE 186 FACILITIES)
10
A high-level summary of all ratings in a sector highlights that there are 5 types of facilities that are rated on average 2 (fair), being DLTC’s, School, Home Affairs, MCCCs and SASSA. A high-level summary of all ratings for facility-type shows there are 3 types of facilities that are rated on average 3 (good) being Health, Justice (Courts), and SAPS.
Sect
or
Sector
Use
r
Sta
ff
Mon
itor
User
Sta
ff
Mon
itor
User
Staf
f
Mon
itor
User
Sta
ff
Mon
itor
User
Sta
ff
Mon
itor
User
Sta
ff
Mon
itor
User
Staf
f
Mon
itor
User
Sta
ff
Mon
itor
Ave
DLTC 3 2 2 2 2 2 2 2 2 3 3 3 3 2 2 3 2 2 3 3 2 2 2 1 2Education 3 2 2 2 2 2 N/A N/A N/A 3 3 3 2 2 2 2 2 2 2 2 2 1 2 1 2Health 3 3 3 2 2 2 2 3 2 3 3 3 3 3 3 3 2 2 3 3 3 2 3 2 3Home Affairs 3 2 2 2 2 2 3 3 2 3 3 3 3 2 2 3 2 2 3 3 3 2 2 2 2Justice 3 3 3 3 2 2 2 3 2 3 3 3 3 3 3 3 3 3 2 3 2 2 2 2 3MCCC 3 3 3 2 2 2 2 2 2 3 3 3 3 3 2 3 2 2 3 3 3 2 2 2 2SAPS 3 3 3 2 2 2 2 3 2 3 3 3 2 3 3 2 2 2 3 3 3 2 2 2 3SASSA 2 2 2 2 2 2 2 3 2 3 3 3 3 3 2 3 2 2 2 3 3 2 2 2 2
Ave 3 3 3 2 2 2 2 3 2 3 3 3 3 3 2 3 2 2 3 3 3 2 2 2 2
Scores for Key
Performance
Areas
Location &
accessibility
Visibility &
signage
Queue
management &
waiting times
Dignified
treatment
Cleanliness
& comfort
SCORES FOR KEY PERFORMANCE AREAS (NEW VISITS) - SECTION A SCORES
Safety Opening &
closing
times
Complaints
management
system
The Presidency: Department of Planning, Monitoring and Evaluation
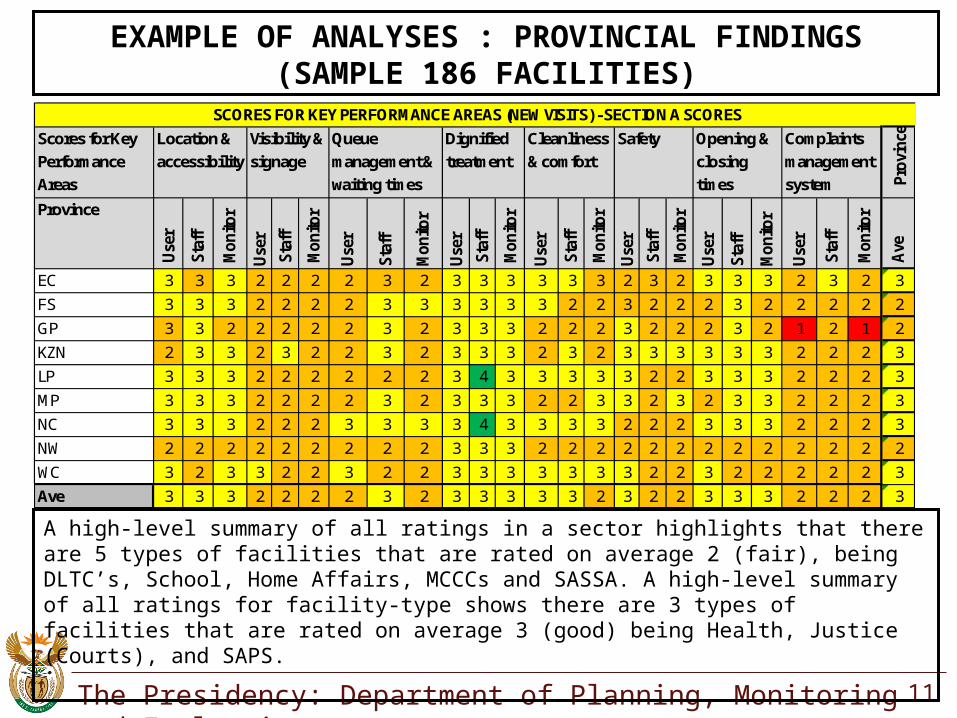
EXAMPLE OF ANALYSES : PROVINCIAL FINDINGS (SAMPLE 186 FACILITIES)
11
A high-level summary of all ratings in a sector highlights that there are 5 types of facilities that are rated on average 2 (fair), being DLTC’s, School, Home Affairs, MCCCs and SASSA. A high-level summary of all ratings for facility-type shows there are 3 types of facilities that are rated on average 3 (good) being Health, Justice (Courts), and SAPS.
Pro
vin
ce
Province
Use
r
Sta
ff
Mo
nito
r
Use
r
Sta
ff
Mo
nito
r
Use
r
Sta
ff
Mo
nito
r
Use
r
Sta
ff
Mo
nito
r
Use
r
Sta
ff
Mo
nito
r
Use
r
Sta
ff
Mo
nito
r
Use
r
Sta
ff
Mo
nito
r
Use
r
Sta
ff
Mo
nito
r
Ave
EC 3 3 3 2 2 2 2 3 2 3 3 3 3 3 3 2 3 2 3 3 3 2 3 2 3
FS 3 3 3 2 2 2 2 3 3 3 3 3 3 2 2 3 2 2 2 3 2 2 2 2 2
GP 3 3 2 2 2 2 2 3 2 3 3 3 2 2 2 3 2 2 2 3 2 1 2 1 2
KZN 2 3 3 2 3 2 2 3 2 3 3 3 2 3 2 3 3 3 3 3 3 2 2 2 3
LP 3 3 3 2 2 2 2 2 2 3 4 3 3 3 3 3 2 2 3 3 3 2 2 2 3
MP 3 3 3 2 2 2 2 3 2 3 3 3 2 2 3 3 2 3 2 3 3 2 2 2 3
NC 3 3 3 2 2 2 3 3 3 3 4 3 3 3 3 2 2 2 3 3 3 2 2 2 3
NW 2 2 2 2 2 2 2 2 2 3 3 3 2 2 2 2 2 2 2 2 2 2 2 2 2
WC 3 2 3 3 2 2 3 2 2 3 3 3 3 3 3 3 2 2 3 2 2 2 2 2 3
Ave 3 3 3 2 2 2 2 3 2 3 3 3 3 3 2 3 2 2 3 3 3 2 2 2 3
Scores for Key
Performance
Areas
Location &
accessibility
Visibility &
signage
Queue
management &
waiting times
Dignified
treatment
Cleanliness
& comfort
Safety Opening &
closing
times
Complaints
management
system
SCORES FOR KEY PERFORMANCE AREAS (NEW VISITS) - SECTION A SCORES
The Presidency: Department of Planning, Monitoring and Evaluation 12
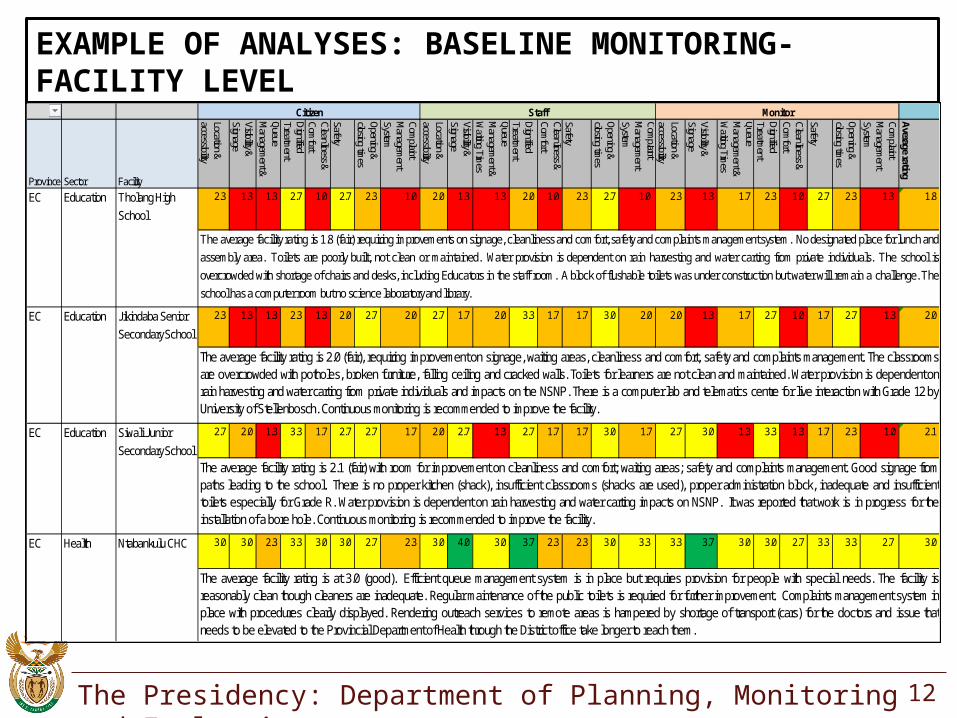
EXAMPLE OF ANALYSES: BASELINE MONITORING- FACILITY LEVEL
Province Sector Facility
Location & accessibility
Visibility & Signage
Queue M
anagement &
Dignified Treatm
ent
Cleanliness & Com
fort
Safety
Opening & closing tim
es
Complaint
Managem
ent System
Location & accessibility
Visibility & Signage
Queue M
anagement &
Waiting Tim
es
Dignified Treatm
ent
Cleanliness & Com
fort
Safety
Opening & closing tim
es
Complaint
Managem
ent System
Location & accessibility
Visibility & Signage
Queue M
anagement &
Waiting Tim
es
Dignified Treatm
ent
Cleanliness & Com
fort
Safety
Opening & closing tim
es
Complaint
Managem
ent System
Average rating
2.3 1.3 1.3 2.7 1.0 2.7 2.3 1.0 2.0 1.3 1.3 2.0 1.0 2.3 2.7 1.0 2.3 1.3 1.7 2.3 1.0 2.7 2.3 1.3 1.8
2.3 1.3 1.3 2.3 1.3 2.0 2.7 2.0 2.7 1.7 2.0 3.3 1.7 1.7 3.0 2.0 2.0 1.3 1.7 2.7 1.0 1.7 2.7 1.3 2.0
2.7 2.0 1.3 3.3 1.7 2.7 2.7 1.7 2.0 2.7 1.3 2.7 1.7 1.7 3.0 1.7 2.7 3.0 1.3 3.3 1.3 1.7 2.3 1.0 2.1
3.0 3.0 2.3 3.3 3.0 3.0 2.7 2.3 3.0 4.0 3.0 3.7 2.3 2.3 3.0 3.3 3.3 3.7 3.0 3.0 2.7 3.3 3.3 2.7 3.0
Citizen Staff Monitor
The average facility rating is at 3.0 (good). Efficient queue management system is in place but requires provision for people with special needs. The facility isreasonably clean though cleaners are inadequate. Regular maintenance of the public toilets is required for further improvement. Complaints management system inplace with procedures clearly displayed. Rendering outreach services to remote areas is hampered by shortage of transport (cars) for the doctors and issue thatneeds to be elevated to the Provincial Department of Health through the District office take longer to reach them.
The average facility rating is 1.8 (fair) requiring improvements on signage, cleanliness and comfort, safety and complaints management system. No designated place for lunch andassembly area. Toilets are poorly built, not clean or maintained. Water provision is dependent on rain harvesting and water carting from private individuals. The school isovercrowded with shortage of chairs and desks, including Educators in the staff room. A block of flushable toilets was under construction but water will remain a challenge. Theschool has a computer room but no science laboratory and library.
The average facility rating is 2.0 (fair), requiring improvement on signage, waiting areas, cleanliness and comfort, safety and complaints management. The classroomsare overcrowded with potholes, broken furniture, falling ceiling and cracked walls. Toilets for learners are not clean and maintained. Water provision is dependent onrain harvesting and water carting from private individuals and impacts on the NSNP. There is a computer lab and telematics centre for live interaction with Grade 12 byUniversity of Stellenbosch. Continuous monitoring is recommended to improve the facility.
The average facility rating is 2.1 (fair) with room for improvement on cleanliness and comfort; waiting areas; safety and complaints management. Good signage frompaths leading to the school. There is no proper kitchen (shack), insufficient classrooms (shacks are used), proper administration block, inadequate and insufficienttoilets especially for Grade R. Water provision is dependent on rain harvesting and water carting impacts on NSNP. It was reported that work is in progress for theinstallation of a bore hole. Continuous monitoring is recommended to improve the facility.
EC Education Siwali Junior Secondary School
EC Health Ntabankulu CHC
EC Education Tholang High School
EC Education Jikindaba Senior Secondary School

The Presidency: Department of Planning, Monitoring and Evaluation 14
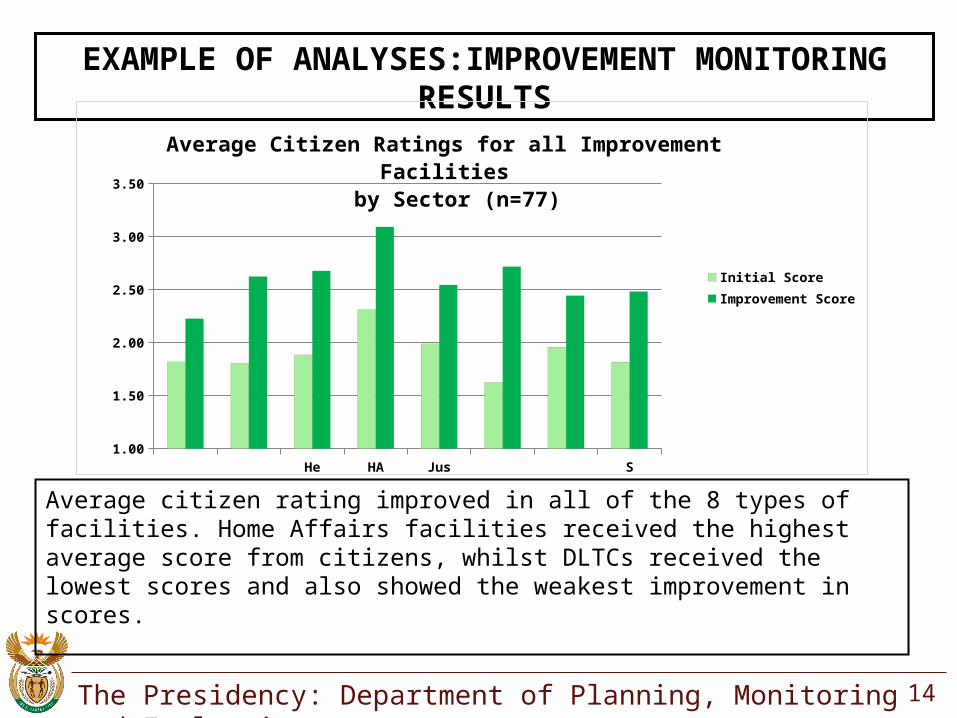
EXAMPLE OF ANALYSES:IMPROVEMENT MONITORING RESULTS
Average citizen rating improved in all of the 8 types of facilities. Home Affairs facilities received the highest average score from citizens, whilst DLTCs received the lowest scores and also showed the weakest improvement in scores.
DLTC Educ Health HA Justice MCCC SAPS SASSA1.00
1.50
2.00
2.50
3.00
3.50
Average Citizen Ratings for all Improvement Facilities by Sector (n=77)
Initial Score
Improvement Score
The Presidency: Department of Planning, Monitoring and Evaluation 15
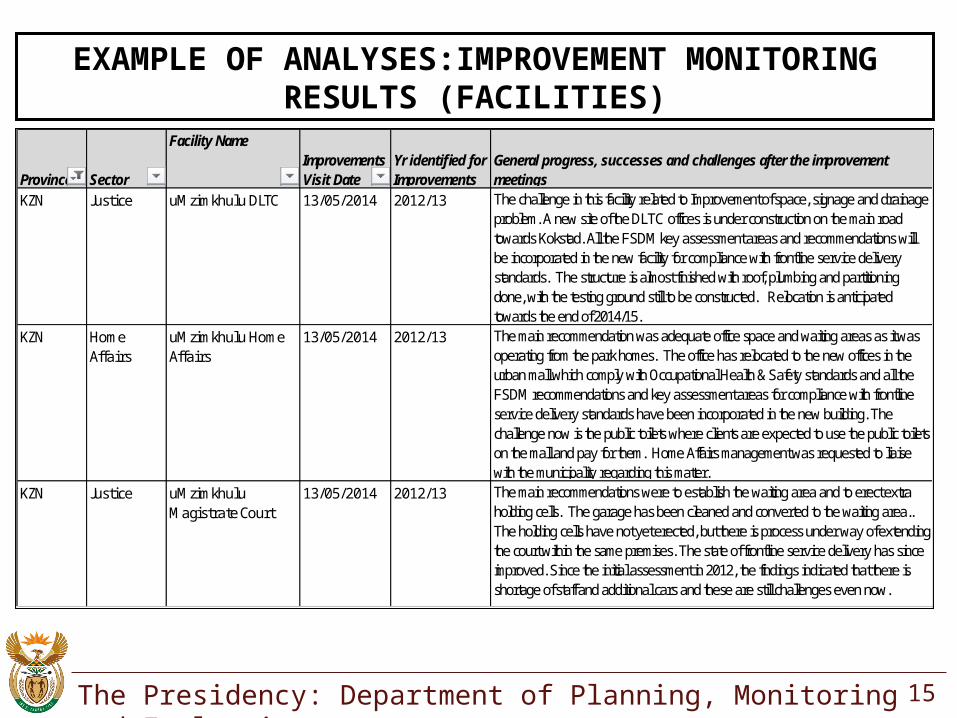
EXAMPLE OF ANALYSES:IMPROVEMENT MONITORING RESULTS (FACILITIES)
Province Sector
Facility NameImprovements Visit Date
Yr identified for Improvements
General progress, successes and challenges after the improvement meetings
KZN Justice uMzimkhulu DLTC 13/05/2014 2012/13 The challenge in this facility related to Improvement of space, signage and drainage problem. A new site of the DLTC offices is under construction on the main road towards Kokstad. All the FSDM key assessment areas and recommendations will be incorporated in the new facility for compliance with frontline service delivery standards. The structure is almost finished with roof, plumbing and partitioning done, with the testing ground still to be constructed. Relocation is anticipated towards the end of 2014/15.
KZN Home Affairs
uMzimkhulu Home Affairs
13/05/2014 2012/13 The main recommendation was adequate office space and waiting areas as it was operating from the park homes. The office has relocated to the new offices in the urban mall which comply with Occupational Health & Safety standards and all the FSDM recommendations and key assessment areas for compliance with frontline service delivery standards have been incorporated in the new building. The challenge now is the public toilets where clients are expected to use the public toilets on the mall and pay for them. Home Affairs management was requested to liaise with the municipality regarding this matter.
KZN Justice uMzimkhulu Magistrate Court
13/05/2014 2012/13 The main recommendations were to establish the waiting area and to erect extra holding cells. The garage has been cleaned and converted to the waiting area.. The holding cells have not yet erected, but there is process under way of extending the court within the same premises. The state of frontline service delivery has since improved. Since the initial assessment in 2012, the findings indicated that there is shortage of staff and additional cars and these are still challenges even now.
The Presidency: Department of Planning, Monitoring and Evaluation 16
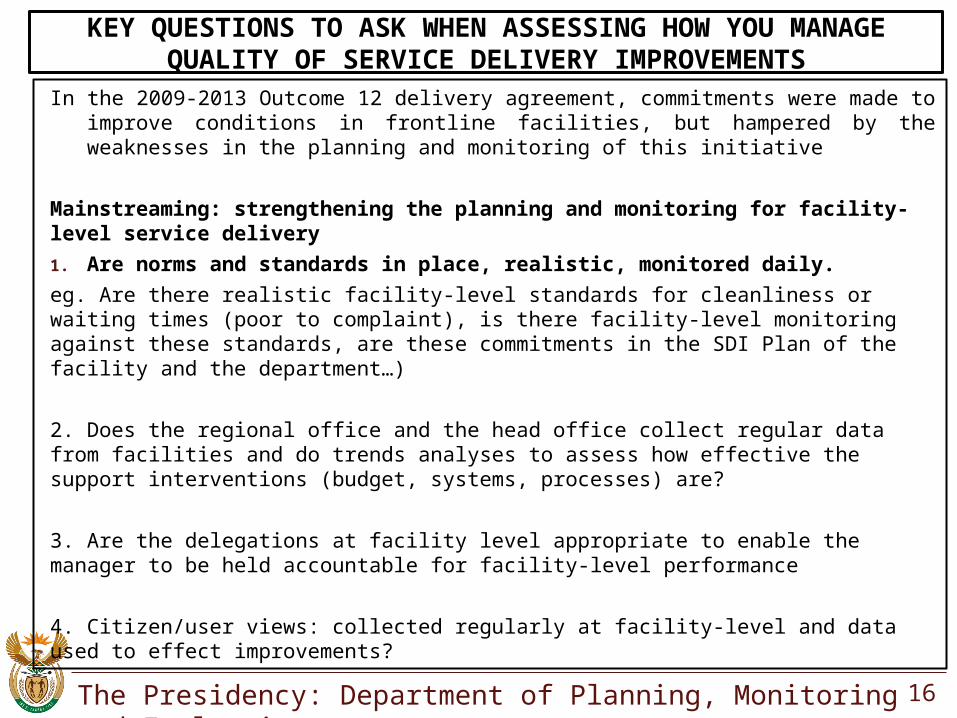
KEY QUESTIONS TO ASK WHEN ASSESSING HOW YOU MANAGE QUALITY OF SERVICE DELIVERY IMPROVEMENTS
In the 2009-2013 Outcome 12 delivery agreement, commitments were made to improve conditions in frontline facilities, but hampered by the weaknesses in the planning and monitoring of this initiative
Mainstreaming: strengthening the planning and monitoring for facility-level service delivery
1. Are norms and standards in place, realistic, monitored daily.
eg. Are there realistic facility-level standards for cleanliness or waiting times (poor to complaint), is there facility-level monitoring against these standards, are these commitments in the SDI Plan of the facility and the department…)
2. Does the regional office and the head office collect regular data from facilities and do trends analyses to assess how effective the support interventions (budget, systems, processes) are?
3. Are the delegations at facility level appropriate to enable the manager to be held accountable for facility-level performance
4. Citizen/user views: collected regularly at facility-level and data used to effect improvements?
The Presidency: Department of Planning, Monitoring and Evaluation
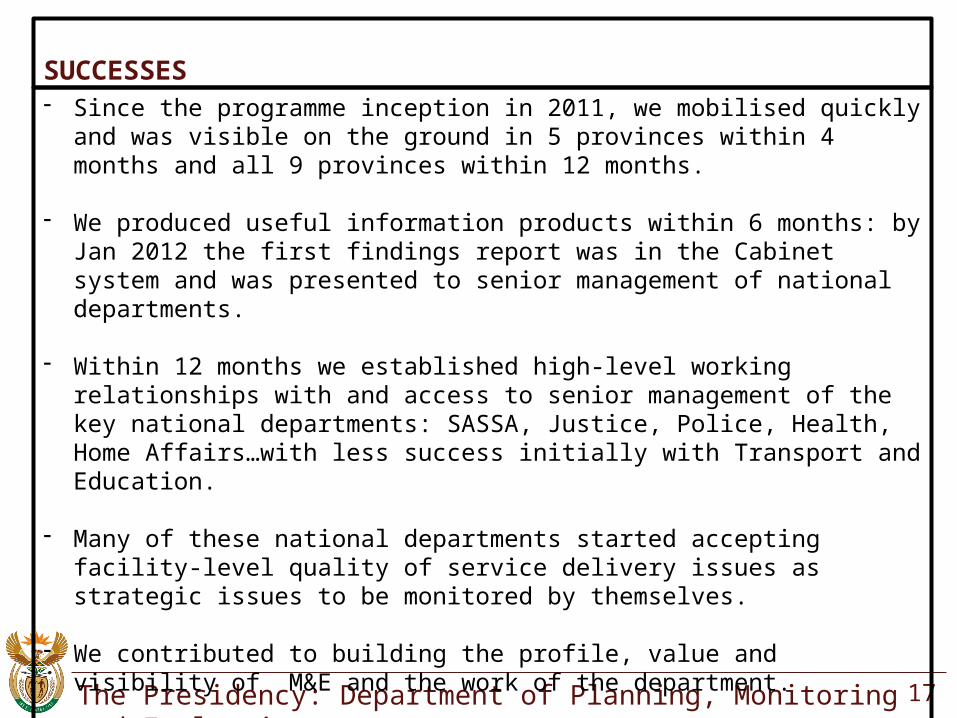
SUCCESSES
17
- Since the programme inception in 2011, we mobilised quickly and was visible on the ground in 5 provinces within 4 months and all 9 provinces within 12 months.
- We produced useful information products within 6 months: by Jan 2012 the first findings report was in the Cabinet system and was presented to senior management of national departments.
- Within 12 months we established high-level working relationships with and access to senior management of the key national departments: SASSA, Justice, Police, Health, Home Affairs…with less success initially with Transport and Education.
- Many of these national departments started accepting facility-level quality of service delivery issues as strategic issues to be monitored by themselves.
- We contributed to building the profile, value and visibility of M&E and the work of the department.
The Presidency: Department of Planning, Monitoring and Evaluation
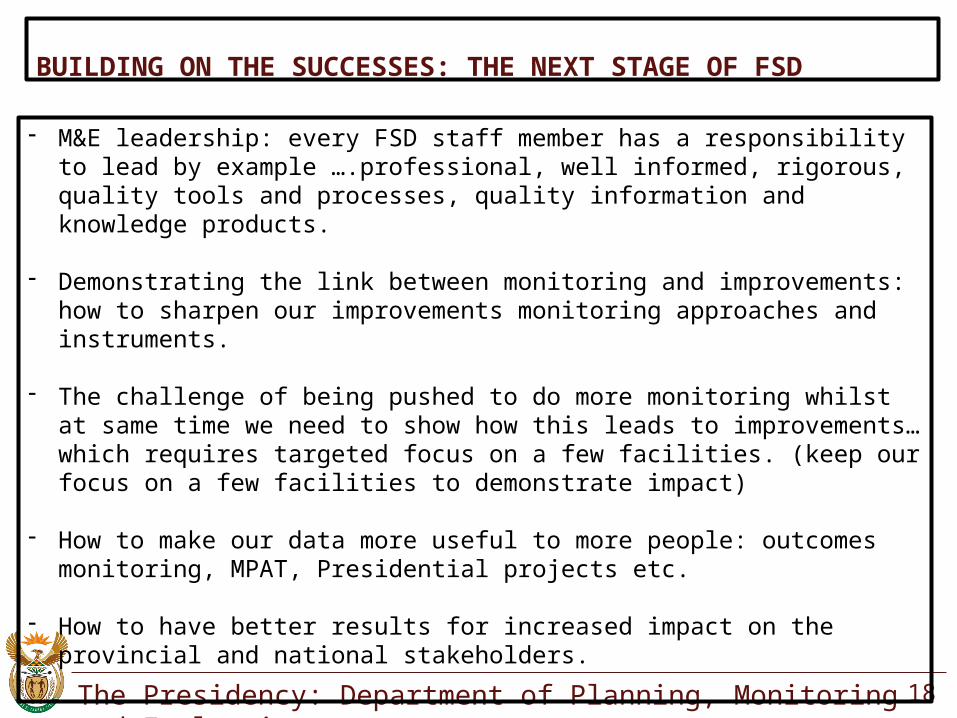
BUILDING ON THE SUCCESSES: THE NEXT STAGE OF FSD
18
- M&E leadership: every FSD staff member has a responsibility to lead by example ….professional, well informed, rigorous, quality tools and processes, quality information and knowledge products.
- Demonstrating the link between monitoring and improvements: how to sharpen our improvements monitoring approaches and instruments.
- The challenge of being pushed to do more monitoring whilst at same time we need to show how this leads to improvements…which requires targeted focus on a few facilities. (keep our focus on a few facilities to demonstrate impact)
- How to make our data more useful to more people: outcomes monitoring, MPAT, Presidential projects etc.
- How to have better results for increased impact on the provincial and national stakeholders.
The Presidency: Department of Planning, Monitoring and Evaluation 19
Go to http://www.thepresidency.gov.za/dpme.asp for PME documentsincluding narrative guide to outcomes approach, outcomes documents
and delivery agreement guide
THANK YOU