THE PREDICTIVE PLACEMENT VALIDITY STUDY OF … · the predictive placement validity study of texas...
32
THE PREDICTIVE PLACEMENT VALIDITY STUDY OF TEXAS SUCCESS INITIATIVE ASSESSMENT (TSIA) Prepared by Weiwei Cui, Ph.D. Luz Bay, Ph.D. The College Board Psychometrics 29 July 2016 Updated 14 June 2017
Transcript of THE PREDICTIVE PLACEMENT VALIDITY STUDY OF … · the predictive placement validity study of texas...
THE PREDICTIVE PLACEMENT VALIDITY
STUDY OF TEXAS SUCCESS INITIATIVE
ASSESSMENT (TSIA)
Prepared by
Weiwei Cui, Ph.D. Luz Bay, Ph.D.
The College Board Psychometrics
29 July 2016
Updated 14 June 2017
2
TABLE OF CONTENTS
List of Tables .................................................................................................................................................................. 3
List of Figures ................................................................................................................................................................. 4
Introduction ................................................................................................................................................................... 5
Statement of Purpose .................................................................................................................................................... 6
Methodology ................................................................................................................................................................. 7
Data ........................................................................................................................................................................... 8
Analyses ................................................................................................................................................................... 15
Results ......................................................................................................................................................................... 19
References ................................................................................................................................................................... 32
Appendix A: Predictive Placement Validity Study Data Requirements and File Layout .............................................. 33
Appendix B: Expected Probability of Successful Mathematics Course Completion Predicted by TSIA‐M .................. 36
Appendix C: Expected Probability of Successful Reading‐intensive Course Completion Predicted by TSIA‐R ............ 38
Appendix D‐1: Expected Probability of Successful English Composition Course Completion Predicted by WritePlacer
Score ............................................................................................................................................................................ 40
Appendix D‐2: Expected Probability of Successful English Composition Course Completion Predicted by TSIA‐W ... 41
Appendix D‐3: Expected Probability of Successful English Composition Course Completion Predicted by TSIA‐W for
WritePlacer Score of 4 ................................................................................................................................................. 43
Appendix D‐4: Expected Probability of Successful English Composition Course Completion Predicted by TSIA‐W for
Students with WritePlacer Score of 1‐8....................................................................................................................... 45
Appendix D‐5: Expected Probability of Successful English Composition Course Completion Predicted by TSIA‐W for
Students with WritePlacer Score of 2‐8....................................................................................................................... 47
Appendix D‐6: Expected Probability of Successful English Composition Course Completion Predicted by TSIA‐W for
Students with WritePlacer Score of 3‐8....................................................................................................................... 49
Appendix D‐7: Expected Probability of Successful English Composition Course Completion Predicted by TSIA‐W for
Students with WritePlacer Score of 4‐8....................................................................................................................... 51
Appendix D‐8: Expected Probability of Successful English Composition Course Completion Predicted by TSIA‐W for
Students with WritePlacer Score of 5‐8....................................................................................................................... 53
Appendix D‐9: Expected Probability of Successful English Composition Course Completion Predicted by TSIA‐W for
Students with WritePlacer Score of 6‐8....................................................................................................................... 55
3
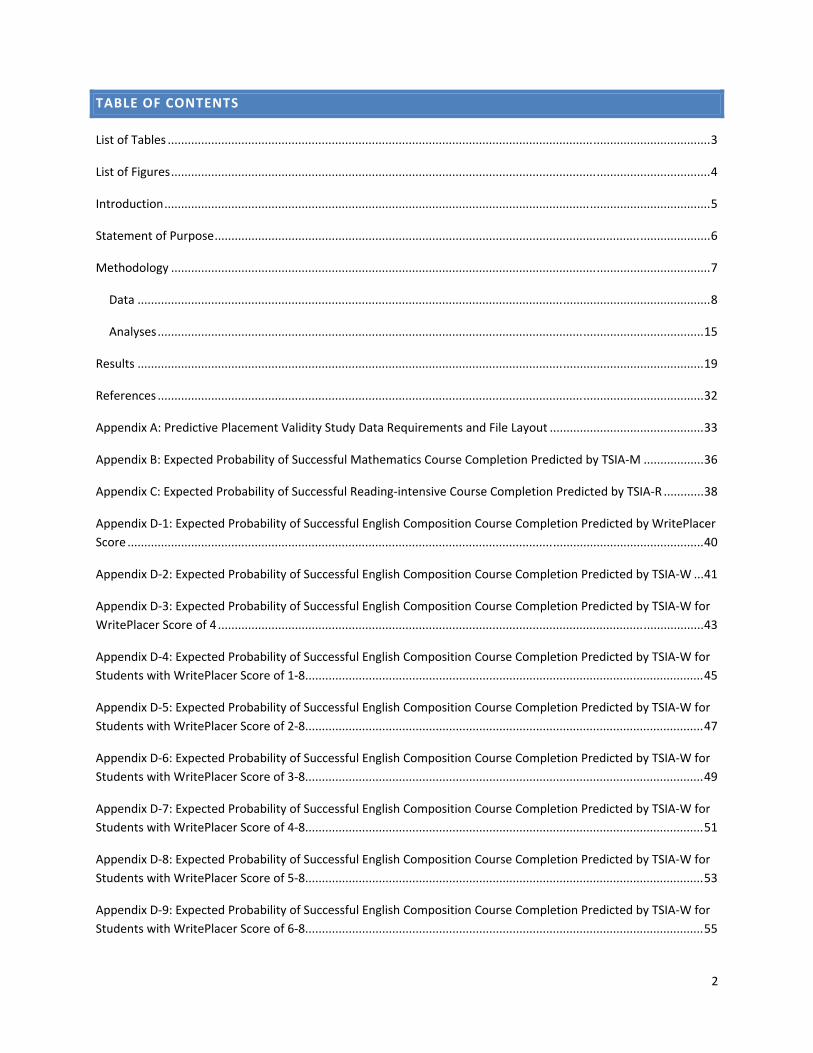
LIST OF TABLES
Table 1: Number of Records and Students for Each Semester ...................................................................................... 9
Table 2: Data Distribution Across Institution Types ...................................................................................................... 9
Table 3: Grade Distribution for Mathematics Courses ................................................................................................ 10
Table 4: Grade Distribution for Reading‐Intensive Courses ........................................................................................ 11
Table 5: Grade Distribution for English Composition Courses ..................................................................................... 12
Table 6: Descriptive Statistics for TSIA Placement Tests and WritePlacer Scores ....................................................... 13
Table 7: Percentage of Successful (C‐ or Higher) Students by TSIA Score ................................................................... 14
Table 8: Percentage of Successful (C‐ or Higher) Students by WritePlacer Score ....................................................... 15
Table 9: Frequencies of Multiple Course Grades for Individual Students ................................................................... 15
Table 10: Correlation Between TSIA and WritePlacer Scores and Success in Associated Courses .............................. 16
Table 11: Summary of Logistic Regression Analysis Performed .................................................................................. 17
Table 12: Summary of Results ..................................................................................................................................... 19
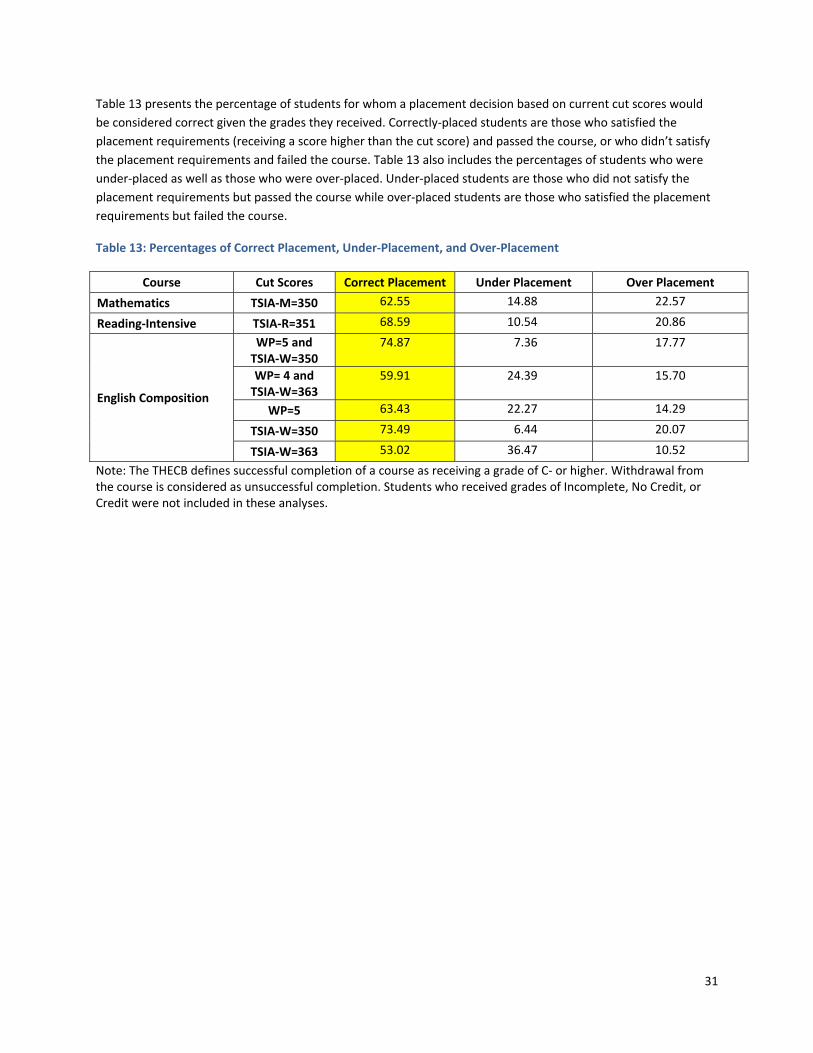
Table 13: Percentages of Correct Placement, Under‐Placement, and Over‐Placement ............................................. 31
4
LIST OF FIGURES
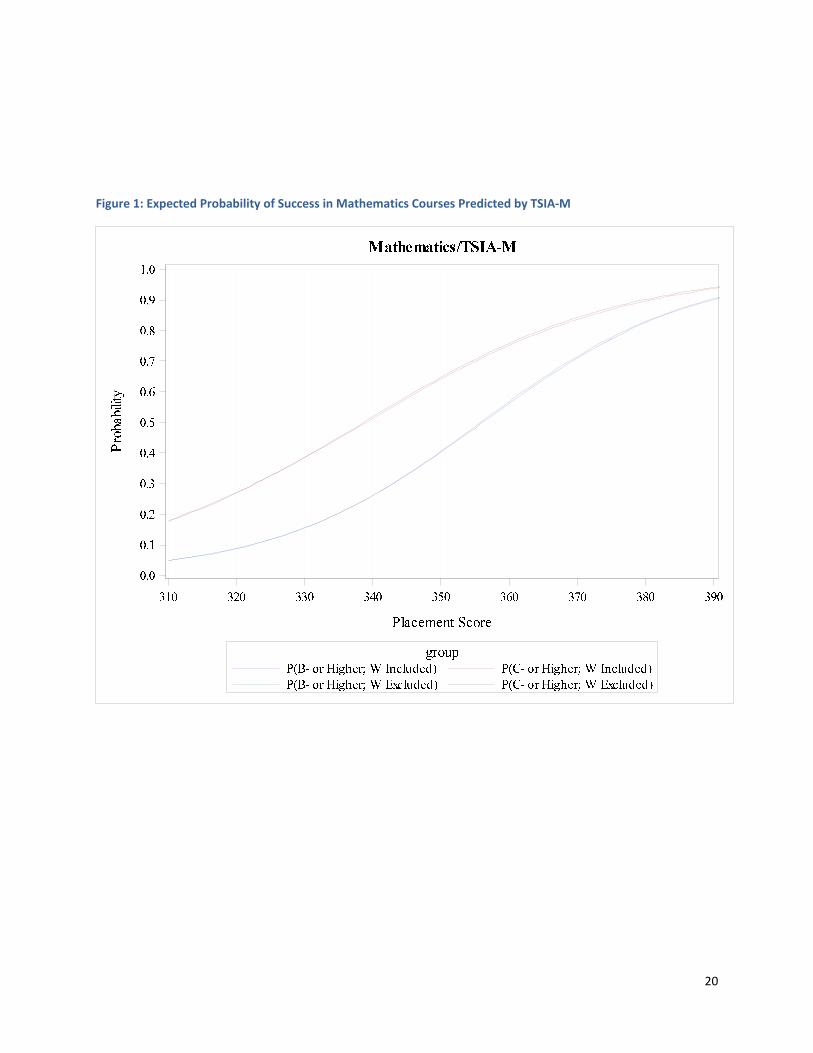
Figure 1: Expected Probability of Success in Mathematics Courses Predicted by TSIA‐M .......................................... 20
Figure 2: Expected Probability of Successful Reading‐Intensive Course Completion Predicted by TSIA‐R ................. 21
Figure 3: Expected Probability of Successful English Composition Course Completion Predicted by WritePlacer ..... 22
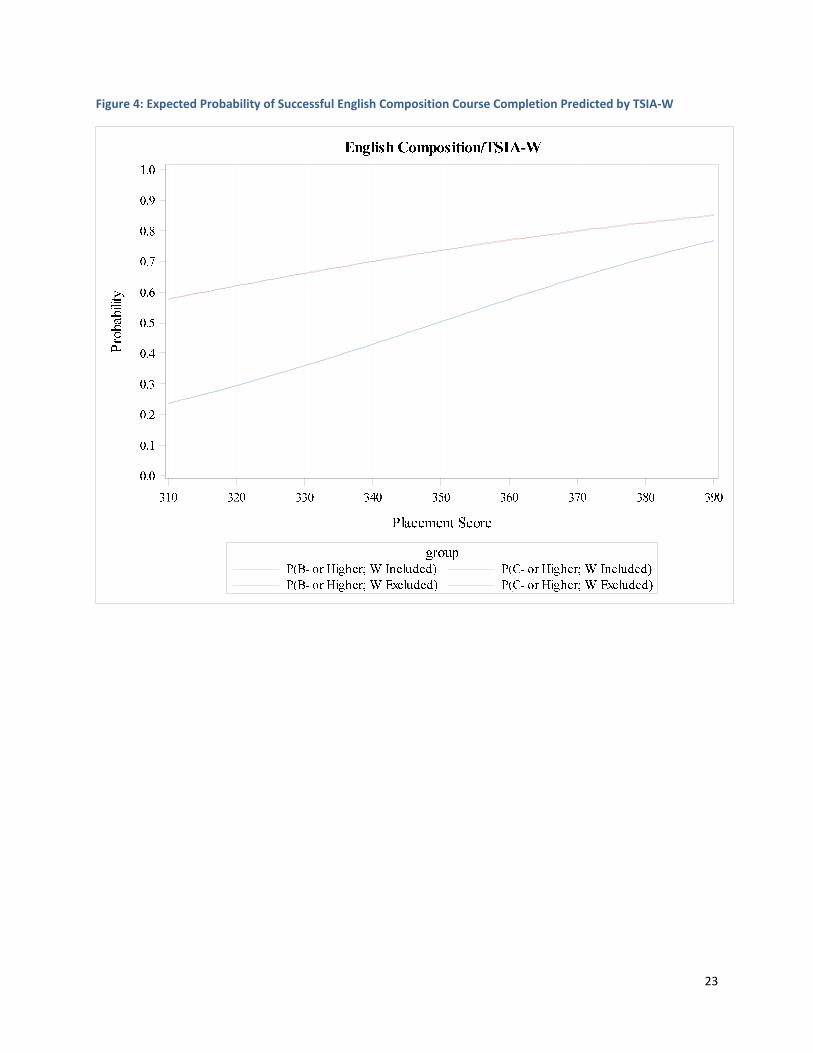
Figure 4: Expected Probability of Successful English Composition Course Completion Predicted by TSIA‐W ............ 23
Figure 5: Expected Probability of Successful English Composition Course Completion Predicted by TSIA‐W for
Students with WritePlacer Score of 4 .......................................................................................................................... 24
Figure 6: Expected Probability of Successful English Composition Course Completion Predicted by TSIA‐W for
Students with WritePlacer Score of 1 or Higher .......................................................................................................... 25
Figure 7: Expected Probability of Successful English Composition Course Completion Predicted by TSIA‐W for
Students with WritePlacer Score of 2 or Higher .......................................................................................................... 26
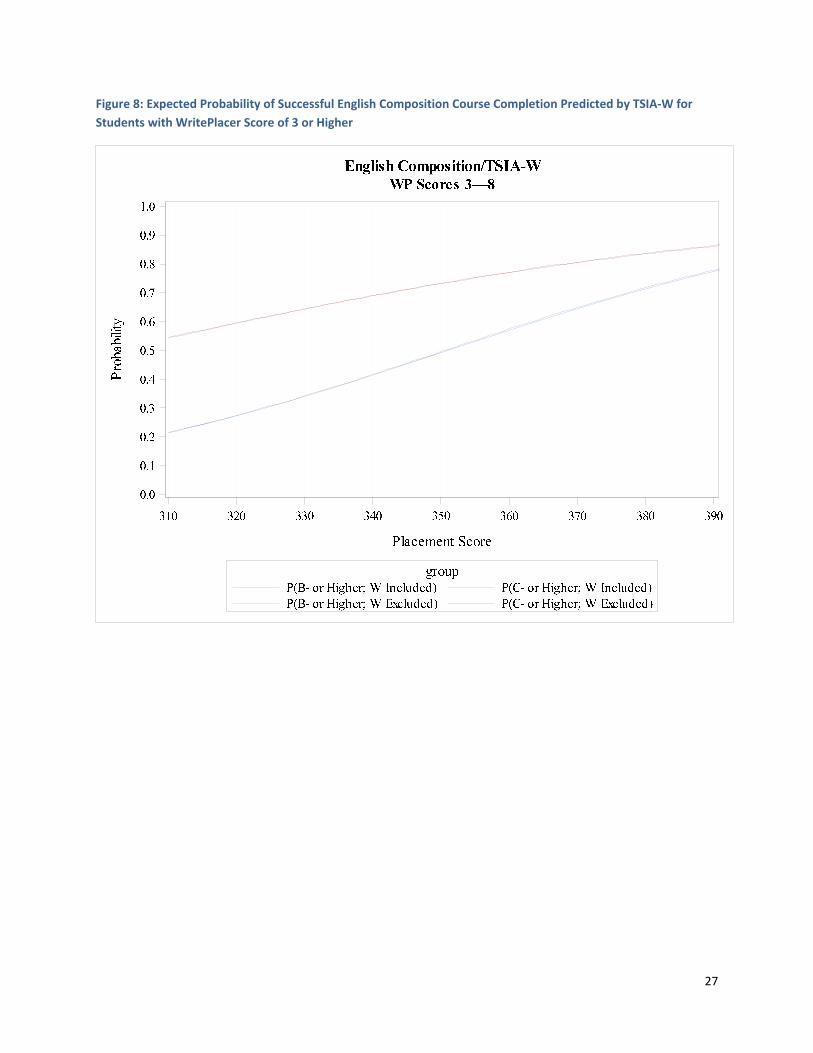
Figure 8: Expected Probability of Successful English Composition Course Completion Predicted by TSIA‐W for
Students with WritePlacer Score of 3 or Higher .......................................................................................................... 27
Figure 9: Expected Probability of Successful English Composition Course Completion Predicted by TSIA‐W for
Students with WritePlacer Score of 4 or Higher .......................................................................................................... 28
Figure 10: Expected Probability of Successful English Composition Course Completion Predicted by TSIA‐W for
Students with WritePlacer Score of 5 or Higher .......................................................................................................... 29
Figure 11: Expected Probability of Successful English Composition Course Completion Predicted by TSIA‐W for
Students with WritePlacer Score of 6 or Higher .......................................................................................................... 30

5
INTRODUCTION
In August 2013, the Texas Higher Education Coordinating Board (THECB) launched the Texas Success Initiative
Assessment (TSIA). The TSIA is designed to assess the academic skills of entering undergraduate students and
determine whether and at what level students are prepared to enroll and succeed in entry‐level college courses.
This state‐legislated assessment program was designed to improve student success in college by determining if
students are ready for college‐level course work in the general areas of reading, writing, and mathematics. Any
student who is not deemed college‐ready must be placed in a developmental education program designed to help
the student achieve college readiness. The law requires all entering college students to be assessed for college
readiness in reading, mathematics, and writing unless the student qualifies for an exemption. Students passing the
threshold for each exam are placed in entry‐level credit‐bearing courses.
The TSIA Mathematics Placement test measures skills in four content categories: Elementary Algebra and
Functions; Intermediate Algebra and Functions; Geometry and Measurement; and Data Analysis, Statistics, and
Probability. With scores ranging from 310 to 390, the threshold for placement is 350. That is, students who receive
scores of 350 or higher are placed in introductory credit‐bearing mathematics courses.
The TSIA Reading Placement test measures four content categories: Main Idea and Supporting Details, Author’s
Use of Language, Inferences in a Text or Texts, and Literary Analysis. The reported scores for this test also range
from 310 to 390. Students who receive scores of 351 or higher are considered ready for college level work and are
placed in introductory credit‐bearing reading‐intensive courses.
The TSIA Writing Placement multiple‐choice test measures four content categories: Sentence Structure,
Agreement, Sentence Logic, and Essay Revision. The reported scale for the TSIA Writing Placement test is from 310
to 390. Students who receive a score of 350 or higher on the multiple choice component were directed to take
WritePlacer which is the essay portion of the TSIA Writing test. Students who receive a WritePlacer score of 5 or
higher and a TSIA Writing Placement score of 350 or higher are placed in introductory English composition.
Students who scored 4 on WritePlacer and 363 or higher on the TSIA Writing Placement test were also placed in
introductory composition course.1
As part of the College Board’s contractual obligation to the THECB, the predictive placement validity of each of the
tests above is being investigated. The studies conducted here investigate the relationship between performance
on the assessments and success on the introductory credit‐bearing college courses for which the assessments are
used for placement.
While validity studies can be very informative about how well test score(s) are able to predict success in a
subsequent course, there are some cautions to keep in mind. Prediction of success using logistic regression can be
influenced by a number of factors which are often hard to identify and/or explain without in depth investigation.
Among these is the integrity of the criterion used in the prediction equation, such as course grade. Grades are
known to have a high degree of variability among instructors in how the grades are assigned and the frequency
with which an instructor may assign one grade versus another. The criterion can become more confounded and
difficult to predict when composed of grades from multiple courses in addition to multiple instructors due to the
greater variance in course content and coverage.
1 Students who score lower than 350 on TSIA‐W are directed to take ABE Writing. Those who score 4, 5, or 6 on ABE Writing were further directed to take WritePlacer. A score of 4 or higher on WritePlacer placed those students in an introductory composition course. This placement decision is not part of the study. Data provided by the THECB only contain ABE Writing for one semester out of the four, with only 61 records containing ABE Writing scores.
6
Another influential factor is the presence of an intervening course of treatment between the test administration
that results in a score being used as a predictor and matriculation to the course for which the grade serves as the
criterion. As the time between test administration and course matriculation increases, the potential that additional
learning is occurring also increases such that, by the time the student enrolls in the course, it is possible that the
student’s level of knowledge is greater than what was demonstrated at the time of test administration. Intervening
courses and treatments skew the relationship between the test score being used as a predictor and the course
grade‐‐resulting in less predictive ability when combined with data from other examinees that may or may not
have also had an intervening treatment. Due to the possible bias that can be introduced into the predictive
relationship when course matriculation occurs in a time frame that is significantly removed from the time of
testing, it is ideal to keep the distance between testing time and course matriculation as short as possible.
Student motivation can also play an important role in the predictive relationship between test scores and course
grades. An unmotivated examinee may have two possible outcomes. First, ideally the examinee performs at an
acceptable level and is accurately placed into a course where the examinee is successful; this is the desired
outcome. Alternatively, the examinee may be placed into a course which is not a good fit for their level of ability,
most likely placed below the optimal level. The examinee has under‐performed on the exam and earns a high
grade (Low Score, High Grade). This second scenario (Low Score, High Grade) can seriously decrease the predictive
relationship. A third possibility that sometimes occurs is when a student professes to have been unmotivated or
not performed as well as they are capable. Thus a “waiver” can occur at the discretion of the local institution. At
times a student may successfully lobby to be admitted to a class despite not earning the test score required due to
numerous possible rationales. As a result the inclusion of students in a course for which they did not achieve a
qualifying placement score can also introduce bias and decrease the power of the predictive relationship,
especially if the student is then able to be successful in the course which again results in the Low Score, High Grade
scenario.
While all of the above factors are potential threats to the predictive relationship, all require a level of investigation
to completely identify and untangle that are beyond what is possible when viewing a single set of data. A more in‐
depth review of course syllabus, grading policies across instructors, intervening course work or developmental
studies, and waiver of placement decisions would need to be conducted to fully explain the factors that may
contribute to a predictive relationship between test score and course grade. In addition, numerous other factors
not considered here may also be a threat to the predictive relationship.
The following sections of the document state the purpose of the study, describe the data used, detail the analysis
performed, and discuss the results of the study. Some details of the results are provided in the appendices.
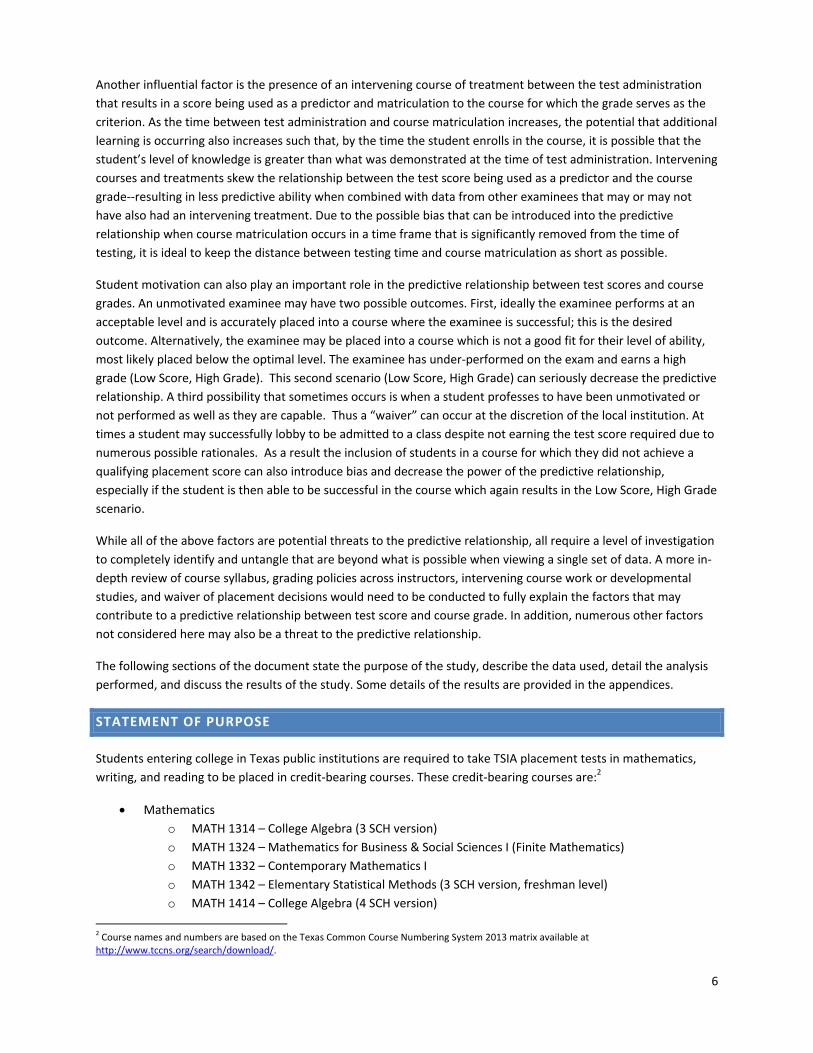
STATEMENT OF PURPOSE
Students entering college in Texas public institutions are required to take TSIA placement tests in mathematics,
writing, and reading to be placed in credit‐bearing courses. These credit‐bearing courses are:2
Mathematics
o MATH 1314 – College Algebra (3 SCH version)
o MATH 1324 – Mathematics for Business & Social Sciences I (Finite Mathematics)
o MATH 1332 – Contemporary Mathematics I
o MATH 1342 – Elementary Statistical Methods (3 SCH version, freshman level)
o MATH 1414 – College Algebra (4 SCH version)
2 Course names and numbers are based on the Texas Common Course Numbering System 2013 matrix available at http://www.tccns.org/search/download/.

7
English Composition
o ENGL 1301 – Composition I
o ENGL 1302 – Composition II
Reading‐Intensive
o GOVT 2301 – American Government I (Federal & Texas constitutions)
o GOVT 2302 – American Government II (Federal and Texas Topics)
o GOVT 2305 – Federal Government (Federal Const & Topics)
o GOVT 2306 – Texas Government (Texas Const & Topics)
o HIST 1301 – United States History I
o HIST 1302 – United States History II
o HUMA 1301 – Introduction to the Humanities I
o PHIL 1301 – Introduction to Philosophy
o PSYC 2301 – General Psychology
o SOCI 1301 – Introductory Sociology
The current TSIA cut scores approved by the THECB are as follows:3
Mathematics — 350
Reading — 351
Writing
o Essay Score of 5 and Multiple Choice Score of 350, or
o Essay Score of 4 and Multiple Choice Score of 363
The purpose of the study is to determine the relationship between TSIA test scores and success in the introductory
credit‐bearing college courses listed above. Furthermore, the study will compute the probability of success
associated with the current cut scores. Results of the study aim to provide to the THECB information that could
help confirm or improve its current course placement policies.
METHODOLOGY
To determine the relationship between TSIA placement test scores and success in college courses, the biserial
correlation between scores and success in associated courses are computed. To compute probability of success
associated with current cut scores, a model‐based method (i.e., logistic regression) was used to derive the
probability of success in mathematics, English composition, and reading‐intensive courses associated with the
respective placement cut scores. Logistic regression is a statistical method that uses binary outcome information
(e.g., success versus failure) to predict the probability of success based on one or more predictor variables.
The logistic regression model
ii
ie scoreTSIASlopeIntercept
p
p
1
log (1)
provides the expected probabilities of success, pi, in a course given a TSIA test score. In accordance with the
THECB’s placement policies, logistic regression models were built to predict probability of succeeding in
mathematics and reading‐intensive course using TSIA mathematics and reading placement tests, respectively, as
3 From the TSIA Program Manual (2014, The College Board).

8
predictors. Each of TSIA Writing placement test and WritePlacer was used as predictor for success in English
composition course. A separate logistic regression model was built to predict success in English composition
courses for students who receive a WritePlacer score of 4. Additionally, a logistic regression model was fitted for
predicting success in English composition using TSIA writing given different levels of performance in WritePlacer:
o WritePlacer score of 1‐8
o WritePlacer score of 2‐8
o WritePlacer score of 3‐8
o WritePlacer score of 4‐8
o WritePlacer score of 5‐8
o WritePlacer score of 6‐8
Sample sizes for students with WP score of 7‐8 and students with WP score of 8 are not large enough (less than
200 records) to obtain reliable regression estimates, thus analyses for these two subsets are not included in this
report.
DATA
Student course grade data used for this study were prepared by the THECB based on the data requirements
document provided by The College Board. This document (see Appendix A) included a file layout that specifies all
the data elements that will be used for the analysis. Included in the data file are first time first year students in TX
public higher education institutions in fall 2013, spring 2014, summer 2014, and fall 2014.
The student course grades data, with one student record per course taken, consist of 21,197 records. This data set
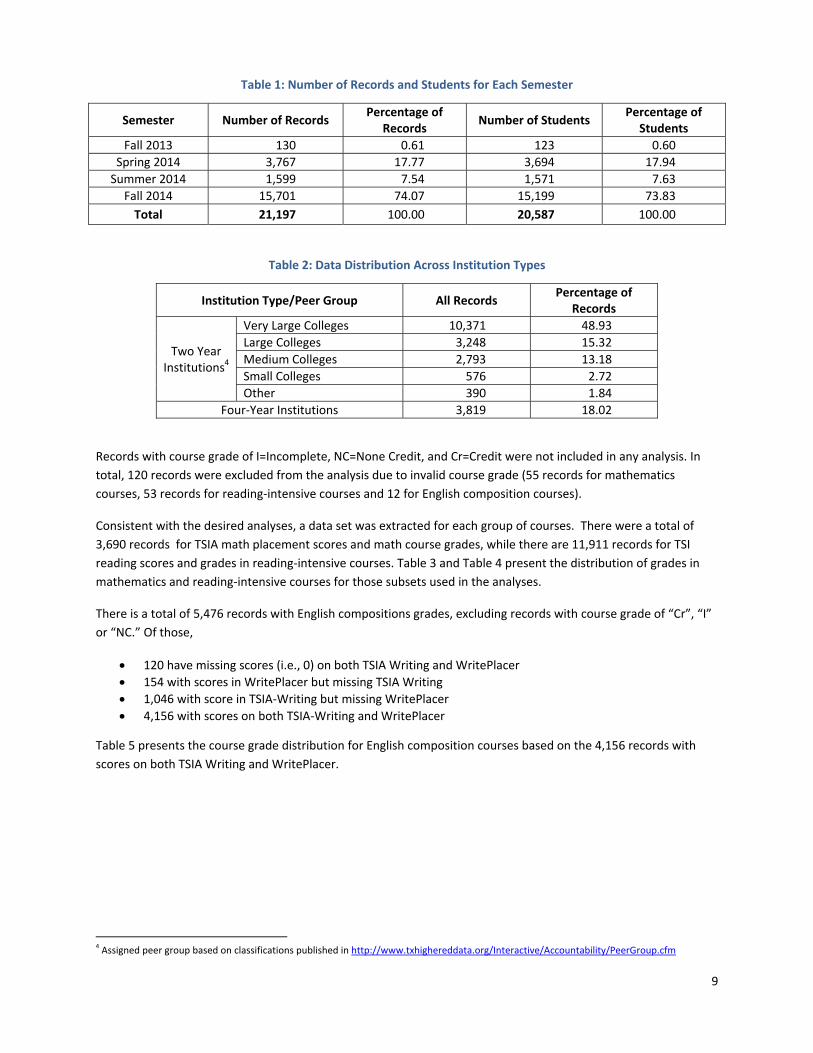
consists of 20,587 unique students. The distribution of the data across semesters is presented in Table 1 and the
distribution of the data per the type of institution is presented in Table 2. Note that a high proportion of the data is
from the Fall 2014 semester, and two year institutions, while a very low proportion of the data is from the Fall
2013 semester, which was when the TSIA was launched.
9
Table 1: Number of Records and Students for Each Semester
Semester Number of Records Percentage of
Records Number of Students
Percentage of Students
Fall 2013 130 0.61 123 0.60
Spring 2014 3,767 17.77 3,694 17.94
Summer 2014 1,599 7.54 1,571 7.63
Fall 2014 15,701 74.07 15,199 73.83
Total 21,197 100.00 20,587 100.00
Table 2: Data Distribution Across Institution Types
Institution Type/Peer Group All Records Percentage of
Records
Two Year Institutions4
Very Large Colleges 10,371 48.93
Large Colleges 3,248 15.32
Medium Colleges 2,793 13.18
Small Colleges 576 2.72
Other 390 1.84
Four‐Year Institutions 3,819 18.02
Records with course grade of I=Incomplete, NC=None Credit, and Cr=Credit were not included in any analysis. In
total, 120 records were excluded from the analysis due to invalid course grade (55 records for mathematics
courses, 53 records for reading‐intensive courses and 12 for English composition courses).
Consistent with the desired analyses, a data set was extracted for each group of courses. There were a total of
3,690 records for TSIA math placement scores and math course grades, while there are 11,911 records for TSI
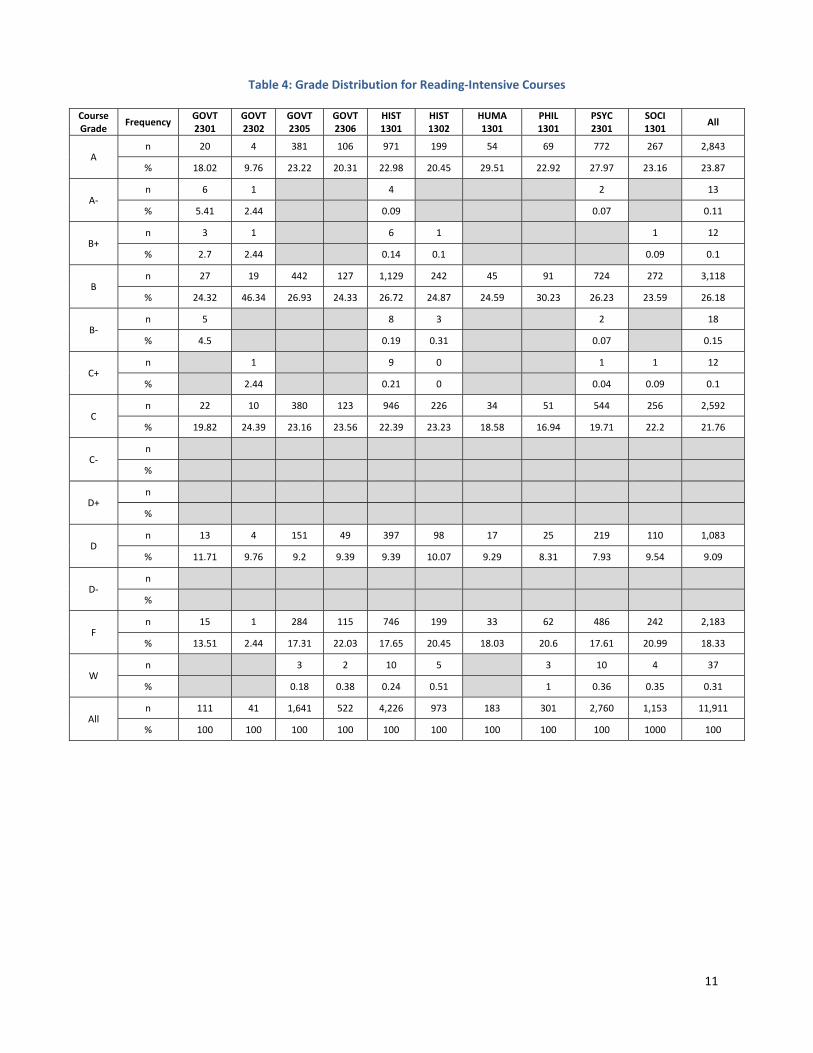
reading scores and grades in reading‐intensive courses. Table 3 and Table 4 present the distribution of grades in
mathematics and reading‐intensive courses for those subsets used in the analyses.
There is a total of 5,476 records with English compositions grades, excluding records with course grade of “Cr”, “I”
or “NC.” Of those,
120 have missing scores (i.e., 0) on both TSIA Writing and WritePlacer
154 with scores in WritePlacer but missing TSIA Writing
1,046 with score in TSIA‐Writing but missing WritePlacer
4,156 with scores on both TSIA‐Writing and WritePlacer
Table 5 presents the course grade distribution for English composition courses based on the 4,156 records with
scores on both TSIA Writing and WritePlacer.
4 Assigned peer group based on classifications published in http://www.txhighereddata.org/Interactive/Accountability/PeerGroup.cfm

10
Table 3: Grade Distribution for Mathematics Courses
Course Grade
Frequency MATH 1314 MATH 1324 MATH 1332 MATH 1342 MATH 1414 All
A n 499 104 105 40 67 815
% 21.47 25.94 20.51 19.51 27.02 22.09
A‐ n
%
B+ n
%
B n 529 90 114 38 43 814
% 22.76 22.44 22.27 18.54 17.34 22.06
B‐ n 2 2
% 0.09 0.05
C+ n 4 4
% 0.17 0.11
C n 485 92 125 46 43 791
% 20.87 22.94 24.41 22.44 17.34 21.44
C‐ n
%
D+ n
%
D n 266 42 64 28 29 429
% 11.45 10.47 12.5 13.66 11.69 11.63
D‐ n 1 1
% 0.2 0.03
F n 515 67 102 50 64 798
% 22.16 16.71 19.92 24.39 25.81 21.63
W n 24 6 1 3 2 36
% 1.03 1.5 0.2 1.46 0.81 0.98
All n 2,324 401 512 205 248 3,690
% 100 100 100 100 100 100
11
Table 4: Grade Distribution for Reading‐Intensive Courses
Course Grade
Frequency GOVT 2301
GOVT 2302
GOVT 2305
GOVT 2306
HIST 1301
HIST 1302
HUMA 1301
PHIL 1301
PSYC 2301
SOCI 1301
All
A n 20 4 381 106 971 199 54 69 772 267 2,843
% 18.02 9.76 23.22 20.31 22.98 20.45 29.51 22.92 27.97 23.16 23.87
A‐ n 6 1 4 2 13
% 5.41 2.44 0.09 0.07 0.11
B+ n 3 1 6 1 1 12
% 2.7 2.44 0.14 0.1 0.09 0.1
B n 27 19 442 127 1,129 242 45 91 724 272 3,118
% 24.32 46.34 26.93 24.33 26.72 24.87 24.59 30.23 26.23 23.59 26.18
B‐ n 5 8 3 2 18
% 4.5 0.19 0.31 0.07 0.15
C+ n 1 9 0 1 1 12
% 2.44 0.21 0 0.04 0.09 0.1
C n 22 10 380 123 946 226 34 51 544 256 2,592
% 19.82 24.39 23.16 23.56 22.39 23.23 18.58 16.94 19.71 22.2 21.76
C‐ n
%
D+ n
%
D n 13 4 151 49 397 98 17 25 219 110 1,083
% 11.71 9.76 9.2 9.39 9.39 10.07 9.29 8.31 7.93 9.54 9.09
D‐ n
%
F n 15 1 284 115 746 199 33 62 486 242 2,183
% 13.51 2.44 17.31 22.03 17.65 20.45 18.03 20.6 17.61 20.99 18.33
W n 3 2 10 5 3 10 4 37
% 0.18 0.38 0.24 0.51 1 0.36 0.35 0.31
All n 111 41 1,641 522 4,226 973 183 301 2,760 1,153 11,911
% 100 100 100 100 100 100 100 100 100 1000 100

12
Table 5: Grade Distribution for English Composition Courses
Course Grade Frequency ENGL 1301 ENGL 1302 All
A n 1,177 22 1,199
% 28.76 34.38 28.85
A‐ n 6 6
% 0.15 0.14
B+ n 11 11
% 0.27 0.26
B n 1,193 20 1,213
% 29.15 31.25 29.19
B‐ n 1 1
% 0.02 0.02
C+ n 1 1
% 0.02 0.02
C n 770 9 779
% 18.82 14.06 18.74
C‐ n 4 4
% 0.1 0.1
D+ n 1 1
% 0.02 0.02
D n 278 3 281
% 6.79 4.69 6.76
D‐ n
%
F n 644 9 653
% 15.74 14.06 15.71
W n 6 1 7
% 0.15 1.56 0.17
All n 4,092 64 4,156
% 100 100 100
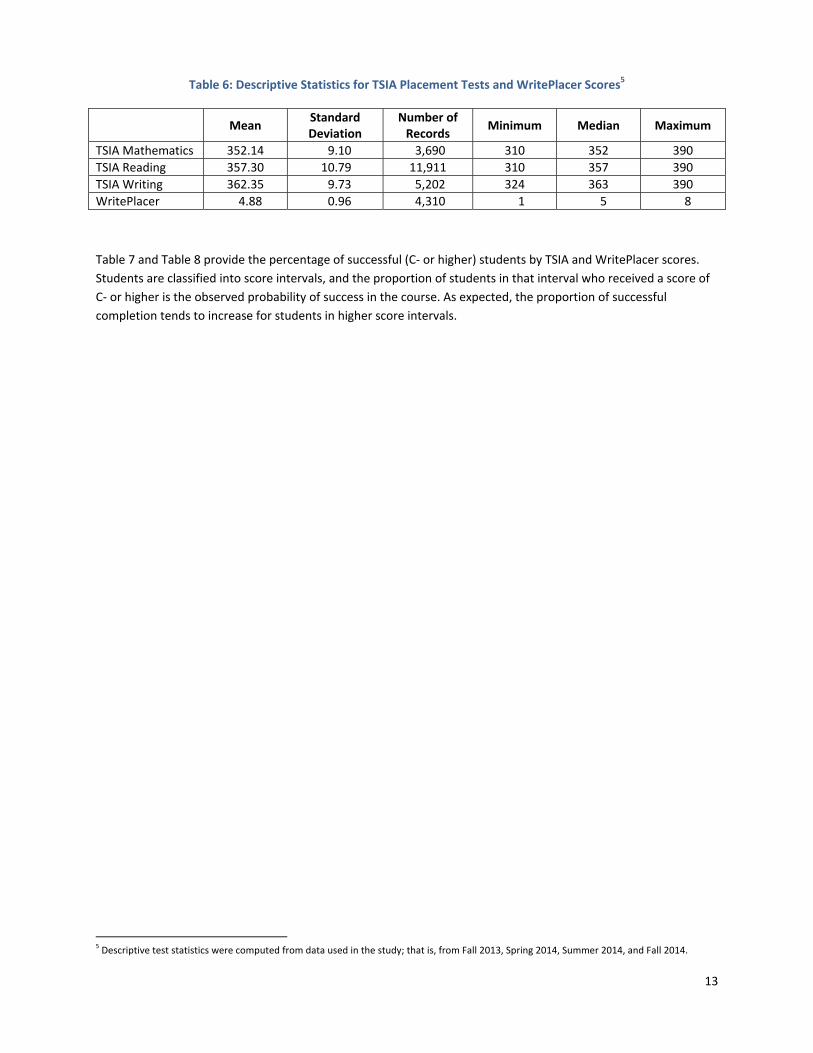
Average TSIA test scores for the extracted subsets are 351.98 for TSIA mathematics, 357.27 for TSIA reading,
362.35 for TSIA writing (based on records having none‐zero writing placement score) and 4.88 for WritePlacer
(based on records having none‐zero WritePlacer score, respectively). Standard deviation, minimum, median, and
maximum scores for each subset are also shown in Table 6.
13
Table 6: Descriptive Statistics for TSIA Placement Tests and WritePlacer Scores5
Mean Standard Deviation
Number of Records
Minimum Median Maximum
TSIA Mathematics 352.14 9.10 3,690 310 352 390
TSIA Reading 357.30 10.79 11,911 310 357 390
TSIA Writing 362.35 9.73 5,202 324 363 390
WritePlacer 4.88 0.96 4,310 1 5 8
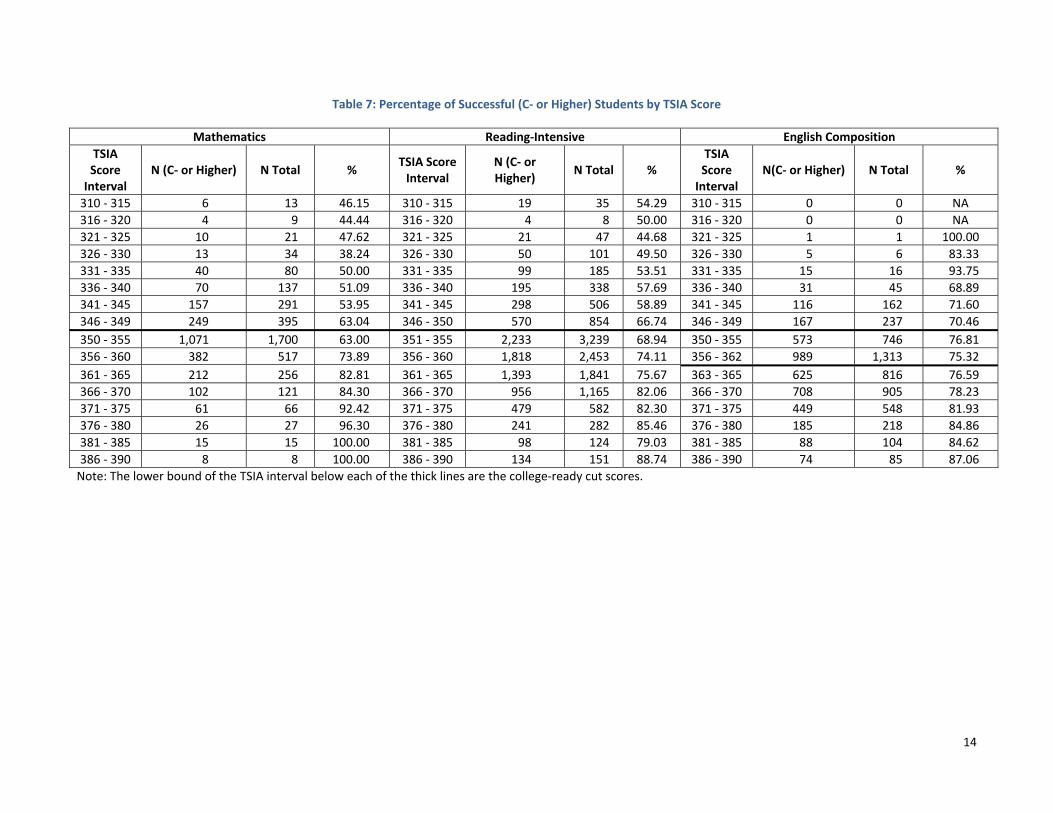
Table 7 and Table 8 provide the percentage of successful (C‐ or higher) students by TSIA and WritePlacer scores.
Students are classified into score intervals, and the proportion of students in that interval who received a score of
C‐ or higher is the observed probability of success in the course. As expected, the proportion of successful
completion tends to increase for students in higher score intervals.
5 Descriptive test statistics were computed from data used in the study; that is, from Fall 2013, Spring 2014, Summer 2014, and Fall 2014.
14
Table 7: Percentage of Successful (C‐ or Higher) Students by TSIA Score
Mathematics Reading‐Intensive English Composition
TSIA Score Interval
N (C‐ or Higher) N Total % TSIA Score Interval
N (C‐ or Higher)
N Total % TSIA Score Interval
N(C‐ or Higher) N Total %
310 ‐ 315 6 13 46.15 310 ‐ 315 19 35 54.29 310 ‐ 315 0 0 NA
316 ‐ 320 4 9 44.44 316 ‐ 320 4 8 50.00 316 ‐ 320 0 0 NA
321 ‐ 325 10 21 47.62 321 ‐ 325 21 47 44.68 321 ‐ 325 1 1 100.00
326 ‐ 330 13 34 38.24 326 ‐ 330 50 101 49.50 326 ‐ 330 5 6 83.33
331 ‐ 335 40 80 50.00 331 ‐ 335 99 185 53.51 331 ‐ 335 15 16 93.75
336 ‐ 340 70 137 51.09 336 ‐ 340 195 338 57.69 336 ‐ 340 31 45 68.89
341 ‐ 345 157 291 53.95 341 ‐ 345 298 506 58.89 341 ‐ 345 116 162 71.60
346 ‐ 349 249 395 63.04 346 ‐ 350 570 854 66.74 346 ‐ 349 167 237 70.46
350 ‐ 355 1,071 1,700 63.00 351 ‐ 355 2,233 3,239 68.94 350 ‐ 355 573 746 76.81
356 ‐ 360 382 517 73.89 356 ‐ 360 1,818 2,453 74.11 356 ‐ 362 989 1,313 75.32
361 ‐ 365 212 256 82.81 361 ‐ 365 1,393 1,841 75.67 363 ‐ 365 625 816 76.59
366 ‐ 370 102 121 84.30 366 ‐ 370 956 1,165 82.06 366 ‐ 370 708 905 78.23
371 ‐ 375 61 66 92.42 371 ‐ 375 479 582 82.30 371 ‐ 375 449 548 81.93
376 ‐ 380 26 27 96.30 376 ‐ 380 241 282 85.46 376 ‐ 380 185 218 84.86
381 ‐ 385 15 15 100.00 381 ‐ 385 98 124 79.03 381 ‐ 385 88 104 84.62
386 ‐ 390 8 8 100.00 386 ‐ 390 134 151 88.74 386 ‐ 390 74 85 87.06
Note: The lower bound of the TSIA interval below each of the thick lines are the college‐ready cut scores.

15
Table 8: Percentage of Successful (C‐ or Higher) Students by WritePlacer Score
WritePlacer Score N (C‐ or Higher) N Total %
1 6 8 75.00
2 22 29 75.86
3 138 218 63.30
4 794 1,072 74.07
5 1,649 2,110 78.15
6 560 691 81.04
7 108 124 87.10
8 50 58 86.21
Note: The low number of test takers with a score below 4 on WritePlacer should be interpreted with cautions, as most students with these scores did not appear in a college‐level course, thus, were not included in the dataset for this study .
Data sets extracted for each course group contains multiple records for students who took multiple courses with
different TCCN number. All of their grades in those courses were included in the analysis. Table 9 provides
information on the number of students with grades in multiple courses in each data set used for the analyses.
There were only four students in the mathematics data set who took two of the five mathematics courses and four
in the English composition data set who took both English composition courses. There was no student in the
mathematics data set who took more than two courses. For reading‐intensive courses, one student took four, 14
students took three, and 159 students took two, of the 10 reading‐intensive courses.
Table 9: Frequencies of Multiple Course Grades for Individual Students
Number of Course Grades Mathematics Reading‐intensive English Composition
One 3,682 11,547 4,148
Two 4 159 4
Three 14
Four 1
ANALYSES
Of primary interest to the THECB is the probability of success associated with each cut score. Specifically, these are
as follows:
Probability of successful completion of first semester credit‐bearing mathematics courses associated with
TSIA‐M score of 350
Probability of successful completion of first semester credit‐bearing reading‐intensive courses associated
with TSIA ‐R score of 351
Probability of successful completion of first semester credit‐bearing English composition courses
associated with WritePlacer score of 5 or higher and TSIA‐W score of 350
Probability of successful completion of first semester credit‐bearing English composition courses
associated with WritePlacer score of 4 and TSIA‐W score of 363
The THECB defines successful completion of a course as receiving a grade of C‐ or higher. Withdrawal from the
course is considered as unsuccessful completion. Students who received grades of I=Incomplete, NC=None Credit,
and Cr=Credit were not included in any of the analyses. Biserial correlations were computed and logistic regression

16
models were fit to the data based on these rules. To provide the THECB additional comparative information,
additional correlations were computed further logistic regression models were built to consider
successful completion of a course is receiving a grade of B‐ or higher
not including withdrawals in the analyses (i.e., removing from the data sets)
Biseral correlations were computed between the TSIA and WritePlacer scores and success in a course and
presented in Table 10. For computing these correlations, withdrawal from the course is considered an unsuccessful
completion.
Table 10: Correlation Between TSIA and WritePlacer Scores and Success in Associated Courses
Test Course Grade (C‐ or Higher)
Course Grade(B‐ or Higher)
TSIA Mathematics 0.21 0.26
TSIA Reading 0.16 0.20
TSIA Writing 0.07 0.14
WritePlacer 0.09 0.13
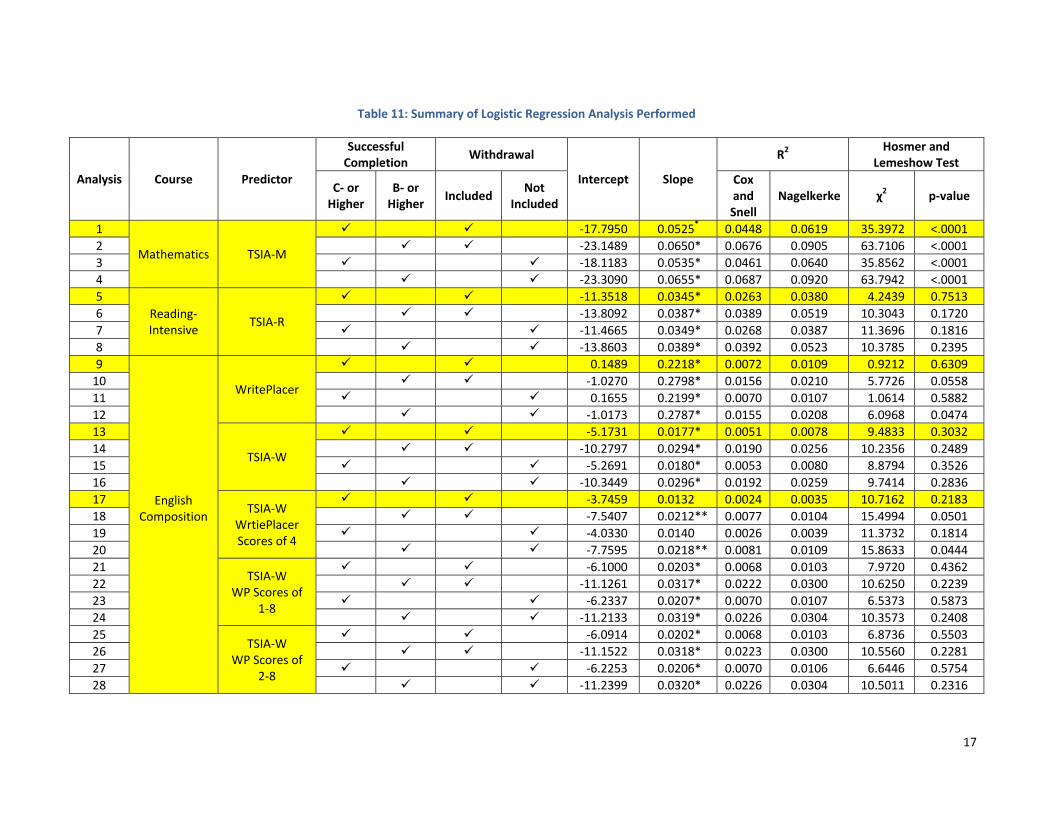
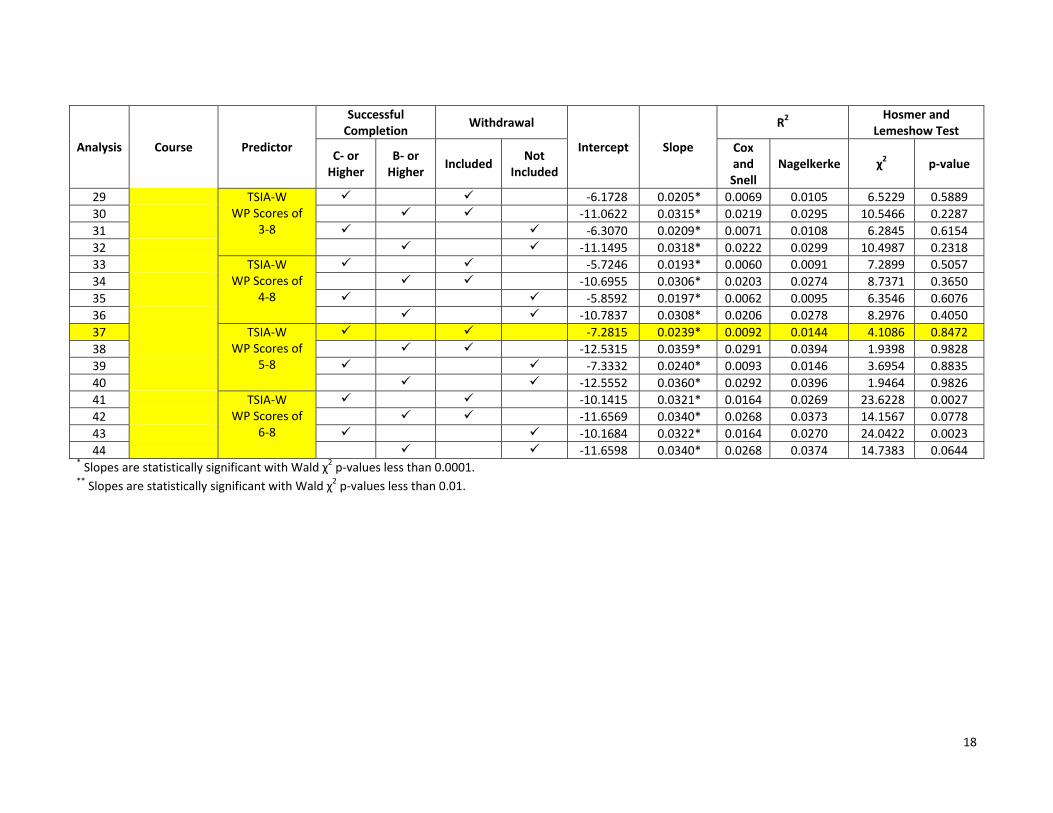
The summary of logistic regression analyses performed for this study is presented in Table 11 for mathematics,
reading‐intensive, and English composition courses where a logistic regression model is appropriately fitted to the
data. Analyses 1, 5, 9, 13, 17, and 37 highlighted on the table are the obligatory analyses while results from other
analyses provide comparative information. The intercept and slope of the fitted logistic regression model for each
analysis are also included in Table 11. Along with the slope and intercept coefficients are model‐fit indicators that
show how well the regression models fit the observed data. Two estimates of R2 (Cox and Snell (1989) R2 and
Nagelkerke (1991) R2) are provided in Table 11. The Nagelkerke R2 estimate rescales the Cox and Snell R2 value to
obtain an upper bound of 1.00. Higher values indicate better model fit because more of the variance in the
outcome (successful course completion) can be accounted for by variance in the predictor score. The Pearson χ2
statistic for the Hosmer‐Lemeshow (H‐L) test, which tests the extent to which the fitted model reproduces the
observed data, is also provided for each model. When the probability of the χ2 is greater than .05 (p > .05), it is
considered indicative that the model fits the data well. The slope estimate, R2, and χ2 are commonly used indices
to assess model fit. The THECB might consider these statistics in deciding which model is best or if it chooses to
adjust placement cut scores. Caution is highly encouraged in interpreting the results of the Hosmer and Lemeshow
test as the χ2 is highly sensitive to fairly small fit discrepancies in large samples.
The TSIA test score is a statistically significant predictor of successful completion of the course with a Wald χ2 value
that corresponds to a p‐value less than 0.0001 for mathematics and reading‐intensive, and the WritePlacer score is
a statistically significant predictor of successful completion of the course with a Wald χ2value that corresponds to a
p‐value less than 0.01 for English composition. For students who receive a WritePlacer score of 4, TSIA‐W is not a
statistically significant predictor of successful completion of the course when defining successful completion of a
course as receiving a grade of C‐ or higher. However, when defining successful completion of a course as receiving
a grade of B‐ or higher, TSIA‐W is a statistically significant predictor of successful completion of the course with a
Wald χ2 value that corresponds to a p‐value less than 0.01 for students who receive a WritePacer score of 4.
17
Table 11: Summary of Logistic Regression Analysis Performed
Analysis Course Predictor
Successful Completion
Withdrawal
Intercept Slope
R2 Hosmer and Lemeshow Test
C‐ or Higher
B‐ or Higher
Included Not
Included
Cox and Snell
Nagelkerke χ2 p‐value
1
Mathematics TSIA‐M
‐17.7950 0.0525* 0.0448 0.0619 35.3972 <.0001
2 ‐23.1489 0.0650* 0.0676 0.0905 63.7106 <.0001
3 ‐18.1183 0.0535* 0.0461 0.0640 35.8562 <.0001
4 ‐23.3090 0.0655* 0.0687 0.0920 63.7942 <.0001
5
Reading‐Intensive
TSIA‐R
‐11.3518 0.0345* 0.0263 0.0380 4.2439 0.7513
6 ‐13.8092 0.0387* 0.0389 0.0519 10.3043 0.1720
7 ‐11.4665 0.0349* 0.0268 0.0387 11.3696 0.1816
8 ‐13.8603 0.0389* 0.0392 0.0523 10.3785 0.2395
9
English Composition
WritePlacer
0.1489 0.2218* 0.0072 0.0109 0.9212 0.6309
10 ‐1.0270 0.2798* 0.0156 0.0210 5.7726 0.0558
11 0.1655 0.2199* 0.0070 0.0107 1.0614 0.5882
12 ‐1.0173 0.2787* 0.0155 0.0208 6.0968 0.0474
13
TSIA‐W
‐5.1731 0.0177* 0.0051 0.0078 9.4833 0.3032
14 ‐10.2797 0.0294* 0.0190 0.0256 10.2356 0.2489
15 ‐5.2691 0.0180* 0.0053 0.0080 8.8794 0.3526
16 ‐10.3449 0.0296* 0.0192 0.0259 9.7414 0.2836
17 TSIA‐W
WrtiePlacer Scores of 4
‐3.7459 0.0132 0.0024 0.0035 10.7162 0.2183
18 ‐7.5407 0.0212** 0.0077 0.0104 15.4994 0.0501
19 ‐4.0330 0.0140 0.0026 0.0039 11.3732 0.1814
20 ‐7.7595 0.0218** 0.0081 0.0109 15.8633 0.0444
21 TSIA‐W
WP Scores of 1‐8
‐6.1000 0.0203* 0.0068 0.0103 7.9720 0.4362
22 ‐11.1261 0.0317* 0.0222 0.0300 10.6250 0.2239
23 ‐6.2337 0.0207* 0.0070 0.0107 6.5373 0.5873
24 ‐11.2133 0.0319* 0.0226 0.0304 10.3573 0.2408
25 TSIA‐W
WP Scores of 2‐8
‐6.0914 0.0202* 0.0068 0.0103 6.8736 0.5503
26 ‐11.1522 0.0318* 0.0223 0.0300 10.5560 0.2281
27 ‐6.2253 0.0206* 0.0070 0.0106 6.6446 0.5754
28 ‐11.2399 0.0320* 0.0226 0.0304 10.5011 0.2316
18
Analysis Course Predictor
Successful Completion
Withdrawal
Intercept Slope
R2 Hosmer and Lemeshow Test
C‐ or Higher
B‐ or Higher
Included Not
Included
Cox and Snell
Nagelkerke χ2 p‐value
29 TSIA‐W WP Scores of
3‐8
‐6.1728 0.0205* 0.0069 0.0105 6.5229 0.5889
30 ‐11.0622 0.0315* 0.0219 0.0295 10.5466 0.2287
31 ‐6.3070 0.0209* 0.0071 0.0108 6.2845 0.6154
32 ‐11.1495 0.0318* 0.0222 0.0299 10.4987 0.2318
33 TSIA‐W WP Scores of
4‐8
‐5.7246 0.0193* 0.0060 0.0091 7.2899 0.5057
34 ‐10.6955 0.0306* 0.0203 0.0274 8.7371 0.3650
35 ‐5.8592 0.0197* 0.0062 0.0095 6.3546 0.6076
36 ‐10.7837 0.0308* 0.0206 0.0278 8.2976 0.4050
37 TSIA‐W WP Scores of
5‐8
‐7.2815 0.0239* 0.0092 0.0144 4.1086 0.8472
38 ‐12.5315 0.0359* 0.0291 0.0394 1.9398 0.9828
39 ‐7.3332 0.0240* 0.0093 0.0146 3.6954 0.8835
40 ‐12.5552 0.0360* 0.0292 0.0396 1.9464 0.9826
41 TSIA‐W WP Scores of
6‐8
‐10.1415 0.0321* 0.0164 0.0269 23.6228 0.0027
42 ‐11.6569 0.0340* 0.0268 0.0373 14.1567 0.0778
43 ‐10.1684 0.0322* 0.0164 0.0270 24.0422 0.0023
44 ‐11.6598 0.0340* 0.0268 0.0374 14.7383 0.0644* Slopes are statistically significant with Wald χ2 p‐values less than 0.0001. ** Slopes are statistically significant with Wald χ2 p‐values less than 0.01.

19
RESULTS
Forty‐four logistic regression models were fitted to the data to predict success in mathematics, reading‐intensive,
and English composition courses. TSIA mathematics and reading multiple choice tests were used as respective
predictors of success in mathematics courses and reading‐intensive courses. WritePlacer was used as a predictor
for success in the English composition courses in this study. Given that TSIA writing and WritePlacer scores were
used conjunctively for placement if the student was not placed using WritePlacer, regression models were also
fitted for English composition data using TSIA‐W scores conditioned on WritePlacer scores, as well as TSIA‐W, per
se. Each model provides the expected probability of successful course completion associated with placement
scores or WritePlacer scores plotted in Figures 1 through 11 and tabulated in Appendix B, C, and D‐1 – D‐9. Each of
the logistic regression model estimated by the data indicates that there is an increase in the predicted probability
of success in the courses as the TSIA test score or WritePlacer score increases. That is, students with higher test
scores have a higher probability of succeeding in the courses than students with lower test scores. For example in
Figure 1 (orange curve), a student with an TSIA‐M score of 347 has a 60% chance of obtaining a C‐ or higher grade
in the mathematics courses, while the corresponding probability for a student with a score of 365 is 80%.
Results provided in detail in Figures 1—11 and Appendices B, C, and D‐1 — D‐9 are summarized in Table 12, where
the expected probability of success associated with the Placement cut scores are indicated for each definition of
successful completion on a course and each manner of accounting for course withdrawals. The results highlighted
in the table are those that are of particular interest to the THECB. They are the expected probabilities of successful
course completion associated with the placement cut scores, where successful course completion means receiving
a grade of C‐ or higher and that withdrawing from the course is considered an unsuccessful completion.
Caution is highly encouraged when interpreting the expected probability of successful course completion for
English composition courses for cut score of the WritePlacer of 4 and TSIA‐W of 363, as the prediction slope for
this model is not statistically significant.
Other expected probabilities in Table 12 and Appendices B, C, and D‐1 – D‐9 are provided as additional information
to the THECB in reviewing its placement policy.
Table 12: Summary of Results
Course Predictor/Cut Score P(C‐ or Higher; W Included)
P(C‐ or Higher; W Excluded)
P(B‐ or Higher; W Included)
P(B‐ or Higher; W Excluded)
Mathematics TSIA‐M=350 0.64 0.65 0.40 0.41
Reading‐Intensive TSIA‐R=351 0.68 0.69 0.44 0.45
English Composition
WP=5 and TSIA‐W=350 0.75 0.74 0.51 0.51
WP= 4 and TSIA‐W=363 0.74 0.74 0.54 0.54
WP=5 0.78 0.78 0.59 0.59
TSIA‐W=350 0.74 0.74 0.50 0.50
TSIA‐W=363 0.78 0.78 0.60 0.60
20
Figure 1: Expected Probability of Success in Mathematics Courses Predicted by TSIA‐M

21
Figure 2: Expected Probability of Successful Reading‐Intensive Course Completion Predicted by TSIA‐R

22
Figure 3: Expected Probability of Successful English Composition Course Completion Predicted by WritePlacer
23
Figure 4: Expected Probability of Successful English Composition Course Completion Predicted by TSIA‐W

24
Figure 5: Expected Probability of Successful English Composition Course Completion Predicted by TSIA‐W for
Students with WritePlacer Score of 4

25
Figure 6: Expected Probability of Successful English Composition Course Completion Predicted by TSIA‐W for
Students with WritePlacer Score of 1 or Higher

26
Figure 7: Expected Probability of Successful English Composition Course Completion Predicted by TSIA‐W for
Students with WritePlacer Score of 2 or Higher
27
Figure 8: Expected Probability of Successful English Composition Course Completion Predicted by TSIA‐W for
Students with WritePlacer Score of 3 or Higher

28
Figure 9: Expected Probability of Successful English Composition Course Completion Predicted by TSIA‐W for
Students with WritePlacer Score of 4 or Higher

29
Figure 10: Expected Probability of Successful English Composition Course Completion Predicted by TSIA‐W for
Students with WritePlacer Score of 5 or Higher

30
Figure 11: Expected Probability of Successful English Composition Course Completion Predicted by TSIA‐W for
Students with WritePlacer Score of 6 or Higher
31
Table 13 presents the percentage of students for whom a placement decision based on current cut scores would
be considered correct given the grades they received. Correctly‐placed students are those who satisfied the
placement requirements (receiving a score higher than the cut score) and passed the course, or who didn’t satisfy
the placement requirements and failed the course. Table 13 also includes the percentages of students who were
under‐placed as well as those who were over‐placed. Under‐placed students are those who did not satisfy the
placement requirements but passed the course while over‐placed students are those who satisfied the placement
requirements but failed the course.
Table 13: Percentages of Correct Placement, Under‐Placement, and Over‐Placement
Course Cut Scores Correct Placement Under Placement Over Placement
Mathematics TSIA‐M=350 62.55 14.88 22.57
Reading‐Intensive TSIA‐R=351 68.59 10.54 20.86
English Composition
WP=5 and TSIA‐W=350
74.87 7.36 17.77
WP= 4 and TSIA‐W=363
59.91 24.39 15.70
WP=5 63.43 22.27 14.29
TSIA‐W=350 73.49 6.44 20.07
TSIA‐W=363 53.02 36.47 10.52
Note: The THECB defines successful completion of a course as receiving a grade of C‐ or higher. Withdrawal from the course is considered as unsuccessful completion. Students who received grades of Incomplete, No Credit, or Credit were not included in these analyses.
32
REFERENCES
Cox, D. R. and Snell, E. J. (1989). The analysis of binary data, second edition. London: Chapman & Hall.
Hosmer D.W. and S. Lemeshow (1980). A goodness‐of‐fit test for the multiple logistic regression model.
Communications in statistics, A10, 1043‐1069.
Nagelkerke, N. J. D. (1991). A note on a general definition of the coefficient of determination. Biometrika, 78, 691–
692.
The College Board (2014). TSI Assessments Program Manual Combined. New York: Author.
The College Board (2015). TSI Assessments Program Technical Manual. New York: Author.