The prediction of passenger flow under transport … prediction of passenger flow under transport...
12
The prediction of passenger flow under transport disturbance using accumulated passenger data T. Kunimatsu & C. Hirai Signalling and Transport Information Technology Division, Railway Technical Research Institute, Japan Abstract Whenever train disturbances occur, it is necessary for traffic operators to recover the train timetable appropriately, considering the passenger flow. But it is difficult to predict the flow in quantitative terms, because passengers may cancel his or her travel, or detour to another rail line. In recent years, however, it has become possible to obtain actual train operation time data stored in traffic control systems, the number of passengers on board by means of load compensating devices on rolling stock and passengers’ Origin-Destination data collected with automatic ticket checkers. In this paper, we first propose a visualization method of passengers’ flow. The method makes it easier for us to understand features of passengers’ flow during traffic disturbances in comparison with that of ordinary days. In the next step, we construct prediction models for the number of passengers passing the section between two adjacent stations. We implement multiple regression analysis using passenger’s flow data and information on outline of disturbances on a commuter rail line in past 10 months. As a result, we get multiple regression formulas to predict increase or decrease rates of the traffic volume in each section, with sufficient multiple correlation coefficients about 0.75. Finally, we apply the formulas to other disturbances, and find that they are reliable enough to support train rescheduling operations. Keywords: traffic disturbance, timetable, train rescheduling, passengers’ flow, multiple regression analysis. Computers in Railways XIV 623 www.witpress.com, ISSN 1743-3509 (on-line) WIT Transactions on The Built Environment, Vol 135, © 2014 WIT Press doi:10.2495/CR140521
Transcript of The prediction of passenger flow under transport … prediction of passenger flow under transport...
The prediction of passenger flow under transport disturbance using accumulated passenger data
T. Kunimatsu & C. Hirai Signalling and Transport Information Technology Division, Railway Technical Research Institute, Japan
Abstract
Whenever train disturbances occur, it is necessary for traffic operators to recover the train timetable appropriately, considering the passenger flow. But it is difficult to predict the flow in quantitative terms, because passengers may cancel his or her travel, or detour to another rail line. In recent years, however, it has become possible to obtain actual train operation time data stored in traffic control systems, the number of passengers on board by means of load compensating devices on rolling stock and passengers’ Origin-Destination data collected with automatic ticket checkers. In this paper, we first propose a visualization method of passengers’ flow. The method makes it easier for us to understand features of passengers’ flow during traffic disturbances in comparison with that of ordinary days. In the next step, we construct prediction models for the number of passengers passing the section between two adjacent stations. We implement multiple regression analysis using passenger’s flow data and information on outline of disturbances on a commuter rail line in past 10 months. As a result, we get multiple regression formulas to predict increase or decrease rates of the traffic volume in each section, with sufficient multiple correlation coefficients about 0.75. Finally, we apply the formulas to other disturbances, and find that they are reliable enough to support train rescheduling operations. Keywords: traffic disturbance, timetable, train rescheduling, passengers’ flow, multiple regression analysis.
Computers in Railways XIV 623
www.witpress.com, ISSN 1743-3509 (on-line) WIT Transactions on The Built Environment, Vol 135, © 2014 WIT Press
doi:10.2495/CR140521
1 Introduction
When a traffic disturbance occurs, a series of timetable modifications, such as implementation of shuttle services, cancelling of trains, or changing of train departure orders, are conducted to recover the disrupted train traffic. It is called train rescheduling. Train operation companies have to recover the disrupted traffic in a short time to minimise passengers’ inconvenience. They always monitor the overall traffic condition of their rail lines in control rooms to find traffic obstruction or other troubles immediately. When they find a blocked section caused by some troubles, they may prepare extra shuttle service trains to keep transport capacity of other sections where trains can be operated normally. In such a disrupted condition, passengers’ behaviour become very complicated because passengers may choose other trains or move to other rail lines based on announcements of the state of the disrupted traffic. Decision-makers at train operation companies who are responsible for stable train traffic have to predict passengers’ behaviour based on their experiential knowledge to make appropriate rescheduling plans, but it is usually difficult to predict it exactly. On the other hand, some train operation companies have already introduced data collection systems to recognize daily traffic condition and passengers’ flow. To be concrete, records of arrival and departure time of each train at each station, estimated numbers of passengers on board, and passengers’ Origin-Destination data can be collected and recorded on the systems. The accumulated data has the potential to bring out features of passengers’ flow under such disrupted traffic condition. In this paper, by using the accumulated data, we propose analysis methods for passengers’ flow to support decision-making in train rescheduling. First, we present a visualization method of the data collected on the days of traffic disturbances to understand the relationship between train rescheduling and passengers’ flow. The methods enable us to analyze the differences of the passengers’ flow between the day of traffic disturbances and that of ordinary operation. Next, we propose a method for predicting the number of passengers passing the section between two adjacent stations in the period before or after operation resumption. We collected recorded data and information on the summary of traffic disturbances for about a year, and conduct multiple regression analysis to build a prediction model. Finally, we apply the methods to an actual rail line to confirm the reliability and applicability of them.
2 Train rescheduling and passenger flow faced with traffic disturbances
2.1 The occurrence of traffic disturbances and rescheduling
When a traffic disturbance occurs and a part of the rail line is blocked, the traffic becomes disrupted until the blockage is lifted. In this case, there are some problems to the effect that little transportation service is provided until the blockage is lifted, or passengers face such inconvenient transportation service as
624 Computers in Railways XIV
www.witpress.com, ISSN 1743-3509 (on-line) WIT Transactions on The Built Environment, Vol 135, © 2014 WIT Press
overcrowded trains and increased duration of their trips. To solve these problems, train operation companies try to adjust traffic conditions by providing temporal shuttle services, or prolonging dwell time of the train at stations to decrease the congestion of overcrowded trains. It is important in making a desirable rescheduling plan for passengers to understand how many passengers are waiting for the operation resumption, and how many trains are necessary for it. For example, if there are predominantly more passengers between Stations A and B than between Stations B and C, and the blockage section is located at Station C, it is desired to ensure train traffic by running extra shuttle service trains between Stations A and B. Similarly, even if there are many passengers between Stations A and D in the same situation, if most passengers are assumed to detour using another rail line between Stations A and D, it is better to cancel several trains to recover traffic operation in a short time.
2.2 Passengers’ flow under traffic disturbances
When a traffic disturbance occurs, passengers seem to wait for the operation resumption, take other transportation services towards their destinations, or quit their journey, and so on. Currently, these passengers’ behaviour is judged experientially by the person in charge in the control room, with the limited information provided by drivers, staff members, or video cameras at stations. As a result, there are some cases where it takes too much time to recover normal transportation services, because the unpredicted increase of the dwell time occurs by the congestion of particular stations or trains, and the rescheduled alternative did not work effectively. It is important for appropriate rescheduling to support such experiential understanding of the passengers’ flow by the traffic operator. But, it is difficult to predict it exactly because the passengers’ flow under such situation is affected by various factors, such as a day of the week, a period of time, traffic condition of the day, congestion of trains or stations, or availability of detour routes. In fact, traffic disturbances with the same blockage section, period of time and duration as that occurred in the past are rarely happen. Even if there is a similar case to a past one, the passengers’ flow in the past is not always reproduced because the information for passengers given by the crew or staff members may be different. When we predict passengers’ behaviour, we have to take into consideration not only the outline of the disturbance and the availability of detour routes, but also announcements for passengers.
2.3 Related work
There are some related works for the passengers’ flow in traffic disturbances. Muto [1] conducted a WEB questionnaire survey for passengers who encounter traffic disturbances, and asked whether they used detour routes or waited until operation resumption. By analyzing the results, he built a behaviour choice model for detour routes based on estimated time to the destination both with
Computers in Railways XIV 625
www.witpress.com, ISSN 1743-3509 (on-line) WIT Transactions on The Built Environment, Vol 135, © 2014 WIT Press
and without detour routes. Kunimatsu et al. [2] built the train operation and passenger flow simulation technique as a micro-simulation system to predict passengers’ train paths towards timetables. They also proposed a train rescheduling algorithm reflecting the passengers’ flow [3], by using the simulation technique incorporating detour route choice model developed by Muto. But, these methods are based on the number of passengers estimated by a questionnaire survey or a simulation. They are not the number of passengers measured on the target day. There is another work for predicting the number of passengers using recorded data. Myojo et al. [4] used passengers’ Origin-Destination data collected by automatic ticket checkers at stations, and proposed a method of applying decreasing rate of a similar disturbance occurred in the past. By this method, we can surely understand the tendency of the passengers’ volume of the particular Origin-Destination. But, it is not sufficient for planning train rescheduling, because the volume of passengers at each section is not clear by that method, and it is important for the train rescheduling in which the number of temporal shuttle services and trains to be suspended is determined. There are also some works about analyzing recorded data of train arrival/departure time [5, 6]. But, their main targets are analysis of delay propagations for overall train traffic. To analyze passengers’ flow under transport disturbances, we have to treat recorded data about passengers.
3 Recorded data and approach for passengers’ flow analysis
3.1 Recorded data about daily train operation
As traffic control systems, train cars, and automatic ticket checkers are updated with IT technology, it becomes possible to collect and accumulate various data about daily train operation. Some examples of the recorded data are as follows. 1) Actual arrival/departure time
This is the recorded data of actual arrival/departure time of each train and station on a specific day. The value of this data is calculated from the record of the track circuits about train positions, and the information on the timetable hold by the control system. The data is accumulated in the control system. We can get the data about all trains and stations within the area covered by the control system.
2) Number of passengers of each train and in each section The data is information on the number of passengers aboard each train in each section between two adjacent stations. This is estimated by the sum of the weight of each passenger on board measured by the load compensating device installed on the train. The data is transmitted to the ground data centre every time of measurement through wireless communication devices. The main function of the load compensating device is adjustment of the braking power according to the load of the train. It detects the load from the swag of the helical springs on the trucks, or the pressure in the air springs. The sum
626 Computers in Railways XIV
www.witpress.com, ISSN 1743-3509 (on-line) WIT Transactions on The Built Environment, Vol 135, © 2014 WIT Press
of the weight of each passenger is estimated using information on the load of the train, and the number of passengers is calculated dividing it by the average weight of passengers.
3) Passengers’ Origin-Destination data The data includes the information on passengers’ origin station, destination station, time period at destination stations, and number of passengers. When passengers go through automatic ticket checkers installed in destination stations, automatic ticket checkers record information on passengers’ tickets. By using this, we can get information on passengers’ trips.
4) Outline of the traffic disturbance Information on the traffic disturbance such as the day, day of the week, location, kind, occurrence time, and resumption time.
5) History of the passenger announcement Information on passenger announcements appeared during the disturbance, including estimated time to resume operation, and whether it came true.
3.2 Approach of the research
In this paper, we adopted a manner in which we directly analyze the recorded data with statistical methods, and extracted the characteristics of passengers’ flow under traffic disturbances. First, we built visualization methods of passengers’ flow for the day. One of them is visualization of number of passengers of each train and in each section. By this method, lines indicating rescheduled trains on the train diagram are coloured differently according to the number of passengers on board the train. The other is visualization of passengers’ Origin-Destination data. This method displays number of passengers in the railway network by three-dimensional way. We can understand remarkable changes of passengers’ flow under the traffic disturbance by setting appropriate thresholds of display. As the next step, to predict passengers’ flow during traffic disturbances, we prepared recorded data collected in the target rail line over the last one year, and build prediction models of the number of passengers passing each section between two adjacent stations. By using multiple regression analysis, we build different prediction models according to each time period before or after the operation resumption. The feature of the proposed method is that, by collecting recorded data over a long period, we can get sufficient samples for statistical analysis, on both days with or without traffic disturbances. This enables us to analyze the difference between the passengers’ flow in traffic disturbances and that of the day with ordinary operation. We showed the fundamental ideas for visualization and analysis methods in [7]. In this paper, we updated and extended visualization method for Origin-Destination data, and built additional prediction models reflecting traffic conditions or rescheduling policies of the railway company under disruption.
Computers in Railways XIV 627
www.witpress.com, ISSN 1743-3509 (on-line) WIT Transactions on The Built Environment, Vol 135, © 2014 WIT Press
4 Visualization method
4.1 Visualization with the data of actual arrival/departure time and the number of passengers on board
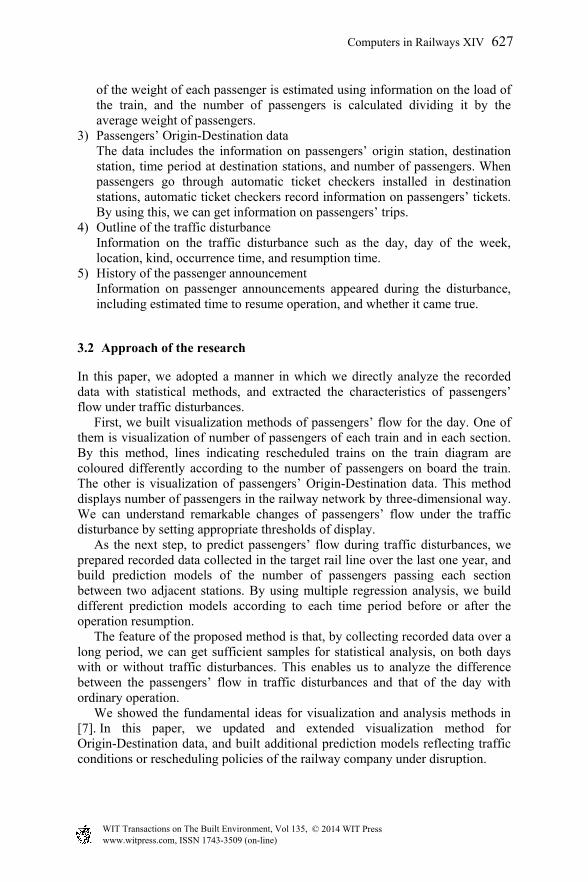
We visualized the recorded data of the number of passengers on board as follows. First, we define the position of lines indicating trains on the time-space diagram, according to the data of the actual arrival/departure time of each train and section. Next, we decide the colour of lines according to the data of the number of passengers on board on the target day. The colour varies according to the congestion rate of each train. If it is low, the colour is blue, and it becomes red as it becomes high. We use a bold line for crowded trains with a more than 100% congestion rate. However, we cannot get the data of some trains due to their car types. In this case, we represent them with dot gray lines, and indicate the trains without data. Finally, we add a symbol “●” for the line of a train, if the congestion rate is somewhat different from the regular value, the central value of passengers’ data collected during one month. We add the symbol only if the difference is over 20%, and if it increases, the symbol is red and if it decreases, it is blue. Now, we show an example of the visualization for an actual traffic disturbance in Figure 1. Two different rail lines are operated in parallel between Stations 11 and 20. On this day, the disturbance occurred at Station 26, and traffic going through Station 26 was suspended for about an hour. In the diagram in Figure 1, the traffic of the rail line with the disturbance is indicated at the bottom, and that of the other rail line is at the top. We can understand some trends by this figure. First, we can see many red symbols at the top of the diagram. This indicates that many passengers of the rail line with the disturbance give up using the trains on the line, and change to the trains on the other line. Next, as it seemed to take a long time to resume operation, the timetable was rescheduled in such a way that 3 turn backs of the outbound trains at Station 24,
Figure 1: Example of the visualization of passengers’ flow.
628 Computers in Railways XIV
www.witpress.com, ISSN 1743-3509 (on-line) WIT Transactions on The Built Environment, Vol 135, © 2014 WIT Press
and 3 extra shuttle service inbound trains are provided during the blockage time. These extra trains are indicated with bold black circles at the bottom of the diagram. By this, it can be said that these trains had over 100% congestion rate. In this way, we can easily understand passengers’ flow or effects of rescheduling by the proposed visualization method.
4.2 Visualization of passengers’ Origin-Destination data
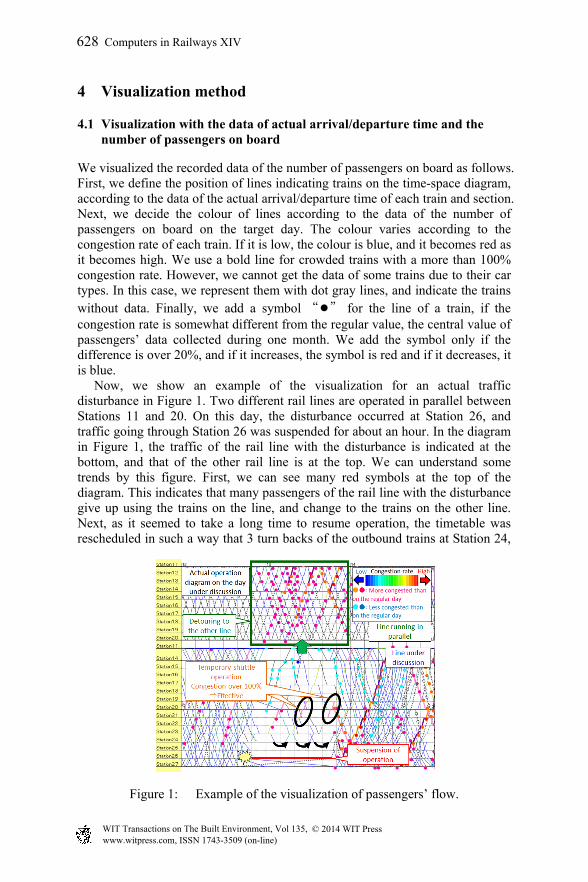
We devised visualization method of passengers’ Origin-Destination (OD) data categorized for each time period in the whole railway network. We adopt three dimensional ways for visualization, and assigned different colours according to volume of passengers. By adjusting thresholds of the number of passengers for displaying, we can easily understand feature of passengers’ flow under the whole railway network when a traffic disturbance occurs. The method is as follows. First, we consider the whole railway network as a plane, and assign two planes in a three dimensional space. One of the planes represents origin stations of passengers, and the other represents destination stations. We connect each pair of origin and destination station with a link distinguished by the volume of passengers for the corresponding OD pair. The characterization is conducted by colour of the link, reflecting the difference between the volume of passengers in the target day and the regular value. As the visualization method is three dimensional ways, we can easily confirm pairs of origin-destination station on different rail line by seeing another angle. By setting appropriate thresholds for increasing/decreasing number of passengers, we can restrict displayed OD pairs with remarkable changes, and easily understand feature of passengers’ flow. Figure 2 shows an example of visualization. The balls on the planes indicate origin or destination stations. By adjusting thresholds or time periods, we can visually understand overall tendency of the OD data in the railway network. For example, if a traffic disturbance affects not only the concerned line, but also adjacent another line by passengers’ detour behaviours, we can look this by the decrease of passengers in the concerned line and increase of passengers in the adjacent detour line.
Figure 2: Visualization of OD data in railway network.
Computers in Railways XIV 629
www.witpress.com, ISSN 1743-3509 (on-line) WIT Transactions on The Built Environment, Vol 135, © 2014 WIT Press
5 Prediction model of passengers’ flow
5.1 Aim and target
As the next step, to understand how many trains should be set for each section before or after the operation resumption, we built a prediction model of passengers’ flow with recorded data on the past days of traffic disturbances. In the same way as the previous chapter, we collected both the data of the actual arrival/departure time and the data of the number of passengers on board. To build the model with sufficient cases of disturbances, we collect the data of the target rail line for over a year. We used 28 cases of disturbances in which we can get the information on the time the operation is suspended and resumed. The target of the model to be predicted is the increasing/decreasing rate of the number of passengers passing each section between two adjacent stations in the period before or after the operation resumption, compared to the number of passengers in the ordinal operation. The reason not to estimate each number of passengers on board is that, we want to exclude the effects of the daily variation of passengers’ volume and the local variation of train intervals, and know whether the number of trains provided by the rescheduled alternative is from a comprehensive point of view. By setting the target for the increasing/decreasing rates, we can use the recorded data of both cases where the traffic disturbance occurs at 11 a.m. and 2 p.m., to build the same prediction model for the daytime. When we calculate the increasing/decreasing rate, the regular value of passengers’ volume is necessary. We define the median of passengers’ volume within the target month as the regular value for each day of the week.
5.2 Model building with multiple regression analysis
We apply multiple regression analysis to build the prediction models. The increasing/decreasing rate of the number of passengers passing each section between two adjacent stations in the period before or after the operation resumption is set as the explained variable. We set the following 17 explaining variables of 3 categories (Figure 3). 1) Information on the traffic disturbance
-location, blockage section (dummy variable): Sta. 11–20, Sta. 20–27 -occurrence time (dummy variable): early morning (before 7 a.m.), morning (7 a.m.–10 a.m.), daytime (10 a.m.–4 p.m.), evening (4 p.m.–10 p.m.) -duration of blockage (dummy variable): under 30 min, 30–60 min, 60–90 min
2) Feather of the rail line and each section -whether another rail line is running in parallel (dummy variable) -whether each side of the section has a station with a connection to another rail line (dummy variable)
3) Whether the predicted time of the operation resumption came true (in the case of predicting after the resumption)
630 Computers in Railways XIV
www.witpress.com, ISSN 1743-3509 (on-line) WIT Transactions on The Built Environment, Vol 135, © 2014 WIT Press
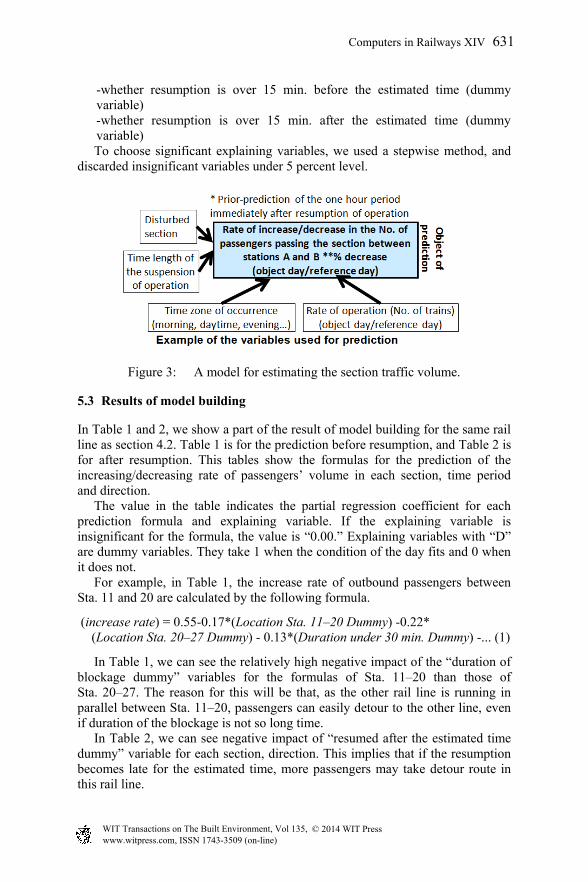
-whether resumption is over 15 min. before the estimated time (dummy variable) -whether resumption is over 15 min. after the estimated time (dummy variable)
To choose significant explaining variables, we used a stepwise method, and discarded insignificant variables under 5 percent level.
Figure 3: A model for estimating the section traffic volume.
5.3 Results of model building
In Table 1 and 2, we show a part of the result of model building for the same rail line as section 4.2. Table 1 is for the prediction before resumption, and Table 2 is for after resumption. This tables show the formulas for the prediction of the increasing/decreasing rate of passengers’ volume in each section, time period and direction. The value in the table indicates the partial regression coefficient for each prediction formula and explaining variable. If the explaining variable is insignificant for the formula, the value is “0.00.” Explaining variables with “D” are dummy variables. They take 1 when the condition of the day fits and 0 when it does not. For example, in Table 1, the increase rate of outbound passengers between Sta. 11 and 20 are calculated by the following formula.
(increase rate) = 0.55-0.17*(Location Sta. 11–20 Dummy) -0.22* (Location Sta. 20–27 Dummy) - 0.13*(Duration under 30 min. Dummy) -... (1)
In Table 1, we can see the relatively high negative impact of the “duration of blockage dummy” variables for the formulas of Sta. 11–20 than those of Sta. 20–27. The reason for this will be that, as the other rail line is running in parallel between Sta. 11–20, passengers can easily detour to the other line, even if duration of the blockage is not so long time. In Table 2, we can see negative impact of “resumed after the estimated time dummy” variable for each section, direction. This implies that if the resumption becomes late for the estimated time, more passengers may take detour route in this rail line.
Computers in Railways XIV 631
www.witpress.com, ISSN 1743-3509 (on-line) WIT Transactions on The Built Environment, Vol 135, © 2014 WIT Press
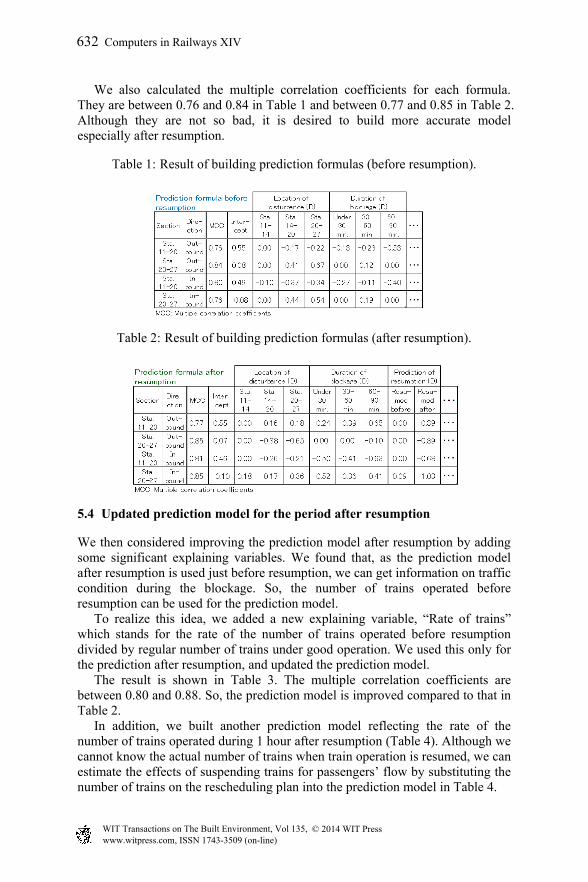
We also calculated the multiple correlation coefficients for each formula. They are between 0.76 and 0.84 in Table 1 and between 0.77 and 0.85 in Table 2. Although they are not so bad, it is desired to build more accurate model especially after resumption.
Table 1: Result of building prediction formulas (before resumption).
Table 2: Result of building prediction formulas (after resumption).
5.4 Updated prediction model for the period after resumption
We then considered improving the prediction model after resumption by adding some significant explaining variables. We found that, as the prediction model after resumption is used just before resumption, we can get information on traffic condition during the blockage. So, the number of trains operated before resumption can be used for the prediction model. To realize this idea, we added a new explaining variable, “Rate of trains” which stands for the rate of the number of trains operated before resumption divided by regular number of trains under good operation. We used this only for the prediction after resumption, and updated the prediction model. The result is shown in Table 3. The multiple correlation coefficients are between 0.80 and 0.88. So, the prediction model is improved compared to that in Table 2. In addition, we built another prediction model reflecting the rate of the number of trains operated during 1 hour after resumption (Table 4). Although we cannot know the actual number of trains when train operation is resumed, we can estimate the effects of suspending trains for passengers’ flow by substituting the number of trains on the rescheduling plan into the prediction model in Table 4.
632 Computers in Railways XIV
www.witpress.com, ISSN 1743-3509 (on-line) WIT Transactions on The Built Environment, Vol 135, © 2014 WIT Press
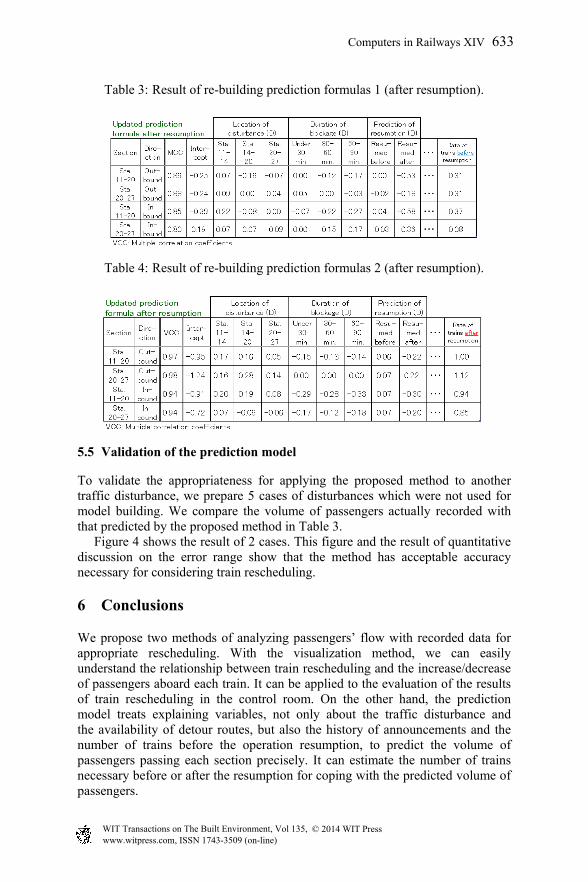
Table 3: Result of re-building prediction formulas 1 (after resumption).
Table 4: Result of re-building prediction formulas 2 (after resumption).
5.5 Validation of the prediction model
To validate the appropriateness for applying the proposed method to another traffic disturbance, we prepare 5 cases of disturbances which were not used for model building. We compare the volume of passengers actually recorded with that predicted by the proposed method in Table 3. Figure 4 shows the result of 2 cases. This figure and the result of quantitative discussion on the error range show that the method has acceptable accuracy necessary for considering train rescheduling.
6 Conclusions
We propose two methods of analyzing passengers’ flow with recorded data for appropriate rescheduling. With the visualization method, we can easily understand the relationship between train rescheduling and the increase/decrease of passengers aboard each train. It can be applied to the evaluation of the results of train rescheduling in the control room. On the other hand, the prediction model treats explaining variables, not only about the traffic disturbance and the availability of detour routes, but also the history of announcements and the number of trains before the operation resumption, to predict the volume of passengers passing each section precisely. It can estimate the number of trains necessary before or after the resumption for coping with the predicted volume of passengers.
Computers in Railways XIV 633
www.witpress.com, ISSN 1743-3509 (on-line) WIT Transactions on The Built Environment, Vol 135, © 2014 WIT Press
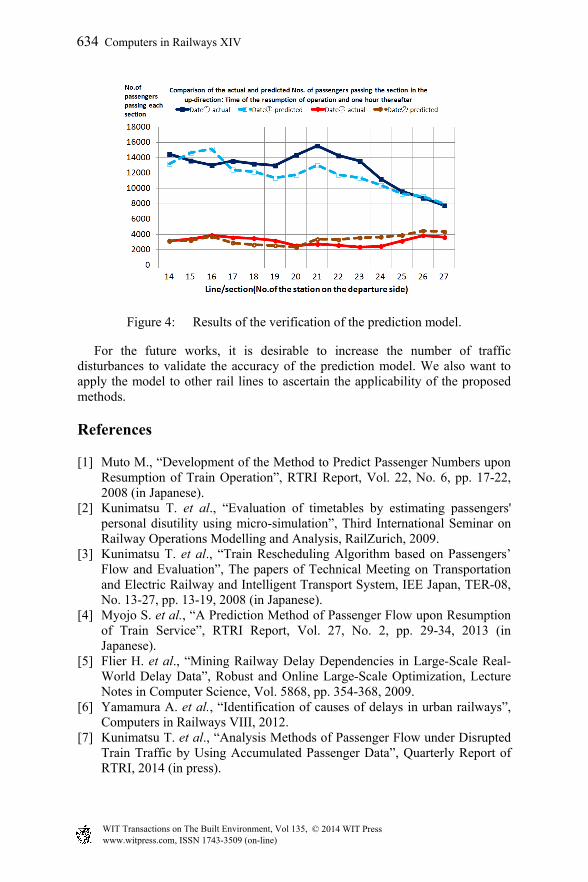
Figure 4: Results of the verification of the prediction model.
For the future works, it is desirable to increase the number of traffic disturbances to validate the accuracy of the prediction model. We also want to apply the model to other rail lines to ascertain the applicability of the proposed methods.
References
[1] Muto M., “Development of the Method to Predict Passenger Numbers upon Resumption of Train Operation”, RTRI Report, Vol. 22, No. 6, pp. 17-22, 2008 (in Japanese).
[2] Kunimatsu T. et al., “Evaluation of timetables by estimating passengers' personal disutility using micro-simulation”, Third International Seminar on Railway Operations Modelling and Analysis, RailZurich, 2009.
[3] Kunimatsu T. et al., “Train Rescheduling Algorithm based on Passengers’ Flow and Evaluation”, The papers of Technical Meeting on Transportation and Electric Railway and Intelligent Transport System, IEE Japan, TER-08, No. 13-27, pp. 13-19, 2008 (in Japanese).
[4] Myojo S. et al., “A Prediction Method of Passenger Flow upon Resumption of Train Service”, RTRI Report, Vol. 27, No. 2, pp. 29-34, 2013 (in Japanese).
[5] Flier H. et al., “Mining Railway Delay Dependencies in Large-Scale Real-World Delay Data”, Robust and Online Large-Scale Optimization, Lecture Notes in Computer Science, Vol. 5868, pp. 354-368, 2009.
[6] Yamamura A. et al., “Identification of causes of delays in urban railways”, Computers in Railways VIII, 2012.
[7] Kunimatsu T. et al., “Analysis Methods of Passenger Flow under Disrupted Train Traffic by Using Accumulated Passenger Data”, Quarterly Report of RTRI, 2014 (in press).
634 Computers in Railways XIV
www.witpress.com, ISSN 1743-3509 (on-line) WIT Transactions on The Built Environment, Vol 135, © 2014 WIT Press

![Prediction of Civil Aviation Passenger Transportation ... · passenger transport. In methodology, Chen Lihua (2003) , in accordance with the [4] method of regression analysis, domestic](https://static.fdocuments.net/doc/165x107/60927b115233e3410b3f6c0b/prediction-of-civil-aviation-passenger-transportation-passenger-transport-in.jpg)