The PRACLAY Heater test after two years of the stationary ...
64
The PRACLAY Heater test after two years of the stationary phase A. Dizier, G. Chen, X.L. Li, J. Rypens EURIDICE Report, ref. EUR_PH_ 17_043 2017
Transcript of The PRACLAY Heater test after two years of the stationary ...

The PRACLAY Heater test after two years of the
stationary phase
A. Dizier, G. Chen, X.L. Li, J. Rypens
EURIDICE Report, ref. EUR_PH_ 17_043
2017

page 4 I EURIDICE Report I ref. EUR_PH_ 17_043
This report was written by A. Dizier (EIG EURIDICE), G. Chen (EIG EURIDICE), X.L. Li (EIG EURIDICE),
and J. Rypens (EIG EURIDICE), with the support of the EURIDICE team members L. Areias, H. Huysmans,
C. Lefevre, J. Leysen, L. Mariën, J. Peters, I. Troullinos, J. Verstricht and B. Vreys.
It was reviewed by X. Sillen (ONDRAF/NIRAS) and G. Armand (ANDRA),
approved by P. De Preter (EIG EURIDICE), and designed and produced by Bailleul Ontwerpbureau.
Contact person at EIG EURIDICE: Xiang Ling Li [email protected]
Contact person at ONDRAF/NIRAS: Xavier Sillen [email protected]
Publisher: Peter De Preter, Sneppenstraat 66, 3010 Kessel-Lo
EIG EURIDICE
Boeretang 200
BE-2400 MOL
Tel. +32 14 33 27 84
www.euridice.be
The data, results, conclusions and recommendations contained in this report are the property of EIG
EURIDICE. This publication may be not quoted without acknowledgement of the source. It is made
available on the basis that it will not be used for commercial purposes. All commercial uses, including
copying and re-publication, require prior written authorisation from EIG EURIDICE.
The PRACLAY Heater test after two years of the stationary phase EURIDICE Report I ref. EUR_PH_ 17_043 I page 5
Document Datasheet
Title The PRACLAY Heater test after two years of the stationary phase
Author(s) of the document Reviewer(s) of the document
A. Dizier (EIG EURIDICE), Xavier Sillen (ONDRAF/NIRAS)
G. Chen (EIG EURIDICE), Gilles Armand (ANDRA)
X.L. Li (EIG EURIDICE), English language reviewed by
J. Rypens (EIG EURIDICE) Moira Bluer
Series NA Publication date 15 December 2017
Document type EURIDICE REPORT Review status Version 1
Status Public Revision number 0
EURIDICE 17-043 Subcontractor NA
number of report reference number
ISBN NA Total number of pages 65
Approver(s) of the document
Peter De Preter (ONDRAF/NIRAS)
EURIDICE approval Date Sign
Author:
Arnaud Dizier 15/12/2017
Reviewer:
Xavier Sillen 15/12/2017
Approver:
Peter De Preter 15/12/2017

page 6 I EURIDICE Report I ref. EUR_PH_ 17_043

The PRACLAY Heater test after two years of the stationary phase EURIDICE Report I ref. EUR_PH_ 17_043 I page 7
Summary
In Belgium, geological disposal in poorly indurated clay has been studied for the past 40 years and
more as a possible option for the long-term management of high-level and/or long-lived radioactive
waste. High-level radioactive waste produces heat. Once the waste is placed in an underground
repository, following a 60-year cooling period on the surface, this heat will have an impact on the
thermo-hydro-mechanical behaviour of the clay for a limited period of time (approximately 1,000 years).
In the HADES underground research laboratory in Mol, Belgium, the large-scale PRACLAY Heater test is
being carried out by EIG EURIDICE as part of the RD&D programme of ONDRAF/NIRAS on geological
disposal. The main goal of this test is to examine the combined impact of hydro-mechanical disturbances
caused by gallery construction and a large-scale thermal load on the Boom Clay due to heat-emitting
high-level waste. This combined mechanical and thermal load leads to perturbations in the clay. In this
respect, it must be verified that poorly indurated clays can retain their ability to physically contain radio-
active substances after these perturbations and that the performance of this important natural barrier will
thus not be significantly altered.
The thermo-hydro-mechanical response of the Boom Clay has already been investigated in laboratory
tests and during the small-scale in-situ ATLAS experiments. To confirm and, if necessary, refine the
existing knowledge and models of the thermo-hydro-mechanical behaviour of the Boom Clay, the
PRACLAY Heater test is being performed on a scale and in conditions that are representative of a real
repository.
The Heater test is installed in the PRACLAY gallery. A 30-metre section of this gallery will be heated
for 10 years at a constant temperature of 80°C at the interface between the concrete lining and the
Boom Clay. This target temperature is slightly higher than the peak temperature that is expected in a real
repository at this interface. The heated part of the gallery is separated from the non-heated part by a seal
made of a bentonite ring supported by a cylindrical steel structure. Due to hydration, subsequent swelling
and the intrinsic low permeability of the bentonite clay, the seal hydraulically cuts off the heated section
from the non-heated access part of the gallery and, together with a water-saturated backfill in the heated
part of the gallery, ensures quasi-undrained boundary conditions during the test.
On 3 November 2014, the heating system was switched on and the target temperature of 80°C was
reached on 19 August 2015. After this start-up phase, the temperature at the interface between the
concrete lining and the Boom Clay was kept constant at 80°C by continuously adjusting the power input
of the heating system. This is the so-called “stationary phase”.
The initial conclusion is that the experimental set-up is functioning as intended. The primary heating
system has proved to be robust and is still fully operational nearly three years after the switch-on.
Numerical calculations allow us to maintain the target temperature at 80°C by regulating the power input
of the heating system. Inside the saturated PRACLAY gallery backfill, the pore water pressure evolved
from 1 MPa just before the start of heating to 2.9 MPa at the end of the start-up phase. At the beginning
of the stationary phase, the pore water pressure decreased slightly and stabilised at around 2.8 MPa.
This evolution of the pore water pressure inside the PRACLAY gallery is consistent with the numerical
predictions assuming quasi-undrained conditions. Moreover, no significant leakage either from the
metallic seal structure with all its watertight feedthroughs or from the interface with the Boom Clay
has been observed. These observations demonstrate that the seal effectively fulfils its role as hydraulic
cut-off between the heated and the non-heated parts, limiting dissipation of pore water pressure from

page 8 I EURIDICE Report I ref. EUR_PH_ 17_043
the heated part towards the non-heated part of the experiment and maintaining the pore water pressure
inside the saturated PRACLAY gallery. There are no indications of instability of the concrete lining, and
displacements of the gallery lining due to heating are minimal. Finally, the alarm system, control system
and visualisation system together enable us to meticulously monitor the functioning of the system as a
whole. The dedication of the scientific and technical team, 24 hours a day, guaranteed that the slightest
abnormal event or evolution was detected and remedied, if necessary.
Although the functioning of the experimental set-up is an important achievement, the main interest of
the Heater test lies in the behaviour of the surrounding Boom Clay and, more specifically, the evolution
of temperature and pore water pressure. To monitor this evolution, an extensive network of instrumented
boreholes was installed in the surrounding clay. The temperature and pore water pressure in the clay
evolved as expected without any sudden or abrupt changes. The most critical transient phenomenon
in terms of the thermo-hydro-mechanical behaviour of the clay, more specifically the peak pore water
pressure in the clay, has already occurred and is confirmed by comparing the in situ measurements with
the numerical predictions. This indicates that the system has responded in a stable manner and that
the clay is able to sustain the thermal load without major alteration of its structural integrity. This was
confirmed by the good agreement of the observations with the outcome of the finite element modelling
that didn’t predict any sign of cracks inside the clay massif. The zone affected by the temperature and
pore water pressure variation had extended up to 16 m from the axis of the PRACLAY gallery by the
beginning of August 2017 (end of reporting period).
Comparisons with the numerical predictions that were made before the heating system was switched
on have shown that the thermal properties are well established and that the temperature evolution can
be reproduced well. The numerical predictions correctly model the trend in the pore water pressure
evolution, but tend to underestimate the magnitude of the variation. Improvement of the numerical
modelling is on-going, particularly by enhancing our understanding of the hydro-mechanical coupling
of the clay in the damaged zone close to the gallery.
Following on from the Start-up phase report, published in May 2016 (EUR_PH_16_025), this second
report summarises the main observations from 3 November 2014 until 19 August 2017, nearly three years
since the switch-on of the heating system. These observations lead to the general conclusion that the
Heater test is a success. The experimental set-up has been found to be reliable and the whole system has
generally evolved as expected. It has been proved that the clay is able to sustain the thermal load that
would be generated by high-level, heat-emitting radioactive waste. Furthermore, our understanding and
knowledge of clay behaviour will enable us to predict adequately the evolution of the temperature and
the pore water pressure surrounding real disposal galleries in poorly indurated clay.
Over the next few years, observations in the far field and improvement of the models will be needed
to increase the accuracy of the predictions. In 2018, a report will be prepared with a more detailed and
in-depth scientific interpretation of the observations so far.

Table of Contents
1 Introduction ................................................................................................................111.1 Background ...................................................................................................................................111.2 Goals and design of the PRACLAY Heater test ...................................................................... 131.3 Goal and structure of this report.............................................................................................. 14
2 Experimental set-up ................................................................................................. 162.1 Heating system ............................................................................................................................ 162.2 Hydraulic seal ............................................................................................................................... 182.3 Backfill sand .................................................................................................................................. 192.4 Instrumentation and monitoring system ................................................................................ 192.5 Data acquisition system ............................................................................................................. 23
3 Test evolution ............................................................................................................. 243.1 Temperature in the concrete lining and at the lining/Boom Clay interface ...................263.2 Pore water pressure inside the PRACLAY gallery ..................................................................283.3 Boom Clay responses .................................................................................................................283.4 Responses in the bentonite seal .............................................................................................. 413.5 Responses in the concrete lining .............................................................................................453.6 Summary .......................................................................................................................................48
4 Comparison with numerical modelling ................................................................494.1 Description of the two numerical models .............................................................................494.2 Comparison with the observations ......................................................................................... 534.3 Summary and future work .........................................................................................................58
5 Preliminary evaluation of the PRACLAY Heater test ........................................... 59
6 General conclusion ...................................................................................................62
7 References .................................................................................................................. 63


The PRACLAY Heater test after two years of the stationary phase EURIDICE Report I ref. EUR_PH_ 17_043 I page 11
1. Introduction
1.1. Background
For the long-term management of high-level and/or long-lived radioactive waste (categories B&C),
ONDRAF/NIRAS, which is responsible for the management of radioactive waste in Belgium, considers
geological disposal in poorly indurated clay formations to be a safe and feasible option.
Research on geological disposal in clay started in Belgium more than 40 years ago. In 1974, the Belgian
nuclear research centre SCK•CEN decided to construct an underground research facility in the Boom
Clay to study the behaviour and characteristics of this clay below ground level and to test different
techniques for excavating and constructing galleries in poorly indurated clay. The Boom Clay formation
lies between 190 and 290 metres below the SCK•CEN site. The underground research facility, which is
situated at a depth of 225 metres, is known as the HADES URL (Figure 1-1). The first part of HADES was
constructed manually during the 1980s.
ONDRAF/NIRAS was founded in 1980. Given that its remit was to manage all Belgian radioactive waste,
ONDRAF/NIRAS was also given responsibility for the RD&D programme on geological disposal.
EIG PRACLAY, an economic interest grouping between ONDRAF/NIRAS and SCK•CEN, was created
in 1995 to carry out the PRACLAY project, the aim of which was to demonstrate the feasibility of
the geological disposal concept for high-level radioactive waste. First, an 80-metre-long gallery
with an internal diameter of 4 metres, called the Connecting gallery (CG), was constructed in
2002/2003 using an industrial tunnelling machine, connecting the second shaft with the existing
part of the HADES laboratory that was constructed during the 1980s. Then, in 2007, the 45-metre-
long PRACLAY gallery (PG) with an internal diameter of 1.9 metres was constructed, perpendicularly
connected with the Connecting gallery.
During excavation and construction of these galleries, the hydro-mechanical behaviour of the Boom Clay
was studied in detail and documented in the CLIPEX and SELFRAC reports (2007). The main conclusion
of these studies is that the Boom Clay displays highly coupled hydro-mechanical behaviour and has a
self-sealing capacity, which means, for example, that the initial low permeability of the clay that is locally
affected by the excavation work gradually recovers.
Figure 1-1: Construction history and layout of the HADES
underground research laboratory

page 12 I EURIDICE Report I ref. EUR_PH_ 17_043
High-level radioactive waste gives off heat. Two specific heat-emitting waste forms are considered in
the RD&D programme on geological disposal: vitrified waste that results from reprocessing, and spent
fuel. In Belgium, spent fuel assemblies are stored to allow them to cool, in dry conditions at the Doel
nuclear power plant and in water basins at the Tihange nuclear power plant. After reprocessing, vitrified
waste is stored in buildings belonging to Belgoprocess, a subsidiary of ONDRAF/NIRAS, to cool down
for several decades.
In the current geological disposal concept, after a cooling period of at least 60 years, the high-level
waste forms (two vitrified waste canisters or four spent fuel assemblies) will be placed in a carbon
steel overpack surrounded by a concrete buffer and an outer stainless steel envelope. Together,
these engineered barriers make up the so-called “Supercontainer”. The Supercontainer is the
current reference design for the disposal of high-level, heat-producing radioactive waste forms
(Figure 1-2). After manufacturing, the Supercontainer will then be placed horizontally in the
disposal galleries, which are supported by a concrete lining. Finally, the void space between the
Supercontainer and the gallery lining will be backfilled, probably with a cement-based material.
The Supercontainer has the key benefit that it is assembled on the surface and has adequate
radiation shielding to enable it to be subsequently manipulated without the need for shielded
handling equipment.
After emplacement of the supercontainers in the disposal facility, the high-level radioactive waste will still
produce some heat and will heat up the clay surrounding the disposal galleries.
To study the impact of this heat on the thermo-hydro-mechanical behaviour of the clay, a large number
of on-surface laboratory tests have been performed (Horseman et al., 1987; Baldi et al., 1991; Sultan,
1997; Coll, 2005; Le, 2008; etc.). In addition, the in-situ ATLAS heater test was conducted in several
phases in HADES from 1993 on (De Bruyn and Labat, 2002; Chen et al., 2011). The last phase of the
ATLAS heater test (ATLAS IV) started on 18 October 2011. During the different phases of the ATLAS heater
test, the temperature and pore water pressure response to thermal loading were measured in boreholes
at a distance of a few metres from a borehole that included an 8-metre-long heated section. Due to
the relatively large distance between the small-diameter heating source and the measuring points,
most of the clay studied could be considered to be initially undisturbed. Combining observations and
robust modelling results, the ATLAS experiment resulted in a very good understanding of the coupled
thermo-hydro-mechanical behaviour and the anisotropic properties of the undisturbed Boom Clay, as a
scale model of the far field of a disposal gallery.
Figure 1-2: The Supercontainer design for vitrified waste as the reference for
the Engineered Barrier System

The PRACLAY Heater test after two years of the stationary phase EURIDICE Report I ref. EUR_PH_ 17_043 I page 13
To confirm and refine the knowledge gained from these small-scale tests, on a scale and in conditions
that are more representative of a real disposal facility, including the excavation-damaged zone (EDZ),
it was decided to perform a large-scale heating experiment in the PRACLAY gallery, the so-called
“PRACLAY Heater test”.
The ultimate goal of these small-scale and large-scale heater tests is to understand the
thermo-hydro-mechanical behaviour of the clay on the scale of a geological disposal system and to
verify that poorly indurated clay, such as the Boom Clay, retains its ability to physically contain radioactive
substances when it is heated.
.
1.2. Goals and design of the PRACLAY Heater test
The main goal of the PRACLAY Heater test is to determine the combined impact of mechanical
disturbances caused by gallery construction and a large-scale thermal load on the Boom Clay due to
heat-emitting high-level waste. This combined mechanical and thermal load leads to perturbations in the
clay. It is important to check whether the latter can affect the performance of the Boom Clay as a host
rock for the geological disposal of heat-emitting radioactive waste.
More specifically, the goals of the Heater test (Van Geet et al., 2007) are to:
• confirm the thermal properties of the Boom Clay on a large scale and refine the models that describe
the thermal evolution of the Boom Clay surrounding a disposal gallery containing heat-emitting
radioactive waste;
• estimate the major consequences of the thermo-hydro-mechanical impact on the Boom Clay,
particularly within the excavation-damaged zone (EDZ), focusing primarily on the mechanical damage
and hydraulic conductivity;
• assess the long-term stability of the concrete lining under thermal loading;
• increase knowledge of the performance and reliability of monitoring devices under thermal stress and
heat;
• assess the thermally and excavation-induced geochemical perturbations and their possible impact on
radionuclide transport-related parameters; this is not a priority, however, and should not jeopardise
achievement of the other goals.
To cope with possible future changes in the repository design, the test was designed to be as design-
independent as possible.
Since it is not possible to fully reproduce the timescale (several hundreds or thousands of years (Sillen
and Marivoet, 2007)), the spatial scale and the boundary conditions of a real repository, the Heater
test is being conducted under a well-controlled and reasonably conservative combination of thermal,
hydraulic and mechanical boundary conditions. For the Heater test, a 34-metre section of the PRACLAY
gallery is being heated for 10 years at a constant temperature of 80°C at the interface between the
concrete lining of the gallery and the clay (before heating, the Boom Clay has a temperature of 16°C at
225 metres depth). This temperature is higher than would be expected in a high-level waste repository
and, in this respect, the test is on the conservative side compared with the temperature conditions in
a real repository.
Also to be on the conservative side, the test is designed so that the fluid overpressures in the clay resulting
from thermal expansion of the pore water cannot easily dissipate towards the gallery (quasi-undrained
hydraulic boundary conditions), which maximises the fluid pressure increase resulting from thermal
expansion of the pore water. In fact, an increase in pore fluid pressure within the natural barrier
reduces the contact forces between the clay particles making up this barrier, reducing its strength and

page 14 I EURIDICE Report I ref. EUR_PH_ 17_043
diminishing the mechanical stability of the repository. This required the installation of a hydraulic seal,
with bentonite-based material, at the intersection between the heated and non-heated sections of the
gallery and backfilling of the heated section with saturated sand. The installation of a hydraulic seal
constituted the Seal Test, the main goal of which was to hydraulically seal the heated section of the
gallery and its surrounding excavation-disturbed zone from the non-heated section. The hydraulic seal
is purpose-built for the PRACLAY experiment and is not representative of seals in a geological disposal
repository.
The construction of the PRACLAY gallery and its crossing with the Connecting gallery constituted
the Gallery and Crossing Test. The feasibility of excavating a gallery in the Boom Clay at a depth of
225 m using an industrial excavation technique had already been demonstrated in constructing the
Connecting gallery. During the construction of the PRACLAY gallery, it was possible to optimise the
excavation technique and further investigate the hydro-mechanical response of the Boom Clay to the
excavation work.
The Gallery and Crossing Test, the Seal Test and the Heater Test together make up the PRACLAY In-Situ
Experiment. A detailed description of all aspects of the design and installation of the experiment can be
found in the EUR 13-129 report entitled The design and installation of the PRACLAY In-Situ Experiment
EURIDICE Report (2013).
1.3. Goal and structure of this report
On 3 November 2014, the heating system was switched on. The heating power was increased
stepwise and on 19 August 2015, an average temperature of 80°C was reached at the interface
between the lining and the clay, marking the end of the start-up phase. Since then, the
temperature has been kept constant at 80°C. A first report entitled “The start-up phase of the
PRACLAY Heater test” (EUR_PH_16_025) was published in May 2016, covering the observations
from the start-up phase.
This second report summarises the observations since 3 November 2014 (start of the heating phase)
until 19 August 2017, covering the start-up phase and two full years of heating at 80°C at the Boom
Clay/concrete lining interface. Based on these observations and on a comparison with the results of
modelling exercises that were carried out before the start of the Heater test (numerical predictions), an
initial evaluation of the goals of the experiment is made.
The report is divided into four main sections:
Experimental set-up
The first section briefly describes the different components constituting the Heater test, including the
whole instrumentation and monitoring system to monitor the evolutions of the clay, and including the
set-up of the seal.
Test evolution
This section provides an overview of all the observations in the experimental set-up and the Boom Clay,
from the start-up phase and over two years of stable heating at 80°C. The temperature and pore water
pressure evolution as well as the profiles are presented. Particular attention is devoted to the observations
around Ring 50 of the PRACLAY gallery because of its central position in the heated area. Comparisons
are also made between the boreholes at different locations in order to check the consistency and
homogeneity of the results. The total stress at different interfaces (Boom Clay/bentonite, Boom Clay/
concrete lining) is also presented and discussed.

The PRACLAY Heater test after two years of the stationary phase EURIDICE Report I ref. EUR_PH_ 17_043 I page 15
Comparison with the modelling
In the third section, all observations are compared with the modelling results and interpreted in the light
of our understanding of the thermo-hydro-mechanical behaviour of the clay.
The modelling results used in this section have been obtained with the conceptualisation and the
parameter values that were defined before the start of the heating phase (numerical predictions). The
conclusions drawn from these comparisons give us a roadmap for our future modelling efforts.
Initial evaluation of the goals of the Heater test
Two years of heating at 80°C at the Boom Clay/concrete lining interface have resulted in an extensive
database on the temperature and pore water pressure evolution at various locations around the heated
section of the Heater test. From the seal, a large amount of data on the behaviour of the bentonite has
been obtained during the same period.
These findings, together with a comparison with the modelling results (numerical predictions), enable us
to make an initial evaluation of the goals of the PRACLAY Heater test. This is presented in the fourth part
of this report.

page 16 I EURIDICE Report I ref. EUR_PH_ 17_043
2. Experimental set-up
A quick overview of the main components of the PRACLAY Heater test is given in this section. The test
set-up is mainly composed of a heating system and a hydraulic seal. The gallery is backfilled with sand,
saturated and pressurised with water. The role of the seal is to hydraulically cut off the heated part from
the non-heated part (Figure 2-1). Bentonite clay, which has a high swelling potential under hydration,
was chosen to achieve this goal. In this way, the interface between the Boom Clay and the bentonite will
be sealed and permeability in the contact zone surrounding the seal will be reduced. The high pressure
inside the PRACLAY gallery will thus be maintained.
The detailed specifications for the PRACLAY gallery, the hydraulic seal, the heater and the backfill
material can be found in the report: “The design and installation of the PRACLAY In-Situ Experiment”
(Van Marcke et al., 2013).
At the end of this section, there is a brief description of the data acquisition system (DAQ) and of the
different sensors used in the experiment.
2.1. Heating system
The heating system consists of a primary heater, attached to the gallery lining, and a secondary heater,
which is placed in a central tube that rests on a support structure. Both of these are electrical heaters.
Since the primary heater is inaccessible during the Heater test, twice as many primary heater cables than
necessary have been installed (100% redundancy). The secondary heater is a back-up and will remain
accessible and replaceable at all times during the test.
A control system regulating the heating power as a function of measured and target temperatures is also
part of the heating system. During the start-up phase, the power was increased in a controlled manner
to limit the thermal gradient over the gallery lining.
The heated part of the PRACLAY gallery is divided into three zones as described in Figure 2-2:
- Zone 1: front-end zone, 2.26 m long, close to the PRACLAY seal,
- Zone 2: middle zone, 28.48 m long, in the middle of the experimental part of the gallery,
- Zone 3: far-end zone, 3.29 m long, at the end of the gallery.
Figure 2-1: An overview of the PRACLAY In-Situ Experiment, including the components of the Heater test.
The PRACLAY gallery has an inner radius of 0.95 m and the thickness of the lining is 30 cm.

The PRACLAY Heater test after two years of the stationary phase EURIDICE Report I ref. EUR_PH_ 17_043 I page 17
The power input can be controlled independently in each of the three zones. In this way, the end effects
can be minimised and a temperature field that is as uniform as possible can be created along the heated
section. This also provides the opportunity to study the long-term effects of high temperature on three
lining rings made of UHPC (ultra-high performance concrete) installed in zone 3.
Each zone comprises four heating sectors (sectors 1 to 4), as shown in Figure 2-2.
The secondary heater consists of four heater elements, which were inserted into the central tube inside
the part of the PRACLAY gallery that is being heated. The central tube contains five guide tubes (four for
heater cables and one for other purposes; see Figure 2-3) and remains accessible at all times so that
the heater elements can be replaced if necessary. The secondary heater will only be used in the event
of failure of the primary heater. Whereas the primary heater can be regulated in three separate zones to
adjust the distribution of heat at the end zones independently of the middle zone, the secondary heater
will provide the same power output along the total length of the heated section. After concerns were
raised about the possible failure of the welds of the tubes holding the secondary heater cables, a back-up
of this system was designed and installed. An additional tube with four elements was inserted inside the
central tube (Figure 2-3).
Figure 2-2: The heater layout is divided into three longitudinal zones (front-end, middle and far-end) and
into four sectors. In this Figure, only the heater cables in sector 2 are shown.
Figure 2-3: Schematic representation of the secondary heating system inside the PRACLAY gallery . (a) The
secondary heater is located in a central tube. (b) View of the different components inside the central tube
defining the original secondary heater and its replacement.
a b

page 18 I EURIDICE Report I ref. EUR_PH_ 17_043
2.2. Hydraulic seal
As described in the report on the design and installation of the PRACLAY In-situ Experiment
(Van Marcke et al., 2013), the seal has to hydraulically cut off the heated part of the PRACLAY gallery from
the non-heated part (Figure 2-4). This is achieved by physically closing off the heated part of the gallery
and by lowering the hydraulic conductivity of the clay around the seal. To this end, a bentonite ring was
installed around a central steel cylinder and in direct contact with the Boom Clay. This bentonite ring
has swelled with the absorption of water causing contact with the surrounding clay and allowing the
closure of the Boom Clay/bentonite interface. Moreover, recompression of the Boom Clay is expected
due to the swelling of the bentonite, which will locally reduce the effect of the excavation of the gallery
(EDZ, excavation-damaged zone).
An insulated frame with a door (Figure 2-5) was installed on 2 March 2015 to prevent too much heat loss
from the seal. To get a better idea of the temperature field over the seal structure, eight thermocouples
have been installed on the outer surface of the structure.
Figure 2-4: 3D view of the seal with a central steel cylinder and an
annular ring of bentonite (orange) against the clay.
Figure 2-5: Insulation door (metallic frame and window) in front of seal.

The PRACLAY Heater test after two years of the stationary phase EURIDICE Report I ref. EUR_PH_ 17_043 I page 19
2.3. Backfill sand
The part of the PRACLAY gallery that is heated is filled with water-saturated sand in order to:
• create quasi-undrained hydraulic boundary conditions at the clay/lining interface;
• efficiently transfer heat from the heater elements to the lining.
The sand (Mol M34) was put in place by blowing it in a dry state into the gallery before September 2011.
Subsequently, a total volume of about 43 m3 of tap water was injected into this part of the gallery between
January and May 2012 (Figure 2-6). Saturation of the backfilled gallery was then naturally completed with
the water flowing from the host Boom Clay into the gallery. The pore water pressure in the gallery has
gradually increased since then. On 3 November 2014 it reached 1 MPa, and the PRACLAY gallery was
estimated to be fully saturated.
During the heating phase of the experiment, the pressure evolves naturally without any human intervention
(adding or subtracting an amount of water).
2.4. Instrumentation and monitoring system
This section provides a general overview of the instrumentation programme. The PRACLAY
In-Situ Experiment has been intensively instrumented with about 1,100 sensors, as shown in Table 2-1
(piezometers, thermocouples, flat-jacks, strain gauges, etc.).
Figure 2-6: Evolution of the pore water pressure inside the backfilled part of
PG before switch-on of the heater.
Table 2-2: Inventory of the sensors involved in the PRACLAY experiment
Measurements Boom Clay Concrete lining SealPore water pressure sensors (piezometer filters)
187 14 21
Temperature (thermocouples) 196 144 46
Total pressure (flat-jacks, biaxial stress meters and piezoresistive sensors)
28 21 21
Strain gauge (vibrating strain wires) - 176 -
Topographic survey (total station with prisms)
- 43 5
Displacements (inclinometer/fibre optics)
21 23 2
Relative humidity sensors - 3 11

page 20 I EURIDICE Report I ref. EUR_PH_ 17_043
Instrumented boreholes were drilled from both the Connecting gallery (CG) and the PRACLAY gallery
(PG) (Figure 2-7, Figure 2-8 and Figure 2-9). Most boreholes are so-called multi-filter piezometers,
which, in addition to the piezometer filters to monitor pore water pressures, also contain thermocouples
(same position as the filters) and, optionally, total pressure sensors (flat-jack or biaxial stress meter) at the
deep end of the instrumented casing. Some boreholes were also drilled for displacement measurements
(inclinometer and borehole extensometers). In total, the instrumented boreholes contain more than
400 sensors around the PRACLAY gallery.
Figure 2-7: 3D view of the instrumented boreholes
surrounding the PRACLAY gallery.
Figure 2-8: Plan view of the PRACLAY gallery, and of the PG and CG boreholes. Coloured rings are
instrumented. Dots in the boreholes indicate pore water filters and temperature sensors. The distance from a
sensor to the intrados (inner surface) of a gallery (PG or CG) is noted beside the sensor.

The PRACLAY Heater test after two years of the stationary phase EURIDICE Report I ref. EUR_PH_ 17_043 I page 21
Several segmental concrete lining rings of the PRACLAY gallery have been constructed with instrumented
segments (coloured in Figure 2-8 and Figure 2-9) to monitor external radial total pressure on the ring, the
normal stresses between the segments (circumferential or hoop stress), the strains and the temperature
inside the segments. Moreover, the pore water pressure is measured at different locations inside the
gallery. Many thermocouples also monitor the heater cable temperatures. About 600 sensors have been
installed in the gallery and in its lining.
Figure 2-9: Vertical cross-section of the boreholes around the PG. The distance from a sensor to the
intrados of a gallery (PG or CG) is noted beside the sensor.

page 22 I EURIDICE Report I ref. EUR_PH_ 17_043
The instrumentation of the PRACLAY seal is mainly clustered in three sections: one located at the
upper level (“section A”), one on the right (“section B”), and one on the bottom left (“section C”).
Each zone contains total pressure sensors (flat-jacks and piezoresistive types), piezometer filters and
thermocouples. The sensors are spread on the radial range from the inner steel cylinder up to the
Boom Clay/bentonite interface. In addition, thermocouples have also been installed on the accessible
side of the seal. An automated total station, located at the crossing between the Connecting and
PRACLAY galleries, is also monitoring the movement of the seal structure. The seal instrumentation
contains more than 100 sensors.
Pore water pressure
Pore water pressures are measured through piezometer filters, incorporated into the instrumented
borehole casing or embedded inside the gallery backfill or in the bentonite ring of the seal structure.
Overall, pore water pressure is monitored using approximately 220 sensors.
Total pressure
Total pressure is measured by embedded sensors in different components throughout the experimental
set-up. The majority of these sensors are based on flat-jacks. The main applications of this type of sensor
are monitoring the total stress inside the clay formation and at the end of some instrumented boreholes
(FJ in Figure 2-8 and Figure 2-9). It is also used at the different interfaces of the seal structure, i.e. Boom
Clay/bentonite interface, Bentonite/steel central cylinder of the seal and bentonite/downstream flange
of the seal. Flat-jacks can also be found at the Boom Clay/concrete lining ring interface and between the
concrete segments, where they are used to estimate the circumferential (or hoop) stress.
Another type of total pressure sensor corresponds to a piezoresistive type (“Kulite” brand), which is
installed in the seal, where flat-jacks were not a suitable solution because of their bigger size.
Temperature
Temperature is one of the principal parameters of the experiment; hence the set-up is heavily
instrumented throughout, mainly with thermocouples. Temperature is measured in the seal, in the
concrete segments (intrados, middle and extrados) and in the clay. Instrumented boreholes from the
PRACLAY and Connecting galleries are also equipped with thermocouples. In addition, the heater
control system uses thermocouples to adjust the power output of the system at any given moment.
About 350 thermocouples have been installed, 120 in the gallery lining, and 190 in boreholes in the
Boom Clay. Since the beginning of the heating phase, numerous thermocouples have failed, mainly in
the concrete lining and in the horizontal boreholes drilled from the PRACLAY gallery. There is sufficient
redundancy built into the monitoring set-up to enable us to control the experiment and to observe the
Figure 2-10: Instrumented sections of the seal, with total pressure sensors
(turquoise and green), piezometer filters (blue) and thermocouples (red).

The PRACLAY Heater test after two years of the stationary phase EURIDICE Report I ref. EUR_PH_ 17_043 I page 23
temperature evolution in the horizontal direction with other boreholes. Analysis of the instrumentation
design of the experiment is not, however, part of this report. A detailed assessment of instrumentation
performance will be covered in future work.
Strain
The most commonly used type of strain gauge is the vibrating wire, 176 of which are embedded in the
concrete lining segment of four instrumented rings. These are oriented in the circumferential direction of
the ring, allowing monitoring of the deformation caused by the loads acting on the concrete segments.
Unfortunately, most of the strain gauges inside the heated section failed before reaching 80°C for reasons
that are currently unknown.
Relative humidity
The accessible part of the gallery is equipped with three sensors to monitor the relative humidity of the
air. Originally, several filters inside the seal were also equipped with these sensors, but they stopped
working soon after artificial hydration of the bentonite ring started.
Displacement
The major set-up for displacement monitoring is based on an automated total station, which is positioned
in the gallery crossing, and which measures several times a day the position of the seal structure (visible
part) and of several rings of the accessible part of the PRACLAY gallery – in particular to check whether
the PRACLAY gallery is moving towards the Connecting gallery, mainly due to the elevated pore water
pressure inside the heated part of the PRACLAY gallery.
2.5. Data Acquisition system A basic representation of the data flow process from sensor to data report is shown in Figure 2-11. First, the
signal output of the sensors is read and converted into a digital signal by a data logger or a data acquisition
front-end. In the PRACLAY experiment, more than 30 data loggers and data acquisition front-ends of different
types are used. As a second step, the data acquisition PC controls all these devices and converts the different
data formats into one standard format. Data is then automatically transferred to a database server, which
stores the raw data and also performs the data conversions, i.e. calculating engineered data from raw data.
For the follow-up of the experiment, visualisation software that accesses the data from the database
server is used.
A selected set of sensors is checked automatically by the database server, looking for deviating
measurements. If alarm limits are exceeded, e-mail notification is sent. In addition to these database alarms,
hardwired alarms have been implemented for the most critical parameters, such as pore water pressure
in the gallery and heater parameters. Some operational components of the experimental set-up, such as
the heater control system and the power supplies, are also connected to a hardwired alarm system. This
hardwired alarm system functions independently of the data acquisition system for maximum reliability.
Figure 2-11: Schematic representation of the data flow. From left to right: sensor, data
logger, data acquisition PC, database server and visualisation software.

page 24 I EURIDICE Report I ref. EUR_PH_ 17_043
3. Test evolution
Section 3 presents the main results since the switch-on of the heating system on 3 November 2014 until
19 August 2017. This includes the three stages of the start-up heating phase and the first two years of
the stationary phase characterised by a constant temperature of 80°C at the interface of the Boom Clay
and the concrete lining. This section therefore discusses the observations of the so-called “test-control
parameters”, i.e. the temperature in the concrete lining (intrados and middle), the temperature at the
Boom Clay/concrete lining (extrados) interface and the pore water pressure inside the backfilled part of
the gallery. These three are the main parameters controlling the thermo-hydro-mechanical boundary
conditions of the experiment. The response inside the Boom Clay is presented with particular attention
devoted to the area around Ring 50 of the PRACLAY gallery, in the middle of the heated section, followed
by comparison with the other boreholes from the PRACLAY gallery and comparison with the observations
from boreholes from the CG. Finally, the different responses in the bentonite seal (total stress, pore water
pressure and temperature) and within the concrete lining rings (stress) are presented.
During the start-up phase, the power of the heating system was increased stepwise to reach the target
temperature of 80°C at the Boom Clay/lining interface. The heater was switched on on 3 November 2014
with a constant power of 250 W/m for the three zones of the primary heating system. Two months later
(on 7 January 2015), the power was increased from 250 W/m to 350 W/m. On 3 March, the power was
again increased to 450 W/m and maintained until the temperature at the extrados of the concrete lining
reached 80°C (19 August 2015). This temperature was kept constant by gradually reducing the power in
Zone 1 and Zone 2 while the power in Zone 3 was kept constant. Once the temperature reached about
80°C on average for Ring 81, the power in zone 3 was also gradually reduced.
Table 3-1 summarises the history of the applied heating power during the start-up phase until the target
temperature of 80°C was reached.
Table 3-1: Applied power in the three zones during the start-up phase of the heating experiment.
Zone 1Front-end Zone
Zone 2Middle Zone
Zone 3Far-end Zone
Axial length in m 2.26 28.48 3.29
Linear power (3 Nov 2014) in W/m 250 250 250
Linear power (7 Jan 2015) in W/m 350 350 350
Linear power (3 March 2015) in W/m 450 450 450

The PRACLAY Heater test after two years of the stationary phase EURIDICE Report I ref. EUR_PH_ 17_043 I page 25
Figure 3-1 shows the measured heating power in one of the heater sectors of each zone during the start-up
phase and the two-year stationary phase. As already explained, the power was gradually reduced in Zone 1
and Zone 2 to maintain the target temperature after the start-up phase, while in Zone 3, the power was only
reduced gradually from June 2016 when the temperature also reached 80°C on average in this latter zone.
In order to correctly identify the beginning of the stationary phase, it was necessary to define an indicator
for the target temperature of 80°C. For this, the average temperature over the thermocouples at the outer
surface of rings 37, 50 and 55 in Zone 2 is used. In Zone 3, a separate thermal indicator was defined by
averaging the extrados thermocouples of Ring 81 inside Zone 3. In this way, the power can be controlled in
Zone 3 independently of Zone 2 to also reach 80°C in Zone 3, despite the increased dissipation at the end of
the gallery. The reason for doing this is to test the performance of the high-performance concrete segments
in that zone under high thermal load. If one of the thermocouples used in a thermal indicator fails or shows
abnormal measurements, the indicator is adjusted (e.g. by removing the failed sensor data from the average).
Figure 3-2 shows the evolution of these average temperatures. The different heating phases are clearly
visible on the graph. It can also be seen that 80°C was reached in mid-August 2015 in Zone 2, indicating
the start of the stationary phase. The evolution of the average temperature in Ring 81 showed that the
target temperature was reached almost one year after the beginning of the stationary phase.
Figure 3-1: Evolution of the heating power in W/m.
Figure 3-2: Average temperature evolution over the three rings (R37/R50/R55) for Zone 2
and on R81 for Zone 3. The average temperature is calculated based on the extrados
thermocouples in the concrete lining.

page 26 I EURIDICE Report I ref. EUR_PH_ 17_043
3.1. Temperature in the concrete lining and at the lining/Boom Clay interface
Once the power was switched on, the temperature started to increase in the concrete lining rings. In
order to monitor the temperature evolution inside the concrete segments of the gallery, thermocouples
were embedded in 10 concrete lining rings of the gallery, as shown in Figure 3-3.
Figure 3-4 shows the temperature evolution inside Ring 50 (PG50), located in the middle of the heated part
of the PRACLAY gallery (Figure 3-3). The temperature in segments S4, S6 and S8 increases in a similar way
(the measurements of S2 are not reliable). The different power steps of increase can be observed with a rapid
temperature increase at each new step followed by a decrease in the temperature increase rate with time.
At the end of the start-up phase (August 2015), the temperature at the extrados was about 80°C while at the
intrados, a value close to 85°C was obtained. This means that the temperature difference over a segment is
approximately 5°C. During the next two years of the stationary phase, the temperature, according to the thermal
indicator (explained earlier), was kept constant at the extrados. Figure 3-4 shows that the temperature varied
slightly. As the power, required to maintain 80°C, decreased slightly over time, the heat flux density through
the lining decreased and, as expected, a very small decrease at the intrados was observed. At the extrados, the
temperature increased very slightly at S6 and remained quite constant for the other thermocouples at S4 and S8.
Figure 3-3: (a) View of the 10 lining rings of the PG instrumented with thermocouples (R3, R16, R20, R21,
R29, R37, R50, R55, R68, R81). (b) Position of the temperature sensors inside the instrumented segments
(S2, S4, S6 and S8; IN: inner, M: middle and OUT: outer).
a b
a b
Figure 3-4: Temperature evolution in four segments of Ring 50 (IN: inner or intrados, OUT: outer or extrados).
Temperature evolution at the intrados of PG50 Temperature evolution at the extrados of PG50
c Layout of the thermo-couples inside a concrete ring

The PRACLAY Heater test after two years of the stationary phase EURIDICE Report I ref. EUR_PH_ 17_043 I page 27
Figure 3-5 shows the longitudinal profiles of the lining temperature, in the direction parallel to the
gallery axis, at different stages of heating. The temperatures are measured at the outer surface of the
S4 segments (bottom part of the PG) of the different instrumented lining rings. The profiles show rather
uniform temperature distributions along the heated part of the PRACLAY gallery at the beginning of the
experiment (with a slight gradient, the temperatures at the far end usually being a bit lower). Close to the
seal, the temperature is lower than 80°C, which is certainly an effect of heat dissipation through the seal
structure and the windows. Based on these profiles, it can be stated that the thermal indicators are an
efficient way to control the experiment.
Similar longitudinal temperature profiles are observed in the other segments when 80°C is reached, as
can be seen in Figure 3-6. The temperature evolution is generally homogeneous between the different
positions (S4, S6, S8). Nevertheless, it is observed that the temperature close to the seal structure is higher
at the top of the gallery (S8) compared with the other segments (S2, S4, S6).
Figure 3-5: Evolution of the extrados temperature profiles along the heated part of the PRACLAY
gallery (measured on the outer surface of the “S4” segments of the different instrumented lining rings).
Figure 3-6: Temperature profiles along the outer surface of the concrete lining segment
at different locations in the gallery in August 2017.

page 28 I EURIDICE Report I ref. EUR_PH_ 17_043
3.2. Pore water pressure inside the PRACLAY gallery
A number of filters are installed inside the backfilled part of the gallery with the goal of monitoring the
pore water pressure inside. As already explained, this backfilled part was pressurised by injecting water
before the start of the heating phase. Once the pressure reached 0.5 MPa, it was allowed to evolve
without any additional injection of water. Because of Boom Clay water inflow, the pressure rose to a
value of about 1 MPa just before the start of heating.
Heating generates an excess pore water pressure inside the gallery due to a higher thermal dilation
coefficient of water compared with the solid phase (sand, concrete). The evolution of the pressure inside
the backfilled part of the PRACLAY gallery can be seen in Figure 3-7. It is observed that the effect of
heating was instantaneous. This confirmed an initial water saturation of the system. The different heating
steps can be clearly seen in this Figure. A sudden pressure drop and a quick recovery can be observed
during the first heating step (at 250 W/m). This can be attributed to a small displacement of a segment or
the sudden ingress of a limited volume of pore water into a borehole casing that may have been initially
plugged. A value of 2.9 MPa was reached when the temperature measured 80°C at the extrados of the
concrete lining. At the beginning of the stationary phase, a small drop in pore water pressure caused by
the power decrease was observed. Afterwards, the pore water pressure remained more or less constant
at around 2.8 MPa, as expected from the nearly constant temperature evolution in the gallery and at the
Boom Clay/lining interface.
3.3. Boom Clay responses
Observations around Ring 50 of the PRACLAY gallery
The response of the Boom Clay to heating is mainly monitored through the instrumented boreholes
drilled either from the PRACLAY gallery (PG) or from the Connecting gallery (CG), as shown in Figure 3-8
and Figure 3-9, in which the distance of each sensor (piezometers and thermocouples) from the gallery
lining intrados is indicated. The distance of the Connecting gallery boreholes parallel to PRACLAY from
the axis of the PRACLAY gallery is also shown.
Figure 3-7: Pore water pressure inside the PG.

The PRACLAY Heater test after two years of the stationary phase EURIDICE Report I ref. EUR_PH_ 17_043 I page 29
The focus is on Ring 50. Because of the central position of this ring, these measurements are considered
to be the most representative for the experiment. At this specific location, four boreholes from the
PRACLAY gallery equipped with piezometer filters and thermocouples are present. In addition, boreholes
drilled from the Connecting gallery, parallel to the PRACLAY gallery axis, are used to generate additional
profiles of temperature and pore water pressure around Ring 50 of the PRACLAY gallery. Due to too many
faulty temperature sensors in PG50S, the measurements of four Connecting gallery boreholes are used
for the horizontal profile at Ring 50 instead (indicated in red in Figure 3-8).
Figure 3-8: Presentation of the instrumentation around the PG including the borehole drilled from the
CG. This diagram corresponds to a horizontal cross-section taken in the middle of the axis of PG. The red
rectangle corresponds to a horizontal profile opposite to PG50S, using sensors from the CG boreholes.
The number indicates the distance from the intrados of the PG or from the CG.

page 30 I EURIDICE Report I ref. EUR_PH_ 17_043
Temperature evolution
Figure 3-10 shows the temperature evolution at different filters of borehole PG50D, drilled vertically from
Ring 50 in the PRACLAY gallery, as can be seen in Figure 3-9. The different heating phases leading to the
stationary phase can be observed. At the end of the reporting period (August 2017), the temperature in
the sensor closest to the PRACLAY gallery, i.e. 0.5 m from the inner surface, was almost equal to 75°C.
The vertically affected temperature zone was less than 16 m, as the temperature at a distance of 16 m
from the intrados had not changed significantly since the start of heating.
Figure 3-9: Vertical cross-section of the different boreholes (PG50) at Ring 50 of the PG. The orientation of
a borehole is indicated by one or two letters (S=south (horizontal); D=down; Id=Inclined down; Iu=Inclined
up). The number refers to the distance of the sensors from the intrados of the gallery lining.
Figure 3-10: Temperature evolution in selected thermocouples installed in borehole PG50D.

The PRACLAY Heater test after two years of the stationary phase EURIDICE Report I ref. EUR_PH_ 17_043 I page 31
In the horizontal direction, the evolution of the temperature is monitored with the thermocouples
installed in four boreholes drilled from the Connecting gallery, as explained at the beginning of this
section. The measurements are used from the thermocouples located 27.5 metres from the Connecting
gallery lining, approximately corresponding to the axial position of Ring 50 of the PG. Figure 3-11 shows
that the temperature started to increase almost immediately for the closest point to the PRACLAY gallery
intrados. For the horizontal direction, the thermally affected zone had extended at least 14.75 m inside
the clay formation by the end of the reporting period. An increase in temperature up to a value of 65°C
for the closest sensor from the PRACLAY gallery was observed. The temperature increased very slowly
and smoothly since the start of the stationary phase.
Pore water pressure evolution
Figure 3-12 and Figure 3-13 show the pore water pressure measurements from the horizontal
(PG50S) and the vertical (PG50D) PRACLAY gallery boreholes, respectively. The initial state of the
pore water pressure prior to heating depends on the effect of drainage of the PRACLAY gallery when
the gallery was open, and on the backfilling and pressurisation of the gallery after the installation
of the seal structure in 2012. As a consequence, at the beginning of the heating phase pore water
pressures were lower close to the gallery than in the far field, as can be seen in Figure 3-12 and
Figure 3-13.
Overall, the pore water pressure increases with the temperature evolution over time. The magnitude
of this pore water pressure increase is almost the same in both directions (horizontal and vertical)
for filters installed at a comparable distance from the gallery. During the stationary phase, a direct
reaction characterised by a small decrease in the pressure can be seen for the closest point from the
gallery lining in PG50S. This drop is very similar to that observed in the backfilled part of the gallery.
The evolution 2 m from the gallery lining shows a slight and continuous increase up to a point where
the pressure starts to decrease slightly. This evolution is representative of the movement of the peak in
pore water pressure, which tends to move away from the gallery towards the clay. This transition will
be further demonstrated in this section by plotting the pore water pressure profiles. Further into the
clay, the pore water pressure continues to increase slowly at different rates, depending on the distance
of the sensor from the concrete lining, lower rates being observed for the deepest points in the clay.
In PG50D, a sudden increase followed by a decrease is observed at 16 m; the reason for this abnormal
observation is not yet known.
Figure 3-11: Temperature evolution around PG50 measured with the thermocouples from the CG boreholes.

page 32 I EURIDICE Report I ref. EUR_PH_ 17_043
It can be concluded from the observations of pore water pressure up until the end of August
2017 that the hydraulically affected zone seems to be similar for both horizontal and vertical
directions. In fact, at the end of August 2017, changes in pore water pressure were observed at
a distance of up to 16 m in both directions. Uncertainty remains over this distance because the
filters at 20 m show an unexpected and unreliable evolution. This distance will be confirmed later
in the report.
When we look at the evolution of the pore water pressure around PG50 with the piezometer
filters located in the boreholes drilled from the Connecting gallery (i.e. horizontal profile in the
opposite direction to PG50S) a similar evolution is observed as that in PG50S (Figure 3-14). The
hydraulically affected zone can be estimated to be a minimum of 14.75 m deep inside the clay
in August 2017, which confirms the observations from borehole PG50S. The stationary phase is
characterised by a slow, regular evolution of the pore water pressure inside the clay. Similar to
the previous observations, the pore water pressure close to the gallery lining 0.75 m from the
intrados has recorded a constant value for these two years at 80°C. Further into the clay, the
pore water pressure increases at different rates, depending on the distance of the sensor from
the intrados.
Figure 3-12: Evolution of the pore water pressure in selected piezometers of PG50S.
Figure 3-13: Evolution of the pore water pressure in selected piezometers of PG50D.

The PRACLAY Heater test after two years of the stationary phase EURIDICE Report I ref. EUR_PH_ 17_043 I page 33
Temperature and pore water pressure profiles
Temperature and pore water pressure profiles around Ring 50 of the PRACLAY gallery are based on
measurements from boreholes drilled in different directions from Ring 50 (Figure 3-9) and boreholes
drilled from the Connecting gallery, parallel to the PRACLAY gallery axis (Figure 3-8).
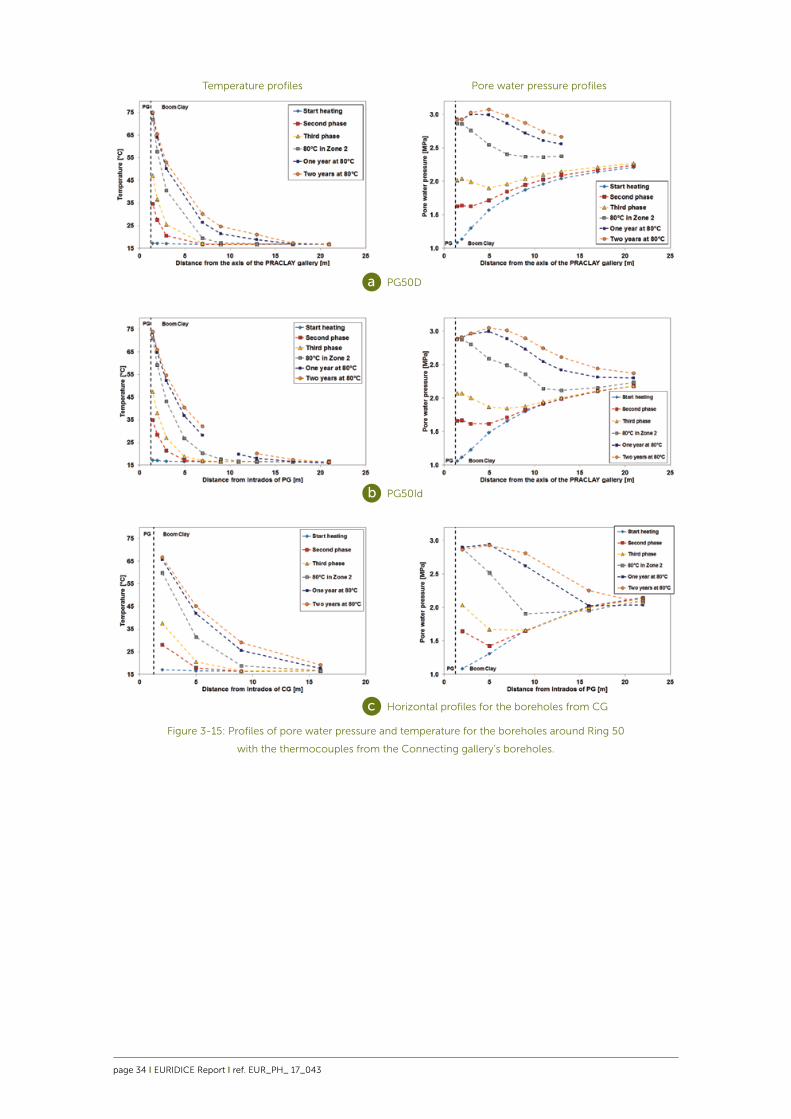
Figure 3-15 shows the temperature and pore water pressure profiles at different times during the
Heater test. As expected, the temperature gradually increases in the clay around the heated part of the
PRACLAY gallery. Overall, the increase is similar for both downward (PG50D and PG50Id) and horizontal
(Connecting gallery boreholes) profiles.
By plotting the temperature profiles at different times after the beginning of the heating phase
(Figure 3-16 (a)), it can be observed that the temperature profile in the horizontal boreholes is
slightly higher than that in the downward boreholes. This confirms, once again, the anisotropic
thermal behaviour of the Boom Clay. In terms of the thermally affected zone, a radius of about
15 m seems to be affected by the temperature for all considered directions at the end of the
reporting period (August 2017).
In terms of pore water pressure, the magnitude of the increase is approximately similar for all the
profiles, with a maximal absolute value around 2.9 MPa in August 2015, when the target temperature
of 80°C was reached (see Figure 3-15, right). During the first two years of the stationary phase,
the pore water pressure close to the gallery lining remained nearly constant while the pore water
pressure continued to increase further into the clay. The peak of pore water pressure tends to
move further away into the clay. At the end of the reporting period (August 2017), the hydraulically
affected zone was likely to be around 15 m for all the boreholes and the peak of pore water
pressure was located at a distance of about 4.5 m from the interface between the PRACLAY gallery
and the clay.
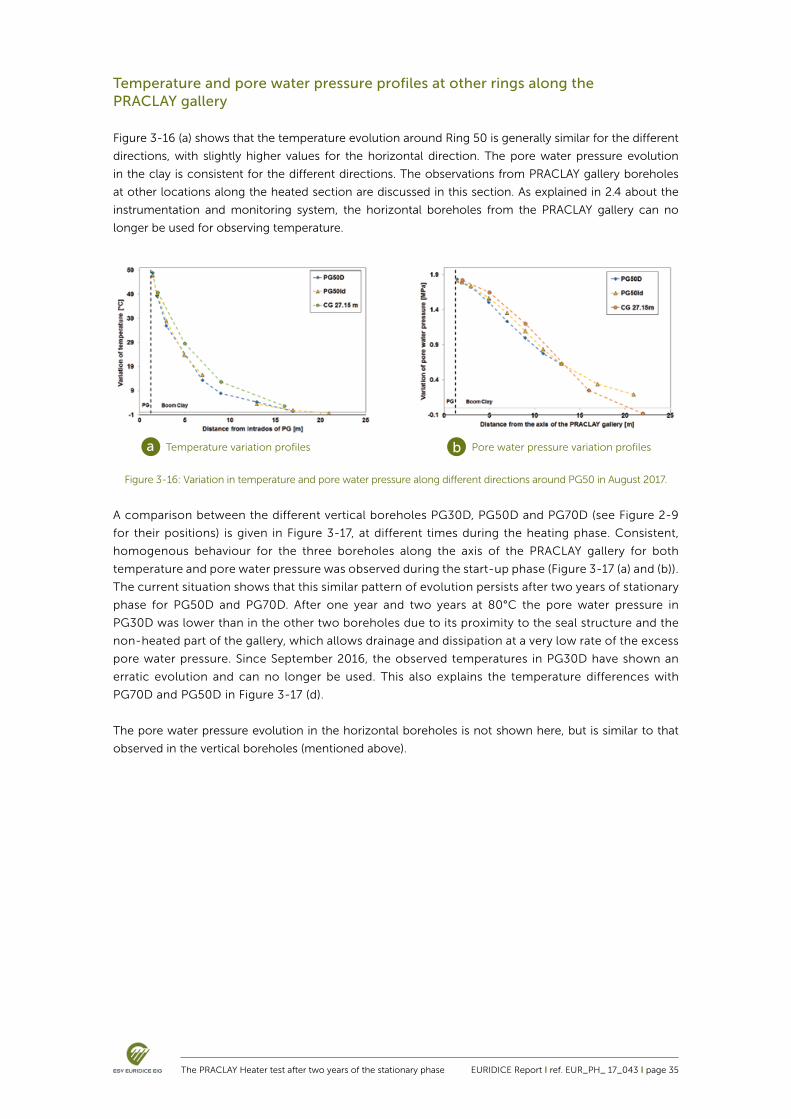
Figure 3-16 (b) presents a comparison of the pore water pressure variation profiles since the start of
the heating phase for the two boreholes around Ring 50 of the PRACLAY gallery and the profile for the
boreholes drilled from the CG. A very similar variation in the pore water pressure for all the profiles can
be observed.
Figure 3-14: Evolution of the pore water pressure in piezometers from the CG.
page 34 I EURIDICE Report I ref. EUR_PH_ 17_043
Temperature profiles Pore water pressure profiles
a
b
c
PG50D
PG50Id
Figure 3-15: Profiles of pore water pressure and temperature for the boreholes around Ring 50
with the thermocouples from the Connecting gallery’s boreholes.
Horizontal profiles for the boreholes from CG
The PRACLAY Heater test after two years of the stationary phase EURIDICE Report I ref. EUR_PH_ 17_043 I page 35
Temperature and pore water pressure profiles at other rings along the PRACLAY gallery
Figure 3-16 (a) shows that the temperature evolution around Ring 50 is generally similar for the different
directions, with slightly higher values for the horizontal direction. The pore water pressure evolution
in the clay is consistent for the different directions. The observations from PRACLAY gallery boreholes
at other locations along the heated section are discussed in this section. As explained in 2.4 about the
instrumentation and monitoring system, the horizontal boreholes from the PRACLAY gallery can no
longer be used for observing temperature.
A comparison between the different vertical boreholes PG30D, PG50D and PG70D (see Figure 2-9
for their positions) is given in Figure 3-17, at different times during the heating phase. Consistent,
homogenous behaviour for the three boreholes along the axis of the PRACLAY gallery for both
temperature and pore water pressure was observed during the start-up phase (Figure 3-17 (a) and (b)).
The current situation shows that this similar pattern of evolution persists after two years of stationary
phase for PG50D and PG70D. After one year and two years at 80°C the pore water pressure in
PG30D was lower than in the other two boreholes due to its proximity to the seal structure and the
non-heated part of the gallery, which allows drainage and dissipation at a very low rate of the excess
pore water pressure. Since September 2016, the observed temperatures in PG30D have shown an
erratic evolution and can no longer be used. This also explains the temperature differences with
PG70D and PG50D in Figure 3-17 (d).
The pore water pressure evolution in the horizontal boreholes is not shown here, but is similar to that
observed in the vertical boreholes (mentioned above).
a Temperature variation profiles
Figure 3-16: Variation in temperature and pore water pressure along different directions around PG50 in August 2017.
b Pore water pressure variation profiles

page 36 I EURIDICE Report I ref. EUR_PH_ 17_043
Temperature profiles Pore water pressure profiles
a
b
c
At the time of the switch-on
2015-08-19 at 80°C (end of the start-up phase)
Figure 3-17: Temperature and pore water pressure profiles for the three boreholes PG30D, PG50D and
PG70D, at different times: start of the experiment, at 80°C, etc.
One year at 80°C
d Two years at 80°C

The PRACLAY Heater test after two years of the stationary phase EURIDICE Report I ref. EUR_PH_ 17_043 I page 37
Temperature and pore water pressure profiles in boreholes drilled from the Connecting gallery
This section discusses the observations from boreholes drilled from the Connecting gallery. Figure 3 -18
shows the evolution over time of the temperature and pore water pressure for sensors in P35E. This
borehole runs parallel to the PRACLAY gallery axis at a distance of 2 m.
The temperature evolution shows a continuing increase in temperature of a magnitude that differs
depending on the position of the sensor, either close to the centre of the heated section of the
PRACLAY gallery or closer to the ends of that section. At 44.8 m, abnormal variations were seen between
June 2016 and January 2017, induced by a technical problem with the data acquisition system.
The pore water pressure evolution follows the same trend: the pressure increase and the rate of increase
depend on the position of the piezometer filters with respect to the heated section. The evolution is quite
uniform for the sensors close to the heated zone. During the two-year stationary phase, a nearly constant
value of pore water pressure was observed for most of the sensors.
Figure 3-19 shows the evolution of the temperature and pore water pressure profiles along P35E. Both
exhibit a relatively uniform evolution along the length of the PRACLAY gallery from the seal towards
the end of the PRACLAY gallery. The presence and effect of the hydraulic seal can clearly be seen in
these graphs. Nevertheless, a slight decrease in the temperature field with distance from the Connecting
gallery is observed.
During the stationary phase, the temperature in the clay continued to increase slightly. Over the same
period, the pore water pressure remained mainly constant.
Figure 3-18: Evolution of temperature and pore water pressure in borehole
P35E, which is parallel to the PG axis, as can be seen in c).
a
c
bTemperature evolution
Position of the sensors in P35E located 2 m from the PG axis
Pore water pressure evolution

page 38 I EURIDICE Report I ref. EUR_PH_ 17_043
Figure 3-20 shows the evolution of the temperature and pore water pressure profiles for the three boreholes
P38E, P42E and P49E, which are parallel to the axis of the PRACLAY gallery at a distance of 5, 9 and 16 m from
the PRACLAY gallery axis, respectively (see Figure 3-8). The same conclusions as previously can be drawn,
with the generation of a pore water pressure increase caused by the rise in temperature in the clay. The
measurements for P38E clearly show the effect of the hydraulic seal. Whereas no reactions were observed
in P49E during the start-up phase, a small increase in temperature and in pore water pressure was observed
after the first year of the stationary phase and a more marked increase after the second year, defining and
confirming the size of the hydraulic and thermal zone, this being about 16 m from the PRACLAY gallery axis.
The estimation of the extent of the thermally and hydraulically affected zone based on these observations
is consistent with the observations from the boreholes drilled from the PRACLAY gallery (mentioned above).
Figure 3-19: Evolution of temperature and pore water pressure profiles in P35E.
a bTemperature profiles in P35E Pore water pressure profiles in P35E
a bTemperature profiles in P38E
(5 m from the PG axis)
Pore water pressure profiles in P38E
(5 m from the PG axis)
c dTemperature profiles in P42E
(9 m from the PG axis)
Pore water pressure profiles in P42E
(9 m from the PG axis)

The PRACLAY Heater test after two years of the stationary phase EURIDICE Report I ref. EUR_PH_ 17_043 I page 39
Comparison between the observations from the PRACLAY gallery and the Connecting gallery boreholes (August 2017)
Figure 3-21 (c) compares the temperature profiles perpendicular to the PRACLAY gallery obtained from
different boreholes: the PRACLAY gallery boreholes at different locations along the heated section and
the profiles with measurements from the Connecting gallery boreholes, at a distance of 17.5 m and
27.5 m from the Connecting gallery. It can be seen that these horizontal profiles (hereafter identified as
CG17.5 and CG27.15) show a slightly higher temperature than the vertical ones, indicating and confirming
the anisotropic properties of the clay.
e fTemperature profiles in P49E
(16 m from the PG axis)
Pore water pressure profiles in P49E
(16 m from the PG axis)
Figure 3-20: Temperature and pore water pressure profiles for P38E, P42E and P49E.
Figure 3-21: Profiles of temperature in the PRACLAY gallery boreholes and at a distance of
17.5 m and 27.5 m from the CG in August 2017.

page 40 I EURIDICE Report I ref. EUR_PH_ 17_043
Figure 3-22 shows the pore water pressure profiles in the horizontal plane and in the vertical plane (upward
and downward). For the horizontal plane, the profiles at comparable distances from the Connecting gallery are
similar for the boreholes from the PRACLAY gallery and from the Connecting gallery (Figure 3-22 (a)): PG30S
corresponds with CG17.5 and PG50S corresponds with CG27.5. Unsurprisingly, the set of profiles (PG50S &
CG27.5) in the plane perpendicular to the gallery axis at mid-length of the heated section show the highest pore
water pressures. Similar results are obtained for the vertical boreholes, as can be seen in Figure 3-22 (b). A rather
homogenous distribution of pore water pressure is generally observed around the heated section.
Based on all the observations described above (time histories of pressure and temperature variations, profiles
along boreholes radial and parallel to the PRACLAY gallery), it is clear that no drastic or sudden changes in
pore water pressure occurred, which might indicate that the structural integrity of the clay was maintained
during these two years of stationary phase. This assertion will be confirmed later in this report by comparing
the observations with the outcome of the finite element modelling that shows no sign of cracks or instability
in the clay massif. In addition, permeability in-situ tests before and during the heating show that the intrinsic
permeability is not affected by the thermal load indicating no modification of the clay structure. The detailed
numerical modelling results and mechanical response of the clay will be discussed in the next PRACLAY report
with a more in-depth scientific interpretation of the thermo-hydro-mechanical behaviour of the clay.
Total pressure measurements
Measurements of total pressure (flat-jack sensors) inside the clay indicate that heating causes a similar
increase in the total pressure as for the pore water pressure. Figure 3-23 shows this for the measurements
in P42E. Comparison with the pore water pressure evolution measured in the closest piezometer filter
reveals that the evolution of the effective stress does not change suddenly. This observation is crucial,
as it demonstrates the absence of fracturing phenomena or drastic changes in the clay. A significant
decrease in the effective stress would indicate a loss of structural integrity of the clay. As explained in the
last paragraph of the previous section, this will be discussed in more detail in the next PRACLAY report.
Figure 3-22: Profiles of pore water pressure in the PRACLAY gallery boreholes and
at a distance of 17.5 m and 27.5 m from the CG in August 2017.
a bHorizontal profiles Vertical profiles
Figure 3-23: Evolution of the total pressure measured in P42E and comparison with the
pore water pressure measured with the closest piezometer to the flat-jack.
a bTotal pressure Total pressure variation

The PRACLAY Heater test after two years of the stationary phase EURIDICE Report I ref. EUR_PH_ 17_043 I page 41
3.4. Responses in the bentonite seal
As explained in Section 2, the seal has to hydraulically cut off the heated part of the PRACLAY gallery
from the non-heated part. The steel cylinder physically closes off the heated section. A large number of
cables that are connected to sensors inside the gallery or to the heating system run through this seal by
means of watertight feedthroughs. The seal is visually inspected on a daily basis. During the start-up and
stationary phases, no significant leakages occurred.
To lower the hydraulic conductivity of the clay around the seal, a bentonite ring was installed around a
central steel cylinder and in direct contact with the Boom Clay. To monitor its evolution, instruments
were embedded inside the bentonite blocks during the installation of the seal in three different zones,
A, B and C (Figure 3-24). Various instruments, such as piezometers, flat-jacks and thermocouples, are
installed in these sections.
Figure 3-25 shows the evolution of the temperature for different thermocouples (TC) in section A.
A temperature increase has been observed since the beginning of the heating phase with a different evolution
between TC-A15 and TCA1, TC-A11 and TC-A5. TC-A11 and TC-A1 are located at the bentonite/steel flange
interface facing the heated side of the gallery, while TC-A5 and TC-A15 are located at the bentonite/steel
flange interface facing the non-heated side of the gallery. At the beginning of the third step of the start-up
phase, it was observed that thermocouples TC-A15 and TC-A5 increased faster as compared with the two first
steps. This observation is related to the installation of the insulation frame and door in front of the seal, one
day before the third heating step. This contributes to a lower dissipation of heat into the non-heated part of
the PRACLAY gallery, which will have consequences for subsequent observations.
The stationary phase is characterised by a near-constant value of the temperature for sensors TC-A15 and
TC-A5 and by a slight decrease in the temperature for sensors TC-A11 and TC-A1, the latter resulting from
the reduction in power.
Figure 3-24: Illustration of the seal with the different sensors.
Figure 3-25: Evolution of the temperature in section A of the seal structure.

page 42 I EURIDICE Report I ref. EUR_PH_ 17_043
Figure 3-26 shows the evolution of the pore water pressure at the Boom Clay/bentonite interface for the
three sections of the seal, and compares it with the PRACLAY gallery pore water pressure evolution. Seal
PP-A1, Seal PP-B1 and Seal PP-C2 are located at the same axial (longitudinal) position in the bentonite
ring. The three heating steps of the start-up phase can be clearly distinguished. The pore water pressure
evolutions between these three sensors are very similar and smoothly follow the evolution of pore water
pressure in the PG. Conversely, Seal PP-A3, which is closer to the accessible, open part of the PG, registers
a smaller pore water pressure value compared with the other three.
A constant or very slight increase in the pore water pressure for all the sensors at the Boom Clay/bentonite
interface characterises the stationary phase. The seal continues to perfectly fulfil its role as hydraulic cut-off
limiting the dissipation of the excess pore water pressure generated by the heating phase. This also shows the
stability of this seal structure and its ability to maintain high pore water pressure inside the PRACLAY gallery.
Figure 3-27 shows the pore water pressure measured at different positions at the top of the PG, from
the heated part (Ring 21) to the accessible part (Ring 20), thereby covering the Boom Clay/bentonite
interface over a total length of about 1.5 m. This Figure again identifies the regular transition from high
pressure to low pressure over this distance.
Figure 3-26: Pore water pressures at the Boom Clay/bentonite interface for the three sections A, B and C
(filters facing the Boom Clay), together with the pore water pressure inside the PG.
Figure 3-27: Pore water pressures measured at the Boom Clay/bentonite interface in
section A and at the Boom Clay/concrete lining interface in Ring 21 and Ring 20.
All sensors are located at the top of the gallery facing the Boom Clay.

The PRACLAY Heater test after two years of the stationary phase EURIDICE Report I ref. EUR_PH_ 17_043 I page 43
Figure 3-28 and Figure 3-29 show the evolution of the total pressure at the Boom Clay/bentonite interface
(radial) and at the bentonite/steel downstream flange interface (axial), respectively. For all sections, the
total radial pressure, against the Boom Clay, increased after the heater switch-on. The effect of the
insulation door produced a small increase around the beginning of the third heating step of the start-up
phase. Unfortunately, Seal PG-PG-A1 failed early in July 2015. Seal PG-PG-B1 continued to measure a
continuous slight increase in the total radial pressure. Considering that the pore water pressure measured
by Seal PP-B1 near this sensor levelled off (Figure 3-26), this increase in total pressure should indicate
a consolidation of the clay by the swelling bentonite (?) with an increase in the effective stress at the
Boom Clay/bentonite interface.
The total axial pressure showed a somewhat similar evolution during the start-up phase, with a small
increase at the beginning of the heating phase followed by an almost constant or even decreasing trend
for section A. A small pressure increase related to the combined effect of the insulation frame and door
installation and of the power rise was observed at the start of the third heating step. The axial pressure
did not seem to evolve during the stationary phase except for Seal PG-PG-B5, where there was a small
increase before the sensor failed.
Figure 3-28: Total radial pressure at the Boom Clay/bentonite interface.
Figure 3-29: Total axial pressure at the bentonite/steel flange interface.

page 44 I EURIDICE Report I ref. EUR_PH_ 17_043
The total radial pressure at the bentonite/steel cylinder interface showed a slight continuous increase
during the stationary phase, as can be seen in Figure 3-30. Within the start-up phase a slight increase
was observed for all the sensors. The distribution of the total radial pressure around the cylinder has been
heterogeneous since the outset and this heterogeneity persisted during the heating phase.
A total station, which is able to determine the distance between its fixed position and the position of the
prisms attached to a structure, monitors the displacement of the seal structure towards the Connecting
gallery. The results of this monitoring are shown in Figure 3-31, where the pore water pressure evolution
inside the PRACLAY gallery is added to link it with the displacements of the seal structure.
Since the beginning of the heating phase, all four prisms on the seal have undergone rather homogeneous
displacement. Since the insulation door was installed in front of the seal, the measurements have shown
some variations due to the presence of the door. Nevertheless, the trend in the displacement can still be
observed and, at the end of the start-up phase, an overall displacement of about 10 mm was obtained
for the different points.
The stationary phase is characterised by a very slow increase in the displacement towards the Connecting
gallery. As the pore water pressure in the gallery reached about 2.8 MPa, the displacements have only
ranged between 11 and 13 mm towards the Connecting gallery since the start of the topographic survey,
which coincided with the beginning of the saturation and pressurisation of the backfilled part of the PG.
Figure 3-31: Displacement of the seal structure since the start of the heating phase (positive displacement towards CG).
Figure 3-30: Total radial pressure at the bentonite/steel cylinder interface.

The PRACLAY Heater test after two years of the stationary phase EURIDICE Report I ref. EUR_PH_ 17_043 I page 45
It can be concluded from all the observations within the seal structure that it fulfils its role as a hydraulic cut-off,
allowing the development of a uniform high pressure inside and a high, non-uniform pressure around the heat-
ed section of the PRACLAY gallery. Uniform displacement of the seal towards the Connecting gallery by about
12 mm on average has been observed since the start of the topographic survey of the seal. Despite this, and the
shear deformations that this displacement caused along the clay/bentonite interface, the seal performs its func-
tion. The swelling of the bentonite is thus effective in closing the interface with the clay and sufficiently lowering
the hydraulic conductivity of the clay surrounding the seal. The steel cylinder does not show any sign of leakage.
3.5. Responses in the concrete lining
Total pressure against the lining
Three lining rings (Ring 12, Ring 46 and Ring 78) have been instrumented with total pressure cells (flat-
jacks). These are installed on the outside of four segments (S2, S4, S6 and S8) and measure the total
pressure that is exerted by the Boom Clay on those rings (Figure 3-32).
Figure 3-33, Figure 3-34 and Figure 3-35 show the total pressure on the concrete lining and its variation
since the start of the heating phase.
In the accessible part of the PRACLAY gallery (Ring 12), the pressure cells indicate a slight decrease in the total
pressure, followed by an increase in pressure (Figure 3-33). Currently, the pressure is still increasing very slowly.
In the heated part, total pressures directly increase similar to the PRACLAY gallery pore water pressure, as
can be seen in Figure 3-34 and Figure 3-35. The same pressure increase of about 1.5 MPa is observed for all
the flat-jacks of Ring 78 as well as for the flat-jacks associated with segments S4 and S6 of R46.
During the stationary phase, the total pressure inside the heated part of the PRACLAY gallery remained
mainly constant. Since the target temperature has been reached, several flat-jacks have failed, making
scientific interpretation of the pressure exerted by the clay on the lining difficult or impossible.
Figure 3-33: Evolution of the total pressure and variation on the four flat-jacks of Ring 12.
a bTotal pressure on Ring 12 Total pressure increase on Ring 12
Figure 3-32: Layout of the instrumentation of the segmental concrete lining
equipped with total pressure flat-jacks.

page 46 I EURIDICE Report I ref. EUR_PH_ 17_043
Circumferential stresses inside the lining
In addition to the radial pressure cells on the lining, load cells (Figure 3-36) have been installed in the
same rings to monitor the loads that the segments are exerting on each other. These measurements are
shown in Figure 3-37 to Figure 3-39 and correspond to an average stress because the surface area of the
load cells is comparable to the surface area between two segments.
The circumferential stresses and their variation inside Ring 12 (accessible part of PG) are shown in
Figure 3-37. As for the evolution of the total pressure on the lining of Ring 12, a decrease in the stresses
was observed during the first few months of heating, followed by an increase a few weeks after the third
heating step. Overall, stress evolutions display a similar trend for LC-PGR12-S2 and LC-PGR12-S6 and a
lower increase for LC-PGR12-S4.
Figure 3-34: Evolution of the total pressure and variation on the four flat-jacks of Ring 46.
Figure 3-35: Evolution of the total pressure and variation on the flat-jacks of Ring 78.
a
a
b
b
Total pressure on Ring 46
Total pressure on Ring 78
Total pressure increase on Ring 46
Total pressure increase on Ring 78
Figure 3-36: Layout of the instrumentation of the segmental concrete lining equipped with load cells.

The PRACLAY Heater test after two years of the stationary phase EURIDICE Report I ref. EUR_PH_ 17_043 I page 47
Figure 3-38 shows the circumferential stresses and their variation inside Ring 46 since the beginning
of the heating phase. At each new heating step, the sudden increase in pore water pressure in the
PRACLAY gallery caused a rapid decrease in the circumferential stresses inside the segments. Then, as
the pore water pressure evolution in the PRACLAY gallery has tended to stabilise since the start of the
stationary phase, the circumferential stresses inside the segments have levelled off. At this point, only
load cell LC-PGR46-S2 in Ring 46 is still functioning.
The evolution of the average circumferential stress and its variation inside Ring 78 (Figure 3-39) shows a
similar pattern with a different magnitude to what was observed with Ring 46. A decrease in the stress is
observed at the beginning of each heating step. This drop is then reversed with a new increase in stress,
which seems to tend to stabilise during the stationary phase.
Figure 3-37: Evolution of circumferential stresses inside Ring 12 since the start of the heating phase.
a bStresses in the concrete lining Ring 12 Variation of stresses in the concrete lining Ring 12
Figure 3-38: Evolution of the circumferential stresses in the lining of Ring 46.
a bStresses in the concrete lining Ring 46 Variation of stress in the concrete lining Ring 46
Figure 3-39: Evolution of the circumferential stresses in the lining of Ring 46.
a bStresses in the concrete lining Ring 46 Variation of stress in the concrete lining Ring 46

page 48 I EURIDICE Report I ref. EUR_PH_ 17_043
3.6. Summary
This section presents the main observations from the PRACLAY Heater test during the start-up phase and
first two years of heating at stationary conditions (80°C at the interface with the clay). It can generally be
stated that since the switch-on of the heating system until August 2017, the system as a whole reacted as
expected. The temperatures and pore water pressures in the experimental set-up and in the clay evolved
smoothly, without any sudden or abrupt changes. This confirms that the system responds in a stable
manner and that the clay is able to sustain the thermal load that would be generated by a geological
disposal system for high-level, heat-emitting radioactive waste.
Based on the evolution of the test-control parameters (temperature in the lining, at the interface with the
Boom Clay and the pore water pressure inside the PRACLAY gallery) and the responses of the Boom Clay,
the bentonite seal and the concrete lining, the situation can be summarised as follows:
• Since the switch-on of the heating system, the temperature has increased in the Boom Clay, the
concrete lining and the seal structure. At the end of the start-up phase, a thermally affected zone of
about 10 m around the PRACLAY gallery was observed. During the following two years (stationary
phase), this zone extended up to 16 m from the PRACLAY gallery axis into the clay.
• An excess pore water pressure was generated in the backfilled part of the gallery and in the Boom
Clay as a consequence of the different thermal dilation coefficient between the liquid and the solid.
In the gallery, the pore water pressure reached a maximum value of 2.9 MPa at the end of the start-up
phase, followed by a small drop of about 0.1 MPa at the beginning of the stationary heating phase,
before evolving to a constant value.
• The extent of the hydraulically affected zone extends up to 16 m from the PRACLAY gallery axis in
both directions around the PRACLAY gallery.
• After two years of the stationary phase, the evolution of the temperature and the excess pore water
pressure around the PRACLAY gallery can still be described as rather homogeneous, leaving aside the
end effects.
• Measurements of the total pressure at the interface between the lining and the clay show that no
mechanical instabilities have occurred. In fact, this indicator is evolving in the same way as the pore
water pressure, indicating no drastic change or sharp decrease in the effective stress in the clay.
• The seal is performing as expected, creating a hydraulic cut-off between the heated and non-heated
parts of the experiment. The high pressure inside the gallery is maintained and no leakage has been
observed either from the seal structure or at the interface with the Boom Clay.
• Concerning the parameters in the concrete structure, the loss of almost all of the sensors made
interpretation more complex. Before the stationary phase, the decrease in the stresses between the
concrete segments was mainly caused by the increase in pore water pressure inside the gallery. During
the stationary phase, stabilisation was observed for one of the surviving sensors, while the other
one showed a slight increase. The total radial pressure on the lining was evolving without significant
variations. Unfortunately, all the flat-jacks at the Boom Clay/concrete lining interface are now lost.
• During two years and nine months of heating no sudden or significant variations in terms of pore
water pressure or temperature were observed in the Boom Clay surrounding the heated part
of the PG. This means that the clay has been able to sustain the thermal load up until now, and
that its structural integrity does not seem to be compromised. A more in-depth analysis of the
thermo-hydro-mechanical response of the clay will be part of the next PRACLAY report and will
include a more detailed scientific interpretation.

The PRACLAY Heater test after two years of the stationary phase EURIDICE Report I ref. EUR_PH_ 17_043 I page 49
4. Comparison with numerical modelling
In Section 4, a comparison is made between the observations obtained to date and the expected values
from the modelling performed before the switch-on, i.e. numerical predictions. These predictions
incorporated all knowledge and understanding of the thermo-hydro-mechanical behaviour of the
Boom Clay available at that time (before the switch-on). The concepts and parameter values used for
this modelling exercise were deduced from the different and numerous studies conducted on different
scales, in both laboratory and in-situ conditions (e.g. the small-scale ATLAS heater test). The numerical
predictions focused on the thermo-hydro-mechanical response of the Boom Clay and considered all the
steps of the experiment: excavation, pressurisation of the PRACLAY gallery and subsequent heating1. This
section discusses only the thermo-hydro-mechanical response due to heating.
As in the start-up phase report, the likely causes of the observed deviations are discussed, together with
possible improvements for future modelling. The modelling conditions, i.e. geometry, initial conditions
and properties, are the same as those presented in the start-up phase report.
4.1. Description of the two numerical models
Two reference cases for the PRACLAY Heater test and the PRACLAY Seal test were modelled. These
were based on a two-dimensional plane strain (2D-PS) model and a two-dimensional axisymmetric
model (2D Axis), respectively. The basic information about these two models is introduced here in terms
of geometry, boundary conditions and material properties.
The two models simulate the evolution of the PRACLAY tests since the PRACLAY gallery excavation
until the end of the heating phase. In this report, the focus will be on a comparison between the
experimental and the numerical results during the start-up phase and the first two years of the
stationary phase (80°C). The finite element code “Code_Bright”, developed by the Universitat Politècnica
de Catalunya (UPC-BarcelonaTech), is used.
Geometry
The test geometry and the detailed test procedures to the best of our knowledge are considered.
The two models are:
(1) 2D Axisymmetric model (2D-Axis, Figure 4-1), which includes the geometry of almost all the
components. Both the Heater test and the Seal test can be simulated in one single model. However,
the anisotropic behaviour of the Boom Clay cannot be represented in this model due to the latter’s
induced axial symmetry. The axial dissipation of heat and pore water pressure (end effects) can be
represented by this model in contrast to the 2D-PS model.
(2) 2D Plane Strain model (2D-PS, Figure 4-2): the geometry of this model consists in a cross-section
perpendicular to the PRACLAY gallery axis. This geometry includes the backfill sand of the PRACLAY
gallery and the concrete lining. This model could consider the anisotropic behaviour of the Boom
Clay and is most representative of a cross-section at the middle of the heated part of the PRACLAY
gallery. The dissipation of heat and pore water pressure along the gallery axis cannot be represented
with this configuration.
1 Initial predictions, performed before the Heater test, considered a slightly different thermal control of the test compared to what was
implemented. The simulations have been updated with the correct duration and heater power of the actual heating steps since the
switch-on, without changing any other parameters. For the sake of comparison with the measurements, the results of these updated
simulations are used in this section.

page 50 I EURIDICE Report I ref. EUR_PH_ 17_043
Figure 4-2: Description of the geometry of the 2D Plane Strain model (2D-PS) with the different components (sand, lining, Boom Clay). The boundary and initial conditions are described.
Figure 4-1: Description of the geometry of the 2D Axisymmetric model (2D-Axis) with all the components
(seal, concrete lining, sand, Boom Clay). The boundary and initial conditions are described.

The PRACLAY Heater test after two years of the stationary phase EURIDICE Report I ref. EUR_PH_ 17_043 I page 51
Initial conditions
The initial conditions of the modelling depend on the geometry and are described in the following tables.
An isotropic value of the total stress is considered for the 2D Axisymmetric model, while distinct vertical
and horizontal total stresses are imposed for the 2D Plane Strain model. A coefficient of earth pressure
at rest (K0) of 0.7 is used in that case.
Thermo-hydro-mechanical parameters
The main thermo-hydro-mechanical parameters of the materials (Boom Clay, sand, concrete lining and
bentonite) are determined based on an extensive literature review, laboratory test results and in-situ
measurements. The effective stresses are defined according to the Terzaghi principle. The heat transfer
is modelled using Fourier’s law of conduction. The flow of water is reproduced using the classic Darcy’s
law. The thermo-hydraulic properties are defined in the tables below for the different materials, Table 4-3
for the Boom Clay and Table 4-4 for the other components.
Table 4-1: Initial conditions for the Boom Clay for both models (based on Bernier et al., 2007;
Dehandschutter et al., 2004; Bernier et al., 2002; Cornet, 2009).
Table 4-2: Initial conditions for the concrete lining, backfill sand and bentonite (MX80).
Table 4-4: Main thermo-hydraulic properties of the sand, bentonite and concrete lining. These materials are supposed to be isotropic in the different models (based on Bamforth et al., 2008;
Davey, 1954; Mitchell, 1956; Powell et al., 1966; Chapuis, 2004; Borgesson and Hernelind, 1999; Chen and Ledesma, 2009; Chen and Li, 2011).
*Based on measurements performed by CEA and EURIDICE
*Based on measurements performed by CEA and EURIDICE
Table 4-3: Main thermo-hydraulic properties of the Boom Clay (based on Bernier et al., 2007b, Bernier et al, 2007c; Bastiaens et al., 2006; Chen et al., 2011; Garitte et al., 2006; Horseman et al., 1987; Chen et al., 2014; Chen, 2012 ).
2D Axisymmetric 2D Plane Strain
Porosity [-] n 0.39
Intrinsic permeability [m²] k 4.5x10⁻¹⁹
Vertical intrinsic permeability [m²] kv 3x10-19
Horizontal intrinsic permeability [m²] kh 6x10-19
Thermal conductivity [W/mK] λ 1.53
Vertical thermal conductivity [W/mK]
λv 1.31
Horizontal thermal conductivity [W/mK]
λv 1.65
Concrete lining Backfill sand Bentonite (MX80)
Pore water pressure [MPa] Pw 0.1 0.1 - 67*
Total stress [MPa] σ 0.1 0.1 0.1
Temperature [°C] T 16 16 16
Bentonite Sand Concrete lining
Initial porosity [-] n 0.396* 0.394 0.1
Intrinsic permeability [m²] k 2.2x10⁻²¹ 2.3x10⁻¹¹ 4.5x10⁻¹⁸
Thermal conductivity [W/mK]
λ 0.3 (dry) -> 1.3 (saturated)
2.90 2.86
2D Axisymmetric 2D Plane Strain
Pore water pressure [MPa] Pw 2.25 2.25
Total stress [MPa] σ 4.5
Vertical total stress [MPa] σv 4.5
Horizontal total stress [MPa] σh 3.825
Temperature [°C] T 16 16

page 52 I EURIDICE Report I ref. EUR_PH_ 17_043
An elasto-plastic model using a Drucker-Prager criterion with a hardening behaviour of the effective friction
angle is used for the Boom Clay. Because the excavation of the PRACLAY gallery caused the creation of
an excavation damaged zone with a certain extension, the hydro-mechanical properties were modified
during the modelling of the excavation (not described in this report), in order to take into account the
damage caused by the excavation and the recovery of the transport properties with time (self-sealing;
Bernier et al., 2007a). As a consequence, an increase of the permeability induced by the excavation was
introduced in the model. The duration between the excavation and the start of heating was assumed to
be sufficient (around seven years) to return to the undisturbed values of the permeability, as used for the
modelling of the heating phase. The mechanical properties decreased in this excavation-damaged zone
due to the excavation and remained the same for the heating phase as their potential restoration requires a
longer time (self-healing). The mechanical properties are given in the following table (Table 4-5).
The bentonite inside the seal is modelled using the Basic Barcelona Model (BBM), taking into account
the effects of suction (negative pore water pressure) on the material behaviour. MX-80 bentonite is one
of the most studied bentonites. The hydro-mechanical properties used in the model are those found in
Tang (2005), Gatabin et al. (2006) and Villar et al. (2008). The concrete lining and the backfill sand are
assumed to behave elastically from a mechanical point of view. A thermo-elastic framework characterises
the thermal phase where the temperature variation causes only thermal elastic strain. The following table
gives an overview of the mechanical properties of the sand and of the concrete lining. In the model, the
three different types of concrete used to build the gallery (Van Marcke et al., 2013) are considered, as can
be seen in the following table.
Table 4-5: Mechanical properties of the Boom Clay (based on Bernier et al, 2002; Bernier et al.,
2007c; Chen, 2012; Dizier, 2011; Chen et al., 2011).
Intact Boom Clay (undamaged zone)
Damaged zone
Isotropic elastic modulus [GPa] E 1.05 0.3
Poisson’s ratio [-] v 0.125
Vertical elastic modulus [GPa] Ev 0.7 0.2
Horizontal elastic modulus [GPa] Eh 1.4 0.4
Shear modulus [GPa] Gv 0.28 0.08
Poisson’s ratio [-] vhh 0.25
Poisson’s ratio [-] vvh 0.125
Effective cohesion [MPa] c’ 0.3
Initial effective friction angle [°] ø’initial 5
Final effective friction angle [°] ø’final 18
Dilatancy angle [°] ψ 0
Table 4-6: Mechanical properties of sand and concrete lining (based on Bamforth et al., 2008).
Sand Concrete lining
Elastic modulus [GPa] E 0.03 27 (C30/37)44 (C80/95)55 (C125/50)
Poisson’s ratio [-] υ 0.2 0.2

The PRACLAY Heater test after two years of the stationary phase EURIDICE Report I ref. EUR_PH_ 17_043 I page 53
4.2. Comparison with the observations
Test-control parameters
Temperature in the concrete lining segments
Figure 4-3 gives a comparison between the measurements and the 2D axisymmetric numerical
predictions of the temperature evolution at the intrados (inner surface of the lining, Figure 4-3 (a)) and
at the extrados (outer surface of the lining, Figure 4-3 (b)) of the three segments (S4, S6 and S8) of PG50
until August 2017. The modelling slightly overestimates (by a few degrees) the observations of S4, S6
and S8. Nevertheless, the deviation is almost constant with time, which allows us to properly control the
heating phase of the experiment.
Figure 4-4 shows the four longitudinal temperature profiles measured along the extrados of the four
concrete lining segments (S2, S4, S6 and S8) on 19 August 2017 and the comparison with the numerical
results.
From these comparisons, it can be observed that the modelled temperature agrees quite well with the
four longitudinal profiles along S2, S4, S6 and S8. However, at the top of the gallery, small differences
between numerical and experimental results are observed for S8, especially close to the seal.
Figure 4-4: Longitudinal profiles of temperature along the extrados of backfilled PG on 19 August 2017
(measurements vs model predictions with 2D-Axis model).
Figure 4-3: Temperature inside the concrete segments of Ring 50 since start-up of heating. Comparison with
the 2D Axis model (black curve) at the intrados (a) and at the extrados (b).
a b

page 54 I EURIDICE Report I ref. EUR_PH_ 17_043
The difference between the measured and the modelled temperature in the top segments (profile S8) of the
PRACLAY gallery might be explained by considering the possibility that the gallery was not fully backfilled
with sand. In fact, close to the seal structure, it was extremely difficult to inject the sand and it is most likely
that a zone was not entirely filled. As a consequence, the top part of the PRACLAY gallery may be composed
of pure water or a mixture of water and very loose sand. The heat transfer properties of the backfilled
PRACLAY gallery could be altered by the existence of such a zone. Control of the heating system of the
experiment is based on the numerical predictions of the average temperature (thermal indicator) in Zone
2 and Zone 3. The indicator in Zone 2 (average around R37/50/68) has been used to define the beginning
of the stationary phase, while the second indicator (R81) has been used to control the power in Zone 3.
The comparison with the modelling results and the two indicators is shown in Figure 4-5. The result of the
comparison shows good agreement between the model and the experimental results.
Pore water pressure inside the PRACLAY gallery
The pore water pressure inside the PRACLAY gallery is an important hydraulic boundary for the
PRACLAY Heater test, and the degree of agreement between its measured and predicted values may directly
affect the prediction of thermo-hydro-mechanical responses in the surrounding clay. Figure 4-6 shows a
comparison between the measurements and the predictions of the pore water pressure inside the PG, for both
models (2D-PS and 2D Axis). The overall agreement is very good for the 2D Axisymmetric model, while the 2D-
PS model overestimates the pore water pressure evolution. This can be explained by the fact that the 2D-PS
model represents a vertical cross-section of the gallery where no axial drainage and no axial heat dissipation can
be represented. As a consequence, higher pore water pressures are predicted compared with the 2D Axis model.
Figure 4-5: Comparison between the 2D-Axis model and the experimental
results of the thermal indicator.
Figure 4-6: Comparison between the measurements and predictions of the pore water pressure inside the
PG for both models (2D-Axis and 2D-PS).

The PRACLAY Heater test after two years of the stationary phase EURIDICE Report I ref. EUR_PH_ 17_043 I page 55
Observations in the Boom Clay
This section considers the comparison of the numerical results with the observations in the Boom Clay.
The evolution of temperature and pore water pressure is described according to the different models. The
profiles are only presented and discussed for the 2D-PS model, as this is the only one that can represent the
anisotropic properties of the Boom Clay, making comparisons more meaningful.
Comparison with the 2D Axisymmetric results
Figure 4-7 and Figure 4-8 show the experimental evolution of the temperature and pore water pressure
compared with the modelling results around PG50. For PG50D (Figure 4-7 (a)), it can be observed that the
modelled temperature is in good agreement considering that this was a numerical prediction and that the
2D Axis model does not represent the effects of the anisotropy of thermal conductivity in the Boom Clay.
The same conclusion is drawn when comparing the numerical and the experimental results obtained with
a horizontal profile with sensors from the Connecting gallery boreholes, as shown in Figure 4-8 (a).
In terms of pore water pressure, the evolution is quite well reproduced by the model for both profiles (Figure
4-7 (b) and Figure 4-8 (b)) even though the magnitude is underestimated in the case of PG50D in the far field.
Figure 4-7: Comparison between numerical (continuous curve) and experimental (points) evolution of the
temperature and pore water pressure in PG50D for the 2D Axis model.
Figure 4-8: Comparison between numerical (continuous curve) and experimental (points) evolution of the
temperature (CG boreholes) and pore water pressure from the CG boreholes for the 2D Axis model.
a
a
b
b
Temperature evolution
Temperature evolution
Pore water pressure evolution
Pore water pressure evolution
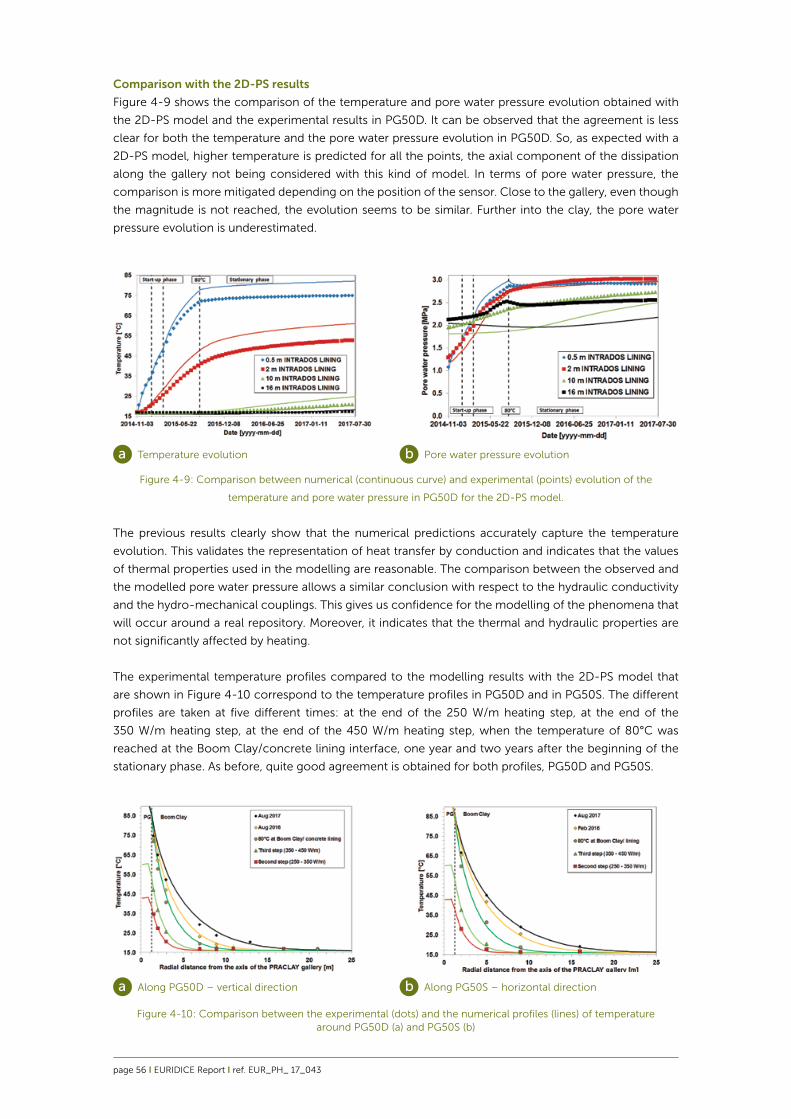
page 56 I EURIDICE Report I ref. EUR_PH_ 17_043
Comparison with the 2D-PS results
Figure 4-9 shows the comparison of the temperature and pore water pressure evolution obtained with
the 2D-PS model and the experimental results in PG50D. It can be observed that the agreement is less
clear for both the temperature and the pore water pressure evolution in PG50D. So, as expected with a
2D-PS model, higher temperature is predicted for all the points, the axial component of the dissipation
along the gallery not being considered with this kind of model. In terms of pore water pressure, the
comparison is more mitigated depending on the position of the sensor. Close to the gallery, even though
the magnitude is not reached, the evolution seems to be similar. Further into the clay, the pore water
pressure evolution is underestimated.
The previous results clearly show that the numerical predictions accurately capture the temperature
evolution. This validates the representation of heat transfer by conduction and indicates that the values
of thermal properties used in the modelling are reasonable. The comparison between the observed and
the modelled pore water pressure allows a similar conclusion with respect to the hydraulic conductivity
and the hydro-mechanical couplings. This gives us confidence for the modelling of the phenomena that
will occur around a real repository. Moreover, it indicates that the thermal and hydraulic properties are
not significantly affected by heating.
The experimental temperature profiles compared to the modelling results with the 2D-PS model that
are shown in Figure 4-10 correspond to the temperature profiles in PG50D and in PG50S. The different
profiles are taken at five different times: at the end of the 250 W/m heating step, at the end of the
350 W/m heating step, at the end of the 450 W/m heating step, when the temperature of 80°C was
reached at the Boom Clay/concrete lining interface, one year and two years after the beginning of the
stationary phase. As before, quite good agreement is obtained for both profiles, PG50D and PG50S.
Figure 4-9: Comparison between numerical (continuous curve) and experimental (points) evolution of the
temperature and pore water pressure in PG50D for the 2D-PS model.
Figure 4-10: Comparison between the experimental (dots) and the numerical profiles (lines) of temperature around PG50D (a) and PG50S (b)
a
a
b
b
Temperature evolution
Along PG50D – vertical direction
Pore water pressure evolution
Along PG50S – horizontal direction

The PRACLAY Heater test after two years of the stationary phase EURIDICE Report I ref. EUR_PH_ 17_043 I page 57
Figure 4-11 shows the comparison between the numerical and the experimental profiles of pore water
pressure around PG50, i.e. in PG50D and in PG50S. From these comparisons, it can be observed that
modelling can correctly reproduce the trend in the pore water pressure evolution after the start of the
heating phase; however, it underestimates the pore water pressure increase in the near field. This is most
likely related to an approximate understanding of the hydro-mechanical coupling and properties in the
EDZ that needs to be improved in the future. In these numerical predictions, a reduced Young’s modulus
has been assumed in the first 10 metres of clay. This also explains the “bump” in the calculated pore water
pressure profile for PG50D at a radius of 10 m after the end of the start-up phase.
Seal and concrete lining structures
Stresses and pore water pressure in the seal
Figure 4-12 shows a comparison between the experimental and the 2D axisymmetric numerical results
in the seal structure and at the Boom Clay/bentonite interface.
The numerical results of the pore water pressure at the Boom Clay/bentonite interface indicate that
modelling underestimates the variation in pressure at this interface for the sensors located either close
to (Seal PP-A1, Seal PP-B1 and Seal PP-C2) or away from (Seal PP-A3) the heated part of the gallery (see
Figure 4-12 (a)).
In terms of the total pressure variation at the Boom Clay/bentonite interface, Figure 4-12 (b) shows that
the model underestimates the total radial pressure variation.
Figure 4-11: Comparison between the experimental and the numerical profiles of pore water pressure around PG50.
a bAlong PG50D – vertical direction Along PG50S – horizontal direction
Figure 4-12: Radial swelling pressure and pore water pressure at the bentonite/Boom Clay interface. Comparison
with the 2D-Axis numerical results.
a bPore water pressure variation at Boom Clay/bentonite interface
Total radial pressure variation at Boom Clay/bentonite interface

page 58 I EURIDICE Report I ref. EUR_PH_ 17_043
Stresses in the concrete lining
The variation in measured circumferential stresses in the concrete lining in PG46 is compared with the
numerical results in Figure 4-13. The modelling results are based on both the 2D-PS model and the 2D
Axis model.
Overall, the modelling results fall within the range of the measured results. However, it is important
to mention that the experimental measurements show considerable dispersion from one segment to
another and that many sensors stopped working during the heating phase. This means that we cannot
confirm these observations and interpretations.
4.3 Summary and future work
Comparisons between the numerical predictions and the measurements obtained since the beginning
of the PRACLAY Heater test show that, in general, the temperatures measured in the concrete lining
segments, the seal and the Boom Clay correspond quite well with the predictions. This means that the
heat dissipation modelled using Fourier’s law of conduction, without including too much complexity,
is capable of reproducing the phenomena observed. Moreover, the thermal properties seem to be
reasonably well defined and will be important information for the design of a future repository.
Numerical predictions can reproduce the trend in the pore water pressure evolution, but tend to
underestimate the magnitude of the variation. Improvement of the numerical modelling is needed in
the future. This can be done by improving the hydraulic properties or by having a better understanding
of the hydro-mechanical coupling of the clay, particularly inside the damaged zone. Nevertheless,
the undisturbed intrinsic permeability that is used in the thermo-hydro-mechanical modelling already
appears to be a reliable value to describe the evolution of the pore water pressure.
Finally, even though the seal behaviour is a secondary objective of the PRACLAY experiment, comparison
between the measurements and the predictions shows that its general behaviour is not yet very well
represented.
Figure 4-13: Circumferential (hoop) stress variation between concrete segments in PG46.
Comparison with the modelling results.

The PRACLAY Heater test after two years of the stationary phase EURIDICE Report I ref. EUR_PH_ 17_043 I page 59
5. Preliminary evaluation of the PRACLAY Heater test
During the nine months of the start-up phase, the PRACLAY gallery was heated until the temperature
at the Boom Clay/lining interface reached the target value of 80°C. Once this temperature was
achieved, the settings of the heating system were adjusted to maintain this condition during the 10-year
stationary phase. This report has presented the measurements of temperature, pressure and stress in
the experimental set-up and in the surrounding clay during the start-up phase and the first two years of
the stationary phase. The measurements have been compared with the numerical predictions that were
made before heating started.
Based on these observations and comparison with the modelling, the following preliminary conclusions
can be drawn in relation to the different goals of the PRACLAY Heater test (Van Geet at al., 2007):
1. From the extensive network of sensors in and around the PRACLAY gallery, a large data set of
temperature measurements was obtained during the start-up phase and the first two years of
stationary heating at 80°C at the Boom Clay/lining interface.
The comparison between the numerical predictions and observations shows overall good agreement
for temperature, as can be seen in Figure 5-1 with the 2D Axis model, for example. This already indicates
that the thermal models applied are sufficiently capable of predicting the temperature evolution
around a real repository in clay like the Boom Clay. It confirms the knowledge and understanding
about the heat transfer mechanism in the Boom Clay, gained from both small-scale in-situ and
laboratory experiments in the past decade. Heat transfer by conduction can in fact reproduce the
different evolutions, clearly demonstrating that this process accounts for most of the actual heat
dissipation.
Some refinement is still possible and all information from the experiment will be used to further refine
the models and to verify whether the numerical predictions remain valid over the next few years.
Figure 5-1: Comparison between the observed and the modelled temperature (2D Axis model)
a b

page 60 I EURIDICE Report I ref. EUR_PH_ 17_043
2. The clay is able to sustain the thermal load without any drastic and sudden change in its properties.
Pore water pressure and temperature evolve smoothly, which indicates that the structural integrity
of the clay is not significantly affected by the thermal load, as shown by the pore water pressure
evolution in Figure 5-2. This aspect will be discussed in more detail in the next PRACLAY report, with
a more in-depth scientific analysis of the observed phenomena.
The measurement of the total pressure in the clay, presented and explained previously, shows a
similar increase as the pore water pressure. This indicates that, during heating, the effective stress in
the near field of a heated gallery does not undergo sharp variations and, in particular, no significant
decrease that would mean a loss of contact between the clay particles, which could lead to fracturing
phenomena. This conclusion is similar to what was already observed in previous thermo-hydro-
mechanical studies in clay (Bernier and Neerdael, 1996).
Moreover, the transport properties of clay, such as its intrinsic permeability, are not severely affected by
heating. Comparison of the pore water pressure evolution and the numerical prediction show overall good
agreement, which indicates that the undisturbed value of the intrinsic permeability used in the calculation
seems to be sufficient to model the phenomenon, as already explained in the modelling section.
Figure 5-2: Pore water pressure along the PG and perpendicular to Ring 50 (horizontally)
a bPore water pressure in P35E, // to PG Pore water pressure, to Ring 50
Figure 5-3: Evolution of the total pressure measured in P42E and comparison with the pore
water pressure measured with the closest piezometer to the flat-jack.
a bTotal pressure Total pressure variation

The PRACLAY Heater test after two years of the stationary phase EURIDICE Report I ref. EUR_PH_ 17_043 I page 61
This interpretation is confirmed by the permeability tests conducted in some piezometer filters around
the gallery before and during heating; they confirm this analysis, as can be seen in Figure 5-5. The intrinsic
permeability is not in fact affected by the heating process, the values of this parameter being nearly the
same before and during heating. This kind of conclusion has been drawn on a laboratory scale (Delage
et al., 2000) and has now been confirmed on a large scale. The temperature causes a decrease in water
viscosity, which enhances hydraulic conductivity; the intrinsic permeability remains unchanged.
3. The long-term stability of the concrete gallery lining seems to be confirmed mechanically. No
indications of instability were observed. The stresses between the concrete segments remain largely
below the design values. Conversely, it is not currently possible to assess the chemical degradation
of the concrete caused by the long-term heating process. This will be done while the experiment is
being dismantled (starting in 2025).
4. The seal structure has demonstrated its ability to sustain the high pressure inside the PRACLAY gallery
and continues to fulfil its role as hydraulic cut-off. Even though the kind of seal used in PRACLAY is
not representative of a repository seal, it is important to remember that this critical structure of the
experiment is performing as expected and has good stability with a uniform displacement towards
the CG. In particular, the bentonite seems to fulfil its role remarkably well despite significant shear
deformations at the interface with the clay.
Figure 5-5: Results of the permeability tests around PG before and during heating
Figure 5-4: Comparison between the observed pore water evolution and the numerical prediction (2D-PS)
a b

page 62 I EURIDICE Report I ref. EUR_PH_ 17_043
6. General conclusion
The large-scale in-situ experiment known as the PRACLAY Heater test has been running for nearly three
years without any major problems. The temperature gradually increased at the concrete lining/ Boom
Clay interface to reach the target temperature of 80°C in August 2015. Once this temperature had
been attained, the power was regulated manually based on numerical calculations to keep it constant.
In August 2017, the end of the observation period presented in this report, the conclusion was that
the system as a whole had reacted as expected. The temperatures and pore water pressures in the
experimental set-up and in the clay had evolved smoothly, regularly and without any sudden or abrupt
changes. The most critical transient phenomenon in terms of the thermo-hydro-mechanical behaviour
of the clay, more specifically the peak pore water pressure in the clay, occurred during this period. This
confirms that the system has responded in a stable manner and that the clay is able to sustain the thermal
load that would be generated by a geological disposal system for high-level, heat-emitting radioactive
waste. The zone affected by the temperature and pore water pressure variation had extended up to at
least 16 m from the axis of the PRACLAY gallery by the beginning of August 2017, which is the end of
the reporting period. In terms of the mechanism of heat transport in clay, conduction is dominant. The
increase in pore water pressure is mainly a consequence of the thermal dilation difference between the
water and the clay particles in a low-permeable clay material like the Boom Clay.
As already mentioned, the whole set-up reacted as expected, and the seal created a hydraulic cut-off
between the heated and the non-heated parts of the experiment. The high pressure inside the PRACLAY
gallery was maintained and no leakage was observed either from the seal structure or from the interface
with the Boom Clay.
Comparison with the numerical predictions showed that thermal properties are well established and that
the temperature evolution can be reproduced well. The numerical predictions model the trend in the pore
water pressure evolution, but tend to underestimate the magnitude of the variation. Improvement of the
numerical modelling is needed in the future by enhancing our understanding of the hydro-mechanical
coupling of the clay, particularly inside the damaged zone. The undisturbed intrinsic permeability that
was used in the thermo-hydro-mechanical modelling has already turned out to be a reliable value to
describe the evolution of the pore water pressure in the clay.
Finally, the nearly three years of the PRACLAY Heater test can be described as a success for many reasons.
First of all, the set-up worked as expected, the seal structure fulfilled its role in ensuring quasi-undrained
boundary conditions for the Heater test and the heater system delivered the power needed without
any interruption of the system. Secondly, it has been proved that the clay is able to sustain the thermal
load without major modifications of its structural integrity. Indeed, no abrupt changes in parameters
such as pore water pressure were observed during the reported period of the experiment. Thirdly, our
understanding and knowledge of the clay already enable us to predict the evolution of the temperature
and the pore water pressure with good accuracy. Improvement and refinement of the models and
their parameters are, of course, still necessary to increase the accuracy of the predictions and hone
our knowledge of the coupled thermo-hydro-mechanical processes in clay, most importantly in the
excavation-damaged zone. For that purpose, in-situ characterisation of key parameters like intrinsic
permeability will continue to be carried out in parallel with the heating experiment.

The PRACLAY Heater test after two years of the stationary phase EURIDICE Report I ref. EUR_PH_ 17_043 I page 63
7. References
Baldi G., Hueckel T, Peano A., Pellegrini R., 1991. Developments in modelling of thermo-hydro-mechanical
behaviour of Boom Clay and clay-based buffer (vol.2). Commission of the European Communities.
Nuclear Science and Technology EUR 13365/2.
Bamforth P., Chisholm D., Gibbs J., Harrison T., 2008: Properties of Concrete for Use in Eurocode 2.
Bastiaens W., Bernier F., Li X.L., 2006. An overview of long-term HM measurements around HADES URF.
In: EUROCK 2006 multiphysics coupling and long term behaviour in rock mechanics, 15–26.
Bel J., Bernier F., 2001. Temperature Criterion Related to Clay Based Backfill Materials in the Framework of
a Geological Repository of Heat Producing Radioactive Waste (HLW). Proc. ICEM’01, The 8th International
conference on Environmental Management, Bruges, 30 Sept. – 4 Oct.
Bernier F., Li X.L., Bastiaens W., Ortiz L. et al. 2007a. SELFRAC : Fractures and self-healing within the
excavation disturbed zone in clays. Final report. Euridice report December 2007.
Bernier F., Li X.L., Verstricht J., Barnichon J.D., 2007b. CLIPEX: Clay Instrumentation programme for
the EXtension of an underground research laboratory. EC contract FI4W-CT96-0028. Final report,
Commission of the European Communities. Nuclear Science and Technology EUR 20619.
Bernier F., Li X.L., Bastiaens W., 2007c. Twenty-five years’ geotechnical observation and testing in the
Tertiary Boom Clay formation. Géotechnique, 57(2): 229–37.
Bernier F, Neerdael B, 1996. Overview of in-situ thermomechanical experiments in clay: Concept, results
and interpretation. Engineering Geology, 41, 51-64.
Borgesson L., Hernelind J., 1999. Coupled thermo-hydro-mechanical calculations of the water saturation
phase of a KBS-3 deposition hole. Technical Report TR-99-41.
Chapuis R.P., 2004. Predicting the saturated hydraulic conductivity of sand and gravel using effective
diameter and void ratio. Canadian Geotechnical Journal, 41(5): 787–795.
Chen G.J., Ledesma A., 2009. Coupled thermo-hydro-mechanical modelling of the full scale in-situ
test “Prototype Repository”. Journal of Geotechnical and Geoenvironmental Engineering, ASCE, 135(1),
121-132.
Chen G.J., Li X.L., 2011. Numerical modelling of PRACLAY Seal test. Internal report.
Chen G.J., Sillen X., Verstricht J., Li X.L., 2011. ATLAS III in situ heating test in boom clay: Field data,
observation and interpretation. Computers and Geotechnics, 38(5), 683-696.
Chen G.J., 2012: Modeling of PRACLAY tests: improved HM parameters of Boom Clay based on in-situ
measured PWP around PG, SAC 41 meeting.
Chen G.J., Maes T., Vandervoort F., Sillen X., Van Marcke P., Honty M., Dierick M., Vanderniepen P., 2014.
Thermal Impact on Damaged Boom Clay and Opalinus Clay: Permeameter and Isostatic Tests with XCT
Scanning. Rock Mechanics and Rock Engineering, Volume 47(1), 87-99.

page 64 I EURIDICE Report I ref. EUR_PH_ 17_043
Coll C., 2005. Endommagement des roches argileuses et perméabilité induite au voisinage d’ouvrages
souterrains. Thèse de doctorat de l’Université Joseph Fourier - Grenoble 1.
Cornet F.H., 2009. In situ stress measurement campaign at SCK•CEN Underground Laboratory by Ecole
et Observatoire des Sciences de la Terre, Université de Strasbourg, Internal report.
De Bruyn D., Labat S., 2002. The second phase of ATLAS: the continuation of a running THM test in the
HADES underground research facility at Mol. Engineering Geology, 64(2), 309-316.
Davey N., 1954. Concrete mixes for various building purposes, Proc. of a symposium on mix design and
quality control of concrete, Cement and Concrete Assn. London, 28-41.
Delage P, Sultan N, Cui Y.-J., 2000. On the thermal consolidation of Boom Clay. Canadian Geotechnical
Journal, 37(2), 343-354.
Dehandschutter B., Vandycke S., Sintubin M., Vandenberghe N., Wouters L., 2004: Brittle fractures and
ductile shear bands in argillaceous sediments: inferences from Oligocen Boom Clay (Belgium). Journal
of Structural Geology 27, 1095-1112.
Dizier A., 2011. Caractérisation des effets de température dans la zone endommagée autour des tunnels
de stockage de déchets nucléaires dans des roches argileuses. PhD thesis, Université de Liège.
Gatabin C., Touze G., Billaud P., Imbert C., Guillot W., 2006. ESDRED PROJECT-MODULE 1, Selection and
THM characterisation of the buffer material. Technical Report E.NT.0GME.05.0005/B.
Garitte B., Gens A., Vaunat J., Armand G., 2014. Thermal Conductivity of Argillaceous Rocks: Determination
Methodology Using In Situ Heating Tests. Rock Mechanics and Rock Engineering, Volume 47(1), 111-
129(19).
Horseman S.T., Winter M.G., Entwistle D.C., 1987. Geotechnical characterisation of Boom Clay in relation
to the disposal of radioactive waste. Final report, Commission of the European Communities. Nuclear
Science and Technology EUR10987.
Le T.-T., 2008. Comportement thermo-hydro-mécanique de l’argile de Boom. PhD thesis, CERMES,
Ecole Nationale des Ponts et Chaussées, Paris.
Mitchell L.J., 1956. Thermal properties, A.S.T.M. Ap. Tech. Publicn. No 169, pp. 129-135.
Powell R.W., Ho C.Y., Liley P.E., 1966. Thermal Conductivity of Selected Materials. National Standard
Reference Data Series-National Bureau of Standards -8.
Sillen X., Marivoet J., 2007. Thermal impact of a HLW repository in clay. Deep disposal of vitrified high-
level waste and spent fuel. Mol, Belgium: SCK•CEN.- 59 p.- (External Report of the Belgian Nuclear
Research Centre; ER-38; CCHO 2004-2470/00/01, DS 251.SAF).- ISSN 1782-2335
Sultan N., 1997. Etude du comportement thermo-mécanique de l’Argile de Boom: Expériences et
modélisation. PhD thesis, Ecole Nationale des Ponts et Chaussées.
Tang A.M., 2005. Effet de la température sur le comportement des barrières de confinement, PhD thesis,
Ecole Nationale des Ponts et Chaussées.

The PRACLAY Heater test after two years of the stationary phase EURIDICE Report I ref. EUR_PH_ 17_043 I page 65
Van Geet M., Lalieux Ph., Van Humbeek H., Dierckx A., De Preter P., Gens R. and Bernier F., 2007. PRACLAY
success criteria. NIROND note 2007-1144 (internal report)
Van Marcke P., Li X.L, Bastiaens W., Verstricht J., Chen G., Leysen J., Rypens J., 2013. The design and
installation of the PRACLAY In-Situ Experiment. EURIDICE report 13-129.
Villar M.V., 2005. MX-80 bentonite, thermo-hydro-mechanical characterisation performed at CIEMAT in
the context of the Prototype project, CIEMAT Technical Report.