The Power of Quality€¢ Rejection • Delayed Graft Function • Malignancy Stay tuned for the...
90
The Power of Quality Lindsay R. Smith, MSN,RN Quality Manager Vanderbilt Transplant Center
Transcript of The Power of Quality€¢ Rejection • Delayed Graft Function • Malignancy Stay tuned for the...
The Power of Quality Lindsay R. Smith, MSN,RN
Quality Manager Vanderbilt Transplant Center

What do you think of when you hear the word quality?

LEAN
PDSA
SIX SIGMA
RCA
QAPI
PIP
5s TQM

Objectives
• Transplant Quality Background • SRTR and CUSUM • Root Cause Analysis • Process Improvement projects

What is Quality?
POLICIES AND REGULATIONS
CLINICAL AND COMPLIANCE MONITORING
ADVERSE EVENTS PROCESS
IMPROVEMENT PROJECTS
EDUCATION
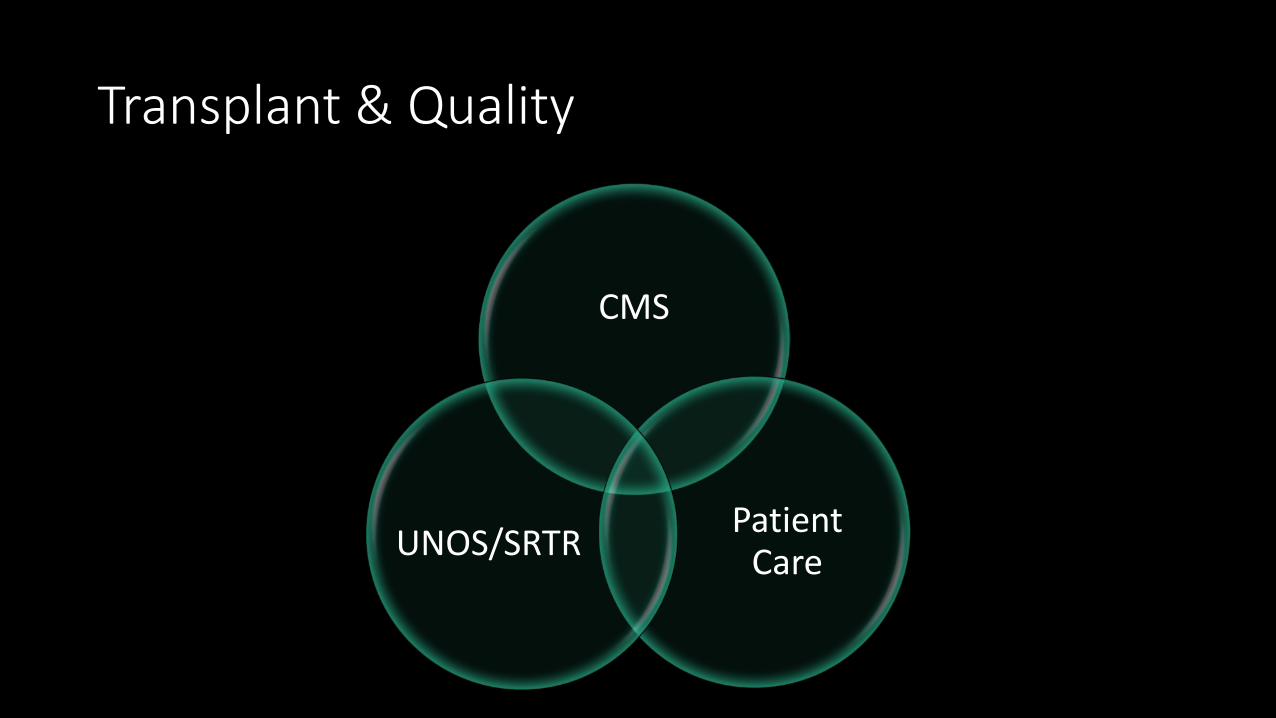
Transplant & Quality
CMS
Patient Care UNOS/SRTR
Monitoring Compliance, Clinical, & Outcome Metrics
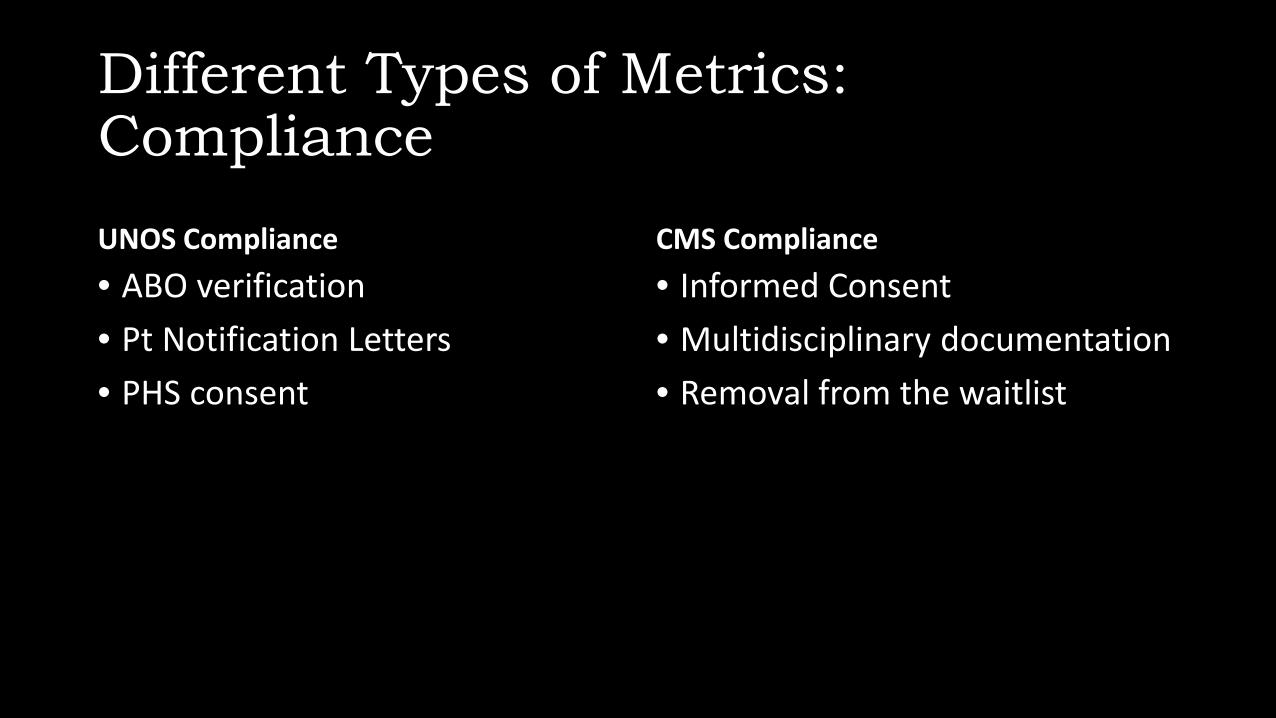
Different Types of Metrics: Compliance
UNOS Compliance • ABO verification • Pt Notification Letters • PHS consent
CMS Compliance • Informed Consent • Multidisciplinary documentation • Removal from the waitlist

Different Types of Metrics: Clinical
• Length of Stay • Readmission • Return to OR • Infection • Rejection • Delayed Graft Function • Malignancy Stay tuned for the skin cancer presentation
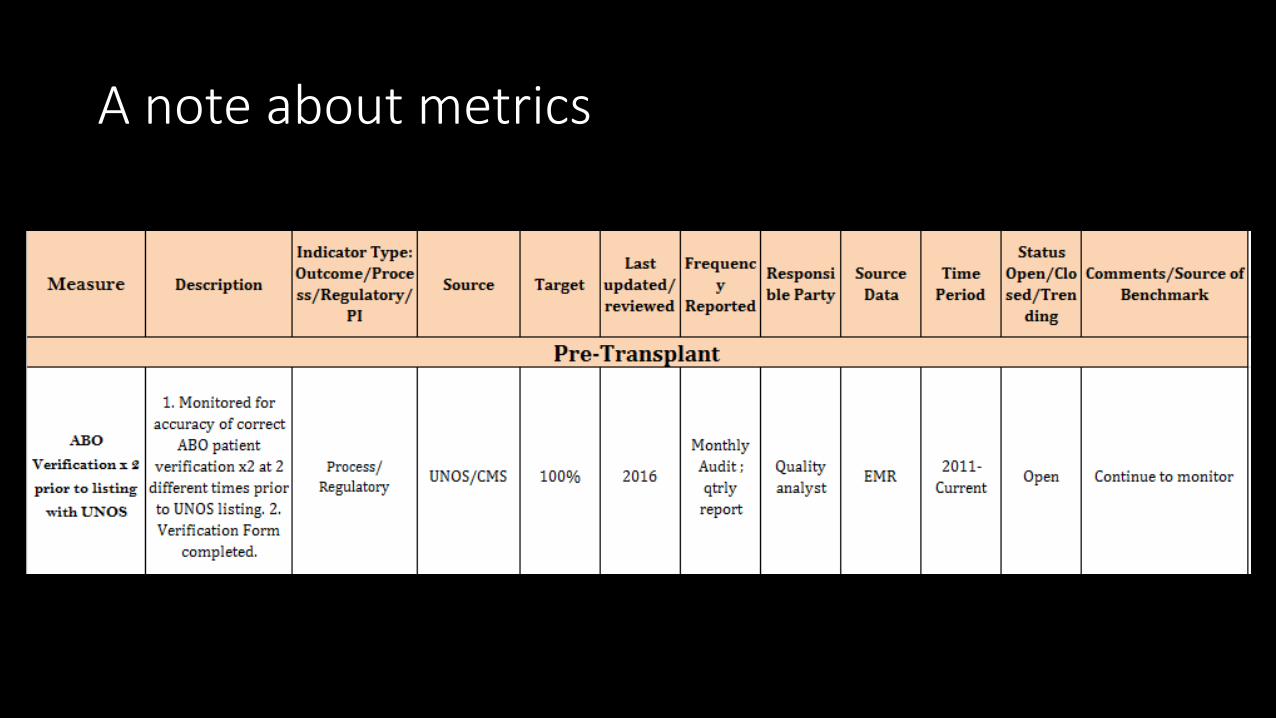
A note about metrics

Example of the Transplant Dashboard
Metric Monitoring ACTIONS
Different Types of Metrics: Outcomes
• SRTR • CUSUM • Predicting future outcomes

Making Sense of SRTR and CUSUM

Overview of SRTR

What is SRTR Scientific
Registry of
Transplant
Recipients
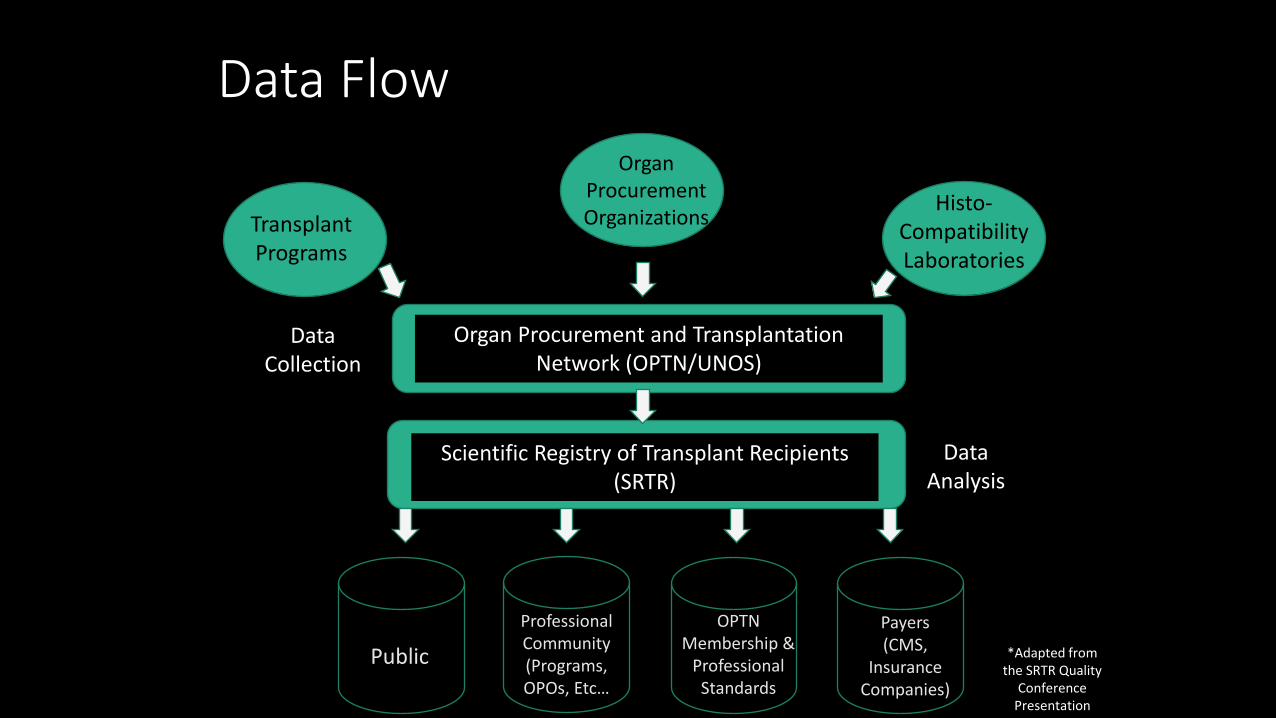
Data Flow
Transplant Programs
Organ Procurement Organizations Histo-
Compatibility Laboratories
Organ Procurement and Transplantation Network (OPTN/UNOS)
Scientific Registry of Transplant Recipients (SRTR)
Data Collection
Data Analysis
Transplant Programs
Professional Community (Programs, OPOs, Etc…
Public OPTN
Membership & Professional
Standards
Payers (CMS,
Insurance Companies)
*Adapted from the SRTR Quality
Conference Presentation
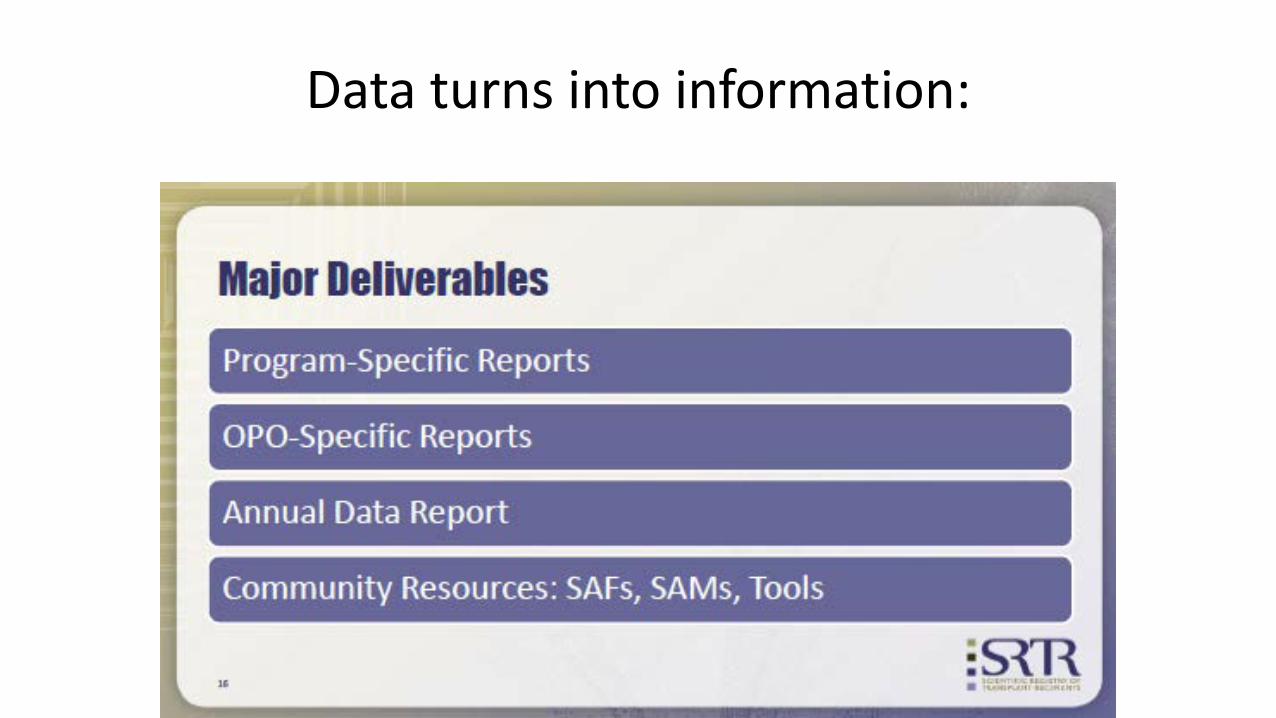
Data turns into information:

Different Audiences, Different Questions: Different Statistics and Interpretations • Patients and families
What will happen to me? Percent survival at 1 year, 3 years. Chances of transplant or death while on the waiting list. CMS-required consent process.
• Payers (including CMS) and MPSC Does a program perform up to standard or systematically fail to
do so? • Transplant programs
What choices do our patients have? What can we tell our patients about waiting time and survival? How well are we doing? How can we improve?

Two Main Components:
OBSERVED • The actual number of patients in
that cohort that lived post a year transplant.
EXPECTED • The anticipated number of
patients that were supposed to live based on characteristics of
• Recipients • Donors • Transplant center
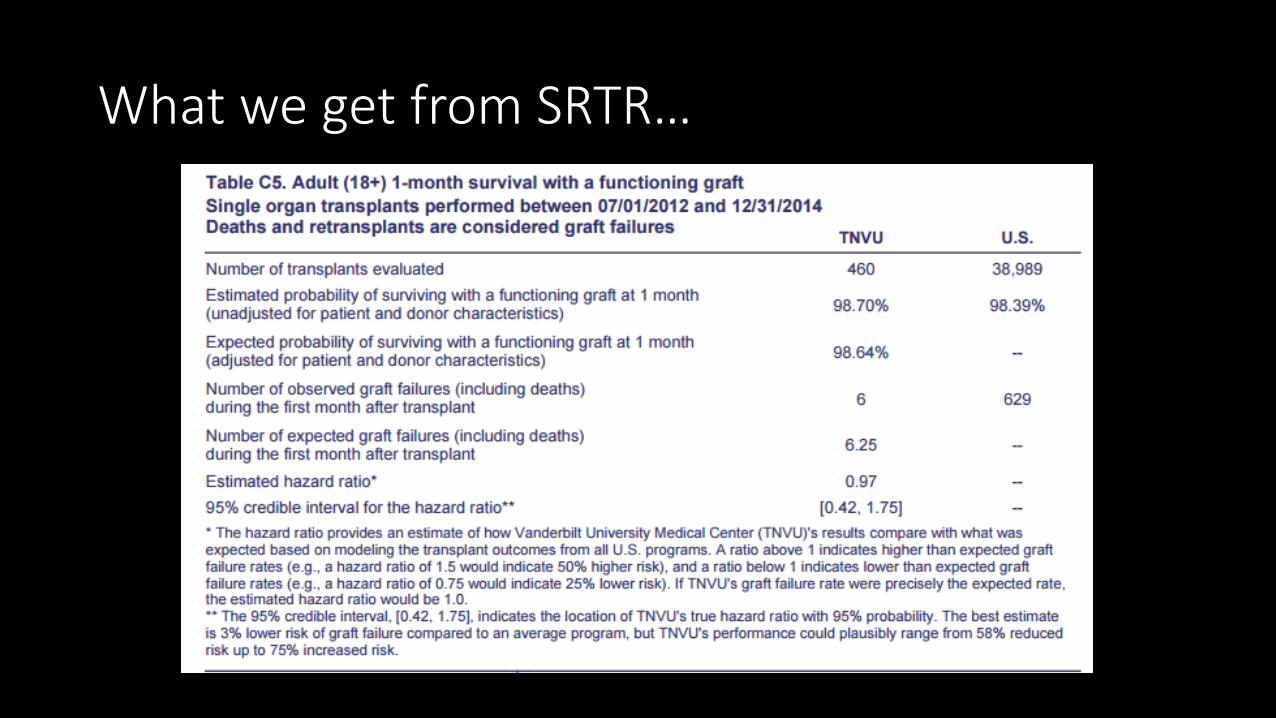
What we get from SRTR…
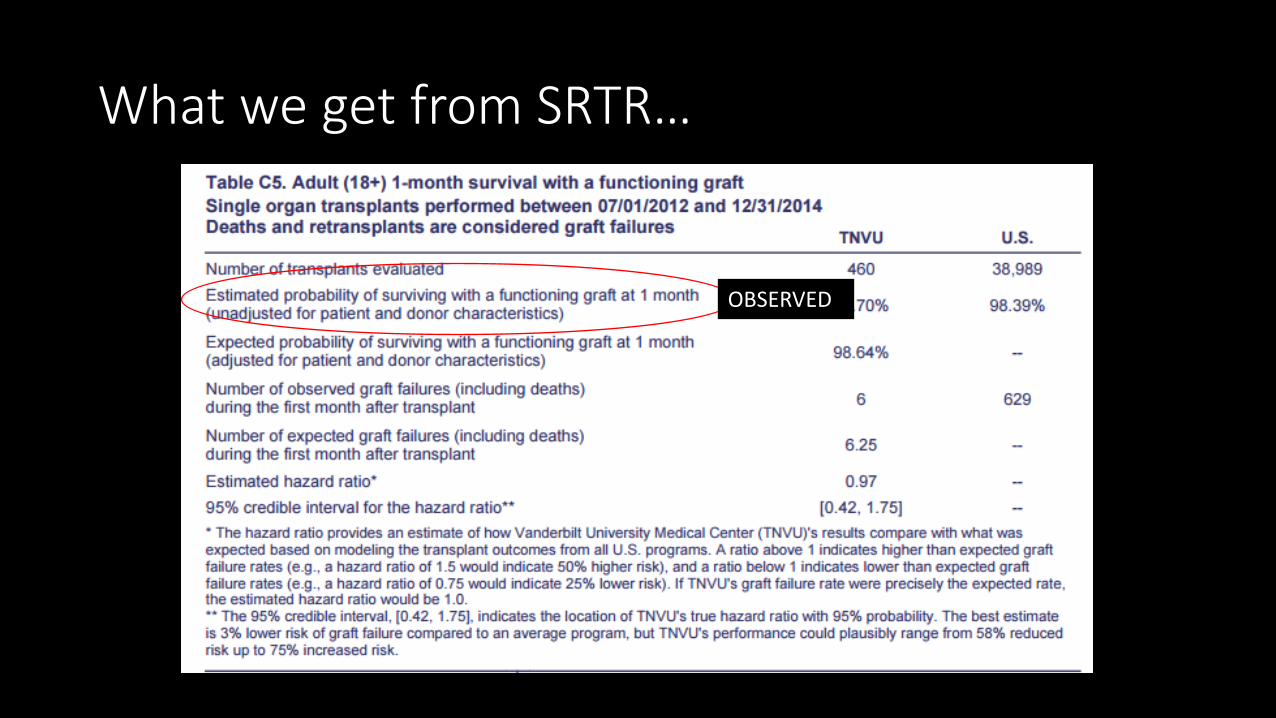
What we get from SRTR…
OBSERVED

What we get from SRTR…
EXPECTED
Why Compare Observed and Expected Outcomes? • Allows fair comparison among programs that treat different types of
patients. • Programs that treat older or sicker patients might provide excellent care even
though outcomes are worse than average. • Programs that treat healthier patients might not provide excellent care even
though outcomes are better than average.

So I am confused, is this all real time data?
NO!
Timeline for Program-Specific Reports
• Updated every 6 months (June, December).
• Patient and graft survival tables report 1-month, 1-year, and 3-year outcomes for 2.5-year cohorts of recipients.

Why Don’t We Have 1-Year Survival for the Last 6 Months of Transplants? 1. 1-year outcomes are not available for 18 months.
• One year needed to determine 1-year survival. • Time needed for programs to submit 1-year follow-up forms to OPTN. • Two months needed for SRTR to calculate statistics and for centers to
comment. 2. Must include enough transplants to allow stable estimates; PSRs use
2.5 years. Together, these factors require a 2.5-year cohort ending 12 to 18
months before the report date, with some transplants occurring as long as 3.5 to 4 years before.

A little more on understanding that tricky expected calculation…
Risk Adjustment
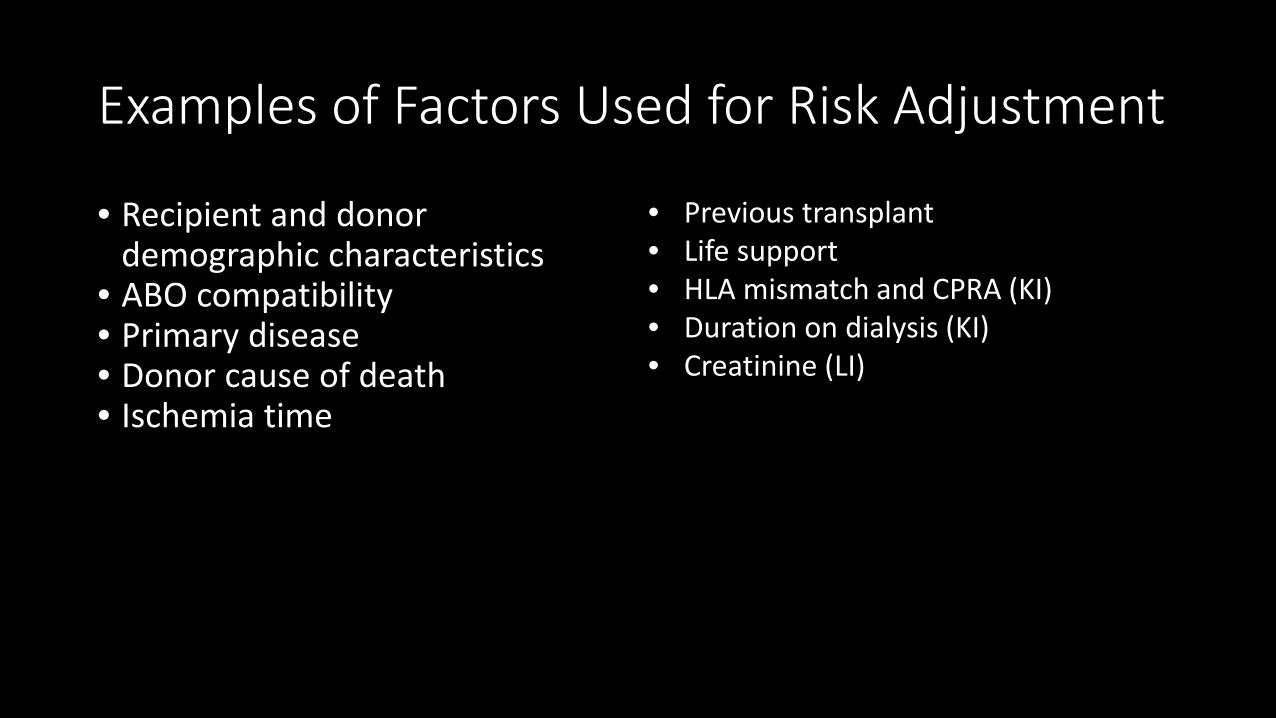
Examples of Factors Used for Risk Adjustment
• Recipient and donor demographic characteristics
• ABO compatibility • Primary disease • Donor cause of death • Ischemia time
• Previous transplant • Life support • HLA mismatch and CPRA (KI) • Duration on dialysis (KI) • Creatinine (LI)
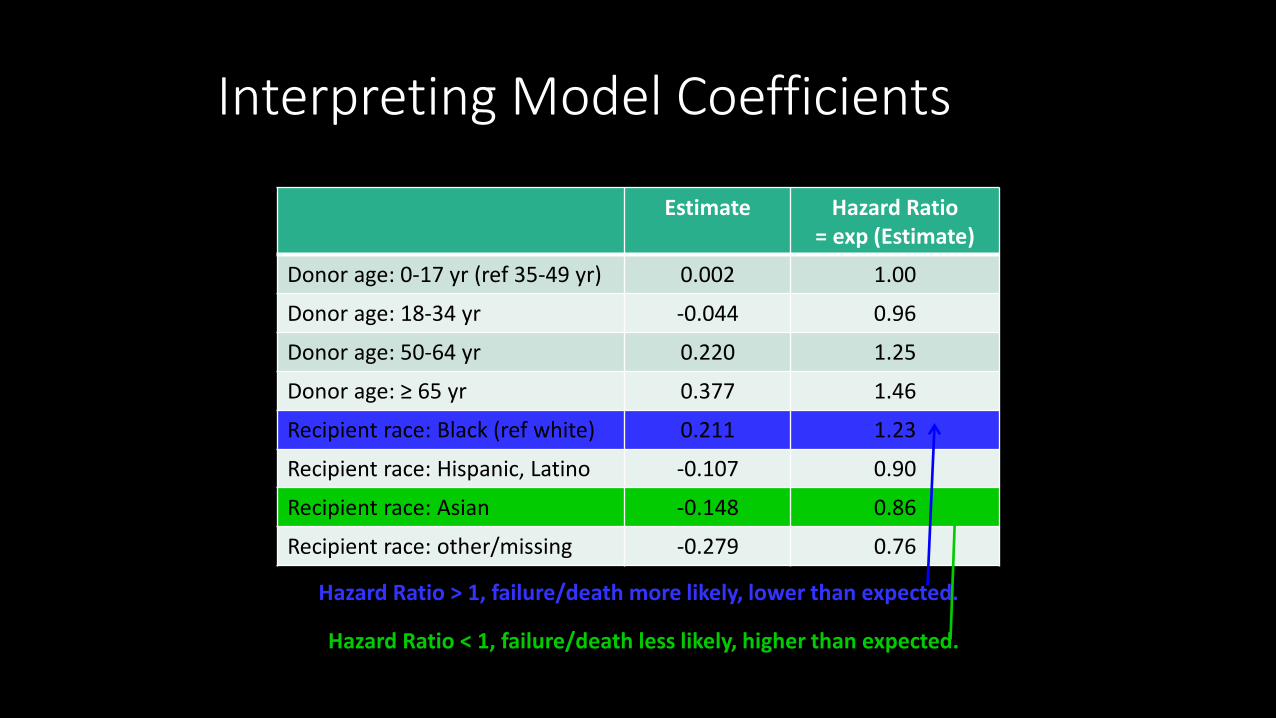
Interpreting Model Coefficients
Estimate Hazard Ratio = exp (Estimate)
Donor age: 0-17 yr (ref 35-49 yr) 0.002 1.00
Donor age: 18-34 yr -0.044 0.96
Donor age: 50-64 yr 0.220 1.25
Donor age: ≥ 65 yr 0.377 1.46
Recipient race: Black (ref white) 0.211 1.23
Recipient race: Hispanic, Latino -0.107 0.90
Recipient race: Asian -0.148 0.86
Recipient race: other/missing -0.279 0.76
Hazard Ratio > 1, failure/death more likely, lower than expected.
Hazard Ratio < 1, failure/death less likely, higher than expected.

Lightbulb Moment
Risk Adjustment Our EXPECTED value

How does this impact you?
Every piece of data we enter into UNOS impacts our EXPECTED VALUE and thus our outcomes!

CUSUM

Purpose
• Provide programs with close to real-time data
• CUSUM is designed to track outcomes over time for individual programs
• Doesn’t replace PSRs • CUSUM charts DO NOT go
through a formal review period
WHAT are CUSUM Charts?
• Quality control method used in statistical analysis • Used to detect a change in a process • Looks at performance over time (3 years time) • If there are no deaths the CUSUM line trends down….if deaths occur
the line goes up

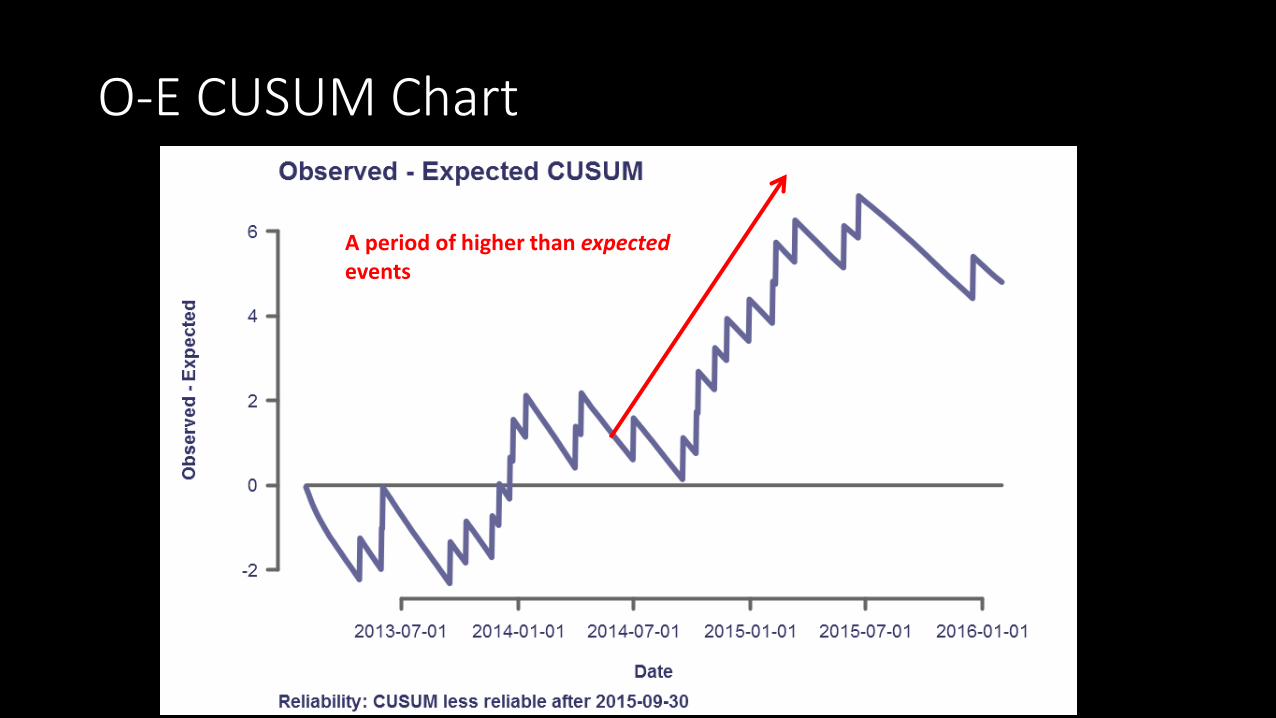
O-E CUSUM Chart

O-E CUSUM Chart
Baseline is zero, your observed was the same as your expected

O-E CUSUM Chart
CUSUM line indicating trends in outcomes
O-E CUSUM Chart
A period of higher than expected events

O-E CUSUM chart
A period of lower than expected events
Always locate the zero/ baseline first
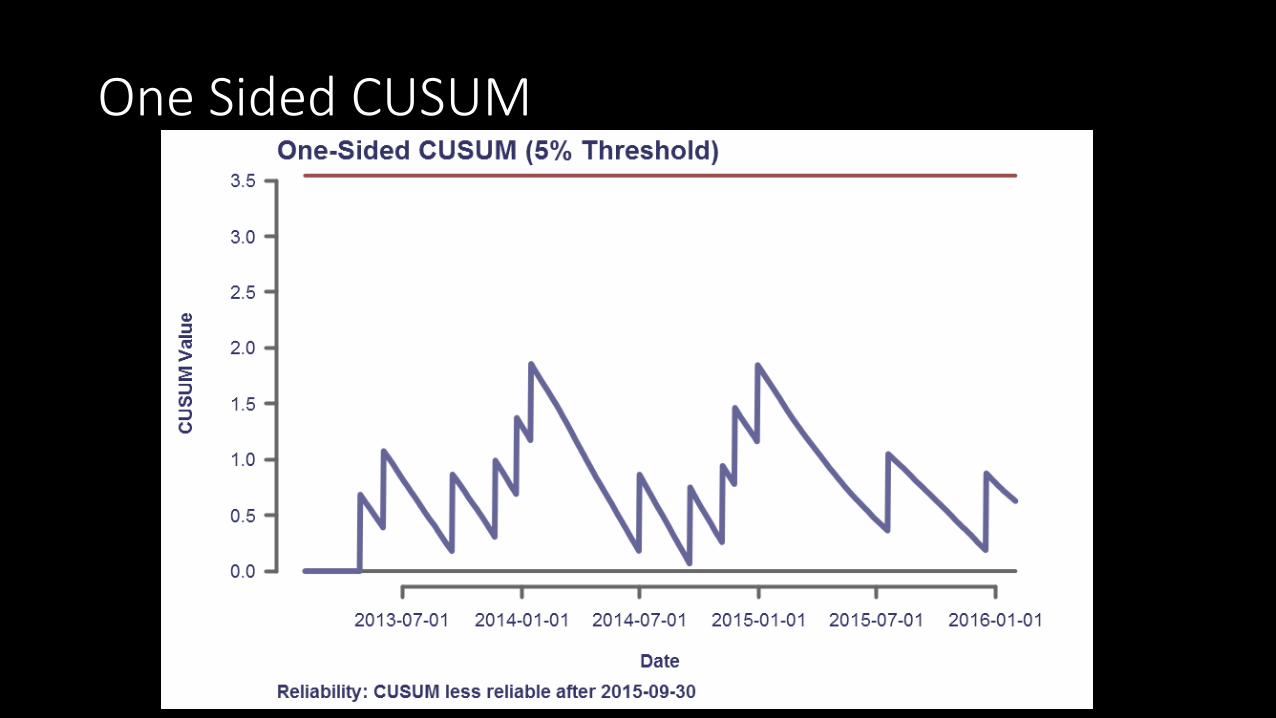
One Sided CUSUM
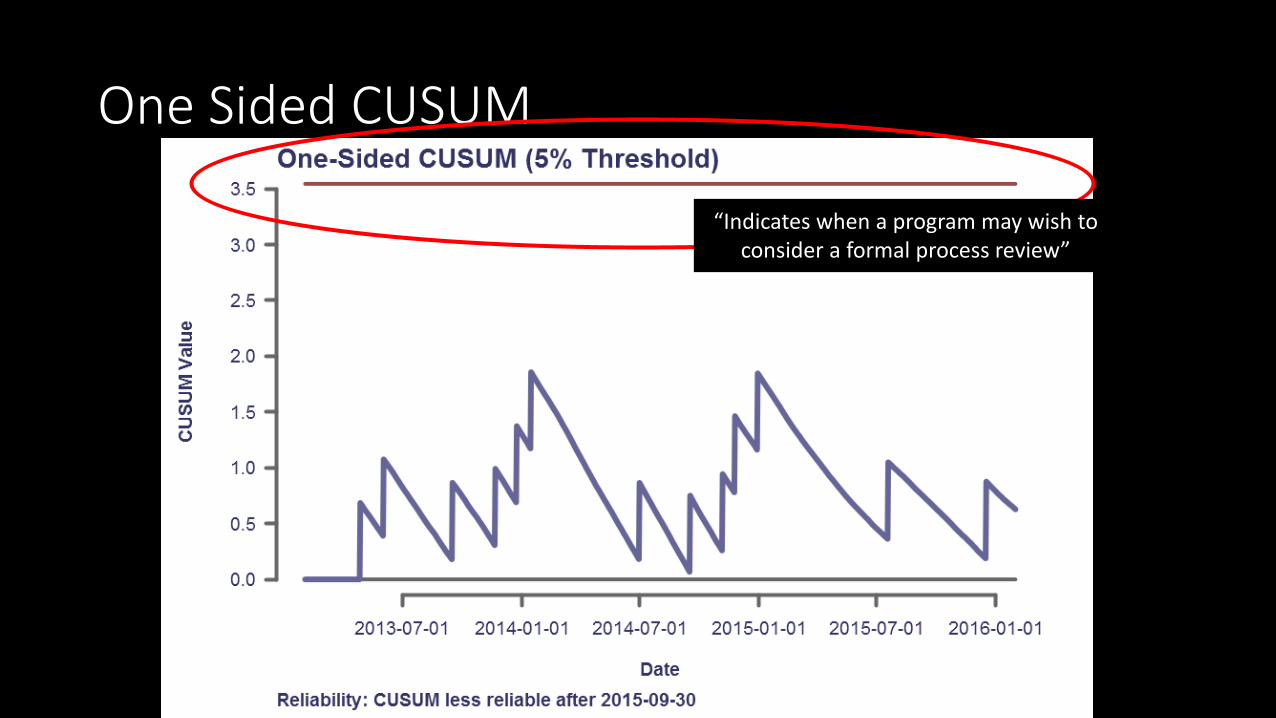
One Sided CUSUM
“Indicates when a program may wish to consider a formal process review”

One Sided CUSUM
Each tick marks an event
When the 5% threshold is hit it resets to zero

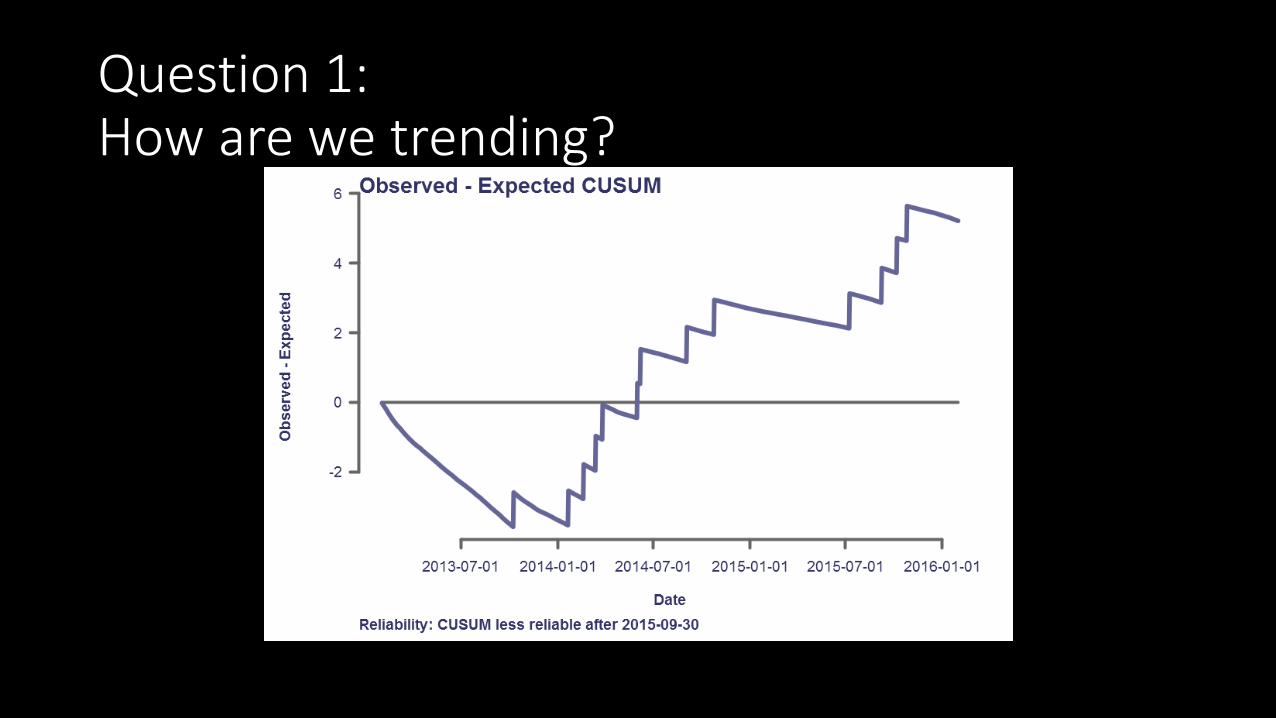
Question 1: How are we trending?

Question 2: How is our program doing?

Can you predict your outcomes?

Looking at Flagging Criteria
Adverse Events
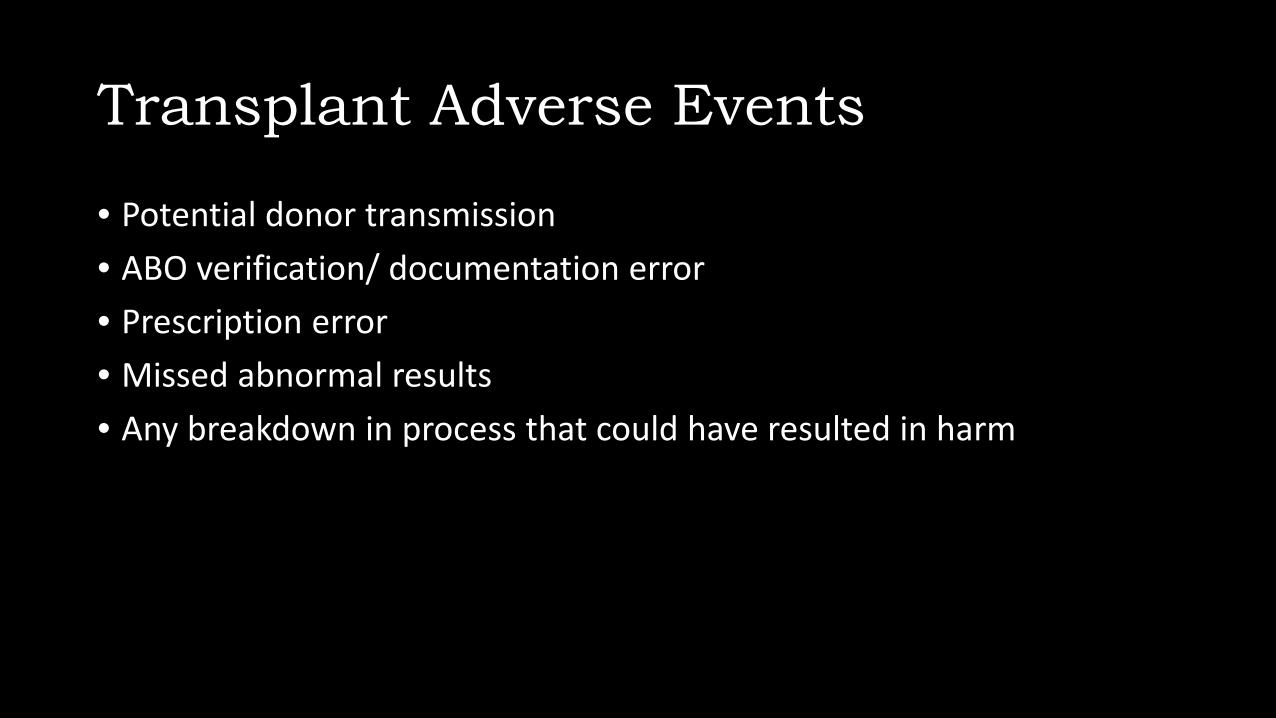
Transplant Adverse Events
• Potential donor transmission • ABO verification/ documentation error • Prescription error • Missed abnormal results • Any breakdown in process that could have resulted in harm

Certain events must be reported to UNOS

ADVERSE EVENTS that need to be reported to UNOS Immediately…
• Death or serious injury during the initial admission for transplantation • Medical device related death • Unintentional transplant • Death or organ failure of a living donor during initial admission • Major living donor complication • Incorrect ABO UNOS waitlist activation of a potential transplant patient • A transplant is cancelled intraoperatively • Potential Disease Transmission
When a Serious Event Occurs, what happens next?
• Communication with transplant management staff, patient, hospital quality, risk management
• Identification of who was involved • ‘Thorough review” or RCA (Root Cause Analysis) performed • Action plan developed • F/U monitoring for sustainability of action plan

Root Cause Analysis (RCA)
• Investigation into: • What happened? • Why did it happen? • What needs to be done to correct the problem? • How to prevent this problem from happening again?
So basically….


So what is the benefit of this method?
• Focuses on all variables vs. one factor in particular • Instead of focusing on the error/ mistake/ event an RCA approaches
the problem from a systems approach • KEY POINT:
Embraces safety culture ideology by not placing blame on individuals

“The biggest challenge to moving toward a safer health system is changing the culture from one of blaming individuals for errors to one in which errors are treated not as personal failures but as opportunities to improve the system and prevent harm.”
-Institute of Medicine, 2001

So lets think about this…
This nurse gave the wrong medication to her patient.
Fifth 12 hr shift in a
row

Case Example:
Medication Error
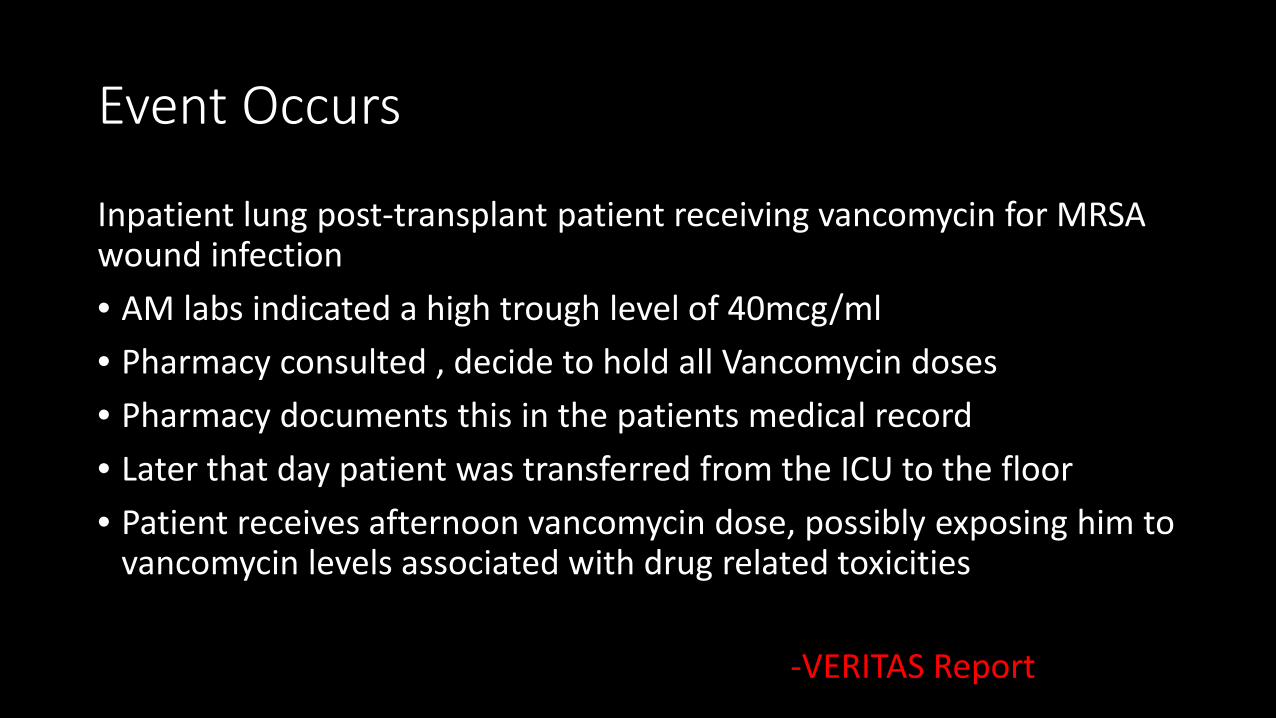
Event Occurs
Inpatient lung post-transplant patient receiving vancomycin for MRSA wound infection • AM labs indicated a high trough level of 40mcg/ml • Pharmacy consulted , decide to hold all Vancomycin doses • Pharmacy documents this in the patients medical record • Later that day patient was transferred from the ICU to the floor • Patient receives afternoon vancomycin dose, possibly exposing him to
vancomycin levels associated with drug related toxicities
-VERITAS Report

Don’t Jump to Solutions

RCA team is formed
• Transplant physician • Pharmacist • Lab • Inpatient nursing • Transplant quality • Transplant pharmacy • Objective outsiders

Gather data
• Thorough chart review • Interview staff involved • Evaluate technology and systems involved
• Are there processes in place to prevent this error from occurring? If so why did they fail?
• Create a time line

Identification of Contributing Factors
• Fishbone Diagram • 5 whys

5 Whys? Why did the patient get the afternoon dose of vancomycin despite being held?
Because the floor nurse did not know the patient was not suppose to receive the afternoon dose.
Why? Because the nurse did not get that information in report from the ICU nurse during the transfer
Because the ICU nurse did not communicate that the patient’s vancomycin was being held.
Because pharmacy had communicated to the ICU nurse that they were holding the dose for the day and they would document that in the patients chart
Why?
Why?
Patient’s POC was not adequately communicated to all members of the multidisciplinary team.

Fishbone diagram
Problem: Pt received
vancomycin after it was
held
Communication
Transfer Report
Pharmacy and nursing communication
Documentation
Lack of standard in charting
Lack of highlighted pertinent patient information
Administration
MAR did not trigger a warning at time of administration
MAR and lab systems lack of communication
Dose was still active on patient’s order set

Taking Action! Action Person Responsible Implementation Date
Create standardized transfer report template that includes medication reconciliation
Nurse Manager of ICU, Nurse manager of floor
Oct 1st
Pharmacy will create a policy that when a medication is on hold it will be discontinued and have to be restarted
Pharmacy manager Nov 1st
Lab values will populate on both the order entry system and during medication administration
IT, Dr. Smith and Nurse Tim Nov 15th
Pharmacy will clearly document and highlight medication concerns in the patient summary
Pharmacy Already started

Hardest Part… Following up!
• Sustainment • Did the project work? • Did we forget an important step? • Are these solutions helping or hurting? • How do we measure success?
30-60-90-120
• Check in • With staff • Determine if any other errors have occurred • Is the process working?
Continuous improvement never ends.

Shout it from the roof tops!
• Lessons Learned • Communicate:
• Top to bottom • Horizontal

A moment to talk about the importance of TRANSPARENCY

Process Improvement Projects

Value Stream Map your referral process
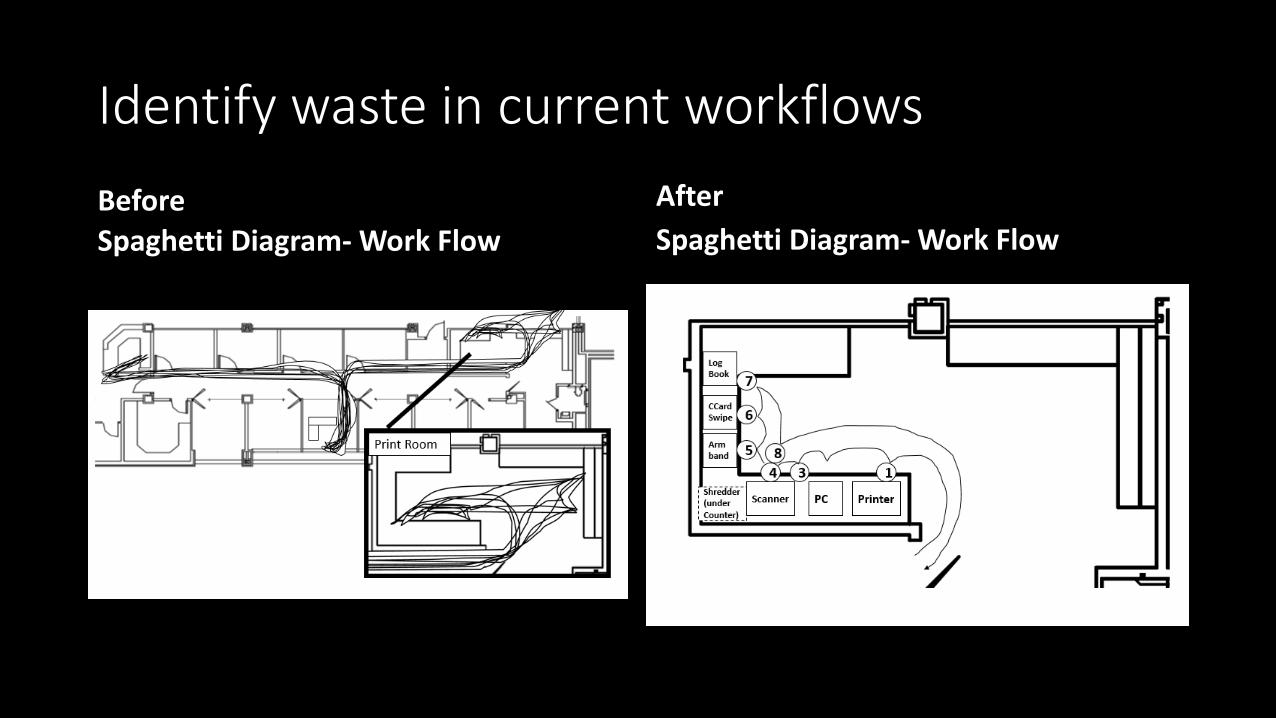
Identify waste in current workflows
Before Spaghetti Diagram- Work Flow
After Spaghetti Diagram- Work Flow

Help bring standardization to your programs
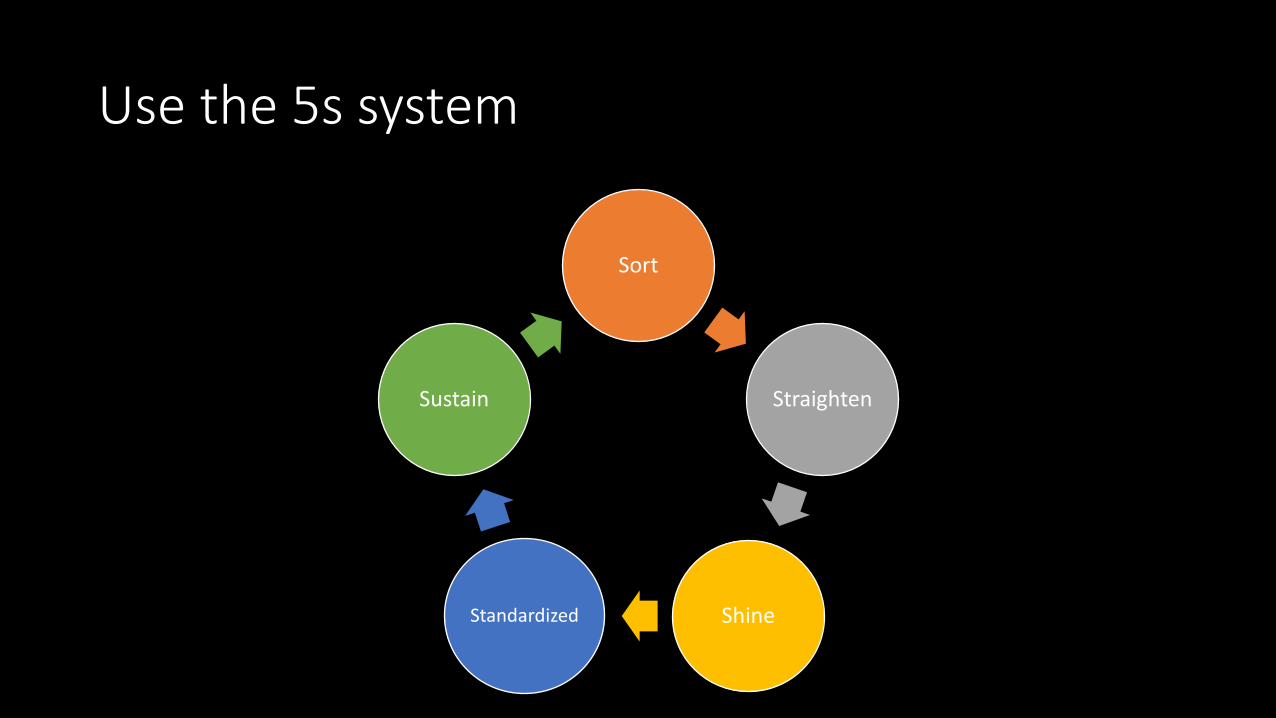
Sort
Straighten
Shine Standardized
Sustain
Use the 5s system

Quality Challenge

Does this look familiar?
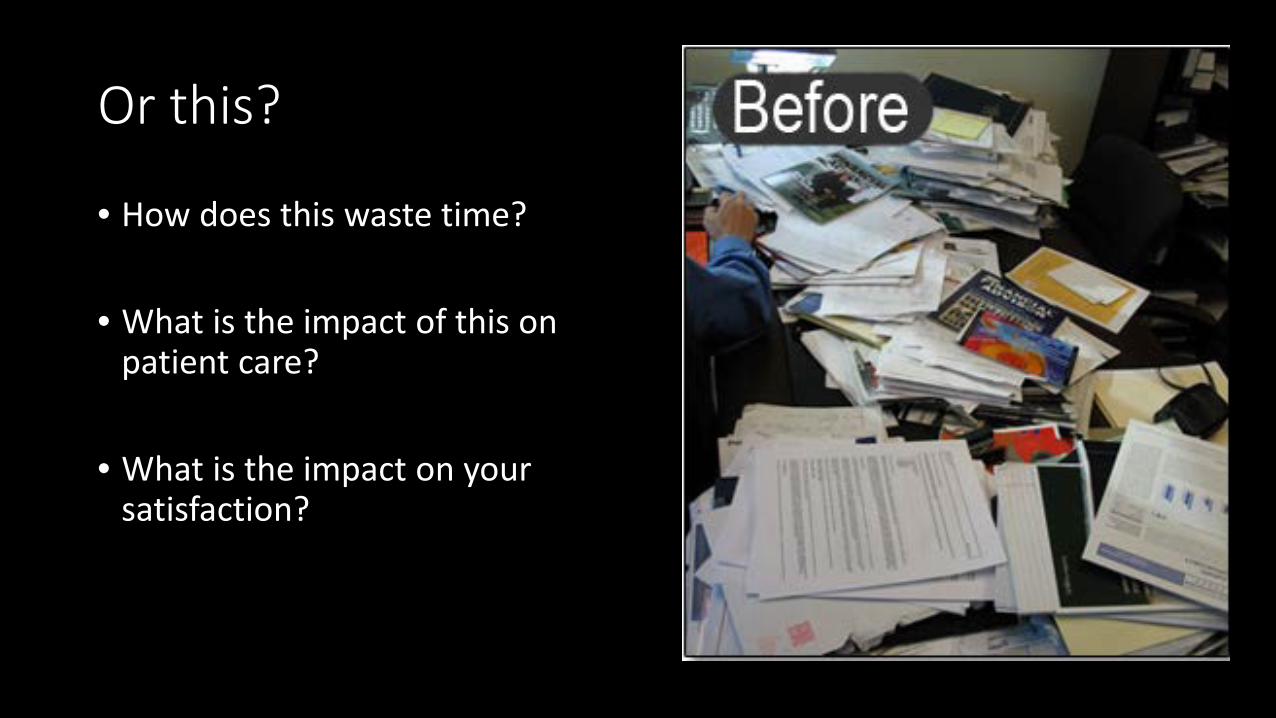
Or this?
• How does this waste time?
• What is the impact of this on patient care?
• What is the impact on your satisfaction?

Step 1: Sort
Defined • Get RID of unneeded items • “When in doubt move it out” • DO I need this? • Is this really important? • When was the last time I used
this?
Examples: • Paper copies that are available
electronically • Old policies or forms that have
been updated • Trash

Step 2: Straighten
Defined • Organize and label the location
for items • THERE IS A PLACE FOR
EVERYTHING- EVERYTHING IN ITS PLACE
Labeled Bins
Labeled Binders
No Clutter

Hospital Example of Straighten
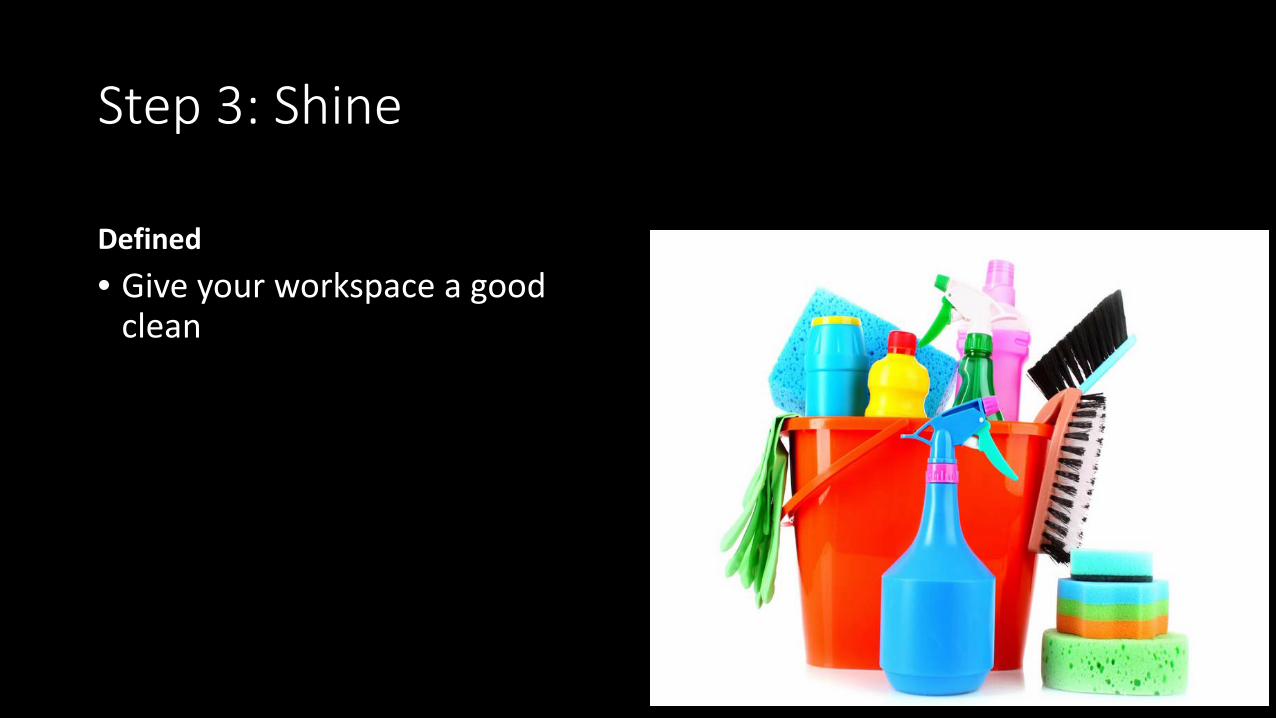
Step 3: Shine
Defined • Give your workspace a good
clean

Step 4: Standardize
Defined • Develop cleaning methods and
cleanliness standards to maintain the first 3 S’s
• How often do you fall back into your old habits?
Example • Put organizing your desk on your
to-do list • My personal one: Clean my desk
every Friday afternoon

Step 5: Sustain
Defined • The hardest part of any change • Make it a habit
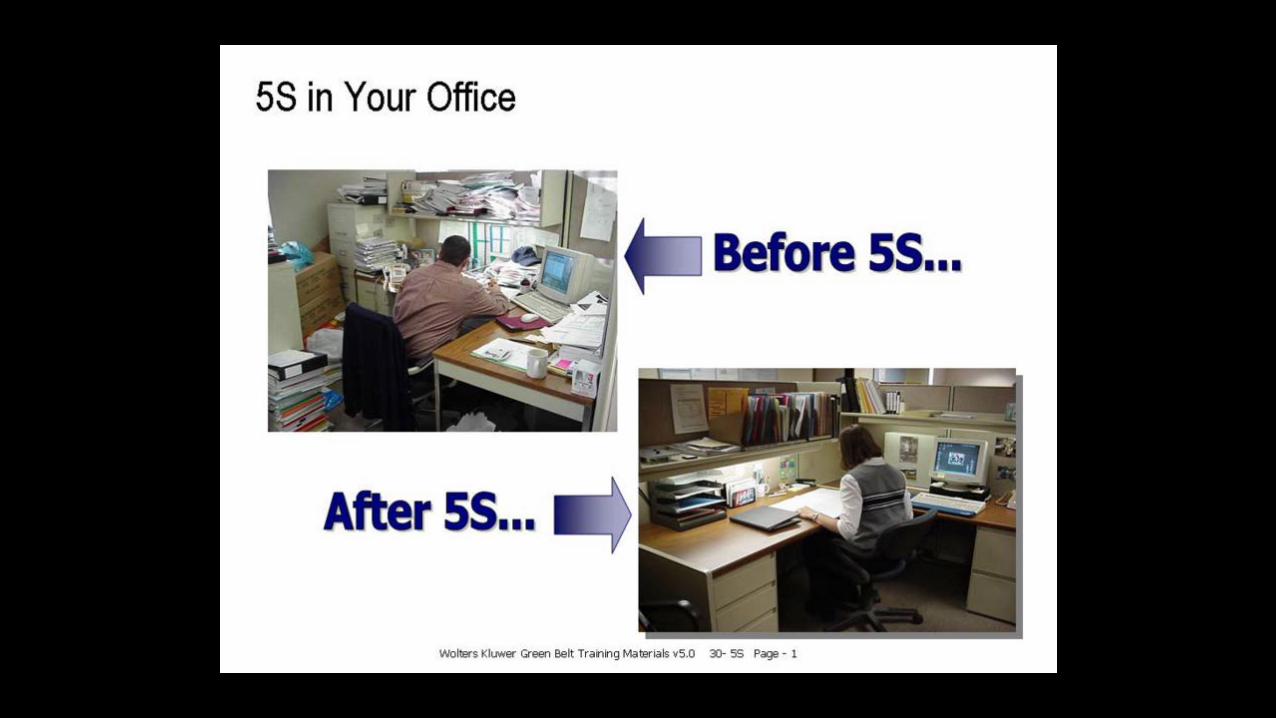

After Pictures
Before
After

Final comments…..

What is your role in Quality?
• Be alert for potential opportunities for improvement and areas of potential risk
• Identify objectives that are of particular interest to your practice • Streamline a process • Monitor for a change in outcomes associated with a change in patient
management
• Collaborate with other team members to develop and standardize best practices based on the results of your initiatives
• Present results of your outcomes metrics to a national meeting
Quality inspires action.