
The potential of using beach wells for reverse osmosis ...
12
ORIGINAL ARTICLE The potential of using beach wells for reverse osmosis desalination in Qatar Husam Musa Baalousha 1 Received: 28 May 2016 / Accepted: 4 June 2016 / Published online: 14 June 2016 Ó Springer International Publishing Switzerland 2016 Abstract Qatar is an arid country, with limited water resources. The country relies on desalination of seawater to meet the increasing water demand for municipal and industrial needs, while the agricultural sector uses the precious fresh groundwater. Groundwater underneath Qatar is mostly saline or brackish with small lenses of fresh water in the northern part of the country. Brackish groundwater in Qatar has a Total Dissolved Solids of less than 10,000 mg/ l, compared to seawater, which is 35,000 mg/l. Using brackish and saline groundwater for desalination via beach wells is less costly and more environmental friendly than direct sea water intake, which is being used in Qatar. The main challenge facing beach wells usage is their ques- tionable capacity to provide enough quantities for desali- nation plants. This study investigates the optimal location and the maximum yield of beach wells in Qatar, using Sea Water Intrusion model (SWI2), coupled with MODFLOW. Model results show the maximum yield of wells at a depth of 100 m is 16,000 m 3 per km 2 . This quantity is good enough for a medium size reverse osmosis plant. Based on hydrogeological settings, the proposed location for the beach wells is near Al-Khor town and to the north of it. Keywords Desalination Beach wells Seawater intrusion Qatar MODFLOW SWI2 Introduction Qatar is a small country located in the eastern part of the Arabian Peninsula and extending into the Arabian Gulf. Its width varies between 55 and 90 km and its length is approximately 160 km. The total area of the country is around 11,500 km 2 . Qatar, as most arid countries, has limited natural water resources, which requires looking into other sources. Aquifer is the only source of natural water in the country, which is heavily over-exploited. Because of limited rainfall (less than 80 mm per year on average), ground- water recharge is very little (Kimrey 1985; Alsharhan et al. 1990). The average annual groundwater recharge from rainfall is approximately 60 million m 3 (Eccleston et al. 1981; Schlumberger Water Services 2009; Baa- lousha 2015, 2016a). This is less than one quarter of the current agriculture water demand, which is around 250 million m 3 per year, in addition to other sectors demand. The stresses on water resources increased further given the high rate of increase in Qatar population due to the influx of expats. Figure 1 shows the trend in population increase, which is expected to continue at the same rate until 2022. Prior 1950, the population was less than 40,000 (Al- Mohannadi et al. 2003), and the residential communities relied on hand-dug wells in the shallow aquifer, where the groundwater was fresh (Macumber 2011). However, the population has increased sharply and the groundwater is obviously not sustainable. As a result, Qatar has focused on desalination as a more reliable source of water supply, especially with the discovery of large reserves of oil and gas, which provides the needed energy to operate desali- nation plants. The first desalination plant in Qatar came online in 1962 (Al-Mohannadi et al. 2003). & Husam Musa Baalousha [email protected] 1 Qatar Environment and Energy Research Institute (QEERI), Hamad Bin Khalifa University (HBKU), PO Box: 5825, Doha, Qatar 123 Model. Earth Syst. Environ. (2016) 2:97 DOI 10.1007/s40808-016-0151-5
Transcript of The potential of using beach wells for reverse osmosis ...

ORIGINAL ARTICLE
The potential of using beach wells for reverse osmosis desalinationin Qatar
Husam Musa Baalousha1
Received: 28 May 2016 / Accepted: 4 June 2016 / Published online: 14 June 2016
� Springer International Publishing Switzerland 2016
Abstract Qatar is an arid country, with limited water
resources. The country relies on desalination of seawater to
meet the increasing water demand for municipal and
industrial needs, while the agricultural sector uses the
precious fresh groundwater. Groundwater underneath Qatar
is mostly saline or brackish with small lenses of fresh water
in the northern part of the country. Brackish groundwater in
Qatar has a Total Dissolved Solids of less than 10,000 mg/
l, compared to seawater, which is 35,000 mg/l. Using
brackish and saline groundwater for desalination via beach
wells is less costly and more environmental friendly than
direct sea water intake, which is being used in Qatar. The
main challenge facing beach wells usage is their ques-
tionable capacity to provide enough quantities for desali-
nation plants. This study investigates the optimal location
and the maximum yield of beach wells in Qatar, using Sea
Water Intrusion model (SWI2), coupled with MODFLOW.
Model results show the maximum yield of wells at a depth
of 100 m is 16,000 m3 per km2. This quantity is good
enough for a medium size reverse osmosis plant. Based on
hydrogeological settings, the proposed location for the
beach wells is near Al-Khor town and to the north of it.
Keywords Desalination � Beach wells � Seawaterintrusion � Qatar � MODFLOW � SWI2
Introduction
Qatar is a small country located in the eastern part of the
Arabian Peninsula and extending into the Arabian Gulf. Its
width varies between 55 and 90 km and its length is
approximately 160 km. The total area of the country is
around 11,500 km2.
Qatar, as most arid countries, has limited natural water
resources, which requires looking into other sources.
Aquifer is the only source of natural water in the country,
which is heavily over-exploited. Because of limited
rainfall (less than 80 mm per year on average), ground-
water recharge is very little (Kimrey 1985; Alsharhan
et al. 1990). The average annual groundwater recharge
from rainfall is approximately 60 million m3 (Eccleston
et al. 1981; Schlumberger Water Services 2009; Baa-
lousha 2015, 2016a). This is less than one quarter of the
current agriculture water demand, which is around 250
million m3 per year, in addition to other sectors demand.
The stresses on water resources increased further given
the high rate of increase in Qatar population due to the
influx of expats. Figure 1 shows the trend in population
increase, which is expected to continue at the same rate
until 2022.
Prior 1950, the population was less than 40,000 (Al-
Mohannadi et al. 2003), and the residential communities
relied on hand-dug wells in the shallow aquifer, where the
groundwater was fresh (Macumber 2011). However, the
population has increased sharply and the groundwater is
obviously not sustainable. As a result, Qatar has focused on
desalination as a more reliable source of water supply,
especially with the discovery of large reserves of oil and
gas, which provides the needed energy to operate desali-
nation plants. The first desalination plant in Qatar came
online in 1962 (Al-Mohannadi et al. 2003).
& Husam Musa Baalousha
1 Qatar Environment and Energy Research Institute (QEERI),
Hamad Bin Khalifa University (HBKU),
PO Box: 5825, Doha, Qatar
123
Model. Earth Syst. Environ. (2016) 2:97
DOI 10.1007/s40808-016-0151-5

The produced water from desalination plants in Qatar
meets 99 % of domestic demand. Nine main desalination
plants provide a total of 1.48 million m3 per day (or 540
million m3 per year), as shown in Table 1. Around 30–35 %
of this amount is lost as leakage, which contributes to the
problem of high water table in Doha City (Qatar General
Secretariat for Development Planning 2011). In addition to
leakage, many construction projects in Doha, including
mega projects such as underground train, are altering the
water table. In many cases, increased groundwater level
creates problems for these projects, so the brackish or saline
groundwater is being pumped out and discharged away in
open field or back to the sea, with no use of it.
The treated wastewater covers 14 % of the needs, and is
being used mainly for landscaping. Despite the shortage in
natural water resources, water consumption in Qatar is the
highest in the world, with an average of 500 l per capita per
day (Qatar General Secretariat for Development Planning
2011). This is due to many socio-economic factors and the
development of the country over the last few decades.
Locals in Qatar receive water and energy for free, whereas
non-Qataris pay a subsidized price (Qatar General Secre-
tariat for Development Planning 2011).
As shown in Table 1, all desalination plants in Qatar use
thermal desalination technology, which consumes high
energy compared to reverse osmosis, but require less pre-
treatment. Direct intake from seawater is used to feed these
plants. Given the high salinity of groundwater in all coastal
areas of the country resulting from seawater intrusion,
pumping this saline groundwater at the shoreline might help
counter the seawater intrusion and protect the fresh
groundwater resources. The decision whether or not to use
groundwater wells as a source for a desalination plant
depends on hydrogeological characterisation, aquifer yield
and the plant size (David et al. 2009; WateReuseAssociation
Desalination Committee 2011). One of the main challenges
for saline/brackish groundwater desalination is the capacity
of wells to provide the needed volumes of water as a feed for
the plants. Another concern is the effect of brackish/saline
groundwater abstraction on the quality of the fresh ground-
water. In addition, deep beach wells might be costly, com-
pared to surface water takes, if drilling is needed to large
depths (Gille 2003). Other problems of beach wells could be
those related to well installations and maintenance such as
screen corrosion or boreholes collapse. These could be
mitigated through regular monitoring and maintenance.
Fig. 1 Population trend in
Qatar (based on data from
trading economics: http://www.
tradingeconomics.com/)
Table 1 Desalination plants
and their capacity (Alrashid
2014)
Plant Technology Capacity (million m3/day)
Ras Abu Fontas A Multi-stage flash distillation (MSFE) 0.25
Ras Abu Fontas A1 Multi-stage flash distillation (MSFE) 0.20
Ras Abu Fontas B Multi-stage flash distillation (MSFE) 0.15
Ras Abu Fontas B2 Multi-stage flash distillation (MSFE) 0.13
RLPC Multi-stage flash distillation (MSFE) 0.18
Q power Multi-stage flash distillation (MSFE) 0.27
RG Multiple-effect distillation (MED) 0.29
Dukhan Multiple-effect distillation (MED) 0.01
Total 1.48
97 Page 2 of 12 Model. Earth Syst. Environ. (2016) 2:97
123

This paper looks into the hydrogeological settings of
Qatar to assess the suitability and reliability of using beach
wells for desalination. A three dimensional groundwater
flow and seawater intrusion model was developed using the
U.S. Geological Survey finite difference-based MOD-
FLOW, with the Sea Water Intrusion (SWI2) package
(Bakker et al. 2013). Calibrated hydraulic properties
resulting from previous work on groundwater flow mod-
elling were used to develop a variable density groundwater
flow model. Various pumping rates are examined using
MODFLOW-SWI2 model, and the effect on saline-
groundwater interface is explored. This variable density
model helps determine aquifer yield and the effect of saline
groundwater pumping on the fresh-saline interface. It also
helps identify the proper location for beach wells along the
coast of Qatar.
Qatar hydrogeology and groundwater resources
Qatar topography is flat; with land elevation varies between
0 near the coast up to 107 m in some areas in the south-
west. The geology of Qatar comprises limestone forma-
tions mainly from Tertiary period, whereas Quaternary
deposits occur only in a form of beach deposits and Sabkha
(Al-Hajari 1990), as shown in the surface geology map
depicted in Fig. 2.
The main water-bearing geological formations in the
country are three: (1) The Dam and Dammam Formation,
(2) Rus Formation and, (3) Um Er Radhuma Formation.
All these formations are composed of limestone layers with
different degrees of dolomite, chalk, and conglomerate
(Kimrey 1985; Schlumberger Water Services 2009; Al-
Hajari 1990; Vecchioli 1976; Baalousha 2016b). The
Fig. 2 Surface geology and
model boundary (Baalousha
2016b)
Model. Earth Syst. Environ. (2016) 2:97 Page 3 of 12 97
123

uppermost formation, Dam and Dammam, has a thickness
of less than 50 m and generally contains no water, except
in low lands and in the coastal areas (Eccleston et al. 1981;
Baalousha 2016b). Rus Formation (the middle layer) is
thicker than the top one, with a thickness of up to 80 m.
This formation contains gypsum deposits, in particular in
the southern part of the country, making water quality poor
due to dissolution of gypsum. The lower water bearing
layer is Umm er Radhuma, which has a thickness of up to
more than 300 m, and its water is generally brackish or
saline.
Most wells penetrate the top two layers, as the quality
deteriorates at greater depths. Wells are clustered in the
northern part of the country, which contains fresh
groundwater in a form of lenses overlaying brackish and
saline groundwater. Most of groundwater abstraction is
used to irrigate farms that scattered across the country, but
mainly in the northern part. Due to overexploitation of
groundwater resources, seawater intrusion took place and
advanced inland to more than 15 km from the shoreline. In
addition, upconing phenomena took place (Schmork and
Mercado 1968), where brackish and saline groundwater
flows upward into a pumping well. As a result, many wells
were abandoned as their salinity becomes high.
The volume of the abstracted groundwater has increased
from less than 50 million m3, in the early seventies to more
than 250 million m3 at present (Eccleston et al. 1981;
Schlumberger Water Services 2009). This is around five
times the estimated groundwater recharge (Eccleston et al.
1981; Baalousha 2015). Due to heavy pumping and in
absence of regulations (Al-Mohannadi et al. 2003; Qatar
General Secretariat for Development Planning 2011), the
groundwater level has dropped more than 10 m in some
places (Schlumberger Water Services 2009).
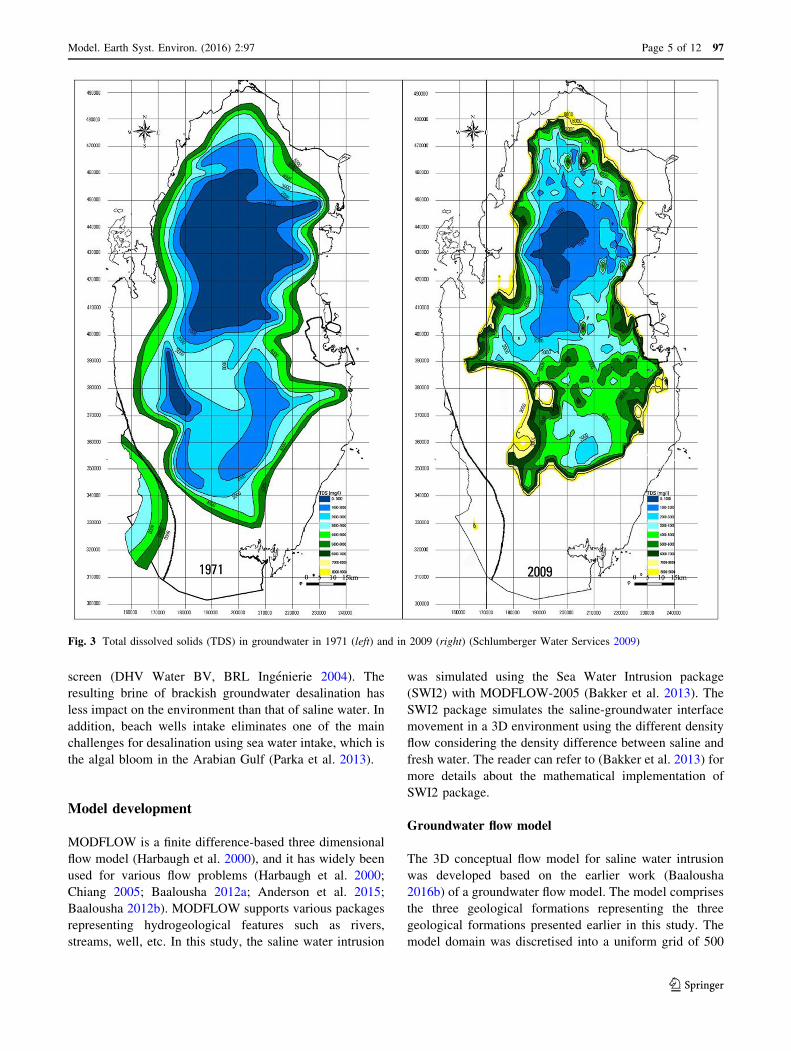
Figure 3 shows the Total Dissolved Solids (TDS) in
1971 and in 2009 (Schlumberger Water Services 2009).
The TDS varies between 1000 mg/l in the north and
10,000 mg/l near the coast. Comparing the two maps, it is
obvious the fresh groundwater area has retracted in 2009
into a much smaller area in the northern part of the country,
compared to 1971 (dark blue color in Fig. 3). This high-
lights the need to take urgent measures to counter the effect
of continuous saline water encroachment and groundwater
quality deterioration.
Sub-surface versus seawater intake
Brackish and saline groundwater wells have widely been
used to feed reverse osmosis desalination plants all over the
world. Beach wells are very common for this purpose, as
they can provide large volumes of water and alleviate the
problem of saline water intrusion. They also require less
pre-treatment compared with seawater take (Baalousha
2006; David et al. 2009). Beach well are normally arranged
in a form of galleries, which can provide reliable quantities
and better quality saline water for desalination plants.
For example, desalination plant feed using beach wells
has been used in Oman (David et al. 2009) with a capacity
of 80,200 m3/day. One of the largest desalination plant in
the world (San Pedro Del Pinatar-Cartagena) in Spain, with
a capacity of 34 MGD uses only groundwater intakes
(WateReuse Association Desalination Committee 2011).
Many other examples of usage of beach wells can be found
in the US, the Netherlands (Stuyfzand and Raat 2010),
Palestine, and Mexico. Reverse Osmosis plants require less
energy than the Multi-stage flash distillation (Munoz and
Fernandez-Alba 2008), which is currently being used in
Qatar, but the shift will be made over time to RO tech-
nology (Darwish et al. 2013).
In addition to their function as a source of water, beach
wells can be useful to counter saline water intrusion, as
illustrated in Fig. 4. Before pumping, fresh and saline
groundwater are static in equilibrium. According to Ghy-
ben–Herzberg equation (Verrjuit 1968), the distance
between the sea level line and the interface (z) is:
Z ¼qf
qs � qfh ð1Þ
where qf is the fresh water density, qs is saline water
density, and h is the distance from water table to sea level
line. Knowing that the fresh water has a density of 1 kg/l,
saline water density is around 1.025 kg/l, Eq. (1) yields to:
Z ¼ 40h ð2Þ
Equation (2) means that a one unit drop in the water
table (h in Fig. 4) results in 40 units upward movement of
the fresh-saline water interface (distance z in Fig. 4).
When the saline groundwater is pumped from the zone
below the interface, downward cone of fresh water devel-
ops, which is the opposite effect of upconing. This might
counter the saline water intrusion effect. The distance
z after pumping is larger than it before pumping, as the
interface moves a distance dz downward (Fig. 4b).
It is well known that brackish water desalination has less
adverse environmental impact than saline water desalina-
tion, and it should be given priority for desalination over
seawater (Munoz and Fernandez-Alba 2008). Saline and
brackish groundwater requires no pre-treatment as it is
naturally filtered, so the desalination cost is reduced.
Brackish groundwater may reduce the energy consumption
by half due to its lower salinity (Munoz and Fernandez-
Alba 2008), which reduces the adverse impact of burning
fossil foil. Saline water intake may disrupt maritime
activities and may kill organisms that collide with intake
97 Page 4 of 12 Model. Earth Syst. Environ. (2016) 2:97
123
screen (DHV Water BV, BRL Ingenierie 2004). The
resulting brine of brackish groundwater desalination has
less impact on the environment than that of saline water. In
addition, beach wells intake eliminates one of the main
challenges for desalination using sea water intake, which is
the algal bloom in the Arabian Gulf (Parka et al. 2013).
Model development
MODFLOW is a finite difference-based three dimensional
flow model (Harbaugh et al. 2000), and it has widely been
used for various flow problems (Harbaugh et al. 2000;
Chiang 2005; Baalousha 2012a; Anderson et al. 2015;
Baalousha 2012b). MODFLOW supports various packages
representing hydrogeological features such as rivers,
streams, well, etc. In this study, the saline water intrusion
was simulated using the Sea Water Intrusion package
(SWI2) with MODFLOW-2005 (Bakker et al. 2013). The
SWI2 package simulates the saline-groundwater interface
movement in a 3D environment using the different density
flow considering the density difference between saline and
fresh water. The reader can refer to (Bakker et al. 2013) for
more details about the mathematical implementation of
SWI2 package.
Groundwater flow model
The 3D conceptual flow model for saline water intrusion
was developed based on the earlier work (Baalousha
2016b) of a groundwater flow model. The model comprises
the three geological formations representing the three
geological formations presented earlier in this study. The
model domain was discretised into a uniform grid of 500
Fig. 3 Total dissolved solids (TDS) in groundwater in 1971 (left) and in 2009 (right) (Schlumberger Water Services 2009)
Model. Earth Syst. Environ. (2016) 2:97 Page 5 of 12 97
123

by 500 m, forming 208 columns and 390 rows. Hydraulic
conductivity is the most important factor for beach wells
and groundwater abstraction as they determine the capacity
of a pumping well. Parameter Estimation and Uncertainty
Analysis program (PEST) (Doherty 2005) was used to
calibrate hydraulic conductivities and rainfall recharge.
Groundwater flow calibration results show the north and
the north eastern parts of the aquifer have the highest
hydraulic conductivity values. Figures 5, 6, 7 show the
calibrated hydraulic conductivity of the three model layers
from top to bottom; respectively. The calibrated hydraulic
conductivity values reach more than 200 m per day in areas
north of Doha and in the central part of the northern half of
the peninsula. In the lower layers, maximum values of
hydraulic conductivities reach more than 60 m per day
(Baalousha 2016b). In general, coastal areas with high
hydraulic conductivities are those to the north of Doha City.
These coastal areas of high hydraulic conductivities will
be targeted for beach wells, as is explained in the following
section.
Sea water intrusion (SWI2) model
The Sea Water Intrusion package (SWI2) is a modelling
tool compatible with finite difference-based MODFLOW
code (Bakker et al. 2013). It simulates the movement of
fresh-saline groundwater interface, stratified flow and
variable density flow. The advantage of SWI2 over other
saline water intrusion models is its time efficiency,
especially for regional scale models (Dausman et al.
2010).
SWI2 Package requires initial saline-fresh groundwater
interface, which was identified based on the TDS survey
(shown in Fig. 3). Other parameters are the same as in the
flow model (Baalousha 2016b), which include the cali-
brated hydraulic conductivities and the calibrated rainfall
recharge. Beach wells were introduced into Modflow-
SWI2 model, which supports different types of wells
including, including horizontal, radial, vertical and slant
wells (Bartak et al. 2012; Cartier and Corsin 2007). The
most economic ones are the vertical wells, so they were
used. A group of vertical wells were placed in the north-
eastern coast of Qatar, as shown in Fig. 7. Wells’ maxi-
mum depths are 100 m below mean sea level, with screens
in the last 20 m. The model was run for 20 years, with
daily time steps.
Results and discussion
The variable density model was run first without pumping
to see the saline-fresh groundwater interface and levels
prior pumping. Figure 8 shows the regional groundwater
levels in the plan view, which vary between 0 near the
coast up to more than 14 m (above mean sea level) in the
centre of the northern part of the country. The locations of
the proposed beach wells are also shown on the map, with
two cross sections through the two selected locations.
Fig. 4 Saline-fresh
groundwater interface a before
pumping and b after saline
groundwater pumping
97 Page 6 of 12 Model. Earth Syst. Environ. (2016) 2:97
123

Before pumping, the interface between fresh and saline
groundwater is advanced inland and not affected by wells.
Figure 9 shows a cross section A–A, which cuts through
wells near Al-Khor town. The blue areas show the fresh
groundwater zone and the area underneath shows the saline
groundwater. Pumping wells appear in the right of the
section, with screens located in the saline groundwater
zone. The legend shows the fresh and saline groundwater
head, relative to mean sea level, which corresponds to
those in the plan view shown in Fig. 8.
After several iterations, and given the hydrogeological
settings of Qatar, it was found that the maximum pumping
rate possible is 4000 m3 per model cell per day, which is
equivalent to 1600 m3 per day per km2. The changes in
Fig. 5 Calibrated hydraulic
conductivity values (m/day) for
the top layer of the model
(Baalousha 2016b)
Model. Earth Syst. Environ. (2016) 2:97 Page 7 of 12 97
123

saline-groundwater interface are obvious after 20 years of
continuous pumping at a rate of 4000 m3/day for each well,
as shown in the lower picture of Fig. 9. The cone-shaped
interface is clear around the wells, which indicate the fresh
groundwater pushes the saline water downward as a result
of saline groundwater pumping (opposite effect of upcon-
ing phenomena).
Similar behavior has been found at cross section B–B, as
shown in Fig. 10. The interface has moved downward as a
result of saline water pumping, pushing more fresh water
down. In both cases, the maximum drawdown at well-head
was found to be 40 m after 20 years of pumping.
It should be noted that the number of wells and their
configuration can be changed as long as the maximum
Fig. 6 Calibrated hydraulic
conductivity values (m/day) for
the middle layer of the model
(Baalousha 2016b)
97 Page 8 of 12 Model. Earth Syst. Environ. (2016) 2:97
123

abstracted volume of 16,000 m3 per km2 is maintained. The
quantity of abstracted water can be significantly increased if
the depths of wells increased. A feasibility study might be
needed in this case to decidewhether to increase the depths or
not, and to compare the cost of drilling deeper than 100 m
with the cost of direct sea water intake.
Conclusions
This study explores the possibility and the yield of beach
wells for reverse osmosis desalination plants. The use of
sub-surface water as intake for desalination plants has a
great benefit as it reduces the environmental impact and
Fig. 7 Calibrated hydraulic
conductivity values (m/day) for
the bottom layer of the model
(Baalousha 2016b)
Model. Earth Syst. Environ. (2016) 2:97 Page 9 of 12 97
123

provides better water quality. Examples of beach wells in
many countries around the world show that no pre-treat-
ment is required for reverse osmosis plants. One factor that
may hinder the decision of using beach wells is their
capacity to provide enough quantities of water to feed the
plants.
A numerical variable density flow model has been
developed to test the effect of pumping saline ground-
water on both fresh and saline groundwater. The pro-
posed locations of beach wells were selected based on
hydrogeological settings and thickness of the aquifer,
and the possible effect on fresh water quality. To max-
imize wells yield, the proposed wells penetrate the thick
lower aquifer, namely Um er Radhuma Formation. As
drilling cost increases with depth, the proposed maxi-
mum depth is 100 m, with screens in the last 20 m of the
well.
Numerical modelling results show the wells at the pro-
posed location can supply 16,000 m3 per day per km2. Well
spacing in this study was 500 m, which corresponds to
model grid size. The spacing and configuration can be
changed but maintaining the same volume per km2. Model
results show the use of beach wells can counter the saline
water intrusion, which deteriorates the fresh groundwater
reserve in Qatar.
The best location for beach wells, given the hydro-
geology of Qatar, is near Al-Khor town and to the north
of it along the coastline. The well yields can significantly
increase if the depth is increased and/or if horizontal
wells are used, but this might increase the cost. The
series of beach well should be drilled within 100 m of
the coastline and it is recommended to use 10 in. well
screens or larger.
This capacity of 16,000 m3 per km2 might be useful
for a medium-size reverse osmosis plant, like the MED
plant currently operating in Dukhan Township, and they
can be used to artificially recharging the aquifer. In
addition to being more environmental friendly than the
direct sea water intake, beach wells can counter the
Fig. 8 Simulated groundwater head (meters above mean sea level),
location of beach wells and cross-sections
Fig. 9 Cross section A–A showing the saline-fresh groundwater interface, with groundwater levels in the background. The top section is before
pumping and the bottom one after 20 years of pumping
97 Page 10 of 12 Model. Earth Syst. Environ. (2016) 2:97
123

saline water intrusion, solve the problem of high water
table in coastal areas and enhance groundwater quality.
References
Al-Hajari S (1990) Geology of the tertiary and its influence on the
aquifer system of Qatar and Eastern Arabia. PhD Dissertation,
University Microfilms International
Al-Mohannadi HI, Hunt CO, Wood AP (2003) Controlling residential
water demand in Qatar: an assessment. Ambio 32:362–366
Alrashid A (2014) Water resource management challenges and water
security. Technical presentation. http://www.qstp.org.qa/docs/
default-document-library/water-resource-management-challenges-
water-security.pdf
Alsharhan S, Rizk ZA, Nairn AEM, Bakhit DW, Alhajari SA (1990)
Hydrogeology of an arid region: the Arabian Gulf and adjoining
areas, ch. 8, 1 edn. Elsevier, Amsterdam, pp 193–200
Anderson M, Woessner W, Hunt R (2015) Applied groundwater
modeling. Simulation of flow and advective transport, 2nd edn.
Elsevier, Amsterdam
Baalousha H (2006) Desalination status in the Gaza Strip and its
environmental impact. Desalination 196:1–12
Baalousha HM (2012a) Modelling surface–groundwater interaction in
the Ruataniwha basin, Hawke’s Bay, New Zealand. Environ
Earth Sci 66:285–294
Baalousha HM (2012b) Characterisation of groundwater–surface
water interaction using field measurements and numerical
modelling: a case study from the Ruataniwha basin, Hawke’s
Bay, New Zealand. Appl Water Sci 2:109–118
Baalousha HM (2015) Estimation of natural groundwater recharge in
Qatar using GIS. In: Weber T, McPhee MJ, Anderssen RS (eds)
MODSIM2015, 21st international congress on modelling and
simulation, pp 2026–2032
Baalousha HM (2016a) Using Monte Carlo simulation to estimate
natural groundwater recharge in Qatar. Model Earth Syst
Environ (in press)
Baalousha HM (2016b) Development of a groundwater flow model
for the highly parameterized Qatar aquifers. Model Earth Syst
Environ. doi:10.1007/s40808-016-0124-8
Bakker M, Schaars F, Hughes JD, Langevin CD, Dausman AM
(2013) Documentation of the seawater intrusion (SWI2) package
for MODFLOW, techniques and methods 6–A46. U.S. Depart-
ment of the Interior, U.S. Geological Survey, New York
Bartak R, Grischek T, Ghodeif K, Ray C (2012) Beach sand filtration
as pre-treatment for RO desalination. Int J Water Sci 1:1–10.
doi:10.5772/53034
Cartier G, Corsin P (2007) Description of different water intakes for
SWRO plants. IDA World Congress-Maspalomas, Gran Canaria
–Spain, pp 1–19, 21–26 Oct 2007
Chiang W-H (2005) 3D-groundwater modeling with PMWIN.
Springer, Integrated Environmental Services, Inc. U.S.A, New
York
Darwish M, Hassabou A, Shomar B (2013) Using seawater reverse
osmosis (SWRO) desalting system for less environmental
impacts in Qatar. Desalination 309:113–124
Dausman AM, Langevin C, Bakker M, Schaars F (2010) A
comparison between SWI and SEAWAT: the importance of
dispersion, inversion and vertical anisotropy. SWIM21—21st
Salt Water Intrusion Meeting, Azores, Portugal
David B, Pinot J-P, Morrillon M (2009) Beach wells for large-scale
reverse osmosis plants: the Sur case study. In: IDA world
congress: Atlantis, The Palm—Dubai, UAE, REF: IDAWC/
DB09-106, 7–12 Nov 2009
DHV Water BV, BRL Ingenierie (2004) Seawater and brackish water
desalination in the Middle East, North Africa and Central Asia a
review of key issues and experience in six countries, final report
For the World Bank with funding from the Bank-Netherlands
Water partnership
Doherty J (2005) PEST model-independent parameter estimation user
manual. 5th edition, Watermark Numerical Computing
Eccleston BL, Pike JG, Harhash I (1981) The water resources in Qatar
and their development. Food and Agricultural Organization of
the United Nations
Gille D (2003) Seawater intakes for desalination plants. Desalination
156(2003):249–256
Harbaugh AW, Banta ER, Hill MC, McDonald MG (2000) MOD-
FLOW-2000, The U.S. Geological survey modular ground-water
model—user guide to modularization concepts and the ground-
water flow process: U.S. Geological Survey, Open-file report
00-92, p 121
Kimrey J (1985) Proposed artificial recharge studies in northern
Qatar. United States Department of the Interior Geological
Survey. Open file report 85–343
Macumber PG (2011) A geomorphological and hydrological
underpinning for archaeological research in northern Qatar.
In: Proceedings of the seminar for Arabian studies, Vol. 41,
Papers from the 44th meeting of the seminar for Arabian
Studies held at the British Museum, London, pp 187–200,
22–24 July 2010
Fig. 10 Cross section B–B showing the saline-fresh groundwater interface, with groundwater levels in the background. The top section is before
pumping and the bottom one after 20 years of pumping
Model. Earth Syst. Environ. (2016) 2:97 Page 11 of 12 97
123

Munoz I, Fernandez-Alba AR (2008) Reducing the environmental
impacts of reverse osmosis desalination by using brackish
groundwater resources. Water Res 42:801–811
Parka KS, Mitraa SS, Yima WK, Lima SW (2013) Algal bloom—
critical to designing SWRO pretreatment and pretreatment as
built in Shuwaikh, Kuwait SWRO by Doosan. Desalin Water
Treat 51:31–33. doi:10.1080/19443994.2013.780992
Qatar General Secretariat for Development Planning (2011) Qatar
national development strategy 2011–2016 towards Qatar
National Vision 2030
Schlumberger Water Services (2009) Studying and developing the
natural and artificial recharge of the groundwater in aquifer in
the State of Qatar. Project final report
Schmork S, Mercado A (1968) Upconing of fresh water—sea water
interface below pumping wells, field study. Water Resour Res.
doi:10.1029/WR005i006p01290
Stuyfzand PJ, Raat KJ (2010) Benefits and hurdles of using brackish
groundwater as a drinking water source in the Netherlands.
Hydrogeol J 18:117–130
Vecchioli J (1976) Preliminary evaluation of the feasibility of
artificial recharge in northern Qatar. Prepared in cooperation
with the U.S. Agency for International Development, Open-file
report June
Verrjuit A (1968) A note on the Ghyben-Herzberg formula, bulletin
of the international association of scientific hydrology, 13th edn.
Technological University, Delft, Netherlands, pp 43–46
WateReuse Association Desalination Committee (2011) Overview of
desalination plant intake alternatives: white paper. https://www.
watereuse.org/wp-content/uploads/2015/10/Intake_White_Paper.
97 Page 12 of 12 Model. Earth Syst. Environ. (2016) 2:97
123


