The potential for cycle helmets to prevent injury – a ... · The report explored a number of...
122
Published Project Report PPR446 The potential for cycle helmets to prevent injury – a review of the evidence D Hynd, R Cuerden, S Reid and S Adams
Transcript of The potential for cycle helmets to prevent injury – a ... · The report explored a number of...

Published Project Report PPR446
The potential for cycle helmets to prevent injury – a review of the evidence
D Hynd, R Cuerden, S Reid and S Adams


Transport Research Laboratory
PUBLISHED PROJECT REPORT PPR 446
The potential for cycle helmets to prevent injury A review of the evidence
by D Hynd and R Cuerden (TRL), S Reid and S Adams (MVA)
Prepared for: Project Record: PPRO4/001/044
Road User Safety and Cycling
Client: Department for Transport, Road Safety Research and Statistics Division
(Louise Taylor)
Copyright Transport Research Laboratory November 2009
This Published Report has been prepared for Department for Transport. Published Project Reports are written primarily for the Client rather than for a general audience and are published with the Client’s approval.
The views expressed are those of the authors and not necessarily those of the Department for Transport.
Name Date
Approved
Project Manager
Maria McGrath 13/11/2009
Technical Referee
Tracy Savill and Richard Cuerden
13/11/2009

Published Project Report
TRL PPR446
When purchased in hard copy, this publication is printed on paper that is FSC (Forestry Stewardship Council) and TCF (Totally Chlorine Free) registered.

Published Project Report
TRL iii PPR446
Contents
Executive summary v
Summary of conclusions viii
1 Introduction 1
1.1 Report Structure 1
2 Data Sources 3
2.1 Literature Selection Process 3
2.2 In-depth Accident Data Sources 3 2.2.1 Hospital data 3 2.2.2 Police Fatal Files 3
3 Cycle Helmet Function and Design – What are they designed to do? 5
3.1 Head Injury 5 3.1.1 Head Injury Risk 5
3.2 Principals of Cycle Helmet Design 5
3.3 Cycle Helmet Regulations 6
3.4 Cycle Helmet Performance Standards 6
3.5 Cycle Helmet Development – Comparing Standards 7
3.6 Summary of Cycle Helmet Function and Design 8
4 Factors Affecting the Potential Effectiveness of Cycle Helmets – A Biomechanical Review 9
4.1 Comparison of Helmeted and Un-helmeted Head Impacts 9 4.1.1 Helmeted and Un-helmeted Head Impact Kinematics 11 4.1.2 Helmeted and Un-helmeted Head Impact risk 11
4.2 Are Cycle Helmets Effective for all Riders? 11
4.3 Helmets for Younger Children 14
4.4 Rotational Acceleration 14
4.5 Material Properties of Cycle Helmet Liners and the Outer Shell 16
5 A Literature Review of Cycle Helmet Effectiveness 17
5.1 Hospital Admissions Studies 17 5.1.1 Overview of the Findings 21
5.2 Population-based Studies 22 5.2.1 Overview of the Findings 24
5.3 Confounding Factors When Measuring Cycle Helmet Effectiveness 25
5.4 Comparing the findings from Hospital Admission and Population Studies 27
6 The Extent and Nature of Cyclist Head Injuries: The Real World Potential Effectiveness of Cycle Helmets 29
6.1 HES Database (1999 to 2005) 29 6.1.1 HES Casualties Head Injuries 30
6.2 Fatal Casualties Database (2001 to 2006) 34

Published Project Report
TRL iv PPR446
6.2.1 Fatal Casualties’ Head Injuries 35
6.3 Summary of Findings 38
7 Conclusions 39
References 41
Appendix A Comparison of Stats19 and HES Cyclist Casualty Data 47
Appendix B Literature Review Method 51
Appendix C Cycle Helmet Standards 57
Appendix D Head Anatomy and Injury 73
Appendix E Translational and Rotational Acceleration 81
Appendix F In-depth Review of Population and Hospital Studies 83
Appendix G International Statistical Classification of Disease 103
Appendix H Review of Cycle Accidents in Police Fatal Files 105
Published Project Report
TRL v PPR446
Executive summary Introduction
In 2008, 115 pedal cyclists were killed and 2,450 reported as seriously injured on Britain’s roads, accounting for 9% of all killed or seriously injured (KSI) road casualties (Department for Transport, 2009). Approximately 40% of pedal cyclists admitted to hospital in England suffer head injuries. Cycle helmets are designed to reduce head injuries by absorbing the energy during a head impact and distributing the load. This is intended to reduce the risk of scalp laceration, cranium fracture, and severe brain injury.
Cycle helmet wearing rates have increased steadily since 1994 for most cyclist groups and in 2008 they were 34% on major roads and 17% on minor roads, up from 22% on major roads and from 8% on minor roads in 1999.
This research report was commissioned to provide a comprehensive review of the effectiveness of cycle helmets in the event of an on-road accident, building on previous work undertaken for the Department for Transport (Towner et al., 2002). The objectives were to evaluate the effectiveness of cycle helmets from several perspectives:
• review of cycle helmet testing and Standards (including nature and severity of head injuries that cycle helmets are designed to protect against; predicted benefit in those types of test conditions);
• a biomechanical assessment of the potential limitations to helmet effectiveness;
• a literature review of helmet effectiveness from real-world studies; and
• an in-depth accident data investigation to identify the potential for cycle helmets to prevent injury.
This report focuses on understanding whether cycle helmets reduce the frequency and severity of injury in the event of a collision. It does not include detailed consideration of whether wearing (or not wearing) a helmet influences the likelihood of being involved in an accident, either through behaviour in the rider or in other road users.
Cycle Helmet Testing
In most jurisdictions, cycle helmets are tested to ensure a minimum level of performance for a range of criteria that affect safety. Typically these include:
• construction requirements;
• impact test requirements;
• retention system (strap) strength and helmet stability;
• definition of the minimum area of the head covered by the helmet; and
• definition of a minimum field of view (to ensure that the helmet does not impede the vision of the wearer).
Most cycle helmet standards around the world define similar types of impact test but the impact severity, pass/fail criteria and number of tests per helmet vary in different standards. This means that helmets certified to one standard may not pass the requirements of another. In addition, cycle helmet standards have changed over time and so current helmets in the UK may be quite different to those sold in other regions or in previous decades. The results of real-world cycle helmet effectiveness studies must be considered in the context of these regional and temporal differences in cycle helmet standards.
It was found that cycle helmets designed to the Standards currently used in the UK (EN 1078 for child and adult helmets and EN 1080 for younger child helmets) would, based on biomechanical principals, be expected to be effective in many cycle accident conditions. This effectiveness would depend on a range of factors, such as the type of accident (e.g. a fall from a cycle or a collision with another vehicle), the stature and

Published Project Report
TRL vi PPR446
injury tolerance of the rider, and the shape and stiffness of the object struck by the head (e.g. a flat road surface, a kerb, or a deformable car bonnet).
Potential limitations to effectiveness
The report explored a number of claims that cycle helmets may make a head injury worse than if no helmet had been worn. The report finds that a helmeted head can fall at least four times as far for the same risk of injury as an un-helmeted head, within the range to which cycle helmets are tested.
There have also been concerns expressed in the literature that cycle helmets may not be effective at reducing injuries due to rotation of the head, or even that they may make such injuries worse. There are no cycle helmet standard tests for performance in rotational loading conditions. Nevertheless, no evidence was found for an increased risk of rotational head injury with a helmet compared to without a helmet.
Literature Review of Cycle Helmet Effectiveness
This report considered in detail the published literature on the effectiveness of cycle helmets, updating the previous review reported by Towner et al. (2002). Most of the published research into helmet effectiveness attempts to determine whether the protective effect of helmets is sufficient to affect casualty outcomes in real accidents. There are two primary forms of study into cycle helmet effectiveness:
• hospital admissions studies; and
• population studies.
The majority of hospital admissions studies use a case-control design. This design matches helmeted cyclists with un-helmeted cyclists and attempts to discern different injury outcomes from the data that are attributable to the helmet. Population-based studies typically consider aggregate national statistics on cycle accidents and tend to be longitudinal. They compare the trend in cyclist head injuries with the expected trend were helmets to offer a protective effect.
The accurate assessment of the effectiveness of cycle helmets requires detailed and comparable data. Many of the studies reported in the literature suffered from some shortcomings in the data, examples included:
• no data being available on the accident characteristics leading to the head injury (e.g. the speed of an impacting vehicle and the first point of contact with the cyclist);
• a lack of detailed data on the type of head injury (was it an injury a helmet could have prevented?); and
• the level of data reported in most of the studies reviewed being aggregated to a point where it was not possible to reinterpret it to answer criticisms of study design or analysis from the published papers.
Overall, there appears to be a clear difference between hospital-based studies, which tend to show a significant protective effect from cycle helmets, and population studies, which tend to show a lower, or no, effect. This is likely to be due to the difficulties in adequately controlling for confounding variables, as well as limitations regarding how representative the cyclists are in the samples used compared with the whole cycling population.
Furthermore, cycle helmet designs have changed over time and it is difficult to interpret effectiveness measures from other regions in terms of cycle helmets currently on sale in the UK. As a result, it was not possible to quantify the amount of benefit offered by modern cycle helmets in the UK from the literature review alone.

Published Project Report
TRL vii PPR446
Evidence from In-depth Accident Studies
In-depth accident data were used to investigate the extent and nature of the head injuries sustained by pedal cyclists, which were then correlated as far as practical with the accident circumstances. In conjunction with consideration of the biomechanics of head injury and the mechanics of helmeted head impacts, this information was used to predict the potential effectiveness of cycle helmets at mitigating or preventing a proportion of the more severe types of head injury, i.e. cranium fractures and/or intracranial injury.
The accident databases used were:
• the Hospital Episode Statistics (HES) database for England (1999 to 2005); and
• police fatal file derived pedal cyclist database (2001 to 2006).
The HES dataset contains detailed information regarding the injuries sustained but only cursory information with respect to the nature of the accident. Whereas the police fatal files provided full reconstruction evidence and allowed in most cases the cause of the head injury to be evaluated by expert assessment. Thus, an expert judgement could be made for each fatal case as to the likely potential effect a cycle helmet would have had, if worn. Therefore, the methods used and the subsequent confidence attributed to the predictions of the potential effectiveness of cycle helmets for fatalities (fatal file) and seriously injured casualties (HES database) vary.
For the HES data it was not possible to state categorically the proportion of casualties which would have been prevented if all had worn cycle helmets, rather a target population was identified, or the proportion of casualties for whom a cycle helmet could have been beneficial.
An in-depth review of the head injuries suffered by cyclists who were admitted to hospital in England identified that 10% sustained serious cranium fracture and/ or intracranial injuries. The majority of this group (7% of the total) only sustained these injuries and had no other head or other body region trauma. Therefore, if cycle helmets had been worn, a proportion of this 7% may not have required hospital treatment at all.
A further 20% of the HES casualties suffered ‘open wounds to the head’. However, no further details regarding the location of the injury were known and therefore it was not possible to quantify how many of these may have been mitigated or prevented if a helmet had been worn.
A forensic case by case review of over 100 British police cyclist fatality reports highlighted that between 10 and 16% of the fatalities reviewed could have been prevented if they had worn a cycle helmet. This predictive analysis was undertaken by biomechanical and vehicle safety experts who excluded cases where:
• the cause of death was not associated with head injury; and
• where the causes of the head injuries were in excess of the potential benefit a helmet could have afforded.
There are limitations associated with the predictive approaches undertaken by this type of study, so conservative estimates of helmet effectiveness were assumed for different accident scenarios (10% to 50%). Further, the police fatal files reviewed were biased towards London and therefore the percentage benefit is only indicative of a national estimate. It is likely to be a conservative estimate because of the higher proportion of accidents involving large goods vehicles and crush related injuries in London compared to the national situation and fewer single vehicle accidents.
However, the sample contained a wide range of fatalities with respect to age, gender and accident typology.

Published Project Report
TRL viii PPR446
Summary of conclusions
Assuming that they are a good fit and worn correctly, cycle helmets should be effective at reducing the risk of head injury, in particular cranium fracture, scalp injury and intracranial (brain) injury.
• Cycle helmets would be expected to be effective in a range of accident conditions, particularly:
o the most common accidents that do not involve a collision with another vehicle, often simple falls or tumbles over the handlebars; and also
o when the mechanism of injury involves another vehicle glancing the cyclist or tipping them over causing their head to strike the ground.
• A specialist biomechanical assessment of over 100 police forensic cyclist fatality reports, predicted that between 10 and 16% of the fatalities could have been prevented if they had worn an appropriate cycle helmet.
• Of the on-road serious cyclist casualties admitted to hospital in England (HES database):
o 10% suffered injuries of a type and to a part of the head that a cycle helmet may have mitigated or prevented; and a further
o 20% suffered ‘open wounds to the head’, some of which are likely to have been to a part of the head that a cycle helmet may have mitigated or prevented.
• Cycle helmets would be expected to be particularly effective for children, because:
o the European Standard (EN 1078) impact tests and requirements are the same for adult and child cycle helmets, both use a 1.5 m drop height test; and so
o given that younger children are shorter than older children and adults, their head height would be within the drop height used in impact tests so a greater proportion of single-vehicle accidents are likely to be covered by the Standard for children.
• No evidence was found for an increased risk of rotational head injury with a helmet compared to without a helmet.
• In the literature reviewed, there is a difference between hospital-based studies, which tend to show a significant protective effect from cycle helmets, and population studies, which tend to show a lower, or no, effect. Some of the reasons behind this were due to:
o the lack of appropriateness of the control groups used; and
o limitations in the available data, such as knowledge of helmet use and type of head injury.

Published Project Report
TRL 1 PPR446
1 Introduction In 2008, 115 pedal cyclists were killed and 2,450 reported as seriously injured on Britain’s roads, accounting for 9% of all killed or seriously injured (KSI) road casualties (Department for Transport, 2009). Approximately 40% of pedal cyclists admitted to hospital in England suffer head injuries. Cycle helmets are designed to reduce head injuries by absorbing the energy during a head impact and distributing the load. This is intended to reduce the risk of scalp laceration, cranium fracture, and severe brain injury.
There has been much debate in the literature and elsewhere regarding cycle helmets since the last review of cycle helmet effectiveness that was commissioned by the Department for Transport (Towner et al., 2002). Cycle helmets were therefore chosen for a specific, in-depth review to evaluate options for improving the safety of cyclists.
This report provides a comprehensive review of the effectiveness of cycle helmets in the event of an on-road accident. The objectives were to evaluate the effectiveness of cycle helmets from several perspectives:
• Cycle helmet testing (nature and severity of head injuries that cycle helmets are designed to protect against; predicted benefit in those types of test conditions).
• Potential limitations to effectiveness.
• Effectiveness from real-world studies.
• New analysis based on in-depth accident data to investigate the potential for cycle helmet wearing to prevent injury
This report focuses on understanding whether cycle helmets reduce the frequency and severity of injury in the event of a collision. It does not include detailed consideration of whether wearing (or not wearing) a helmet influences the likelihood of being involved in an accident, either through behaviour changes in the rider or in other road users.
1.1 Report Structure
The report starts with a short summary of the approach taken to select the literature for review and briefly outlines the sources of the accident data used (Chapter 2).
The main body of the report is then organised into four sections. Firstly, Chapter 3 (Cycle Helmet Function and Design) provides background on the current regulations and standards.
Chapter 4 (Factors Affecting the Potential Effectiveness of Cycle Helmets) reviews the literature and presents the biomechanical reasoning behind the factors which can affect the injurious protection offered by a cycle helmet.
Chapter 5 (A Literature Review of Cycle Helmet Effectiveness) reviews the pertinent literature on the effectiveness of cycle helmets in the event of an accident
Chapter 6 (The Extent and Nature of Cyclists Head Injuries: The Real World Potential Effectiveness of Cycle Helmets) outlines the nature and extent of the head injuries sustained through a review of police forensic fatal accident reports and Hospital Episode Statistics (HES) for England. This analysis provides estimates for the number of fatalities that could have been prevented if cycle helmets had been worn; and begins to describe the serious casualty target population, or those who may have not been so badly injured, or uninjured if they had worn a cycle helmet.
Finally, the overall conclusions arising from this review are given in Chapter 7.


Published Project Report
TRL 3 PPR446
2 Data Sources
2.1 Literature Selection Process
Literature was identified by searches of the International Transport Research Database (ITRD), Transport Research Information Services (TRIS), Science Direct, and MedLine, as well as web searches. Papers identified by the searches were graded according to criteria of relevance, timeliness and quality, more detail is given in Appendix B (includes complete list of search terms).
2.2 In-depth Accident Data Sources
2.2.1 Hospital data
Pedal cyclist injury data was sourced from the Hospital Episode Statistics (HES) database for England (1999 to 2005). This database contains information about on-road and off-road casualties, but only the on-road were selected for further analysis. However, a limitation of the HES data is that if the location of the accident is not recorded in the patients’ records, it is assumed to be a traffic accident (on-road) (Noble et al., 2007). The HES data provided a rich source of information on the medical outcome of more serious road collisions. They cover patients admitted to hospital and so exclude attendance at A & E or visits to a GP, but do include collisions not reported to the police. This data source contains very detailed coverage of medical diagnoses using the International Classification of Diseases codes (ICD codes, see Appendix G). However they contain few details of the collision, only differentiating by collision partner (e.g. car or single-vehicle etc.).
2.2.2 Police Fatal Files
Forensic police investigation reports on fatal collisions provide detailed information on the events leading up to a collision. These reports are comprehensive, including witness statements, reports by collision investigators and vehicle examination specialists, sketch plans showing pre-impact trajectories and post-impact positions of vehicles and photographs.
The DfT’s archive of police fatal files was used and a total of 113 accidents between 2001 and 2006 were reviewed (see Appendix H for more information). There were 810 cyclist fatalities between 2001 and 2006 in Great Britain.

Published Project Report
TRL 5 PPR446
3 Cycle Helmet Function and Design – What are they designed to do?
This section provides an overview of cycle helmet function and outlines the types of injuries they are designed to prevent and the associated mechanics of injury prevention.
3.1 Head Injury
The head is a complex collection of bones and soft tissues. Head injury may refer to injuries to any of these tissues, and multiple head injuries may occur in a single accident. Appendix D.1 gives an overview of the key anatomy of the head, focussing on those areas that are most relevant to a discussion of the effectiveness of cycle helmets: the cranial vault (or calvaria, which surrounds the brain) and the brain itself. These are the most relevant areas because injuries to these regions are more likely to have serious, long-term consequences and they are the regions that cycle helmets cover (at least in part) and for which helmets are intended to provide some protection.
Head injury types and head injury mechanisms are discussed in Appendix D. The main types of injury that are relevant to accidents with impacts to the head when wearing cycle helmets are:
• Cranium fracture
• Focal Brain Injuries
• Diffuse Brain injuries
3.1.1 Head Injury Risk
Injury risk functions have been proposed in the biomechanics literature that relate the loading applied to the head with the risk of a particular type of injury. Many car crash and other test standards place a limit on the peak acceleration that moves the head without rotating it (i.e. translational acceleration– see Appendix E). Diffuse brain injuries are particularly associated with impacts that cause the head to rotate, although there is considerable discussion regarding the tolerance of humans to rotational acceleration and a wide range of injury thresholds have been proposed, mostly based on scaling the results of tests with animals (see Appendix D).
A comprehensive review of brain injury based on clinical findings, animal experiments and numerical modelling was presented by Melvin et al. (1993). The information presented indicates that diffuse injuries, such as concussion and Diffuse Axonial Injury (DAI), are very important in terms of the outcome for head injury survivors, but that haematomas, contusions and disruption of the membranes surrounding the cerebral spinal fluid are associated with a high mortality. This may be due to compression of the brain or disruption to the oxygen supply. The implication is that focal injuries may be important for determining survival, and diffuse injury for determining the outcome for survivors.
However, brain injury mechanisms and tolerance are still subject to a good deal of discussion and uncertainty. In particular, safe limits for rotational acceleration are not well defined.
3.2 Principals of Cycle Helmet Design
Generally, protective helmets consist of a shell and an energy absorbing layer. Motorcycle helmets typically have a relatively hard shell, for example made of glass-reinforced plastic, thermoplastic or even carbon-kevlar composite. Modern cycle helmets typically have a micro-shell, usually between 0.3 and 0.8 mm thick, that is often bonded to the liner material during the manufacturing process. The micro-shell liner provides

Published Project Report
TRL 6 PPR446
little rigidity or load distribution, but may help to maintain helmet integrity in an impact, which may be particularly important if a second impact occurs in the same accident.
A hard shell is likely to distribute loading better in a very localised loading condition, and would be expected to be better than a micro-shell in protecting against penetration of sharp objects. In both hard-shell and micro-shell helmets, the liner will absorb a proportion of the impact energy and will distribute the impact loading over a wider area of the head (particularly in impacts with a relatively flat surface). Both of these features will reduce the risk of cranium fracture (through reducing the localised strain on the cranium) and the risk of skull fracture and brain injury (through reducing translational acceleration of the head). The proportion of impact energy absorbed will depend on the design of the helmet, the impact tests that the helmet has been designed to meet and the type of surface impacted (see Appendix D).
In the process of absorbing a proportion of the energy of an impact, the structure of the helmet is usually damaged. This is an important characteristic of helmets: if the liner material was elastic the impact energy that was initially absorbed would be returned to the head later in the impact, thereby greatly reducing the effectiveness of the padding. Liner materials are therefore primarily plastic in their deformation characteristics.
Helmet fit and retention are also important (see, for example, Henderson, 1995), as an improperly fitting helmet may not provide the designed impact absorption, and a helmet that is dislodged in an impact is unlikely to provide any protection at all. In addition to these considerations, ventilation and aesthetics are considered important to the comfort and user acceptability of helmets, and much cycle helmet marketing focuses on the amount of ventilation provided. Furthermore, cycle helmets for use on the roadway are usually designed to ensure that the vision and hearing of the rider are not compromised.
3.3 Cycle Helmet Regulations
All cycle helmets sold in the UK must conform to Council Directive 89/686/EEC relating to Personal Protective Equipment (as amended by 93/68/EEC, 93/95/EEC and 96/58/EEC). Directive 89/686/EEC is enacted in the UK under the following Statutory Instruments:
1. The Personal Protective Equipment (EC Directive) Regulations 1992, Statutory Instruments number 3139 of 1992.
2. The Personal Protective Equipment (EC Directive) (Amendment) Regulations 1994, Statutory Instruments number 2326 of 1994.
Effectively, these require all cycle helmets for personal use to be sold in the UK (and Europe) to comply with a suitable standard, and this is typically demonstrated by meeting European Standard EN 1078:1997 (helmets for older children and adults) or EN 1080:1997 (helmets for younger children). Annex ZA of EN 1078:1997 lists the clauses of the EN standard that are ‘likely to support requirements of Directive 89/686/EEC, annex 11’. However, Annex ZA also notes that ‘other requirements and other EU Directives may be applicable to the product(s) falling within the scope of this standard’.
For cycle helmet regulations in other regions please see Appendix C.
3.4 Cycle Helmet Performance Standards
In most countries, cycle helmets are tested to ensure a minimum level of performance of the helmet for a range of criteria that affect safety. Typically these include:
• Construction requirements (e.g. to ensure that the materials used do not affect the skin of the wearer, and that sweat and hair and skin products do not affect the materials of the helmet)

Published Project Report
TRL 7 PPR446
• Impact requirements (e.g. to ensure a minimum level of energy absorption at multiple points on the helmet, often in a range of environmental conditions)
• Retention system requirements (e.g. the strength of the straps and the stability of the helmet on the head)
• Coverage (to ensure that a certain area of the head is covered by the helmet)
• Vision (to ensure that the helmet does not unnecessarily impede the vision of the wearer)
A historical review of protective helmet standards and the reasons for their development may be found in Becker (1998). The first cycle helmet standards were British Standard 4544:1970 in 1970 and a 1972 Annex to the 1970 Snell general helmet standard that was specifically for cycle helmets. Since then, many standards have been developed by different organisations around the world, and many of the standards have been revised periodically. Some earlier standards encouraged the development of hard-shell cycle helmets, but more recent standards can be met with micro-shell, soft-shell or even no-shell helmets. This means that a general understanding of the principles of cycle helmet standards and how they have changed in different countries and at different times is important for interpreting real-world helmet effectiveness studies.
Appendix C summarises the key points of the major cycle helmet standards from around the world. The cycle helmet standards reviewed here are similar in aim and content. They all test the performance of the helmets in specific tests such as impact performance (generally against several impact surface shapes and with a range of environmental conditioning), retention strap strength, helmet stability and helmet coverage. Most also define materials and construction in generic terms (for instance, materials should not react with or be harmed by exposure to sweat or hair products). These requirements are comprehensive; the main omission is a test for rotational performance in an oblique impact.
3.5 Cycle Helmet Development – Comparing Standards
Most cycle helmet standards note that helmets are designed to protect the head, but that they cannot mitigate against injury in all circumstances. For instance, EN 1078:1997 notes that: ‘The protection given by a helmet depends on the circumstances of the accident and wearing a helmet cannot always prevent death or long term disability’. The EN standard also includes requirements on the manufacturer to provide clear information with every helmet that the helmet can only protect if it fits well, is correctly positioned and the straps correctly adjusted.
The differences between standards make it difficult to be confident that cycle helmet effectiveness studies from different regions will be comparable. In addition, standards have changed over time and the construction of helmets that they encourage has therefore changed. It was intended that this review would consider the changes in standards over time, but it was not possible to review the changes in depth. The Snell Memorial Foundation have an archive of their superseded standards on their web site, but most other superseded standards are not easily available or have only the most recent superseded versions available.
However, some information was available on changes in helmet standards in the UK over time, and the standards to which cycle helmets on sale in the UK were certified. Mills and Gillchrist (2008) reported that, when British Standard BS6863 was replaced by EN 1078 in 1997, the impact test drop height increased from 1.0 to 1.5 m. A drop height of 1.0 m would be entirely inadequate for the protection of adults (see the discussion in Section 4.2) and also for older children in many head impact scenarios. This indicates a likely improvement in cycle helmet performance in the late 1990s.

Published Project Report
TRL 8 PPR446
The range of standards met by cycle helmets on sale in the UK has changed considerably over time: in 1991 at least five standards were promoted in the UK and many helmets were certified to more than one standard, whereas today all cycle helmets are certified to EN 1078 (or EN 1080 for younger child helmets) and very few carry any additional certification.
Clearly, the effectiveness of cycle helmets will be closely tied to changes in the standards that encourage improvements in cycle helmet performance. Changes will affect not only impact attenuation, but also the likelihood of the helmet being worn correctly and staying in position on the head during a crash due to the way the retention straps are configured and tested.
All of these factors will affect the likely effectiveness of cycle helmets, and make it difficult to compare the results of cycle helmet effectiveness studies in different regions and at different times.
3.6 Summary of Cycle Helmet Function and Design
• Cycle helmets standards encourage helmets that distribute impact forces and reduce linear accelerations to the parts of the head covered by the helmet. They also define the minimum field of view that must be present when the helmet is worn; and the efficacy of the straps that hold the helmet on the head in the event of an accident.
• Cycle helmets sold in the UK conform to the EN 1078 (for children and adult helmets) or EN 1080 standards (for younger child helmets).
• Helmet retention and stability tests are very similar in most standards.
• Cycle helmet impact tests vary in type, severity and pass-fail threshold. All standards measure the same parameter (linear head acceleration), although some standards have additional requirements. The EN 1078 standard has the least severe impact severity, but one of the strictest requirements; this combination may not ensure good performance in very severe impacts.
• Cycle helmet coverage is variable in different standards. EN 1078 provides typical coverage at the front and poor coverage at the rear compared with other standards.

Published Project Report
TRL 9 PPR446
4 Factors Affecting the Potential Effectiveness of Cycle Helmets – A Biomechanical Review
Assuming that they are a good fit and are worn correctly, cycle helmets should be effective at reducing the risk of cranium fracture, scalp injury and focal (localised) brain injuries due to translational acceleration. This chapter presents the biomechanical reasoning behind the factors which can affect the injurious protection offered by a cycle helmet.
4.1 Comparison of Helmeted and Un-helmeted Head Impacts
Some commentators have questioned the lack of un-helmeted test data in the literature. The primary reason that such tests are not conducted is that the equipment would be broken if the impact forces were not attenuated by a helmet or some other form of padding. This can be illustrated by consideration of head accelerations from Post Mortem Human Subject (PMHS) tests. The certification requirements for the Hybrid III front impact dummy head were derived from PMHS tests at a range of severities from no fracture to fracture (Mertz, 1985). The certification test uses a head drop of 376 mm onto a flat, rigid steel surface (similar to the flat anvil in cycle helmet performance standards) and requires a head translational acceleration of 250±25 g. Very approximately; this represents the transition between fracture and non-fracture for head impacts with a rigid surface. The same headform acceleration is used as the upper limit for a drop height of 1,500 mm in the European cycle helmet standard EN 1078. This greater drop height tolerance with a helmet is illustrated in Figure 4.1.
It should be noted that the risk of fracture is lower in the padded impact (i.e. with a cycle helmet) than in a rigid impact with the same head acceleration, as the impact force is distributed over a larger area, which will reduce the peak stresses in the bone. In addition, cycle helmets may perform better than the minimum performance required by the standard, which would allow a greater drop height before the peak head acceleration reached 205 g. This is demonstrated in Figure 4.2, which is reproduced from StClair and Chinn (2007). The yellow band shows the very wide range of linear impact performance between the best and worst performing helmets from a small sample of just eight cycle helmet models.
0
200
400
600
800
1000
1200
1400
1600
Unhelmeted head EN 1078 minimum performance for head with
cycle helmet
Drop Height (mm)
Drop height for 250 g head acceleration
Four times higher with a cycle helmet
Figure 4.1: Comparison of drop test helmeted and un-helmeted head impacts

Published Project Report
TRL 10 PPR446
The head injury is classified using an Abbreviated Injury Score (AIS), where any injury over 3 (six point scale) is serious or life threatening. It is also worth noting that a cycle helmet will absorb a proportion of the impact energy, and distribute the impact forces, even in impacts that exceed the test severity in the standard to which the helmet is certified. This will always be beneficial unless the impact severity is sufficiently high that a fatal injury is caused despite the energy absorption; in these cases, fatal injury would also result without energy absorption from a cycle helmet.
0
1
2
3
4
5
6
0.0 1.0 2.0 3.0 4.0 5.0 6.0Velocity [m/s]
AIS
0
50
100
150
200
250
300
Peak
line
ar a
ccel
erat
ion
[g]
Worst helmet impact performanceBest helmet performanceUnhelmeted headWorst helmet impact performance in AISBest helmet impact performance in AIS
Linear skull fracture of unhelmeted head AIS 2 @ 2.2m/s
Compound skull fracture of unhelmeted head AIS 4 @ 3.2m/s
Figure 4.2: Linear acceleration versus impact velocity (based on size 54 helmet performance) (StClair and Chinn, 2007)
Similar results have been found from impactor tests. McIntosh et al. (1993) found that peak resultant head translational acceleration was approximately 115 g in a lateral impact with 25 mm of padding on the impactor and 308 g in a different PMHS tested with a rigid impactor surface. This corresponded to impactor forces of 6.87 and 9.14 kN respectively. Neither PMHS received a skull fracture from the test. Also of interest were the rotational accelerations (3,360 and 6,035 krad.s-2 about the x-axis, and 2,312 and 11,441 krad.s-2 about the z-axis with and without padding) and neck forces (3720 and 8124 N, and -127 and -461 Nm with and without padding). Although these results are from only two PMHS, they are indicative of the effect of padding on impact response. That head translational acceleration, impact force and rotational acceleration were all considerably reduced, at least for this impact configuration.
Only a few studies were found that permitted a direct comparison between helmeted and un-helmeted head impacts, or between padded and unpadded head impacts. The evidence available strongly indicates that head translational acceleration is considerably reduced by the presence of a helmet. An alternative way to think of this is that with a helmet a much higher drop height can be tolerated for a given risk of head injury than without a helmet. The limited evidence from McIntosh et al. also indicates that head impact forces and rotational acceleration would also be reduced through the use of a cycle helmet. Rotational acceleration is investigated further in Section 4.4.

Published Project Report
TRL 11 PPR446
4.1.1 Helmeted and Un-helmeted Head Impact Kinematics
It has been noted that in the event of a head impact with the ground, the head may bounce and suffer a secondary impact. This is true, both for helmeted and un-helmeted head impacts. However, any secondary impact to the same part of the head or helmet is highly likely to be trivial compared with the initial impact as any rebound distance is limited by the attachment of the head to the body via the neck. If the impact is to a site of helmet coverage, the helmet may or may not have any energy absorbing capacity remaining after the initial impact. In the worst case, where no energy absorbing capacity remains, the secondary impact due to bounce will be equivalent to the un-helmeted head, albeit both will be relatively trivial.
Furthermore, each cycle helmet is tested more than once in most standards. For example, EN 1078 in Europe has one kerb anvil impact, followed by one flat anvil impact, with the two sites separated by not less than 150 mm along the surface of the helmet. This means that the helmet would be expected to perform to standard in an accident that involved two separate impacts, provided that the impacts are not to the same part of the helmet. For example, a cyclist may have a first head impact with the ground, followed by sliding into a secondary impact with a kerb. In the worst case, where all of the energy absorbing capacity of the helmet is used up in the first impact and the second impact occurs to the same part of the helmet, adequate protection will only be offered in the first impact. However, without a helmet the first impact the secondary impact will be no worse than for the un-helmeted case, and the risk of injury in the first impact would be much higher in the un-helmeted case.
4.1.2 Helmeted and Un-helmeted Head Impact risk
It has also been suggested that wearing a cycle helmet may cause the wearer to sustain a head impact when an un-helmeted rider would not have had a head impact. It would seem that there are two possible scenarios in which this could occur:
1. The un-helmeted rider falls to the ground and the head stops within e.g. 25 mm (a typical helmet thickness) due to initial arm or shoulder contact with the ground, decelerating the head via the neck. In this case, the head velocity in the last 25 mm of travel would have to be very low or the neck would not be able to decelerate the head prior to impact; the resulting contact for a helmeted rider in the same fall would be trivial.
2. The un-helmeted rider falls to the ground (without a head impact) and another vehicle passes within 25 mm of the rider’s head, but without contacting it. For the helmeted rider, this would result in an oblique impact to the helmet (not directly to the head) that would not otherwise have occurred. This will result in loads being applied to the head and, even though the helmet will attenuate these loads, it is possible that injury could result. However, this is a highly specific scenario and, whilst it is not possible to estimate exposure to this scenario, it is reasonable to assume that it would be a very rare occurrence compared with typical head impacts with vehicles (e.g. to the windscreen or roof), the road surface, or other fixed obstacles.
4.2 Are Cycle Helmets Effective for all Riders?
From the hospital admission data for England (HES, see Chapter 6), 67% of serious cyclist casualties were reported to have been involved in a single-vehicle accident. Although there is no specific data on the impact surface (e.g. road or kerb) for these accidents, it is likely that most were with the road itself. Furthermore, the HES data shows that base of skull fractures are just as commonly the result of single-vehicle accidents as from collisions with cars and light goods vehicles (LGVs). Vault of skull fractures are almost twice as common in single-vehicle cycle accidents as accidents with cars, pick-up trucks and vans (see Table 6-2).

Published Project Report
TRL 12 PPR446
If a cyclist falls to the ground, the vertical impact velocity is primarily governed by the height of their head above the ground in the normal cycling position prior to the accident. No publications were found that specifically addressed this for the cycling population, but a simple calculation can give an indication of the height of the centre of gravity (C.G.) of the head. Figure 4.3 shows a schematic of the relevant measurements, and Table 4-1 shows relevant anthropometric data for the UK population. Several assumptions were made for the calculation:
• The leg height plus the crank height is equal to the hip height when standing, plus 50 mm to allow for placing the toe on the ground rather than the heel
• The torso is at an angle of 60° to the horizontal
Figure 4.3: Schematic of typical cyclist head height
This indicates that the C.G. of the head would be approximately 1.52 m above the road surface for a 50th percentile cyclist. For the 95th percentile person this would be 1.68 m and for the 95th percentile male this would be 1.69 m. For more upright riding postures, the head would be somewhat higher above the road surface than indicated by these figures; for instance, a fully upright posture would give a head C.G. height of 1.61 m for a 50th percentile cyclist and 1.77 m for a 95th percentile cyclist.
In some single-vehicle cycle accidents, the rider may be projected forwards over the handlebars and the rider’s head may gain some height, particularly if the rider’s arms are locked and do not flex. Based on the geometry in Figure 4.3, the height gained by the head of an average size rider could be as much as 150 mm, so their head C.G. height above the ground would become 1.67 m.
Mills and Gilchrist (2006) showed that the peak translational acceleration for head impacts with a cycle helmet is primarily due to the vertical component of head-to-road impact velocity, and is nearly independent of the horizontal component. In fact, for some of their computer modelling simulations at higher impact velocities than those included in test standards, the head translational acceleration was lower in tests with a horizontal velocity than in purely vertical drop tests. This was attributed to rotation of uncrushed foam into the contact region. A helmet test drop height of 1.68 m, together with a suitable limit on head acceleration, would therefore be necessary to attenuate the force of impact sufficiently to minimise the risk of cranium fracture and focal brain injuries for a 50th percentile male cyclist in a fully upright posture.
60°
Torso and half-head height
Leg height
Crank height

Published Project Report
TRL 13 PPR446
Table 4-1: Anthropometry of the UK male and female adults (from PeopleSize 1998, reported in Peebles and Norris, 1998)
Sex Mean (mm)
Standard deviation
(mm)
5th percentile (mm)
95th percentile
(mm)
Standing height
M 1755.1 69.9 1641.0 1869.2 F 1620.0 64.4 1514.4 1725.6 All 1687.6 95.0 1531.2 1843.9
Ear (tragion) height (~ C.G. of head)
M 1631.7 66.6 1522.2 1741.2
F 1496.3 63.5 1391.8 1600.7
All 1564.0 92.0 1412.6 1715.4
Hip (greater trochanter) height
M 931.5 49.6 849.8 1013.1
F 826.5 46.2 750.6 902.4 All 879.0 67.8 767.5 990.5
Head C.G. height with 60° torso angle
M 1587.9 1482.1 1693.7
F 1456.6 1355.9 1557.1
All 1522.3 1376.2 1668.2
Head C.G. height with 90° torso angle
M 1681.7 1572.2 1791.2
F 1546.3 1441.8 1650.7
All 1614.0 1462.6 1765.4
Most cycle helmets sold in the UK are only labelled as conforming to EN 1078, although some do include labelling for other standards. This means that a helmet bought in Europe is only guaranteed to have been tested in impacts up to 5.4 m.s-1 against a hard, flat surface and 4.57 m.s-1 against hard kerb surface. These are equivalent to drop heights of 1.5 and 1.06 m respectively. It should be noted that a drop test of 1.5 m is more severe than a typical cyclist head impact with the ground from a head height of 1.5 m, because other body regions will often contact the ground before the head, which will tend to reduce the severity of the head impact.
By contrast, the US CPSC Regulation has a drop height of 2.0 m onto a flat anvil and 1.2 m onto hemispherical and kerb anvils. Snell B-95 increases this to over 2.2 m and 1.3 m respectively. Both standards have a higher peak head translational acceleration of 300 g, compared with the EN 1078 requirement of 250 g. This means that helmets tested to CPSC or Snell B-95 are likely to comply with EN 1078, but the reverse is not necessarily true. These standards provide a drop height that is likely to be sufficient for even the tallest rider, although the allowable head acceleration is 20% greater.
Combining the information on helmeted and un-helmeted PMHS tests, laboratory and simulated helmet tests, and helmet test standards, it is apparent that cycle helmets would be expected to provide some protection against cranium fracture and focal brain injury in single cycle accidents. The primary limitations are:
• The drop height specified in EN 1078 for flat anvil tests (1.5 m) is lower than the head height for approximately half of adult riders. An increase in the drop height to 1.8 m would be sufficient to cover most of the cycling population, and the drop height of 2.0 m used in some standards would allow for some upward movement in a crash.

Published Project Report
TRL 14 PPR446
• Protection for impacts against kerbs and other substantially non-flat rigid surfaces will be lower than for flat surface impacts, particularly for adults.
• A cycle helmet will only provide the stated energy absorption within the designated test zone. Some protection may be afforded outside this zone, as the helmet can have greater coverage than the test zone, but effectiveness is reduced at the edge of the helmet (McIntosh et al., 1998).
• A cycle helmet may not provide as much protection against basal skull fracture as other cranium fractures. Not all cycle helmets cover this region of the skull adequately, and there are thought to be indirect injury mechanisms for some basal skull fractures such as impacts to the jaw (the mandible).
An improvement in the energy absorption capacity of cycle helmets, for instance by raising the drop height of the impact tests in EN 1078, would increase the proportion of cyclist head impacts that could be mitigated by a cycle helmet. Ideally, this should be done without increasing the peak head acceleration threshold in the standard. However, this could only be achieved at the cost of increasing the thickness of the helmet liner, which would result in a slightly bulkier, heavier helmet.
4.3 Helmets for Younger Children
Many authors question whether scaled-down adult cycle helmet standards are appropriate for children (e.g. Pedder, 1996; Newman, 1993). Child anthropometry is not simply a smaller version of adult anthropometry. Skull material properties are different, particularly for younger children up to about 7 years old. The increased flexibility of the cranium of younger children may make them more susceptible to brain injury due to deflection of the skull in localised loading; a more rigid helmet shell may be more effective in distributing the load (Henderson, 1995). The Canadian cycle helmet standard has lower peak acceleration limits for children less than 5 years old in order to account for the more compliant skull of younger children.
In addition, the CPSC and both Snell standards require helmets for children under five to cover a larger proportion of the head than helmets for older children and adults.
Considering that the drop heights in helmet impact tests are identical for adult and child helmets in EN 1078, and that the performance limits are the same, cycle helmets would be expected to provide somewhat better protection for children than for adults. This is because in single-vehicle accidents, a child’s head will tend to impact the ground from a lower initial height. This should ensure that the peak head acceleration is well within the limits defined in test standards and therefore that the risk of skull fracture and focal brain injury is reduced.
4.4 Rotational Acceleration
A number of authors have commented on the relative contributions to brain injury of translational and rotational head accelerations. As noted in Appendix E, rotational acceleration is generally considered to be associated with a range of injuries from concussion through to diffuse axonal injury, the effects of which may be very severe in terms of risk of death or poor long-term outcome for survivors.
Curnow (2003) has commented that cycle helmet design is based entirely on mitigating injuries due to linear (translational) acceleration and that most serious brain injuries are due to rotation. It is true that no cycle helmet standard to date includes a specific test to control the rotation performance of the helmet (see Section 3.4). In contrast to this, some motorcycle standards, including UNECE Regulation 22, contain tests that are designed to limit the coefficient of friction between the helmet and the impacted surface, and therefore limit the tendency to impart rotational acceleration to the head.

Published Project Report
TRL 15 PPR446
The head will rotate in an impact if the resultant impact reaction force does not intersect with the centre of gravity of the head (irrespective of the impact surface). This may occur (with or without a helmet) in a vertical impact if the contact point is offset horizontally from the centre of gravity of the head. This causes the normal force to be offset from the centre of gravity (see Figure 4.4), which will cause rotation. In a head impact with a lateral velocity component, friction between the head (or helmet) and the impacted surface will cause a tangential force that will also cause a rotation (see Figure 4.5). (These figures show a head impact with the ground with both vertical head velocity due to gravity, and forward head velocity due to the forward speed of the cyclist. However, the same considerations apply equally to other impact configurations, such as an impact with a fixed obstacle.)
The tangential force (which causes the rotation) is proportional to the normal force (the tangential force is equal to the normal force multiplied by the coefficient of friction - the effect of a coefficient of friction of approximately 0.5 is shown in Figure 4.4 and Figure 4.5). Sliding friction is constant, whatever the relative velocity of the two contact surfaces. Therefore, halving the normal force will halve the tangential force and commensurately reduce the rotational acceleration. The increase in the effective size of the head would offset a small proportion of this advantage if the helmet was rigidly attached to the head. In practice, the fit between the head and the helmet will allow some movement, and the scalp will accommodate further movement, so the benefit from the reduced normal force will greatly outweigh any slight dis-benefit due to the increased size of the head.
Figure 4.4: Example of head rotation due to head centre of gravity offset
from impact point
Figure 4.5: Example of head rotation due to sliding friction causing a
tangential force
Finan et al. (2008) discuss the implications of these effects in some detail. In some circumstances these rotational components will combine to increase the total rotational moment on the head, while in other circumstances the components may tend to cancel each other out and, if evenly balanced, result in zero rotational moment on the head. Reducing friction between the helmet and the impacted surface may therefore increase or decrease the rotational acceleration of the head depending on the trajectory of the impact.
Finan et al. (2008) also undertook physical helmet tests to confirm their theoretical discussion. They concluded that ‘while friction may be beneficial in a particular impact, in an averaged sense it is never beneficial and may be quite costly.’ That is, while there may be some impact configurations in which the forces due to friction will protect the brain from rotational acceleration, in the majority of cases the friction will increase the rotational acceleration and therefore the head injury risk. Finan et al. therefore recommended a reduction in the coefficient of friction of the helmet.

Published Project Report
TRL 16 PPR446
This does not mean, that the tests in existing cycle helmet standards – which do not control the coefficient of friction between the helmet and an impact surface - are not relevant to the risk of receiving an injury due to the rotational acceleration of the head. Rotational moments due to an offset between the impact location and the centre of gravity of the head, and due to tangential forces in an oblique impact, are both affected by the normal impact force. In both cases, attenuating the normal force – for example with a cycle helmet - will reduce the rotational moment on the head and therefore reduce the rotational acceleration.
Indeed, given the attenuation of impact force provided by a cycle helmet relative to an un-helmeted head (discussed in Section 4.1), reduction of impact force could be just as important in protecting the head from rotational injury as reducing the friction. If the increase in head acceleration with drop height is proportional to the impact energy (which seems a reasonable first approximation from the data in Prasad and Mertz, 1985), then the head acceleration due to a drop of 1.5 m without a helmet should be approximately 1000 g (or four times higher than that allowed in the EN 1078 standard). A similar factor of four times a reduction in the coefficient of friction would be required in order to have the same effect on head rotation, for example reducing the coefficient of friction between the helmet and the impacted surface from 0.8 to 0.2. A coefficient of friction of 0.8 would be quite high for a modern cycle helmet and a coefficient as low as 0.2 would be very difficult to achieve.
In practice, impact force would be limited in the un-helmeted head due to fracture of the skull (with attendant risks for fatal injury), which would reduce the difference – possibly by as much as a half. Nevertheless, it is clear that reducing the normal force is likely to be beneficial in reducing the risk of rotation-induced brain injury. In fact, Mills et al. (2009) recently suggested that, ‘The most effective method of reducing head rotational acceleration [for motorcycle helmets] could be a reduction in the linear acceleration limit of the helmet standards.’
It is also clear that further benefit would accrue from controlling the coefficient of friction between the helmet and the impacted surface. Because this friction is difficult to control, due to the wide range of impact surfaces that may be encountered in an accident, designers have sought to control the friction by introducing a sliding layer within the helmet itself. Two rather different solutions are already available for equestrian helmets (the MIPS AB equestrian helmet from Sweden, which was also proposed as a motorcycle helmet design in e.g. Aare and Halldin (2003)) and motorcycle helmets (e.g. the Lazer SuperSkin motorcycle helmet based on a concept by Ken Phillips - www.lazerhelmets.com).
4.5 Material Properties of Cycle Helmet Liners and the Outer Shell
There is an argument that helmet liners are too stiff, as the standards are relatively severe, and that helmets may therefore be sub-optimal for more common, lower severity impacts. Others have suggested that the standards should be more severe, to improve the ability to protect the head in high energy impacts such as those involving other road traffic which are often, though not always, more severe. This is discussed further in Appendix D.
Improvements could be made by controlling the material properties of the outer shell of the helmet. As the coefficient of friction between the shell and the impact surface can be different for different impact surfaces, it is only partially within the control of the helmet designer. As a result, several design solutions have been proposed that incorporate a low-friction shear plane within the helmet itself. Recently, both motorcycle and equestrian helmets that feature this sort of technology have been marketed.

Published Project Report
TRL 17 PPR446
5 A Literature Review of Cycle Helmet Effectiveness This chapter reviews the pertinent literature on the effectiveness of cycle helmets in the event of an accident.
It is generally accepted that cycle helmets can reduce the severity of some impacts (Adams and Hillman, 2001; Towner et al., 2002; Robinson, 2007). Some authors contend however that, given the standards to which cycle helmets perform, those impacts are likely to be relatively trivial; e.g. Scuffham et al. (2000) suggest that helmets are more effective at mitigating against minor injuries (such as scalp lacerations) than more severe injuries such as intracranial fractures.
A helmet may not prevent injury if its design parameters are exceeded during a collision (Rivara et al., 1999), although standards are minimum requirements and some helmets available to consumers will exceed the standards (see Section 4.1). Even when impacts exceed the tolerance of a helmet, however, it is anticipated that there will be reduced acceleration to the head; although in an impact of sufficient severity this may not prevent injury or fatality.
It is argued by some authors that a higher impact severity is likely to be a feature of incidents involving motor vehicles and that the probability of a collision with a motor vehicle is greater in some environments (e.g. quiet, residential streets compared with heavily trafficked intra-urban highways – Wardlaw, 2000). The consequent implication of this being that helmets cannot be expected to prevent all injuries in all locations and in all incidents (Robinson, 2007) and that data derived from one set of circumstances cannot be applied to a different setting.
Most of the published research into helmet effectiveness consequently attempts to determine whether the protective effect of helmets is sufficient to affect casualty outcomes in real accidents. There are two primary forms of study into cycle helmet effectiveness that are described in the published literature:
• Hospital admissions studies; and
• Population studies.
5.1 Hospital Admissions Studies
A total of eleven hospital admissions studies were identified that met the criteria of quality, relevance and timeliness; two were from the UK and nine were from outside the UK including the USA, Australia, and the Middle East. Studies varied in size, the largest study having a sample of 16,406 (Cook and Sheikh, 2003), and the smallest being based on 86 cases (Depreitere et al., 2004). On further examination, four studies were excluded from consideration: Eid et al. (2007) was excluded as only two of their 200 cyclists were wearing helmets, and therefore there was an insufficient sample to analyse; Depreitere et al. (2004) was excluded for the same reason - only three of their 86 cyclists were wearing helmets; Karkhaneh et al. (2008), and Meuleners et al. (2007) were excluded because they did not consider the effectiveness of helmets. The full in-depth review of hospital admissions studies may be found in Appendix F.2 and an overview of the studies is given in Table 5-1.
The focus of the studies varied, as would be expected, but included the following issues:
• effectiveness of different helmet types;
• differences in effectiveness on head and brain injuries, and head and facial injuries;
• differences in effectiveness in adults and children; and
• differences in effectiveness of helmets in accidents involving, and not involving, vehicles.

Published Project Report
TRL 18 PPR446
The majority of hospital admissions studies use a case-control design. This design matches helmeted cyclists with un-helmeted cyclists and attempts to discern different injury outcomes from the data that can be attributable to the helmet. Most studies of this design attempt to carefully match cyclists to control for other characteristics that may also explain different injury outcomes. Not all of the hospital admissions studies use the case-control design; for example Cook and Sheikh (2003) is comparable to a population study in that a large data-set (all UK hospital admissions between 1995-2000) was analysed and cycle helmet wearing rates were estimated from other studies, rather than taken from the admissions data. Cook and Sheikh used pedestrians as a control group
The majority of the studies recruited cases and controls from those who presented to an emergency department for treatment, though some restricted their study to only those who had been admitted to hospital.
Where studies reported the cause of the accident, the main cause was due to a fall from the bicycle; the average percentage was around 60%, other vehicles were reported as being involved rarely. This is very different from the proportion highlighted in population studies and may reflect the fact that population studies tend to be based on police accident data, and therefore predominantly a population of highway users, whereas hospital studies are based on admissions data and therefore include all types of cycle-related injuries including those sustained off road, via children’s play etc (see section 2.2.1). For example, the Scottish Executive (2005) found that helmet wearing rates were highest for cyclists injured in off-road or ‘mountain trail’ locations.
The legislative position of the region of the study poses problems in trying to make direct comparisons between them. For example, comparing non-helmet wearing bicyclists in the Davidson (2005) and Scottish Executive (2005) studies (set in the UK where there is no helmet legislation) with those in the Abu-Zidan et al. (2007) study (set in Australia where all cyclists are compelled by law to wear helmets) is potentially problematic. In these situations, a comparison was attempted between those who decided not to wear a helmet and those who decided to break the law by not wearing a helmet.
Hospital studies are often (but not exclusively) small scale and have been criticised for failing to control for all significant variables that might explain differences in casualty patterns. Such criticism is often valid, although such is the multivariate nature of situations leading to cyclist casualties that it is difficult to envisage all possible confounding variables being available within the data.
To some extent this limitation is inherent within the data, rather than the analysis. For example, Robinson criticises Cook and Sheikh’s failure to consider the influence of traffic calming and other environmental changes on cyclist injuries (See Appendix E). Such detailed information on the circumstances of any individual casualty is not collected in hospital administrative data. Consequently more detailed data has to be collected specially and the resulting studies tend to be small scale, and hence lack statistical robustness.
Significant difficulties identified with a high proportion of the hospital studies are that:
• No data was available on the characteristics of the impact leading to the head injury, particularly with respect to the speed of the impacting vehicle and the nature of the point of contact with the cyclist. This makes relating the performance of the helmet to the characteristics of the accident impossible. It has to be assumed that helmeted and un- helmeted cyclists on average are involved in comparable accidents, but this cannot be demonstrated by the data and there is some evidence, e.g. Scottish Executive, 2005, that this is not the case.
• The detail on the nature of the injury sustained is often limited. For example some studies (e.g. Scottish Executive, 2005) do not distinguish between facial and cranial injuries or between those sub-areas that may be covered by the helmet and those which would not, e.g. between forehead and chin (Hansen et al.

Published Project Report
TRL 19 PPR446
2003). As such those studies fail to distinguish between accidents in which a helmet may have been expected to provide a benefit and those in which it would not. Similarly the lack of data on the nature of the injury makes it impossible to distinguish between translational injuries and rotational injuries.
An underlying assumption of hospital studies is that the sample of cyclists presenting themselves with injuries is sufficiently representative of the population of cyclists to enable results to be extrapolated to the wider population. It is argued (Curnow, 2007; Robinson, 2007) that by excluding cyclists who have not been injured important data has been lost. An often repeated comment (e.g. Hewson, 2005a) is that injured cyclists wearing helmets are typically children in parks rather than adults on roads and so extrapolation on this basis may be tenuous. However, it may also be the case that some cyclists with helmets who have a head impact will be uninjured and therefore do not appear in the hospital admission studies – which would be expected to lead to an underestimate of cycle helmet effectiveness.
By excluding cyclists who have not had accidents from case-control studies it is claimed a bias has been applied to them such that not only are the interpretations of the data being contested, the primary evidence is also being questioned. In some case-control studies, it is assumed that presentation at a hospital by cases and controls (i.e. injury, but not head injury) is unrelated to helmet wearing, and therefore that both cases and controls are representative of the population. However, it is not certain that this assumption is robust.
Finally there is some discussion of whether the fact of electing to wear a cycle helmet denotes a particular attitude to risk that may result in different riding behaviour which influences casualty patterns. One suggestion is that helmet wearing cyclists adopt lower-risk strategies whilst cycling (one element of which is possibly the wearing of a helmet) (Hewson, 2005a).
This potential for lower-risk strategy on the part of helmet wearing cyclists cannot necessarily be extrapolated from case-control study results to the wider population since the behaviour, rather than just the helmet, may also be contributing to a lower injury burden. If this were true, it would be expected that studies based in locations where helmet use was compulsory would provide an opportunity to assess helmet use by a population using them on an involuntary basis, i.e. regardless of attitude, although behavioural change cannot be ruled out.

Publish
ed Pro
ject Rep
ort
TRL
20
PPR
446
Tab
le 5
-1: O
verv
iew
of h
osp
ital a
dm
ission
s stud
ies in
clud
ed
in th
e in
-dep
th re
vie
w
Au
tho
rs Y
ear
Data
sa
mp
le
(years)
Data
sam
ple
(lo
catio
n)
Data
sa
mp
le
(size)
Co
mm
en
ts 'Q
uality
of R
ese
arch
'
Fo
r the q
uality
criteria
ap
plie
d, se
e A
pp
en
dix
B
Thom
pson
et al. 1996
1992-1
994
Wash
ingto
n, U
SA
3,3
90
Seven
hosp
itals; ch
ild an
d ad
ult
gro
ups
Peer-review
ed jo
urn
al article. Heavily con
tested fin
din
gs
due to
confo
undin
g factors an
d w
heth
er they h
ave been
acco
unted
for.
Cook an
d S
heikh
2003
1995-2
000
Englan
d
69,5
91
HES d
ata; all cyclists ad
mitted
durin
g th
e study
perio
d
Peer-reviewed
journ
al article. Sig
nifican
t sample size
inclu
din
g u
se of p
edestrian
s as a 'contro
l'; how
ever co
ncern
s have b
een raised
about th
e meth
odolo
gy an
d
results.
Han
sen et al.
2003
15 m
onth
perio
d
Berg
en, N
orway
991
Child
and ad
ult
gro
ups
Peer-reviewed
journ
al article. Som
e confo
undin
g factors
contro
lled for alth
ough som
e results p
oten
tially counter-
intu
itive
Hew
son
2005
1989-2
003
Englan
d
No. o
f cases not stated
H
ES an
d S
tats19
1 data; ch
ildren
<16
years old
Peer-reviewed
journ
al article. Poten
tially inco
nclu
sive resu
lts.
Sco
ttish
Execu
tive 2005
2003-2
004
Loth
ian an
d
Bord
ers, Sco
tland
806
Five A&
E
dep
artmen
ts; child
an
d ad
ult g
roups
Not p
eer-reviewed
. Little detail on
meth
odolo
gy u
sed o
r on statistical variab
ility of results. Po
tential co
nfo
undin
g
arising fro
m in
clusion
of off-ro
ad accid
ents.
Hen
g et al.
2006
2004-2
005
Sin
gap
ore
160
Peer-review
ed jo
urn
al article. Sm
all sample size lim
ited
conclu
sions reg
ardin
g effectiven
ess.
Abu-Z
idan
et al. 2007
Perth
, Australia
297
>13 years
Peer-reviewed
journ
al articles. Som
e allowan
ce for
confo
undin
g facto
rs although n
ot fu
lly isolated
. Doubts
raised reg
ardin
g b
enefits fro
m a larg
e num
ber of m
inor
inju
ries bein
g p
revented
'maskin
g' an
y chan
ge in
severe in
juries.
Berg
and
Westerlin
g
2007
1987-1
996
Sw
eden
49,7
58
Child
and ad
ult
gro
ups
Peer-review
ed jo
urn
al article. Auth
ors them
selves raise so
me m
ethodolo
gical w
eaknesses –
how
ever some
confo
undin
g facto
rs (e.g. ag
e, collisio
n typ
e) are ad
dressed
; no d
ata presen
ted o
n exp
osu
re so fin
al co
nclu
sions p
oten
tially limited
1 S
tats19 is d
atab
ase used
to reco
rd ro
ad ca
sualties in
Great B
ritain

Published Project Report
TRL 21 PPR446
5.1.1 Overview of the Findings
Hospital admissions studies tend to find that helmets are effective in reducing injuries and fatalities. A major, albeit criticised, meta-review of a number of hospital admissions studies claims to have shown that ‘helmets provide protection against head, brain, severe brain, and facial injuries’ – this is for all ages of cyclist, including children and adults (Thompson et al., 1999). Headline injury reduction rates were reported to include:
• Head injuries down -85%;
• Brain injuries down -88%;
• Severe brain injuries down -75%; and
• Upper facial injuries down -65%.
Another meta-review (Attewell et al., 2001) estimated lower injury reduction rates:
• Head injuries down -40%;
• Brain injuries down -42%;
• Upper facial injuries down -53%; and
• Fatal injuries down -27%.
The second review (Attewell et al., 2001) is more critical of the primary data and evidence contained in the original articles it drew upon; more so than Thompson et al. (1999) which has received criticism (e.g. Curnow, 2005; insufficient sample sizes, inadequate information, inconstant underlying trends). Attewell et al. (2001) highlight that, while the error bounds for each of the headline injury rate reductions are large, a large number of negative results showing helmet ineffectiveness would be required to balance statistically the level of helmet effectiveness calculated2.
It is worth noting that for both meta-review studies, the authors effectively applied a uniform weighting to each of the primary data sources. All were considered by the authors as equally valid and as robust as each other (given the initial filtering processes used – see criticisms and limitations above)
Whilst these studies use actual data from individuals, it has been argued (e.g. Curnow, 2005) that the sample sizes used are too small from which to draw meaningful population-based estimates of effectiveness. For example, Curnow (2007) cites a study which has a sample size of 757 where only 31 cyclists had received a very severe injury and only seven of those 31 were reported to be wearing a helmet. Further criticisms of this type of study are that the comparative populations are unrepresentative of the wider cycling population as a whole (Robinson, 2007) and that children are over-represented in hospital admissions compared to the overall cycling population (Thompson et al., 1990) This led Robinson to state: ‘There is a danger such [case control] studies may control inadequately for rider behaviour or other factors and so attribute these differences to the impact of helmets’ (1996, p.463). Little is known about any differences between cyclists who have accidents (whether wearing a helmet or not) compared with the large population of cyclists who didn't have an accident during the study period (Robinson, 1996; Curnow, 2005).
2 Both the Attlewell et al. and Thompson et al. reviews passed the initial literature review filtering by virtue of being: directly relevant, recently published, and from peer-reviewed sources. There was not a second re-rating exercise undertaken although concerns particularly relating to Thompson et al. were acknowledged in conjunction with other articles that were highlighted by the literature review filtering.

Published Project Report
TRL 22 PPR446
5.2 Population-based Studies
A number of critics of the case-control hospital admission method instead favour the use of wider population-based studies that consider aggregate regional or national statistics on cycle accidents. It is claimed that these are more reliable as they do not try to explain confounding factors on an individual level.
Population studies are typically based on larger datasets and focus on large scale outcomes. Issues of extrapolating from a sample are avoided. Population studies tend to be longitudinal and compare the trend in cycle head injuries with the expected trend were helmets to offer a protective effect. However, they require data on rates of cycling and rates of cycle helmet wearing over time, and both are sometimes limited or provided at a fairly coarse level of detail (Knowles et al., 2009) For this reason population studies have tended to focus on locations where helmet wearing is mandatory and hence where there tends to be data on helmet wearing as well as a significant increase in wearing rates in a short space of time (although also possibly a significant change in exposure).
An overview of the literature that was included in the in-depth review of population studies is shown in Table 5-2. Most population studies were based on police reported accident databases, which are likely to tend towards the more serious multi-vehicle accidents. A cycle helmet is very unlikely to be able to offer protection from head injury in all accident circumstances, and the higher energies involved in some multi-vehicle accidents would be expected to reduce the proportion of accidents in which a cycle helmet may significantly reduce the risk of injury.
These studies, in addition to not including uninjured cyclists, also exclude accidents which are not attended by or reported to the police. In particular, population studies based on police reports are likely to significantly under-represent single vehicle cycle accidents, i.e. where no other vehicle was involved. Appendix A shows that Stats19 under-reports serious single-vehicle cycle accidents in England by as much as 97.6%.
Thus, any protective effect of cycle helmets would be underestimated, possibly considerably, by the skew in the types of accident recorded by the police compared with the whole population of cycle accidents.
None of the reviewed studies controlled fully for all possible confounding variables and it is likely that this would be difficult to do with a population study based, for example, on Police-reported accident data. A frequent criticism of longitudinal studies concerns the use of control populations to determine whether trends in cyclist head injuries can be explained by helmet wearing trends or by other factors. Some population studies segment the cycling population and compare one segment with another, particularly by age in locations where helmet wearing is compulsory for children (e.g. Berg and Westerling, 2007; Ho-Yin Lee et al., 2005). This practice has been criticised where, for example, adults are used as a control for children, where it is argued that differences in anatomy, behaviour and experience are not allowed for. In addition, helmet wearing rates were not reported for adults or children in some cases, so it is not possible to be certain that adults form an unvarying baseline to use as a control, because they may be subconsciously influenced by their children or wish to set a good example by following the same rules. Also, the types of cycling undertaken by adults and children may vary, so adults may not be an adequate control for environmental factors (such as traffic calming or the introduction of cycle paths).
Several studies (e.g. Robinson, 1996) have compared cyclist head injury rates against injury rates for other modes of travel (walking, driving and motorcycling). Similar trends in injury reduction are in evidence across several modes with the suggestion being that these trends are related and that an increase in helmet wearing rates cannot be regarded as the sole factor in cyclist head injury reduction (Robinson, 2001; Burdett, 2004). It should also be noted that parallel initiatives to improve safety for other groups, or a change in exposure for other groups, may produce the same effect.

Publis
hed
Pro
ject
Rep
ort
TRL
23
PP
R446
Tab
le 5
-2:
Overv
iew
of
po
pu
lati
on
stu
die
s in
clu
ded
in
th
e in
-dep
th r
evie
w
Au
tho
rs
Year
Data
sa
mp
le
(years
)
Data
sam
ple
(l
oca
tio
n)
Data
sa
mp
le
(siz
e)
Co
mm
en
ts
'Qu
ali
ty o
f R
ese
arc
h'
Fo
r th
e q
uality
cri
teri
a a
pp
lied
, se
e A
pp
en
dix
B
Mac
pher
son e
t al
. 2002
1994-1
998
Can
ada
9,6
50
Child
ren 5
-19
year
s
Peer
-rev
iew
ed journ
al a
rtic
le.
Cri
tici
sed b
y oth
ers
–
sugges
tion t
hat
ped
estr
ians
would
hav
e bee
n a
bet
ter
'contr
ol'
popula
tion –
although a
uth
ors
att
empte
d t
o
contr
ol fo
r so
me
vari
able
s.
Farl
ey e
t al
. 2003
1988-1
996
Monté
régie
, Q
ueb
ec
Appro
x 140,0
00
(tar
get
ed b
y in
terv
ention)
Child
ren a
ged
5-1
2 y
ears
Peer
-rev
iew
ed journ
al a
rtic
le.
Concl
usi
ons
limited
by
pote
ntial
confo
undin
g f
acto
rs s
uch
as
a w
ider
road
sa
fety
cam
paig
n u
nder
take
n a
t th
e sa
me
tim
e as
a
cycl
e hel
met
wea
ring c
ampai
gn.
Lille
r et
al.
2003
1993-2
000
Hill
sboro
ugh
County
, Fl
orida
400
Child
ren a
ged
5-1
3 y
ears
Peer
-rev
iew
ed journ
al a
rtic
le.
Res
earc
h p
ote
ntial
ly
limited
by
lack
of
'contr
ol'
gro
ups
and n
o
consi
der
atio
n o
f si
ngle
veh
icle
inci
den
ts (
i.e.
only
cy
clis
t).
Gra
nt
and
Rutn
er
2004
1975-2
000
United
Sta
tes
1,3
26
Child
ren <
16
year
s
Peer
-rev
iew
ed journ
al a
rtic
le.
Concl
usi
ons
limited
by
lack
of
det
aile
d t
rend d
ata a
nd e
xposu
re d
ata.
Ho-Y
in L
ee e
t al
. 2005
1991-2
000
Cal
iforn
ia
44,0
69
Cyc
lists
<18
year
s
Peer
-rev
iew
ed journ
al a
rtic
le.
Som
e cr
itic
ism
rel
atin
g
to n
o c
onsi
der
atio
n o
f tr
ends
pre
- an
d p
ost
- hel
met
le
gis
lation a
nd t
hat
ther
e w
as a
spec
ula
tion r
ather
th
an r
obust
concl
usi
ons.
Robin
son
2006
Var
ious
Aust
ralia
; N
ew
Zea
land
Var
ious
Pe
er-r
evie
wed
journ
al a
rtic
le.
Art
icle
cites
sev
eral
oth
er s
tudie
s fr
om
Aust
ralia
and
NZ.
Ji e
t al
. 2006
1992-1
996
San
Die
go
County
1,1
16
Cyc
lists
<18
year
s
Peer
-rev
iew
ed journ
al a
rtic
le.
Auth
ors
ack
now
ledge
limitat
ions
incl
udin
g s
hort
tim
e per
iod,
bia
s to
war
ds
seve
re inju
ries
, an
d u
nkn
ow
n
hel
met
use
.
Kim
et
al.
2007
1997-2
002
Nort
h C
arolin
a 2,9
34
Pe
er-r
evie
wed
journ
al a
rtic
le.
Pote
ntial
ly c
ontr
adic
tory
res
ults
that
can
not
be
concl
usi
vely
addre
ssed
with a
nal
ysis
pre
sente
d.
Wes
son e
t al
. 2008
1991-2
002
Onta
rio
362
Child
and a
dult
gro
ups
Peer
-rev
iew
ed journ
al a
rtic
le.
Lim
itat
ion o
n c
oncl
usi
ons
rela
ting t
o im
plie
d b
enef
its
from
hel
met
use
– h
elm
ets
wer
e in
cluded
in
com
bin
atio
n w
ith o
ther
non
-leg
isla
tive
mea
sure
s th
at
cannot
be
indep
enden
tly
asse
ssed
.

Published Project Report
TRL 24 PPR446
Robinson claims that ‘a proportion of cycling injuries relate to motor vehicles and thus may be affected by the overall road safety climate’ (1996, p.464). An example of this (taken from Robinson, 2007) is where compulsory helmet-wearing legislation was adopted in Australia shortly after major campaigns to reduce drink driving and speeding. The presence of the additional major environmental changes means that a simple causal relationship between helmet wearing rates and cycle casualties would be difficult to prove from the data in the study. The overall implication is that there are confounding factors unaccounted for and/or helmets (worn to meet legal requirements) are of little benefit (Robinson, 2001).
Similarly to the hospital admissions studies, most of the studies reviewed used an inadequate definition of head injury and did not differentiate on the severity of head injury, both of which considerably reduce the robustness of any conclusions that are drawn from the studies. Indeed, in many of the population studies head injury was not defined at all, either in terms of the part of the head injured or the severity of injury considered
Even in the case of studies where ‘head injury’ is defined more specifically, very broad definitions are used such as ‘traumatic brain injury’ (e.g. Ho-Yin Lee et al., 2005). Such a definition is too broad to be confident that there are no dis-benefits to helmet wearing. To address this question, brain injuries should be classified into two groups: focal and diffuse types. This level of detail would be necessary to be certain that diffuse injuries are not increased through helmet wearing. This seems unlikely (at least on average) from biomechanical reasoning (see Section 4.4), but it would be useful to confirm this with accident data.
Other key limitations of the recent population studies that were reviewed in this project were the lack of information about individual-level helmet use and the lack of control for changes in cycling participation rates. Helmet use rates were often estimated from observation studies, but these may have been conducted in areas where cyclists were more (or less) likely to wear a helmet than the cyclists represented in the population. An ideal study design would have access to a dataset that recorded helmet use directly. It may be possible to control for changes in cycling participation rates by comparing the rates of head injuries with the rates of injuries to other body regions. However, there is no consensus in the literature about what type or severity of non-head injuries could be used as a reliable control.
5.2.1 Overview of the Findings
A broad range of findings was reported in the literature for the effectiveness of cycle helmets. For example, some population studies reported no significant change following the introduction of cycle helmet legislation (Ho-Yin Lee et al., 2005). However, other population studies reported various effects including: a reduction in fatal injuries and an associated increase in other injuries (Kim et al., 2007); a 50% reduction of fatalities (Wesson et al., 2008); and an 18% greater reduction in head injuries with legislation than without (Macpherson et al. 2002).
Population studies that reported positive benefits for helmet wearing were largely studies of child populations. As discussed in more detail in Section 4, a greater benefit would be expected for children than adults because a larger proportion of the child population would fall from a height covered within cycle helmet standards.
A number of population studies (e.g. Robinson, 2001; Hewson, 2005b; Scuffham et al., 2000) have shown that head injury rates for cyclists have not demonstrated any obvious change over time despite an increase in the trend for helmet wearing. This lack of a clear relationship is claimed to show that there is no conclusive evidence of helmets reducing head injuries (Hewson, 2005b). The authors report that cycle helmets may be effective on an individual level in some circumstances, but other factors are limiting injury mitigation at the population level and/or limiting the ability to measure effectiveness

Published Project Report
TRL 25 PPR446
reliably. This suggests that the order of injury reduction identified by some of the hospital studies is likely to be over-stated as the confounding factors would have to be very large to mask rates of head injury reduction of 80% plus in the helmet wearing population and, depending on the factor, might be expected to be detectable in the population of other vulnerable road user types.
The study by Hewson (2005b) is interesting as it uses UK-specific data (Stats19 casualty data together with data on helmet wearing rates) to examine whether helmets have been effective in reducing overall reported road casualties. The study conclusion is that ‘There is no evidence that cycle helmets reduce the overall cyclist injury burden at the population level in the UK when data on road casualties is examined.’ (2005b, p.127). However, there are some limitations associated with this methodology, not least that head injuries were not specifically examined (all trauma was aggregated by fatal, serious and slight injury severity levels). A cycle helmet would not reduce a non-head serious injury, so all cyclists with multiple body region injuries would still remain serious casualties, even if cycle helmets were 100% effective. Even for head injury only, a helmet may reduce the severity of some injuries, but a serious head impact may still require the casualty to attend hospital for observation, even if the severity of the injury was much reduced, so again, would still be listed as a serious casualty
5.3 Confounding Factors When Measuring Cycle Helmet Effectiveness
With regard to helmet effectiveness, the primary area of discussion is whether, all other things being equal, the logical and theoretical benefits of cycle helmets can be shown to provide a protective effect in reality.
Determining whether all other things are equal or whether changes in other factors may be confounding the evidence of the effectiveness of helmets forms the basis of much of the criticism of individual studies, as discussed in Appendix E. The level of data reported in most of these studies is aggregated to a point where it is not possible to reinterpret it to answer criticisms of study design or analysis from the published papers.
The real-world setting within which cycling takes place consists of multiple factors affecting people, places, and events such that identifying a particular causal factor for a particular identified outcome is difficult (Karkhaneh et al., 2006). This multivariate context allows and potentially encourages different interpretations of data and the mechanisms and factors underpinning it.
Many studies attempt through their design and analysis (Hewson, 2005a; Robinson, 2007) to isolate known variables (confounding factors) other than helmet wearing that may also explain differences in cyclist injury patterns. It is, however, highly unlikely that all confounding factors can be entirely isolated. Confounding factors can change both between locations and also over time - a number of key studies are now over ten years old, some nearing twenty. Many changes have taken place in the intervening years, not least to cycle helmet standards; changes in cycle helmet wearing rates; vehicle characteristics, e.g. evolving standards regarding ‘pedestrian-friendliness’; cycling exposure; and changing driver attitudes (e.g. drink driving - Robinson, 2007).
Many studies use an inadequate (or absent) definition of head injuries. For example, Robinson (2006) defines head injuries in the studies that she reviewed as ‘most commonly classified as admissions to hospital with head wounds, skull or facial fractures, concussion, or other intracranial injury’. However, ‘head wounds’ is very vague and not useful for this type of study. For instance, even if this was constrained to the International Classification of Diseases code S01 (open wound of the head - see Appendix G for a complete list of codes included in the ICD codes for head injuries commonly used in hospital admissions databases), any cuts and lacerations to the nose, ear, cheek, lip or chin would be recorded as ‘serious’ head injuries. Furthermore, head injury is inadequately characterised in many of the studies, even hospital studies based on Emergency Department records. At one level, all head injuries are often grouped

Published Project Report
TRL 26 PPR446
together. Given that a cycle helmet is unlikely to protect all parts of the head a helmet that successfully mitigated one type of injury but not another would reduce the apparent effectiveness of cycle helmets. For example, if a helmet prevented a skull fracture but did not prevent a chin laceration it would still be classified as a head injury case. It is important, therefore, that the classification of head injury is such that these effects can be isolated. At the minimum, scalp injury, cranium fracture and brain injury should be classified separately from face and other head injuries. Both groups should be further grouped by severity so that the incidence of minor cuts and abrasions can be investigated separately from more serious injuries.
While such a classification would be necessary to eliminate some possible confounding factors in helmet effectiveness studies, at least one factor worthy of separate investigation would remain: the effectiveness of cycle helmets in mitigating brain injuries due to rotation of the head. Some commentators have raised the concern that cycle helmets may even increase the risk of rotation-induced brain injury in some circumstances. Consideration of the mechanical and biomechanical factors involved would suggest that cycle helmets would have a very positive protective effect for reducing rotation-induced injury (see Section 4.4).
Unfortunately, none of the recent studies reviewed were sufficiently detailed for this to be analysed. Most did not classify the brain injuries that were observed such that rotation-induced injuries could be differentiated from other brain injuries. In practice, this distinction would be very difficult to make for many brain injuries unless very detailed injury information was available. This is because many brain injuries, such as sub-dural or sub-arachnoid haematoma could be caused by a variety of head loading mechanisms. However, most studies agree that the various levels of concussion and diffuse axonal injury are due entirely to rotation of the head. If these injuries were compared for the with and without helmet groups, with sufficient controls on head impact severity, accident type and so forth, it may be possible to determine whether cycle helmets increase, do nothing, or reduce the risk of rotation-induced injuries.
Furthermore, these injuries are considered by Robinson (2006) to be ‘severe enough to appear in hospital admissions databases’. However, if a cycle helmet was effective in a particular accident at reducing the severity of certain types of head injury (e.g. cranium fracture and intracranial injury), the patient could still be present as a head injury case in the hospital admissions database. This may be because the severity of the injury is reduced, but not eliminated. For instance, a serious concussion and a cranium fracture may be reduced to a moderate concussion, which would be a very worthwhile reduction in injury severity for the individual, but - if admitted for the concussion - would still be recorded as ‘serious’. Alternatively, if the patient had minor facial cuts documented, they would still be in the ‘serious’ injury database and the helmet would appear ineffective. Overall, the inadequate definition of head injury and of head injury severity means that it is not possible to determine the effectiveness - or non-effectiveness - of cycle helmets from this type of data.
It is also worth noting that Hewson (2005b) examined the effectiveness of cycle helmets by comparing the proportion of serious and fatal injuries compared with slight injuries for pedestrians and cyclists. Note that head injuries were not specifically examined; this adds a further layer of abstraction to the lack of appropriate definition of head injuries discussed above, which would make it even more difficult to detect any effect. For example, a rider with a serious limb and serious head injury would still be a serious casualty even if the head injury was mitigated to slight or no injury. It is also not clear, in this and other studies, why pedestrians have been used as a control group - for instance whether they have the same distribution of accident and injury types and severities as unhelmeted cyclists.
A potentially significant confounding factor is any change in behaviour among cyclists or other road users as a result of a cyclist electing (or being compelled) to wear a helmet. This behavioural change cannot be discounted, and some studies, e.g. Abu-Zidan et al

Published Project Report
TRL 27 PPR446
(2007) attempt to control for this variable; however, neither the population nor hospital admissions studies considered in this review provided conclusive evidence on the effect of helmet wearing on the attitudes or behaviour of cyclists or other road users. This typically reflects limitations in datasets, rather than analysis per se.
5.4 Comparing the findings from Hospital Admission and Population Studies
There is little agreement on why there is a difference between, on the one hand, small-scale case-control studies showing helmet effectiveness and, on the other hand, larger population-based studies that show no clear trend in head injury reduction (Hewson, 2005b). There are methodological shortcomings with many of the studies reviewed, and these are discussed in detail in Appendix E. These shortcomings make it impossible to definitively quantify the effectiveness or otherwise of cycle helmets based on the literature reviewed.
The difference between the findings and conclusions of the hospital studies and those of population studies is likely to reflect:
• Differences in the samples used in hospital-based and population studies, and differences between both these samples and the cycling population;
• The appropriateness of the control group to adequately compensate for confounding variables;
• Limitations in the ability to identify helmet wearing in the samples;
• Conclusions biased by the so-called 'ecological fallacy' where sub-groups of cyclists with different risk profiles need to be accounted for (Hewson, 2005b).
• The possibility that the protective effect of helmets may be smaller than the effect of confounding variables and cannot be readily identified in population data. Consequently the hospital studies are likely to over-state the protective effect of helmets and some, as discussed above, clearly do so; and
• The severity and definitions of injury not being adequately identified.
Additionally, both methods may miss a proportion of the ‘success stories’ if helmets are effective.
Overall, it is concluded that it is not possible to determine definitively from the literature the level of effectiveness of cycle helmets as none of the reviewed studies controlled fully for all possible confounding variables and it is likely that this would be difficult to achieve.
The studies that were closest to having adequate controls were hospital studies where the accident severity for the with-helmet and the without-helmet groups can be controlled to a reasonable extent, for example by comparing the injuries to other body regions. However, in most studies, the severity of injury in other body regions is not reported and it is not clear that using minor injuries as a control would be adequate. Typically, samples were small for hospital studies where helmet wearing was known for each case, and helmet wearing rates from separate observational studies were used for larger hospital studies, such as those using hospital admissions data for the whole of England.
This is not to say that cycle helmets are or are not effective in reducing the risk of head injuries; rather that limitations in the data available mean that it would be very difficult for such studies to control for all possible confounding factors, and it would therefore be difficult to make a definitive claim for cycle helmet effectiveness.


Published Project Report
TRL 29 PPR446
6 The Extent and Nature of Cyclist Head Injuries: The Real World Potential Effectiveness of Cycle Helmets
In-depth accident data were used to investigate the extent and nature of the head injuries sustained by pedal cyclists, which were then correlated as far as practical with the accident circumstances. In conjunction with consideration of the biomechanics of head injury and the mechanics of helmeted head impacts (see Chapter 4), this information was used to predict the potential effectiveness of cycle helmets at mitigating or preventing a proportion of the more severe types of head injury, i.e. cranium fractures and/or intracranial injury. Other injuries, such as scalp lacerations are also considered, but because there is limited information regarding the part of the head injured, it is not known if a cycle helmet would have covered the affected region and mitigated or prevented the actual outcome.
The accident databases used were:
• the Hospital Episode Statistics (HES) database for England (1999 to 2005); and
• police fatal file derived pedal cyclist database (2001 to 2006).
The HES dataset contains very detailed information regarding the injuries sustained but only superficial information with respect to the nature of the accident. Whereas the police fatal files provided full reconstruction evidence and allowed in most cases the cause of the head injury to be evaluated by expert assessment. Thus, an expert judgement could be made for each fatal case as to the likely potential effect a cycle helmet would have had, if worn.
Therefore, the methods used and the subsequent confidence attributed to the predictions of the potential effectiveness of cycle helmets for fatalities (fatal file) and seriously injured casualties (HES database) vary.
6.1 HES Database (1999 to 2005)
The Hospital Episode Statistics (HES) database analysed here contains details of 37,504 pedal cyclists injured in traffic collisions in England between 1999 and 2005.
The majority (67%) of the casualties were involved in a non-collision accident which includes falling from a pedal cycle or overturning. An additional 24% were injured when they were involved in a collision with a car or HGV. Half of the injured cyclists (50%) in the HES database were children (aged 0-16 years), and of these, 70% were involved in a non-collision (single-vehicle). Injury information is recorded in HES using ICD-10 codes (Appendix G). These give detailed information on region and type of injury, and other illnesses and diseases. Other illnesses and diseases are excluded from this analysis.
Figure 6-1 shows the distribution of injuries to different body regions for all pedal cyclists with at least one injury, pedal cyclists involved in non-collisions and injured child pedal cyclists. Around 1 in 10 pedal cyclists (9% of all, 11% of non-collision and 13% of children) had an injury to more than one body region. The body regions that were most commonly recorded in the HES database were injuries to the arms and head. Children were proportionately more likely to have a head or arm injury than adults in the database.

Published Project Report
TRL 30 PPR446
Figure 6-1: Distribution of injury regions (all injured cyclist casualties involved in traffic collisions in HES data, 1999-2005)
6.1.1 HES Casualties Head Injuries
Of the 15,704 casualties with a head injury 11,003 had a known head injury type, 6,070 had an unknown head injury type; and 1,369 had both known and unknown head injury types. Table 6-1 shows the distribution of casualties with cranium fractures and intracranial head injuries by collision type for the 11,003 cyclist casualties who had known head injury types. Cranium fractures and intracranial injuries are typically the most serious types of head injury, as well as being more likely to be mitigated by a cycle helmet than, for example, a jaw (mandible) fracture (Chapter 3). Cycle helmets will provide protection against other injuries that have been recorded, such as open wounds to the head (5,302 or 20% of the traffic accident cyclist casualties had open wounds to the head), but it is not known how many of these injuries were to a part of the head that may be covered by a helmet. Therefore, a conservative approach is taken to only highlight the most serious cranium fractures and brain injuries.
It is notable that for all head injured casualties, cranium vault fractures and intracranial injuries were more common in non-collision (single-vehicle) accidents than in collisions involving cars and light goods vehicles (LGVs). Conversely, base of cranium fractures and intracranial injury were more commonly associated with car and LGV collisions. Overall, cranium fractures and intracranial injuries were very evenly distributed between non-collision (single-vehicle) accidents and collisions involving motor vehicles (1,112 and 1,172 casualties respectively). For cyclists who sustained only a head injury (see Table 6-2), proportionally more cranium fractures and intracranial injuries occurred in non-
Head (Incl. Face) All 39.8% Non-collision 41.7% Child 44.5%
Neck All 1.8% Non-collision 1.1% Child 0.9%
Thorax All 4.5% Non-collision 2.4% Child 1.5%
Arms All 41.5% Non-collision 46.6% Child 42.6%
Lower limbs All 23.8% Non-collision 19.1% Child 19.2%
Abdomen, lower spine & pelvis All 7.8% Non-collision 6.6% Child 7.5%

Published Project Report
TRL 31 PPR446
collision (single-vehicle) accidents than collisions involving motor vehicles (869 and 676 casualties respectively).
Table 6-1: Cyclist cranium and intracranial head injury casualties by collision type (all cyclist casualties with head injury, HES data 1999-2005)
Collision type Fracture of vault of cranium
Fracture of base of cranium
Intracranial injury
Cranium fracture &
intracranial injury
Car/LGV 146 259 768 999
Cyclist 8 23 31 54
HGV/Bus 17 34 67 91
Non-motor vehicle 1 0 3 4
Single-vehicle 178 189 856 1112
Object 18 15 53 73
Other motor vehicle 6 13 41 55
Pedestrian/Animal 2 5 11 16
Train 0 0 1 1
TWMV/3WMV 6 7 18 27
Unknown 36 41 158 199
Total 418 586 2007 2631
The data from Table 6-1 is summarised in Table 6-3. Of those casualties with a known head injury type, 2,631 casualties had either a cranium fracture, an intracranial injury, or both. If these figures are scaled up to account for the unknown head injuries, then a total of 3,755 casualties would have had at least one of these injuries, which represents 10.0% of the pedal cyclists injured in traffic collisions in the HES database for 1999-2005.
Some of the cyclist casualties with head injuries will also have had a serious injury to another body region, and so would still be classified as serious casualties even if their head injury was mitigated to no injury. Figure 6-2 highlights the selection of the casualties with cranium and intracranial head injuries, with and without other injuries.
Table 6-4 shows the proportion of injuries for the 10,888 casualties who had a head injury and no injury to any other body region. A total of 1,801 cyclist casualties had at least one cranium fracture or intracranial injury and had no injury to any other body region. Scaled-up to account for the unknowns, then 2,702 casualties (7.2% of all HES cyclist traffic casualties) would have a relevant head injury and no injury to any other body region. If these serious injuries were reduced to slight or no injuries, then the casualty would no longer appear in the KSI statistics.

Published Project Report
TRL 32 PPR446
Table 6-2: Cyclist cranium and intracranial head injury casualties by collision type (all cyclist casualties with head injury and no other injuries, HES data
1999-2005)
Collision type Fracture of vault of cranium
Fracture of base of cranium
Intracranial injury
Cranium fracture &
intracranial injury
Car/LGV 82 157 443 577
Cyclist 4 17 22 37
HGV/Bus 9 17 35 49
Non-motor vehicle 1 0 3 4
Single-vehicle 140 138 674 869
Object 14 13 39 55
Other motor vehicle 4 9 28 37
Pedestrian/Animal 1 4 7 10
Train 0 0 0 0
TWMV/3WMV 4 2 9 13
Unknown 24 36 119 150
Total 283 393 1379 1801
Table 6-3: Cyclist cranium and intracranial head injury casualties (all cyclist casualties with head injury, HES data 1999-2005)
Casualties (of 11,003 with known
injury)
Percentage (of 11,003 with known
injury)
Scaled-up to 15,704 casualties
Percentage (of all 37,504
casualties)
No. with vault of skull injury 418 4% 597 1.6%
No. with base of skull injury 586 5% 836 2.2%
No. with intracranial injury 2007 18% 2864 7.6%
No. with 1 or more vault, base, or intracranial injury
2631 24% 3755 10.0%
Table 6-4: Cyclist cranium and intracranial head injury casualties (all cyclist casualties with head injury and no other injuries, HES data 1999-2005)
Casualties (of 7,258 with known injury)
Percentage (of 7,258 with known injury)
Scaled-up to 10,888 casualties
Percentage (of all 37,504
casualties)
No. with vault of skull injury 283 3% 426 1.1
No. with base of skull injury 393 4% 590 1.6
No. with intracranial injury 1379 13% 2069 5.5

Published Project Report
TRL 33 PPR446
No. with 1 or more vault, base, or intracranial injury
1801 16% 2702 7.2%
Figure 6-2: Selection of cyclists with cranium and intracranial head injury with and without other injuries
Assuming that at least 7.2% of head injuries could be saved, this would equate to 176 of the 2,450 seriously injured cyclist casualties recorded in GB in 2008.
It is unlikely that cycle helmets would be able to mitigate all of these cranium fractures and brain injuries. For instance, a cranium fracture or intracranial injury could be caused by an impact to the cranium below the level of the helmet, or even by loads transferred from an impact to the mandible (the jaw). Also, the precise impact conditions for these casualties is not known, so it is not possible to estimate for any one casualty whether the severity of their head impact would have been in the range for which a helmet may be expected to be of some benefit. Furthermore, whilst the biomechanical evidence strongly suggests (see Chapter 4) that a cycle helmet would reduce the severity of injury in some collision situations, the injury may not be reduced to no injury. For the individual, a reduction in head injury severity from a complex cranium fracture with brain injury to a moderate concussion would be very beneficial, but it is likely that the casualty would still be admitted to hospital. In some cases, a casualty may be admitted just for
37,504 Pedal Cyclists in HES from 1999-2005
15,704 head injuries
11,003 known type of head injury
2,631 cranium injury
Scaled up to 15,704 to account
for unknowns
3,755 serious head injury – 10% of the 37,504 total
10,888 head injuries and no other injuries
7,258 known type of head injury
1,801 cranium injury
Scaled up to 10,888 to account
for unknowns
2,702 serious head injury and no other injuries
7% of the 37,504 total

Published Project Report
TRL 34 PPR446
observation, but they are therefore likely to appear as a ‘serious’ casualty in the official accident statistics.
This means that it would be unrealistic to assume cycle helmets to be 100% effective and capable of preventing or mitigating all the serious cranium fractures and intracranial injuries. Therefore, if cycle helmets had been worn, a proportion of this 7% (who only sustained these injuries and had no other head or other body region trauma) may not have required hospital treatment at all.
However, this percentage doesn’t include the potential to prevent other injury types such as open wounds to the head (20% casualties), but without further details it would not be appropriate to tag these to the target population.
A limitation of this work was the lack of evidence regarding whether or not the cyclists were already wearing a cycle helmet.
6.2 Fatal Casualties Database (2001 to 2006)
The fatal accident database compiled as part of this research has the post mortem results for 116 cyclist accidents (66 London collisions and 50 rural collisions). Injuries were classified using the Abbreviated Injury Scale (AIS) (Gennarelli and Wodzin, 2005), which is an internationally recognised method of measuring injury severity. The AIS is based on threat to life, ranging from AIS 1 (minor) to AIS 5 (critical) and AIS 6 (currently untreatable). The proportion of moderate and greater (AIS 2+) and serious and greater (AIS 3+) injuries by body region are highlighted in Figure 6-3 London (labelled L) and rural (labelled R) collisions. More details are provided in Appendix H with respect to the selection of the fatal files, which are not necessarily representative of the national fatal casualty population. The sample over-represents London, with 58% of cases being from London and 42% from rural areas.
For pedal cyclist fatalities the most serious or ‘life threatening’ injuries are those with severity scores of AIS 3+. The head most frequently suffered AIS 3+ injury, with 82% and 71% of pedal cyclists involved in rural and London collisions respectively. Seventy percent of the rural pedal cyclists sustained AIS 3+ thorax injury and 62% of the London group. The London cyclists sustained proportionally more ‘lower extremity’ and abdominal injuries (including pelvic fractures). This was principally due to the different crash typology the urban pedal cyclist fatalities experienced, with a higher percentage of lower speed accidents involving HGVs or larger vehicles turning across the cyclists’ paths and running them over. This resulted more often in crushing injuries, whereas the rural accidents more commonly involved blunt trauma due to higher speed impacts with vehicles and the ground.
The majority of the pedal cyclists who died sustained severe injury (AIS 3+) to more than one body region (62% London, 76% rural), the most common combination being ‘head and thorax’ (20% London, 34% rural). The head was the only body region seriously injured (AIS 3+) in 27% of fatal injuries of the urban sample and 20% in the rural sample. A table of all combinations is shown in Appendix H.
The collision circumstances were investigated for each range of injuries to determine patterns. Given the small numbers, patterns were not clear. However, of those collisions where the cyclist died of a head injury only, a quarter were from the cyclist being hit in the rear by a vehicle (either the other vehicle drove into them or the cyclist moved into the path of the vehicle) and 15% were single-cycle non-collision accidents. The London pedal cyclist fatalities who sustained ‘head and thorax’ injuries at AIS 3+ typically were involved in collisions where either a larger goods or passenger vehicle turned left across their path and ran them over or the cyclist lost control and fell into the path of the other vehicle. The rural pedal cyclist fatalities who sustained ‘head and thorax’ at AIS 3+ were struck from the rear in two thirds of cases and the vehicle passed too close causing them to lose control in one third.

Published Project Report
TRL 35 PPR446
Figure 6-3: Distribution of injury regions for cyclists who died in collisions in London (L) and rural areas (R)
6.2.1 Fatal Casualties’ Head Injuries
Two rural and one London case were removed from the analysis due to incomplete data, leaving a total of 113 casualties who were killed. There were a total of 69 casualties who were killed by a head injury, out of a total of 113. This suggests that the maximum target population for cycle helmets is 61% (69/113) for this sample. Furthermore, there were three cases where a cyclist who was known to be wearing a cycle helmet received a fatal head injury. All three of these injuries were sustained in collisions with cars, two due to an impact with the vehicle and one due to unknown causes. These casualties have been removed from the following analysis on the assumption that they could not be saved by wearing an appropriate cycle helmet, although it is not certain from the fatal file information that they were wearing a helmet that met the present EN 1078 standard, or that the helmet was correctly fitted and worn.
Face
AIS 2+: 7.6% (L) 6% (R) AIS 3+: 0% (L) 0% (R)
Head
AIS 2+: 74% (L) 84% (R) AIS 3+: 71% (L) 82% (R)
Neck
AIS 2+: 1.5% (L) 6% (R) AIS 3+: 0.0% (L) 4% (R)
Upper Extremity
AIS 2+: 12% (L) 22% (R) AIS 3+: 0% (L) 0% (R)
Lower Extremity (including pelvis)
AIS 2+: 47% (L) 44% (R) AIS 3+: 33% (L) 24% (R)
Thorax
AIS 2+: 67% (L) 76% (R) AIS 3+: 62% (L) 70% (R)
Abdomen and pelvic contents
AIS 2+: 44% (L) 38% (R) AIS 3+: 17% (L) 12% (R)
Spine
AIS 2+: 11% (L) 36% (R) AIS 3+: 5% (L) 12% (R)

Published Project Report
TRL 36 PPR446
Table 6-5: Cause of fatal head injuries by opposing vehicle type
Cause of Injury
Motor cycle
Car Minibus Bus/
Coach
Goods vehicle <3.5t
Goods vehicle >3.5t
Other motor vehicle
Ridden horse
Single vehicle
Total
Impact with
vehicle
0 18 0 0 3 0 0 0 0 21
Impact with
ground
2 3 0 1 4 0 0 0 5 15
Run over / caught
0 0 0 1 1 8 0 0 0 10
Multiple causes
0 6 0 1 0 0 0 0 0 7
Unknown 0 12 0 0 0 1 0 0 0 13
Total 2 39 0 3 8 9 0 0 5 66
Table 6-5 shows the distribution of fatal head injuries by opposing vehicle type. It is apparent from Table 6-5 that 20 (30%) of the fatal head injuries were due either to multiple causes or the cause was unknown. This category will include cases in which it was not possible to determine with confidence which of several head impacts (e.g. with the car and with the road) caused the head injury (or the most severe head injury). In some cases it may be that both head impacts were significant and either one of them would have been sufficient to cause the fatal injury. For the purposes of estimating the likely effectiveness of cycle helmets, two assumptions have therefore been made:
1. The effectiveness of cycle helmets for head injuries due to ‘multiple causes’ is zero. This has been assumed because it is not possible to attribute the most important cause of head injury. It is unlikely that this assumption is accurate, and it would give a conservative estimate of cycle helmet effectiveness.
2. The head injuries due to ‘unknown’ causes have been distributed pro-rata for impacts with cars and with goods vehicles > 3.5 tonnes.
This gives the distribution of casualties with a fatal head injury shown in Table 6-6.
The effectiveness of cycle helmets in single-vehicle collisions was estimated to be 50%. It is assumed that this effectiveness applies to all ground collisions. (Some casualties will be thrown in to the air in a collision with another vehicle and the effectiveness would be lower if the head is the first body region to contact the ground; it is assumed that these are offset by the number of casualties who land on another body region and therefore have a less severe head impact.)

Published Project Report
TRL 37 PPR446
Table 6-6: Cause of fatal head injuries by opposing vehicle type (with unknown head injury cause attributed pro-rata to vehicle, ground and run over impact
types)
Cause of Injury
Motor cycle
Car Minibus Bus/
Coach
Goods vehicle <3.5t
Goods vehicle >3.5t
Other motor vehicle
Ridden horse
Single vehicle
Total
Impact with
vehicle
0 28 0 0 3 0 0 0 0 31
Impact with
ground
2 5 0 1 4 0 0 0 5 17
Run over / caught
0 0 0 1 1 9 0 0 0 11
Multiple causes
0 6 0 1 0 0 0 0 0 7
Total 2 39 0 3 8 9 0 0 5 66
The effectiveness in multi-vehicle collisions is much more difficult to estimate, as this is highly dependent on the nature of the head contact with the vehicle. This will depend, amongst other factors, on: the relative velocity of the cyclist and the vehicle; the shape and rigidity of the vehicle structure contacted by the cyclists head; the injury tolerance of the cyclist. The effectiveness of a cycle helmet in collisions with a car was assumed to be lower than that for impacts with the ground. In the absence of any definitive estimates, a range of 10 to 30% is used for the following assessment. This range is consistent with the discussion in Chapters 4 and 5 that some benefit would be expected in these collisions, but that the benefit would be lower than for single-vehicle collisions. However, it should be remembered that there was no specific evidence to support these estimates. The estimated potential fatal casualty savings are shown in Table 6-7.
This analysis assumes that helmets are worn correctly and that all of the fatal head injuries were due to an impact with a part of the head that would be covered by the helmet. This assumption is likely to overestimate the potential casualty saving because some fatal accidents reported in the literature review were due to impacts below the level of the helmet.
The majority of the ‘run over’ casualties in this analysis were involved with collisions with HGVs. The sample of accidents used in this analysis is biased towards accidents occurring in London and it is considered that fatal accidents with HGVs are over-represented in this region. If the proportion of these accidents was lower in a nationally representative sample, then the proportion of other accident types would increase, which would increase the cycle helmet effectiveness estimate given above.
It should also be noted that it is most unlikely that any fatal head injuries mitigated by a cycle helmet would be mitigated from fatal to slight or no injury, so a reduction in fatal injuries is unlikely to change KSI statistics. With these caveats, and based on a sample that is known to over-represent cycle accidents in London, the estimated potential fatal cyclist casualty saving is between 10% and 16%. If only single-vehicle cycle accidents are considered, the estimated potential fatal cyclist casualty saving is 8%. These estimates are believed to be conservative because helmets are not effective in run-over accidents, which are over-represented in this sample, due to the London bias.

Published Project Report
TRL 38 PPR446
Table 6-7: Estimate of the possible fatality savings due to the use of cycle helmets
Number of Fatalities Estimated effectiveness (%)
Estimated potential casualty saving
Fatality due to non-head injury
44 0 0
Fatal head injury whilst wearing a helmet
3 0 0
Fatal head injury due to impact with a vehicle
31 10-30 3 - 9
Fatal head injury due to impact with the ground
17 50 9 (8%)
Fatal head injury due to run over / caught under vehicle
11 0 0
Fatal head injury due to multiple causes
7 0 0
Total 113 12 - 18 (10% to 16%)
6.3 Summary of Findings
For the HES data it was not possible to state categorically the proportion of casualties which would have been prevented if all had worn cycle helmets, rather a target population was identified, or the proportion of casualties for whom a cycle helmet could have been beneficial.
An in-depth review of the head injuries suffered by cyclists who were admitted to hospital in England identified that 10% sustained serious cranium fracture and/ or intracranial injuries. The majority of this group (7% of the total) only sustained these injuries and had no other head or other body region trauma. Therefore, if cycle helmets had been worn, a proportion of this 7% may not have required hospital treatment at all.
A further 20% of cyclists sustained ‘open wounds to the head’, some of which are likely to have been to a part of the head that a cycle helmet may have mitigated or prevented.
A forensic case by case review of over 100 British police cyclist fatality reports highlighted that between 10 and 16% of the fatalities could have been prevented if they had worn a cycle helmet (assuming an effectiveness of between 10 and 50%).

Published Project Report
TRL 39 PPR446
7 Conclusions Assuming that they are a good fit and worn correctly, cycle helmets should be effective at reducing the risk of head injury, in particular cranium fracture, scalp injury and intracranial (brain) injury.
• Cycle helmets would be expected to be effective in a range of accident conditions, particularly:
o the most common accidents that do not involve a collision with another vehicle, often simple falls or tumbles over the handlebars; and also
o when the mechanism of injury involves another vehicle glancing the cyclist or tipping them over causing their head to strike the ground.
• A specialist biomechanical assessment of over 100 police forensic cyclist fatality reports, predicted that between 10 and 16% of the fatalities could have been prevented if they had worn an appropriate cycle helmet.
• Of the on-road serious cyclist casualties admitted to hospital in England (HES database):
o 10% suffered injuries of a type and to a part of the head that a cycle helmet may have mitigated or prevented; and a further
o 20% suffered ‘open wounds to the head’, some of which are likely to have been to a part of the head that a cycle helmet may have mitigated or prevented.
• Cycle helmets would be expected to be particularly effective for children, because:
o the European Standard (EN 1078) impact tests and requirements are the same for adult and child cycle helmets, both use a 1.5 m drop height test; and so
o given that younger children are shorter than older children and adults, their head height would be within the drop height used in impact tests so a greater proportion of single-vehicle accidents are likely to be covered by the Standard for children.
• No evidence was found for an increased risk of rotational head injury with a helmet compared to without a helmet.
• In the literature reviewed, there is a difference between hospital-based studies, which tend to show a significant protective effect from cycle helmets, and population studies, which tend to show a lower, or no, effect. Some of the reasons behind this were due to:
o the lack of appropriateness of the control groups used; and
o limitations in the available data, such as knowledge of helmet use and type of head injury.


Published Project Report
TRL 41 PPR446
References
Aare M and Halldin P (2003). A new laboratory rig for evaluating helmets subject to oblique impacts. Traffic Inj Prev 4(3). 240-248.
Abu-Zidan FM, Nagelkerke N and Sudhakar R (2007). Factors affecting severity of bicycle-related injuries: the role of helmets in preventing head injuries. Emergency Medicine Australasia, 19, 366–371.
Adams, JGU (1985). Risk and freedom – the record of road safety regulations. Nottingham, UK: Bottesford Press.
Adams J and Hillman M (2001). The risk compensation theory and bicycle helmets. Injury Prevention, 7, pp.89-91.
ASTM (2006). ASTM F1447:2006 - Standard specification for helmets used in recreational bicycling or roller skating. West Conshohocken, United States: American Society for Testing of Materials.
Attewell RG, Glase K and McFadden M (2001). Bicycle helmet efficacy: a meta-analysis. Accident Analysis and Prevention, 33(3), pp.345-352.
Becker E (1998). Helmet Development Standards. In N. Yoganandan, F. Pintar, S. Larson and A. J. Sances, Frontiers in Head and Neck Trauma: Clinical and Biomechanical. Amsterdam: IOS Press.
Berg P and Westerling R (2007). A decrease in both mild and severe bicycle-related head injuries in helmet wearing ages - trend analyses in Sweden. Health Promot Int. 2007 Sep;22(3):191-7.
British Standards Institution (1997). BS EN1078 ‘Helmets for pedal cyclists and for users of skateboards and roller skates’ (amended 2006). London, United Kingdom: BSI.
British Standards Institution (1997). BS EN1080 ‘Impact protection helmets for young children’ (amended 2006). London, United Kingdom: BSI.
Burdett A (2004). Effectiveness of cycle helmets and the ethics of legislation. Journal of the Royal Society of Medicine, 97(10), pp.503.
Canadian Standards Association (1989). CAN/CSA-D113.2-M89 ‘Cycling helmets’ (Reaffirmed 2004). Toronto, Canada: CSA.
Cheng J and Reichert K (1998). Adult and Child Head Anatomy. In N. Yoganandan, F. Pintar, S. Larson and A. J. Sances, Frontiers in Head and Neck Trauma: Clinical and Biomechanical. Amsterdam: IOS Press.
Christmas S, Young D and Cuerden R (2008). Strapping Yarns: Why people do and do not wear seat belts. Road Safety Research Report No. 98. Department for Transport. London. ISBN 978 1 906581 43 5
Consumer Product Safety Commission (1998). CPSC 16CFR1203 ‘Safety standard for bicycle helmets: final rule’. United States: CPSC.
Cook A and Sheikh A (2003). Trends in serious head injuries among English cyclists and pedestrians. Inj Prev. 2003 Sep;9(3):266-7.
Curnow W (2003). The efficacy of bicycle helmets against brain injury. Accident Analysis and Prevention 35(2). 287-292.
Curnow WJ (2005). The Cochrane collaboration and bicycle helmets. Accident Analysis and Prevention, 37(3), pp.569-573.
Curnow WJ (2007). Bicycle helmets and brain injury. Accident Analysis and Prevention, 39(3), pp.433-436.

Published Project Report
TRL 42 PPR446
Davidson JA (2005). Epidemiology and outcome of bicycle injuries presenting to an emergency department in the United Kingdom. European Journal of Emergency Medicine, 12(1).
Department for Transport (2007). Road Accidents Great Britain: 2007 - Annual Report. TSO. Available from www.dft.gov.uk/pgr/statistics.
Depreitere B, Van Linde C, Maene S, Plets C, Sloten JV, Van Audekercke R, Van der Perre G and Goffin J (2004). Bicycle-related head injury: a study of 86 cases. Accident Analysis and Prevention, Vol. 36, 561–567.
Eid HO, Bashir MM and Abu-Zidan FM (2007). Bicycle-related injuries: a prospective study of 200 patients. Singapore Medical Journal, 48(10), 884.
European Commission (1989). ‘Council Directive 89/686/EEC of 21 December 1989 on the approximation of the laws of the Member States relating to personal protective equipment’.
Evans L (1991). Traffic Safety and the Driver. New York, Van Nostrand Reinhold.
Farley C, Laflamme L, Vaez M (2003). Bicycle helmet campaigns and head injuries among children. Does poverty matter? J Epidemiol Community Health. 2003 Sep;57(9):668-72.
Farris C, Spaite DW, Criss EA et al (1997). Observational evaluation of compliance with traffic regulations among helmeted and nonhelmeted bicyclists. Ann. Emerg. Med. 1997; 29: 625–9.
Finan J, Nightingale R and Myers B (2008). The influence of reduced friction on head injury metrics in helmeted head impacts. Traffic Inj Prev 9. 483-488.
Franklin, J (2003). Bicycle Helmet Effectiveness – A Broader Perspective: A Critique of DfT Road Safety Research Report No 30. Available from www.cyclehelmets.org.
Gennarelli T (1981). Mechanistic approach to head injuries: clinical and experimental studies of the important types of head injury. Head and Neck Injury Criteria: a Consensus Workshop. National Highway Traffic Safety Administration.
Gennarelli T (1985). The state of the art of head injury biomechanics. 29th Annual Conference of the American Association for Automotive Medicine, Washington DC, October 7-9, 1985. AAAM.
Gennarelli T and Thibault L (1982). Biomchanics of acute subdural hematoma. J Trauma 22(8). 680-686.
Gennarelli T, Wodzin E (2005). Abbreviated Injury Scale 2005. Association for the Advancement of Automotive Medicine.
Grant, D and Rutner, SM (2004). The Effect of Bicycle Helmet Legislation on Bicycling Fatalities. Journal of Policy Analysis and Management. 2004 Vol 23(3).
Hansen KS, Engesaeter LB and Viste A (2003). Protective effect of different types of bicycle helmets. Traffic Injury Prevention, 4, 285–290.
Harvey AC and Durbin J (1986). The effects of seat belt legislation on British road casualties: a case study in structural time series modelling. Journal of the Royal Statistical Society A149:187-227.
Henderson M (1995). The Effectiveness of Bicycle Helmets - a Review: Revised Edition. MAARE-010995. Sydney, NSW, Australia: Motor Accidents Authority of NSW.
Heng KWJ, Lee AHP, Zhu S, Tham KY and Seow E (2006). Helmet use and bicycle-related trauma in patients presenting to an acute hospital in Singapore. Singapore Medical Journal, 47(5), 367.
Hewson PJ (2005a). Investigating population level trends in head injuries amongst child cyclists in the UK. Accid Anal Prev. 2005 Sep;37(5):807-15.

Published Project Report
TRL 43 PPR446
Hewson PJ (2005b). Cycle helmets and road casualties in the UK. Traffic Inj Prev. 2005 Jun;6(2):127-34.
Hodgson V (1991). Skid Tests on a Select Group of Bicycle Helmets to Determine Their Head-Neck Protective Characteristics. Detroit, MI, USA: Gurdjian-Lissner Biomechanics Laboratory, Department of Neurosurgery, Wayne State University and the Society of Automotive Engineers, Inc.
Ho-Yin Lee B, Schafer JL and Koppelman FS (2005). Bicycle safety helmet legislation and bicycle-related non-fatal injuries in California. Accident Analysis and Prevention, 37(1), pp.93-102.
Jacobsen PL (2003). Safety in numbers: more walkers and bicyclists, safer walking and bicycling. Injury Prevention, 9, 205–209
Ji M, Gilchick RA and Bender SJ (2006). Trends in helmet use and head injuries in San Diego County: the effect of bicycle helmet legislation. Accid Anal Prev. 2006 Jan;38(1):128-34. Epub 2005 Oct 11.
Karkhaneh M, Kalenga JC and Hagel BE (2006). Effectiveness of bicycle helmet legislation to increase helmet use: a systematic review. Injury Prevention, 12(2), pp.76-82.
Karkhaneh M, Mohsen N, Rowe BH, Hagel BE, Jafari N and Saunders D (2008). Epideiology of bicycle injuries in 13 health divisions, Islamic Republic of Iran 2003. Accident Analysis and Prevention, 40, 192–199.
Kikuchi A, Ono K and Nakamura N (1982). Human head tolerance to lateral impact deduced from experimental head injuries using primates. 9th International Conference on Experimental Safety Vehicles, Kyoto, Japan, 1-4 November, 1982. US Department of Transportation, National Highway Traffic Safety Administration.
Kim JK, Kim S, Ulfarsson GF and Porrello LA (2007). Bicyclist injury severities in bicycle-motor vehicle accidents. Accid Anal Prev. 2007 Mar;39(2):238-51. Epub 2006 Sep 26.
Knowles J, Reid S, Cuerden R, Savill T, and Tight M (2009). Collisions involving Cyclists on Britain’s Roads: Establishing the Causes. Report Number PPR 445. Transport Research Laboratory: Crowthorne.
Kramer F and Appel H (1990). Evaluation of protection criteria on the basis of statistical biomechanics. International IRCOBI Conference, Bron, Lyon, France, 12-14 September, 1990. IRCOBI.
Liller KD, Nearns J, Cabrera M, Joly B, Noland V and McDermott R (2003). Children's bicycle helmet use and injuries in Hillsborough County, Florida before and after helmet legislation. Inj Prev. 2003 Jun;9(2):177-9.
Mackay GM (1985). Seat belt use under voluntary and mandatory conditions and its effect on casualties. In Evans L and Schwing RC, editors. Human behaviour and traffic safety. New York, NY: Plenum Press, p259-278.
Macpherson AK, To TM, Macarthur C, Chipman ML, Wright JG and Parkin PC (2002). Impact of mandatory helmet legislation on bicycle-related head injuries in children: a population-based study. Pediatrics. 2002 Nov;110(5):e60.
McGarry T and Sheldon R (2008). Cycle helmet wearing in 2006. London: Department for Transport.
McIntosh A and Dowdell B (1992). A field and laboratory study of the performance of pedal cycle helmets in real accidents. International IRCOBI Conference, Verona, Italy, 9-11 September, 1992. IRCOBI.
McIntosh A, Kallieris D, Mattern R and Miltner E (1993). Head and neck injury resulting from low velocity direct impact. 37th Stapp Car Crash Conference, San Antonio,

Published Project Report
TRL 44 PPR446
Texas, USA, 08th to 10th November, 1993. Society of Automotive Engineers, Warrendale, PA, USA, 43-57.
McIntosh A, Dowdell B and Svensson N (1998). Pedal cycle helmet effectiveness: a field study of pedal cycle accidents. Accid Anal Prev 30(2). 161-8.
Melvin J, Lighthall J and Ueno K (1993). Brain Injury Biomechanics. In A. Nahum and J. Melvin, Accidental Injury: Biomechanics and Prevention. New York: Springer-Verlag.
Mertz H (1985). Biofidelity of the Hybrid III head. In S. Backaitis and H. Mertz, Hybrid III: The First Human-Like Crash Test Dummy. PT-44. Warrendale, PA, USA: Society of Automotive Engineers, Inc.
Meuleners LB, Lee AH and Haworth C (2007). Road environment, crash type and hospitalisation of bicyclists and motorcyclists presented to emergency departments in Western Australia. Accident Analysis and Prevention, 39, 122-1225.
Mills N and Gilchrist A (1990). The effectiveness of foams in bicycle and motorcycle helmets. 34th Annual Conference of the Association for the Advancement of Automotive Medicine Scottsdale, Arizona, October 1 -3, 1990. AAAM.
Mills N and Gilchrist A (2006). Bicycle helmet design. Proceedings of the IMechE Part L: J. Materials: Design and Applications 220. 167-180.
Mills N and Gilchrist A (2008). Oblique impact testing of bicycle helmets. International Journal of Impact Engineering 35. 1075-1086.
Mills N, Wilkes S, Derler S and Flisch A (2009). FEA of oblique impact tests on a motorcycle helmet. International Journal of Impact Engineering In press manuscript available from the IJImpEng web site. doi: 10.1016/j.ijimpeng.2008.12.011.
Moore K (1985). Clinically Oriented Anatomy. Baltimore, USA: Williams and Wilkins, Second edition.
Morrongiello BA, Walpole B and Lasenby J (2008). Understanding children’s injury-risk behaviour: Wearing safety gear can lead to increased risk taking. Accident Analysis and Prevention 39. 618-623.
Newman J (1986). A generalized acceleration model for brain injury threshold (GAMBIT). International IRCOBI Conference, Zurich, Switzerland, 2-4 September, 1986. IRCOBI.
Newman J (1993). Biomechanics of Human Trauma: Head Protection. In A. Nahum and J. Melvin, Accidental Injury: Biomechanics and Prevention. New York: Springer-Verlag.
Newman J (1998). Kinematics of Head Injury. In N. Yoganandan, F. Pintar, S. Larson and A. J. Sances, Frontiers in Head and Neck Trauma. Amsterdam: IOS Press.
Newman J, Barr C, Beusenberg M, Fournier E, Shewchenko N, Welbourne E and Withnall C (2000). A new biomechanical assessment of mild traumatic brain injury. Part 2: results and conclusions. International IRCOBI Conference, Montpellier, France, 20-22 September, 2000. IRCOBI.
Noble B, Robinson D and Roebuck C (2007). The use of hospital data on road accidents. In: Road Casualties Great Britain 2006. Published September 2007. London: The Stationery Office.
Nolen S (2005). In: Swedish National Road and Transport Research Institute. Road Safety on Four Continents: 13th International Conference. Warsaw, Poland, 5-7 Oct, Swedish National Road and Transport Research Institute: Sweden.
Ommaya A and Gennarelli T (1974). Cerebral concussion and traumatic unconsciousness. Correlation of experimental and clinical observations of blunt head injuries. Brain 97(4). 633-654.

Published Project Report
TRL 45 PPR446
Ono K, Kikuchi A, Nakamura M, Kobayashi H and Nakamura N (1980). Human head tolerance to sagittal impact reliable estimation deduced from experimental head injury using subhuman primates and human cadaver skulls. 24th Stapp Car Crash Conference, Troy, Michigan, USA, 15-17 October, 1980. Paper number 801303. Society of Automotive Engineers, Warrendale, PA, USA.
Pedder J (1996). Bicycle helmets - are they up to standard? Injury Prevention 2(4). 250-251.
Peebles L and Norris B (1998). Adultdata: The handbook of adult anthropometric and strength measurements. Data for design safety. URN 98/736. Department of Trade and Industry: London.
Pincemaille Y, Trosseille X, Mack P, Tarriere C, Breton F and Renault B (1989). Some new data related to human tolerance obtained from volunteer boxers. 33rd Stapp Car Crash Conference, Washington, DC, USA, 4-10 October, 1989. Paper number 892435. Society of Automotive Engineers, Warrendale, Pennsylvania, USA.
Povey LJ, Frith WJ and Graham PG (1999). Cycle helmet effectiveness in New Zealand. Accident Analysis and Prevention, 31(6), pp.763-770.
Prasad P and Mertz H (1985). The position of the United States delegation to the ISO Working Group 6 on the use of HIC in the automotive environment. In S. Backaitis, Biomechanics of Impact Injury and Injury Tolerances of the Head-Neck Complex: PT-43. Society of Automotive Engineers, first edition.
Rivara FP, Astley SJ, Clarren SK, Thompson DC and Thompson RS (1999). Fit of bicycle helmets and risk of head injuries in children. Injury Prevention, 5(3), pp.194-197.
Robinson DL (1996). Head injuries and bicycle helmet laws. Accident Analysis and Prevention, 28(4), pp.463-475.
Robinson DL (2001). Changes in head injury with the New Zealand bicycle helmet law. Accident Analysis and Prevention, 33(5), pp.687-691.
Robinson DL (2003). Confusing trends with the effect of helmet laws. Electronic letter (7 July 2003) in response to Pediatrics. 2002 Nov;110(5):e60.
Robinson DL (2004). Reasons for trends in cyclist injury data. Inj Prev. 2004 Apr;10(2):126-7.
Robinson DL (2006). No clear evidence from countries that have enforced the wearing of helmets. BMJ. 2006 Mar 25;332(7543):722-5.
Robinson DL (2007). Bicycle helmet legislation: Can we reach a consensus? Accident Analysis and Prevention, 39(1), pp.86-93.
Royal S, Kendrick D and Coleman T (2008). Promoting bicycle helmet wearing by children using non-legislative interventions: systematic review and meta-data. Child: Care, Health and Development, 34(1), pp.135.
Safety Standard for Bicycle Helmets; Final Rule (1998). 16 CFR Part 1203 (March 10, 1998), pp. 11711 - 11747.
Scott PP and Willis PA (1985). Road casualties in Great Britain the first year with seat belt legislation. Crowthorne, Berkshire, UK: Transport and Road Research Laboratory Report 9.
Scottish Executive (2005). Extent and Severity of Cycle Accident Casualties. Scottish Executive Social Research.
Scuffham P, Alsop J, Cryer C and Langley JD (2000). Head injuries to bicyclists and the New Zealand bicycle helmet law. Accident Analysis and Prevention, 32(4), pp.565-573.
Published Project Report
TRL 46 PPR446
Sharratt C, Walter LK and Anjum O (2009). Cycle helmet wearing in 2008. London: Department for Transport.
Snell Memorial Foundation (1990). Snell B90A ‘Standard for Protective Headgear for use in Bicycling’ (Augmented 1998). California, United States: Snell Memorial Foundation.
Snell Memorial Foundation (1995). Snell B95A ‘Standard for Protective Headgear for use with Bicycles’ (1998 addendum). California, United States: Snell Memorial Foundation.
Standards Australia, Standards New Zealand (1996). AS/NZS 2063:1996 ‘Pedal cycle helmets’. New South Wales, Australia: AS and Wellington, New Zealand: NZS.
Thibault L and Gennarelli T (1990). Brain injury: an analysis of neural and neurovascular trauma in the nonhuman primate. 34th Annual Conference of the Association for the Advancement of Automotive Medicine, Socttsdale, AZ, USA, 1-3 October, 1990. AAAM.
Thompson DC, Rivara FP and Thompson RS (1996). Circumstances and severity of bicycle injuries. Snell Memorial Foundation.
Thompson DC, Rivara FP and Thompson RS (1996). Effectiveness of bicycle safety helmets in preventing head injuries. Journal of the American Medical Association, 276(24), pp.1968-1973.
Thompson DC, Rivara FP and Thompson RS (1999). Helmets for preventing head and facial injuries in bicyclists. Cochrane Database of Systematic Reviews 1999, Issue 4.
Thompson DC, Thompson RS, Rivara FP and Wolf ME (1990). A case control study of the effectiveness of bicycle safety helmets in preventing facial injury. American Journal of Public Health, 80(12), pp.1471-1474.
Thompson NJ, Sleet D and Sacks JJ (2002). Increasing the use of bicycle helmets: lessons from behavioural science. Patient Education and Counselling, 46(3), pp.191-197.
Towner E, Dowswell T, Burkes M, Dickinson H, Towner J and Hayes M (2002). Bicycle helmets: a review of their effectiveness, a critical review of the literature. Road Safety Research Report No. 30. Department for Transport DfT, London.
Walker B (2005). Heads Up. Cycle. June/July, 2005.
Walker I (2006). Drivers overtaking bicyclists: Objective data on the effects of riding position, helmet use, vehicle type and apparent gender. Accident Analysis and Prevention, 39(2), pp.417-425.
Wardlaw MJ (2000). Three lessons for a better cycling future. British Medical Journal, (32), pp.1582-1585.
Wesson DE, Stephens D, Lam K, Parsons D, Spence L and Parkin PC (2008). Trends in Pediatric and Adult Bicycling Deaths Before and After Passage of a Bicycle Helmet Law. Pediatrics 2008 Vol 122(3):605-610.
Which? (1998). Get a Head Start. Which? Magazine. October, 1998.

Published Project Report
TRL 47 PPR446
Appendix A Comparison of Stats19 and HES Cyclist Casualty Data
Hospital Episode Statistics (HES) are collected in England as part of the funding mechanism for hospitals. HES data includes hospital admissions only, and so treatment in Accident and Emergency, by a GP or not requiring professional treatment are not included. Similar data is available for Wales and for Scotland.
Noble et al. (2007) compared pedal cycle casualties in England in 2005/2006 by accident type. Table 7-1 shows a comparison of cyclist HES data and all seriously3 injured cyclist casualties in Stats19 for the year 2005/2006 (both sets of data exclude deaths). Only 5% of serious cyclist casualties in Stats19 were single-vehicle accidents in which the cycle was the only vehicle involved. In contrast, single-vehicle accidents made up 60% of HES cyclist casualties. Noble et al. considered that this difference may be due to under-reporting of single vehicle cycle accidents to the police and possible inclusion of off-road accidents in the HES data (Noble et al. noted that if the location is not specified in the patient’s notes, it will be assumed that the accident was a traffic accident).
Twenty-three percent of cyclist accidents recorded in the HES database involved a car (or light goods vehicle), compared with 77% in Stats19. The total number of serious cyclist casualties is also far higher in the HES data, with approximately 7000 cases compared with approximately 2000 in Stats19.
Table 7-1: Pedal cyclist casualties by collision type: England 2005/2006 (from Noble et al., 2006)
HES Stats19
Collision type Number Percent Number Percent
No collisiona 4,268 60 101 5
Collision withb: 2,186 31 1,899 91
Object 242 3 100 5
Pedestrian / animal 34 0 4 0
Cyclist 89 1 12 1
Motorcycle 50 1 42 2
Car / LGV 1,592 23 1,616 77
HGV / Bus 102 1 109 5
Other vehicle 77 1 16 1
Totalc 7,065 100 2,092 100
a HES: Fall or thrown from pedal cycle (without antecedent collision), STATS19: Single vehicle accidents, no pedestrian/animal, no object hit.
b STATS19: If a pedal cyclist has been recorded as colliding with an object and is involved in an accident with another vehicle, only the collision with the object will be shown here.
c Includes accidents in which it is unknown whether the pedal cyclists collided with a vehicle or object.
3 Police-reported ‘Serious’ injuries in Stats19 include: fracture; internal injury; severe cuts; crushing; burns (excluding friction burns); concussion; severe general shock requiring hospital treatment; detention in hospital as an in-patient, either immediately or later; injuries to casualties who die 30 or more days after the accident from injuries sustained in that accident.

Published Project Report
TRL 48 PPR446
The data in Table 7-1 indicates that serious injury cases from single-vehicle cycle accidents are underestimated in Stats19 by up to 97.6% and collisions with other objects by 13.1%, principally due to low recording of collisions between cyclists and pedestrians/animals, objects and other cyclists. The recording of serious injuries resulting from cyclist collisions with cars/LGVs and HGVs/buses is slightly higher in Stats19 than in the HES data.
When disaggregated by age, the biggest difference between HES and Stats19 was reported to be for children (aged 0-15 years), for whom there were six times as many admissions in HES as there were serious casualties recorded in Stats19 (see Figure A.1). Seventy percent of the admissions in this age group were single vehicle accidents. The frequency of collision-only accidents (see note 2 above) was very similar across all age groups. For adults (aged 16 and over), there were approximately 2.6 times as many HES admissions as serious casualties in Stats19.
0-4 5-7 8-11 12-15 16-19 20-29 30-39 40-49 50-59 60-69 70-79 80+HES 167 455 1003 1249 584 815 808 724 588 359 237 75STATS19 8 42 146 271 156 373 366 300 194 111 60 15
0
500
1,000
1,500
Age band
Admissions / Seriously injured casualties
Figure A.1: All pedal cyclist road traffic casualties by age: England 2005/2006 (reproduced from RCGB 2007)
For accidents involving a collision with another object (such as a car, HGV, pedestrian, animal, or fixed object), there was very little difference between Stats19 and HES data for adults (see Figure A.2). For children 0-16 years there were 1.35 times as many cases recorded in HES compared with Stats19.
The HES data also showed the body regions injured by collision type. Head and/or face injuries were recorded for 35% of single-vehicle accidents, 49% of accidents involving a collision with a motor vehicle, and 48% of collisions with another object. In total, 39% of cyclist admissions had an injury to the head and/or face. Single-vehicle accidents tended to result in slightly shorter admission periods than collisions with motor vehicles or other objects.

Published Project Report
TRL 49 PPR446
0-4 5-7 8-11 12-15 16-19 20-29 30-39 40-49 50-59 60-69 70-79 80+HES 15 87 205 303 182 319 306 289 225 143 86 25STATS19 8 41 144 258 150 356 351 280 182 103 55 15
0
100
200
300
400
500
Age band
Admissions / Seriously injured casualties
Figure A.2: Collision-only (not single-vehicle) pedal cyclist road traffic casualties by age: England 2005/2006 (reproduced from RCGB 2007)


Technical Annex
TRL 51 PPR446
Appendix B Literature Review Method
B.1 Introduction
A literature review was undertaken to identify what is already known about collisions involving cyclists. The review consisted of the following phases:
1. Searching of published and unpublished literature; 2. Grading of literature; 3. Analysis of literature; and 4. Reporting.
Each of the phases will be described in more detail below.
B.2 Searching of published literature
Published literature was searched using the following methods: • Searches using databases held by TRL and ITS Leeds; • Web-based search tools (e.g. Google and Google Scholar); • By direct approaches to stakeholders (as part of the wider stakeholder engagement
process being undertaken); and • By direct approaches to other known sources of cycle-related literature.
The following databases were interrogated by TRL:
• The International Transport Research Database (ITRD) – which holds over 15,000 documents relating to cycling;
• The Transportation Research Information Services (TRIS) database – holding over 700,000 documents (mainly international) relating to all transportation modes and disciplines;
• Ingenta Connect – an online resource with a comprehensive collection of academic and professional publications;
• ScienceDirect - an online resource focussing on scientific, technical and medical information with almost 9 million articles; and
• PubMed – reference database containing several million records covering life sciences and biomedical research.
The following databases were interrogated by ITS Leeds:
• Scopus – an abstract and citation database of research literature and quality web sources with many millions of records; and
• Web of Science - an online resource with a comprehensive collection of academic and professional publications.

Tech
nical A
nnex
TRL
52
PPR
446
'Types' AND
'Users' O
R'Vehicle' O
R'Safety' O
R'Equipm
ent' OR
'Behaviours' O
R'Surfacing' O
R'Infrastructure' O
R'O
ther'B
icycleC
hildH
GV
SafetyH
elmet
AttitudeS
urfaceInfrastructure
Weather
Cycle
AdultG
oods VehicleC
asualtyEquipm
entBehaviour
SurfacingD
esignD
arkBike
LeisureLorry
InjuryVisibility
TrainingM
aintenanceIntervention
Night
Cyclist
Com
mute
KSIR
eflectiveEnforcem
entPothole
PinchpointG
radientB
ikerC
omm
uterD
eathLights
EducationPot hole
Pinch pointN
umber of cyclists
Cycling
Disabled
FatalityBell
Involvement
Pavement
ASLPedestrian
PO
BAccident
LegislationAdvanced stop line
Rural
IncidentA
lcoholM
andatoryLane
Urban
Collision
Mobile phone
AbilityPath
Crash
Drug(s)
Reporting
FacilityIm
pactU
nder-reportingS
hared useC
ontributoryH
ighway C
odeSM
IDSY
SignSeverity
BehaviorSignage
Deform
ationSpeed
Toucan H
eadSpeeding
Crossing
EffectivenessC
ritical mass
SegregationProtection
Confidence
PriorityE
xposurePerception
Bus laneC
onspicuity20m
ph zoneVulnerable
Hom
e zoneR
iskC
alming
BodyTraffic C
alming
Crush
Speed limit
Limb
Chicanes
Limbs
RLJ
BrokenLighting
Slight
Invisible (infrastructure)G
razeKerbJunctionATSA
utomatic traffic signal
Shared spaceN
aked street

Technical Annex
TRL 53 PPR 446
B.3 Search of unpublished literature
Unpublished literature was sought through the following means: • Searching TRL's in-house database of unpublished reports; • Web-based searches (e.g. Google) of non-academically published data, analysis,
and reports; • Requesting relevant material from the project’s Advisory Group members, using
their extensive knowledge of key articles, ongoing work and views on where the project should be taken, and why;
• Consultation with other stakeholders; and • Discussions with key contacts overseas.
A reduced set of search terms were used where appropriate to constrain potentially large numbers of search results.
B.4 Grading of literature
The grading of literature found in the published and unpublished searches was undertaken to select only those articles which were directly relevant to cycle helmets and head injury safety. A 'filtering' methodology was set up as a consistent and quick means of selecting the search results based on three criteria:
• Relevance; • Quality; and • Timeliness.
Each criteria rating used a three-level rating – high, medium, and low. The combined ratings for relevance, quality, and timeliness were then compared against a 'priority matrix' which enabled a decision to be made whether to investigate the piece of research further by requesting the full article. Using this 'priority matrix' ensured that there was a consistent and transparent process for selecting articles.
B.5 Relevance
Relevance was interpreted to mean: "Does the publication present any evidence, and is it likely to be relevant to UK practice?" The three-level rating system was as follows:
• High – highly and directly relevant to cycle helmets, with primary data referred to in the abstract text – essential reading;
• Medium – generally relevant to cycle helmets – only to be followed-up further if time permits; and
• Low – accidental connection only to cycle helmets – do not follow-up further. This rating was based on an analysis of the abstract text contained in the search results; if no abstract was present then the article title was used.
B.6 Quality
Quality was interpreted to mean: "Is the publication peer reviewed or from a trusted source and does its methodology and sampling appear robust?" The three-level rating system was as follows:
• High – from an internationally recognised and peer-reviewed source; • Medium – from an academic journal or book (unknown / uncertain review process)
or from a conference/symposium (international scope, invitation-only, etc); and

Technical Annex
TRL 54 PPR 446
• Low – from conference proceedings (general, open-to-all events), general discussion papers etc.
This rating was based on analysis of the article's source and, if appropriate, abstract text. Articles that were conference proceedings were classified as 'medium' if there was any doubt about their review process.
B.7 Timeliness
Timeliness refers to when the article was published. The three-level rating system was as follows:
• High – published in 2005 onwards; • Medium – published in any year between 1999 and 2004 inclusive; and • Low – published earlier than 1999.
This rating was based on analysis of the abstract's year of publication, as opposed to the date of any data referred to in the article's title or abstract text. If particular articles appeared to be (or where known to be) particularly important and still relevant then they were coded with an enhanced rating.
B.8 International Papers
Each article was also classified based on whether it contained UK or international experience / evidence which ensured that the UK-specific articles were selected for detailed review.
B.9 Priority Matrix
The three ratings for relevance, quality, and timeliness were then referenced against a 'priority matrix' to determine whether the full article should be reviewed in more detail. There were separate matrices for UK-specific and International articles as shown in Figure B.1 and Figure B.2.
Figure B.1 UK Priority Matrix
"TIM
ELIN
ES
S"
HIG
H
MED
IUM
LOW
"RELEVANCE"
"QU
ALITY
"HIGH
MEDIUM
LOW
"TIM
ELIN
ES
S"
HIGH
MEDIUM
LOW
X
X
XX
X

Technical Annex
TRL 55 PPR 446
Figure B.2 International Priority Matrix
From the UK matrix it can be seen that: • All abstracts rated as High Relevance (RH) are to be read, including those which
are Low Timeliness (TL), but excluding those which are Low Quality (QL): • Similarly, all abstracts rates as Medium Relevance (RM) are to be read, including
those which are Low Timeliness (TL), but excluding those which are Low Quality (QL);
• All abstracts rated as Low Relevance (RL) are to be discarded; and • All abstracts rated as Low Quality (QL) are to be discarded.
From the International matrix it can be seen that only those articles rated as High Relevance (RH) and High Quality (QH) are to be read, excluding including those which are Low Timeliness (TL). This restriction on relevance and quality ensured that only those international articles which contained reference to primary data / evidence and were clearly peer-reviewed were selected.
"TIM
ELIN
ES
S"
HIG
H
MED
IUM
LOW
"RELEVANCE"
"QU
ALITY
"HIGH
MEDIUM
LOW
"TIM
ELIN
ES
S"
HIGH
MEDIUM
LOW
X
X
X
X
X
XX
X


Technical Annex
TRL 57 PPR 446
Appendix C Cycle Helmet Standards
C.1 Introduction
This appendix summarises the key points of the major cycle helmet standards from around the world. Firstly, an overview of the main legal requirements in force is given. Typically, these reference one or more existing standards as demonstrating suitable performance for a cycle helmet. The current standards from regions where cycle helmet effectiveness studies have been reported are then summarised. This provides a context for the review of cycle helmet effectiveness studies (in Section 3).
The review of standards also provides a basis for comparing the expected performance of helmets with the types and distribution of accidents reported in the companion report from this project (Knowles et al., 2009) and the in-depth review of selected accident cases (see 0).
C.2 Summary of Cycle Helmet Standards
Most cycle helmet regulations, including those in force in the UK, require helmets to meet the requirements of an existing standard; that is, the regulation does not itself define the requirements that the helmet must meet. As a result, the main standards referred to in regulations were reviewed.
The following sections give an overview of eight of the most common bicycle helmet standards currently in use around the world. An additional six standards were identified: four of these were superseded by the CEN EN1078 standard (BS 6863 of Britain, DIN 33954 of Germany, KOV 1985:6 of Sweden and BFU R 8602 of Switzerland); the ANSI Z90.4 standard of the United States was superseded by the ASTM F1447 standard; and the Japanese JIS T 8134 standard, which is understood not to be in wide use.
While each standard has its own specific requirements and methods, the majority of test programmes generally involve the following tests: impact tests, a retention system strength test, and a retention system stability test. The following sections summarise the requirements, similarities and differences between each of the standards reviewed, with additional detail in Table 7-4 to Table 7-11.
Most cycle helmet standards note that helmets are designed to protect the head, but that they cannot mitigate against injury in all circumstances. For instance, EN 1078:1997 notes that: ‘The protection given by a helmet depends on the circumstances of the accident and wearing a helmet cannot always prevent death or long term disability’. The EN standard also includes requirements on the manufacturer to provide clear information with every helmet that the helmet can only protect if it fits well, is correctly positioned and the straps correctly adjusted.
Some standards include requirements for periodic testing of production helmets to improve the confidence that every helmet sold will meet the performance requirements. Some, such as the Snell standards, include on-going random sample testing of products purchased from retailers, while others require the manufacturer to test samples from each batch of helmets produced. Furthermore, some standards are reviewed periodically at set intervals, while others are updated on an ad hoc basis.
Many standards also recommend that helmets are manufactured in certain colours, for example in the yellow or orange spectrum, to improve conspicuity.
This section gives an overview of the following standards and regulatory requirements:
• AS/NZS 2063:1996;
• ASTM F1447:2006;

Technical Annex
TRL 58 PPR 446
• CPSC 16 CFR 1203:1998;
• EN 1078:1997 (incorporating Amendment No. 1 Nov 2005);
• EN 1080:1997 (incorporating Amendment Nos. 1 and 2 Dec 2005);
• Snell B-90A and B-90C; and
• Snell B-95 (including 1998 addendum).
C.2.1 AS/NZS 2063
The bicycle helmet standard of the Joint Standards Australia / Standards New Zealand Committee was introduced in 1996 and is mandatory within Australia and New Zealand.
Impact Tests: The AS/NZS 2063 standard only uses a flat anvil drop test from a height of 1.5 m. This is approximately equivalent to an impact velocity of 5.4 m.s-1 and an impact energy level of 78 J. The peak headform acceleration in this test is not allowed to exceed 300 g. Unusually, the AS/NZS standard also requires the 3 ms exceedance headform acceleration not to exceed 200 g and 6 ms exceedance acceleration not to exceed 150 g. There is also a unique load distribution test in which the helmet is dropped from 1.0 m; the helmet must not create a force greater than 500 N over a circular area of 100 mm2. Although the impact energy of the tests is relatively low, these additional requirements mean that the standard is well regarded.
Retention System Strength Tests: The retention system is subjected to a preliminary force of 225 ±5 N applied for 30 s and then an additional force of 500 ±5 N is applied for 120 s. The retention system or its attachments must not separate and the elongation between the preliminary load and the test load must not exceed 25 mm.
Retention System Stability Tests: Dynamic test with an inertial hammer; tested by applying a force parallel to the helmet edge from the opposite end.
C.2.2 ASTM F1447
This voluntary bicycle helmet standard was produced by the American Society for Testing and Materials (ASTM). While it is technically still in use it has since been superseded by the mandatory (in the US) CPSC standard. It was last updated in 2006 (a slight editorial change).
Impact Tests: The ASTM F1447 standard involves a drop test onto three different anvils: flat, hemispherical and kerbstone. These drops are performed at velocities of 6.2 m.s-1 on the flat anvil, and 4.8 m.s-1 on the hemispherical and kerbstone anvils, which is approximately equivalent to drop heights of 2.0 m and 1.2 m respectively. The peak headform acceleration must not register more than 300 g in either test condition.
Retention System Strength Tests: The retention system strength test is performed with an inertial hammer suspended from the straps of the helmet. The mass of the hammer is 4 kg and the fall length is 600 mm, which results in an energy of about 24 J. The straps must not elongate more than 30 mm.
Retention System Stability Tests: The retention system stability test is performed by attaching an inertial hammer of 4 kg mass to the opposite edge of the helmet on an inclined headform, and dropping the mass. The helmet is permitted to move on the headform, however it should not come off.
Further details may be found in Table 7-5.

Technical Annex
TRL 59 PPR 446
C.2.3 CAN/CSA-D113.2-M89
The bicycle helmet standard of the Canadian Standards Association (CSA) was originally introduced in 1989, last updated technically updated in 1996, and reaffirmed in 2004.
Impact Tests: The CSA-D113.2-M drop test is performed onto two types of anvil: flat and cylindrical. The drops are performed so that the impact energies are 80 J and 55 J respectively for child and adult helmets. This is approximately comparable to drop velocities of 5.7m.s-1 and 4.7 m.s-1 and drop heights of 1.66 and 1.13m. The same velocities are used with a smaller headform for helmets for children five years old and under, giving impact energies of up to 67 and 45 J for the two anvil types. For child and adult helmets the maximum headform accelerations are 250 g for the 80 J flat anvil test, 200 g for the 55 J flat anvil test, and 250 g for the 55 J cylindrical anvil test. For younger child helmets the limits are 200 g for the flat anvil tests and 150 g for the cylindrical anvil. The standard also recommends that manufacturers ensure that the Gadd Severity Index is less than 1500 for all tests.
Retention System Strength Tests: The retention system strength test is performed by dropping a 2 kg weight attached to the helmet from a height such that 20 J of energy is imparted to the helmet (approximately 1.02 m). Dynamic elongation must not exceed 25 mm and post-test static elongation must not exceed 12 mm.
Retention System Stability Tests: The retention system stability test is performed by subjecting the helmet to a 250 N tangential force for 5 seconds, if the helmet moves more than 10 mm during this time then the force is continued for another 5 seconds. Helmet rotation must not exceed 45o.
Further details may be found in Table 7-6.
C.2.4 CPSC 16 CFR 1203:1998
This bicycle helmet standard was produced by the Consumer Product Safety Commission (CPSC). The standard was developed in conjunction with ASTM and the test procedures are largely similar to the F1447 standard. It was introduced in 1998 and was made compulsory in 1999. The standard is part of the US Code of Federal Regulations and as such is a legal requirement in all US States. The CPSC standard is very similar to the ASTM F1447 standard.
Impact Tests: The drop test uses three different anvils: flat, hemispherical and kerbstone. These drops are performed at velocities of 6.2 m.s-1 on the flat anvil, and 4.8 m.s-1 on the hemispherical and kerbstone anvils. These velocities are approximately equivalent to drop heights of 2.0 m and 1.2 m respectively. The instrumented headform must not register more than 300 g acceleration throughout each test.
Retention System Strength Tests: The retention system strength test is performed with an inertial hammer suspended from the straps. The hammer mass is 4 kg and the fall length is 600 mm, which results in a fall energy of about 24 J. The straps must not elongate more than 30 mm.
Retention System Stability Tests: The retention system stability test is performed by attaching an inertial hammer of 4 kg mass to the opposite edge of the helmet on an inclined headform, and dropping the mass. The helmet is permitted to move on the headform, but it must not come off.
The CPSC standard requires helmets for children under the age of five to cover a larger proportion of the head than helmets for older children and adults. The Snell B-90 and B-95 standards were updated to match these coverage requirements for children under five in 1998.
The CPSC standard also requires manufacturers to implement a ‘reasonable testing programme’ to ensure that products meet the certification requirements. This testing may be conducted by a third party, but the manufacturers and importers are responsible

Technical Annex
TRL 60 PPR 446
for ensuring that samples from each production lot are compliant with the standard or a reasonable testing programme. CPSC will test for compliance to the standard. There are also specific requirements for record-keeping for helmet tests.
Further details may be found in Table 7-7.
C.2.5 EN 1078 and EN 1080
EN 1078 and 1080 are the bicycle helmet standards produced by the European Committee for Standardisation (CEN), and were introduced in 1997 in all CEN member states.4 EN 1078 applies to helmets for children and adults; EN 1080 applies specifically to helmets for young children.
Impact Tests: The impact test requirements are identical for both standards and involve two anvils: flat and kerbstone. These tests are performed at velocities of 5.42 and 4.57 m.s-1 respectively, which correspond roughly to drop heights of 1.5 and 1.06 m.
Retention System Strength Tests: EN 1078 tests the strength of the retention system with an inertial hammer suspended from the straps. The hammer mass is 10 kg and the fall length is 600 mm, which results in a fall energy of about 24 J. The straps must not elongate more than 35 mm dynamically and the residual extension must not exceed 25 mm. It must be possible to operate the fastening system with one hand while under load. In contrast, EN 1080 requires that the fastening system should self-release when a force of greater than 90 N but less than 160 N is applied quasi-statically. This is designed to prevent strangulation by ensuring that the strap will release if the helmet becomes trapped, for instance in playground equipment.
Retention System Stability Tests: EN 1078 tests the stability of the helmet and retention system by attaching an inertial hammer of 10 kg mass and 250 mm drop height to the opposite edge of the helmet. The helmet is permitted to move on the headform, but it should not come off the headform. EN 1080 does not define a stability test.
EN 1078 and 1080 contain no conformity of production requirements.
Further details may be found in Table 7-8 and Table 7-9.
C.2.6 Snell B-90A B-90C 1998
Snell B-90 bicycle helmet standard is produced by the Snell Memorial Foundation. The B90 standard (introduced in 1990) was for a short time the foremost standard within the helmet industry; however, after criticism of it being too harsh and encouraging overly stiff helmets it has become less widely used.
Impact Tests: The Snell B90 drop tests involve 3 different anvils; flat, kerbstone and hemispherical. These drops are performed at impact energies of 100 J, 58 and 65 J respectively. These are approximately equivalent to impact velocities of 6.33 m.s-1, 4.81 m.s-1 and 5.17 m.s-1.
Retention System Strength Tests: The retention system strength test is performed with an inertial hammer suspended from the straps. The hammer mass is 4 kg and the fall length is 600 mm, which results in a fall energy of about 24 J. The straps must not elongate more than 30 mm.
Retention System Stability Tests: The retention system stability test is performed by attaching an inertial hammer of 4 kg mass to the opposite edge of the helmet on an inclined headform, and dropping the mass 600 mm. The helmet is permitted to move on the headform but it should not come off.
4 CEN members are the national standards bodies of Austria, Belgium, Cyprus, Czech Republic, Denmark, Estonia, Finland, France, Germany, Greece, Hungary, Iceland, Ireland, Italy, Latvia, Lithuania, Luxembourg, Malta, Netherlands, Norway, Poland, Portugal, Slovakia, Slovenia, Spain, Sweden, Switzerland and the United Kingdom.

Technical Annex
TRL 61 PPR 446
Snell periodically tests helmets intended for the consumer (e.g. bought from a retailer) to ensure on-going compliance with the standard.
Further details may be found in Table 7-10.
C.2.7 Snell B-95
The Snell B-95 standard introduced in 1995 more severe impact requirements than the B-90 Standard. The impact energies are 110 J, 72 J and 72 J for the flat, kerb and hemispherical anvils respectively (up from 100 J, 58 J and 65 J respectively).
Snell B-95 contains an addendum that updates both Snell B-90:1998 and Snell B-95 to incorporate the CPSC requirements for helmets intended for use by children from one up to five years old. Primarily, this updates the extent of protection and field of view requirements to match the CPSC requirements.
Snell periodically tests helmets intended for the consumer (e.g. bought from a retailer) to ensure on-going compliance with the standard.
Further details may be found in Table 7-11.
C.3 Cycle Helmet Retention and Stability Tests
Most of the retention and stability tests are also generally similar in intent and method. Retention and stability are important considerations because a helmet that is dislodged during an accident cannot provide the intended protection. The area of the head that is required to be covered by cycle helmets varies somewhat between different standards
C.4 Cycle Helmet Impact Tests
The impact test requirements are compared in Table 7-2. In terms of impact performance, there are some differences between the standards. The European standard EN 1078 and the Canadian standard CAN/CSA D113.2-M have the lowest peak head acceleration limit at 250 g, with all others having a limit of 300 g. However the impact energy is lower in the European and Canadian standards than in the other standards; the drop height onto a flat anvil in EN 1078 is 1.5 m compared with 2.0 to 2.2 m in the higher energy standards. These higher energy tests should ensure a performance at lower energies similar to that required by EN 1078, but the reverse is not true; helmets designed solely to EN 1078 may fail completely in higher energy tests. The relevance of cycle helmet impact tests to real-world accident conditions is considered in Section 4.
C.5 Cycle Helmet Coverage
Each of the standards summarised in Table 7-3 defines the area of the helmet that may be loaded in the impact tests. The helmet may extend below this line, subject to constraints on the field of view of the wearer and requirements not to block the hearing of the wearer.
The test area is generally similar for all of the standards. Most describe a stepped test line that is slightly higher at the front of the helmet and lower at the sides and rear. The AS/NZS standard describes a double-step in the coverage line for all helmets and a number of other standards use a double step for helmets for children five years and younger. The European standard EN 1078 defines a test line that is inclined at 10° to the horizontal and that is lower at the rear of the helmet than at the front.
The Canadian and Snell B-95 standards provide the greatest coverage. EN 1078 provides typical coverage at the front of the helmet and relatively poor coverage at the rear. The test area in EN 1078 is illustrated in Figure 7.3.
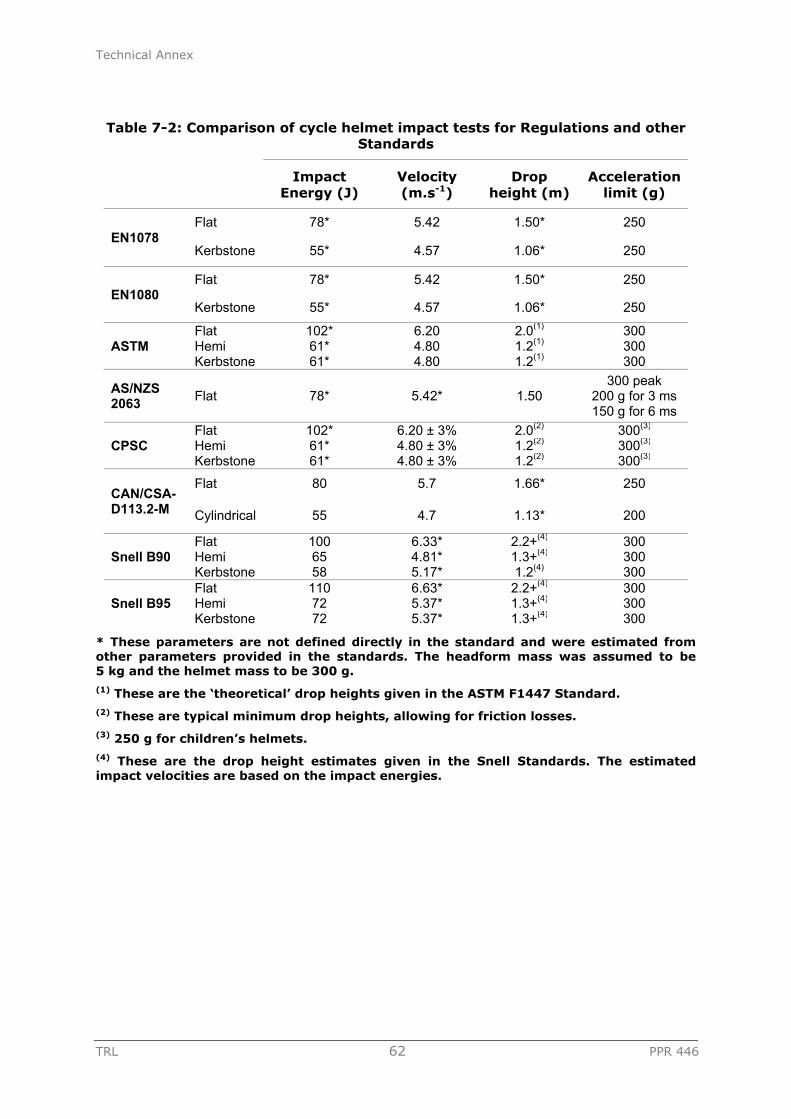
Technical Annex
TRL 62 PPR 446
Table 7-2: Comparison of cycle helmet impact tests for Regulations and other Standards
Impact
Energy (J) Velocity (m.s-1)
Drop height (m)
Acceleration limit (g)
EN1078 Flat 78* 5.42 1.50* 250
Kerbstone 55* 4.57 1.06* 250
EN1080 Flat 78* 5.42 1.50* 250
Kerbstone 55* 4.57 1.06* 250
ASTM Flat 102* 6.20 2.0(1) 300 Hemi 61* 4.80 1.2(1) 300 Kerbstone 61* 4.80 1.2(1) 300
AS/NZS 2063 Flat 78* 5.42* 1.50
300 peak 200 g for 3 ms 150 g for 6 ms
CPSC Flat 102* 6.20 ± 3% 2.0(2) 300(3) Hemi 61* 4.80 ± 3% 1.2(2) 300(3) Kerbstone 61* 4.80 ± 3% 1.2(2) 300(3)
CAN/CSA-D113.2-M
Flat 80 5.7 1.66* 250
Cylindrical 55 4.7 1.13* 200
Snell B90 Flat 100 6.33* 2.2+(4) 300 Hemi 65 4.81* 1.3+(4) 300 Kerbstone 58 5.17* 1.2(4) 300
Snell B95 Flat 110 6.63* 2.2+(4) 300 Hemi 72 5.37* 1.3+(4) 300 Kerbstone 72 5.37* 1.3+(4) 300
* These parameters are not defined directly in the standard and were estimated from other parameters provided in the standards. The headform mass was assumed to be 5 kg and the helmet mass to be 300 g. (1) These are the ‘theoretical’ drop heights given in the ASTM F1447 Standard. (2) These are typical minimum drop heights, allowing for friction losses. (3) 250 g for children’s helmets. (4) These are the drop height estimates given in the Snell Standards. The estimated impact velocities are based on the impact energies.

Technical Annex
TRL 63 PPR 446
Table 7-3: Comparison of cycle helmet coverage for Regulations and other Standards (J headform)
Front (mm) Middle (mm) Rear (mm) Type of coverage line
EN1078 68 - 48 10º slope
EN1080 - 10º slope
AS/NZS 2063 86 61 36 2 steps
ASTM 68.5 - 52.5 1 step
CAN/CSA-D113.2-M
52.5 - 32.5 1 step adult 2 steps ≤ 5
CPSC 68.5 - 54.5 1 step adult 2 steps ≤ 5
Snell B90 53.5 - 40.5 1 step
Snell B95 53 - 33 1 step adult 2 steps ≤ 5
Figure 7.3: Approximate relationship between EN 1078 test area and the skull

Technical Annex
TRL 64 PPR 446
Table 7-4: Summary of AS/NZS 2063:1996
Construction
Helmet materials Ideally made of durable material and not be harmed by exposure to sun, rain, dust, vibration, sweat or products applied to skin or hair. Materials known to cause skin irritation shall not be used. All metal parts should be corrosion resistant. Recommended that colour of shell should be white or in colours within the yellow to orange spectrum to aid conspicuity on the road
Coverage 86 mm above basic plane at front, stepping down to 61 mm above approx. one-third of way back, then stepping down to 36 mm above basic plane two-thirds of way back
Construction Should have no internal projection likely to cause injury during an impact. External projections not greater than 5 mm. Shall have features for ventilation purposes. Peripheral vision not less than 105º either side of the mid-sagittal plane and brow/peak of helmet shall be at least 25 mm above all points in the basic plane within the angle of peripheral vision clearance
Impact Tests
Impact sites Four sites above test line
Impact surfaces Flat Anvil: 125 mm minimum diameter
Impact velocities Flat Anvil: 5.42 m.s-1 (78 J); drop height 1.5 m
Requirements Max. acceleration: 300 g, or 200 g for 3 ms, or 150 g for 6 ms
Load distribution: Helmeted headform dropped 1 m. The load on a circular area of 100 mm2 shall not exceed 500 N and the anvil shall not contact the headform
No. helmets tested
Eight
Conditioning Ambient: 18-25ºC for 16-30 hours
Hot: 50±2ºC for 16-30 hours
Cold: -5±2ºC for 16-30 hours
Wet: fully immersed in water at 18-25ºC for 16-30 hours
Artificial ageing: None
Headform As specified by AS/NZS 2512.1. Assembly drop mass 3.5-6 kg depending on helmet size (medium = 5 kg)
Retention System Tests
Strength tests Static pull of 225 N for 30 seconds, followed by an additional force of 500 N applied for 120 seconds. Strap shall not fail or elongate more than 25 mm
Stability tests Hook to rear of helmet with J headform. Static pull of 50 N. After 15-30 seconds, helmet should not deflect enough to obscure or entirely expose a test band drawn around the head between the basic plane and 74 mm above the basic plane

Technical Annex
TRL 65 PPR 446
Table 7-5: Summary of ASTM F1447:1998
Construction
Helmet materials None that are known to be skin irritants
Coverage 68.5 mm above the basic plane at front, stepping down to 52.5 mm above basic plane two-thirds of way back
Construction No internal projections greater than 2 mm, except occipital stabilisers and foam fit pads
Impact Tests
Impact sites Four sites above test line
Impact surfaces Flat Anvil: 125 mm minimum diameter
Kerbstone Anvil: with two edges 52.5±2.5º to vertical and forming a striking area of radius 15±0.5 mm
Hemispherical Anvil: radius 48±1 mm
Impact velocities Flat Anvil: 6.2 m.s-1 (102 J); drop height 2 m
Kerbstone Anvil: 4.8 m.s-1 (61 J), drop height 1.2 m
Hemispherical Anvil: 4.8 m.s-1 (61 J), drop height 1.2 m
Requirements Maximum acceleration: 300 g
No. helmets tested
Eight of each size
Conditioning Ambient: 17-27ºC, relative humidity 20 to 80%
Hot: 50±3ºC, Relative humidity<25% for 4-24 hours
Cold: -15±2ºC for 4-24 hours
Wet: fully immersed in water at 17-27ºC for 4-24 hours
Artificial ageing: None
Headform Magnesium alloy to specification of ISO-DIS 6220:1983; 5±0.1kg including assembly
Retention System Tests
Strength tests Test energy 23.5 J. Extension of restraint system shall not exceed 30 mm when chin strap is exposed to a drop weight of 4 kg from a height of 0.6 m
Stability tests Test energy 23.5 J. Helmet shall not come off headform when subjected to a 4 kg mass drop from 0.6 m

Technical Annex
TRL 66 PPR 446
Table 7-6: Summary of CAN/CSA-D113.2-M89
Construction
Helmet materials Materials should be known to be suitable for use in protective helmets. Materials should not alter appreciably due to rain, sun, temperature or age
Coverage 52.5 mm above basic plane at front, stepping down to 32.5 mm above basic plane approx. two-thirds of way back; two steps children ≤ 5
Construction No rigid protrusions on the inner surface of the helmet liner
Impact Tests
Impact sites Six for each helmet – front, rear, side and three others, at least two at 55 J and two at 80J
Impact surfaces Flat Anvil: 150 mm minimum diameter
Cylindrical Anvil: Radius 40±1 mm, length 200±1 mm
Impact velocities Flat Anvil: 5.7 m.s-1 (80 J), drop height 1.66 m; 4.70 m.s-1 (55 J), drop height 1.13 m.
Kerbstone Anvil: 4.70 m.s-1 (55 J), drop height 1.13 m
Requirements Maximum acceleration: 200 g 55 J flat; 250 g 80J flat; 250 g 55J cylindrical; 200 g 50/67 J flat and 150 g 34/45 J cylindrical for helmets for children under five; recommend Gadd Severity Index < 1500 for all tests
No. helmets tested
Eight
Conditioning Ambient: 20±5°C, relative humidity 50 to 70% for not less than 4 hours
Hot: 50±2°C for not less than 4 hours
Cold: -10±2°C for not less than 4 hours
Wet: Immersed in water at 18 to 27°C for not less than four hours
Artificial ageing: None
Headform Magnesium alloy to specification of ISO-DIS 6220:1983; 5±0.1kg including assembly
Retention System Tests
Strength tests A mass of 2 kg should be dropped to impart an impact energy of 20 J (1.02 m), with an apparatus mass of 7 kg. The maximum dynamic elongation must not exceed 25 mm and the post-test static elongation must not exceed 12 mm
Stability tests A force of 250 N applied upwards at a constant rate for at least 5 s; if the helmet moves more than 10 mm on the headform, apply force for another 5 s. Rotation of the helmet must not exceed 45°

Technical Annex
TRL 67 PPR 446
Table 7-7: Summary of CPSC 16 CFR 1203:1998
Construction
Helmet materials No requirements
Coverage 68.5 mm above basic plane at front, stepping down to 54.5 mm above basic plane approx. two-thirds of way back; two steps children ≤ 5
Construction Any unfaired projection extending more than 7 mm from the helmet's outer surface shall break away or collapse when impacted with forces equivalent to those produced by the applicable impact attenuation tests. No fixture on the helmet's inner surface shall project more than 2 mm. Peripheral vision of a minimum of 105º to left and right of mid-sagittal plane.
Impact Tests
Impact sites Four for each helmet chosen by test laboratory to represent worst case condition - each anvil to be used at least once for each sample tested.
Impact surfaces Flat Anvil: 125 mm minimum diameter
Kerbstone Anvil: height >50 mm, length >200 mm, angle 105°, and forming a striking edge of radius 15±0.5 mm
Hemispherical Anvil: radius 48±1 mm
Impact velocities Flat Anvil: 6.2 m.s-1 (98 J), drop height 2 m
Kerbstone Anvil: 4.8 m.s-1 (59 J), drop height 1.2 m
Hemispherical Anvil: 4.8 m.s-1 (59 J), drop height 1.2 m
Requirements Maximum acceleration: 300 g
No. helmets tested
Eight
Conditioning Ambient: 22±5°C and 20-80% relative humidity >4 hours
Hot: 50±3ºC for 4-24 hours
Cold: -15±2ºC for 4-24 hours
Wet: Fully immersed crown down to a crown depth of 305 mm in water for 4-24 hours
Artificial ageing: None
Ambient pressure: 75-110 kPa for all tests
Headform Magnesium alloy to specification of ISO-DIS 6220:1983; 5±0.1kg including assembly
Retention System Tests
Strength tests Extension of restraint system shall not exceed 30 mm when chinstrap is exposed to a drop weight of 4 kg from a height of 0.6 m (23.5 J). Total mass of apparatus (including drop weight) is 11±0.5 kg
Stability tests Headform angled so that vertical axis points downwards and 45º to gravity. Wire rope is hooked to rear of helmet and a load of 4 kg dropped through 0.6 m (23.5 J). Helmet shall not come off the headform. Procedure repeated with wire hooked to front of helmet (headform inverted so headform is face up). Mass of assembly (including drop weight) 5 kg

Technical Annex
TRL 68 PPR 446
Table 7-8: Summary of EN 1078:1997
Construction
Helmet materials No appreciable alteration from contact with sweat or toiletries. No materials known to cause skin disorders shall be used
Coverage Plane inclined at to the horizontal, approximately 68 mm above basic plane at front and 48 mm at rear
Construction No rivets, edges etc. that are likely to injure the user in normal use. Field of vision must be at least 105º from the longitudinal plane to the left and right, and 25º upwards from the reference plane and 45º downwards from the basic plane. Helmet should be ventilating and not impair hearing or use of spectacles
Impact Tests
Impact sites Two for each helmet (one of each anvil) chosen by test laboratory to represent worst case condition
Impact surfaces Flat Anvil: 130±3 mm diameter; one impact per helmet
Kerbstone Anvil: with two edges 52.5±2.5º to vertical and forming a striking area of radius 15±0.5 mm
Impact velocities Flat Anvil: 5.42 m.s-1 (78 J for J-headform), drop height 1.5 m
Kerbstone Anvil: 4.57 ms-1 (55 J for J-headform), 1.06 m
Requirements Maximum acceleration: 250 g
No. helmets tested
Four of each size
Conditioning Ambient: no tests
Hot: 50±2ºC for 4-6 hours
Cold: -20±2ºC for 4-6 hours
Artificial ageing: exposed to UV 125 W xenon-filled quartz lamp at range of 250 mm for 48 hours and then sprayed with water at room temperature for 4-6 hours at rate of 1 litre/minute
Headform Magnesium alloy to specification of EN 960. Mass between 3.1 and 6.2 kg depending on helmet size (J-headform 4.7±0.14 kg)
Retention System Tests
Strength tests Dynamic extension of restraint system shall not exceed 35 mm and residual extension shall not exceed 25 mm when chin strap is exposed to a drop weight of 4±0.2 kg from a height of 600±5 mm (23.5 J). Mass of loading apparatus (not inc. drop weight) is 5±0.5 kg. Residual displacement is measured after 2 minutes. Fastening must be operable with one hand while under load
Stability tests Cable attached to rear of helmet linked to a pulley system. Falling mass of 10±0.1 kg for 175±5 mm (17.2 J) produces force on helmet retention system. Helmet shall not come off the headform. Guide apparatus additional 3 kg

Technical Annex
TRL 69 PPR 446
Table 7-9: Summary of EN 1080:1997
Construction
Helmet materials No appreciable alteration from contact with sweat or toiletries. No materials known to cause skin disorders shall be used
Coverage Same proportional coverage as EN 1078
Construction No rivets, edges etc. that are likely to injure the user in normal use. Field of vision must be at least 105º from the longitudinal plane to the left and right, and 25º upwards from the reference plane and 45º downwards from the basic plane. Helmet should be ventilating and not impair hearing or use of spectacles
Impact Tests
Impact sites Two for each helmet (one of each anvil) chosen by test laboratory to represent worst case condition
Impact surfaces Flat Anvil: 130±3 mm diameter; one impact per helmet
Kerbstone Anvil: with two edges 52.5±2.5º to vertical and forming a striking area of radius 15±0.5 mm
Impact velocities Flat Anvil: 5.42 m.s-1 (78 J for J-headform), drop height 1.5 m
Kerbstone Anvil: 4.57 ms-1 (55 J for J-headform), 1.06 m
Requirements Maximum acceleration: 250 g
No. helmets tested
Four of each size
Conditioning Ambient: no tests
Hot: 50±2ºC for 4-6 hours
Cold: -20±2ºC for 4-6 hours
Artificial ageing: exposed to UV 125 W xenon-filled quartz lamp at range of 250 mm for 48 hours and then sprayed with water at room temperature for 4-6 hours at rate of 1 litre/minute
Headform Magnesium alloy to specification of EN 960. Mass between 3.1 and 6.2 kg depending on helmet size (J-headform 4.7±0.14 kg)
Retention System Tests
Strength tests A self release mechanism is required and shall be coloured green to differentiate from adult helmet retention systems. Release force must exceed 90 N, but not exceed 160 N under quasi-static loading conditions
Stability tests None defined

Technical Annex
TRL 70 PPR 446
Table 7-10: Summary of Snell B-90A B-90C 1998
Construction
Helmet materials Ideally durable material and not harmed by exposure to sun, rain, dust, vibration, sweat or products applied to skin or hair. No materials known to cause skin irritation. Materials should not degrade with age or temperature. Recommends bright colours to reduce likelihood of collision involvement
Coverage 53.5 mm above basic plane at front, stepping down to 40.5 mm above the basic plane
Construction Smooth and rounded edges with no rigid projections inside the shell that may cause injury. Visual field of at least 110º right and left
Impact Tests
Impact sites Four per helmet sample
Impact surfaces Flat Anvil: 127 mm minimum diameter
Kerbstone Anvil: height >50 mm, length >200 mm, angle 105°, and forming a striking edge of radius 15±0.5 mm
Hemispherical Anvil: radius 48±0.5 mm
Impact velocities Flat Anvil: 100 J, drop height 2.04 m (6.33 m.s-1)
Kerbstone Anvil: 58 J, drop height 1.18 m (4.81 m.s-1)
Hemispherical Anvil: 65 J, drop height 1.36 m (5.17 m.s-1)
Requirements Maximum acceleration: 300 g
No. helmets tested
Five
Conditioning Ambient: 22±5°C and 20-80% relative humidity >4 hours
Hot: 50±2ºC for 4-24 hours
Cold: -20±2ºC for 4-24 hours
Wet: Fully immersed crown down to a crown depth of 305 mm in water at 22±5°C for 4-24 hours
Artificial ageing: None
Ambient conditions: 75-110 kPa and 20 to 80% relative humidity for all tests
Headform Magnesium alloy to specification of ISO-DIS 6220:1983; 5±0.1kg including assembly
Retention System Tests
Strength tests Extension of restraint system shall not exceed 30 mm when chinstrap is exposed to a drop weight of 4 kg from a height of 0.6 m (23.5 J). Total mass of apparatus (including drop weight) is 11±0.5 kg
Stability tests Headform angled so that vertical axis points downwards and 45º to gravity. Wire rope is hooked to rear of helmet and a load of 4 kg dropped through 0.6 m (23.5 J). Helmet shall not come off the headform. Procedure repeated with wire hooked to front of helmet (headform inverted so headform is face up). Mass of assembly (including drop weight) 5 kg

Technical Annex
TRL 71 PPR 446
Table 7-11: Summary of Snell B-95 (including 1998 addendum)
Construction
Helmet materials Ideally durable material and not harmed by exposure to sun, rain, dust, vibration, sweat or products applied to skin or hair. No materials known to cause skin irritation. Materials should not degrade with age or temperature. Recommends bright colours to reduce likelihood of collision involvement
Coverage 53 mm above basic plane at front, stepping down to 33 mm above the basic plane; two steps children ≤ 5
Construction Smooth external and internal surfaces. Any feature projecting more than 5 mm must readily break away. No fixture on inner surface shall project more than 2 mm. Visual field of at least 110º right and left and at least 25º upward from the horizontal
Impact Tests
Impact sites Four for each helmet chosen by test laboratory to represent worst case condition. Each anvil to be used at least once for each sample tested
Impact surfaces Flat Anvil: diameter 127 mm
Kerbstone Anvil: height >50 mm, length >200 mm, angle 105°, and forming a striking edge of radius 15±0.5 mm
Hemispherical Anvil: radius 48±0.5 mm
Impact velocities Flat Anvil: 110 J, drop height 2.24 m (6.63 m.s-1)
Kerbstone Anvil: 72 J, drop height ≥ 1.47 m (5.37 m.s-1)
Hemispherical Anvil: 72 J, drop height ≥ 1.47 m (5.37 m.s-1)
Requirements Maximum acceleration: 300 g
No. helmets tested
Five
Conditioning Ambient: 22±5°C and 20-80% relative humidity >4 hours
Hot: 50±2ºC for 4-24 hours
Cold: -20±2ºC for 4-24 hours
Wet: Fully immersed crown down to a crown depth of 305 mm in water at 22±5°C for 4-24 hours
Artificial ageing: None
Ambient conditions: 75-110 kPa and 20 to 80% relative humidity for all tests
Headform Magnesium alloy to specification of ISO-DIS 6220:1983; 5±0.1kg including assembly
Retention System Tests
Strength tests Extension of restraint system shall not exceed 30 mm when chinstrap is exposed to a drop weight of 4 kg from a height of 0.6 m (23.5 J). Total mass of apparatus (including drop weight) is 11±0.5 kg

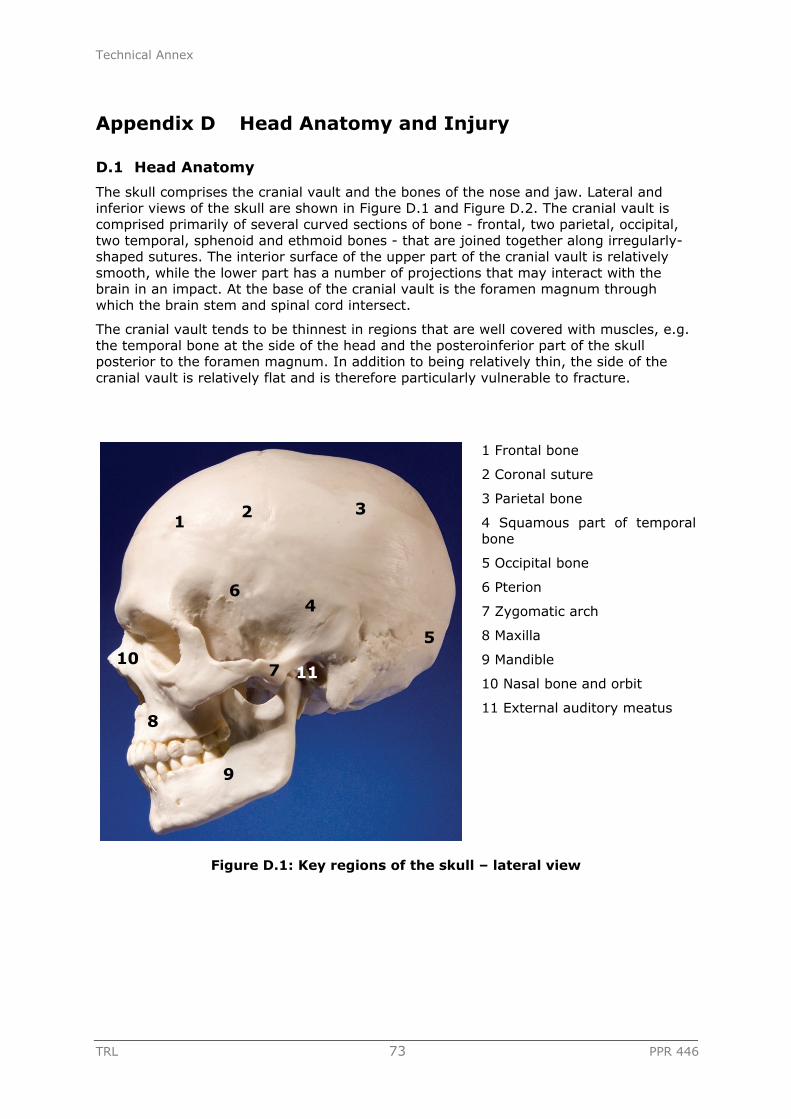
Technical Annex
TRL 73 PPR 446
Appendix D Head Anatomy and Injury
D.1 Head Anatomy
The skull comprises the cranial vault and the bones of the nose and jaw. Lateral and inferior views of the skull are shown in Figure D.1 and Figure D.2. The cranial vault is comprised primarily of several curved sections of bone - frontal, two parietal, occipital, two temporal, sphenoid and ethmoid bones - that are joined together along irregularly-shaped sutures. The interior surface of the upper part of the cranial vault is relatively smooth, while the lower part has a number of projections that may interact with the brain in an impact. At the base of the cranial vault is the foramen magnum through which the brain stem and spinal cord intersect.
The cranial vault tends to be thinnest in regions that are well covered with muscles, e.g. the temporal bone at the side of the head and the posteroinferior part of the skull posterior to the foramen magnum. In addition to being relatively thin, the side of the cranial vault is relatively flat and is therefore particularly vulnerable to fracture.
1 Frontal bone
2 Coronal suture
3 Parietal bone
4 Squamous part of temporal bone
5 Occipital bone
6 Pterion
7 Zygomatic arch
8 Maxilla
9 Mandible
10 Nasal bone and orbit
11 External auditory meatus
Figure D.1: Key regions of the skull – lateral view
1 2 3
4
5
6
7
8
9
10 11

Technical Annex
TRL 74 PPR 446
1 Occipital bone
2 Temporal bone
3 Foramen magnum
4 Occipital condyle
5 Zygomatic arch
6 Mandible
7 Mastoid process
Figure D.2: Key regions of the skull – inferior view
Much of the cranial vault is covered by the scalp. The outer layer of skin and connective tissue is separated from the periostium of the cranium by a layer of loose connective tissue that forms a shear plane between the skin and the cranium (Moore, 1985). The scalp is well supplied with blood vessels and bleeding from scalp lacerations can be profuse.
Between the cranium and the brain are a series of protective coverings called the cranial meninges. The outer layer is the dura mater, the middle layer is the arachnoid and the inner layer is the pia mater, which adheres closely to the surface of the brain, dipping in to the fissures and carrying small blood vessels with it. An extension of the dura mater, called the falx cerebri, separates the left and right hemispheres of the cerebrum.
1 Frontal lobe of cerebrum
2 Occipital lobe of cerebrum
3 Cerebellum
4 Body of corpus callosum
5 Mid-brain
6 Pons
7 Medulla oblongata
Figure D.3: Key regions of the brain – mid-sagittal seciton
1
6
4
7
2
3
5
1
2
3
4
5
6
7

Technical Annex
TRL 75 PPR 446
The brain is well supplied with oxygen and nutrients through a network of blood vessels. Blood vessels that enter the brain tissue first pass along the surface of the brain and, as they penetrate inwards, they are surrounded by a loose-fitting layer of pia mater.
D.2 Types of Head Injury
There are three types of head injury that are most relevant to the consideration of cycle helmet effectiveness: skull fracture; focal brain injuries; and diffuse brain injuries. The mechanisms and likely consequences of these injury types have been considered in detail in numerous publications (e.g. Gennarelli, 1985; Melvin et al., 1993; Henderson, 1995) and a summary is given here.
D.2.1 Skull Fracture
Skull fractures may be simple or complex and occur due to direct impact of the head with another object. Simple linear fractures are generally considered to have little significance for brain injury, although dangerous complications may occur (Melvin et al., 1993). More severe impact forces may lead to comminuted or depressed fractures, where fragments of bone may be pushed in to the underlying soft tissues causing damage to the blood vessels or brain tissue.
Even when skull fracture does not occur, bending of the skull may be sufficient to damage underlying blood vessels and brain tissue, particularly in younger children where the bones are more flexible (see Section D.2.4).
D.2.2 Focal Brain Injuries
Focal - or localised - brain injuries consist of epidural haematomas, subdural haematomas [sub-arachnoid haematomas], intracerebral haematomas, and coup or contrecoup contusions. Most focal injuries are due to direct contact with bone fragments from skull fractures, or to relative motion between different parts of the skull and the brain. Such relative motion may be due to linear or rotational acceleration of the skull.
Approximately one in four brain injuries resulting from a road traffic accident are focal, compared with three out of four in assaults and falls (Gennarelli, 1981, reported in Melvin et al., 1993).
Extradural haemorrhage – bleeding between the dura mater and the cranium may follow a blow to the head. Typically there is a brief concussion, followed by a lucid interval of some hours. This is succeeded by drowsiness and coma. As the mass of blood increases in size, compression of the brain occurs.
It should be noted that focal brain injuries are reportedly highly correlated with fatality (Melvin et al., 1993). For example, Gennarelli and Thibault (1982) reported an incidence of acute subdural haematoma of 30%, with an associated mortality rate of 60%.
D.2.3 Diffuse Brain Injuries
Diffuse injuries consist of concussion, swelling of the brain and diffuse axonal injury (DAI). Mild concussion may include disorientation and confusion, with moderate (often referred to as ‘classical’ concussion) concussion leading to loss of consciousness for up to 24 hours. Recovery rates from mild and moderate concussion are good, but severe deficit in brain function may result in a small minority of cases. The clinical outcome for patients with moderate concussion is dependent on any other head injuries received (Melvin et al., 1993). Loss of consciousness greater than 24 hours is associated with a much higher rate of brain deficit and even fatality. Melvin et al. (1993) reported that close to 2% of patients with loss of consciousness greater than 24 hours may have a severe deficit and 2% may have moderate deficit.

Technical Annex
TRL 76 PPR 446
DAI is associated with widespread disruption of the axons in the cerebral hemispheres, mid-brain and brainstem. DAI involves loss of consciousness lasting at least 24 hours and possibly weeks. 55% of patients are likely to have died one-month post-trauma, 3% may have vegetative survival and 9% may have severe deficit (Gennarelli, 1981 reported in Melvin et al., 1993).
Brain swelling due to an increase in intravascular blood within the brain may worsen the effects of primary brain injury due to increased intracranial pressure. This increased pressure may force the brain and brainstem downwards through the foramen magnum causing further damage to the tissues. In this way, focal injuries may greatly increase the risk of fatality for patients with DAI.
D.2.4 Child and Adult Head Injury
The shape and stiffness of a newborn child’s skull are quite different to that of an adult. The newborn skull is more flexible and the sutures that join the bones of the cranium together are not fused (Cheng and Reichert, 1998). Growth of the skull is especially rapid in the first two years and will have achieved 90% of its adult volume by the age of ten years. Complete fusion of the bony plates occurs at around 20 years old, at which time the skull will have reached its definitive size.
The flexible skull of very young children may make them more vulnerable to focal injuries due to compression of the brain by the skull. It has therefore been suggested that hard-shell helmets would be more appropriate for children than micro-shell or other soft-shell designs. The Canadian cycle helmet standard (see Appendix C) includes lower peak acceleration limits for helmets designed for children under five years, which may be an attempt to address this issue.
Based on information from animal tests, smaller brains require very much larger rotational accelerations to induce sufficient strain in the brain tissue to cause diffuse brain injury. The implication of this is that younger children may be slightly less vulnerable to this sort of injury, although no consideration of this was found in the literature.
D.2.5 Head Injury Risk
D.2.5.1 Translational Acceleration5
Many car crash and other test standards place a limit on the peak translational acceleration measured at various points in a crash test dummy (e.g. spine acceleration) or subsystem test tool (e.g. lower leg acceleration in a pedestrian legform for bumper tests). The acceleration may be in a single axis, or may be the resultant of the accelerations measured in two or three orthogonal axes. Peak head acceleration is commonly used in helmet test procedures, both for cycle helmets (see Appendix C) and other types of helmet.
Experiments on Post Mortem Human Subjects (PMHS), animals, and volunteers were used to propose the Wayne State Tolerance Curve, which expresses the concept that a higher peak head acceleration can be tolerated for a shorter period of time (and, conversely, the acceleration tolerance is lower for longer loading durations). Some test standards incorporate this concept by limiting the peak acceleration for different time intervals. For example, the US regulation for motorcycle helmets (FMVSS 218) uses the following limits (where ‘g’ is the typical acceleration due to gravity – approximately 9.81 m.s-2):
Peak head acceleration < 400 g
Time at 200 g < 2 ms
5 The concepts of translational and rotational acceleration are outlined in Appendix D.

Technical Annex
TRL 77 PPR 446
Time at 150 g < 4 ms
Another US regulation, FMVSS 208 car occupant impact protection in frontal impacts, introduced the Head Injury Criterion (HIC), which is extrapolated from the Wayne State Tolerance Cuve. The standard formulation for HIC is:
Where t1 and t2 are the two time instances that maximise the function on the left side of the equation, and a is the measured head acceleration. Very often, the interval t2 – t1 is limited to e.g. 15 or 36 ms.
D.2.5.2 Rotational Acceleration
The work of Ommaya, Gennarelli, Thibault and colleagues (e.g. Ommaya and Gennarelli, 1974, and Thibault and Gennarelli, 1990) is often quoted in support of a largely rotational basis for diffuse brain injury (concussion through to diffuse axonal injury). Ommaya and Gennarelli undertook a number of test series over many years with different sub-human primate (monkey and ape) test subjects. They developed special test equipment to apply a known and adjustable level of purely inertial loading to the head, i.e. loading that did not involve an impact. This was designed to enable them to study the effects of isolated translational and rotational acceleration, without the potentially confounding influence of injuries due to impact, e.g. focal haematomas that may arise due to local skull fracture or bending.
Ommaya and Gennarelli (1974) reported that their equipment enabled them to ‘test the rotational and translational components of inertial loading separately’. This work demonstrated that diffuse SDH and, to an extent, SAH were generated from ‘purely rotational’ acceleration of the head, with focal (localised) SDH and SAH resulting from ‘purely translational’ acceleration of the head. Cerebral concussion (a diffuse brain injury) was found in all of the rotation cases and none of the translation cases.
In fact, the loadings that were applied were either a pure translation or a combined rotation/translation; the latter was combined loading of the brain (not pure rotation) because the rotation occurred about the T1 (upper thorax vertebra) joint rather than the centre of gravity of the brain. In fact, for one series of experiments the tangential acceleration (the translational component of the combined rotation/translation acceleration) was almost as great in the ‘rotation’ tests as in the ‘translation’ tests. This means that the loading of the brain due to rotation was additional to translational acceleration that was sufficient to cause significant injury. It is therefore difficult to determine whether the ‘rotational’ injuries were solely due to the presence of rotational acceleration, or simply due to the much greater overall loading on the brain tissue. It may also be that the combination of loading mechanisms may be important in causing some brain injuries.
More recently, Ono et al. (1980) undertook further test series with sub-human primate subjects using either inertial or impact loading, depending on the series. The first series of tests applied pure translational acceleration without direct impact and concussion was observed in all 26 subjects, albeit the severity of concussion was low – lasting from 20 seconds to seven minutes. A subsequent test series (Kikuchi et al., 1982) was used to develop the JARI Human Head Tolerance Curve (JHTC) for concussion, which is very similar to the Wayne State Tolerance Curve. The JHTC relates the magnitude and duration of translational acceleration to the presence of concussion. However, these

Technical Annex
TRL 78 PPR 446
tests applied both translational and rotational loading to the subject, as well as direct impact loading, so it is not clear that the JHTC is valid for isolated translational acceleration. Nevertheless, the earlier finding that concussion (mild diffuse brain injury) can be produced in the absence of rotation appears to stand.
Despite of these findings, a number of thresholds for rotational acceleration and velocity change have been proposed. Newman (1998) interpreted the data of Thibault and Gennarelli (1990) to provide the following limits:
Concussion: 8,000 rad.s-2, 75 rad.s-1
Acute sub-dural haematoma: 12,500 rad.s-2, 60 rad.s-1
Diffuse axonal injury: 15,000 rad.s-2, 150 rad.s-1
These data from Thibault and Gennarelli were scaled from the original animal test results and there are considerable assumptions in the scaling process. Pincemaille et al. (1989) reported on volunteer tests with amateur boxers who were instrumented to record head translational and rotational acceleration. The authors reported the following limits for concussion:
16,000 rad.s-2, 25 rad.s-1
13,600 rad.s-2, 48 rad.s-1
These tests are outside the range of the animal tests described by Thibault and Gennarelli, but are not contradictory. They imply a duration component for angular acceleration much like that used for translational acceleration with HIC and the JHTC.
Due to ethical concerns regarding testing with sub-human primates, many other tests have been undertaken with subjects such as rats, ferrets and rabbits, but there are considerable difficulties scaling the results to understand the implications for human injury tolerance. The very high level of angular accelerations necessary to induce closed head injury in the small brains of the animals used makes characterisation of the brain response difficult. The different shapes of the brains and internal structure of the skull of the animals make scaling of the results to man difficult (Melvin et al., 1993). Much of the current work on head injury mechanisms and tolerance is focussed on using finite element modelling to understand how the input loadings from biomechanical tests load the tissues of the brain, and to relate injury to specific tissue loading. If tolerances for the tissues can be developed and agreed, it may be possible to translate this to human head models and thereby develop new criteria and tolerances for human head injury mechanisms that more accurately reflect clinical experience.
D.2.5.3 Generalised Acceleration Criteria
Most head injury criteria that are in common usage regulations and standards focus on a single quantity, such as linear acceleration, related to a particular mechanism of injury. Some more general injury criteria have been suggested that combine linear and rotational injury mechanisms, but these are not in widespread use in helmet or car crash test standards. The Generalized Acceleration Model for Brain Injury Tolerance (GAMBIT) was proposed by Newman (1986). The original Gambit equation was of the form:
Where ac and αc are limiting ‘critical’ values of translational and rotational acceleration, and m, n and s are constants set, somewhat arbitrarily, to equal two. If G(t) was greater than 1, head injury was assumed to have occurred. Initially, limit values of 250 g and 10,000 rad.s-2 were proposed. Others have proposed a limit on rotational acceleration of 25,000 rad.s-2 based on field accident studies (Kramer and Appel, 1990). With these

Technical Annex
TRL 79 PPR 446
limits, Newman et al. (2000) report that G=1 corresponds to a 50% probability of AIS>36 head injury.
GAMBIT has been criticised for not taking into account any time-dependent factor of the head injury process – it depends on maximum values only and does not account for duration of exposure.
More recently, Newman et al. (2000) proposed the Head Injury Power function (HIP), which considers the maximum rate of translational and rotational energy transfer. In a study of American football helmeted head impacts HIP was reported to have a slightly better ability to predict mild traumatic brain injury (MTBI) than peak translational acceleration and GAMBIT, and considerably better than peak rotational acceleration and HIC.
6 AIS is the Abbreviated Injury Scale, which is used to code the severity of injuries arising from road traffic accidents (AAAM, 1990). The scale goes from 1 (no injury) to 6 (virtually unsurvivable). AIS ≥ 3 injuries are usually considered to be ‘serious’ or ‘life threatening’. See section 7 for more information on the AIS scale.


Technical Annex
TRL 81 PPR 446
Appendix E Translational and Rotational Acceleration
There are two basic kinds of motion: translation and rotation. Translation means movement of a body without any rotation, and is often referred to as linear motion. There are two types of translational motion: rectilinear and curvilinear (see Figure E.1 and Figure E.2 respectively). Rectilinear means that the body moves in a straight line, and curvilinear means that the body moves on a curved path (but without any rotation)
Figure E.1: Rectilinear motion Figure E.2: Curvilinear motion
Similarly, a body may rotate about its centre of gravity (Figure E.3) or about any other point either within the body or without (Figure E.4). This latter motion is a combination of translation and rotation.
Figure E.3: Rotation about the centre of gravity of a uniform object
Figure E.4: Rotation about a centre of rotation outside a uniform object


Technical Annex
TRL 83 PPR 446
Appendix F In-depth Review of Population and Hospital Studies
Following the overview of cycle helmet effectiveness issues reported in Section 5.1.1, a more in-depth review of population and hospital admissions studies was undertaken. The focus was on recent literature, building on the review carried out for the DfT by Towner et al. (2002).
F.1 Population Studies
Large population studies on the effectiveness of cycle helmets typically use administrative datasets such as Police-reported collision databases. These studies analyse groups, rather than individuals, and identify trends in population-level injury rates over a period of time. Several national-scale hospital admissions studies, which used national administrative databases of hospital admissions information, were also reviewed. Because of their scale these could be defined as population studies – indeed, they may well represent more of the cycle accident population than population studies based on Police-reported accidents – but were included in this report with the smaller scale hospital admissions studies (see Appendix F.2).
Helmet use is usually derived from a separate observation study and is compared with the injury data to comment on the overall effectiveness of cycle helmets. Another approach is to assess the exposure of a large population to a specific intervention, such as the passage of helmet wearing legislation. For instance, a group that was exposed to an intervention would be compared over time to a similar group that was not exposed. For greater confidence, multiple jurisdictions would be analysed and injury rates compared before and after the intervention. Helmet use data is usually included also.
This section reviews the methods and findings from a number of large population studies on the effectiveness of cycle helmets. It also summarises published responses to the studies.
F.1.1 Studies of the Effectiveness of Cycle Helmets – No Interventions
This section describes studies of the effectiveness of cycle helmets in areas where there has been no specific, large-scale intervention - such as legislation to require cycle helmet wearing - aimed at reducing injuries to cyclists. It is particularly relevant to the UK, therefore, where there is no legislation for helmet wearing. A variety of methods are used in these studies, with different statistical modelling and analysis techniques employed by researchers to analyse trends in the data over time. While some overall patterns emerge, the evidence for the effectiveness of cycle helmets from these studies is mixed.
Kim et al. (2007)
Kim et al. (2007) examined a range of factors contributing to the injury severity of cyclists in collision with a vehicle. This was based on Police-reported accident data between 1997 and 2002 in North Carolina. Helmet use decreased the probability of fatal injury by 24.3%; however, the probabilities of incapacitating injury and non-incapacitating injury each increased by 18.8%. The authors attributed this to helmets reducing the severity of serious accidents that would have led to a fatality; however, no specific evidence for this effect was presented. In fact, this finding appears to contradict the more widespread view that helmets could be less effective in impacts that would be expected to result in death, and in serious collisions with a motor vehicle.

Technical Annex
TRL 84 PPR 446
Hewson (2005b)
Another study by Hewson (2005b) used the STATS19 Police-reported road accident database to investigate patterns of injury in cyclists and pedestrians in the UK from 1990 to 2002. Comparisons were made with helmet wearing survey data to comment on the effectiveness of cycle helmets in reducing overall casualties. Hewson (2005b) found no evidence for a safety gain for cyclists compared with that of pedestrians. This was based on observed data and model predictions, including: the fatality rate per million miles for cycle and pedestrian casualties; and the ratio of killed and seriously injured cyclists and pedestrians compared with all casualties. However, the analysis was clearly biased by the dataset - a point recognised by Hewson when he concluded that helmets have not had a marked safety benefit at the population-level for (injured) road-using cyclists. Such cyclists have the possibility of being in collision with a motor vehicle. He adds, therefore, that this conclusion cannot be extrapolated to non-road using cyclists and that it is leisure cyclists who provide the mass of evidence in case control studies. It is also worth noting that all Stats19 fatal and serious injuries were aggregated for both pedestrians and cyclists, and compared with the rate of slight injuries. No attempt was made to evaluate any differential rate of fatal or serious head injury for the two groups, or the subset of fatal and serious head injuries that have the most potential to be mitigated through the use of a cycle helmet (i.e. cranium fractures and intra-cranial injuries). Furthermore, if a helmet reduced a head impact from fatal to serious, or reduced a head impact from very serious to moderately serious - both of which would be very worthwhile improvements in outcome, and would be reasonable expectations based on the evaluation in Section 4 - this would not show up in Hewson’s analysis. Any reduction in head injury from fatal or serious to slight would also be masked for any cyclist casualty with a serious injury to any other body region. It would therefore be surprising if any difference due to cycle helmets could be detected using this approach, even if cycle helmets were highly effective for cranium fractures and intra-cranial injuries in all cycle accident scenarios.
F.1.2 Studies on the Effectiveness of Cycle Helmets – Legislative or Other Intervention
Various countries have introduced legislation that requires people to wear a helmet while cycling, including Australia, New Zealand, the United States and Canada. There are differences in the population affected by the legislation. In Australia, cyclists of all ages must wear a helmet. In Canada, however, most provincial legislation applies to children and adolescents only. Enforcement of the legislation also differs from country to country or even state to state, possibly due to different priorities in policing.
Robinson (2006)
Robinson (2006) referenced several studies from Australia and New Zealand, where helmet laws were introduced for adults and children. In each case, enforcement was reported to have led to high rates of helmet use (80% to 90%) following the law. Robinson (2006) reported that, in each study, the proportion of cyclists admitted to hospital with head injuries was observed to be falling for several years before the law and did not display any clear response when helmet use increased substantially. In fact, detailed information from the studies about helmet use was not presented; instead, before and after averages were used, and it may have been the case that helmet use was increasing gradually from a period well before the passage of the law. Nevertheless, Robinson (2006) contended that it has proven impossible to determine with confidence whether the main cause of decreases in head injury have been due to increased helmet use, other interventions, or a fall in cycling.

Technical Annex
TRL 85 PPR 446
Robinson reported that the studies that she included in her analysis most commonly classified head injuries as ‘admissions to hospital with head wounds, skull or facial fractures, concussion, or other intracranial injury’. However, ‘head wounds’ is very vague and could encompass any or all head injuries. The ICD injury classifications used in British and many other hospitals have many categories of head injuries, one of which is ‘open wound of the head’. With this classification, any cut, laceration or puncture wound to the face (or the rest of the head) would be recorded as an injury, alongside much more serious cranial fractures and intracranial injuries (which are the most important injuries that a cycle helmet may have the potential to mitigate). Including these injuries would mask any effect on cranial fractures and intracranial injuries (open wound injuries were the most common, specified injury type in the HES database, even more common than superficial injuries and twice as common as cranium fractures and intracranial injuries combined. If ‘head wounds’ also contained e.g. superficial injuries, then the effect would be even more pronounced.
Furthermore, if a cycle helmet reduced the severity of injury e.g. from an AIS 4 cranium fracture with AIS 3 concussion, to an AIS 2 cranium fracture with AIS 2 concussion, then the helmet would have been very beneficial to the wearer. However, if the wearer was still admitted to hospital due to their injuries, they would be recorded as having a head injury and the helmet would be considered - by this method of analysis - to have had no effect on the injury outcome.
In fact, only those casualties whose ‘serious’ head injury was mitigated to no head injury, but who were still admitted to hospital for injuries to other body regions, would be identified as an effective case for helmets. Given that even a cut to the chin would be classified as a head injury, it seems unlikely that this group of ‘saved’ head injuries would be very large.
Liller et al. (2003)
Liller et al. (2003) examined the effects of a state-wide helmet law in Hillsborough County, Florida. The law was passed in 1997 and required all cyclists less than 16 years of age to wear a helmet. Approximately 400 children aged 5 to 13 years were observed between 1993 and 2000. For the same period, rates of cycle-related injuries or deaths involving a motor vehicle were obtained from the Florida Department of Transportation, and other state agencies, for children aged from 0 to 14 years. The crash reports record the victim as sustaining no injury, possible injury, non-incapacitating injury, incapacitating injury or a fatal injury; no specific description of head injury was noted. Observed helmet use averaged 7.7% during the pre-law years (1993-1996), but this increased to 57.5% during the post-law years (1997-2000). The Hillsborough County crash data showed that an average of 28% of children with no recorded injuries wore helmets, whereas an average of 8% with recorded injuries wore helmets. The average rate of injuries was approximately 1.5 times greater during the pre-law years than in the post-law years and there was a statistically significant decrease in injury incidence over the study period.
While Liller et al. (2003) presented trends in cycle-related injuries during the years before and after the passage of a helmet wearing law, there were a number of limitations that restrict the value of the study as an examination of the efficacy of cycle helmets. A key limitation is that the study analyses all bicycle-related injuries, rather than focussing on head injuries. The authors recognised this limitation, but argued that helmet use was lower in children injured than those not injured. On that basis, they recommended that measures should be taken to maintain the trend towards greater helmet use. However, the evidence presented was somewhat weak, due to the lack of detail about injuries. Another important limitation was the lack of any suitable control or comparison groups. Finally, the study focussed on injuries that occurred following a collision with a motor vehicle only. The authors noted that injuries were more common in a non-traffic setting, but justified the use of this data on the basis that motor vehicle

Technical Annex
TRL 86 PPR 446
collisions account for the most serious cyclist injuries and deaths. While the study demonstrated that cycle-related injuries were falling in the County, the study did not provide a convincing argument that cycle helmets were responsible for this reduction.
Ho-Yin Lee et al. (2005)
This study assessed the effects of the Californian helmet law across the entire state. The law came into force on 1 January 1994 and required cyclists aged 17 years and under to wear a helmet. Patient discharge records were obtained from all public Californian hospitals from 1991 to 2000. This included three years of pre-legislation data (1991 to 1993) and seven years of post-legislation data (1994 to 2000). Adults, who were not required by law to wear helmets whilst cycling, were used as a control group for comparison. Three types of injury were examined: traumatic brain injury, other head or facial injury and other (below neck) injury. No data were available on actual helmet use at the time of injury, or the enforcement or compliance with the law. Ho-Yin Lee et al. reported that the cycle helmet legislation in California was associated with a reduction of 18.2% (99% CI: 11.5% to 24.3%) in the proportion of traumatic brain injuries among injured cyclists aged 17 years and under, who were subjected to the law. The proportions of other head, face and neck injuries did not change significantly in the pre- and post-legislation periods in the age group studied, but there was a corresponding increase of 9% (99% CI: 5% to 13%) in the proportion of all other injuries. There were no significant changes in the proportions of all three injury outcomes for adult cyclists who were not subjected to a helmet law. The youngest cyclists, aged from 0 to 9 years, had the greatest decrease in the proportion of traumatic brain injuries. The reduction was the same for motor vehicle and non-motor vehicle-related incidents. The legislation was associated with a decrease in the likelihood of traumatic brain injury for non-urban residents but not for urban residents, for males but not females, and for Whites, Asians and Hispanics, but not Blacks and others.
Robinson (2007) criticised Ho-Yin Lee et al. (2005) for not considering trends. Although this comment was not explained further, it seems likely that Robinson was referring to the grouping of cases into pre- and post-legislation periods. A time-series may have provided more information, such as seasonal or other trends. Robinson added that Ho-Yin Lee et al. (2007) provided no information on percent-head injury by year. This was similar to the first comment. Although Ho-Yin Lee et al. used recognised statistical tests on the pre- and post-legislation data, annual data were not reported or analysed. Another criticism was that there was no evidence for diverging helmet use between adults and children to support the reduction in head injury for children. Robinson referenced another Californian study that had suggested that adult and child helmet use followed similar trends. However, this criticism is somewhat misleading, or irrelevant, if helmets are more effective for children than for adults.
Further criticism was published by the Bicycle Helmet Research Foundation on their web site: cyclehelmets.org (accessed February 2009). One of the points raised by the Foundation was that adults were used as a control group for children and adolescents. They set out a number of reasons why these are not compatible groups. Clearly, the ideal control group would be the same age cyclists in a neighbouring state or province where all other influential factors such as driving laws and other environmental initiatives would be as similar as possible. The Foundation also reiterated the authors’ own concerns about the lack of information on helmet use or from which to determine exposure. However, the statistical test used by Ho-Yin Lee et al. (2005) to test whether there were any changes in the proportion of injury types before and after the legislation was described as independent of exposure. Finally, the data in Ho-Yin Lee et al. (2005) was analysed further by the Foundation, who determined the average per-annum casualties. This was used to highlight a number of facts not mentioned in the paper. However, the key criticism was that the study sought to draw too many conclusions from

Technical Annex
TRL 87 PPR 446
too little data, with much of the discussion being speculation about what might have transpired as a result of helmet law.
Ji et al. (2006)
Ji et al. (2006) also examined the effects of the Californian helmet law, but focussed on San Diego County only. The authors obtained data from the San Diego County Trauma Registry from 1992 to 1996. Injured youths aged less than 18 years comprised the intervention group, while adults aged 18 years and above were the control group. The outcome measures were serious injury, defined by anatomic region and abbreviated injury score greater than three; and helmet use reported by the injured cyclist. The authors found no statistically significant decrease in the proportion of head injuries post-legislation compared with the pre-legislation period, either for children or adults. However, they were cautious not to conclude that helmet use did not have an effect on reducing head injuries because ‘the study had multiple limitations’. These were discussed at length, but included: the relatively short period of the study, the bias towards more severe injuries in the Trauma Registry and the relatively high proportion of unknown helmet use (one-quarter of cycle-related injuries).
The Bicycle Helmet Research Foundation published a review of Ji et al. (2006) on their web site: cyclehelmets.org (accessed February 2009). The Foundation highlighted that Ji did not find a reduction in serious head injury rates over the study period, despite an increase in helmet use. Nevertheless, a number of criticisms of the research were included. Firstly, the Foundation pointed out that Ji et al. (2006) provided nothing in the way of comparable pedestrian or motor vehicle occupant head injury data. However, adult cyclists were used as a control group. The Foundation did not state why pedestrians or other road users would be a better control group. Another criticism was the lack of exposure data; however, this is a well-known limitation of this kind of study. Other studies, that the Foundation was supportive of, also lacked exposure data.
Wesson et al. (2008)
Wesson et al. (2008) also compared cyclist injuries before and after legislation was passed, but focussed on deaths only. Wesson examined the effects of state-wide legislation in Ontario, Canada. The law was introduced in October 1995 for cyclists less than 18 years of age. Parents of cyclists less than 16 years of age, who were found without a helmet, would be subject to a fine, while 16 to 17 year olds would be fined directly. Data for the period 1991 to 2002 was obtained from the Office of the Chief Coroner of Ontario. This was supplemented with population estimates from Statistics Canada to obtain mortality rates (deaths per 100,000 person-years). Subjects were categorised into two age groups: 1 to 15 years and 16 years through adulthood. The authors grouped cyclists aged 16 to 17 years, who may be fined directly, with adults, who were not required to wear a helmet. This was chosen because it was expected that the manner in which the sanction was imposed would influence the effectiveness of the law, and to allow comparison with a previous study (reported by the authors). The main outcome measures were the average number of deaths per year and mortality rates per 100,000 person-years. The authors found that only 9 (8%) of the 107 children who died were reported to have been wearing a helmet at the time they were injured (three in the pre-legislation period and six in the post-legislation period). For cyclists 1 to 15 years of age, the average number of deaths per year decreased by 52% (95% CI: 42% - 62%), from 13 deaths per year in the pre-legislation period (1991 – 1995) to 6 deaths per year in the post-legislation period (1996 – 2002). The mortality rate per 100,000 person-years decreased by 55% (95% CI: 46% - 64%), from 0.59 deaths per 100,000 person-years to 0.27 deaths per 100,000 person-years. For cyclists 16 years of age and above, there were much smaller changes in the number of deaths or mortality rates.

Technical Annex
TRL 88 PPR 446
Wesson et al. (2008) concluded that the bicycle-related mortality rate in children decreased significantly, which may have been attributable in part to helmet legislation. This wording is important, since the changes may also have been due to other measures, rather than helmets. The authors referenced several studies looking at non-legislative initiatives to increase helmet use in Ontario, undertaken in the years before the legislation was introduced. They interpreted these as demonstrating that non-legislative strategies and legislation work jointly, rather than independently. However, it may also be the case that non-legislative strategies for range of measures, not just helmets, could contribute to reductions in overall fatalities. Although the findings from Wesson et al. (2008) suggest that helmet legislation reduced deaths to children, they do not provide definitive evidence that cycle helmets were responsible for the reduction.
Farley et al. (2003)
Farley et al. (2003) assessed the effect of a community based cycle helmet programme aimed at children aged 5 to 12 years. The programme was in place between 1990 and 1993 and was part of a five year plan aimed at reducing road injury mortality and morbidity in the Montérégie region of Quebec, Canada. Specifically, the programme aimed to increase helmet wearing from 1.3% to 20%. The study period was 1988 to 1996 and hence included pre-intervention and post-intervention years. A comparison group of children of the same age was included from another community (40 km north of Montreal, with similar population characteristics and no programme to promote helmet use). The target and comparison communities were divided into two categories of socioeconomic status: poor and average rich. Data was obtained from a provincial government inpatient register. The main outcome measures were the incident rate of hospitalisation for (bicycle-related) head injury per 1000 children and corresponding risk ratios. Head injury was defined as an injury that occurred on ‘any area of the head that a helmet might be expected to protect’. Helmet use was not examined during the study; however, repeated observational studies from the region by the same author were referenced and revealed that helmet wearing increased significantly over time, reaching 32.5% in 1993 (from 1.3% in 1989). However, the authors noted that the programme was only one in three times as effective in poor areas as in richer ones. Before the programme was implemented, children from the target community showed a significantly higher risk of hospitalisation for head injury than those from the comparison community, for both categories of socioeconomic status. In subsequent periods, the difference between the two communities decreased and was statistically non-significant. Children exposed to the programme (both poor and average rich) showed a significant decrease in the risk of hospitalisation from head injury. No such difference was found in the comparison community. Also, no significant differences were found in the risk of hospitalisation for other cycle-related head injuries.
The authors concluded that the bicycle helmet programme reduced head injuries significantly; however, they fell short of saying that helmets themselves were responsible. What stood out was that head injuries fell across both socioeconomic groups, even though children from the poorer group were much less likely to be wearing a helmet. This suggested that some other effect was present. The authors discussed a number of possible explanations, such as differences in cycling rates among the two socioeconomic groups. However, they also noted that a general programme concerning road traffic injuries was in place in the Montérégie region during the cycle helmet campaign.
Macpherson et al. (2002)
Macpherson et al. (2002) examined the effect of helmet legislation on cycle-related head injuries by comparing regions with and without legislation. The authors examined the period from 1994 to 1998. In that time, legislation was implemented in Ontario in

Technical Annex
TRL 89 PPR 446
October 1995, New Brunswick in December 1995, British Columbia in September 1996 and Nova Scotia in July 1997. The legislation applied to children only. Data were collected for children aged five to 19 years from the Canadian Institute of Child Health. Head injury was defined as any injury to the head, face or brain. Children residing in the provinces with bicycle helmet legislation were the intervention group, while the control group were children in the rest of Canada. Hospitalisation rates from the provinces were combined, irrespective of when the legislation was passed. The authors maintained that this approach was taken for methodological reasons and would confer a conservative estimate of the protective effect of the legislation. The head injury rate was similar in both groups (legislation and no legislation) before the legislation was implemented. However, the cycle-related head injury rate declined significantly (45% reduction) in provinces where legislation had been adopted compared with other provinces and territories (27% reduction). No reduction was found in other cycle-related injuries, suggesting the decrease in head injuries was not related to a decrease in cycling. Logistic regression was used to investigate (some) potential confounding variables such as age, gender, socioeconomic status; however, legislation was the only significant variable of those examined.
Robinson (2003) responded to the article in an electronic letter. The letter criticised Macpherson et al. (2002) by pointing out that trends unrelated to helmet use were observed in head injury rates in Australia and New Zealand. Robinson also argued that pedestrians should be used as a control group and that changes in cyclist head injury over time should be consistent with changes in helmet use. Robinson did not explain these comments further; however, pedestrians are usually suggested as a control group to investigate whether other, broader efforts to reduce injury have influenced the data. However, Macpherson did attempt to control for this by examining non-head injuries (which remained constant). Robinson’s comment about helmet use is important and highlights a limitation of the majority of helmet effectiveness studies. It is often impossible to determine whether an injured cyclist was wearing a cycle helmet from an administrative database. Observation studies can be used to estimate helmet use within a dataset, assuming that the observed cyclists were representative of those in the dataset. However, it is possible that helmet use was observed in areas where cyclists were more (or less) likely to wear a helmet than the cyclists represented in the administrative dataset.
Grant and Rutner (2004)
Another study that compared areas with and without legislation was reported by Grant and Rutner (2004). Their study assessed the effect of legislation on cycling fatalities among juveniles in the United States. The study period comprised 1975 to 2000. Since 1992, more than one third of states had passed legislation requiring children and adolescents to wear a cycle helmet. The Fatality Analysis Reporting System was used to determine the number of fatalities among juvenile cyclists and other control groups (adult cyclists and pedestrians), by state and by year. State-wide cycle helmet laws were then identified (typically, there was a cut-off of 16 years in the legislation). Finally, a set of control variables collected. These were classified as time-invariant and time-varying factors. Although the helmet laws came into force during the 1990’s, Grant and Rutner (2004) found that cycling fatalities reduced throughout the study period, despite a doubling of motor vehicle miles. This was attributed to a reduction in cycling. Time series of cycle use at the state level were not available; however, National Sporting Goods Association data was mentioned, which revealed that a 12% reduction in cycling fatalities was associated with a 21% reduction in overall cycle use (no reference was provided). Grant and Rutner (2004) investigated whether youths were choosing other means of transport instead of cycling, although this was examined indirectly, from pedestrian deaths and per capita vehicle miles. No evidence of substitution was found, but the data did not address the key question: whether youths were cycling less. The final conclusion of the study was that helmet legislation reduces fatalities by about 15%

Technical Annex
TRL 90 PPR 446
in the long term, but less in the short term, without leading to an increase in pedestrian or motor vehicle fatalities. This did not reflect the more detailed discussion about trends in cycling and their influence on fatalities.
F.1.3 Discussion of Evidence from Population Studies
Large population studies have revealed very mixed evidence for the effectiveness of cycle helmets. Studies that reported positive evidence were based largely on children (who would be more likely to fall from a height within the drop height in helmet standards). In addition, responses to a number of the studies were critical of the methods used, or of the author’s conclusions, often with some justification. However, studies that found no evidence for the effectiveness of cycle helmets also had drawbacks. For example, these were usually based on Police-reported collision data that included a very high proportion of motor vehicle accidents (see Appendix A).
Unfortunately, important limitations were found in each of the large population studies reviewed here, which limits their use for determining the effect of helmet use on head injury. While it would be difficult to design a study that could provide a definitive answer to the question of the effectiveness of cycle helmets against head injury, the review has highlighted a number of important study design aspects that should be addressed.
It is preferable for population studies to comprise several years of data, particularly where there has been an intervention such as helmet legislation. There must be an adequate period to identify any pre-intervention trends and to be confident that any effects that are observed, post-intervention, are maintained. However, when examining several years of retrospective data, consideration must be given to changes in helmet design and they way they are tested over the period of the study. Consideration must also be given to other safety initiatives that have taken place. While it should be possible to control for these potential confounders, it may be difficult to obtain accurate information.
A robust study must also include an appropriate control group for comparison. Various control groups have been used in the literature, including adult cyclists (as controls for children) or pedestrians. While there does not appear to be a broad consensus, pedestrians seem to be the preferred control group for cyclists. However, if an intervention is being assessed, the preferred control group would be an equivalent population of cyclists, with the same characteristics, who have not been exposed to the intervention.
One of the key limitations of the population studies was the lack of information about individual-level helmet use. Observation studies were used to estimate helmet use within the population, but helmet use may have been observed in areas where cyclists were more (or less) likely to wear a helmet than the cyclists represented in the population. An ideal study design would have access to a dataset that recorded helmet use directly.
A criticism of the population studies was that the effect on cycling participation rates was not considered adequately and may have explained observed reductions in head injury rates. It might be possible to control for this by comparing head injury rates with the rate of injury to other body regions, particularly the limbs, on the basis that injuries to other parts of the body would reduce also if there was a reduction in cycling.
Another aspect of population study design that could be improved is the definition and analysis of head injuries. In many studies this is not defined at all, either in terms of the part of the head that was injured or the severity of injury considered. Splitting head injuries into two groups would be a useful first step in improving the specificity of the studies: those injuries that a helmet may be expected to help (cranial vault and basal skull fracture, brain injury, scalp injury) vs. other head injuries (such as mandible fracture, tooth fracture, cheek injury). This would allow investigators to ensure that the

Technical Annex
TRL 91 PPR 446
results apply to serious head injuries that may mitigated by a cycle helmet, and are not influenced by other types of head injury.
Even in the case of studies where ‘head injury’ is defined more specifically, very broad definitions are used such as ‘traumatic brain injury’ (e.g. Ho-Yin Lee et al., 2005). Such a definition is too broad to be confident that there are no dis-benefits to helmet wearing. To address this question, brain injuries should be classified in to two groups: focal and diffuse types. This level of detail would be necessary to be certain that diffuse injuries are not increased through helmet wearing. This seems unlikely (at least on average) from biomechanical reasoning (see Section 4.4), but it would be useful to confirm this with accident data.
Another influence on the effectiveness of a cycle helmet is the accident severity and circumstances. The lack of detailed information in administrative datasets has made it harder to control for these potential confounders in the population studies to date. Thompson et al. (1996) controlled their analysis of the effectiveness of cycle helmets for crash involvement with a motor vehicle, type of surface hit, speed of bicycle and damage to the bicycle. However, this was a case-control study that supplemented their data with a questionnaire. Nevertheless, it would be desirable to apply similar controls in an ideal population study design.
Finally, a variety of statistical techniques were used in the literature. Some of the studies have been criticised for methodological short-comings, but a coherent view on the most robust approach has not emerged.
F.2 Hospital Admission Studies
The hospital studies reviewed in this section range from analyses of national-scale hospital admissions administrative databases to small sample surveys at a single Accident and Emergency unit. These latter studies may be prospective, collecting specific information on cyclist accidents at the time of admission and during treatment, or retrospective, based on reviews of local A&E records.
Helmet use information may be derived from a range of sources, such as the cyclist themselves at the time of treatment, ambulance crews, or from follow-up questionnaires. For large scale studies, such as Cook and Sheikh (2003) helmet use was based on observational studies and was not known for individual cyclists.
This section again focuses on studies that have been published since the last review of cycle helmet effectiveness reported by Towner et al. (2002). The abstracts collected from earlier top-level searches of ITRD, TRIS, Science Direct, and MedLine – as required for the overall cycle review project and described in Knowles et al. (2009) – were saved in Microsoft Word documents and were then searched for the following terms through the ‘Find’ option:
• Emergency department/Accident and Emergency/Hospital AND
o Bicycle/bicyclist accident/incident; OR
o Helmet; OR
o Head impact/injury; OR
o Brain impact/injury.
Further studies were identified by browsing (e.g. using the reference lists of other publications to identify relevant pieces of work). Studies were selected from 2002, where the last DfT review of cycling stopped (Towner, 2002).

Technical Annex
TRL 92 PPR 446
F.2.1 Overview of Hospital Admission Studies
A total of eleven studies were identified using the approach described above; two were from the UK and nine were from outside UK including the USA, Australia, and the Middle East. Studies varied in size, the largest study having a sample of 16,406 (Cook and Sheikh, 2003), and the smallest being based on 86 cases (Depreitere et al., 2004). On further examination, four studies were excluded from consideration: Eid et al. (2007) was excluded as only two of their 200 cyclists were wearing helmets, and therefore there was an insufficient sample to analyse; Depreitere et al. (2004) was excluded for the same reason—only three of their 86 cyclists were wearing helmets; Karkhaneh et al. (2008), and Meuleners et al. (2007) were excluded because they did not consider the effectiveness of helmets.
Where studies reported the cause of the accident, the main cause was due to a fall from the bicycle; the average percentage was around 60%, other vehicles were reported as being involved rarely. This is very different from the proportion highlighted in population studies (see Appendix F.1).
The majority of studies recruited cases and controls from those who presented to an emergency department for treatment, though some restricted their study only to those who had been admitted to hospital.
The focus of the studies varied, as would be expected. Among the issues being researched were: effectiveness of different helmet types; differences in effectiveness on head and brain injuries, and head and facial injuries; differences in effectiveness in adults and children; differences in effectiveness of helmets in accidents involving, and not involving, vehicles.
F.2.2 Individual studies
Cook and Sheikh (2003)
Cook and Sheikh (2003) examined hospital admission data for a six year period between 1995 and 2000 in the entire of the UK. The database they used contained cyclists and pedestrians admitted to hospital during this period, either through an emergency admission, or through self-admission. Thus presentations at Accident and Emergency departments that did not lead to admission were not included, and neither were deaths before arrival at hospital. Only first presentations were included and only if full discharge information was available. All accidents, including those that included a motor vehicle, were included. The use of pedestrians admitted during the same period as a control group attempts to control for changes in hospital admission procedures during the period studied.
Head injuries (defined as fractures of the vault or base of skull, intracranial injuries or other, unspecified injuries to the head) were expressed as a percentage of the total admissions for cyclists and pedestrians, for each month of the study period. Among cyclists admitted to hospital, the percentage with a head injury reduced from 27.9% in 1995/96 to 20.4% in 2000/01; an estimated change of -8.49% (95% CI: -6.75% to -10.2%). Similar decreases were found among adults and children (≤16 years). For pedestrians, the percentage with a head injury declined from 26.9% in 1995/96 to 22.8% in 2000/01; an estimated change of -4.94% (95% CI: -3.79% to -6.10%). Modelling cyclists and pedestrians together, the authors determined that there was a greater reduction in cyclist head injuries (p=0.03). Helmet wearing data (16.0% in 1994; 17.6% in 1996; 21.8% in 1999) from another study (Bryan-Brown and Christie, 2001) was used to explain the trend in cyclist head injury.
Cook and Sheikh concluded that based on the difference in the drop in head injury percentages for cyclists and pedestrians the most plausible explanation was the

Technical Annex
TRL 93 PPR 446
increased cycle helmet wearing rates over the time period. They did acknowledge that there may have been other improvements to cycle safety during this time period (for example changes to infrastructure, traffic calming), but considered that it was unlikely that these changes would have selectively affected head injuries in the way that helmets should do. The authors estimated that (based on the difference in cyclist and pedestrian head injury percentages, and helmet wearing increase over the time period) helmets prevent 60% of serious head injuries. This estimate is in line with the 63% to 88% range estimated by case control studies.
A number of rapid responses (electronic letters) were posted to this study, mostly criticising aspects of the methodology or the results. Detailed criticism was set out by Robinson (2004). Robinson noted that another explanation for the fall in cyclist head injuries could be increases in cycle lanes and traffic calming measures (intended to lower the risk of collision with motorised traffic, and hence the proportion of total accidents involving motor vehicles). This is a common criticism of helmet effectiveness studies in the wider literature. In fact, Cook and Sheikh (2003) made this point also, although they considered helmets to be the most plausible explanation for the extra reduction in head injuries in cyclists compared with the pedestrian control group. Nevertheless, it was a valid criticism to highlight that no attempt was made to account for these other factors, particularly for the estimate of the effectiveness of cycle helmets.
Further criticism was published by the Bicycle Helmet Research Foundation on their web site: cyclehelmets.org (accessed February 2009). The Foundation made a number of comments. Their first comment was that helmet use was derived from observations made on main roads. Although no explanation was provided, the implication was that the cyclists could have been injured in a range of locations (i.e. where helmet use rates might be different from main roads). Clearly, it would have been preferable to use actual helmet use; however, this would not have been recorded in the Hospital Episode Statistics database. The Foundation also noted that helmet use for children declined from 17.6% in 1994 to 15.0% in 1999 on major roads, yet the reduction in child head injuries was attributed to an increase in helmet wearing. However, most child casualties are not on major roads and therefore the comparison with these helmet wearing rates is not a good measure. Cook and Sheikh (2003) did not report or comment on helmet use rates for children only. However, in a reply to an electronic letter that made similar comments, Cook and Sheik (2004) explained that helmet use had indeed fallen among children between 1994 and 1996, but did not change significantly from 1996. They added that there was a corresponding increase in the percentage of children with a head injury between 1994 and 1996, but from 1996, head injury remained constant. This is an example of the different ways that the same data can be analysed and interpreted by different researchers. It is very important that population-level data is analysed very carefully. The final comment made by the Foundation was the same as that made by Robinson (2004), namely that other changes in the cycling environment were not considered.
Cook and Sheikh (2003) provide useful data on the proportion of head injuries among cyclists admitted to Hospital in England. However, as a study of the effectiveness of helmets it has a number of limitations. It is also the case that cyclists would have had to receive a serious injury to be admitted to hospital. The study therefore excludes those who received less severe injuries. If helmets are effective, a proportion of cyclists involved in accidents that result in head impacts would be ‘saved’ from injury and would therefore not present at a hospital. The omission of such cases would lead to an underestimate of the effectiveness of cycle helmets.
Hewson (2005a)
Hewson (2005a) also analysed the Hospital Episodes Statistics database. The method followed a similar approach to Cook and Sheikh (2003), whereby the database was used to obtain the proportion of cyclists with a head injury; however, Hewson (2005a)

Technical Annex
TRL 94 PPR 446
analysed the period from 1989 to 2003, and focussed on children (< 16 years). Head injury included fractures of the vault or base of the skull, intracranial injuries or other, unspecified injuries to the head. Hewson also used STATS19 to examine the relationship between male and female child cyclists killed or seriously injured in a Police-reported accident between 1991 and 2003. The STATS19 analysis revealed no clear trend in the proportion of males in the injury group, during most of the time period; however, there was some evidence of an increase in the proportion of males towards the end of the period. As expected, the analysis of the Hospital Episodes Statistics database followed the same trend as Cook and Sheikh (2003), in that the proportion of child cyclists admitted to hospital with a head injury fell. This was the case for both males and females, which followed each other closely from 1992. When comparing the cyclist data with pedestrian data, it was apparent that head injury had fallen faster in the cyclist group than the pedestrian group. However, the key point raised by Hewson was that the difference could not simply be due to cycle helmet use because the time series was inconsistent with the helmet use data. Information on helmet use was obtained from the same source as Cook and Sheikh (2003); however, there was additional data for 2002 (25.1% overall helmet wearing). In addition, Hewson noted that helmet wearing appeared to be declining slightly among male children, such that there was a widening gap in wearing rates between male and female children. It was surprising, therefore, that no differences were found between male and female child cyclist injuries, in spite of the widening gap in helmet use rates.
Hewson (2005a) cautioned that it would be an over-interpretation of the results to argue that helmets are not effective. He added that, while it may seem counter-intuitive, the lack of an effect at a population level is still consistent with evidence for the benefit to an individual in wearing a helmet. Unfortunately, this comment was not explained further, although reference was made to a study by Simpson (1951) that describes a phenomenon whereby the observed population effect can be the complete opposite of sub-group effects. Hewson also noted that the population was poorly characterised in terms of its helmet use and differential exposure to injury.
Both studies by Hewson could be interpreted as demonstrating that cycle helmets are not effective; however, this would be inaccurate. Hewson (2005a) noted a fall in head injuries over and above that for pedestrians in hospital admissions data. However, direct helmet use was unavailable and hence this was estimated from other observation studies.
Scottish Executive (2005)
This study examined a sample of 806 cyclists who had been injured as a result of cycling between 1st Sept 2003 and 31st August 2004, and had presented at one of five Accident and Emergency departments in the Lothian and Borders region of Scotland. In addition to collecting data on the types of accidents happening, the study also examined the effectiveness of helmets in the sample on different kinds of injury.
For 725 (90%) of the cases, no other vehicles were involved in the accident, and the authors state that most of the injuries were minor, with only 4% leading to admission to hospital. The only examination of helmet effectiveness was broken down by children (defined as <16 years) and adults (defined as ≥16 years), and by area of the body injured (head and neck; face; upper limbs; lower limbs; chest or abdomen; spine; and not stated). No clear definition of head injuries is given. Head and neck injuries were combined for the analysis. Injuries to the head and neck accounted for 11% of all casualties and injuries to the face accounted for 15%.
The study reported that those cyclists wearing a helmet were less likely to have a head and neck injury than those not wearing a helmet (7% of sample compared to 14% of sample) while they were more likely to suffer an injury to the upper limbs (46% compared to 35%) or lower limbs (25% compared to 17%). The difference in head

Technical Annex
TRL 95 PPR 446
injuries between helmeted and non-helmeted cyclists was more pronounced for children (8% compared to 14%) than for adults (7% compared to 11%).
Overall this study is weak on methodology. No mention is made of the statistical variability of the data (for example the confidence intervals around the calculable odds ratios), and no mention is made of whether the apparent difference in efficacy of helmets for children and adults is statistically significant.
This study attempts to address the issues of the different effectiveness of cycle helmets for adult and child cyclists, and the issue of using a control group. It should be noted that the largest helmet wearing rate was in cyclists injured in off-road or ‘mountain trail’ locations. This may explain why helmets seems to correlate with an increase in the number of upper and lower limb injuries and a decrease in head and neck injuries. Possible differences in type of accident (due to the location of the accident as being off- or on-road/cycle path) being confounded with helmet wearing make the findings less robust than if the groups of cyclists had been deliberately matched for such variables.
Berg and Westerling (2007)
Berg and Westerling (2007) studied hospital discharge data for the whole population of Sweden in the period from 1987 to 1996, during which time helmet wearing rates were known to have increased in all categories of cyclist according to large scale annual surveys. The study examined the trends in cycling-related head injuries over this time, in different age groups.
The total number of cycling-related injuries during the study period was 49,758. The definition of head injury used was skull fracture, concussion, or head injury except skull fracture and concussion, using the Swedish version of ICD-9 (the World Health Organisation’s International Classification of Diseases) – ICD-9800-4, ICD-9850, and ICD-9851-4 respectively. The cases were also split by whether they had collided with a motor vehicle, or had been involved in some other kind of cycle accident.
Incident rates (number of hospital discharges divided by the population of Sweden for that year, multiplied by 100,000) for the age groups 0 to 15, 16 to 50, 51 to 65 and ≥66 were calculated. Statistically significant drops in incident rates of cycle-related head injuries were observed for boys and girls aged 15 and under, but no change in non-head injuries was observed over the same time period. This pattern of findings was true for collisions involving motor vehicles and other cycling accidents. In this age group there was also a drop in the incident rate of concussion and skull fractures. People aged 16 to 50 years showed a significant increase in incident rate for head injuries and non-head injuries, but no change in head injuries when a motor vehicle was involved. If the proportion of head injuries (to overall injuries) was used as a measure, an 11.5% reduction was noted for children, while no change was noted for adults.
The authors discussed various shortcomings of their methodology, including the lack of exposure data for all groups. However the authors concluded that the most plausible explanation for the decrease in head injuries among child cyclists during the period was that helmet wearing rates were known to have increased during this period—from ~20% to 35% in children ≤10 years old riding in their leisure time, from ~5% to 33% among school children, and from ~2% to 14% in adults (Nolen et al., 2005; cited in Berg and Westerling, 2007).
Again this study does not seem to address all the methodological concerns raised regarding hospital studies (see Section 5.1.1). However it does address the issue of age, and of collision type. Additionally, the study mentions some other evidence for the wider debate on helmets, and acknowledges that studies looking at diffuse axonal injuries and angular acceleration of the head (and a possible increased risk when poorly fitted helmets are used) need to be considered in the wider debate on compulsion. However there is no real discussion of why the incidence rate for head injuries in adults rises

Technical Annex
TRL 96 PPR 446
during the period studied, especially since cycling exposure was known to reduce by one third between 1992 and 1996.
Abu-Zidan, Nagelkerke and Rao (2007)
Abu-Zidan et al. (2007) sought to address directly the issue of whether helmets have a causal effect on the severity of head injuries once other differences between helmeted and non-helmeted cyclists (e.g. higher rates of legal hand signals and obeying stop signs in helmeted cyclists – Farris et al., 1997) are controlled for.
Records of patients (n = 297) admitted with a cycle-related injury to a hospital in Perth, Australia were examined. The records contained all injuries including those that led to deaths, unless the death occurred before admission. Also all records were for patients over 13 years of age. The hospital treats injuries with high Injury Severity Scores, and admissions (rather than just presentations at Accident and Emergency) were used, so most injuries were serious.
The authors asked whether the injury severity for head injuries differed between helmeted and non-helmeted patients, and crucially whether this difference (if it existed) was larger or the same as the difference in ISS scores for all injuries (including non-head injuries) between the groups. If general differences in the care taken by helmeted cyclists were to blame for their lower head injuries, then one would expect to see all injuries (even non-head injuries) being less serious in helmeted cyclists.
Injury severity scores were calculated manually using the Abbreviated Injury Scale handbook. Head injury was defined as head/neck AIS score of more than zero.
The analyses showed that helmet wearing reduced the severity of head injuries, but not non-head injuries. Overall logistic regression analysis suggested that that wearing helmets can reduce head injuries by half. The authors also note that their design could not rule out the impact of confounding variables (e.g. better behaviour by cyclists who wear helmets) completely, but that the research question answered did show that helmets do have a reducing effect on head injury severity in addition to any other confounding group differences. However, there is no information on the types of injuries prevented within the head injury category - specifically there is nothing mentioned on diffuse axonal injuries, and also ISS scores were calculated for the whole body, not just the head - so it remains possible that a large reduction in the number of less severe injuries is masking a small increase in these specific types of injuries, as has been argued by some authors.
Hansen, Engesaeter and Viste (2003)
Hansen et al. (2003) explored the protective effect of different helmet types through a case control methodology in Norway using a sample of 991 cyclists. The study employed two control groups: a main control group made up of cyclists who had injuries not including the head/neck (emergency room controls); and a second ‘population’ control group made up of cyclists who had been involved in an accident, regardless of whether they had sustained any injury. Cases were matched to controls in both control groups on the basis of age and gender. Data were collected by means of questionnaires. Effects were analysed for three age groups of cyclist (< 9 years, 9–16 years, and > 16 years), and type of accident (collision with car, collision with obstacle, fall).
Head injuries were defined as injuries to the forehead, scalp, skull, ears and brain. Face injuries were defined as injuries to the eyebrows, eyes, cheeks, mouth or chin. Skeletal injuries to the nose, maxilla, and mandible were counted as face injuries. The severity of injuries was coded according to the Abbreviated Injury Scale, and the Injury Severity Score (ISS) was calculated for each patient.
290 of the cases had face injuries, and 281 had head injuries to regions of the head other than the face. Neither injury type was broken down into sub-areas. Helmet users

Technical Annex
TRL 97 PPR 446
were more often involved in a collision with a moving object than non-helmet users. 11.4% (n = 32) of the patients with head injuries (face not included) were using a hard shell helmet at the time of the accident, and 9.6% had been using a foam helmet. The corresponding percentages in emergency room controls were 26.4% and 11.4% for hard and foam helmets respectively. The odds ratio of getting head injuries was 0.36 for users of hard shell helmets compared to non-helmet users. There was no difference with respect to hard shell helmet wearing between the cases and the emergency room controls when looking at face injuries. However when compared to the population controls the odds ratio of sustaining a face injury was 0.42 for wearers of hard shell helmets.
Overall, 9.6% (n = 27) of the patients that had sustained injuries to the head had been using a foam helmet at the time of the accident. There was no difference in the risk of getting head injuries between users of foam helmets and non-helmet users, regardless of which control group was used. However there was an increased chance of sustaining a face injury when wearing foam helmets, an effect almost entirely due to the increased risk shown by children under the age of 9 years old, who had a fourfold increase in risk of face injuries compared to emergency room controls. The authors suggest that this may be due to the different accident profiles of children under 9 years old, since they were more likely to have face injuries overall when compared to other age groups, or that it may be due to the likelihood of helmets not fitting properly being greater in this group. Also the authors note that they defined head injuries as anything above the eyes; hence a face injury was anything below the eyes and down to under the chin. This is a different definition of face injuries to some previous studies that have failed to show any deleterious effect of foam helmets on face injuries (i.e. these previous studies have included injuries to the forehead as face injuries) and may explain this result.
Recommendations made in the study were that all cyclists should wear hard shell bicycle helmets while cycling, since these helmets reduced the likelihood of sustaining an injury to the head for all age groups. The study has well-matched control groups, and attempts to address the question of helmet efficacy for multiple age groups and also for two helmet types. However there is no mention of differences of effectiveness of helmets on head injuries between the different accident types, although the authors report an increased chance of sustaining face injuries when gender, age groups and type of accident are accounted for in a logistic regression. Presumably this effect is carried almost entirely by children under 9 years old wearing foam helmets. The paper also illustrates some of the finer details regarding the effect though (i.e. different types of helmet; different types of injury such as face injuries below the forehead) which need to be followed-up in other research.
Heng, Lee, Zhu, Tham and Seow (2006)
Heng et al. (2006) examined helmet use in a sample of 160 cyclists presenting to an emergency department in a hospital in Singapore between Sept 1st 2004 and May 31st 2005. Patients were either identified at triage, or later from records if they had to bypass triage (i.e. go straight to resuscitation). The authors reported that helmet use was significantly related to fewer cases of head and face injury, and a lower ISS score. Head and face injuries were broken down into soft tissue, intercranial bleed (head only) and fractures, but sample sizes were too low to comment on the effectiveness of helmets across these three types, and no information was given on the region of damage that relates to head or face.
The authors also presented a brief summary of some of the wider arguments in the debate on helmet compulsion (including the fact that Australian studies have shown that helmet compulsion may lower cycling rates) and also that other road safety interventions will be necessary to solve the problems of cyclists, beyond just improving cycle helmet wearing rates.
The paper provides evidence that helmets protect against the occurrence of head injuries, and towards a lower ISS score.

Technical Annex
TRL 98 PPR 446
Thompson, Rivara and Thompson (1996)
In a study by Thompson et al. (1996) a case-control methodology was employed (where cases were patients with head and brain injuries from cycling accidents and controls were cyclists without head or brain injuries). 3,390 cyclists (of 3,854 injured or killed during the period) were recruited between March 1992 and August 1994 from seven hospitals in Western Washington, and from two Medical Examiners Offices. Various data collection methods were used including questionnaires, abstraction of medical records, in some cases examination of bicycle helmets and measurements of cyclists’ heads.
Head injuries were defined as all injuries to the scalp, forehead, ears, skull and brain, including all superficial lacerations, bruises and abrasions, as well as fractures, concussion, cerebral contusions and lacerations and all intracranial haemorrhages (subarachnoid, subdural, epidural and intra-cerebral). Also defined were brain injuries (concussion or more severe intracranial injury, excluding skull fractures without accompanying brain injury) and severe brain injuries (an intracranial injury or haemorrhage, including all cerebral lacerations/contusions, and subarachnoid, subdural and extradural haemorrhages).
Overall, the helmet wearing rate was 50.6%, with hard shell helmets most frequently used (49%) compared with soft- and no-shell- helmets. Overall, helmets were reported to prevent 69% of head injuries, 65% of brain injuries and 74% of severe brain injuries. The protective effect of hard shell helmet for brain injuries was 73% compared with 58–59% for other types, and for serious brain injuries was 83% compared to 70%. Similar patterns of protection were found when only accidents involving a motor vehicle were considered. The Study compared helmet effectiveness in four different age groups (<6 years, 6–12 years, 13–19 years and ≥20 years), and found no evidence for any differences in helmet effectiveness across the groups.
The study also examined the effectiveness of helmets in reducing facial injuries, defined as injuries to the jaw, lips, cheeks, nose, eyes, forehead and mouth. Only serious injuries (fractures and lacerations) were counted, and were categorised in the analysis as upper (forehead, orbit, eyes and ears), middle (nose and cheeks) and lower (lips, mouth, and lower jaw). 700 cyclists from the overall sample had injuries of sufficient severity to the face to be included in the analysis. Helmets were found to reduce the risk of serious facial injuries by 50%, with most effect for upper and middle regions.
The study also examined ‘fit’ of the helmet, by asking cyclists how well they felt the helmet fitted at the time of the crash. A clear dose-response relationship was demonstrated between this rating and head injury likelihood, although it was noted that recall bias may explain these results (i.e. riders who had injuries assuming that fit was bad, because they had injuries).
Other findings included: no relationship between neck injury and helmet-wearing; and analysis of the damage to helmets by location - most damage was sustained to the front of helmets.
Overall this study covers many of the criticisms made of hospital studies. Appropriate control groups appear to have been used, in a large sample, and head, brain and facial injuries have been broken down by severity, with all helmets proving effective at reducing all injury types, including those sustained in accidents with vehicles. All ages of cyclist benefited from equal protection. Although the findings are at odds with some others reported in this section (for example, the finding by Hansen et al. that foam helmets do not protect against head injury) the study seems to provide strong evidence that helmets protect against head and brain injuries, including severe ones. Brain injuries were well characterised compared with many studies, but the information given is not sufficient to be able definitively to rule out the possibility suggested in the literature that an increase in serious diffuse brain injuries (with long-term impairment outcomes) is masked by a greater reduction in other, less serious, head injury types.

Technical Annex
TRL 99 PPR 446
F.2.3 Discussion of Evidence from Hospital Admission Studies
Taken as a whole, the literature reviewed in this section addressed many of the criticisms and issues considered, both in terms of case control and other hospital study designs, and in the overall debate on cycle helmet effectiveness.
The issue of confounding variables is considered in most of the publications reviewed. Indeed Hagel and Pless (2006) make the case that hospital studies (and case-control studies in particular) are more able to control confounding variables than are larger population-level studies. Nevertheless, most of the publications reviewed acknowledge that it was not possible within the study design to control fully for all confounding variables.
The evidence regarding facial injuries is more equivocal (e.g. Hansen et al., 2003) than that on head or brain injuries, and where facial injury protection is found (e.g. Thompson et al. 1996) it appears to be greater for upper face injuries than middle and lower. Multiple studies examine the differences between effectiveness for adults and children, with again equivocal data (some studies showing greater benefits for children, and some no differences between children and adults).
A number of studies reported that helmets are effective in reducing head and brain injuries for both accidents where cyclists have fallen off a bike by themselves, and for accidents involving vehicles.
However, there is no single study within those reviewed that meets all of the criticisms and issues (Thompson et al., 1996 comes closest). Most importantly, not one study meets the criticism of examining the effect of helmet wearing on diffuse axonal injuries, which are often offered as particularly relevant in the debate over cycle helmet effectiveness, due to their serious nature and particularly the long-term impairment that may result from these injuries. It is possible that within the datasets of the papers reviewed there are details relating to these injuries, and that with large enough samples it would be possible to run the analyses needed to answer this question - specifically whether helmets reduce (or increase) the chance or severity of this type of injury. The issue of what the net benefit of helmets might be can then be settled, as it should be possible to see whether large reductions in minor injuries are (or are not) being outweighed in cost terms by small increases in very serious injuries.
In the case control design it is not always possible to control for confounding variables that may explain any differences in outcome in the case and control groups; while some of the studies addressed some of the issue of confounding variables, none did so entirely. A further criticism is that there is often no discussion of the differential efficacy of helmets on different groups of cyclists - in particular children and adults. Again, most of the studies here looked at type of cyclists to some degree. As can be seen from the table, definitions of injury were very inconsistent and there was a fairly even spilt between whether frequency or severity was recorded.
F.3 Summary of Population and Hospital Admission Studies
Most of the population studies reviewed studied the effects of cycle helmet legislation or other interventions on head injury rates in children and adolescents. Many used adults as a control group, on the basis that legislation did not apply to adults; the implicit assumption is that the wearing rate for adults will not have changed over the study period and that adults will therefore control for any changes in the cycling environment. However, helmet wearing rates were not reported for adults (or children in some cases), so it is not possible to be certain that adults form an unvarying baseline to use as a control. Also, the types of cycling undertaken by adults and children may vary, so adults may not be an adequate control for environmental factors (such as traffic calming or the introduction of cycle paths).

Technical Annex
TRL 100 PPR 446
Notwithstanding the limitations of the studies, the reported effects of cycle helmet legislation or other interventions were mixed, from no significant change (Ho-Yin Lee et al., 2005), through a reduction in fatal injuries and an associated increase in other injuries (Kim et al., 2007), to a 50% reduction of fatalities (Wesson et al., 2008) and an 18% greater reduction in head injuries with legislation than without (Macpherson et al. 2002). Most studies were based on police reported accident databases, which are likely to tend towards the most serious accidents and particularly to under represent single vehicle cycle accidents (see Appendix A). Consideration of the mechanical performance of cycle helmets (see Section 3) would suggest that any protective effect of cycle helmets would be underestimated, possibly considerably, by the skew in the types of accident recorded compared with the whole population of cycle accidents. Cycle helmets cannot be expected to mitigate head injury in all circumstances, and a large skew towards multi-vehicle accidents will reduce the proportion of accidents in which a helmet may be expected to provide some protection.
Many of the population studies have very broad definitions of head injury, often including facial and minor injuries. Again, consideration of the mechanical performance of cycle helmets would suggest that they are unlikely to be protective against many face injuries. Inclusion of these injuries would therefore be expected to lead to an underestimate of cycle helmet effectiveness. With the difficulties in adequately controlling for helmet wearing rates for those cyclists involved in accidents, changes in the environment in which cycling activities take place, and other factors, it is maybe not surprising that the results of population studies are inconclusive.
The hospital studies also reported a range of effectiveness, from no benefit (e.g. Hewson 2005a), to a ‘reduction’ of head injuries (Abu-Zidan et al., 2007), to a reduction of 69% of head injuries, 65% of brain injuries and 74% of serious brain injuries (Thompson, Rivara and Thompson, 1996). Samples ranged from 160 cyclists presenting at an emergency department over a nine month period (Heng et al., 2006), to all cyclist hospital admissions in England over a six year period (Cook and Shiekh, 2003).
In the latter study, the effectiveness reported seems to be quite high. Cook and Sheikh (2003) reported a 3.55% reduction in cyclist head injuries (down to 20.4% of cyclists admitted to hospital) in parallel with helmet wearing rates increasing from 16.0% to 21.8% (an increase of 5.8%). If the incidence of cyclist head injuries drops 3.55% for a 5.8% increase in the wearing rate, then zero head injuries should occur when the cycle helmet wearing rate reaches approximately 55%. This is highly unlikely to be the case, even if cycle helmets are 100% effective in all cycle accidents that result in a head impact, which is also not the case. In a response to Cook and Sheikh’s papers, Annan (2004) expressed the same concern in a slightly different way. Annan found that the data in Cook and Sheikh indicated an effectiveness of 186%; ‘in other words, "helmet effectiveness" is so high that each helmet does not just save its wearer, but a non-wearer too.’
There are many factors that could help to explain the range of results in different studies. For instance, the wearing rate data is sourced from separate studies that may not be representative of helmet wearing rates for the whole population of cyclists. In particular, the wearing rate is reported to be different on roads with different speed limits, with higher wearing rates associated with higher speed limits. The majority of hospital admitted cyclists have an accident not involving any other vehicle (Appendix A), and a proportion will not even occur on the roadway. Estimates of helmet wearing rates based on road observations may therefore overestimate the total wearing rate. A proportion of helmets may not be worn correctly, or be in a suitable condition, which could also skew the results.
The above estimate assumes that the effect of helmet wearing rate on the rate of head injuries is linear. This may not be a reliable assumption, as those cyclists choosing to wear helmets may not have the same accident risk as cyclists choosing not to wear helmets, which could differ for different age groups. The effects may also be sensitive to
Technical Annex
TRL 101 PPR 446
the definition of head injury, which is often not well defined. For instance, most cycle helmets are not designed to protect the face, although various claims of a protective effect are made; if head injury rates include facial injury, the results are difficult to apply to an understanding of cycle helmet effectiveness.
If cycle helmets are effective in at least a proportion of cycle accidents involving head impacts, the cyclist may not have a head injury and so may not present at hospital, or may require lower level treatment that does not require admission to the hospital. This implies that a proportion of the ‘effective’ group will be missed, which may lead to an underestimate of cycle helmet effectiveness from hospital admissions data.
Both hospital admission and population studies have been found to have significant limitations that affect their ability to determine the effectiveness of cycle helmets. These include:
• Appropriateness of control groups
• Severity of injury considered
• Definition of head injury / specificity of information brain injury information
• Lack of control for other factors such as introduction of cycle lanes and traffic calming schemes, improved enforcement of speed limits (reasonable control for these cycling environment factors can be made by comparing the rate of suitable non-head injuries for cyclists with and without a helmet)


Technical Annex
TRL 103 PPR 446
Appendix G International Statistical Classification of Disease
The ICD-10 codes used in HES classify the following head injury types:
• S00 - Superficial injury of head
• S01 - Open wound of head
• S02 - Fracture of skull and facial bone
• S03 - Dislocation, sprain and strain of joints and ligaments of head
• S04 - Injury of cranial nerves
• S05 - Injury of eye and orbit
• S06 - Intracranial injury
• S07 - Traumatic amputation of part of head
• S08 - Other and unspecified injuries of head
Each of these is then further subdivided into specific injuries. For instance S02 - Fracture of skull and facial bones is further subdivided into:
• S02.0 - Fracture of vault of skull
• S02.1 - Fracture of base of skull
• S02.2 - Fracture of nasal bone
• S02.3 - Fracture of orbital floor
• S02.4 - Fracture of malar and maxillary bones
• S02.5 - Fracture of tooth
• S02.6 - Fracture of mandible
• S02.7 - Multiple fractures involving skull and facial bones
• S02.8 - Fractures of other skull and facial bones
• S02.9 - Fracture of skull and facial bones, part unspecified
The vault of the skull is defined as the frontal and parietal bones only. The occipital and temporal bones, which form significant parts of the rear and side of the cranium respectively, are entirely classified as base of skull.

Technical Annex
TRL 104 PPR 446
Furthermore, pedal cyclists injured in transport accidents are coded into the following classifications:
• V10 - Pedal cyclist injured in collision with pedestrian or animal
• V11 - Pedal cyclist injured in collision with other pedal cycle
• V12 - Pedal cyclist injured in collision with two- or three-wheeled motor vehicle
• V13 - Pedal cyclist injured in collision with car, pick-up truck or van
• V14 - Pedal cyclist injured in collision with heavy transport vehicle or bus
• V15 - Pedal cyclist injured in collision with railway train or railway vehicle
• V16 - Pedal cyclist injured in collision with other non-motor vehicle (e.g. a horse-drawn cart)
• V17 - Pedal cyclist injured in collision with fixed or stationary object
• V18 - Pedal cyclist injured in non-collision transport accident
• V19 - Pedal cyclist injured in other and unspecified transport accidents
Each of the V10 to V18 codes is further subdivided in to (more extensive codes are provided for the V19 classification):
• .0 - Driver injured in non-traffic accident
• .1 - Passenger injured in non-traffic accident
• .2 - Unspecified pedal cyclist injured in non-traffic accident
• .3 - Person injured while boarding or alighting
• .4 - Driver injured in traffic accident
• .5 - Passenger injured in traffic accident
• .9 - Unspecified pedal cyclist injured in traffic accident.
Accordingly, non-traffic accidents are specified by appending the appropriate V-code subdivision. A non-traffic accident is defined as ‘any vehicle accident that occurs entirely in any place other than a public highway.’ Unknowns are assumed to be traffic accidents: ‘A vehicle accident is assumed to have occurred on the public highway unless another place is specified, except in the case of accident involving only off-road motor vehicles, which is classified as a non-traffic accident unless otherwise stated.’ The graphs below omit injuries due to accidents that were recorded as non-traffic, but these were a small proportion of the total number of injuries.

Technical Annex
TRL 105 PPR 446
Appendix H Review of Cycle Accidents in Police Fatal Files
H.1 Selection of Cases
Between 2001 and 2006 there were 810 pedal cyclist fatalities of which 108 were in London and 702 were in areas outside of London (Table 7-12). TRL has recently carried out a cycling project for TfL which investigated all the available London fatal files between 2001 and 2006. Each fatal file was reviewed by the research team and the pertinent facts and contextual information describing their characteristics and why the collision occurred were recorded in a dedicated database. In total 92 pedal cyclist fatal files were coded for London which 66 cases had a coded post mortem report.
Table 7-12: Numbers of fatal files 2001-2006
2001 2002 2003 2004 2005 2006 Total
London files - coded 18 17 16 8 18 15 92
London files - not coded 3 3 3 0 3 4 16
Non-London file - held at TRL 44 39 29 26 13 7 158
Non-London file - not available 73 71 66 100 114 120 544
Total population (all fatal files) 138 130 114 134 148 146 810
For this project, a further 50 cases were coded covering rural areas. The final sample of cases still over-represents London with 65% of cases being London and 35% of cases being rural areas. The extra 50 cases were split equally between major and minor roads and were selected so that each file had a post mortem report.

Technical Annex
TRL 106 PPR 446
H.2 Details of the Sample
Each of the 142 accidents were classified using the definitions shown in Table 7-13.
Table 7-13: Definition of accident types
Accident Type
Definition
A Vehicle pulling out of side road collided with cyclist
B Vehicle turning into side road
C Vehicle overtaking cyclist collided with vehicle in other direction
D Cyclist rode into stationary vehicle
E Vehicle passed too close
F Cyclist crossing or entering road into path of vehicle
G Vehicle failed to stop at junction
H Vehicle drove into rear of cyclist
I Cyclist lost control – fell/went into path of other vehicle
J Cyclist moved into path of vehicle travelling behind/overtaking
K Cyclist failed to stop at junction
M Cyclist turning at junction failed to see other vehicle
N Vehicle moved to nearside and collided with cyclist
O Other
P Cyclist collides with open door of parked vehicle
S Single vehicle – cyclist only
Table 7-14 shows the frequency of each accident type for both the London and rural samples.

Technical Annex
TRL 107 PPR 446
Table 7-14: Fatality distribution by accident type and London/rural
Accident Type
Number of fatalities
London Rural
A 1 (1.1%) -
B 24 (26.1%) -
C - -
D 1 (1.1%) -
E 1 (1.1%) 2 (4%)
F 16 (17.4%) 5 (10%)
G 1 (1.1%) 1 (2%)
H 6 (6.5%) 13 (26%)
I 11 (12.0%) 3 (6%)
J 6 (6.5%) 7 (14%)
K 3 (3.3%) 1 (2%)
M 3 (3.3%) 4 (8%)
N 2 (2.2%) 2 (4%)
O 11 (12.0%) 6 (12%)
P 4 (4.3%) -
S 2 (2.2%) 6 (12%)
Total 92 50
Table 7-15 shows the age and gender distribution of the sample. It should be noted that the overall sample under-estimates children and over estimates females. The reason for this is that the London sample under represents the under 16s and smaller proportions of child cyclists are killed on rural roads. The London sample over-represents females.
Table 7-15: Age and gender distribution of fatalities
Age Gender Number of fatalities
London Rural
≤16 M 9 6
≤16 F 1 1
>16 M 57 38
>16 F 25 5

Technical Annex
TRL 108 PPR 446
Table 7-16 shows the distribution of the accidents by the total number of vehicles involved in the accidents (including the cyclists).
Table 7-16: Accident distribution by number of vehicles involved
Number of vehicles involved
Number of accidents
London Rural
1 2 6
2 85 43
3 5 1
The majority of accidents, both London’s and rural involved more than one vehicle. However the proportion of accidents involving only a single vehicle was higher in rural areas than in London, 12% in rural compared with 2% in London.
In the sample of London accidents, there were 90 multi-vehicle accidents that involved a total of 95 vehicles (other than the cyclists). For the rural accidents, the 44 multiple-vehicle accidents involved 4 other vehicles. Table 7-17 shows the types of the other vehicle involved in the accidents.
Table 7-17: Types of other vehicle involved in pedal cycle accidents
Vehicle Type Number of vehicles
London Rural
Motorcycle 4 -
Car/taxi 33 32
Minibus - 1
Bus/coach 8 1
Goods vehicle <3.5t 13 -
Goods vehicle >3.5t 37 8
Other motor vehicle - 2*
Ridden horse - 1**
Total 95 45
*The two ”Other motor vehicles” were a refuse truck and a line painting vehicle
** The accident actually involved two ridden horses, but only one was coded
Although the distribution of the detailed accident cases does not match the proportions identified from the STATS19 analysis, the database can be used to provide a more detailed insight into the characteristics of the main accident groups.

Technical Annex
TRL 109 PPR 446
H.3 Analysis of Cyclist Head Injuries in Fatal Accidents
A data sample of 116 fatal accident cases consisting of 66 urban accident cases and 50 rural cases where the post mortem results were available was selected from the data set of 142 cases described in Section H.2. This was used to investigate the head injuries sustained by cyclists in fatal accidents. One of the London cases and two of the rural cases were subsequently removed from the sample due to incomplete data, leaving a sample of 113 fatal accident cases. Of these 113 cases, 106 (94 percent) were cases where the cyclist had been in collision with at least one other vehicle. There were only 7 cases (6 percent) where only the cyclist was involved. It should be noted that this sample is unlikely to be fully representative of the national picture, but does provide a good indicative estimate of the likely benefit range. The bias towards London accidents results in a greater proportion of collisions involving the cyclists being run-over by large goods (HGVs) or passenger vehicles (bus/coach) than occur nationally. Cycle helmets are not effective in run-over events where the vehicle crushes the casualty and therefore the estimates provided are likely to be conservative for the national picture.
The breakdown of the types of opposing vehicle which the cyclists were involved in collisions with is shown in Table 7-18. This showed that a large proportion of cases involved collisions with either cars or goods vehicles over 3.5 tonnes.
Table 7-18: Breakdown of opposing vehicle type in sample
Opposing Vehicle Type
Number of vehicles
Motorcycle 3 (2.8%)
Car/taxi 52 (49.0%)
Minibus 1 (0.9%)
Bus/coach 6 (5.7%)
Goods vehicle <3.5t 8 (7.5%)
Goods vehicle >3.5t 33 (31.1%)
Other motor vehicle 2 (1.9%)
Ridden horse 1 (0.9%)
Total 106
The most severe injuries to the cyclists in the fatal accident cases were determined from the post mortem reports. The ‘most severe’ injury was defined as either the injury with the highest AIS level or the injury named in the post mortem report as being the cause of death.
The primary cause of the most severe injury to the cyclist was determined as being due to one of four main factors. These were an impact with a vehicle, an impact with the ground, being run over or caught by a vehicle, or multiple causes. In the sample, the most prevalent causes of the most severe injury were the impact with a vehicle and being run over or caught (Table 7-19). The cases where the injury was caused by ‘impact with ground’ includes all 7 cases where only a single cycle was involved. It should be noted that the cases where the cause of the most severe injury is defined as ‘Unknown’ were mostly cases where the cyclist impacted a vehicle and subsequently impacted the ground, and it is not known which impact caused the injury.

Technical Annex
TRL 110 PPR 446
Table 7-19: Cause of most severe injury to cyclist in sample
Cause of most severe injury
Number of cases
Impact with vehicle 39 (34.5%)
Impact with ground 18 (15.9%)
Run over / Caught 30 (26.5%)
Multiple causes 9 (7.9%)
Unknown 17 (15.0%)
Total 113
Of the 113 cases, there were 69 cases (61 percent) where a head injury to the cyclist was determined as the main cause of the fatality from the post mortem results.
The cyclist’s helmet usage in the fatal accident sample is shown in Table 7-20. This shows that out of the 87 fatal accident cases where helmet usage was known, 12 cyclists (14 percent) were wearing a cycle helmet, 2 of which came off in the collision. Out of the 57 cases where head injury was determined as the main cause of fatality and helmet usage was known, 4 cyclists (7 percent) were wearing a cycle helmet, 1 of which came off in the collision.
Table 7-20: Helmet use and head injury
Helmet use Total cases in
sample
Head injury main cause of
fatality
Percentage of fatal head
injuries
Helmet worn 10 3 30%
Helmet not worn 75 53 71%
Helmet use unknown
26 12 46%
Helmet came off in collision
2 1 50%
Total 113 69 61%
It was observed that the percentage of fatal head injuries was much lower for those cyclists wearing a helmet than for those who were not wearing a helmet. A chi squared test was performed in order to test whether there was an interaction between the two variables ‘whether head injury was the main cause of fatality’ and ‘whether a helmet was worn’, in other words whether there was a statistical significance to this difference. The test showed that it is highly likely (p=0.01) that there is an interaction between the two variables, i.e. whether a head injury is the cyclist’s most severe injury is dependent on whether the cyclist was wearing a helmet or not.

TRL Crowthorne House, Nine Mile Ride Wokingham, Berkshire RG40 3GAUnited Kingdom
T: +44 (0) 1344 773131 F: +44 (0) 1344 770356E: [email protected] W: www.trl.co.uk
ISSN 0968-4093
Price code: 4X
Published by IHS Willoughby Road, Bracknell Berkshire RG12 8FB United Kingdom
T: +44 (0) 1344 328038 F: +44 (0) 1344 328005E: [email protected] W: http://emeastore.ihs.com PP
R4
46
The potential for cycle helmets to prevent injury – a review of the evidence
There has been much debate in the literature and elsewhere regarding cycle helmets and their potential to prevent injury. This cycle helmet safety research report was commissioned to provide a comprehensive review of the effectiveness of cycle helmets in the event of an on-road accident, building on previous work undertaken for the Department for Transport (Towner et al., 2002). The programme of work evaluates the effectiveness of cycle helmets from several perspectives, including a review current test Standards; a biomechanical investigation of their potential limitations; a review of recent literature; and finally an assessment of the casualties who could be prevented if cycle helmets were more widely used.
This report focuses on understanding whether cycle helmets reduce the frequency and severity of injury in the event of a collision. It does not include detailed consideration of whether wearing (or not wearing) a helmet influences the likelihood of being involved in an accident, either through behaviour changes in the rider or in other road users.
The project concludes that in the event of an on-road accident, cycle helmets would be expected to be effective in a range of real-world accident conditions, particularly the most common accidents that do not involve a collision with another vehicle and are often believed to consist of simple falls or tumbles over the handlebars.
Other titles from this subject area
PPR213 Assessment of current bicycle helmets for the potential to cause rotational injury. V J M St Clair and B P Chinn. 2007
PPR223 New and improved accident reconstruction techniques for modern vehicles equipped with ESC systems. R F Lambourn, P W Jennings, I Knight and T Brightman. 2007
PPR241 Factors influencing pedestrian safety: a literature review. A Martin. 2007
PPR242 Reporting of road traffic accidents in London: Matching Police STATS19 with hospital accident and emergency data. Supplementary report for St. Thomas’ Hospital Central London. H Ward, S Robertson, K Townley and A Pedler. 2007
PPR248 Review of International Road Safety Good Practice. J A Castle and G E Kamya-Lukoda. 2007