The Potential Consequences of El Nino
13
El Nino ~ The Potential Consequences of Climate Variability and Change AGRICULTURE Educational Product Educators Grades 5-8
Transcript of The Potential Consequences of El Nino

El Nino~The Potential Consequences of Climate Variability and Change
AGRICULTURE
Educational Product
Educators Grades 5-8

El Niño
Suggested Curriculum Area:Science ... Math ... Social Studies
Suggested Grade Level:5-8
Learner OutcomesStudents will access the internet and collectinformation about the effects of El Niño for theirregion.
●
Students will be able to define global change.●
Students will become aware of climatic changes intheir region during an El Niño year.
●
Students will interpret data collected from a web site.●
Students will be able interpret a StandardizedVegetation Index (SVI) and draw conclusions abouttheir region.
●
Students will draw conclusions about the effects of ElNiño on agriculture in their region.
●
Concept IntroductionAfter studying about global climate change and El Niño,students will collect data about rainfall and temperaturevariations for their region during an El Niño year. Studentswill then examine a series of standardized vegetation indiceswith DataSlate to draw conclusions about the effect of ElNiño on their region.
ToolsDataSlate●
Data SetsSVI DataSlate Data set (zip file 2.5 MB)●
TutorialsIntroduction to DataSlate●
Interpreting SVI imagery●
El Nino: Teacher Page
http://ois.unomaha.edu/casde/casde/lessons/Nino/teacherp.htm

Teacher PreparationTechnologyThis lesson can be used in a one computer classroom as ademonstration, individually in a lab or in groups. The lessonis designed to last about one 50 minute period. Teachers needto be familiar with DataSlate and its basic operations. Theon-line tutorial can be used to become familiar with thissoftware. Teachers should also be familiar with all of the websites students will use. The computer used should be at least aPentium 90 (166 is better) with 16 MB of ram or a PowerMacintosh with 32 MB of RAM. Either platform needs aCD-ROM.
LessonThe teacher, if not familiar with ENSO events should reviewthe web pages listed in the resources section of this page.Introduce the concept of Global Change and discuss itsdefinition. Do the same with El Niño and ENSO. Distributeassignments and data sheets. Allow students to complete theactivity. Discuss findings as a class. This activity worksideally with cooperative groups.
ResourcesTeacher Talk Global Change a definitionWhat is El NiñoEl Niño, La Nina, and ENSO definitionsNOAA El Niño PageCurrent Research on El NiñoClimate Change FAQ
Student Pages
Environment• NCSS Strand VIII: Science Technologyand Society
Assessment Suggestions
Concept ExtensionsWhat are the effects of La Nina onagriculture in your region?
●
What are the current statistics for yourarea?
●
References
El Nino: Teacher Page
http://ois.unomaha.edu/casde/casde/lessons/Nino/teacherp.htm
El Niño Data Sheet
http://ois.unomaha.edu/casde/bblocks/, last modified 1/14/99, UNOmaha Office of Internet Studies
Curriculum StandardsNational Mathematics Standards• NCTM 5-8 Standard 1: Problem Solving• NCTM 5-8 Standard 4: MathematicalConnections
National Science Standards• NSES 5-8 Content Standard: Earth andSpace Science• NSES 5-8 Content Standard: Science inPersonal and Social Perspectives
National Social StudiesStandards,• NCSS Strand III: People, PLaces and
Data SlateA Tour with Data Slate
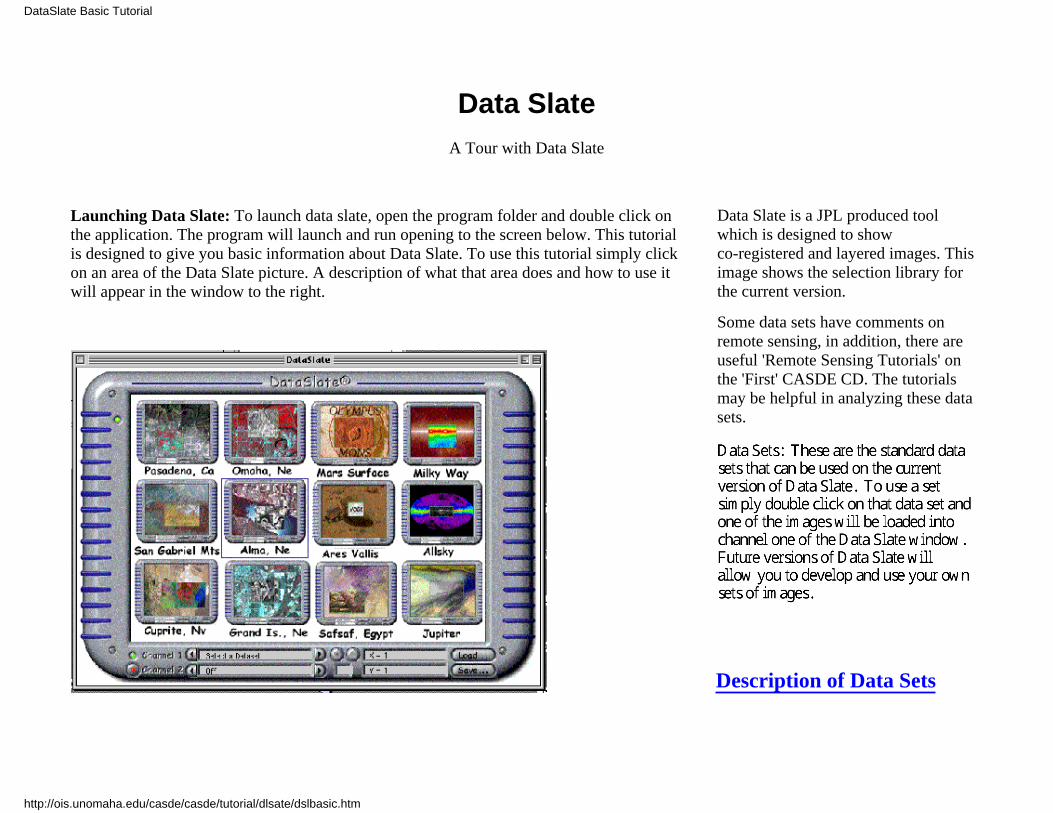
Launching Data Slate: To launch data slate, open the program folder and double click onthe application. The program will launch and run opening to the screen below. This tutorialis designed to give you basic information about Data Slate. To use this tutorial simply clickon an area of the Data Slate picture. A description of what that area does and how to use itwill appear in the window to the right.
Description of Data Sets
Data Slate is a JPL produced toolwhich is designed to showco-registered and layered images. Thisimage shows the selection library forthe current version.
Some data sets have comments onremote sensing, in addition, there areuseful 'Remote Sensing Tutorials' onthe 'First' CASDE CD. The tutorialsmay be helpful in analyzing these datasets.
DataSlate Basic Tutorial
http://ois.unomaha.edu/casde/casde/tutorial/dlsate/dslbasic.htm
Data Sets: These are the standard data sets that can be used on the current version of Data Slate. To use a set simply double click on that data set and one of the images will be loaded into channel one of the Data Slate window. Future versions of Data Slate will allow you to develop and use your own sets of images.

The Current Data Slate Library
Ares Vallis
Panorama - A panoramic view of the local Martian landscape. Find the image whichannotates the rock 'names'. Get out your 3-D glasses for 'three-D'! How is this imageprepared?
Safsaf Oasis
SIR-C - Click on the title for information about the data sets. These are Landsat and SIR-Cimages. SIR-C is an acronym for Spaceborne Imaging Radar on C band (6 cm). Check onthe Radar Tutorial from JPL for more detailed information on radar imaging. The fulltutorial resides on CD's 'SIRCED01 and 02' SIR-C Education Program CD's from JPL.More information on SIR-C and Imaging Radar may be found at:
http://southport.jpl.nasa.gov
Milky Way
When you click on different wavelength interrogations, we are reminded of how little theordinary eye is able to detect. How much of the electromagnetic spectrum is made up ofthe visible light section?
pz.4g3
http://ois.unomaha.edu/casde/casde/tutorial/dlsate/dslsets.htm
Go Back

All Sky
The 'information' screen tells us that posters are available.
Jupiter
A very active atmosphere.
Cuprite, Nevada
Some great comments on remote sensing! Read how minerals are observed and detected byremote sensing.
San Gabriel Mountains
It might be interesting to follow the San Andreas fault line through the image.
pz.4g3
http://ois.unomaha.edu/casde/casde/tutorial/dlsate/dslsets.htm
Go Back

Pasadena
Find the Rose Bowl!
Grand Island, Nebraska
Again, there is more information on remote sensing.
Alma, Nebraska
Find Alma in all of the images. Alma resides on the North shore at the upper end of thelake. Note that Republican City has moved!
Omaha
Page one of this tutorial describes locating some some landmarks in the images. The TM3band gives a good look at Eppley Airfield. Try overlaying the 'dem' with radar to see theMormon Bridge area. Perhaps you can see by the terrain why some western migrationcrossings were done here.
Go Back
pz.4g3
http://ois.unomaha.edu/casde/casde/tutorial/dlsate/dslsets.htm

El Niño and Plant GrowthActivity:During the 20th century the Earth's atmosphere has had tremendous amounts of CO2 added. Carbon Dioxide is agas that helps trap heat and contributes to global warming. As the Earth warms, sea temperatures have greaterfluctuation. There is evidence that global warming is contributing to more intense and severe El Niño events. Inthis activity you will investigate the effects of El Niño on plant growth and agricultural production during El Niñoyears where you live. You will be using the Internet to assist in this process.
Materials:Data collection sheet. (Thislink will open in a separatewindow.)
●
Pencil●
Computer●
DataSlate software●
Internet connection●
You are going to assume the role of an agronomist, an expert in soilmanagement and field-crop production. Your team is investigating theeffects of El Niño on the plant growth in your area so you can make apresentation to local farmers. You are interested in the effects of El Niño onthe agriculture for your area. You are mainly interested in precipitation andtemperature. You will be using Internet to connect to a NOAA, NationalOceanic and Atmospheric Administration, web site. From this web site youwill collect data on temperature and precipitation for your area during ElNiño years. Your task will be to prepare a presentation on what you havediscovered.
Part I DataCollection:
El Niño Impact on States
1. Connect to the El Niño Impact on States web site by clicking on the bluetext.
From this web site click on your state and you will see a page that hasEl Niño data for your state.
●
To get background information about your state, click on Discussion.Summarize and record your findings on your data sheet. Click theback button on your browser to return to your state's information.
●
El Niño and Plant Growth: Student Activity
http://ois.unomaha.edu/casde/casde/lessons/Nino/student.htm

and temperature. Be sure and click the back button on your browser toreturn to a previous page. When finished return to your state's mainpage.
Next you are going to compare Normal vs. El Niño AveragePrecipitation for NOVEMBER-DECEMBER. Click onNOVEMBER-DECEMBER and record on your data sheet thepercent above or below normal for the area in which you live. Forexample, an El Niño % of Normal 106 means that during El Niñoprecipitation is 6 percent above normal. After recording thisinformation, return to the main page and do the same forJANUARY-MARCH.
●
Part II DataAnalysis:
Standardized VegetativeIndex Tutorial
DataSlate Tutorial
If you have not done so, read through the Standardized Vegetative Indextutorial by clicking on the blue text. Click the back button on your browserto return to this page when you are finished.
If you have not used DataSlate you may want to go through the DataSlateTutorial before beginning the next part of the lesson.
Launch DataSlate by double clicking on its icon. Once the programhas launched, click the load button. You will be prompted for a file toload. Navigate to the SVIJuly folder and open it. Once inside thisfolder, locate the file SVIJULY.LBL, click on it and then click the'open' button. This will open the SVI data set. The first image you willsee will be the SVI image for July 1989.
●
El Niño and Plant Growth: Student Activity
http://ois.unomaha.edu/casde/casde/lessons/Nino/student.htm
From your state's main page, click on each time period. This will takeyou to the United States map that has temperatures for those dates.These maps show average temperatures or precipitation during ElNiño events. Examine the key for the map and record on your datasheet the information for your area. Do this with both precipitation
●

Click back to the 1989 image which was a drought year. Click on the'channel two' button and a window will open showing the same areaduring another year. Clicking the arrows to the right or left of thechannel two title will display another year in the window. Use thisinformation to make further comparisons of the bold face years .
●
Look at the years on your data sheet. Bold faced years are El Niñoyears. Compare your observations of normal years with El Niño years.Use the notes you made on your data sheet and write a summary ofwhat you have discovered about the effects of El Niño on your areaand its effect on vegetation. Make inferences on the effects of cropgrowth. Present your findings to the class.
●
Part III Results: Examine all data and summarize your observations on your data sheet. Doesyour region tend to be warmer, cooler or normal during an El Niño year?Does your region tend to be wetter, dryer, or normal during an El Niño year?Make a prediction about how agricultural crops will perform during an ElNiño year.
http://ois.unomaha.edu/casde/bblocks/, last modified 1/14/99, UNOmaha Office of Internet Stu
El Niño and Plant Growth: Student Activity
http://ois.unomaha.edu/casde/casde/lessons/Nino/student.htm
Click and hold the mouse button in the window and drag to yourlocation. Record the color you see for your area in your data sheet.Click the arrow directly to the right of the image title. You will see thesame image in 1990. Record the color you see in your data sheet.Continue until you have recorded colors for all years on your datasheet.
●
When you reach the legend, compare the color you recorded for eachyear with the key and record the condition for each year in your datasheet.
●
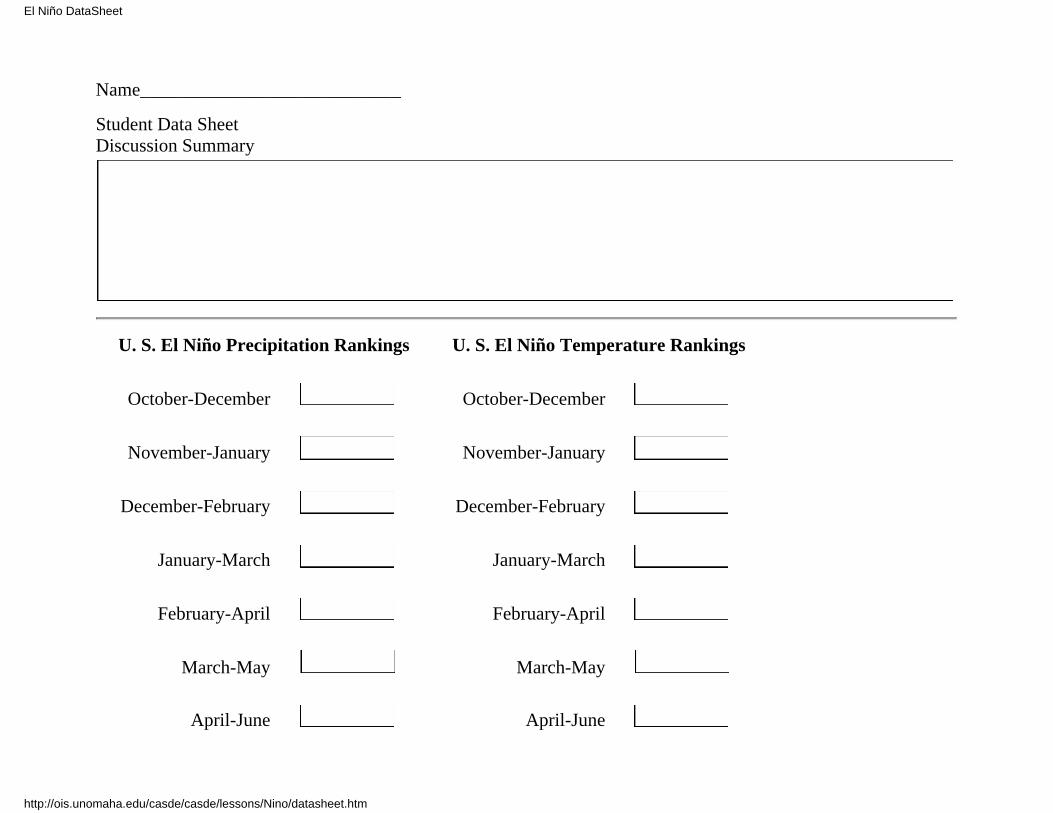
Name____________________________
Student Data SheetDiscussion Summary
U. S. El Niño Precipitation Rankings
October-December
November-January
December-February
January-March
February-April
March-May
U. S. El Niño Temperature Rankings
October-December
November-January
December-February
January-March
February-April
March-May
El Niño DataSheet
http://ois.unomaha.edu/casde/casde/lessons/Nino/datasheet.htm
April-June April-June

Normal vs. El Niño Average PrecipitationNOVEMBER-DECEMBER
Normal vs. El Niño Average PrecipitationJANUARY-MARCH
Data Summary Analysis
To launch Data Slate, click on the Apple Menu. Select CASDE folder, then select Data Slate. Once the programhas launched, click the Load button. You will be prompted for a file to load. Navigate to the SVIJuly folder andopen it. Once inside this folder, locate the file SVIJULY.LBL. Click on it, and then click the 'Open' button. Thiswill open the SVI data set. The first image you will see will be the SVI image for July 1989.
Year Color Vegetation Condition1989 1990 *1991 *1992 1993
El Niño DataSheet
http://ois.unomaha.edu/casde/casde/lessons/Nino/datasheet.htm
1994 *1995 1996 *1997
* indicates El Niño years
http://ois.unomaha.edu/casde/casde/home/bldgbloc.htm, Last modified 2/10/99, UNOmaha Office of Internet Studies

ReferencesAnderson, Hugh. Teacher talk for global change. [Online] Availablehttp://athena.wednet.edu/curric/land/global/tglobchg.html, Last update March 28, 1997.
CASDE: Jet Propulsion Laboratory. DataSlate page. [Online] Available http://casde.jpl.nasa.gov/dataslate/,Last downloaded January 15, 1999.
CASDE: UNL. Virtual Nebraska. [Online] Available http://www.casde.unl.edu/vn.html, Last downloadedJanuary 15, 1999.
Hughes, Katherine. What is El Niño? Environmental News Network. [Online] Availablehttp://www.enn.com/specialreports/elnino/what.asp. Document date September 22, 1997.
National Oceanic and Atmospheric Administration Home Page. [Online] Available http://www.noaa.gov/,Last downloaded January 15, 1999.
The Living Planet Campaign: State of the Climate. [Online] Available http://www.panda.org/climate_event/,Last downloaded January 15, 1999.
http://ois.unomaha.edu/casde/bblocks/, last modified 1/14/99, UNOmaha Office of Internet Studies
El Niño: References Alward, R. D., Detling, J.K., & Milchunas D. G.(1999). Grassland veg...rnal global warming. Science, 283, 229-231. JPL The Great American Desert???: References
http://ois.unomaha.edu/casde/casde/lessons/Nino/references.htm