
The potential $2 trillion prize from longer - PwC UK · PwC Golden Age Index: Key results Iceland,...
57
Transcript of The potential $2 trillion prize from longer - PwC UK · PwC Golden Age Index: Key results Iceland,...


The potential $2 trillion prize from longer working lives
PwC Golden Age Index
Between 2015 and 2050, the number of people aged 55 and above in OECD countries will grow by almost 50% to around 538 million. It is good news that we are living longer, but rapid population ageing is already putting significant financial pressure on health, social care and pension systems and this will only increase over time.
To offset these higher costs, we think older workers should be encouraged and supported to remain in the workforce for longer. This would increase GDP, consumer spending power and tax revenues. It could also help to improve the health and wellbeing of older people by keeping them mentally and physically active.
We have developed our Golden Age index to quantify how far different economies are harnessing the power of their older workers. The index captures a broad range of indicators relating to the participation of older people in employment and training. We find that Iceland, New Zealand, Israel and Sweden lead the OECD on this index, with large potential economic gains if employment rates for those over 55s could be raised to those of the top performers.
Specifically, across the OECD as a whole, we estimate that the potential long-term GDP gain from raising employment rates for the over 55s to Swedish levels could be around $2 trillion. Potential gains could rise as high as 16% of GDP for Greece and 13% for Belgium. For the US, they could be around 3% of GDP, or around 2% of GDP for Japan.
We also consider trends in the UK in more detail in this year’s report. While progress has been made over time in boosting working lives, we estimate there could be a potential £80bn boost to UK GDP in the long run if it could match Swedish performance.
For governments across the OECD, the priorities include reforming pension systems and providing other financial incentives to encourage later retirement. Measures to support lifetime learning and training in the face of rapid technological progress, including automation, are also important. Our analysis suggests that policies to support older workers should not crowd out younger workers as this will boost demand as well as supply.
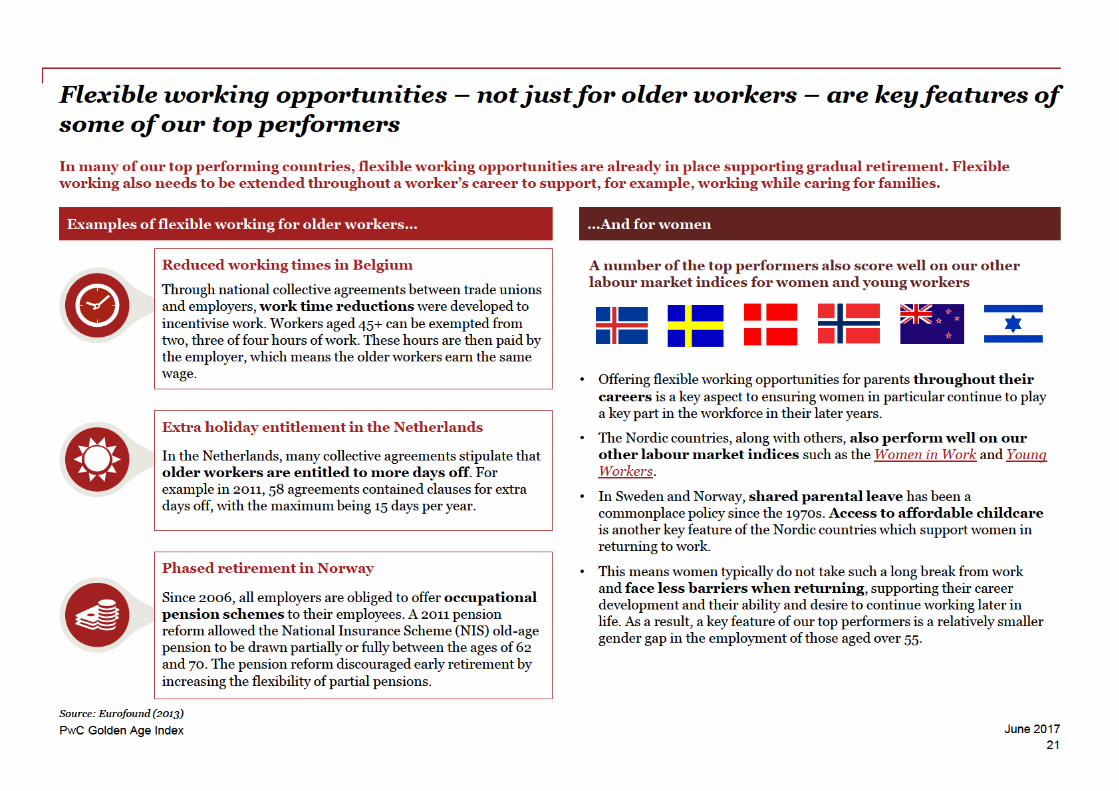
For employers, flexible working and partial retirement options can pay dividends, as can redesign of factories, offices and roles to meet the changing needs and preferences of older workers.
Reverse mentoring schemes on digital skills and extending apprenticeships to older workersalso feature in the strategies of leading companies we have reviewed.
I hope you find our analysis useful as a contribution to this important area of debate. Please do come back to us if you would like a more in-depth discussion of how we can help you to harness the power of older workers in your own organisation.
John HawksworthChief Economist, PwC UK
1June 2017


Our Golden Age Index takes a holistic view of the labour market for older workers across the OECD, combining indicators into one comparable metric
PwC Golden Age Index
Labour market indicators Process Labour market indicators
The PwC Golden Age Index combines a broad range of labour market indicators as listed below with relative weights shown in brackets. Employment rates have the highest weights but other variables are included to present a more holistic picture:
• Employment rate 55–64 (40%)
• Employment rate 65–69 (20%)
• Gender gap in employment, 55–64: ratio women/men (10%)
• Incidence of part-time work 55–64 (10%)
• Full time earnings 55–64 relative to 25–54 (10%)
• Average effective exit age from the labour force (5%)
• Participation in training: ratio 55–64 to 25–54 (5%)
These indicators are normalised, weighted and aggregated to generate index scores for each country.
The index scores are on a scale from 0 to 100, with the average OECD value in the base year of 2003 set to 50. However, the average index values for 2007, 2014 and 2015 can be higher or lower than this 2003 baseline.
We can therefore compare how each country’s performance has evolved over time in absolute terms, as well as the relative performance of countries in a particular year.
See Annex for more details of the methodology.
All data are taken from the OECD.
We focus mostly on the 55–64 age group for data reasons. We do, however, include total employment rates for 65–69 year olds in the index and look at all workers over 55 in calculating potential boosts to GDP from higher employment rates for older workers.
The latest data available across the broad range of countries covered are for 2015, so this is the final year covered by the index.
8June 2017


PwC Golden Age Index: Key results Iceland, New Zealand, Israel and Sweden take the top four places
PwC Golden Age Index
Sources: PwC analysis, OECD1 The PwC Golden Age Index 2017 edition uses 2015 data as the latest available data.
Israel continues to rise up the rankings, having gained 10 places since 2003.
The UK’s relative ranking has fallen slightly since 2003, despite a steady improvement in its absolute index score over time.
Mexico has seen the biggest fall in the rankings this year, while Germany, Portugal and Ireland rise up the list.
Turkey maintains its position at the bottom of the index, having fallen 12 places since 2003.
The United States is now only the second highest G7 country in the list as Japan has seen a relatively strong increase in its score since 2014.
The Nordic countries continue to do very well as Iceland, Sweden and Norway all occupy a place in the top 10.
Ranking Country Raw index score
2003 2007 2014 2015 2003 2007 2014 2015
1 1 1 1 Iceland 92.5 93.1 97.2 98.89 3 2 2 New Zealand 60.9 71.5 82.4 84.2
13 10 3 3 Israel 58.2 65.7 78.3 80.13 4 4 4 Sweden 68.1 71.2 78.2 79.68 2 5 5 Estonia 63.4 73.6 76.5 78.64 8 6 6 Norway 67.4 69.7 76.3 77.57 6 9 7 Korea 64.1 70.7 72.4 76.85 7 10 8 Japan 66.8 70.3 70.7 75.82 5 7 9 United States 68.7 70.7 74.8 74.6
14 11 8 10 Chile 57.3 65.7 74.2 71.810 13 11 11 Switzerland 60.7 62.7 67.9 70.820 17 16 12 Australia 45.7 54.8 62.9 69.311 14 12 13 Denmark 59.7 59.5 64.7 67.716 15 14 14 Finland 51.1 58.4 64.1 66.225 20 17 15 Germany 37.1 47.6 62.5 66.015 16 15 16 Canada 53.5 58.0 63.8 65.312 9 19 17 Portugal 59.3 66.6 55.3 62.56 12 13 18 Mexico 64.4 65.4 64.5 62.3
17 19 18 19 United Kingdom 47.7 51.0 58.4 61.2
18 18 23 20 Ireland 47.3 54.6 52.3 60.121 22 20 21 Czech Republic 43.5 45.8 54.5 59.127 26 21 22 Netherlands 34.8 42.6 53.7 56.430 25 24 23 Austria 32.5 43.3 51.2 54.823 24 22 24 France 42.8 44.9 52.4 53.224 21 25 25 Spain 42.6 46.5 49.9 52.529 30 27 26 Hungary 32.5 36.2 46.9 51.328 28 26 27 Italy 33.1 36.8 46.9 49.732 31 28 28 Slovak Republic 30.0 35.5 46.6 48.626 34 30 29 Poland 35.7 32.4 44.7 48.034 29 29 30 Belgium 29.0 36.7 45.4 47.719 23 32 31 Greece 46.2 45.2 42.0 46.433 27 33 32 Slovenia 29.7 37.4 41.9 44.731 32 31 33 Luxembourg 30.3 35.5 43.2 41.322 33 34 34 Turkey 43.5 34.2 37.8 36.8
OECD Average 50.0 54.5 60.4 62.9
The East Asian countries in our index perform strongly, with both Korea and Japan making strong improvements in their absolute index scores.
10June 2017


Countries scoring lower on our Golden Age Index have the most to gain from boosting employment rates for those aged over 55 to Swedish levels
PwC Golden Age Index
Sources: PwC analysis, OECD
Note: Iceland and New Zealand are excluded from the analysis as they have higher employment rate of 55 + year olds than Sweden.
Figure 2: Potential long-run GDP boost
15.5
12.912.2
10.610.1 10.0 9.9 9.9 9.6 9.6
9.3
7.9
6.8 6.5
5.45.0
4.6 4.6 4.5 4.5 4.4 4.2
3.32.9 2.9
2.42.1 1.9 1.8
1.4 1.2
0
2
4
6
8
10
12
14
16
18
Gre
ece
Bel
gium
Slo
veni
a
Luxe
mbo
urg
Turk
ey
Italy
Spa
in
Hun
gary
Fran
ce
Pol
and
Aus
tria
Slo
vak
Rep
ublic
Net
herla
nds
Por
tuga
l
Irela
nd
Ger
man
y
Finl
and
Sw
itzer
land
Cze
ch R
epub
lic
Aus
tralia
Mex
ico
Uni
ted
Kin
gdom
Can
ada
Uni
ted
Sta
tes
Den
mar
k
Chi
le
Japa
n
Isra
el
Est
onia
Kor
ea
Nor
way
Ch
an
ge
in
GD
P (
%)
Key
High GDP impact (>10%)Medium GDP impact (5.0–9.9%)Low GDP impact (< 4.5%)
17June 2017


Boosting training and lifelong learning is crucial to enabling older workers to continue to have relevant and effective skills for today’s workplace
PwC Golden Age Index
• Analysis of the UK Labour Force Survey suggests that older workers are less likely to receive training than younger employees, with only 45% of those aged 65 and over having received one day of training in the past 12 months.
• This might in part be due to negative stereotyping from employers, who are not prepared to invest in the training of older workers as they anticipate they will exit the workforce sooner than younger workers. But in fact, studies have shown that the risk of an employee leaving a company after receiving training is the same across all age groups.
• Further, survey evidence reveals that training satisfaction was higher for those aged 60+ compared to employees aged 22-49 (WERS).
• The difference is particularly pronounced for men, who are typically more concentrated in industries that receive less formalised training than women.
• Differences in the prevalence of training for older and younger workers might reflect variations in job and workplace characteristics, as younger employees with higher qualifications are more likely to work in industries that require more frequent training, such as banking and finance.
Figure 7: Incidence of training of UK employees by age
Sources: DWP (2017), LFS (2011) , WERS (2011)
20
30
40
50
60
70
80
16-21 22-29 30-39 40-49 50-59 60-64 65+
Pe
rce
nta
ge
of
UK
em
plo
ye
es
su
rve
ye
d r
ec
eiv
ing
at
lea
st
on
e
da
y o
f tr
ain
ing
in
12
mo
nth
s
Employee age
30June 2017


UK businesses are increasingly adopting policies in line with the government’s strategy to Retain, Retrain and Recruit
PwC Golden Age Index
Below are three examples of employers across a range of industries that have taken measures in line with government policy to benefit from the experience of their older workers. Such policies encourage more flexible working, the promotion of older age apprenticeships and lifelong learning. The examples covered here are just illustrative – many other UK companies will also be pursuing such initiatives.
32
• JLR launched a Retirement Transition Initiative (RTI) to equip people aged over 50 with the information, networks, resilience, and opportunities to enter later life with confidence and purpose.
• The main programme is delivered via a two-day residential workshop to approximately 30 participants. A direct result of RTI participation was 63% began to plan their finances and 36% reconsidered when they would retire.
• The Co-operative runs an apprenticeship scheme open to all ages (the oldest apprentice is currently 67)
• To date, the Co-op has taken on almost 400 apprentices aged 50-59, and over 60 apprentices aged over 60.
• The Co-op spend around £500,000 a year on top-up funding for its apprenticeship programme, as many older applicants are not eligible for government support.
UK Policy Business Policy in action
Retain
Recruit
Jaguar Land Rover
The Co-operative
• Barclays has launched a number of initiatives to support the retraining of older workers.
• Their ‘Bolder Apprenticeships’ scheme was introduced in 2015 with the intention of creating new employment routes for older people as well as reskilling those who have been out of work.
• Barclay’s 12 week ‘Welcome Back’ programme also helps to encourage senior-level women who’ve taken a multi-year career break return to work.
• Barclays have also recently pledged to hire 12% more older workers by 2022.
Retrain Barclays
June 2017
Source: Business in the Community (2016)


The clear positive correlation between our Young Workers Index and the Golden Age Index suggests that the employment of older workers does not crowd out younger workers at the economy-wide level
PwC Golden Age Index
Sources: PwC analysis, OECD
Iceland
New ZealandSweden
Israel
Norway
Estonia
United States
Chile
Korea
Japan
Switzerland
Denmark
Finland
Mexico
Canada
Australia
Germany
United Kingdom
Czech Republic
Netherlands
France
Ireland
Austria
Slovak Republic
Hungary
Belgium
Poland
Luxembourg
Slovenia
Turkey
30
35
40
45
50
55
60
65
70
30 40 50 60 70 80 90 100
Pw
C Y
ou
ng
Wo
rke
rs In
de
x (
20
16
)
PwC Golden Age Index (2017)
46June 2017


PwC Golden age index methodologyVariables included in the index
PwC Golden Age Index
Indicator Weight Factor Rationale
Employment rate, 55-64(% of the age group)
40% 1 The proportion of 55-64 year old workers in employment is the most important measure in our index and so has the highest weight of 40%.
Employment rate, 65-69 (% of the age group)
20% 1 The proportion of 65-69 year old workers has half the weighting of that of 55-64 year old workers assuming the 65-69 age group is roughly half as large in terms of population.
Gender gap in employment, 55-64 (ratio women/men)
10% 1 Gender equality in employment is included here as lower employment rates among older women tend to be a particular feature of many OECD countries.
Incidence of part-time work, 55-64 (% of total employment)
10% - 1 Part-time employment may adversely affect earnings, pensions and job security, but this is given a lower weight in the index since some older workers may prefer part-time work.
Full-time earnings, 55-64 relative to 25-54 (ratio)
10% 1 Earnings equality would represent equal pay across age groups and could also be an indicator of the relative labour productivity of older workers. But it has a lower weight in the index as higher relative earnings could also price some older workers out of jobs in certain cases.
Average effective labour force exit age (years)
5% 1 This measures the length of time a worker stays in the labour force before they become economically inactive. However, there is some overlap with other variables such as employment rates so we do not give it too high a weight in the index.
Participation in training of 55-64 age group (ratio, relative to employed persons aged 25-54)1
5% 1 This is an indication of how far older workers keep learning beyond age 55, which will be important in keeping them employable and renewing their skills. But data are lacking for several countries, so we do not give this too high a weight in the index.
Note: The index scores reported in this 2017 release reflect the latest OECD data. Index scores for 2003, 2007 and 2014 may have changed relative to the results in our release last year (June 2016).
1 This indicator was defined as the absolute number of 55-64 year olds in training in our previous June 2015 release, but we have had to change to this for data availability reasons. However, this does not have a major impact on the overall rankings relative to two years ago.
50June 2017


PwC Golden Age index methodologyHow did we calculate the potential long-term GDP increase?
PwC Golden Age Index
We break down GDP in the following way:
GDP15-54 FT * GDP per FT worker
=15-54 PT * GDP per PT worker
55-64 FT * GDP per FT worker
55-64 PT * GDP per PT worker
65+ FT * GDP per FT worker
65+ PT * GDP per PT worker
+ + + + +
Key assumptions
• Total employment in the economy is equal to the employment of 15 year olds and above.
• A full-time (FT) worker is twice as productive on average as a part-time (PT) worker, due to working twice as many hours on average.
We took Sweden as a benchmark country as it is the best performing in the EU (and one of the best in the OECD) and calculated the impact on GDP if countries raised their 55-64 and 65+ employment rates to Swedish levels. Sweden is a high performer in the 55-64 year old employment rates category and also performs relatively well in the 65+ employment category. However, if a country has a higher full-time equivalent employment rate than Sweden in either age category, as is the case, for example, in the US and Norway for the 65+ category, we did not assume any change to the employment rate currently experienced in that country.
Data
• Employment data by age and FT/PT split is sourced from the OECD.
• Due to data constraints for some countries with the employment data based on a common definition, we used FT/PT data employment based on national definitions.
• FT/PT employment data based on a national definition is only available for the 65+ age range, as opposed to 65-69 which is used within our index.
• For Korea, the OECD did not provide data based on a national definition, so we used the employment data based on an OECD common definition instead (which was an option in the case of Korea). There was also no data on the FT/PT breakdown of the 65+ age group so we estimated this by applying the average change in the distribution of FT/PT workers across the OECD economies as you move from the 55-64 age group to the 65+ age group to the overall employment estimate for 65+ years olds in Korea.
52June 2017

Bibliography
PwC Golden Age Index
• Annual Population Survey (January – December 2016).
• Annual Survey of Hours and Earnings (2016).
• Business in the Community (2016), ‘Age in the Workplace: Retain, Retrain, Recruit’.
• Department for Work and Pensions (2017), ‘Employer experiences of recruiting, retaining and retraining older workers: qualitative research’.
• Department for Work and Pensions (2017), ‘Older workers and the workplace: evidence from the Workplace Employment Relations Survey’.
• Department for Work and Pensions (2017), ‘Fuller Working Lives: A Partnership Approach’.
• Department for Work and Pensions (2017), ‘Fuller Working Lives: Evidence Base 2017).
• Eurofound (2012), ‘Employment trends and policies for older workers in the recession’.
• Eurofound (2013), ‘Role of governments and social partners in keeping older workers in the labour market’.
• Eurofound (2015), ‘Germany: New Retirement Package’.
• Harvard Business Review (2013), ‘The Globe: How BMW Is Defusing the Demographic Time Bomb’.
• IEA (2013), ‘Work Longer, Live Healthier: The relationship between economic activity, health and government policy’.
• Institute for Public Policy Research (2013), ‘The Sandwich Generation: Older Women Balancing Work and Care’.
• Journal for Labour Market Research (2016), ‘The hiring and employment of older workers in Germany: A Comparative Perspective’.
• Labour Force Survey (2011).
• Ministry of Business, Innovation & Employment (2017), ‘National Survey of Employers 2014/15’.
• OECD (2016) Statistics.
• OECD Older Workers Scoreboard (http://www.oecd.org/els/emp/older-workers-scoreboard.xlsx - accessed May 2017).
• OECD (2012) ‘Country Policy Monitoring’.
• Office National Statistics (2015), ‘Participation rates in the UK – 2014 – 3. Older People’.
• Resolution Foundation (2012), ‘Unfinished Business: Barriers and opportunities for older workers.
• Phillipson, Vickerstaff & Lain (2016) ‘Achieving fuller working lives: labour market and policy issues in the United Kingdom’, Australian Journal of Social Issues.
• Picchio, Matteo (2015) ‘Is training effective for older workers?’, IZA World of Labour
• PwC (2017) ‘Will robots steal our jobs? The potential impact of automation on the UK and other major economies’, UK Economic Outlook
• The Centre for Ageing Better (2016), ‘Age in the Workplace: Retain, Retrain, Recruit’.
• The Guardian (2016) ‘Ageing Britain: two-fifths of NHS budget is spent on over 65s’.
• Workplace Employment Relations Study (2011).
• United Nations (2015), ‘World Population Prospects 2015’.
53June 2017


www.pwc.com
This publication has been prepared for general guidance on matters of interest only, and does not constitute professional advice. You should not act upon the information contained in this publication without obtaining specific professional advice. No representation or warranty (express or implied) is given as to the accuracy or completeness of the information contained in this publication, and, to the extent permitted by law, PricewaterhouseCoopers LLP, its members, employees and agents do not accept or assume any liability, responsibility or duty of care for any consequences of you or anyone else acting, or refraining to act, in reliance on the information contained in this publication or for any decision based on it.
© 2017 PricewaterhouseCoopers LLP. All rights reserved. In this document, “PwC” refers to the UK member firm, and may sometimes refer to the PwC network. Each member firm is a separate legal entity. Please see www.pwc.com/structure for further details.


