The Potash Outlook - FIRTGiasson_Potash_Outlook... · The Potash Outlook Al Mulhall Director,...
42
-
Upload
nguyencong -
Category
Documents
-
view
216 -
download
0
Transcript of The Potash Outlook - FIRTGiasson_Potash_Outlook... · The Potash Outlook Al Mulhall Director,...


The Potash OutlookThe Potash Outlook
AlAl MulhallMulhallDirector, Market ResearchDirector, Market Research -- PotashCorpPotashCorp
TFI Outlook MeetingTFI Outlook Meeting
November 2, 2005November 2, 2005

ForwardForward--Looking StatementsLooking StatementsThis presentation contains forwardThis presentation contains forward--looking statements, which involvelooking statements, which involve
risks and uncertainties, including those referred to in the Comprisks and uncertainties, including those referred to in the Companyany’’ss
annual report to shareholders for 2003 and in filings with the Uannual report to shareholders for 2003 and in filings with the U.S..S.
Securities and Exchange Commission and Canadian provincialSecurities and Exchange Commission and Canadian provincial
securities commissions. A number of factors could cause actualsecurities commissions. A number of factors could cause actual
results to differ materially from those in the forwardresults to differ materially from those in the forward--lookinglooking
statements, including, but not limited to, fluctuation in supplystatements, including, but not limited to, fluctuation in supply andand
demand in fertilizer, sulfur and petrochemical markets; changesdemand in fertilizer, sulfur and petrochemical markets; changes inin
competitive pressures, including pricing pressures; risks associcompetitive pressures, including pricing pressures; risks associatedated
with natural gas and other hedging activities; changes in capitawith natural gas and other hedging activities; changes in capitall
markets; changes in currency and exchange rates; unexpectedmarkets; changes in currency and exchange rates; unexpected
geological or environmental conditions and government policygeological or environmental conditions and government policy
changes.changes.

The Potash OutlookThe Potash Outlook
Global FundamentalsGlobal Fundamentals
Global PotashGlobal Potash
US FundamentalsUS Fundamentals
US PotashUS Potash
The Potash OutlookThe Potash Outlook
Global FundamentalsGlobal Fundamentals

N, P & K OutlookN, P & K Outlook
Declining land per capitaDeclining land per capita
Strong economic growthStrong economic growth
Tight global grain supply/demand balanceTight global grain supply/demand balance
China having a strong impact on demand forChina having a strong impact on demand forgrains, oilseeds and ocean freightgrains, oilseeds and ocean freight
Recent commodity price growthRecent commodity price growth
Good FundamentalsGood Fundamentals

Source: FAO, PPI, PotashCorpSource: FAO, PPI, PotashCorp
Hectares of Arable Land Per PersonHectares of Arable Land Per Person
Land Available to Agriculture is DecliningLand Available to Agriculture is Declining
0.0
0.1
0.2
0.3
0.4
1970 1980 1990 2000 2010F 2020F

Source: IMFSource: IMF
World Economic GrowthWorld Economic Growth
0
1
2
3
4
5
6
1997 1998 1999 2000 2001 2002 2003 2004E
Strongest GrowthStrongest Growthin Over 30 Yearsin Over 30 Years
% Annual Real GDP Growth% Annual Real GDP Growth

Source: IMFSource: IMF
World Economic GrowthWorld Economic Growth
0
1
2
3
4
5
1999-2002 2003-2006 2007-2010
Real GDP GrowthReal GDP Growth -- % CAGR% CAGR
3.5%
4.5%4.3%

Source: USDA, PotashCorpSource: USDA, PotashCorp
World Grain Production & ConsumptionWorld Grain Production & Consumption
1.0
1.1
1.2
1.3
1.4
1.5
1.6
1.7
1980/81 1985/86 1990/91 1995/96 2000/01 2005/06F 2010/11F1.0
1.1
1.2
1.3
1.4
1.5
1.6
1.7
Production Consumption
Billion TonnesBillion TonnesRecord ProductionRecord ProductionAbove Normal WeatherAbove Normal Weather
ProductionProductionGapsGaps
PossiblyPossiblyMoreMore
CommonCommon
Production GapProduction Gap
Wheat and Coarse GrainsWheat and Coarse Grains

Source: USDASource: USDA
World Grain StocksWorld Grain Stocks
0
100
200
300
400
500
600
73/74 77/78 81/82 85/86 89/90 93/94 97/98 01/02 05/06F
10
15
20
25
30
35
40
Year-End Grain Stocks Stocks-to-Use Ratio
Million TonnesMillion Tonnes PercentPercent
Wheat and Coarse GrainsWheat and Coarse Grains
17.9%
Source: USDA, PotashCorpSource: USDA, PotashCorp
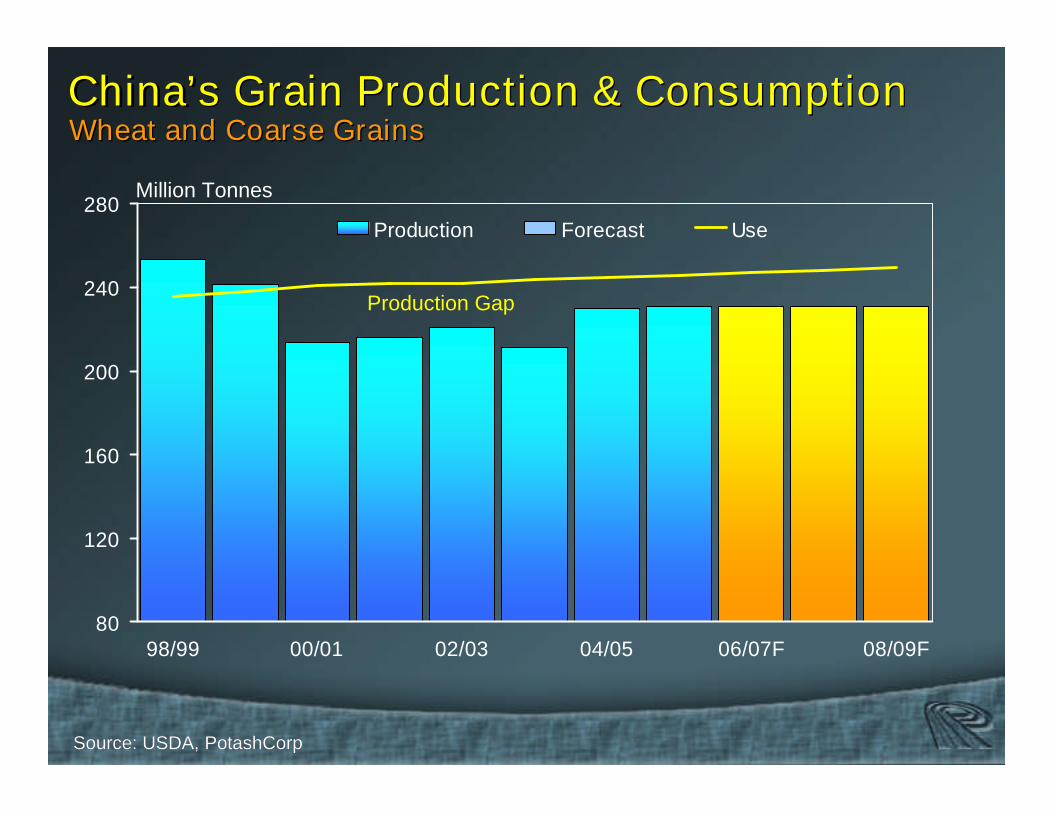
ChinaChina’’s Grain Production & Consumptions Grain Production & Consumption
80
120
160
200
240
280
98/99 00/01 02/03 04/05 06/07F 08/09F
Production Forecast Use
Production Gap
Wheat and Coarse GrainsWheat and Coarse Grains
Million Tonnes

Source: USDASource: USDA
0
40
80
120
160
200
240
61/62 65/66 69/70 73/74 77/78 81/82 85/86 89/90 93/94 97/98 01/02 05/06F
0
20
40
60
80
100
120Stocks Stocks-to-Use Ratio
ChinaChina’’s Grain Ending Stocks*s Grain Ending Stocks*
StocksStocks--toto--Use RatioUse RatioMillion TonnesMillion Tonnes
* Wheat and corn* Wheat and corn

Source: World BankSource: World Bank
60
70
80
90
100
110
120
130
140
150
160
3Yrs
Ago
1Yr Ago
Q3 2005
3Yrs
Ago
1Yr Ago
Q3 2005
3Yrs
Ago
1Yr Ago
Q3 2005
3Yrs
Ago
1Yr Ago
Q3 2005
3Yrs
Ago
1Yr Ago
Q3 2005
Index 1990 =100Index 1990 =100
Agricultural Commodity PricesAgricultural Commodity Prices
Grains-rice-wheat-maize-sorghum
-
Oilseeds-soybeans-palm oil-coconut oil
Beverages-coffee-cocoa-tea
OtherFood-bananas-oranges-sugar
Other RawMaterials-cotton-rubber-wool

Source: USDA August 2005Source: USDA August 2005
US $BillionsUS $Billions
US Net Cash Farm IncomeUS Net Cash Farm Income
9.2 13.47.9 7.3 7.3 7.5 12.2
20.6 22.9 20.711.2
17.2 13.321.4
46.045.9
43.2 45.3 50.2 51.0 43.334.0 33.8 39.4
38.3
54.472.2
63.8
0
10
20
30
40
50
60
70
80
90
1992 1993 1994 1995 1996 1997 1998 1999 2000 2001 2002 2003 2004 2005E
Net Cash Income Before Gov,t Payments
Direct Government Payments
US farmers are beginning to feel the pinchof rising costs but have enjoyed recordnet cash farm income over the past fewyears and 2005 should be another recordor near record year.
85.285.5
71.6

The Potash OutlookThe Potash Outlook
Global FundamentalsGlobal Fundamentals
Global Potash OutlookGlobal Potash Outlook

N, P & K OutlookN, P & K Outlook
Industry government ownershipIndustry government ownership
The global playersThe global players
Global potash demand growthGlobal potash demand growth
Regional potash demand growthRegional potash demand growth
Global potash production growthGlobal potash production growth –– FSU & ChinaFSU & China
World supply/demand balanceWorld supply/demand balance
PotashPotash –– Key PointsKey Points
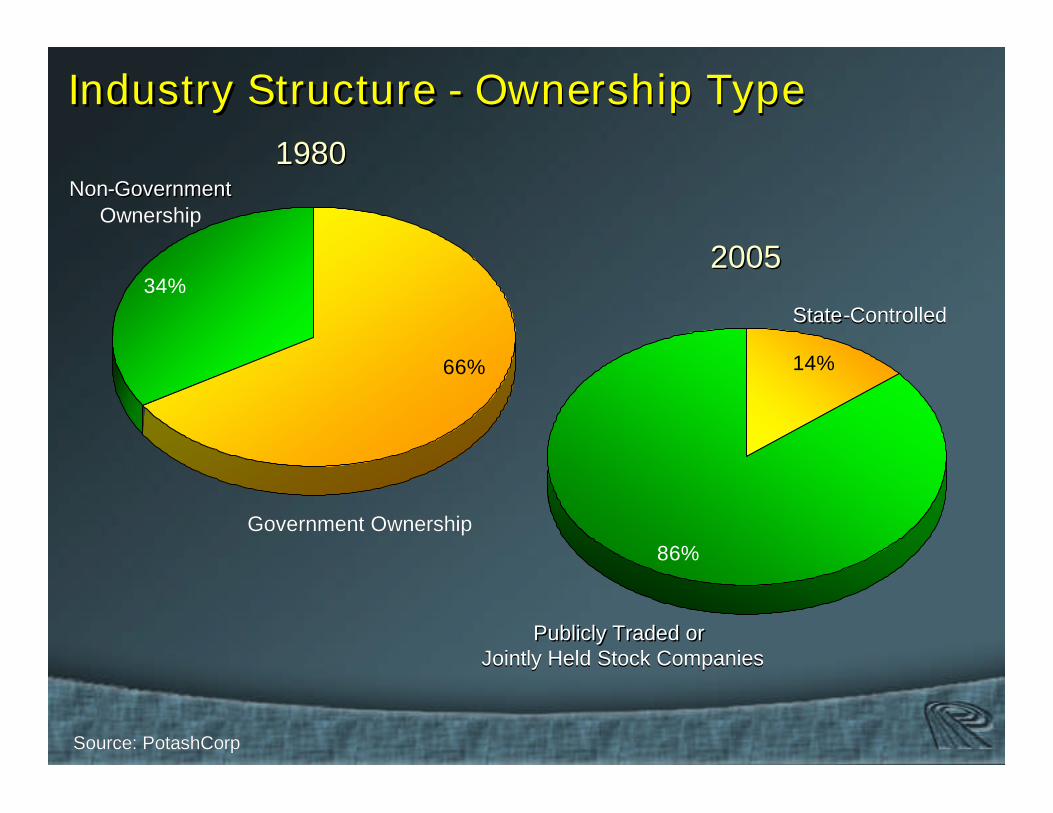
Source: PotashCorpSource: PotashCorp
Industry StructureIndustry Structure -- Ownership TypeOwnership Type
86%
14%
Publicly Traded orPublicly Traded orJointly Held Stock CompaniesJointly Held Stock Companies
StateState--ControlledControlled
2005200534%
66%
19801980
Government OwnershipGovernment Ownership
NonNon--GovernmentGovernmentOwnershipOwnership

Source: FerteconSource: Fertecon
Million Tonnes KClMillion Tonnes KCl
World Potash ExportersWorld Potash Exporters -- 20042004
0
2
4
6
8
10
12
14
16
18
Canada Russia Belarus Germany Israel Jordan Others
Top 3 Exporters (2004)Top 3 Exporters (2004)= 75% of total exports= 75% of total exports
40%
18%17%
10%8%
4% 3%
By Country

Source: FerteconSource: Fertecon
Million Tonnes KClMillion Tonnes KCl
World Potash ImportersWorld Potash Importers -- 20042004
0
1
2
3
4
5
6
7
8
9
10
US China Brazil India France Malaysia
87%
84%91%
100%
100%100%
Top 3 Importers (2004)Top 3 Importers (2004)= 53% of total imports= 53% of total imports
Imports as a % of a country’s total sales
By Country

Source: IFA, PotashCorpSource: IFA, PotashCorp
World Potash Demand GrowthWorld Potash Demand Growth
0
4
8
12
16
20
24
28
32
36
40
44
1999 2000 2001 2002 2003 2004 2005E 2006F 2007F 2008F 2009F 2010F
Cumulative YOY Percentage GrowthCumulative YOY Percentage Growth
8.3%
3.8%-0.6%
10.0%
3.0%
3.6% 1H 2005
3% Growth Rate
2% Growth Rate

Source: FerteconSource: Fertecon
Million Tonnes KClMillion Tonnes KCl
Asia and Latin America Potash DemandAsia and Latin America Potash Demand
0
2
4
6
8
10
12
1999 2000 2001 2002 2003 2004
Asia Latin America
Cumulative Growth
+3.5 MMT+3.5 MMT
+1.1 MMT+1.1 MMT
+2.8 MMT+2.8 MMT

Source: Fertecon, PotashCorpSource: Fertecon, PotashCorp
0
1
2
3
4
5
6
7
8
9
10
2001
2003
2005
F20
0120
03
2005
F20
0120
03
2005
F20
0120
03
2005
F
Million Tonnes KClMillion Tonnes KCl
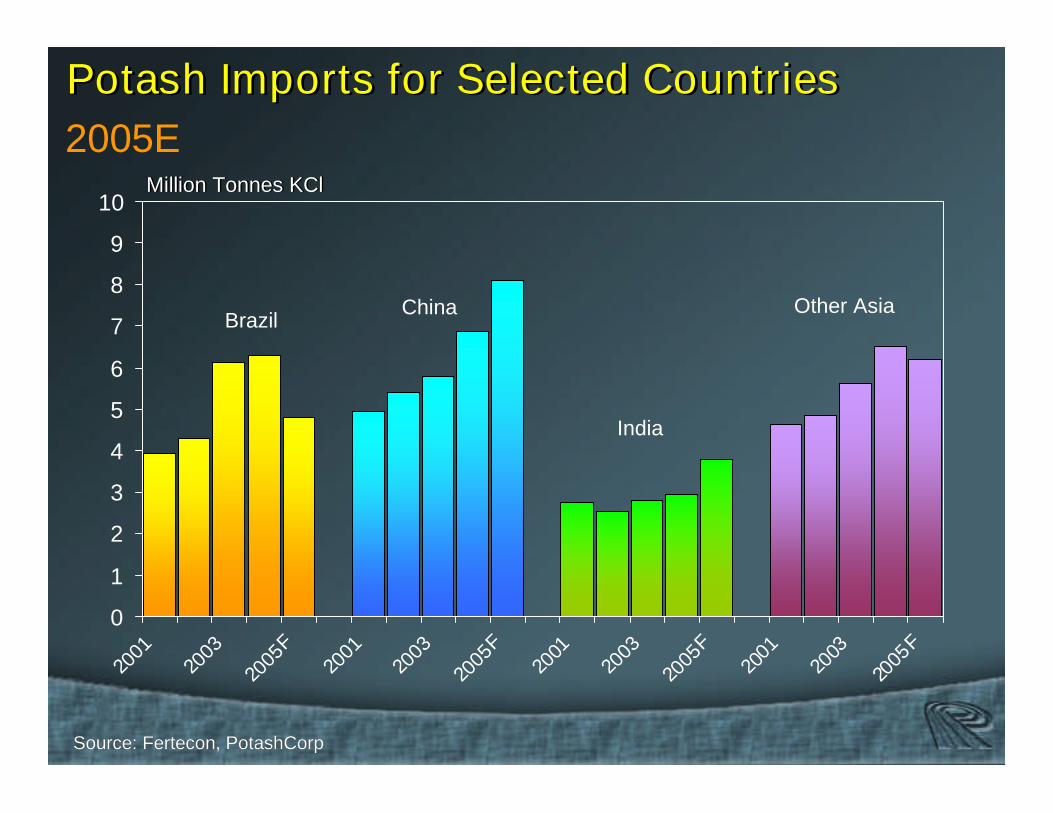
China
Potash Imports for Selected CountriesPotash Imports for Selected Countries
Brazil Other Asia
India
2005E

Source: Oanda.comSource: Oanda.com
0.20
0.25
0.30
0.35
0.40
0.45
0.50
Jul-03 Oct-03 Jan-04 Apr-04 Jul-04 Oct-04 Jan-05 Apr-05 Jul-05 Oct-05
Real per US Dollar
Brazilian Real per US DollarBrazilian Real per US Dollar
Exchange rates are those in effect on the first day of the month

Source: USDA, Doane, PotashCorpSource: USDA, Doane, PotashCorp
0
50
100
150
200
250
300
Brazil (2005) US(2005)
Seed Fertilizer Costs Other Variable Land Costs Depn&Other Fixed Costs
Cost of Producing Soybeans in Brazil and US
US$/Acre
Labor, taxes andmachinery costs arecheaper in Brazil
Excludes apossible extra$25/acre cost forfungicide to fightAsian Rust
Chemicals, fuel costmore than the US …including $50/ha tofight Asian Rust
Land costs haverisen sharply withthe price ofsoybeans but arestill a fraction ofthe US
Fertilizer costshave risen andare more thanthe US
$215/acre
$255/acre
Source: Fertecon, PotashCorpSource: Fertecon, PotashCorp
0
1
2
3
4
5
6
7
8
9
10
2001
2003
2005
F20
0120
03
2005
F20
0120
03
2005
F20
0120
03
2005
F
Million Tonnes KClMillion Tonnes KCl
China
Potash Imports for Selected CountriesPotash Imports for Selected Countries
BrazilOther Asia
India
2005E

Source: Fertecon, PotashCorpSource: Fertecon, PotashCorp
ChinaChina’’s Potash Demand Growths Potash Demand Growth
0
1
2
3
4
5
6
7
8
9
10
11
2000 2001 2002 2003 2004 2005F
Production Imports
Million Tonnes KClMillion Tonnes KCl

Source: CanpotexSource: Canpotex
0
1
2
3
4
5
6
7
8
9
1978 1981 1984 1987 1990 1993 1996 1999 2002 2005F
Million Tonnes KCl
CanpotexCanpotex’’s Sales Volumes Sales Volume
Records

Source: Fertecon, PotashCorpSource: Fertecon, PotashCorp
FSU Potash Sales and CapacityFSU Potash Sales and Capacity
0
4
8
12
16
20
1988 1990 1992 1994 1996 1998 2000 2002 2004
Domestic Sales Export Sales New Capacity
Million Tonnes KCl

Source: Fertecon, IFA, PotashCorpSource: Fertecon, IFA, PotashCorp
FSU KCl ProductionFSU KCl Production
0
1
2
3
4
5
6
7
8
9
20022003
20042005F
20022003
20042005F
20022003
20042005F
Million Tonnes KClMillion Tonnes KCl
Silvinit
Belarus
Uralkali

Source: PPISource: PPI
0.5
1.0
1.5
2.0
2.5
3.0
Jan Feb Mar Apr May Jun Jul Aug Sep Oct Nov Dec
Million Tonnes KCl
North American ProducersNorth American Producers’’ Ending KCl InventoryEnding KCl Inventory
5-YearAverage
2004
22 % Below 5-Year Average
2005
2003

Source: Fertecon, ANDA, PPISource: Fertecon, ANDA, PPI--PPICPPIC
Million Tonnes KClMillion Tonnes KClSelected NationsSelected Nations’’ Potential Potash GrowthPotential Potash Growth
China
0
2
4
6
8
10
12
Current Potential
India Brazil
0
2
4
6
8
10
12
Current Potential0
5
10
15
20
25
30
Current Potential
Note: KNote: K22O tonnes divided by .61 to convert to KCl tonnesO tonnes divided by .61 to convert to KCl tonnes

Source: FAO, FerteconSource: FAO, Fertecon
0
5
10
15
20
25
30
35
61/62 67/68 73/74 79/80 85/86 91/92 97/98 '03/04 09/10F
NAmerica Asia LAmerica WE Africa Oceania EE FSU
Million Tonnes KMillion Tonnes K2200
World Potash Fertilizer ConsumptionWorld Potash Fertilizer Consumption
North America
FSU
EE
Asia
L AmericaWE
Actual Forecast

Source: Fertecon, IFA, PotashCorpSource: Fertecon, IFA, PotashCorp
World Potash Operating Rate (%)World Potash Operating Rate (%)
% of Capacity
50
60
70
80
90
100
1980 1983 1986 1989 1992 1995 1998 2001 2004 2007 2010
Actual With PotashCorp Forecast With PotashCorpActual Without PotashCorp Forecast Without PotashCorp
* excludes capacity additions in planning stage for Thailand, Ur* excludes capacity additions in planning stage for Thailand, Uralkali, and Mosaicalkali, and Mosaic

Source: Fertecon, PotashCorpSource: Fertecon, PotashCorp
0123
45
678
910
11121314
2005E 2006F 2007F 2008F 2009F 2010F
PotashCorp: Available CapacityPotashCorpProjects Under ReviewUralkaliJordanBrazilGermanyIsraelChinaMosaicAgrium3% Demand Growth2 % Growth
Cumulative GrowthCumulative Growth -- Million Tonnes KClMillion Tonnes KCl
Potash Demand Growth versus Capacity:Potash Demand Growth versus Capacity:Assumes All Capacity Announcements CompletedAssumes All Capacity Announcements Completed

The Potash OutlookThe Potash Outlook
Global FundamentalsGlobal Fundamentals
Global PotashGlobal Potash
US FundamentalsUS Fundamentals

Source: USDA and Doane's ForecastSource: USDA and Doane's Forecast
US Crop Acreage ForecastUS Crop Acreage ForecastMillion AcresMillion Acres
2002 2003 2004 2005 2006 +/-Corn 78.9 78.6 80.9 81.6 79.8 -1.8All Wheat 60.3 62.1 59.7 57.1 59.2 2.1Soybean 74.0 73.4 75.2 72.2 74.0 1.8Cotton 14.0 13.5 13.7 14.2 13.8 -0.4
Doane’s 2006 ForecastMore wheat and soybeans … lesscorn and cotton due to rising costsand the higher returns to soybeans.Also there is so far little evidence ofAsian Rust.

The Potash OutlookThe Potash Outlook
Global FundamentalsGlobal Fundamentals
Global PotashGlobal Potash
US FundamentalsUS Fundamentals
US Potash OutlookUS Potash Outlook

Source: TFI, Fertecon, PotashCorpSource: TFI, Fertecon, PotashCorp
Ammonia Costs Depend on Gas CostsAmmonia Costs Depend on Gas Costs
US$/ST
Gas Cost per Million Btu
0
50
100
150
200
250
300
350
400
450
500
2.00 4.00 6.00 8.00 10.00 12.00 14.00
Gas Costs Conversion Costs
Current Tampa Ammonia Price ($328/st)

Source: AAPFCO and PotashCorp 2004/05 Estimates and 2005/06 ForeSource: AAPFCO and PotashCorp 2004/05 Estimates and 2005/06 Forecastcast
US Fertilizer Consumption ForecastUS Fertilizer Consumption ForecastMillion Tons NutrientMillion Tons Nutrient
2003/04 YOY% 2004/05 YOY% 2005/06 Range
K2O 5.498 11.1% 5.445 0 to -2% 5.250 -3 to -5%
Sharp Increase in2003/04 … Due toexceptionalweather, favorablecrop prices andbetter reporting
Down slightly in2004/05 … Due tomore normalweather and adecline in cropprices
Down 3 - 5%… Due to high gasprices, US marketresistance to nitrogenprices, and reducedcorn acreage.

The Potash OutlookThe Potash Outlook
Industry government ownership is lowIndustry government ownership is low
Industry operating rates are highIndustry operating rates are high
Global potash demand growth to average 2Global potash demand growth to average 2--3%3%
US market carries risk of 3US market carries risk of 3--5% drop from last year5% drop from last year
Market outlook is for continued tight supply/demandMarket outlook is for continued tight supply/demand
ConclusionConclusion