
The Port of Rotterdam - d1rkab7tlqy5f1.cloudfront.net · The Port of Rotterdam: the largest...
27
The Port of Rotterdam: the largest “capacitor” of the Netherlands Delft, September 14th 2017 Rob Stikkelman [email protected]
-
Upload
trinhtuyen -
Category
Documents
-
view
241 -
download
0
Transcript of The Port of Rotterdam - d1rkab7tlqy5f1.cloudfront.net · The Port of Rotterdam: the largest...
The Port of Rotterdam: the largest “capacitor” of the Netherlands
Delft, September 14th 2017 Rob Stikkelman [email protected]
2
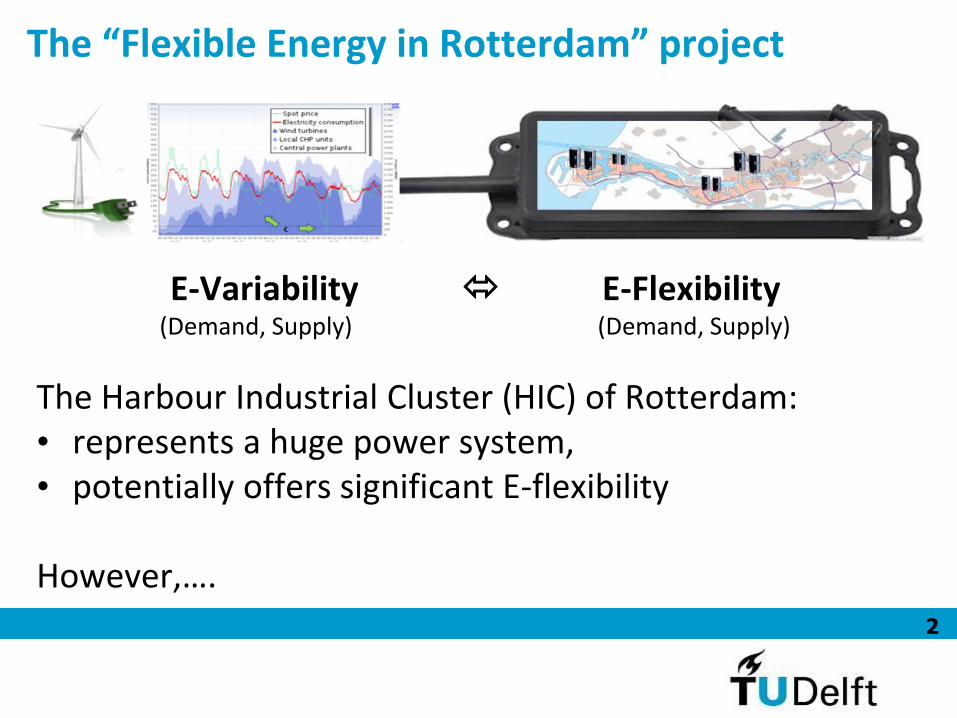
E-Variability E-Flexibility (Demand, Supply) (Demand, Supply)
The Harbour Industrial Cluster (HIC) of Rotterdam: • represents a huge power system, • potentially offers significant E-flexibility However,….
The “Flexible Energy in Rotterdam” project

3
There was a lack of data and knowledge: • Which flexibility options can we create within
individual companies and clusters? • What is the effect of integrated processes? • How much variability do we observe in the electricity
markets? • How do we harvest this variability? • To which extent is the electric power grid a limiting
factor? • Etc.
The “Flexible Energy in Rotterdam” project

4
Project team
The “Flexible Energy in Rotterdam” project

Markets
The Harbor Industrial Cluster as “Capacitor"
HIC Processes
net
wo
rk
€
up down
Natural gas
Electricity products
5
6
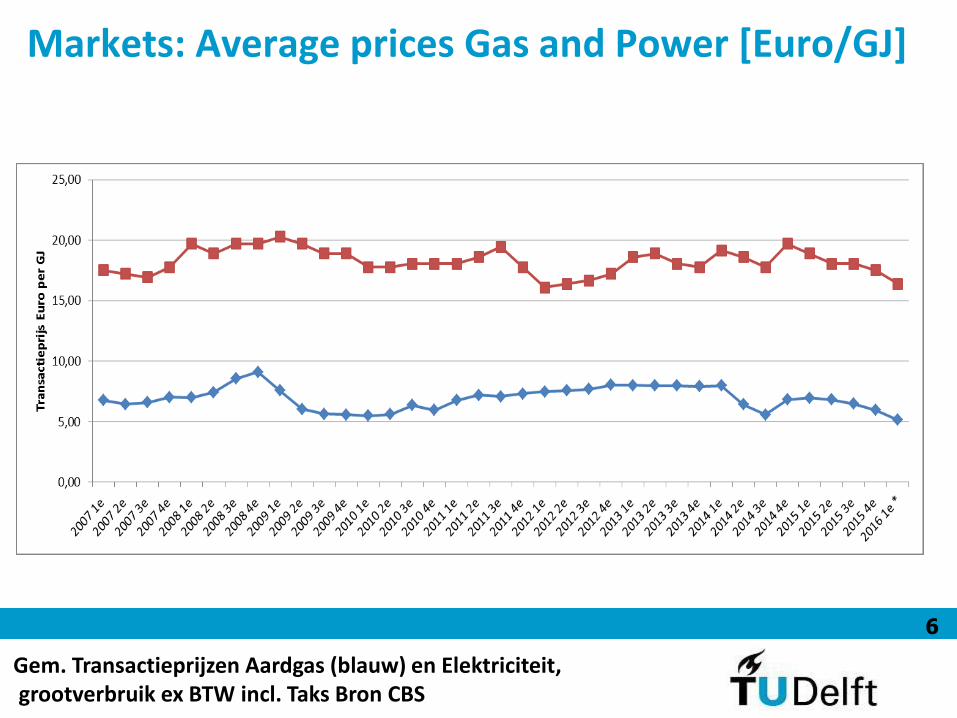
Markets: Average prices Gas and Power [Euro/GJ]
Gem. Transactieprijzen Aardgas (blauw) en Elektriciteit, grootverbruik ex BTW incl. Taks Bron CBS
7
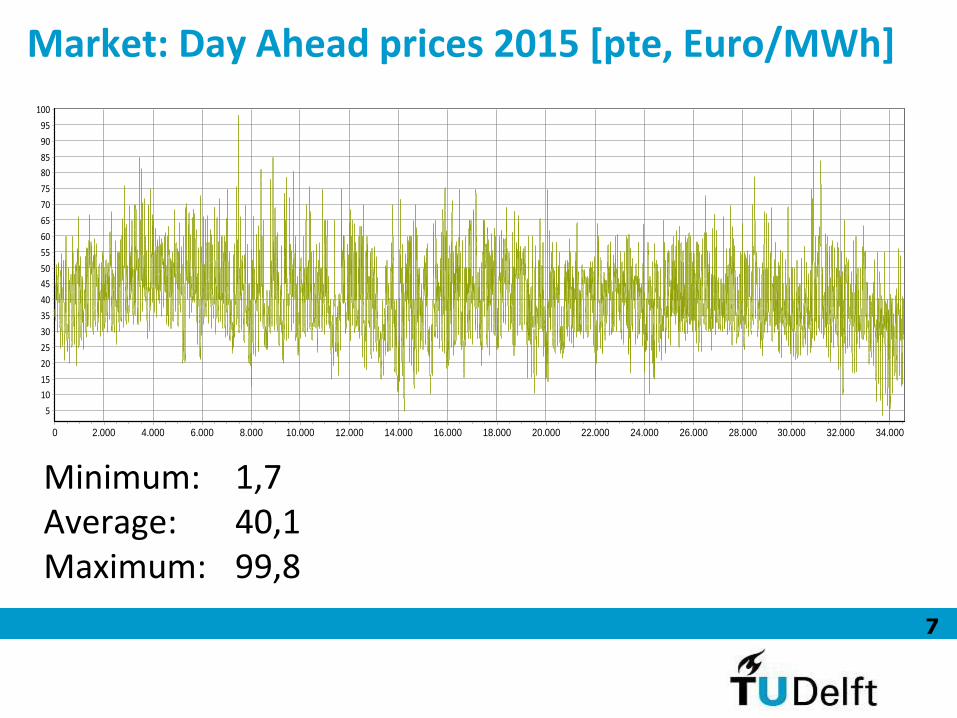
Minimum: 1,7 Average: 40,1 Maximum: 99,8
Market: Day Ahead prices 2015 [pte, Euro/MWh]
34.00032.00030.00028.00026.00024.00022.00020.00018.00016.00014.00012.00010.0008.0006.0004.0002.0000
100
95
90
85
80
75
70
65
60
55
50
45
40
35
30
25
20
15
10
5

8
E
Market: Prices RRV trade 2015 [pte,Euro/MWh]
34.00032.00030.00028.00026.00024.00022.00020.00018.00016.00014.00012.00010.0008.0006.0004.0002.0000
700
600
500
400
300
200
100
0
-100
-200
-300
-400
Up Down Minimum: 0 -429 Average: 79 7 Maximum: 738 78

9
Market: Prices imbalance trade 2015 [Euro/MWh]
<price> Euro/MWh
<Volume> MWh/pte
UP 79 15,1
DOWN 7 -13,9

10
E
Networks: 150 and 380 kV net

11
E
Selected processes and products
• Electrolysis of brine, Chlorine, Cl2
• Production of liquid Carbon dioxide, CO2
• Air separation, Liquid Oxygen O2
• Charging Batteries of Automated Guided Vehicle (AGV)
• Milling Cement
• Cooling warehouses
• Production of steam
• Heating of stored bunker oil
12
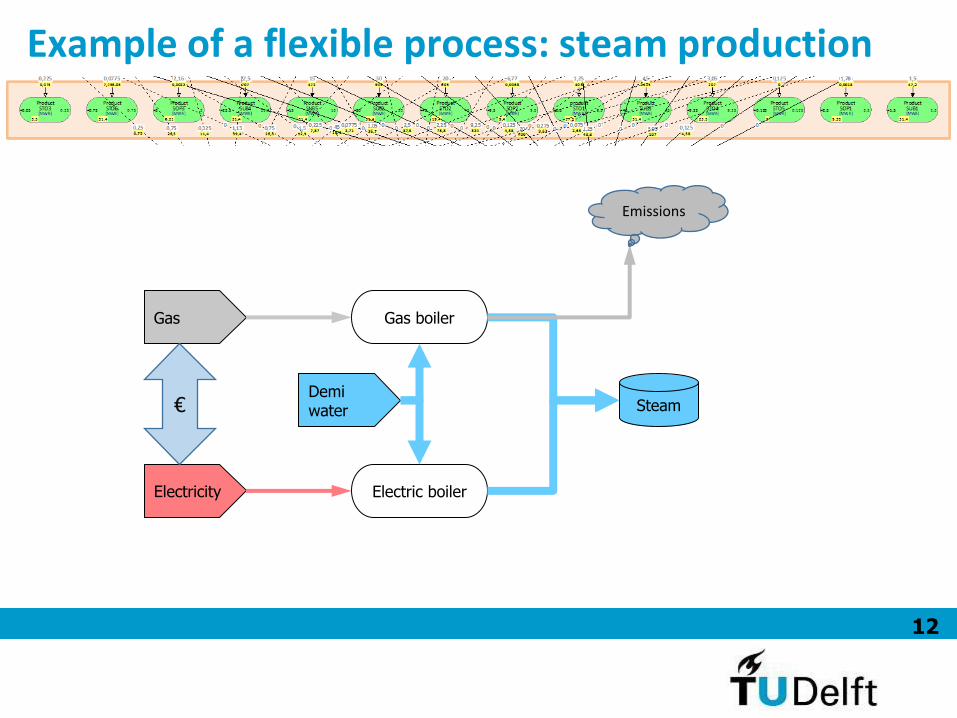
Example of a flexible process: steam production
Electricity
Steam Demi water
Electric boiler
Gas boiler Gas
Emissions
€

13
Modelling the system: Linny-R by Pieter Bots
• easy-to-use software tool for industrial process optimization (LP)
• allows to model a production system as (clusters of) processes that have products as inputs and outputs.
• calculates at what level processes should be scheduled to produce the desired quantities of end products while maximizing profit (or minimizing cost).
• Allows time series
• Uses the lp_solve library version 5.5.2.0 developed by Michel Berkelaar, Kjell Eikland,
and Peter Notebaert, • Uses the API for Delphi developed by Henri Gourvest

14
Modelling the system: Linny-R

15
Network: A (too) Simple model OUTCOMES OF EXPERIMENT "Base run" -- Success
0
0,001
BLStroom[MWh]
0
0
E invoeruit markt
[MWh]
1
51,70,0518
1 0
1
0
1
0
10
1
51,70
51,7[0 ... 70]
0,001
BLbasislast
0[0 ... 20]
0,01
BL hogelast
0[0 ... 10]
0,1
BL Extremelast
Maasvlakte Geervliet Europoort Theemsweg Merseyweg Botlek Oudeland

16
Modelling the system: The production of chlorine
0
25,0
Liquifiedchlorine
[ton]
0
7,27
NaOH32%[ton]
0,54833
H2[ton]
39,6
11,4
NaOH50%[ton]
-29,70
NaCl[ton]
-28,50
DemiWater[ton]0
10,0
power[MWh]
-61,9
0
low-pressuresteam
[MWh,th]
1095
2,96
<1600
>500
Cl2storage
[ton]
16
25,0
=16
Cl2delivered
[ton]
-5
-150 -150
imbalancepower[MWh]
-40
30 30
day-aheadpower[MWh]
1 18450
3,4461,91547
0,03
0,5413,5
161,9450
0,6439,6288
1,6529,70
2,82
50,80
2,5
45450
1
61,90
12
50,0
1 250,0
10
10
116400
1 16400
0,3622,3162
1
401200
1
401200
1
5-750
1
5-7501
0
1
0
18[9 ... 18]
25,0
Electrolysis
61,9[0 ->
7,27
Evaporator
2[0 ->
25,0
fill
0[0 ->
2,92
empty
16[0 ->
25,0
Offtake
5[5]
-150
buy onimbalance
market
40[40]
30
buy on day-ahead market
0[0]
10,0
sell onimbalance
market
Joint effort with companies to:
• build trust and mutual understanding
• create curiosity

17
Modelling the system: standard storage process
OUTCOMES OF EXPERIMENT "Base run" -- Success
2,5
17
=2,5
productSTO1[MWh]
171
0
<240
>120
opslagSTO1[MWh]
0
0,001
THStroom[MWh]
-65,2
34
<0
E day-ahead[MWh]
0
0
=0
Eafregelen
[MWh]27,9
34
<37,7
>0
Eopregelen
[MWh]0
34
inkooptotaal STO1
[MWh]
11,250
1 1,2542,5
11,250,0013
12,585
10
1
2,585
1 0 11,2542,5
1 1,2542,5
1
1,2542,5
1 0
1
01
1,250
0[0 ->
17
vullenSTO1
1,25[0 ->
0
legenSTO1
1,25[1,25 ... 3,75]
34,0
producerenSTO1
2,5[2,5]
34
DA inkoopSTO1
0[0 ->
0
E inkoopSTO1
1,25[0 ->
34
E verkoopSTO1
STO STO STO STO STO

18
Modelling the system: standard substitution process
SUB SUB SUB SUB SUB

19
Results: Single storage process and imbalance prices
Effect of storage size and future knowledge of prices

20
The port model OUTCOMES OF EXPERIMENT "Base run" -- Success
2,5
17,5
=2,5
productSTO1[MWh]
0
0
=0
Eafregelen
[MWh]-65,2
35
<0
E day-ahead[MWh]
-139
25
<0Gas
[MWh] 0
0
E invoeruit markt
[MWh]
0
0,001
EPStroom[MWh]
0
0,001
BLStroom[MWh]
0
0,001
MVStroom[MWh]
0
0
GVStroom[MWh]
0
0,001
OLStroom[MWh]
0
0,001
THStroom[MWh]
0
0
MEStroom[MWh]
45
19,4
=45
ProductSTO2[MWh]
0,25
3,5
=0,25
ProductSTO3[MWh]
9,25
23,5
=9,25
ProductSTO4[MWh]
0,125
0
=0,125
ProductSTO5[MWh]
0,75
31,4
=0,75
ProductSTO6[MWh]
1,5
31,4
=1,5
ProductSUB1[MWh]
30
31,4
=30
ProductSUB2[MWh]
45
31,4
=45
ProductSUB3[MWh]
22,5
31,4
=22,5
ProductSUB4[MWh]
15
31,4
=15
ProductSUB5[MWh]
2,5
9,35
=2,5
ProductSOP1[MWh]
9,5
9,4
=9,5
ProductSOP2[MWh]
3
9,21
=3
ProductSOP3[MWh]
24,7
35
<28,1
>0
Eopregelen
[MWh]
1
1,2543,8
1
0
1
0
1
2,20
1
2,20,0022
1
0
1
0
1
27,50,0276
1
0
1
0
1
0
1
0
1
27,50
1
0,69750,0007
1
0
1
0
1
0
1
0
1
0,69750
1
0
1
0
1
0
1
0
1
0
1
0
1
0,353,50E-04
1
0
1
0
1
0
1
0
1
0,350
1
9,70,0097
1
0
1
0
1
0
1
0
1
9,70
1
0
1
0
1
0
1
0
1
0
1
0
1
1,250,0013
1
0
1
25875
1
250,025
1
0
1
0,0250,875
1
0,0252,50E-05
1
0
1
6,2217
1
6,20,0062
1
0
1
0
1
0
1
0
1
0,672523,5
1
0,67250,0007
1
1,547,2
1
0,0757,50E-05
1
1,7844,5
1
30943
1
1,50,0015
1
35,6891
1
451415
1
2,250,0023
1
53,41336
1
22,5707
1
1,130,0011
1
26,7668
1
15472
1
0,750,0008
1
17,8445
1
0
1
0,71523,4
1
0,2752,75E-04
1
0,5513,8
1
0
1
2,7389,3
1
1,050,0011
1
2,152,5
1
0
1
0,84527,6
1
0,3253,25E-041
0,6516,2
140,50
1
451575
1
0
1
20700
1
0,1254,38
1
0
1
0,1254,38
1
2,587,5
1
0
1
1,2543,8
1
9,25324
1
0
1
3,05107
1
0,258,75
1
0
1
0,2257,87
1
0,7526,3
1
0
1
0,07752,71
1
2,2578,8
1
0
1
0
1
1,0536,7
1
0
1
0
1
0,0752,63
1
0
1
0
1
1,552,5
1
0
1
0
1
1,1339,4
1
0
1
0
1
0,7526,3
1
0
1
0
1
0,2759,63
1
0
1
0
1
0,32511,4
1
0
1
0
1
0
1
1,250
1
0,2250
1
0,07757,75E-05
1
2,160,0022
1
200
1
6,770,0068
1
3,050
1
0,1250
1
1,780,0018
1
0
1
0
40,5[0 ->
0
LeveringElektriciteit
0[0 ->
100
Andereafregelaars
0[0 ->
1000
Andereopregelaars
STO1
Europoort 150 kV200 MW
Botlek 150 kV400 MW
Maasvlakte 150 kV200 MW
Geervliet 150 kV200 MW
Oudeland 150 kV200 MW
Theemsweg 150 kV200MW
Merseyweg 150 kV200 MW
STO2STO3 STO4 STO5STO6 SUB1SUB2 SUB3SUB4 SUB5 SOP1SOP2SOP3
Natural gas Electricity production
Up Down
Day-Ahead market

21
Experiments for 2015
1. Reference case
2. No balancing
3. Zero flexibility
4. No limits
– Day- Ahead and RRV prices
– Volumes Up and Down RRV per pte
– Gas price is 25 €/MWh
– As reference case, but volumes Up and Down are zero
– As No balancing, but no gas tipping point
– As reference cases, but infinite volumes for Up and Down

22
Results: Reference case
Mean
St.dev.
Min.
Max.
Sum
[MWh/pte]
[GWh/year]
Down BM
-6,1
12,5
-122
0
-210
Up BM
1,0
3,4
0
66
35
Day-ahead
-68,8
22,5
-210
-65
-2377
E-load 73,8 24,1 37,3 203,9
2550 G-Load 141,3 24,8 14,7 152,1
4883
Flex load HIC 2015 4*(1,0 − -6,1)= 28,4 MW

23
Results: No Limits
Mean
St.dev.
Min.
Max.
Sum
[MWh/pte]
[GWh/year]
Down BM
-41,3
56,3
-139
0
-1428
Up BM
3,4
13,9
0
173
116
Day-ahead
-68,8
22,5
-210
-65
-2377
E-load 107 59,3 37,3 204
2550
Upper limit average Flex load HIC
4*(3,4 − -41,3) = 179 MW
Max transport capacity 4*173= 692 MW
Network OK?

24
Results: Value of Flexibility
Sum
Energy costs
[M€/year]
Zero flexibility 221,7
No balancing 219,9
Referentie casus
205,8
No limits
157,6
Value flex HIC in 2015 221,7 − 205,8= 15,9 M€ Market volume limits
Maximum value flex 221,7 − 157,6= 64,1 M€
Technique limits
25
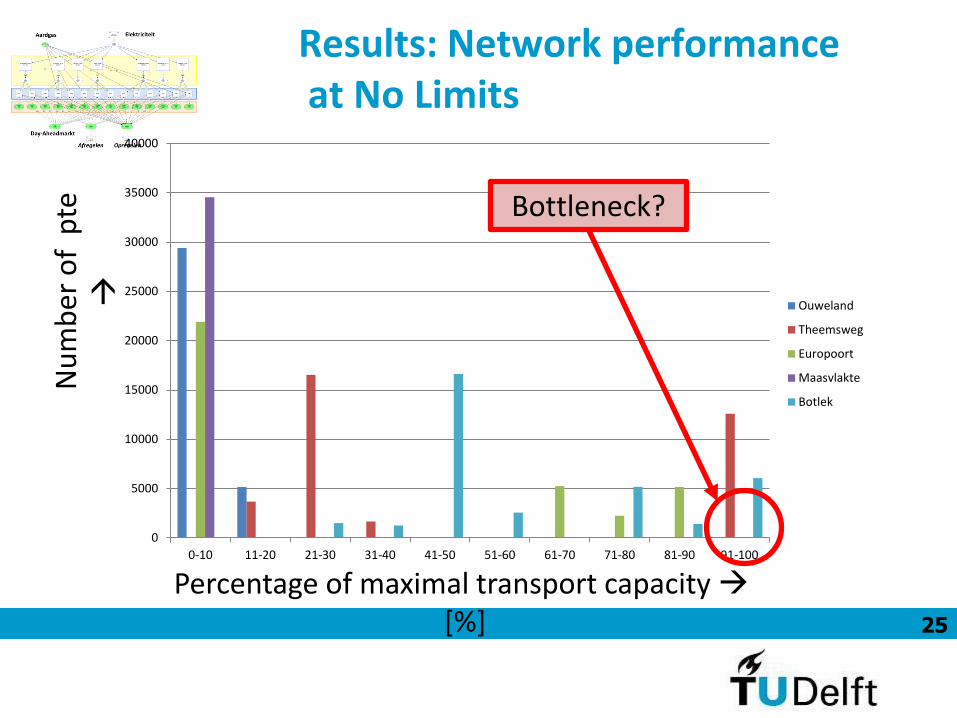
Results: Network performance at No Limits
0
5000
10000
15000
20000
25000
30000
35000
40000
0-10 11-20 21-30 31-40 41-50 51-60 61-70 71-80 81-90 91-100
Ouweland
Theemsweg
Europoort
Maasvlakte
Botlek
Percentage of maximal transport capacity [%]
Nu
mb
er o
f p
te
Bottleneck?

26
Closure
Model results for 2015 case:
• The port of Rotterdam is able to offer on average 179 MW of flexibility
• The RRV market offered on average 53,2 MW of variability
• Due to market limitations only 28 MW on average was used with a total value of 15,9 million Euro
• Value of the RRV market in 2015 was 32,4 million Euro

27
Closure
The project was a success:
• Project members were always on board
• We learned a lot
• Follow-up projects are developed
Simple LP model has been made:
• New insights were generated
• The model can easily be adjusted for other industrial area
• Too simple?