
The population impact of delaying childbearing in the ...
18
The population impact of delaying childbearing in the context of high adolescent fertility and marriage Vladimira Kantorova and Ann Biddlecom United Nations, Department of Economic and Social Affairs, Population Division 2 April 2014 Corresponding author: Vladimira Kantorova, United Nations, Department of Economic and Social Affairs, Population Division, New York, NY 10044 (email: [email protected]). Paper submitted for the 2014 annual meeting of the Population Association of America (Boston, MA). The views expressed herein are those of the authors and do not necessarily reflect the views of the United Nations.
Transcript of The population impact of delaying childbearing in the ...

The population impact of delaying childbearing in the context of high adolescent
fertility and marriage
Vladimira Kantorova and Ann Biddlecom
United Nations, Department of Economic and Social Affairs, Population Division
2 April 2014
Corresponding author: Vladimira Kantorova, United Nations, Department of Economic
and Social Affairs, Population Division, New York, NY 10044 (email:
[email protected]). Paper submitted for the 2014 annual meeting of the Population
Association of America (Boston, MA). The views expressed herein are those of the
authors and do not necessarily reflect the views of the United Nations.

1
Abstract
We examine the population impact of delaying childbearing in the context of efforts to
eliminate child marriage, invest in the human capital of girls and expand access to sexual
and reproductive health information and services. In the future, these efforts would likely
lead to a reduction of fertility rates in the youngest age groups. For the period up to 2040,
we simulate a postponement of childbearing and use a cohort component population
projection method for two types of countries where marriage at young ages is common:
one where adolescent fertility (births to females aged 15-19) and period total fertility are
currently high (Ethiopia and Nigeria) and one where adolescent fertility is high and total
fertility is already approaching replacement level (Bangladesh and Nepal). Delayed
childbearing has an impact on population growth net of the projected fertility decline, and
the impact is an 8 to 10 per cent reduction in the population below age 20 by 2040
compared to the projection with no postponement of childbearing.
Introduction
International efforts to improve the human capital of girls and young women and to
ensure the protection of their rights, such as a focus of the Millennium Development
Goals on achieving gender parity in schooling, reducing adolescent fertility and
expanding access to reproductive health services (United Nations, 2013a), efforts to
eliminate child marriage (Machel et al., 2013) and the attention to girls and women in the
new global development agenda will ultimately change the lives of girls and young
women. As a greater proportion of girls and young women in each succeeding cohort
achieves a higher level of schooling, postpones marriage and has access to effective
methods of contraception, these efforts are likely to prompt, sustain or even accelerate a
delay in the start of childbearing.
In this paper we examine the potential macro-level impact of delaying childbearing on
period total fertility and on population growth from 2010 to 2040, a time period in which
we introduce the gradual postponement from early to later childbearing. We test the
impact of delayed childbearing by simulating changes in age-specific fertility rates
(ASFR) and using a cohort component population projection method for two types of
countries where marriage at young ages is common: one where adolescent fertility (aged
15-19) and period total fertility are currently high (Ethiopia and Nigeria) and one where
adolescent fertility is high and period total fertility is already approaching replacement
level (Bangladesh and Nepal).
Current levels of child marriage and adolescent childbearing
Elimination of child marriage (commonly defined as marriage before the age of 18) has
gained international attention as part of efforts to improve gender equality and women’s
empowerment as well as women’s health (Machel et al., 2013), and has also been
proposed as a target for the new global development agenda (High-Level Panel of
Eminent Persons on the Post-2015 Development Agenda, 2013). Most countries have

2
laws that would theoretically make child marriage rare. For example, in 2010, 158
countries had a minimum legal age at marriage for women (without parental consent) of
18 years or older (United Nations, 2011). Yet child marriage still remains common,
especially in Southern Asia and sub-Saharan Africa. In 39 countries at least one in three
young women (aged 20-24) reported in a recent survey that they had married before the
age of 18 (UNICEF, 2013). A young age at marriage is also associated with a young age
at the start of childbearing and high levels of adolescent fertility (figure 1), with the
exception of most countries in Latin America and the Caribbean and Southern Africa,
where adolescent childbearing is often outside of marriage.
FIGURE 1 Prevalence of child marriage and adolescent fertility, 2005-2010
Source: UNICEF, 2013, table 9 and World Population Prospects 2012 (United Nations, 2013b)
The four countries included in this analysis have relatively high levels of both early
marriage and childbearing. Nepal and Ethiopia have a prevalence of child marriage
around 40 per cent and adolescent fertility is estimated around 90 births per 1,000 women
aged 15-19 for the period 2005-2010 (United Nations, 2013b). Nigeria has a similar
prevalence of child marriage but a much higher level of adolescent fertility (135 births
per 1,000 women aged 15-19). Bangladesh has a similar level of adolescent childbearing
as Ethiopia and Nepal, but a much higher prevalence of child marriage (65 per cent of
women aged 20-24 reported that they had married before the age of 18).
In general, with high adolescent fertility, the overall number of children per woman is
high. There is, however, a wide range of situations. Countries with adolescent fertility
above 50 births per 1,000 women aged 15 to 19 but period total fertility below 4 children

3
per woman in 2005-2010 are mainly in South Asia, Southern Africa, and Latin America
and the Caribbean, including Bangladesh with period total fertility estimated for 2005-
2010 at 2.4 children per woman and Nepal with 3.0 children per woman (Figure 2).
During the fertility transition in these countries, fertility declined proportionally more in
older age groups and childbearing is now concentrated into younger age groups.
Countries with high adolescent fertility and high period total fertility are primarily in sub-
Saharan Africa, including Nigeria with more than 6 children per woman and Ethiopia
with 5.3 children per woman in 2005-2010.
FIGURE 2 Total fertility and adolescent fertility, 2005-2010
Source: World Population Prospects 2012 (United Nations, 2013b)
Note: Countries in the figure are divided into three groups: countries where adolescent fertility is below 50
births per 1000 women aged 15-19 (grey colour); countries where adolescent fertility is more than 50
births per 1000 women aged 15-19 and total fertility is more than 4 children per woman (red colour) or less
than 4 children per woman (blue colour).
High population growth is projected to continue in all four countries. Yet, the extent and
components of the population growth are quite different. Ethiopia and Nigeria are
expected to grow fast and are projected to more than double by 2050 (increase 2.2 times
in Ethiopia and 2.8 times in Nigeria). High fertility is responsible for the high population
growth: in Nigeria, 75 per cent of the population increase between 2010 and 2050 is due
to projected fertility above replacement level and in Ethiopia 47 per cent of population

4
increase in this period is from above-replacement fertility. Additionally, a young age
structure of the population is responsible for 22 per cent of the projected population
increase between 2010 and 2050 in Nigeria and 45 per cent in Ethiopia (Andreev et al.,
2013). Bangladesh and Nepal, despite period total fertility levels that are projected to be
below 2.1 children per woman from around 2020 onwards, are expected to have total
populations larger by one third by 2050. These populations continue to grow even at or
below replacement-level fertility because of current young age structures, as relatively
large cohorts at young ages move through their childbearing years.
Changes in the timing of childbearing and population growth
The potential impact of shifts to later ages of childbearing on population growth was
addressed over 50 years ago by Coale and Tye (1961), who argued for incorporating the
delay in age of marriage into the population policy discourse. They showed that even
when the total number of children each woman bears does not change, postponing
marriage (and, implicitly, childbearing) would slow population growth in high-fertility
populations. They employed a mathematical model developed earlier (see Dublin and
Lotka, 1925) and empirical evidence comparing the population growth rates of two high-
fertility populations, each with different age patterns of childbearing, and concluded that
high-fertility populations with later patterns of childbearing experienced slower
population growth.
Two main reasons why a younger childbearing pattern in populations with high fertility
and mortality produces faster growth are: 1) younger childbearing permits some births to
occur that otherwise would be prevented by the mortality of women of reproductive age,
and 2) the population growth per generation that results from a given average number of
offspring is compressed into a shorter time period to produce a higher annual rate of
growth. Also, the pyramid shape of the age distribution in high-fertility countries, with
large population sizes at young ages and a rapid reduction in the number of women in
older age groups, results in a larger number of births when the same fertility rates are
applied to younger age groups.
The shifts in the timing (tempo) of childbearing may cause considerable fluctuations in
period fertility rates and thus have an additional impact on population size. The increased
period fertility of the baby boom era between the mid-1950s and the mid-1960s in many
countries in Western and Northern Europe, as well as the pronatalist policy measures in a
number of countries in Central and Eastern Europe during the communist regime, were
partly driven by shift of childbearing to younger ages of women. In the opposite
direction, the ongoing trend in the postponement of childbearing in Europe has been
unprecedented in its pace, duration and ultimately its impact on period fertility measures,
explaining a large part of the declines and rises in period total fertility in Europe
(Sobotka, 2004; Bongaarts and Sobotka, 2012) and consequently influencing population
growth. It has been suggested that ending the increase in the mean age at childbearing in
Europe would have a substantial effect on population dynamics by slowing population
decline and aging (Lutz et. al, 2003; Lutz and Skirbekk, 2005).

5
In the context of high-fertility countries, Bongaarts (1994) addressed the delay in
childbearing with respect to policy-relevant ways to slow population growth attributable
to population momentum. He examined the potential population impact of delayed
childbearing by simulating the effect for a population with replacement-level fertility of a
2.5 year and 5 year increase in the mean age at childbearing. Substantial reductions in
population size resulted by 2100: for all developing countries, a 2.5 and 5 year delay in
childbearing resulted in a reduction of 0.6 billion and 1.2 billion, respectively. A more
recent study of the demographic impact of delayed childbearing used cohort component
population projections in India and found that a policy encouraging later marriage and
longer birth spacing would result in a future total population in 2050 of about 52 million
fewer people–a reduction by 3.3 per cent—than if the current early fertility trajectory in
India continued (Matthews et al., 2009).
In estimating the impact of changes in the timing of childbearing and population growth,
these previous studies employed either mathematical models derived from stable
population theory and its extensions with simulation exercises of changes in the mean age
of childbearing in specific populations (Bongaarts, 1994; Lutz et al., 2003; Goldstein et
al., 2003), or full details of current and projected age-specific fertility rates, starting age
structure and mortality and migration projections in a full cohort-component model (Lutz
and Skirbekk, 2005; Matthews et al., 2009). While the first approach is valuable for
studying long-term impacts, the second approach enables a more detailed assessment of
the impact of the postponement of childbearing in the short term of just a few decades.
Recent examples of the postponement of childbearing
While early childbearing has never been as common in Europe as in parts of Africa and
Asia, there are recent examples of fast reductions of high fertility rates among women
aged 15 to 24 years through the process of the postponement of childbearing. For
example, in the Czech Republic as of 1990, the peak fertility rates were among 21-year-
olds (185 births per 1,000 women aged 21), and a quarter of period total fertility was
contributed by women aged 19 or less (Human Fertility Database, 2014). In the wake of
political, economic and social transformations since 1990, the postponement of
childbearing played a pivotal role in the fall of period total fertility rates over the 1990s.
The experience of the Czech Republic illustrates that the reduction in early childbearing
can occur in a short time period: in just 15 years, the fertility rates among women aged
18-22 declined by more than three quarters of the levels in 1990 (figure 3). Similar
changes in timing of childbearing characterize many Central and Eastern European
countries (Sobotka, 2004). In more general terms, the postponement of the mean age at
childbearing has characterized a wide range of countries with diverse cultural and social
conditions in Europe, East Asia, Northern America and Australia and New Zealand.
Outside of these regions, few other countries have experienced a significant
postponement in the mean age at childbearing. In countries of Northern Africa, rapid
fertility declines in the 1970s and 1980s have been led by delays in marriage. In Algeria,

6
the proportion of women married at young age groups declined between the 1966 and the
1987 censuses: from 44 per cent to 9 per cent at ages 15–19 and from 83 per cent to 46
per cent at ages 20–24 (United Nations, 2013). Period total fertility in the country
declined from 8.1 children per woman in 1970 to 5.3 in 1981–1985. In societies where
women face heavy social restrictions against sexual relationships outside of marriage, a
rise in the marriage age is strongly correlated with lower fertility (Ouadah-Bedidi and
Vallin, 2013). Such declines in fertility rates are then concentrated at young ages (figure
4); fertility rates among women aged 15-19 declined from 109 births per 1,000 women in
1970 to 24 in 1981-1985 and among women aged 20 to 24 from 330 births per 1,000
women in 1970 to 181 in 1981-1985.
FIGURE 3 Age-specific fertility rates in the Czech Republic, selected observations
Source: Human Fertility Database. http://www.humanfertility.org
FIGURE 4 Age-specific fertility rates in Algeria, selected observations
Source: Collection of data by Ouadah-Bedidi and Vallin, 2013.

7
The fast fertility transition in Iran is another example. In 1980, the adolescent fertility rate
was above 150 births per 1,000 women aged 15-19. During the 1980s fertility shifted to a
relatively later childbearing pattern with the peak of childbearing in the age group 25–29
years. Since the late 1990s, adolescent fertility rates declined further to below 50 births
per 1,000 women by 2000 (Abbasi-Shavazi et al., 2009). At the same time, the proportion
of women married in young age groups declined between the 1976 and the 2006
censuses: from 34 per cent to 17 per cent at ages 15–19 and from 79 per cent to 50 per
cent at ages 20–24 (Abbasi-Shavazi et al., 2009).
FIGURE 5 Age-specific fertility rates in Iran, selected observations
Source: Own-children estimates of the age specific fertility rates for Iran, 1986, 1996, 2006 Censuses (Table 3.3, page
52, Abbasi et al., 2009).
Algeria and Iran are examples of countries with an initial situation of early marriage and
high fertility rates and where postponement of marriage and childbearing contributed to
faster fertility transitions. Such types of fertility transitions are examples of the potential
impact of eliminating child marriage and delaying childbearing in high-fertility countries
in Africa and Asia. The mechanism of the postponement of childbearing in Central and
Eastern European countries, with initial situations of early marriage and total fertility
close to replacement level, are examples of the potential impact of delaying childbearing
in countries in Asia with high adolescent fertility and period total fertility already close to
replacement level.
Scenarios of the postponement of childbearing
The population projections used in this analysis are based on estimates and projections
(medium variant) from the 2012 Revision of World Population Prospects (United
Nations, 2013b). We create three age-specific fertility scenarios in which all other
components—mortality, migration, current population age structure and total fertility—
are as specified in the 2012 Revision. For projections we use the same cohort-component
methodology and programs as in the 2012 Revision.

8
Three scenarios for each of the countries with an early start of childbearing are centred on
the age-specific fertility patterns. In the first scenario, we assume that the proportional
age-specific fertility rates (PASFR) stay constant at the values for 2010-2015 over the
whole projection period until 2040 (the “constant PASFR” scenario). Age-specific
fertility rates change proportionally in relation to the projected period total fertility from
the 2012 Revision of World Population Prospects.
In the next step, we assume a change in the age pattern of childbearing that reduces the
age-specific fertility rate in the age group 15-19 by 25 per cent in the period 2015-2020
compared to the situation in 2010-2015, and by another 25 per cent for 2020-2025 and
2025-2030. Thus, by 2025-2030, the ultimate impact is an assumed reduction by 75 per
cent of the age-specific fertility rate for adolescents (15-19) in a 15-year time period.
Several countries experienced this magnitude of change in the adolescent fertility rate
over a similar time period, as described earlier. A smaller reduction is assumed for the
fertility rate in the age group 20-24, with a reduction by 10 per cent in 2015-2020 and
again in 2020-2025 and 2025-2030, resulting in a total impact of a 30 per cent reduction
by 2025-2030 compared to 2010-2015. We assume that postponed births from the age
groups 15-19 and 20-24 are realized 10 years later in the age groups 25-29 and 30-34,
respectively. By 2040, the transformation is completed from the initial age pattern of
fertility to an older age pattern of fertility.
In the second scenario, the projections of the total fertility from the 2012 Revision of
World Population Prospects, which we assume are due to a quantum effect, are applied
to the proportions of age-specific fertility rates (PASFR) from the postponement scenario
(the “postponement only” scenario). In countries with a fast decline in period total
fertility, the age-specific fertility rates for age groups 15-19 and 20-24 in 2025-2030 will
be reduced by more than 75 per cent and 30 per cent, respectively, from the rates in 2010-
2015, due to the impact of overall fertility decline.
A third scenario adopts the proportions of age-specific fertility rates (PASFR) changes
described above and also includes the additional transitory impact on period total fertility
from the change from one age-specific fertility schedule to another. We calculate the
proportional impact of the postponement of childbearing on the period total fertility for
the periods 2015-2020 to 2030-2035 and apply the ratio to the projected total fertility
from the 2012 Revision of World Population Prospects. The resulting age-specific
fertility rates and period total fertility are used in the third scenario (the “postponement
with the impact on period total fertility” scenario). The shifts in the timing of
childbearing reduce period total fertility by 9 per cent in Ethiopia and Nigeria (difference
in absolute terms of 0.3 and 0.5 children per woman, respectively) and by 15 per cent in
Bangladesh and Nepal (difference of 0.3 children per woman) (Figure 6 and Table 1).

9
FIGURE 6 Period total fertility as projected in medium variant of the 2012 Revision of World
Population Prospects (scenarios 1 and 2) and the postponement scenario with the impact on period
total fertility (scenario 3)
The age-specific fertility rates from the constant PASFR scenario (scenario 1) and the
postponement scenario with the impact on period total fertility (scenario 3) are illustrated
in Figure 7 for the periods 2010-2015 to 2035-2040. The resulting mean age at
childbearing would increase between 2010-2015 and 2035-2040 from 25.8 years to 28.2
years in Bangladesh and from 29.8 years to 31.1 years in Ethiopia. The impact of
postponement on period total fertility is highest in 2020-2025, with total fertility of 1.6
children per woman compared to 1.9 children per woman from the constant PASFR
scenario in Bangladesh. In 2020-2025, the postponement scenario produces a period total
fertility of 3.2 children per woman compared to 3.5 children per woman from the
constant PASFR scenario in Ethiopia and 4.6 children per woman compared to 5.1
children per woman from the constant PASFR scenario in Nigeria.

10
FIGURE 7 Projected changes in age-specific fertility rates, constant PASFR (scenario 1) and
postponement scenario with the additional impact on period total fertility (scenario 3), 2010-2015 to
2035-2040

11
Table 1: Age-specific fertility rates for age groups 15-19 and 20-24, mean age at childbearing and
period total fertility for the postponement scenario with the additional impact on period total fertility
(scenario 3) and comparison with period total fertility from WPP 2012 (medium variant)
Scenario 3
Total fertility WPP2012
Ratio of scenario 3 to
WPP2012 Country Period
ASFR 15-19 (births per
1000 women)
ASFR 20-24 (births per
1000 women)
Mean age at childbearing
(years)
Total fertility (children per
woman)
Bangladesh
2010-2015 81 150 25.8 2.20 2.20 100
2015-2020 56 125 26.3 1.88 2.05 92
2020-2025 35 105 26.9 1.62 1.93 84
2025-2030 17 87 27.9 1.54 1.83 84
2030-2035 16 84 28.0 1.62 1.76 92
2035-2040 16 82 28.2 1.72 1.72 100
Nepal
2010-2015 74 164 26.0 2.32 2.32 100
2015-2020 50 134 26.5 1.95 2.11 93
2020-2025 31 111 27.1 1.67 1.96 85
2025-2030 15 92 28.0 1.58 1.86 85
2030-2035 14 89 28.1 1.66 1.79 93
2035-2040 14 86 28.3 1.74 1.74 100
Ethiopia
2010-2015 78 197 29.8 4.59 4.59 100
2015-2020 51 155 30.3 3.83 4.00 96
2020-2025 30 121 30.8 3.22 3.52 91
2025-2030 13 94 31.2 2.87 3.14 91
2030-2035 12 86 31.2 2.73 2.85 96
2035-2040 11 79 31.1 2.63 2.63 100
Nigeria
2010-2015 120 240 30.2 6.00 6.00 100
2015-2020 86 207 30.7 5.47 5.73 96
2020-2025 54 174 31.2 4.94 5.43 91
2025-2030 25 143 31.7 4.64 5.10 91
2030-2035 24 133 31.6 4.55 4.76 96
2035-2040 22 124 31.6 4.42 4.42 100
12
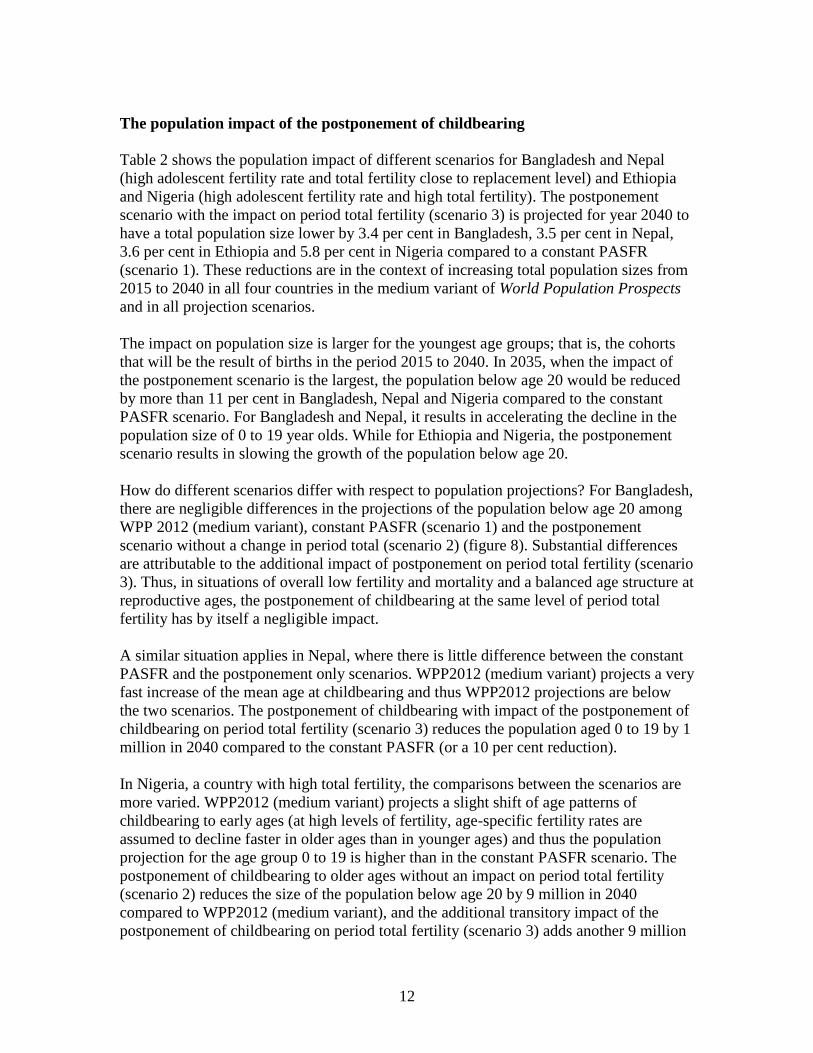
The population impact of the postponement of childbearing
Table 2 shows the population impact of different scenarios for Bangladesh and Nepal
(high adolescent fertility rate and total fertility close to replacement level) and Ethiopia
and Nigeria (high adolescent fertility rate and high total fertility). The postponement
scenario with the impact on period total fertility (scenario 3) is projected for year 2040 to
have a total population size lower by 3.4 per cent in Bangladesh, 3.5 per cent in Nepal,
3.6 per cent in Ethiopia and 5.8 per cent in Nigeria compared to a constant PASFR
(scenario 1). These reductions are in the context of increasing total population sizes from
2015 to 2040 in all four countries in the medium variant of World Population Prospects
and in all projection scenarios.
The impact on population size is larger for the youngest age groups; that is, the cohorts
that will be the result of births in the period 2015 to 2040. In 2035, when the impact of
the postponement scenario is the largest, the population below age 20 would be reduced
by more than 11 per cent in Bangladesh, Nepal and Nigeria compared to the constant
PASFR scenario. For Bangladesh and Nepal, it results in accelerating the decline in the
population size of 0 to 19 year olds. While for Ethiopia and Nigeria, the postponement
scenario results in slowing the growth of the population below age 20.
How do different scenarios differ with respect to population projections? For Bangladesh,
there are negligible differences in the projections of the population below age 20 among
WPP 2012 (medium variant), constant PASFR (scenario 1) and the postponement
scenario without a change in period total (scenario 2) (figure 8). Substantial differences
are attributable to the additional impact of postponement on period total fertility (scenario
3). Thus, in situations of overall low fertility and mortality and a balanced age structure at
reproductive ages, the postponement of childbearing at the same level of period total
fertility has by itself a negligible impact.
A similar situation applies in Nepal, where there is little difference between the constant
PASFR and the postponement only scenarios. WPP2012 (medium variant) projects a very
fast increase of the mean age at childbearing and thus WPP2012 projections are below
the two scenarios. The postponement of childbearing with impact of the postponement of
childbearing on period total fertility (scenario 3) reduces the population aged 0 to 19 by 1
million in 2040 compared to the constant PASFR (or a 10 per cent reduction).
In Nigeria, a country with high total fertility, the comparisons between the scenarios are
more varied. WPP2012 (medium variant) projects a slight shift of age patterns of
childbearing to early ages (at high levels of fertility, age-specific fertility rates are
assumed to decline faster in older ages than in younger ages) and thus the population
projection for the age group 0 to 19 is higher than in the constant PASFR scenario. The
postponement of childbearing to older ages without an impact on period total fertility
(scenario 2) reduces the size of the population below age 20 by 9 million in 2040
compared to WPP2012 (medium variant), and the additional transitory impact of the
postponement of childbearing on period total fertility (scenario 3) adds another 9 million
13
reduction in population compared to the constant PASFR (or a 10 per cent reduction in
population aged 0 to 20 through postponement of childbearing).
In Ethiopia, WPP2012 (medium variant) projects a slight increase in the mean age at
childbearing compared to the constant PASFR scenario. The postponement of
childbearing to older ages without an impact on period total fertility (scenario 2) reduces
the size of the population below age 20 by 1.6 million in 2040 compared to constant
PASFR scenario, and the additional transitory impact of the postponement of
childbearing on period total fertility adds another 3.4 million reduction in population
compared to the constant PASFR (or an 8 per cent reduction in population aged 0 to 19
through postponement of childbearing).
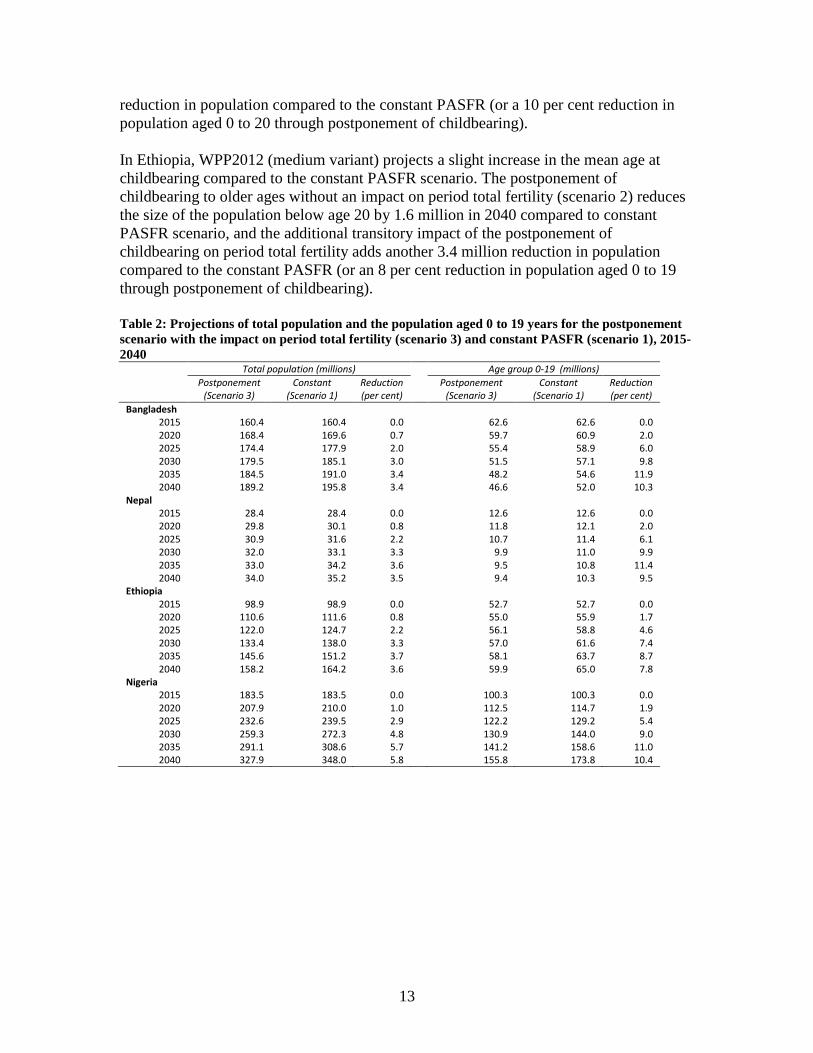
Table 2: Projections of total population and the population aged 0 to 19 years for the postponement
scenario with the impact on period total fertility (scenario 3) and constant PASFR (scenario 1), 2015-
2040 Total population (millions) Age group 0-19 (millions)
Postponement (Scenario 3)
Constant (Scenario 1)
Reduction (per cent)
Postponement (Scenario 3)
Constant (Scenario 1)
Reduction (per cent)
Bangladesh 2015 160.4 160.4 0.0
62.6 62.6 0.0
2020 168.4 169.6 0.7
59.7 60.9 2.0 2025 174.4 177.9 2.0
55.4 58.9 6.0
2030 179.5 185.1 3.0
51.5 57.1 9.8 2035 184.5 191.0 3.4
48.2 54.6 11.9
2040 189.2 195.8 3.4
46.6 52.0 10.3 Nepal
2015 28.4 28.4 0.0
12.6 12.6 0.0 2020 29.8 30.1 0.8
11.8 12.1 2.0
2025 30.9 31.6 2.2
10.7 11.4 6.1 2030 32.0 33.1 3.3
9.9 11.0 9.9
2035 33.0 34.2 3.6
9.5 10.8 11.4 2040 34.0 35.2 3.5
9.4 10.3 9.5
Ethiopia 2015 98.9 98.9 0.0
52.7 52.7 0.0
2020 110.6 111.6 0.8
55.0 55.9 1.7 2025 122.0 124.7 2.2
56.1 58.8 4.6
2030 133.4 138.0 3.3
57.0 61.6 7.4 2035 145.6 151.2 3.7
58.1 63.7 8.7
2040 158.2 164.2 3.6
59.9 65.0 7.8 Nigeria
2015 183.5 183.5 0.0
100.3 100.3 0.0 2020 207.9 210.0 1.0
112.5 114.7 1.9
2025 232.6 239.5 2.9
122.2 129.2 5.4 2030 259.3 272.3 4.8
130.9 144.0 9.0
2035 291.1 308.6 5.7
141.2 158.6 11.0 2040 327.9 348.0 5.8 155.8 173.8 10.4

14
FIGURE 8 Projected population aged 0 to 19 years (millions) in Bangladesh, Ethiopia, Nepal and
Nigeria, 2010 to 2040, constant PASFR (scenario 1), postponement only (scenario 2), postponement
with impact on period total fertility (scenario 3) and WPP2012 (medium variant)
15
Conclusion
International efforts to eliminate child marriage and invest in the human capital and
reproductive health of girls and young women are likely to have macro-level population
effects that go beyond policies and programmes targeting individual well-being and
rights. Countries where these investments are particularly relevant are in Asia and Africa,
where early marriage and early childbearing are closely correlated.
While childbearing patterns may start young, overall fertility levels are relatively diverse
across countries in these regions, and thus the implications of postponing childbearing
may be different. In Bangladesh and Nepal, fertility is approaching replacement level and
shifts in the age structure towards people of working-age have opened up an immediate
opportunity to reap a “demographic dividend”. In Ethiopia and Nigeria, total fertility
levels remain relatively high and the population pyramid retains a wide, populous base.
The population policy focus in the region is generally oriented towards supporting
investments in youth and women and, more recently, fertility decline in the context of
shifting the age structure and increasing economic growth (United Nations, 2013c).
The results from this analysis suggest that delayed childbearing has an impact on
population growth net of the projected fertility decline, and the impact can be as large as
an 8 to 10 per cent reduction in the population below age 20 by 2040 compared to the
projection with no postponement of childbearing. The impact may even be larger as we
have not considered the behavioural and biological effects of changes in the timing of
childbearing on the total number of children born over women's lifetimes. In countries
with high total fertility (such as Ethiopia and Nigeria), a later start of childbearing could
accelerate declines in overall fertility levels both in period and cohort perspective.
In sum, rights-based approaches of eliminating child marriage, investing in girls and
young women and ensuring reproductive rights have the potential to slow population
growth and support age structure shifts that reduce dependency ratios above and beyond
projected declines in the number of children women have over their reproductive years.
References Abbasi-Shavazi, Mohammad Jalal, Peter McDonald and Meimanat Hosseini-Chavoshi (2009).
The Fertility Transition in Iran: Revolution and Reproduction. Springer Verlag.
Andreev, Kirill, Vladimira Kantorova and John Bongaarts (2013). Demographic components of
future population growth. Technical Paper 2013/3. United Nations Population Division.
No. 2013/3
Bongaarts, John. (1994). Population policy options in the developing world. Science Vol.
263:771- 776.
Coale, Ansley J. and C.Y. Tye. (1961). The significance of age-patterns of fertility in high
fertility populations. The Milbank Memorial Fund Quarterly, 39 (4) (1961), pp. 631–646

16
Bongaarts, J. and Sobotka, T. (2012), A Demographic Explanation for the Recent Rise in
European Fertility. Population and Development Review, 38: 83–120. doi: 10.1111/j.1728-
4457.2012.00473.x
Dublin, Louis I. and Alfred J. Lotka (1925) On the True Rate of Natural Increase. Journal of the
American Statistical Association, Vol. 20, No. 151, pp. 305-339
Goldstein, Joshua R., Wolfgang Lutz, and Sergei Scherbov (2003). Long-term population decline
in Europe: The relative importance of tempo effects and generational length, Population and
Development Review 29 (4): 699-707.
Goldstein, J. R., T. Sobotka, and A. Jasilioniene. 2009. The end of lowest-low fertility?
Population and Development Review 35 (4): 663-700.
High-Level Panel of Eminent Persons on the Post-2015 Development Agenda (2013). A new
global partnership: eradicate poverty and transform economies through sustainable development.
The report of the High-Level Panel of Eminent Persons on the Post-2015 Development Agenda.
New York: United Nations. http://www.post2015hlp.org/wp-content/uploads/2013/05/UN-
Report.pdf.
Human Fertility Database. Max Planck Institute for Demographic Research (Germany) and
Vienna Institute of Demography (Austria). Available at www.humanfertility.org (data
downloaded on 1 March 2014).
Lutz, Wolfgang and Vegard Skirbekk (2005). Policies addressing the tempo effect in low-fertility
countries, Population and Development Review, 31 no. 4 (Dec 05): 699-720.
Lutz, W., B. C. O'Neill, and S. Scherbov (2003). Europe's population at a turning point, Science
299:1991-1992.
Machel, Graça, Emilia Pires and Gunilla Carlsson (2013). The world we want: an end to child
marriage. The Lancet Vol. 382:1005-1006.
Matthews, Zoë, Sabu S. Padmadas, Inge Hutter, Juliet McEachran, and James J. Brown (2009).
Does early childbearing and a sterilization-focused family planning programme in India fuel
population growth? Demographic Research Vol. 20: 693-720. http://www.demographic-
research.org/Volumes/Vol20/28/ DOI: 10.4054/DemRes.2009.20.28
Ouadah-Bedidi, Z. and Vallin, J. (2013), Fertility and Population Policy in Algeria: Discrepancies
between Planning and Outcomes. Population and Development Review, 38: 179–196. doi:
10.1111/j.1728-4457.2013.00559.x
Sobotka, Tomáš (2004). Is Lowest-Low Fertility in Europe Explained by the Postponement of
Childbearing? Population and Development Review, Vol. 30, No. 2, pp. 195-220
United Nations Children’s Fund (UNICEF) (2013). The State of the World’s Children 2013. New
York: UNICEF.
United Nations (2011). World Fertility Policies 2011. New York: United Nations.
http://www.un.org/en/development/desa/population/publications/fertility/world-fertility-policies-
2011.shtml

17
United Nations (2013a). The Millennium Development Goal Report 2013.
United Nations (2013b). World Population Prospects: The 2012 Revision. New York: United
Nations. http://esa.un.org/unpd/wpp/index.htm
United Nations Economic Commission for Africa, African Union Commission and United
Nations Population Fund (UNFPA) (2013c). Addis Ababa Declaration on Population and
Development in Africa beyond 2014. http://www.uneca.org/sites/default/files/uploaded-
documents/ICPD/2014/declaration-final-e1351225.pdf