
ijopec.co.ukijopec.co.uk/wp-content/uploads/2018/01/3.PF_.pdf2018-01-142 The Political Economy of...
238
The Political Economy of Public Finance (Edited by: Mustafa Çelen, Özkan Zülküfoğlu, Elżbieta Robak) THE POLITICAL ECONOMY OF PUBLIC FINANCE Edited By Mustafa Çelen Marmara University, İstanbul / Turkey Özkan Zülküfoğlu Marmara University, İstanbul / Turkey Elżbieta Robak Częstochowa University of Technology, Częstochowa / Poland
Transcript of ijopec.co.ukijopec.co.uk/wp-content/uploads/2018/01/3.PF_.pdf2018-01-142 The Political Economy of...

The Political Economy of Public Finance (Edited by: Mustafa Çelen, Özkan Zülküfoğlu, Elżbieta Robak)
THE POLITICAL ECONOMY OF PUBLIC FINANCE Edited By
Mustafa Çelen Marmara University, İstanbul / Turkey
Özkan Zülküfoğlu Marmara University, İstanbul / Turkey
Elżbieta Robak Częstochowa University of Technology, Częstochowa / Poland

2
The Political Economy of Public Finance (Edited by: Mustaf Çelen, Özkan Zülküfoğlu, Elzbieta Robak)
IJOPEC Publication Limited CRN:10806608 615 7 Baltimore Wharf London E14 9EY United Kingdom
www.ijopec.co.uk E-Mail: [email protected] Phone: (+44) 73 875 2361 (UK) (+90) 488 217 4007 (Turkey)
Contemporary Studies in Social, Economic & Financial Analysis First Edition, November 2017 IJOPEC Publication No: 2017/13 ISBN: 978-1-912503-00-1 No part of this book may be reproduced, stored in a retrieval system, transmitted in any form or by any means electronically without author’s permission. No responsibility is accepted for the accuracy of information contained in the text, illustrations or advertisements. The opinions expressed in these chapters are not necessarily those of the editors or publisher. A catalogue record for this book is available from Nielsen Book Data, British Library and Google Books. The publishing responsibilities of the chapters in this book belong to the authors. Printed in London. Composer: IJOPEC Art Design London, UK [email protected] Cover illustration created by Freepik
IJOPECLondon ijopec.co.uk IstanbulPUBLICATION
The Political Economy of Public Finance (Edited by: Mustafa Çelen, Özkan Zülküfoğlu, Elżbieta Robak)
Contents
Editorial Advisory Board ......................................................................................... 5 List of Contributers ............................................................................................ 6-11 Introduction: Social and Economic Perspectives on Sustainability .................. 13-18 Mustafa Çelen, Özkan Zülküfoğlu, Elżbieta Robak 1. From State Owned Enterprises of OECD to Wars
in the MENA Region: Visible Hands of Markets ...................................... 19-43 Berna Uymaz
2. Financial Crises, Public Restriction and Environmental Issues .................. 45-61
Muhammet Şahin, Candan Yılmaz 3. Turkish Regional Development Agencies and Evolution
of Regional Disparities In Turkey ............................................................. 63-86 Cihan Kızıl
4. The Government Supports on Livestock Products
in OECD Countries and Turkey ............................................................. 87-113 Ali Karabacak, Savaş Çevik
5. Sovereign Wealth Funds: A Comparison of Turkey
and Other Countries ............................................................................. 115-142 Sevda Mutlu Akar
6. Intergovernmental Fiscal Transfers and Turkey’s Implementation:
Amendments in Fiscal Transfer System Set in Law No. 6360 ............... 143-168 Aykut Aydın
Beps Action Plan and the Current Case of Turkey ................................. 169-185 Gözde Nalbant Efe, Müge Yetkin Ataer
7. A Comparative Analysis of Advance Pricing Agreements
in Turkey and the United States
4
8. As a Result of Transformation in Manorial System: Âyan ..................... 187-203 Burcu Kuzucu Yapar and Fatma Turna

The Political Economy of Public Finance (Edited by: Mustafa Çelen, Özkan Zülküfoğlu, Elżbieta Robak)
5
Editorial Advisory Board
Lokman Gündüz Istanbul City University
Bülent Besim Bali Marmara University
Nagihan Oktayer Işıklar Istanbul University
Mustafa Erdoğdu Marmara University
Mehmet Şişman Marmara University
Erkan Aydın Marmara University
Ayşe Güner Marmara University
Leyla Ateş Altınbaş University
Tamer Budak Inönü University
Ülkü Arıkboğa
Tülin Altun Cumhuriyet University
Recep Yücedoğru Bülent Ecevit University
Anna Albrychiewicz – Słocińska PhD Częstochowa University of Technology
Sylwia Nieszporska Częstochowa University of Technology
Sebastian Skolik Częstochowa University of Technology
Aneta Włodarczyk Częstochowa University of Technology

List of Contributors
6
List of Contributors This is a list of those who contributed to The Political Economy of Public Finance.
Editors
Mustafa Çelen is a Professor at Department of Public Finance, Faculty of Economics, Marmara University, Turkey. He graduated from Department of Economics in Istanbul University. He received his MA and Ph.D. degrees in Public Finance from Marmara University. He has been a visiting scholar at the Faculty of Public Policy, George Mason University in USA. He teaches public debts, public economics, tax theory and policy. He has recently published papers and books on the Economics of Corruption, Harmonization of Monetary and Fiscal Policy, Political Economy of Fiscal Policy, Turkish Tax System, Government and Municipal Bonds.
Özkan Zülfüoğlu is an Assistant Professor at Department of Public Finance, Faculty of Economics, Marmara University. He received his MA and PhD degree in Public Finance from Marmara University. He was a visiting researcher at the Department of Economics and Finance at the University of Southern Illinois Edwardsville in USA between October 2011 and October 2012. The courses he teaches are Theory of Public Finance, Regulatory State and Regulation and Community Service Practices. Özkan Zülfüoğlu’s research activities concern in the areas of regulation theories, fiscal policy, taxation, political economy and education.
Elżbieta Robak is an Assistant Professor at the Department of Sociology and Psychology of Management, Częstochowa University of Technology, Faculty of Management, Częstochowa, Poland. She received her MBA in Sociology from Jagiellonian University in Kraków and Ph.D. from University of Silesia in Katowice, Faculty of Social Sciences. Elżbieta Robak have been participating in numerous conferences including international scientific meetings and was involved in the process of organizing conferences regarding social and management issues. She is the author of several articles and publications in prestigious journals and monographs and was involved in the process of editing books. Her research areas focus on Human Resource Management, Sociology of Organization, Organizational Behaviour , Corporate Social Responsibility and Labour Market Problems.
The Political Economy of Public Finance (Edited by: Mustafa Çelen, Özkan Zülküfoğlu, Elżbieta Robak)
7
Authors
Berna Uymaz is an Assistant Professor, Department of Public Finance, Faculty of Economics, Istanbul University. She completed her MA degree in 2004 and her PhD degree in 2010 in Public Finance at Istanbul University. She was a visiting researcher at the Department of Public Finance at the University of Sapienza in Italy between June 2006 and June 2007. She serves as an editorial board member of İktisat Dergisi since 2005. The courses she teaches are Public Finance, State-Owned Enterprises, Radical Economics and State Theories. Her research interests are state theories, crisis theories, radical political economy and state-owned enterprises.
Muhammet Şahin was born in 1978 in the city of Van, Turkey. After completing his primary, secondary and high school education in Van, he started in Public Finance Department of Süleyman Demirel University in 1998. He graduated from this department in 2002. He completed his master's degree in public finance from 2004-2006 and his doctorate degree from 2006-2011. In 2009 he started to work as an Instructor at Gumushane University Faculty of Economics and Administrative Sciences. In 2011, he was appointed to the position of Assistant Professor Doctor of the same university and he is still continuing to work at the university, in this academic position.
Candan Yılmaz was born in Kocaeli, İzmit in 1989. In 2007, she finished the Körfez - Hereke High School. In 2007, she graduated from Karadeniz Technical University, Department.of Public Finance She completed her master's degree in the Sakarya University Institude of Social Sciences in 2015. In 2015, she started her PhD at Istanbul University Social Sciences Institute Depatment of Public Finance. At the same time she is currently working as a research assistant at the Department of Public Finance in the Faculty of Economics and Administrative Sciences at Gumushane University.
Cihan Kızıl is a research assistant at the Public Finance Department of Istanbul University since December 2009. He received his bachelor's degree in economics from Kadir Has University and master's degree in economics from Istanbul Technical University. He is a PhD candidate and still continuing his doctoral studies at the Public Finance Department of Istanbul University. He visited the School of Economics & Management (ISEG) of the University of Lisbon in order to complete his dissertation
List of Contributors
8
on the role of government in regional development. His research interests include regional development, political economics, and migration.
Ali Karabacak is an Associate Professor in Department of Animal science at the Selcuk University, Turkey. He received his M.S. and Ph.D. degrees in animal breeding from Selcuk University. He teaches zootechnics, sheep breeding and cattle breeding, while his research interests are in meat quality, carcass characteristics and fatty acids of meat. He has recently working on agriculture economics and livestock economy.
Savaş Çevik is an Associate Professor in Department of Economics at the Selcuk University, Turkey. He received his M.S. and Ph.D. degrees in public finance from Marmara University. He has been a visiting scholar at the University of Texas at Dallas. He teaches public finance, public economics and tax law and policy, while his research interests are in public economics, politics and economics of taxation and behavioral economics. He has recently published papers and books on tax morale, tax compliance, international taxation, and tax structure and economic performance.
Sevda Mutlu Akar is Assistant Professor of the Department of Public Finance at Bandirma Onyedi Eylul University, Faculty of Economics and Administrative Sciences in Turkey since 2016. She earned her PhD degree in public finance at the Marmara University, Department of Public Finance, Institute of Social Sciences (Turkey). Her PhD dissertation titled as “The Impact of Natural Disasters on Public Finance: Turkish Case (in Turkish, 2009-2013)”. Her teaching and research are in the area of public economics, public finance and budgeting. She has also worked on health expenditures, public expenditures, taxation and time series analysis.
Aykut Aydın was born in İstanbul, graduated from Balıkesir University, Faculty of Economics and Administrative Sciences, Department of Public Finance in 2008. He graduated from the Marmara University Institute of Social Sciences in 2014 with a master's degree and continues Marmara University Social Sciences Institute with a Ph.D. degree. He started his academic life in Gumushane University Faculty of Economics and Administrative Sciences Department of Public Finance in 2010. His academic interests are stochastic Public Finance, Local Government

The Political Economy of Public Finance (Edited by: Mustafa Çelen, Özkan Zülküfoğlu, Elżbieta Robak)
9
Gözde Nalbant Efe is a Research Assistant at Istanbul Medeniyet University, Faculty of Political Sciences. Previously, she was a Research Assistant at Marmara University, Faculty of Economics. She received her master’s degree in public finance at Marmara University and is still a doctoral student in the same department. Her research areas are public water services, public social expenditures, public healthcare policies, externalities, tax systems and tax revenues.
Müge Yetkin Ataer is a Research Assistant at Istanbul Medeniyet University, Faculty of Political Sciences. Previously, she was a Research Assistant at Marmara University, Faculty of Economics. She received her master’s degree in public finance at Marmara University and is still a doctoral student in the same department. Her research areas are economics of education, social expenditures, tax systems and tax revenues.
Burcu Kuzucu Yapar was born on 17.10.1989 in Istanbul. In 2010, she successfully completed undergraduate studies at Department of Public Finance of Istanbul University and was admitted to master program of Fiscal Law at same university. She graduated from master program with her thesis entitled "Participation, concurrence, recidivism in tax offenses and misdemeanours" in 2013. She has registered Ph.D. in Fiscal Law at Marmara University Social Sciences Institute and still keep studying on her thesis. She also continues undergraduate program at Istanbul University Faculty of Law. Burcu Kuzucu Yapar is married and has a child. Since 2011, she has been working as a research assistant at Faculty of Political Sciences Department of Public Finance in Istanbul Medeniyet University.
Fatma Turna was born on 1986 in Kahramanmaraş. In 2009, She successfully completed undergraduate studies at Department of Public Finance of Erciyes University. In the same year, she began to work as a research assistant at the Finance Department of the Faculty of Economics in Hakkâri University. In 2011, She was admitted to master program of Fiscal Law at Marmara University. She graduated from master program with her thesis entitled "The Prescription in Tax Law" in 2014. In 2014, She has registered Ph.D. in Fiscal Law at Marmara University. Since 2011, she has been working as a research assistant at Faculty of Economics Department of Public Finance in Marmara University and and stil keep studying on her thesis.

The Political Economy of Public Finance (Edited by: Mustafa Çelen, Özkan Zülküfoğlu, Elżbieta Robak)
11
Introduction Mustafa Çelen Özkan Zülküfoğlu Elżbieta Robak
he public finance issues has become one of the vital subject affecting all economic sectors. Especially after the 2008 financial crisis, there has been intense debate on public finance issues. The issues of fiscal policy, public debts,
economic growth and the redefinition of the role of the state, agricultural policies and the use of state funds are often on the agenda of policy makers. For this purpose, the chapters of the book in your hand are intended to discuss the public finance in terms of political economy. In addition, the chapters in “The Political Economy of Public Finance” seek to explain the development in public finance and fiscal policy with the key challenges.
First draft of the chapters in this book were presented in 8th International Conference of Political Economy (ICOPEC) between 28th June 2017 - 30th June 2017 in Belgrade at Serbia and Montenegro. The main theme of the 8th ICOPEC conference has been identified as “Institutions, National Identity, Power, and Governance in the 21st Century”. The editors selected eight presented papers. Every paper was peer reviewed by two referees and become the book chapters.
In chapter 1, Berna Uymaz focuses on state owned enterprises. This article analyzes how neoliberalism works through different market interventions nowadays. In accordance with this purpose, the worldwide trend of cooperation between states and capital in the neoliberal era is examined with examples from the Organisation for Economic Co-operation and Development (OECD) countries and the Middle East and North Africa
T

Mustafa Çelen, Özkan Zülküfoğlu, Elżbieta Robak (Introduction: The Political Economy of Public Finance)
12
Region (MENA). The study emphasizes that, in order to understand the functioning of markets in the region, the role of uninterrupted wars. The results indicate that neoliberalism is said to bring prosperity and peace to the world. However, according to author OECD and the MENA region provide plenty of case examples showing the reverse of this expectation.
In chapter 2, Muhammet Şahin and Candan Yılmaz investigate financial crises, public restrictions and their relations with environmental issues. They are focusing on the effect of austerity policies to minimize the influence of the financial crisis on environmental politics of the European Union (EU) which is considered as a successful actor of environmental protection practices is evaluated. According to them, while the effects of the financial crisis to member countries in EU, the macroeconomic rules proposed to the debtor countries are effected in the negative direction of the success of the countries' environmental policies. At the end, they found out that it may be stated that the effect of crisis on EU environmental standards occurred in two dimensions: One of them environmental problems having secondary importance on the basis of government and another issue that should be improved is concerning the public awareness.
In chapter 3, Cihan Kızıl discusses regional development agencies and evolution of regional disparities in Turkey. In his study, he focuses on how regional disparities change over time and evaluates if there is any distinct and positive convergence among regions following the establishment of regional development agencies in Turkey. This paper is demonstrated that socio-economic development and reduction of regional disparities are required long-term perspectives, and such a distinct transformation takes time. According to the author, regional development agencies cannot be considered the sole factor in this situation, however, it is also clear that these agencies have not been able to provide sufficient indication for that they are a remedy for regional inequalities.
In chapter 4, Ali Karabacak and Savaş Çevik examine supports to livestock product in OECD countries and Turkey. Government payments are expected to affect the production level and value of livestock products as meat and milk, which are basic human food sources. Livestock production support in Turkey shows periodic differences in parallel with EU policies. In this study, it is examined an overview of
The Political Economy of Public Finance (Edited by: Mustafa Çelen, Özkan Zülküfoğlu, Elżbieta Robak)
13
agricultural subsidies and especially of supports to livestock product in OECD countries and in Turkey in terms share of agricultural value added, GDP and farm receipts. While agricultural subsidies in Turkey account for 2% of GDP, there is unstable trend according to years, and a significant part of total support consists of producer support and lower part is general service supports. Agricultural subsidies constitute approximately 30% of the total agricultural value added. According to authors, the supports for beef meat production in the supports to livestock products are significantly higher than other products. Turkey is the country where provide the highest supports to meat product among in OECD and the EU countries.
In chapter 5, Sevda Akar focuses sovereign wealth funds (SWF). The paper is aimed to explain sovereign wealth funds in Turkey and other countries. The fundamental aim of an SWF is to ensure macroeconomic stability, success higher returns on investments, and provide for future generations. In general, SWFs are long-term investments, and they tend to stabilize larger economies more effectively than short-term investments. The Turkey Wealth Fund represents the first sovereign wealth fund in the country, having been legally established in August 2016. This study is investigated the Turkey Wealth Fund’s effectiveness and to propose the relevant policy to enhance the fund’s effectiveness.
In chapter 6, Aykut Aydın argues intergovernmental fiscal transfers. The author focuses on amendments in fiscal transfer system set in Law No. 6360 in Turkey and debates in to the effective allocation of resources between the local government and the central government. Local governments also play an important role in the effective allocation of resources. In order to accomplish this, one of the most important conditions is to set an effective intergovernmental fiscal transfer system. In this study the transfer system in Turkey (after and before Law No. 6360) has been analysed numerically, the results obtained by this analysis and the problems occurring in this system have been evaluated. Approximately 55 percent of local government revenues consist of funds transferred through financial transfers. With this new system, there have not been any serious changes. There was a relative increase in the share of the metropolitan municipalities from the general budget tax revenues and a relative rise in the share of special provincial administrations per capita.

Mustafa Çelen, Özkan Zülküfoğlu, Elżbieta Robak (Introduction: The Political Economy of Public Finance)
14
In chapter 7, Gözde Nalbant Efe and Müge Yetkin Ataer explain base erosion and profit shifting action plan and the current case of Turkey. In this study, authors aim to determine progress made in terms of the fifteen actions included in the OECD’s “Action Plan on Base Erosion and Profit Shifting” by evaluating recommendations laid out in the reports on each action item and it reveals criticism about these recommendations. The study reveals that, within the scope of cooperation developed in the field of international taxation under the guidance of OECD and G20, BEPS Action Plan aims to restrict the places where multinational companies can shift or hide their taxable income to reduce their tax burdens. The study showed that Turkey has been involved in the BEPS project since the beginning. In its domestic legislation, Turkey has taken limited implementation so far. The authors recommend that more importance must be attached to this issue and outcomes must be disclosed to the public through an official channel.
In the last chapter, Burcu Kuzucu Yapar and Fatma Turna investigate transfer-pricing agreements. They aim to examine the process of advance pricing agreements in Turkey and the United States and makes recommendations for the effective use of agreements to prevent the abuse of transfer pricing in Turkey. This study found that the legislation on advance pricing agreements in Turkey is disorderly relative to that in the United States. This problem is expected to be eliminated by enforcing the Advance Pricing Agreement Guide published in 2015 as a draft by the Revenue Administration. The authors think that this draft or a different regulation will be useful for rendering clearer and more understandable the available irregular and complex legislation.
This book with eight chapters discuss the various public finance issues that have increased rapidly in recently. Some issues are important problems which its solution really hard. We thank all the contributors of this publication for their work. This book of research offers important knowledge for academics, research students, government agencies policy makers and professionals working on public finance and fiscal policy. Our expectancy from this book is that researchers may get new ideas and solutions for their new studies.
November 2017

The Political Economy of Public Finance (Edited by: Mustafa Çelen, Özkan Zülküfoğlu, Elżbieta Robak)
15
Mustafa Çelen Özkan Zülküfoğlu Elżbieta Robak

The Political Economy of Public Finance (Edited by: Mustafa Çelen, Özkan Zülküfoğlu, Elżbieta Robak)
17
From State Owned Enterprises of OECD to Wars in the Mena Region: Visible Hands of Markets
Berna Uymaz Abstract
This article analyzes how neoliberalism works through different market interventions nowadays. In accordance with this purpose, the worldwide trend of cooperation between states and capital in the neoliberal era will be examined with examples from OECD countries and the Middle East and North Africa Region (MENA). After the privatization policies of the 1980s, the ongoing presence of SOEs in the “free market” will be examined with examples from OECD countries. Due to the fact that SOEs have been used to generate employment especially since the Arab Spring (2011–12), instead of privatization implementations alternative policies are used in MENA. So that, in order to understand the functioning of markets in the region, especially the role of uninterrupted wars will especially be interpreted.
Keywords: State Interventions, Neoliberalism, OECD, Middle East and North Africa
1

Berna Uymaz (From State Owned Enterprises of OECD to Wars in the Mena Region: Visible Hands of Markets)
18
Introduction
fter the 1980s neoliberal policies such as free trade, privatization, price deregulation and flexible labour markets were applied to support capital accumulation in an era of internationalization. But in practice, for the same
reason, extensive government interventions in the economies continues worldwide.
The article analyzes and interprets reasons of the most frequently seen examples of markets’ “visible hands” in the economies of OECD countries and the Middle East and North Africa (MENA) region. In the first section reasons of the interventions will be discussed theoretically.
During this period of neoliberalism, the privatization of public enterprises, as the most known and the most used policy, has been in practice in all countries. But, in order to increase profitability besides privatization implementations many governments nationalize “too big to fail” companies (TBTFs), continue to maintain large state owned enterprise (SOE) portfolios and also create new public enterprises. This situation which increases government interventions seems to be a contradiction in neoliberalism which aims to reduce the size of the state in the economies. In the second section SOEs in OECD countries will be analyzed.
The worldwide trend of cooperation between states and capital can be examined also in examples from the MENA region. But as SOEs have increasingly served as employer of last resort to generate employment especially since the Arab Spring (2011–12), instead of privatizations, alternative policies are used in MENA through state owned enterprises, public-private partnership models, tax systems, incentives, sovereign wealth funds are used in MENA. However economic effects of today’s wars are a subject of debate, besides these policies, as wars and conflicts are part of everyday life in the region, the last chapter especially concentrates on also the economic effects of wars and related expenditures, first on theoretical basis, then on MENA-based examples.
1.Visible Hands of Neoliberalism
Neoliberalism that should proceed on principles of private property and market force, works best when it is approached with wholesale marketization through privatization,
A

The Political Economy of Public Finance (Edited by: Mustafa Çelen, Özkan Zülküfoğlu, Elżbieta Robak)
19
liberalization and deregulation. Other economic rules and institutions, which do not have functions to facilitate and protect private ownership and the “free” operation of supply and demand among producers and consumers, are “political interferences” that undermine market efficiency and should therefore be abolished (Scholte, 2005: p. 1). But it is seen that in the neoliberal era capital accumulation process has become more complicated and have contained many old and new types of state-capital relations.
Markets mask the very processes that bring them into being; the illusion of self-generating reality requires hiding the reality that generates them. So the metaphor of “visible foot” is used to show that the invisible hand is not a reality; it takes root in political power, and its power is to make its politics invisible (Araghi, 2009, p. 111). As a component of society, the state is not separate and independent from class structure because the relationship which the ruling class establishes with the state ensures that it exists as a class so that they can reinforce each other mutually (Hanieh, 2015, p. 24).
This coordination between state and capital can be seen well during the crisis. From the mid-90s onwards the markets necessitated active state interventions to prevent systemic failure during numerous financial crises (Cumbers, 2012: 100). For instance, Uymaz (2012, pp.107-122) and Lapavitsas, Lalturbrunner, Lindo, Meadway, Michell, Painceira, Pires, Powell, Stenfors, Teles & Vatikiotis (2011, p.5) assess the effectiveness of the market interventions undertaken by the authorities of major advanced economies during the 2008 crisis. The International Monetary Fund (IMF) (2009, p. 117) points out these policies as unprecedented amounts of liquidity injections; credit easing through purchases of credit instruments; or taking them as collateral for nonrecourse liquidity provision; guaranteeing bank liabilities; injecting capital into financial institutions; and in some cases, introducing schemes to relieve banks of their impaired assets.
The mainstream economics literature accepts these interventions during the crisis period, but it hides relations between state and capital in the ordinary functioning of capital accumulation process. Some of the most frequently used state interventions in the neoliberal period in response to the needs of capital, are:
• Privatization: Although usually done in order to have greater efficiency, privatization, selling state-owned enterprises, goods and services to private
Berna Uymaz (From State Owned Enterprises of OECD to Wars in the Mena Region: Visible Hands of Markets)
20
investors, has mainly had the effect of transferring wealth to fewer hands. • State owned enterprises (SOEs): Despite the long wave of privatization in the
last decades, SOEs continue to persist for political, social and strategic reasons, remaining as key players in various countries (Clo, Chiara, Bo, Ferraris, Fiorio, Florio, & Vandone, 2014, p. 5). This is especially because the nationalized sector wants to support the private sector by producing and supplying commodities and services at very favorable prices (O’Connor, 1973, p. 186). At the beginning of the new Millennium, SOEs were still playing a significant role in various OECD economies, representing “up to 40% of value added, around 10% of employment, and even 50% of market capitalization in different OECD countries (Clo et al., 2014, p. 5).
• Public-private partnerships (PPPs): Governments support private sector via PPP models which are commonly applied across the world. PPP can be defined as the integrated, more comprehensive, legal and institutional form of methods that incorporate the participation of the private sector in the design, financing, construction, and operation of necessary infrastructure and facility for the delivery of a service, or in the renewal, lease, repair and maintenance and operation of an existing public investment. (Güzelsarı, 2012, pp. 33-34). Through PPPs neo-liberal international institutions granting credits are also settled in the decision-making bodies of the states (Hanieh, 2013, pp. 105-106).
• Too big to fail (TBTF) policies: According to the TBTF theory, the economy would face severe adverse consequences in case some organizations, particularly financial institutions which have big size, complexity, interconnectedness, and critical functions go unexpectedly into bankruptcy, and therefore TBTFs should be protected by the state (Bernanke, 2010). In 2008, the financial crisis and economic recession have further induced state intervention in Western economies. For instance many OECD countries have injected consistent amounts of liquidity to the market to bail out private banks and strategic enterprises. According to the OECD sources, just in 2009, shares of equity holdings owned by some OECD governments increased up to 20% of their GDP, above the OECD average of around 8% (Clo et al., 2014, p. 5).
• Taxes-subsidies: The process of capital formation is quite sensitive to tax rules

The Political Economy of Public Finance (Edited by: Mustafa Çelen, Özkan Zülküfoğlu, Elżbieta Robak)
21
and tax rates. It is important to understand how particular taxes and subsidies affect capital accumulation. Many studies (Feldstein, 1987, pp. ix, 1) dealing with the way taxes affect the profitability, show that tax rules and subsidies have powerful effects on business investment in plant and equipment, on personal saving, and on the realization of capital gains.
• Sovereign wealth funds (SWFs): SWFs could be a tool for collective saving or balancing the economy over the business cycle; SWFs are new versions of the developmentalist banks and the state trading firms, and they are vehicles through which the state seeks to create its counterpart bourgeoisie and civil society; SWFs (patrimonial SWFs) manifest political capitalism and the valorization of personal capital through association with political authority, and profits can arise from special deals with political authorities and because of all this SWFs can be personal vehicles for capital accumulation through investment strategies (Schwartz, 2012, pp. 12, 14).
• War and related expenditures: During the crisis, an idea of a war to postpone crisis comes up. A reason for this expectation is an effect of the Second World War which is the one of the important factors to increase the profit rates after the big Crisis of 1929. For instance, after the Second World War, the military expenditures’ role in providing the stability is expressed through "the theory of permanent arms economy” or Ernest Mandel on the "Long Wave Theory" examines the effects of the Second World War and he states the importance of war in changing the downward movement of profit rates (Uymaz Yılmaz, 2010, pp.-151-175).
The crisis of capital accumulation of capital is caused by the law of tendency of the profit rate to fall due to the rising organic composition of capital. Therefore wars’ economic effects can have a role in postponing the crisis only if they can contribute to the production of surplus value (increasing the rate of surplus value), to increase the portion of productive labor and to realize the devalorization of capital. If there’s a worldwide war to contribute to such processes, it can help to increase the average rate of profit, so it can have a role in entering the phase of an expansionist long wave. Local wars can have a role in the process of business cycles and lastly, wars that cannot affect the long wave or the business cycle, can have a role only in changing the redistribution of income by transferring the existing surplus value between capitalists. In this way through the wars, “war lords” (especially arms merchants) appear (Uymaz Yılmaz, 2010,

Berna Uymaz (From State Owned Enterprises of OECD to Wars in the Mena Region: Visible Hands of Markets)
22
pp. 221-226).
The common point of these policies and interventions is to try to provide solutions to the capitalist systems’ contradictions. OECD countries and the MENA region are, in fact, an area where all of these mechanisms can be studied.
2.SOES in OECD Countries
While in 1980s and 1990s attention was largely focused on reducing the role of the state in the economy, this fact is less remarkable in the public debate today. On the contrary, besides other policies of intervention, the PPPs and, more interestingly, SOEs that reflect the state’s functions in the production areas are on the agenda and state participation in the marketplace has generally not seen any significant retreat.
PPP investments, covering spending on various infrastructure services, including energy, water, transport, and telecoms, have steadily risen over time in advanced, emerging, and low-income countries since 1990 and are highest in low-income countries at 1 % of GDP but have started to fall since the crisis of 2008. On the other hand, the PPP capital stock (current cost, as a share of GDP) continues to rise and is highest in low-income countries at 7 % of GDP (International Monetary Fund [IMF], 2017, p. 5). Governments transfer resources to private sector through PPP models which are commonly used around the world. For instance there is a significant interaction between PPPs and EU State aid policy (European PPP Expertise Centre [EPEC], 2016, p. 5). State aid issues are most likely to be found in PPPs through a “Remuneration allocated from the public sector to the private partner”; remuneration to the private partner as “Public Service Obligations for Services of General Economic Interest”; “State guarantees”; by administering the “Sale of land and buildings” (EPEC, 2016, p. 6).
Except PPPs and more interestingly worldwide countries have also relatively large SOE sectors as the main indicator of the state's presence in the economy.
Nowadays, the most important reason to study SOEs is simply because they exist and they are vital economic organizations (Florio, 2015, p. 1).

The Political Economy of Public Finance (Edited by: Mustafa Çelen, Özkan Zülküfoğlu, Elżbieta Robak)
23
Although throughout the 1990s, a number of countries engaged in ambitious privatization implementations and this led to a large overall decrease in the size of national SOE sectors, many governments nonetheless maintained large SOE portfolios (The Organisation for Economic Co-operation and Development [OECD], 2014, p. 9). After the peak of the second half of the 1990s, Privatization Barometer data show a decline in the number of privatizations in Europe (Clo, Ferraris, & Florio, 2015, p. 4) and today, public companies have consolidated their position in national and international markets over the past decade; they have grown in number, size, economic performance and internationalized through national and cross-border (M & A) acquisition operations (Clo et al., 2015, p. 6).
So the SOEs which survived the privatization process at the beginning of 2000s are still playing an important role in various OECD economies, representing “up to 40% of value added, around 10% of employment, and even 50% of market capitalization in different OECD countries, and not only in the former socialist countries” (Clo, et al., 2014, p. 2). While adopting the 50% ownership threshold1, more than 10% of the 2000 largest companies in the world (reported by Forbes 2000) are publicly owned, and their combined value of sales ($ 3,600 billion 2011) equals nearly 6% of world GDP, thus higher than the GDPs of Germany, France and Britain, with an aggregate market value of $ 4,900 billion, which is equal to 11% of the capitalization of all listed companies (Clo et al., 2015, p. 5).
SOEs (under the most strict definition of absolute majority holding) on the list of Forbes would represent: - 11.15% of total sales in the Forbes top global companies list 1 There are differences in attribution the SOE label. For instance an OECD approach, Orbis database, Forbes Global 2000, Christianen 2011 and Kowalski et al.2013 identify public enterprises when the public ownership is greater than 50 % of the shares (Florio, 2015, p. 1). However, such a definition excludes from the list some partially public enterprises where the state holds a share below 50% but which allows it to a majority in the board of director and they are in fact among the largest in other world rankings (Florio, 2015, p. 1 and Clo et.al. 2015, p. 5). Moreover, some of the core SOEs in the world, particularly in Europe, are effectively controlled by governments with a stake 25% (or even less) (Florio, 2015, p. 1). So a more flexible definition of public enterprise can be done considering to be public every firm where the top shareholder is a public institutions (Clo et al., 2015, p. 5).
Berna Uymaz (From State Owned Enterprises of OECD to Wars in the Mena Region: Visible Hands of Markets)
24
- 13.51% of total profits - 16.38% of total assets - 13.36% of total market value. So, as mentioned, the share of SOEs in the list is 10.02%. In terms of number, the average perform of SOEs are better than the average Forbes company in the list, as follows: - 11.28% more in terms of sales per firm - 34,83% more profits per firm - 63,47% more assets per firm - 33,33% higher market value per firm (Florio, 2015, p. 1). Moreover, since general government (non-incorporated) activities weigh heavily in total GDP in most countries, and agriculture is still a major component of most non-OECD economies, SOEs share of the corporate economy will in most cases be significantly higher than these percentages (OECD, n.d., p. 3).
The 34 countries analyzed in a report of OECD (2014, p. 7) (31 of which are OECD members) have SOE portfolios with a combined 2111 enterprises, having a value of over USD 2 trillion and employing about 6 million people. A number of governments also maintain non-trivial minority shares in listed companies, altogether having a value of an additional USD 860 billion and employing 2,8 million people (OECD, 2014, p. 7). In BRIC, the market value of SOEs is 32% of the GDP of their respective countries; "in China companies in which the state is a majority shareholder account for 60% of the stock market capitalization and this is 30-40 % in Russia and Brazil (Clo et al., 2015, p. 5).
SOEs in the top league are located in countries as diverse as Brazil, Russia, India and China (BRIC) but also in advanced economies of Norway, France, Switzerland and others (Florio, 2015, p. 2).
The largest SOE sectors in the OECD area are found in Norway (10% of national employment), followed by France and Slovenia (6%). If minority-owned listed entities are included in the comparison, the employment share reaches over 10% in Norway, France and Finland (OECD, 2014, p.7).
The number of state-owned enterprises in different countries ranges from under 10 (in Austria, Belgium and Switzerland) to over 100 (in Czech Republic, Hungary, Lithuania and Poland). It should be noted that in those countries which have relatively fewer SOEs, the average value of individual companies are much higher than those in countries with relatively higher numbers of SOEs. For instance, Austria’s nine SOEs have an average value of USD 2.5 billion each, compared to Poland’s 326 SOEs, with
The Political Economy of Public Finance (Edited by: Mustafa Çelen, Özkan Zülküfoğlu, Elżbieta Robak)
25
an average value of only USD 189 million (OECD, 2014, p. 10).
Measured by total number of employees France has by far the largest SOE sector in the sample area, with 1.6 million employees. It is followed by the United States and Italy, each having SOE sectors employing over 500 000 people and Germany with about 350 000 SOE employees (OECD, 2014, p. 11). Among OECD countries, the largest SOE sectors as measured by share of non-agricultural dependent employment are found broadly in Norway (10 % of domestic employment), in France and Slovenia (about 6% of national employment) then in Portugal and Estonia (about 5%) (OECD, 2014, p. 17). If the employment comparison is broadened to include minority-owned listed entities, with the share of national employment increasing to over 10% in Norway, France and Finland, reflecting the non-trivial minority stakes, these countries have largest SOE sectors in listed companies (OECD, 2014, p. 22).
The value of listed entities as a percentage of the entire state- invested portfolio2 is the highest (over 90%) in Belgium and United Kingdom (OECD, 2014, p. 17) then in Colombia (78%), in Italy (reaching almost 70%) and in Switzerland (55%). Conversely, listed PSOEs have the highest share (over 90%) in Belgium and United States and then, reaching almost over 50% in Finland, France, Germany, Hungary, Spain and Sweden. These European governments try to maintain blocking minorities in certain companies in order to hold them under national ownership and/or maintain their independence from a private investor takeover (OECD, 2014, pp. 16-17). In France for example, the state is a minority owner of companies in the air transport, electricity, manufacturing and telecoms sectors; in Finland, the largest minority holdings are found in the telecoms, manufacturing and financial sectors; Sweden and Hungary follow, each with an employment share in all state-invested listed entities of around 5% (OECD, 2014, p. 22).
The largest concentration of SOEs is found in public utilities, telecommunications and sometimes also in the banking and hydrocarbons sectors. To the contrary, few countries have a significant presence of SOEs in competitive, industrial sectors (e.g. manufacturing, construction), retail service provision (shopping, hospitality) or primary
2 State–invested portfolio comprises SOEs of all corporate forms as well as listed partly owned enterprises, or PSOEs, which are minority-owned (OECD, 2014, p. 17).

Berna Uymaz (From State Owned Enterprises of OECD to Wars in the Mena Region: Visible Hands of Markets)
26
activities except for the extractive industries (OECD, n.d., p. 3). For instance in most countries, in the sample area (OECD, 2014), SOEs are highly concentrated in sectors either considered of “strategic” importance or those on which large parts of the broader economy depend: half of SOEs by value operate in the network industries (telecoms, electricity and gas, transportation and postal services) and, a further one fifth is found in the financial sector (OECD, 2014, p. 7).
The degree of state ownership in listed companies varies significantly according to sectors. Minority-owned entities account for over 90% of state-invested listed entities in the manufacturing sector; 77% in the financial sector, 76% in telecoms and 66% in transportation (OECD, 2014, p. 14). Majority-owned entities have a share in the value of state-invested listed entities in the primary sector (84%), electricity and gas (80%), and other utilities, including postal service operators (64%) (OECD, 2014, p. 14).
There are three other indicators of 2010 that might be interesting: ROS (ratios of profits and sales); ROA (the ratio of profits and assets) and, ROE (the ratio of profits and market value). Under this perspective, the average ROS in the list is 5.10%, while SOEs have 8.77%. ROA in the total list is 1.69%, while it is 1.40% in the SOEs; and ROE is respectively 6.33% and 6.41%. Thus, using the most common financial ratios, the large SOEs outperform the world league of major companies in terms of ROS; slightly also in terms of ROE; while they underperform in terms of ROA. They perform well, even better than private firms, own substantial assets and earn profits3 (Florio, 2015, p. 2).
Many researches (OECD, n.d. and Florio, 2015, p. 2) have noticed also the new acquisition activism of SOEs, from China to Brazil, from France to Italy, which has been involved in important acquisition deals of private firms as targets, including often those abroad .
3 The trend in the growth rates of real public capital is highly correlated with labor productivity growth especially in the advanced and low-income countries. Long-term real GDP growth rates (from 1960 to 2015) and long-term real public capital stock growth rates show a strong positive correlation (IMF, 2017, p. 5).

The Political Economy of Public Finance (Edited by: Mustafa Çelen, Özkan Zülküfoğlu, Elżbieta Robak)
27
The issue of SOEs operating abroad has come to the forefront in recent years because economies with large SOE sectors have grown strongly over the last decade(s) and integrated more closely with the international economic system; SOEs operating in certain sectors of great importance to the competitiveness of the rest of the economy have been at the forefront of internationalization and government rescue operations for financial institutions that were in danger of bankruptcy which triggered "renaissance" of SOEs in many countries (OECD, n.d., p. 2).
Therefore, one of the most important reasons for the current interest in SOEs is the intervention of various governments after the 2008 Crisis via nationalization policies or other forms of state control policies to prevent the failing of many companies. The biggest banks in UK such as Bank of Scotland, the top automobile companies in the US, such as General Motors, and several other major corporations in the United States and the United Kingdom, were rescued by governments of their countries, where the neo-liberal policies were dominant (Florio, 2015, p. 3). As a result of these policies, just after the crisis of 2008, shares of equity holdings owned by some OECD governments increased up to 20% of their GDP, above the OECD average of around 8% (Clo, et al., 2014, p. 2).
The purpose of these nationalizations which are exceptional and temporary emergency solutions of the governments are certainly similar to the policies that led to the establishment of so many SOEs during the Great Depression of 1929. Governments had to rescue private enterprises by appointing managers and providing capital and this has focused the attention to the fact that governments still perceive themselves to have certain responsibilities and capacity when confronted with the possible failure of too big to fail organizations (Florio, 2015, p. 3). Eventually, around 30% of the entire EU banking sector has been restructured through EU State aid rules. Out of the top 20 European banks, the Commission approved aid to 12 banks, six of which were subsequently restructured, five received aid, and one was liquidated (Adamczyk & Windisch, 2015, p. 1). Following the 2008 crisis, state bank ownership among developed economies increased from 6.7 % of pre-2008 to 8 % on the overall. Individual cases are more remarkable with Ireland jumping from 0 to 21% and the UK from 1% to 26% from 2008 to 2010 (Marois, 2013, pp. 6-7).
Another issue of state intervention is re-publicization of formerly privatized firms
Berna Uymaz (From State Owned Enterprises of OECD to Wars in the Mena Region: Visible Hands of Markets)
28
providing services of general interest, or re-municipalization of local public services. Due to that concession and other form of private capital’s involvement in local services are not in the public interest, municipalities re-nationalize related services. In the case of water, re-nationalisations can again be found in different countries, such as France, Germany and the USA, as well as in various countries in Latin America. (Florio, 2015, p. 3).
There is also wide evidence in network industries, particularly in energy and telecoms, in the EU as elsewhere, of a good and profitable performance of SOE or other firms where governments are shareholders. In the EU, where the market is open to competition, major enterprises which were controlled by or at least received considerable investment from governments can be observed in electricity in France, Italy, in Nordic countries and in the Central and Eastern Europe. Even in the telecommunications, the government is an important shareholder of some important players, in Germany, France, and the Scandinavian countries, etc. (Florio, 2015, p. 3).
There is much evidence suggesting that many deals that have been considered as privatizations were in fact were hiding a change in the enterprise’s legal status or a limited divestiture of public ownership. For instance in OECD countries governments maintain a certain degree of control in 62% of their privatized companies (Clo, et al., 2014, p. 2). Also the declining importance of SOEs in individual countries does not automatically imply a receding role in the international economy. For example, the growth rates in the Indian economy over the last 15 years have been so high that a decline in SOE share from 18% to 13% of GDP means that the value added of the SOE sector has actually grown by 70% (OECD, n.d., p. 3). It has become clear that, for both political and economic reasons, the state will remain a major owner of productive assets in a number of economies also in the future (Clo, et al., 2014, p. 2). Thus, in spite of the long wave of privatization in the last decades, SOEs continue to persist for political, social and strategic reasons, remaining key players in various countries, particularly, in network industries (Clo, et al., 2014, p. 2).
3.State Interventions, Wars and Neoliberalism in Mena
Neoliberalism, describing policies that capital need for accumulation, entered the Middle East especially in the 1980s, by obliging states to adhere to internationally

The Political Economy of Public Finance (Edited by: Mustafa Çelen, Özkan Zülküfoğlu, Elżbieta Robak)
29
prescribed norms as a result of pressures to obtain foreign exchange inflows to reduce debt obligations due to the 1980s economic crises. The US and European governments in the region have established bilateral trade relations and signed financial agreements; international institutions, especially the IMF and the World Bank, have imposed technically compulsory neoliberal policies, and the states and classes have been rebuilt in this process affecting the accumulation of local capital (Hanieh, 2015, pp. 34-37).
The main component of the Structural Adjustment Packages prepared in the 1980s and 90s was the narrowing of the size and scope of the public sector through privatization. By the end of the 1990s, legal and institutional framework agreements were signed and many countries, particularly Egypt, Morocco, Tunisia, and Jordan, began implementing privatization policies at the beginning of 2000s (Hanieh, 2013, pp. 94- 96). But in today's political environment, where governments are under pressure to provide employment through the public sector and, past privatization cases are subject to heavy criticism, it is difficult to make new privatizations. For example, in Egypt due to privatization and competition, more than half of the workers employed in the state were fired from their jobs between 1994 and 2011. Under these circumstances, the dynamics of class disunity grew and the slogans of "bread" increased partially in Egypt in 2011. So after the aggressive privatization of the government of Mubarak, the privatizations have slowed down (Cox, 2015).
In other countries where Arab spring is experienced, privatization is clearly seen as "old fashioned" (Cox, 2015). In particular, in the development plans of the Gulf countries, new targets for privatization have not been set. For example, both Vision 2021 scheme and the Government Strategy (2011-2013) of the United Arab Emirates have a very limited role for the private sector; there is no promise of a reduction in the share of the state in the economy. At the same time, however, it is clear that the United Arab Emirates operates in a global market economy, and the plan emphasizes a special economic model based on public ownership, which is driven by the market but no privatization practices are applied (Hvidt, 2013, p. 33). Tunisia is the only country that implements privatization practices in the region (Cox, 2015).
Nowadays, MENA countries cannot use the privatization practices due to the region’s unique nature (that the public sector has increasingly served as employer of last resort) but without leaving the neoliberal paradigm, instead apply the policies through which
Berna Uymaz (From State Owned Enterprises of OECD to Wars in the Mena Region: Visible Hands of Markets)
30
the state and capital cooperate. The authoritarian image of this situation in the Middle East is not contrary to or opposition to the system as a special form of capitalism in the Middle East (Hanieh, 2015, p. 25). In this context, in MENA which is shaped by the neoliberal policies, the states play a crucial role directly in the accumulation of capital especially through the SOEs, PPPs, taxes, incentives-related regulations and sovereign wealth funds.
While the process of adapting the state to the requirements of a competitive economy continues in MENA, most of the regional economies are dominated by the public sector, mostly in the presence of public banks and other public institutions in financial markets (Abed & Davodi, 2003) The state has a significant share in 89 of the top 100 companies listed in the region and is the biggest shareholder in 34 of them. The state, holding more than 40% of the total market value in the region, is also the largest institutional investor in the Arabian stock market (Amico, 2017). Nowadays, states in MENA can be successful entrepreneurs, and large state-controlled companies support private sector; states make profitable joint investments with private investors, as in SABIC, the largest company in the region. As Bahrain's national asset fund Mumtalakat shows, the transfer of SOEs to sovereign wealth funds rather than fully privatizing property, generates more profitable results (Amico, 2015).
In the noncompetitive monopolistic sectors where the SOEs provide goods and services at a price below their costs, the opposition of the public to the PEEs’ privatization has increased the interest of politics in Public-Private Sector Partnerships (PPP) (OECD, 2013, p. 76).
PPP is a form of privatization in which profit-generating businesses are left entirely in private sector but other loss-generating and high-cost jobs are undertaken by the state in which case losses and costs are reflected to the public and the orientation towards privatization of service provision in key sectors is done through PPPs (Hanieh, 2013, pp. 104-105). In the PPP system, private companies make a contractual agreements with the state and receive payment from the government or the service user. In MENA countries infrastructure-related activities such as energy, transport and water services, which were carried out by the state prior to the end of 2005, are done by private sector under PPPs agreement. (Hanieh, 2013, p. 104). In the region, Jordan is the leader of PPPs implementation, leaving production of electricity, water supply system and the

The Political Economy of Public Finance (Edited by: Mustafa Çelen, Özkan Zülküfoğlu, Elżbieta Robak)
31
administration of Amman airport to PPPs (OECD, 2013, p. 75).
As mentioned above, in addition to supports provided by the state through direct production activities, states can also support capital accumulation through tax legislation, subsidies and incentives.
Price subsidies are used frequently in most of the MENA countries, because they often constitute governments’ main instrument for providing social protection and support for certain industrial sectors, which is a way to share the wealth in oil exports. In MENA, energy subsidies account for the bulk of subsidies. About 50 % of the total cost of pretax energy subsidies ($119.3 billion or 4.3 % of GDP) is related to petroleum products, another 23 % ($55.2 billion or 2 % of GDP) to natural gas, and 26 % ($62 billion or 2.3 % of GDP) to electricity. At the same time, however, a large share of the subsidies does not reach the neediest segments of the population (Sdralevich, Sab, Zouhar, & Albertin, 2014, pp. 2, 5).
Industries also benefit from many exemptions across the region. All MENA countries offer direct and/or indirect investment incentives to increase employment, encourage the development of the private sector and improve their competitive position. Exemptions and multiple tax rates generally make the tax difficult to administer, create tax avoidance opportunities, and damage the business environment by increasing complexity. In many countries, off-shore regimes (as in Tunisia) or free-trade zones (Djibouti and Egypt) offer tax holidays and exemptions, and streamlined tax systems—but often favor insiders and over-burden taxpayers in the on-shore sector. Large gaps between the highest rates for CIT also distort the choice of incorporation (Jewell, Mansour, Mitra, & Sdralevich, 2015, pp. 8, 15).
The corporate income taxes which are applied at relatively moderate rates in the region, plays an important role in MENA’s tax systems, with the exception of Gulf Cooperation Council (GCC) countries, where it applies mostly to foreign companies. Over the past two decades corporate tax rates in MENA have declined significantly. In the early 1990s, average top corporate income tax rates across country groups ranged from about 35 % in the Mashreq to over 55 % in OME. In 2012, rates stood between 18 to 28 %. This trend has been noted elsewhere around the world, and interpreted as a form of corporate tax competition (Mansour, 2015, p. 24).

Berna Uymaz (From State Owned Enterprises of OECD to Wars in the Mena Region: Visible Hands of Markets)
32
Big corporations which are influenced by the changes in the administration of Egypt, are generally in cooperation with the state. These enterprises have been particularly essential in driving economic growth and expanding the export sector and tourism, which attracts much-needed foreign exchange. All this makes it imperative that the governments create the proper conditions for large private enterprises to function well and thrive regardless of their direct political influence (Adly, 2017, pp. 21-22).
The states and the markets act together in collaboration. The state's power plays a role in determining the profitability of businesses, and sovereign wealth funds (SWFs) are tools used to affect this relationship in favor of local firms and elites (Schwart, 2012, pp. 2, 5).
Since the 1980s, the oil revenues of the Gulf countries have been deposited in long term financial and real estate investments in international markets through the SWFs of these countries. Investments financed by SWFs are strategic projects that require high capital, and are generally supported by large-scale and often intergovernmental agreements (Choplin & Vignal, 2017). In the last 20 years, hydrocarbon revenues and income from the SOEs have contributed to the growth of SWFs in the Middle East (Amico, 2017). According to the Sovereign Wealth Fund Institute (Sovereign Wealth Fund Institute [SWFI], 2017), the value of national asset funds worldwide is $ 7.4 trillion by March 2017, about $ 3.1 trillion of which is in the OECD region.
GCC-based SWFs are playing a crucial role in transnationalization of capital and (re)consolidation of the GCC transnational elites’ power in TCC. The GCC countries have already completed most of the crucial stages of liberalization and financial reform.” by the creation of many SWFs in the GCC that play an important role in returning petrodollars into the global financial market and by reinvesting it in mostly Western countries. At the same time, these funds have appeared as a reliable source of capital for many GCC-based financial sectors that play a decisive role in financing the private sector of global economy by injecting large sums of cash into the system, mainly during the periods of financial crisis, such as the one in 2008. Furthermore, the position of the GCC elites in the TCC has been strengthened by the segmentation of production according to neoliberalism. The GCC elites play a significant role in the global economy of oil and the financial transactions of petrodollars. As a result of this model of management, it appears that these funds have become an important source of capital

The Political Economy of Public Finance (Edited by: Mustafa Çelen, Özkan Zülküfoğlu, Elżbieta Robak)
33
for personal investments. For instance, KIA (Kuwait Investment Authority), has 7.1 % stake in Daimler Chrysler dating back to 1969 and has also 3.3 % share in British Petroleum (BP). More recently, KIA made headlines by becoming the largest investor in the Industrial and Commercial Bank of China ($720 million) in 2006 and it made a “very public contribution to propping up ailing U.S. banks during the acute phase of the 2008 global financial crisis” (Mirtaheri, 2016, pp. 44-45). Therefore, the SWFs of the Persian Gulf Arab states are controlled by individual actors rather than public entities (Mirtaheri, 2016, p. 44), which makes it difficult to separate them from the state budget (Choplin & Vignal, 2017).
SWFs are instruments of personal capital accumulation through investment strategies, rather than being carriers of state interests. In particular, SWFs of Arab oil exporting countries which have been established in patrimonial states, maximize economic gains using capitalism, where actors are profit-oriented. This profit arises from the direct use of force and special deals made with political authorities. Although patrimonial SWFs seem to belong to the state, their connections with their states are weak because of the low level of institutionalization of these states. State ownership is becoming a veil for private activities and the state is becoming a means for the people to maintain their special interests in the resources they captured. Since the investment strategies and internal organization of these SWFs are not clear, the control is limited and the investment objectives are hidden (Schwart, 2012, pp. 4, 12).
Besides these policies showing the coordination of capital and state intervention policies, the economic role of destruction and economic effects of wars are important in MENA.
To postpone a crisis, the idea of a war may come up. A reason for this expectation is an effect of the Second World War which was one of the important factors to increase the profit rates after the big Crisis of 1929. For instance, after the Second World War, the role of military expenditures in providing stability is expressed by "the theory of permanent arms economy” and Ernest Mandel’s (1986) "Long Wave Theory" which examine the effects of the Second World War and the importance of war in changing the downward movement of profit rates. However, whether wars after the Second World War have the same effects is a subject of discussion.
Berna Uymaz (From State Owned Enterprises of OECD to Wars in the Mena Region: Visible Hands of Markets)
34
It’s possible to examine the topic in two sub-headings: i) examining the economic effects of the war industry and the military expenditures; ii) examining the economic effects of wars.
From this point of view, war industry and military expenditures provide a contribution to postpone crises and to realize capital accumulation in cases they increase the rate of surplus value, they also slow down the rise in organic composition of capital and they increase demand for consumer goods (Uymaz Yılmaz, 2010, pp. 221-226). The positive effects of military expenditures and war industry in capital accumulation can be classified as follows:
• Mandel (1993, pp. 278, 285) states that during the late capitalism the war industry and the military expenditures can contribute to the capital accumulation through low wages and labor-intensive working conditions which are possible during wars.
• Military expenditures, the wasted resources and the planned production process in the war industry offer a solution to over-production (Baran & Sweezy, 1966, p. 87 and Kidron, 1969).
• In the monopoly capitalism, military expenditures have an important role in absorbing the economic surplus (Baran & Sweezy, 1966, pp. 222-225).
• Technological developments in these areas increase productivity (Mandel, 1993, pp. 292-293, 304 and 1968, vol.2, pp. 522-524 and O'Connor, 1973, p. 113);
On the other hand, a war is expressed as a regulator and a single adaptive devastator which can contribute to solve problems arising in crisis, through terminating old institutions, technologies and modes of capital accumulation (Yeldan, 2009, p. 14). In this context, the destruction caused by war is emphasized to provide opportunities for the increasing production in post-war period (Grant, 1960). The high level of destruction of the war is a prerequisite for increasing the production and thus the production of surplus value after the war.
It is also necessary to focus on transformations which occurred in the forms of battles in order to examine the different ways in which contemporary wars are affecting the

The Political Economy of Public Finance (Edited by: Mustafa Çelen, Özkan Zülküfoğlu, Elżbieta Robak)
35
economies of MENA.
Wars after the Cold War have been mostly in less developed countries. Those in the MENA, after 1970s are generally civil-wars and they don’t have rules and standards. The fighting parties are irregular forces or mercenary soldiers and in these wars, which are limited and low-intensified (generally with light weapons), civilian death rates are high as civilian populations (the groups) fight for a variety of purposes and they are also under the threat of possible usage of nuclear weapons. Due to the above mentioned conditions, duration of the wars are getting longer (Kaldor, 2006, p. 15 and Yalçınkaya, 2008, pp. 337, 354, 357). In such wars usually there aren’t active roles of air forces. (Yalçınkaya, 2008, pp. 322, 336, 337). There aren’t final battles and a conflict is rarely seen. The features of the wars’ economy consist of high unemployment rates, high import ratio and decentralized governance (Münkler, 2010, pp. 27, 28, 29). A total war economy is not used during such wars and there is no need for post-war reconstruction activities because of a low destruction (Kaldor, 2006, p. 10; Yalçınkaya, 2008, p. 304). Instead of transferring a technology from war industry to civilian sectors, civil sectors provide R & D supports to war industry (Mackenzie, 1983, pp. 48-49). The wars are becoming less controllable and less rational taking into consideration the atomic bomb. Due to the danger of using the atomic bomb, weapons with high destroying capacity are not used in wars. In their place the political process is getting more important in the wars (Giddens, 2008, pp. 427, 430). Due to the above mentioned situations, duration of the little wars are getting longer (Kaldor, 2006, p. 15 and Yalçınkaya, 2008, pp. 337, 354, 357).
Based on this theoretical framework, some of the relevant developments in the region for the interpretation of the economic effects of war industry, war related expenditures, and finally war are as follows:
In the last quarter of the 20th century, the MENA has steadily moved away from relatively short conventional wars between state actors and has moved towards radically different efforts to use force to deter or to influence; towards conflicts with involve of non-state actors and outside powers, and towards unstable alliances, terrorism and insurgency (Cordesman, 2017).
Countries most exposed to conflict face deep recessions, high inflation, worsened fiscal
Berna Uymaz (From State Owned Enterprises of OECD to Wars in the Mena Region: Visible Hands of Markets)
36
and financial positions, and damaged institutions (Herrala, 2016, p. 40). Conflicts in the region have been typically associated with increased fiscal pressures and the end result has often been increasing fiscal deficits. For instance in Yemen’s data of 2015 suggests that central government revenue fell by as much as 60 % reflecting the combined effect of the sharp fall in oil prices and the shutdown of oil production facilities (Herrala, 2016, p. 40).
The poor performance of several MENA countries are partly determined by the wars that have caused death, destruction and also growth shortfalls in both conflict countries and their neighbors (Mottaghi, 2016, p. 9). From 1946 to 2015, 12 out of 59 conflicts in the region continued more than eight years and peace in half of these conflicts lasted less than 10 years. So, the region accounts for 40 % of the estimated global battle-related deaths since 1946 and 60 % of all casualties since 2000 (Sfakianakis, 2016).
For instance five years of war in Syria and to neighbors Turkey, Lebanon, Jordan, Iraq, and Egypt has a cost of around USD 35 billion in output, measured in 2007 prices and, per capita income in constant terms in Syria and Iraq have declined by 23 % and 28 % relative to the levels that could have been achieved without the war (Mottaghi, 2016, p. 9).
Wars directly damage the stock of physical capital in a country. World Bank-led assessment of damage found an estimate of $3.6-4.5 billion up to end 2014 in six cities in Syria (Aleppo, Dar'a, Hama, Homs, Idlib, and Latakia) over seven sectors (housing, health, education, energy, water and sanitation, transport and agriculture); an estimate of $ 4.0 – 5.0 billion in four cities of Yemen (Sana’a, Aden, Taiz and Zinjibar) over six sectors (education, energy, health, housing, transport, and water and sanitation); an estimate of $ 362.5 – 443 million in four cities liberated from ISIS in Iraq over four key sectors (water and sanitation, transport, public buildings and municipal services, and housing) (Mottaghi, 2016, p. 11). The wars in Syria and Iraq have displaced around 12 million Syrians and 4 million Iraqis (Stockholm International Peace Research Institute [SIPRI], 2016, p. 2).
“Not only have the civil wars caused untold damage to human and physical capital, but they have created one of the biggest forced displacement crises since World War II. Unemployment is high among refugees, especially women and those who do work often in

The Political Economy of Public Finance (Edited by: Mustafa Çelen, Özkan Zülküfoğlu, Elżbieta Robak)
37
the informal sector with no protection. About 92 % of Syrian refugees in Lebanon have no work contract and more than half of them work on a seasonal, weekly or daily basis at low wages.” (Devarajan, 2016).
In Syria and Iraq, millions of internally displaced persons are living in precarious conditions; Jordan, Lebanon and Turkey are the three countries that currently host most of the refugees, but refugees have settled in the poorest regions in Lebanon and Jordan (SIPRI, 2016, p. 2). The World Bank estimates that the inflow of more than 630,000 Syrian refugees have cost Jordan over USD 2.5 billion a year (Mottaghi, 2016, p. 16)
In Yemen, the number of poor people has increased from 12 million prior to the war to more than 20 million people (80 % of population) after the war (Mottaghi, 2016, p. 19) In Lebanon only, where real GDP growth is estimated to have dropped by 2.9 % each year during 2012-14, more than 170,000 Lebanese have been pushed into poverty and the unemployment rate has doubled to above 20 %. On the other hand, land and trade owners in Lebanon and Turkey have benefited from refugees, but workers have lost because Syrian refugees’ demand for goods and services increased prices and lowered wages as they also increased the labor supply (Mottaghi, 2016, p. 10).
World military expenditure is estimated to have been $1676 billion in 2015, representing 2.3 % of global gross domestic product and it was about 1.0 % higher in real terms than that in 2014. Military expenditure continued to rise in Asia and Oceania, Eastern Europe and those countries in the Middle East for which data is available (SIPRI, 2016, p. 17). In the MENA outside powers have also played a major role in conflicts through arms sales.
The ongoing conflicts in many parts of the world have direct links to arms imports. For example the MENA experienced significant growth in arms imports since 2010 and the use of arms by states in the conflict in Yemen in 2015 led to discussion of the morality and legality of exporting arms to the states in the region (SIPRI, 2016, p. 20).
Between 2007–11 and 2012–16 arms imports by states in the Middle East rose by 86 % and accounted for 29 % of global imports in 2012–16. Saudi Arabia was the world’s second largest arms importer in 2012-16, with an increase of 212 % compared with
Berna Uymaz (From State Owned Enterprises of OECD to Wars in the Mena Region: Visible Hands of Markets)
38
2007–11. Arms imports by Qatar went up by 245 %. The majority of other states in the MENA also increased arms imports. Over the past five years, most states in the Middle East have imported military equipments primarily from the USA and Europe and despite low oil prices, they continued to order more weapons in 2016 (Blenckner, 2016, p. 2).
The United States signed new arms sales agreements with nations in the Near East for an amount of approximately US$ 134 billion between 2007 and 2014; Russia signed for US$ 29.3 billion; China signed for US$ 4.9 billion; major European powers (UK, France, Germany, Italy) signed for US$ 49 billion, and some other states signed agreements for arms sales for US$ 19.3 billion. These purchases were driven largely by the fighting in Syria and Iraq, and the growing tension between Iran and its Arab neighbors (Cordesman, 2017).
Protecting core government institutions — such as fiscal agents and central banks — has been difficult during wars when policy makers can use government agencies more easily for personal benefits in which case financial flows may be redirected to the political constituencies of those in power; regulations are prepared in favor of a privileged minority and the collection of revenue may be aimed at political opponent (Herrala, 2016, p. 40).
Conclusion
The neo-liberal theory is ideologically anti-statist but state power does not disappear in the neoliberal period even though privatizations are implemented and vice versa. A close look at the role and impact of state interventions in OECD countries and the MENA region reveals that the state is not always inefficient and neutral. This article underlines the coordination between the capital accumulation process and states, and also describes how neoliberalism functions.
From the mid 90s onwards, the markets necessitated active state interventions to prevent systemic failure during numerous crises. This is one of the situations (market failures) in which neoclassical theory can accept interventions in the market economy. However, the neoclassical theory actually obscures that also in ordinary times public interventions are used and shaped in order to respond to the contradictions of the
The Political Economy of Public Finance (Edited by: Mustafa Çelen, Özkan Zülküfoğlu, Elżbieta Robak)
39
capitalist system. In order to elaborate on the mentioned theoretical base, besides other policies, examples from two different economic groups have been examined: i) SOEs in the OECD countries and ii)wars in the MENA region.
Despite ambitious privatization programmes of the recent decades, a number of OECD countries maintain state ownership in commercial enterprises, and largest SOE sectors are found in the largest economies. This situation is discussed in various studies, providing data about sales, profits, assets and market values of the SOEs. SOEs show a performance comparable with private companies, and they are even better in some specific sectors such as energy and telecoms. They grow faster than their private counterparts in terms of sales, assets and employees. They are among the largest and fastest expanding multinational companies. Data confirms that public enterprises are currently active in the global market arena.
As in OECD, it can be said that the role of the state in the economy is also high in the MENA, where privatizations are declared old fashion. States in the MENA support private sector and make profitable joint investments with private investors. The countries of the region offer a wide range of fiscal and financial incentives to promote capital accumulation and attract foreign direct investment. Investments by the state or state-controlled entities are on the rise across the region. The most visible investors are in sovereign wealth funds which are the instruments of personal capital accumulation through investment strategies and they should not be seen as neutral market actors.
The widespread economic impact of the war, the war industry, and the related expenditures are a matter of debate on the theoretical framework. When examining examples from the MENA, the clearest point is that the region is creating an important demand for the arms trade. The weapon sales made in May 2017 to Saudi Arabia were one of the largest in history, totaling close to $110 billion. It’s clearly seen that investors in war related fields such as military-industrial complexes and postwar reconstruction sectors can increase their profits. From this point of view, it seems that the war in Iraq, the civil war in Syria, the war in Yemen and the war against ISIS in Libya, are likely to continue. Another important point is that the refugee immigration has affected not only the conflicting countries’ economy but the burden of refugees threatens also the neighboring countries and the EU. This characteristic of the MENA makes it open to debate as the long-lasting wars have become part of everyday life in the region.

Berna Uymaz (From State Owned Enterprises of OECD to Wars in the Mena Region: Visible Hands of Markets)
40
Neoliberalism is said to bring prosperity and peace to the world. But OECD and the MENA region provide plenty of case examples showing the reverse of this expectation.
References
Abed, G. T., & Davodi, H. R. (2003). Challenges of Growth and Globalization in the Middle East and North Africa. Washington: IMF Publishing. Retrived from https://www.imf.org/external/pubs/ft/med/2003/eng/abed.htm (15.05.2017).
Adamczyk, G., & Windish, B. (2015). Competition State Aid Brief: State Aid to European Banks: Returning to Viability, Brussel: European Commission, Retrived from http://ec.europa.eu/competition/publications/csb/csb2015_001_en.pd (05.05.2016).
Adly, A. (2017, March 2). Too big to fail: Egypt’s large enterprises after the 2011 uprising, Carnegia Middle East Center, Washington, D.C. Retrived from http://carnegie-mec.org/2017/03/02/too-big-to-fail-egypt-s-large-enterprises-after-2011-uprising-pub-68154 (28.05.2017).
Amico, A. (2015, March 4). The “invisible hand” of the state in MENA economies. The Washington Post. Retrived from https://www.washingtonpost.com/news/monkey-cage/wp/2015/03/04/the-limits-of-privatization-in-the-middle-east/?utm_term=.56a7cdfdd1df (21.04.2017).
Amico, A. (2017). The promise of Middle East sovereign wealth funds, Project Syndicate, Retrived from https://www.project-syndicate.org/commentary/corporate-governance-middle-east-sovereign-wealth-funds-by-alissa-amico-2017-02 (25.05.2017).
Araghi, F. (2009). The Invisible Hand and The Visible Foot”. in A.H. Akram-Lodhi & C.Kay (Eds.). Peasants and globalization: Political economy, agrarian transformation and the agrarian question. pp. 111-147. London and New York: Routledge. Retrived from https://books.google.com.tr/books?hl=tr&lr=&id=rP4ve9VNX_QC&oi=fnd&pg=PA111&dq=neoliberalism%2Bvisible+hands&ots=-ykiTjT1Sb&sig=TWzKxVUZu9L7qhWsEdXjTY-Z3UI&redir_esc=y#v=onepage&q=visible%20foot&f=false (03.05.2017).
Baran, P., & Sweezy, P. (1966). Monopoly capital: An essay on the American economic and social order. New York. NY: Monthly Review Press.
Bernanke, B.S. (2010). Causes of the Recent Financial and Economic Crisis, Before the Financial Crisis Inquiry Commission. Washington, D.C.. September 2. Retrived
The Political Economy of Public Finance (Edited by: Mustafa Çelen, Özkan Zülküfoğlu, Elżbieta Robak)
41
from http://www.federalreserve.gov/newsevents/testimony/bernanke20100902a.pdf. (12.05.2016).
Blenckner, S. (20.02.2017). Increase In Arms Transfers Driven By Demand in The Middle East and Asia, Says Sipri. Stockholm International Peace Institution. Press Release. https://www.sipri.org/sites/default/files/AT-Press-Release-ENG.pdf. (09.04.2017).
Choplin, A., & Vignal, L. (2017). Gulf Investment in the Middle East: Linking Places. Shaping a Region. in L. Vignal (Eds). The transnational Middle East: People, places, borders. The International Political Economy of the New Regionalism Series. London-NewYork: Routledge. Retrived from https://books.google.com.tr/books?id=f_4wDQAAQBAJ&pg=PT151&dq=gulf+groups:+new+actors+of+regional+investment&hl=tr&sa=X&ved=0ahUKEwior7iko7bTAhXG6xoKHWiRDXEQ6AEIITAA#v=onepage&q=intergovernmental&f=false. (03.04.2017).
Clo, S., F. Chiara, Bo, D., Ferraris, M., Fiorio, C., Florio, M., & Vandone, D. (2014). “Publicization versus Privatization: Recent Worldwide Evidence”. Working Paper CIRIEC N° 2014/03. ISSN 2070-8289. Retrived from http://econpapers.repec.org/paper/crcwpaper/1403.htm. (13.05.2017).
Clo, S., Ferraris, M., & Florio, M. (2015). “L’impresa pubblica in prospettiva globale nell’ultimo decennio”, Università degli Studi di Milano, Working Paper n. 2015-03. Retrived from http://wp.demm.unimi.it/files/wp/2015/DEMM-2015_03wp.pdf. (10.03.2017).
Cordesman, A. (January 14, 2017). “The Changing Nature of War in the Middle East and North Africa” Harvard International Review. Retrived from http://hir.harvard.edu/article/?a=14493. (17.05.2017).
Cox, E. (2015). “Neoliberalism and Revolution in Egypt”. E-International Relations. Retrived from http://www.e-ir.info/2015/04/24/neoliberalism-and-revolution-in-egypt/. (22.05.2017).
Cumbers, A. (2012). Reclaiming Public Ownership-Making Space for Economic Democracy, Zed Books, London-New York.
Devarajan, S. (03.02.2016). Economic Effects of War and Peace in the Middle East and North Africa. The World Bank. Press Release. Retrived from
European PPP Expertise Centre (2016). “PPP and State Aid”. Europen Investment Bank. Herbert Smith Freehills. Retrived from
Berna Uymaz (From State Owned Enterprises of OECD to Wars in the Mena Region: Visible Hands of Markets)
42
http://www.eib.org/epec/resources/publications/epec_ppp_and_state_aid_en. (20.04.2017).
Feldstein, M. (1987). Introduction. in M. Feldstein (Eds.). The effects of taxation in capital accumulation. Chicago-London: The University of Chicago Press. Retrived from https://books.google.com.tr/books?id=mPeIW90fh9YC&pg=PA415&lpg=PA415&dq=taxes%2Bsubsidies%22capital+accumulation%22&source=bl&ots=P2hEbzBiQT&sig=gkgBwhBWbmsALlkDyA6sYqB2rmA&hl=tr&sa=X&ved=0ahUKEwiluMGclIjUAhVSLVAKHdtjD8c4ChDoAQhoMAc#v=onepage&q=subsidies&f=false. (27. 04.2017).
Florio, M. (2015). “Public Enterprises in a Global Perspective: Role and Governance in the Implementation of Innovative Strategic Policies and Economic Development”. CIRIEC International Conference. Ferbruary 25th. Paris. Retrived from http://www.ciriec.ulg.ac.be/wp-content/uploads/2016/01/seminaire25fev15-Florio-LongText_EN.pdf. (10.03.2017).
Giddens, A. (2008). Ulus devlet ve şiddet. (C. Atay, Trans.). İstanbul: Kalkedon Yayınları. Grant, T. (1960). “Will There Be A Slump?”. The Unbroken Thread. Retrived from Güzelsarı, S. (September 2012). “The Restructuring of Health Care System and Public-Private
Partnerships”. TODAİE’s Review of Public Administration. Volume 6. No 3. pp. 33-64. Retrived from
Hanieh, A. (2013). Körfez ülkelerinde kapitalizm ve sınıf. (B. Ahıska & S. Doğan, Trans.). İstanbul: Nota Bene Yayınları.
Hanieh, A. (2015). İsyanın kökenleri: kapitalizmin Ortadoğu’daki sorunları. (A.Toprak, Trans.). İstanbul: Nota Bene Yayınları.
Herrala, R. (2016). Economic Policies During Conflict. MENAP Region Highlights. IMF. Retrived from https://www.imf.org/external/pubs/ft/reo/2016/mcd/eng/pdf/menap1016.pdf. (15.05.22017).
http://openaccess.city.ac.uk/3425/6/swfs.pdf. (28.05.2017). http://www.thenational.ae/business/economy/the-economic-cost-of-middle-east-conflict-is-a-
daunting-thing-to-calculate. (23.05.2017). http://www.todaie.edu.tr/resimler/ekler/0466df806be926b_ek.pdf?dergi=Review%20of%20Pu
blic%20Administration. (08.05.2017). http://www.worldbank.org/en/news/press-release/2016/02/03/economic-effects-of-war-and-
peace-in-the-middle-east-and-north-africa. (02.04.2017).
The Political Economy of Public Finance (Edited by: Mustafa Çelen, Özkan Zülküfoğlu, Elżbieta Robak)
43
http://www.worldbank.org/en/news/press-release/2016/02/03/economic-effects-of-war-and-peace-in-the-middle-east-and-north-africa. (02.04.2017)
Hvidt, M. (2013). Economic Diversification in GCC Countries: Past Record and Future Trends. Kuwait Programme on Development. Governance and Globalisation in the Gulf States. No: 27. Retrived from http://www.lse.ac.uk/middleEastCentre/kuwait/documents/Economic-diversification-in-the-GCC-countries.pdf. (15.05.2017).
International Monetary Fund (2009). Market Interventions During The Financial Crisis: How Effective and How to Disengage?. in Global Financial Stability Report
International Monetary Fund (2017). Estimating the stock of public capital in 170 countries. Retrived from http://www.imf.org/external/np/fad/publicinvestment/pdf/csupdate_jan17.pdf. (14.05.2017).
Jewell, A., Mansour, M., Mitra, P., & Sdralevich, C. (September, 2015). Fair Taxation in the Middle East and Northern Africa. IMF Staff Discussion Note. SDN 15/16. Retrived from https://www.imf.org/external/pubs/ft/sdn/2015/sdn1516.pdf. (25.05.2017).
Kaldor, M. (2006). New and old wars: Organised violance in a global era. 2nd edt. UK: Politiy Press.
Kidron, M. (1969). Il capitalismo occidentale del dopoguerra. Bari: Laterza. Lapavitzas, C., Lantenbrunner, A., Lindo, D., Meadway, J., Michell, J., Painceira, J.P., Pires,
E., Powell, J., Stenfors, A., Teles, N. & Vatikiotis, L. (2011). Breaking Up? A Route out of the Eurozone Crisis Research on Money and finance, Occasional Report, https://www.researchonmoneyandfinance.org/images/other_papers/Eurozone-Crisis-RMF-Report-3-Breaking-Up.pdf. (23.01.2012).
Mackenzie, D. (1983). Militarism and Socialist Theory. Capital & Class. no.19. pp.33-73. Retrived from http://www.cseweb.org.uk/issue.shtml?x=26349. 23.04.2007.
Mandel, E. (1986). Kapitalist gelişmenin uzun dalgaları. (D. Işık, Trans). İstanbul: Yazın Yayıncılık.
Mandel, E. (1993). Late capitalism. (J. De Bres, Trans.). 5.bsk London-New Yok: Verso. Mansour, M. (May 2015). Tax Policy in MENA Countries: Looking Back and Forward. IMF
Working Paper-15/98. Retrived from https://www.imf.org/external/pubs/ft/wp/2015/wp1598.pdf. (10.05.2017).
Berna Uymaz (From State Owned Enterprises of OECD to Wars in the Mena Region: Visible Hands of Markets)
44
Marois, T. (2013). State-owned banks and development: Dispelling mainstream myths. Occasional Paper. no. 21. Municipalservicesproject. Retrived from http://www.municipalservicesproject.org/publication/state-owned-banks-and-development-dispelling-mainstream-myths (16.04.2016).
Mirtaheri. S. A. (2016). Transnational capitalism and the Middle East: Understanding the transnational elites of the Gulf Cooperation Council. FIU Electronic Theses and Dissertations. 2607. Retrived from http://digitalcommons.fiu.edu/etd/2607. (29.05.2017).
Mottaghi, L. (03.02.2016). Economic Effects of War and Peace in the Middle East and North Africa. The World Bank. Press Release. Retrived from
Navigating the Financial Challenges Ahead. World Economic and Financial Surveys. ch: 3. pp.117-152. Retrived from https://www.imf.org/external/pubs/ft/gfsr/2009/02/pdf/chap3.pdf . 29.04.2017.
ng_papers_151-200/WP197.pdf. (14.06.2010). O'Connor, J. (1973). The fiscal crisis of the state. New York, NY.: St. Martin's Prees. Organisation for the Co-operation and Development (2013). State-owned enterprises in the
Middle East and North Africa: Engines of development and competitiveness?. Paris: OECD Publishing. Retrived from http://dx.doi.org/10.1787/9789264202979-en. (27.05.2017).
Organisation for the Co-operation and Development (2014). “The Size and Sectoral Distribution of SOEs in OECD and Partner Countries”. OECD Publishing. DOI:10.1787/9789264215610-en. Retrived from http://www.keepeek.com/Digital-Asset-Management/oecd/finance-and-investment/the-size-and-sectoral-distribution-of-soes-in-oecd-and-partner-countries_9789264215610-en#page3. (09.04.2017).
Organisation for the Co-operation and Development (n.d.). SOEs Operating Abroad: An application of the OECD Guidelines on Corporate Governance of State-Owned Enterprises to the cross-border operations of SOEs. Retrived from http://www.oecd.org/corporate/ca/corporategovernanceofstate-ownedenterprises/44215438.pdf. (22.04.2017).
Scholte, J.A. (2005). “The Sources of Neoliberal Globalization“. United Nations Research Institute for Social Development. Programme Paper Number 8. Retrived from http://www.unrisd.org/80256B3C005BCCF9/(httpAuxPages)/9E1C54CEEB19A314C12570B4004D0881/$file/scholte.pdf. (30.05.2017).

The Political Economy of Public Finance (Edited by: Mustafa Çelen, Özkan Zülküfoğlu, Elżbieta Robak)
45
Schwartz, H. (2012). Political Capitalism and the Rise of Sovereign Wealth Funds. Globalizations. 9(4). pp. 517-530. doi: 10.1080/14747731.2012.699924. Retrived from
Sdralevich, C., Sab, R., Zouhar, Y., & Albertin, G. (2014). “Subsidy Reform in the Middle East and North Africa: Recent Progress and Challenges Ahead”, Washington”, D.C.: International Monetary Fund. Retrived from https://www.imf.org/external/pubs/ft/dp/2014/1403mcd.pdf. (15.05.2017)
Sfakianakis, J. (2016, September 18). “The Economic Cost of Middle East Conflict Is A Daunting Thing To Calculate”. The National. Retrived from
Sovereign Wealth Fund Institute (2017). Sovereign Wealth Fund Rankings. Retrived from http://www.swfinstitute.org/sovereign-wealth-fund-rankings/. (10.02.2017).
Stockholm International Peace Research Institute (2016). SIPRI Yearbook 2016-Armaments, Disarmament and International Security - Summary. Retrived from https://www.sipri.org/sites/default/files/YB16-Summary-ENG.pdf. (15.05.2017)
Uymaz Yılmaz, F. B. (2010). 20. Yüzyılda savaşların uzun dalgalar ve sınai çevrimlerdeki etkileri. (Unpublished doctoral dissertation). Istanbul Ünivesitesi Sosyal Bilimler Enstitüsü. İstanbul.Turkiye.
Uymaz, B. (2012) Krizin tanımlanmasına Bağlı Şekillenen Müdahale Politikaları: Avrupa Birliği Üzerinden Analiz. In E. Tahsin (Eds). Türkel Minibaş’a Armağan. (pp:97-126). İstanbul: Derin Yayınları.
www.tedgrant.org/archive/grant/1960/slump.htm. (10.01.2010). Yalçınkaya, H. (2010). “Savaşın Değişimi ve Savaş Çalışmalarında Farklı Disiplinler”. in B.
Özçelik (Eds.). Savaş: Farklı disiplinlerde yeni yaklaşımlar. (pp: 13-30). Ankara: Siyasal Yayınevi.
Yeldan, E. (2009). “On the Nature and Causes of the Collapse of the Wealth of Nations, 2007/2008: The End of a Façade Called Globalization”. PERI (Political Economy Research Institute). University of Massachusetts Amherts. Working Paper Series Number 197. Şubat, ABD. s.1-16. Retrived from http://www.peri.umass.edu/fileadmin/pdf/working_papers/worki


The Political Economy of Public Finance (Edited by: Mustafa Çelen, Özkan Zülküfoğlu, Elżbieta Robak)
47
Financial Crises, Public Restriction and Environmental Issues
Muhammed Şahin Candan Yılmaz Abstract
The environment is defined as a global public good that needs to be protected, and it is mentioned that international governance necessitated to be establish for this. In this direction, the European Union, one of the most important actors of the global system, has taken important steps to raise environmental standards. However, these practices and policies aimed at eliminating environmental problems at the EU level have been hampered as a result of 2008 Global Financial Crisis affected all over the World. Thus, innovative and comprehensive environmental policies have remained in the second place in the EU states because of the fact that the budget balance is disrupted and public debts have increased rapidly. In this study, the effect of austerity policies to minimize the influence of the financial crisis on environmental politics of the EU which is considered as a successful actor of environmental protection practices is evaluated. After the austerity policies, governments' approach to environmental policy is dealt with in EU by years. According to data obtained from the study while the effects of the financial crisis to member countries in EU, the macroeconomic rules proposed to the debtor countries are in the negative direction of the success of the countries' environmental policies.
Key Words: Financial Crises, Austerity Policy, EU Environment Policy.
2
Onur Oğuz, Nadir Eroğlu (Income Inequality From the View of Institutional Economics: An Emprical Analysis Using Dynamic Panel Data)
48
Introduction
enerating a sustainable economic growth and healthy environmental conditions became of the most significant issues of today. The atmospheric problems created by the greenhouse gases, glacial melting caused by global
warming, destruction of rain forests, and confronting with the risk of decrease of bio-diversity, started to threaten the future of human beings. In accordance with this fact, a significant increase in activities of either governments or international institutions intended at protection of environment was observed in the recent period. The ecological sensibility, which started with the United Nations Environment Conference held in Sweden’s capital Stockholm in 1972, continues to determine the outlines of 21st Century’s global environment policies with the Millennium Targets expressed once again by the United Nations.
However, exceptional situations such as war and economic crisis may damage the environmental sensibility. It is possible to observe the last example of this in 2008 Global Financial Crisis. Before the crisis, during a period when growth and employment concerns were relatively less dominant, stopping the ecological destruction and protecting the environment were among the top priority concerns. However, the crisis attracted all the attention first to the facts of stagnation and unemployment and then to the increasing public deficits.
And as a result of this, environmental problems became a relatively less important title. In fact, even in European Union (EU), which is considered to have one of the most advanced norms in the world with regards to environmental standards, the application of environment policies was imperiled.
In this study, the objective is to analyze the effect of 2008 Global Financial Crisis on EU environment policy and practices. The study consists of five main sections. In the first section, the formation and effects of the crisis will be examined. In the second section, the effect of the crisis on the public financial balance of developed countries and in particular of EU states will be discussed. The third section is intended to explain the environment and EU’s environment policies. In the fourth section, the effect of the financial crisis on EU environment policies will be expressed. And the last section bears the title of conclusion and general evaluation.
G

The Political Economy of Public Finance (Edited by: Mustafa Çelen, Özkan Zülküfoğlu, Elżbieta Robak)
49
1. Global Financial Crisis: A General Framework
World economy was confronted with a big financial crisis in years 2007-2008. The point of origin of the crisis, which arose from USA and then rapidly spread to other countries, was the speculative movements occurred in the real estate market. FED’s low interest policy and the rise in the household debts played a crucial role in the arising of the crisis. FED lowered the interest rates to the levels of 1% to prevent the economic stagnation that rose to the surface after the downfall, which occurred during the early 2000’s at American technology index NASDAQ and which passed into history as “.com.bubble” (Ofek and Richardson, 2003; DeLong and Magin, 2006). This decrease in the interest rates made it easier for the household to contract debts (Brown et. al, 2010; Chmelar, 2013). Therefore a big bubble was formed in the property market associated with transformation of this money obtained by the households to consumption and speculative real estate investments.
The conversion of the households’ residence and similar expenses to complex derivative financial instruments through securitization had influence on the transitivity of this bubble to the financial markets (Girón and Chapoy, 2012; Buchanan, 2017). These instruments presented a very high level of credit that indeed they did not deserve depending on the incorrect credit scores of the rating agencies (Dennis, 2009). In addition to these, the presence of subprime mortgage loans offered to low-income people who do not have purchasing power (Bibow, 2010) made the crisis inevitable.
The crisis has a deep effect on the national economies. The growth figures throughout World economies, particularly of the epicenter of the crisis USA, decreased prominently, whereas the unemployment figures increased considerably (Gros and Aleidi, 2010; Worldbank, 2009). The effect of the crisis on economic growth is presented on Figure 1. Whereas the crisis led to economic recession on USA, Euro Region and Japan, which were considered as the central regions of the World economy, the effect of this condition was particularly more permanent on Japan and Euro regions. On the other hand, it may be understood on the figure that Chinese economy, which had one of the biggest growth performances within emerging markets, was affected negatively from the central shrinkage and that her annual growth figures decreased by half within the period of years 2007-2016 (growth rate was 6,7% in 2016 whereas it was 13% in 2007).

Onur Oğuz, Nadir Eroğlu (Income Inequality From the View of Institutional Economics: An Emprical Analysis Using Dynamic Panel Data)
50
Figure 1: Annual GDP Change Values in Major Economies (%)
Source: IMF, 2017
Figure 2: Unemployment Rates of Some Advanced Economies (%)
Source: OECD, 2017
-10
-5
0
5
10
15
2001
2002
2003
2004
2005
2006
2007
2008
2009
2010
2011
2012
2013
2014
2015
2016
USA
EuroArea
UK
Japan
China
0,000
5,000
10,000
15,000
20,000
25,000
30,000
2006
2007
2008
2009
2010
2011
2012
2013
2014
2015
2016
Greece
Ireland
Italy
Portugal
Spain
UnitedStates
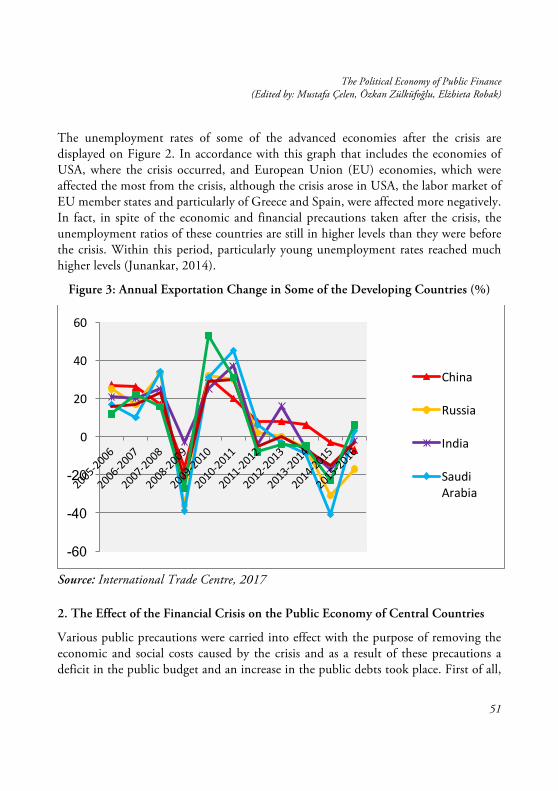
The Political Economy of Public Finance (Edited by: Mustafa Çelen, Özkan Zülküfoğlu, Elżbieta Robak)
51
The unemployment rates of some of the advanced economies after the crisis are displayed on Figure 2. In accordance with this graph that includes the economies of USA, where the crisis occurred, and European Union (EU) economies, which were affected the most from the crisis, although the crisis arose in USA, the labor market of EU member states and particularly of Greece and Spain, were affected more negatively. In fact, in spite of the economic and financial precautions taken after the crisis, the unemployment ratios of these countries are still in higher levels than they were before the crisis. Within this period, particularly young unemployment rates reached much higher levels (Junankar, 2014).
Figure 3: Annual Exportation Change in Some of the Developing Countries (%)
Source: International Trade Centre, 2017 2. The Effect of the Financial Crisis on the Public Economy of Central Countries
Various public precautions were carried into effect with the purpose of removing the economic and social costs caused by the crisis and as a result of these precautions a deficit in the public budget and an increase in the public debts took place. First of all,
-60
-40
-20
0
20
40
60
China
Russia
India
SaudiArabia

Onur Oğuz, Nadir Eroğlu (Income Inequality From the View of Institutional Economics: An Emprical Analysis Using Dynamic Panel Data)
52
policies intended to reduce losses caused by financial assets that played a significant role in the arising of the financial crisis and that are called toxic assets are put into practice.
Within this period, the negative effect of these assets, whose large part was derived by securitization, on the balance-sheets of the creditor banks was tried to be resolved with the bailouts put into practice by the state (Pinedo, 2009; Schäfer and Zimmermann, 2009). For as much as, the aforementioned banks, which were in gigantic in size would affect the economy negatively in general, in case they went bankrupt, were referred as institutions that were too big to fail (Shull, 2010).
The first step taken in this direction was the bailout package called the Troubled Asset Relief Program (TARP) put into practice by the public authorities. With this package, which was carried into effect in accordance with the Emergency Stabilization Act (EESA) accepted by the Unites States Senate in November, 2008, and which has a magnitude amounting to 700 billion Dollars, it was aimed to support the large companies operating in insurance, automotive and primarily banking industries (Webel, 2013; Amadeo, 2017). However, this package amounting to 700 billion Dollars reflected only a small part of the bailouts. The total cost of company relief programs along with the other bailouts following the one mentioned above for the American government exceeded 13 trillion Dollars (Prins, 2009: p. 5).
Similar bailouts were also put into practice in EU states. As crisis exceeded the borders of USA and reached a global scale, the necessity of protecting the EU economies against the crisis became a current issue. Correspondingly, similar relief operations used in USA were put into practice and in this regard, it was decided a public support amounting to more than 5 trillion Euros should be provided to the European financial institutions. The countries that the bailouts, which placed an additional burden on European governments approximately between 1,5 billion Euros and 870 billion Euros, were applied most intensively were respectively United Kingdom, Germany, Denmark, Spain, Ireland, France, Belgium, Holland, Sweden, Italy, Greece, Austria, Portugal, Poland and Finland (Thomson Reuters, 2013). If a proportional comparison should be made, the proportion of the support provided to the financial industry in GDP reached to levels of 37.3 % in Ireland, 24.8% in Greece and 10.4% in Portugal, the proportion of the financial support in the total GDP of Euro Region was 5.1% (Maurer and Grussenmeyer, 2015: p. 19).

The Political Economy of Public Finance (Edited by: Mustafa Çelen, Özkan Zülküfoğlu, Elżbieta Robak)
53
Figure 4: The Ratio of Budget Deficit to GDP in Selected Countries (%)
Source: OECD, 2011; OECD, 2014 The second precaution taken after the crisis was to bring stimulus policies intended to resolve the stagnation caused by the crisis into force. The Global Financial Crisis led up to social problems such as poverty and income inequality as a result of the economic stagnation and unemployment caused by the crisis (Duiella and Turrini, 2014; De Beer, 2012). Therefore, the governments once again had to take stimulus precautions in order to resolve these economic and social problems. China led the way in application of the stimulus policies. While Chinese government put a stimulus application at the ratio of approximately 12.7% of the country’s GDP into practice in 2008, the year the crisis arose, Saudi Arabia, South Korea, Turkey and USA followed China respectively. Italy, Germany and France were the countries who actualized the highest amount of stimulus payment within EU states (International Institute for Labour Studies, 2011: p. 3-4). Within this period, tax cut application was one of the most important instruments resorted to within the stimulus policies. Tax cuts amounting approximately to 400 billion Dollars in USA (Blinder and Zandi, 2010: p. 16) and to 115 billion Euros in EU (Saha and Von Weizsäcker, 2009: p. 2) were applied right after the crisis. The countries who resorted to the tax cut instrument most intensively within the total
-40,00
-30,00
-20,00
-10,00
0,00
10,00
2006 2007 2008 2009 2010 2011 2012 2013 2014 2015
Greece Iceland Ireland Portugal
Spain UK USA

Onur Oğuz, Nadir Eroğlu (Income Inequality From the View of Institutional Economics: An Emprical Analysis Using Dynamic Panel Data)
54
stimulus practices were respectively Russia, Brazil, Indonesia, United Kingdom and Germany (Verick and Islam, 2010: p. 41).
The public precautions put into effect as needed to fight the crisis and the economic and social problems caused by the crisis, affected the budget balance negatively as may be seen on Figure 4. In accordance with this figure that comprises USA and the EU states whose budget balances are disturbed the most, the budget deficits of EU states and particularly Ireland rapidly rose since the beginning of the crisis. A similar situation is also true for public debts. Because the period after the crisis is referred to as debt crisis period for advanced economies and particularly for EU states (Lane, 2012; Tichy, 2012). After the crisis, the debts of the advanced countries, which were referred to as central economies, showed a considerable increase. In fact, the ratio of public debt to GDP reached to a level of 234% in Japan, 181% in Greece, 157% in Italy, 125% in USA and 122% in Iceland (OECD, 2016).
The disruption in the financial balances caused contractionary policies to be brought to agenda in time, on the contrary to the expansionary policy at the beginning. With the austerity policies that was put into practice within this period it was intended to reestablish the public finance balances and the fiscal discipline started to be a more emphasized title in the next stage of the crisis (Wren-Lewis, 2016; Fazi, 2016). Therefore, whereas the effect of the crisis on the finance of advanced economies was expansionary at the beginning, later the situation presented a quite opposite prospect later on. As it may be seen on Figure 5, although the austerity policies were able to reestablish the budget balances even if partially, they made it more difficult to resolve the economic and social problems in EU states after the crisis. For example, the poverty levels were still higher when compared to pre-crisis period and this situation was felt more heavily in Southern Europe countries such as Greece, Spain, Italy and Portugal (Lecerf, 2016; OXFAM, 2013).
Similarly, the austerity period affected the environment policies of EU and the concerns regarding the establishment of financial discipline became prominent and this factor was determinative for the field of environment to become a matter that had minor importance when compared with the pre-crisis period (Gravey, 2014; Geels, 2013).

The Political Economy of Public Finance (Edited by: Mustafa Çelen, Özkan Zülküfoğlu, Elżbieta Robak)
55
3. Environment as a Global Public Good and Environment Policies of EU
Environmental pollution became one of today’s most significant global issues. As a result of the acceleration of the urbanization process, concentration of industrial activities, gradual substitution of synthetic products instead of natural products and the increasing mass consumption, an increase in the ecocide is being observed. The most crucial environmental problems of present-day may be listed as global warming, ozone layer depletion, glacial melting, disappearance of biological diversity, extinction of rain forests, decrease in the available water supplies and the narrowing of cultivated lands (Kemp, 2004; Marks, 2016). The effect of global environmental issues on the globe is presented on Figure 5. In accordance with this figure, where the values of global warmth of left axis and carbon dioxide concentration on the right axis are presented, a considerable increase occurred in both values as from the last quarter of 20th century and aforementioned increase reached its peak in the period. And this is important with regards to indicate that the environmental issues, which started with the industrial evolution to a large extent, became more apparent in the present-day.
Figure 5: Global Warming and Carbon Dioxide Concentration Data
Source: Earth Policy Institute, 2015
0,00
100,00
200,00
300,00
400,00
500,00
12,50
13,00
13,50
14,00
14,50
15,00
1880
1888
1896
1904
1912
1920
1928
1936
1944
1952
1960
1968
1976
1984
1992
2000
2008
Carbon
Dioxide
Tempe
rature
Temperature(Celsius)
CarbonDioxideConcentration(PartsPerMillionbyVolume)

Onur Oğuz, Nadir Eroğlu (Income Inequality From the View of Institutional Economics: An Emprical Analysis Using Dynamic Panel Data)
56
Environmental issues reached dimensions that may threaten the future of human beings. Therefore, environment is now acknowledged as a shared value of all humanity and environment is considered as a global public good as a part of increasing the ecologic balance protection awareness (Heal, 1998; Gardiner and Le Goulven, 2002; UNIDO, 2008).
At the present time, the necessity to manage the economic growth and development process in a way to form a completeness with the protection of environment and sustainability of natural sources principles is generally accepted (Kates et.al, 2005; Harris, 2000; Strange and Bayley, 2008). In this context, ensuring environmental sustainability principle was ranked among the millennium development objectives of United Nations.
European Union is acknowledged as one of the international institutions, where environment polies are managed in a most successful manner. The beginning of EU environment policies reaches out to year 1972, in other words, just after 1972 United Nations Environment Conference. However, an important part of today’s environment standards was constituted within the framework of the regulations put into practice in 1990’s (Scheuer, 2006: p. 12). The environment policies of the union, whose majority was constituted by countries that have high production and consumption capacity and advanced life standards, were designed on the basis of sustainable development and protection of the nature. These policies were collected under the titles of clean energy sources, climate change, protection of natural sources, public health, sustainable production and consumption and sustainable transportation on the Sustainable Development Strategy (SDS) document of EU (European Union, 2009). Moreover, the future sustainability objectives of the union were listed as Live & Prosper Sustainably, Combat Climate Change, Healthy Ecosystems, Improve Soil & Water, Safeguard the Oceans, Govern the Environment, Reduce Pollution & Waste, Boost Renewable Energy, Increase Resource Efficiency on the document named The 2030 Agenda for Sustainable Development and the SDGs (European Union, 2015).
The expenses aimed for environmental sustainability have a relatively weighted place in the EU budget. 37% of the budget is reserved for sustainable growth and natural resources item. Figure expresses the highest figure after the 48% share reserved for economic and social requirements. However, it is crucial to state that there are expenses

The Political Economy of Public Finance (Edited by: Mustafa Çelen, Özkan Zülküfoğlu, Elżbieta Robak)
57
intended for agriculture, rural development and fishery within this 37% share (European Union, 2017). In other words, it would not be right to state that the whole figure displayed within EU budget classification consists of environmental expenses. As of year 2014, the amount of expenses realized on environment protection activities was approximately 297,5 billion Euros. The share of this amount within the GDP of the union was 2.13%. The most important environmental expenses with regard to the topics were respectively under the titles of waste and wastewater and the share of these two expenses within the total amount of expenses exceeds 70%. After these two items, biodiversity title is the third most important environmental expense item with it is approximately 10% share (Eurostat, 2016). Environmental taxes occupy an important place in the finance of union’s environment policies. As of year 2015, environmental taxes amounting approximately to 359,3 billion Euros were collected and this figure corresponds to the 6.3% of the total tax revenues and 2.4% of the total GNP. While the weighted share within these belongs to energy taxes group with 76.6%, transport taxes with 19.8% and pollution and resources taxes with 3.5% items follows. The countries that apply to the environmental taxes most intensively among the members are the Balkan states. For example, the share of the environmental taxes within the total taxes are at the level of 10.9% in Croatia, 10.6% in Slovenia, 10.3% in Greece and 10% in Bulgaria. None the less, aforementioned percentage falls to the levels of 5.1% in Germany, 4.9% in Luxemburg, 4.8% in France and 4.7% in Belgium of Western Europe. A similar differentiation within the member states is related to the source of the environmental taxes. This condition may be seen on Figure 6. The figure is important with regard to give an idea about the environmental priorities of the members. In accordance with the figure, the share of energy taxes within the total environmental taxes is at the highest level in Czech Republic, Lithuania, Luxemburg and Romania. However, the member states where the share of the transport taxes are highest are respectively Malta, Denmark, Ireland and Austria. Croatia, Holland and Slovenia are the member states that apply relatively more for pollution and resources taxes source (Eurostat, 2017).

Onur Oğuz, Nadir Eroğlu (Income Inequality From the View of Institutional Economics: An Emprical Analysis Using Dynamic Panel Data)
58
Figure 6: Environmental Taxes in Accordance with the Sources in EU States (%)
Sources: Eurostat, 2017. 4. The Effect of Global Crisis on EU Environment Policies
As the financial crisis became effective, the austerity policies started to be advocated in EU states. The government turned towards to contractionary policies instead of increasing the consumption of individuals through fiscal expansion due to increasing budget deficits and high public debts (Krugman, 2015: 1). Accordingly, in order to minimize the effects of the global crisis, austerity policies including mandatory reforms and spending cuts were suggested by Troika (European Central Banks, IMF and European Commission) (Monastiriotis, 2013: p. 1).
During crisis periods, the governments focus on subjects such as budgetary cuts, recession and competitive power. Therefore, the limitations applied on environment policies attract less attention when compared to the economic and political struggles in
0,020,040,060,080,0
100,0120,0
Energytaxes Transporttaxes Taxesonpollutionandresources

The Political Economy of Public Finance (Edited by: Mustafa Çelen, Özkan Zülküfoğlu, Elżbieta Robak)
59
aforementioned periods (Shiqiu, 2009: p. 1). Although it is difficult to present the change occurred in environment policies with the suggested austerity policies, it is possible to state that the austerity policies are in contradiction especially with environment policies (Tobin and Burns, 2015: p. 2).
Figure 7: EU-28 Total Environment Protection Expenses (million euro)
Source: Eurostat, 2017 Primarily cutting the public expenses are suggested in austerity policies. In accordance with this, the environment expenses are undoubtedly among the decreased public expenses. The total environment expenses of EU involve not only the public sector expenses but also the public-private sector initiatives, which are specialized in environmental services and the expenses only of the private sector. The greatest share of within the three expense units belongs to public-private sector initiatives, whereas the public sector is ranked as the second and the private sector is ranked at the third place (Eurostat, 2016: p. 4).
The share of environment protection expenses for EU-28 within GDP is presented on Figure 7. The share of governmental environment protection expenses within GDP was 0.62% in year 2004, the highest percentage was 0.75% in year 2009, 0.70% in year 2010 and 0.67% in year 2013. The absolute value of environment protection expenses

Onur Oğuz, Nadir Eroğlu (Income Inequality From the View of Institutional Economics: An Emprical Analysis Using Dynamic Panel Data)
60
carried out by the public sector 65 billion Euros in year 2004, 88 billion Euros in year 2009, 86 billion Euros in year 2010 and 87 billion Euros in year 2013. While the environment protection expense realized by public-private partnership, which have the greatest share in EU environment protection expenses, was 108 million Euros in year 2004 and 141 million Euros in year 2008, just after the crisis the amount fell to 133 million Euros in year 2009 and then reached to 144 million Euros in year 2013 (Eurostat, 2017).
Figure 8: The Share of EU-28 Environmental Taxes within GDP (%)
Source: Eurostat, 2017 Another austerity measure taken was the increase in the tax incomes. At this point, it is possible to state that the environment taxes increased at the level of EU-28. However, aforementioned increased may be caused by the increase in the returns of the environmental taxes as well as may also be caused by the increase in the prices of the goods and services that had to be imported during the crisis periods (Öz and Kutbay, 2016: p. 264). The share of the environmental taxes in within GDP in EU states followed a fluctuating course during the period of years 2002-2015 and aforementioned figure was at the level of 2.56% in year 2003 and fell to the level of 2.36% in year 2009,
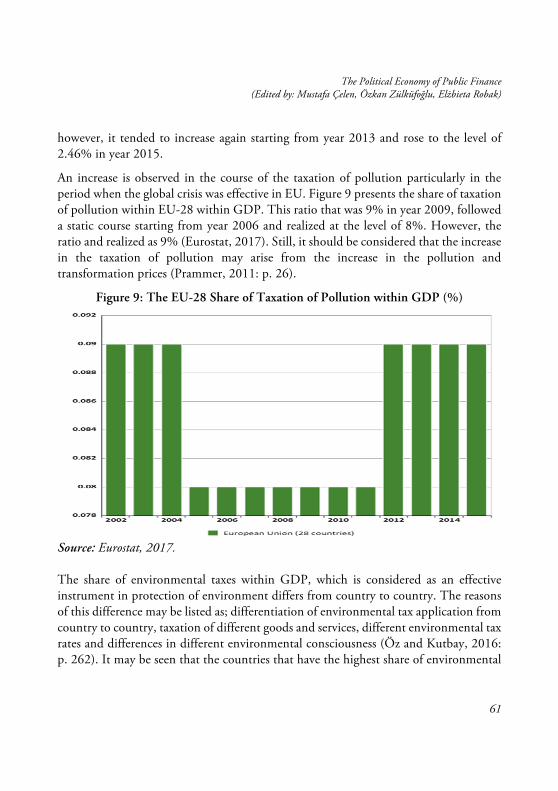
The Political Economy of Public Finance (Edited by: Mustafa Çelen, Özkan Zülküfoğlu, Elżbieta Robak)
61
however, it tended to increase again starting from year 2013 and rose to the level of 2.46% in year 2015.
An increase is observed in the course of the taxation of pollution particularly in the period when the global crisis was effective in EU. Figure 9 presents the share of taxation of pollution within EU-28 within GDP. This ratio that was 9% in year 2009, followed a static course starting from year 2006 and realized at the level of 8%. However, the ratio and realized as 9% (Eurostat, 2017). Still, it should be considered that the increase in the taxation of pollution may arise from the increase in the pollution and transformation prices (Prammer, 2011: p. 26).
Figure 9: The EU-28 Share of Taxation of Pollution within GDP (%)
Source: Eurostat, 2017. The share of environmental taxes within GDP, which is considered as an effective instrument in protection of environment differs from country to country. The reasons of this difference may be listed as; differentiation of environmental tax application from country to country, taxation of different goods and services, different environmental tax rates and differences in different environmental consciousness (Öz and Kutbay, 2016: p. 262). It may be seen that the countries that have the highest share of environmental
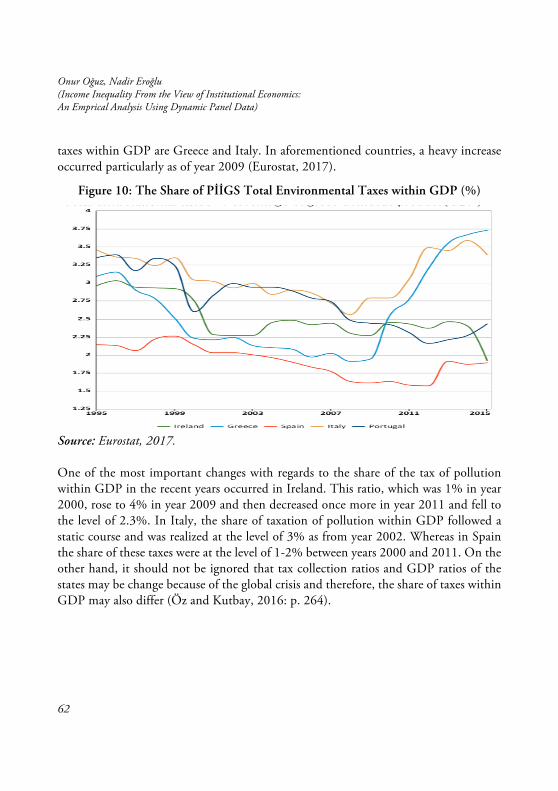
Onur Oğuz, Nadir Eroğlu (Income Inequality From the View of Institutional Economics: An Emprical Analysis Using Dynamic Panel Data)
62
taxes within GDP are Greece and Italy. In aforementioned countries, a heavy increase occurred particularly as of year 2009 (Eurostat, 2017).
Figure 10: The Share of PİİGS Total Environmental Taxes within GDP (%)
Source: Eurostat, 2017. One of the most important changes with regards to the share of the tax of pollution within GDP in the recent years occurred in Ireland. This ratio, which was 1% in year 2000, rose to 4% in year 2009 and then decreased once more in year 2011 and fell to the level of 2.3%. In Italy, the share of taxation of pollution within GDP followed a static course and was realized at the level of 3% as from year 2002. Whereas in Spain the share of these taxes were at the level of 1-2% between years 2000 and 2011. On the other hand, it should not be ignored that tax collection ratios and GDP ratios of the states may be change because of the global crisis and therefore, the share of taxes within GDP may also differ (Öz and Kutbay, 2016: p. 264).

The Political Economy of Public Finance (Edited by: Mustafa Çelen, Özkan Zülküfoğlu, Elżbieta Robak)
63
Figure 11: The Share of Taxation of Pollution within GDP in Spain, Ireland and Italy (%)
Source: Eurostat, 2017 The reason why the global crisis proceeded as a debt crisis in Europe, was observed in Greece, who had a high level of public debt, in the beginning (Gros and Mayer, 2010: p. 1). In consequence of the austerity measures carried into effect, the environment policies of Greece underwent a change significantly. Correspondingly, it is claimed that serious deductions were applied to the finance of environment policies (Eder and Kousis, 2001: p. 9). On the other hand, the environment protection expenses concerning Greece and inability to reach to date regarding the environmental taxes, makes it difficult to make a healthy analysis. However, it is possible to state that the austerity policies sabotage the progress Greece make in the environment policies on one hand, and also contradict with the priorities of EU regarding the subject of environment on the other hand. Usage of products spreading pollution as a substitution for oil based on the increase in the oil prices may be given as an example (Lekasis and Kousis, 2013: p. 305).
When Figure 12 is examined, it is possible to see that the oil consumption decreases in Greece, in accordance with the increase in the oil prices. Although it may be considered that this progress has a positive effect on environment, what happens in real life is the

Onur Oğuz, Nadir Eroğlu (Income Inequality From the View of Institutional Economics: An Emprical Analysis Using Dynamic Panel Data)
64
fact that individuals turn towards sources that are damaging environment because of the increase in the oil prices (Lekasis and Kousis, 2013: p. 305). Approximately threefold increase in the oil prices due to the high taxation during the global financial crisis, directed Greek citizens to use different resources for heating. As a result of the high oil prices, illegal wood chopping increased either in rural regions or in natural reserve areas such as national parks (Reuters, 2013: p. 1).
Figure 12: Oil Prices ($) and Per Person Consumed Oil Consumption in Greece
Source: Tverberg, 2013: p. 1 The global financial crisis was reflected on European Union generally since May, 2010, when the first bailout package for Greece was adopted. Although the reasons and effects of the financial crisis differ from country to country, the measures presented as a recovery formula comprised programs such as budgetary cuts, abolition of environmental regulations and downsizing of public management regarding environment. In this context, it is possible to list the negative effects of the global crisis on environment policies as follows. First, environmental expenses were cut down and less funds were transferred regarding environment by the public sector. Second, during the crisis period, due to the increasing costs, the environment policies that were on the
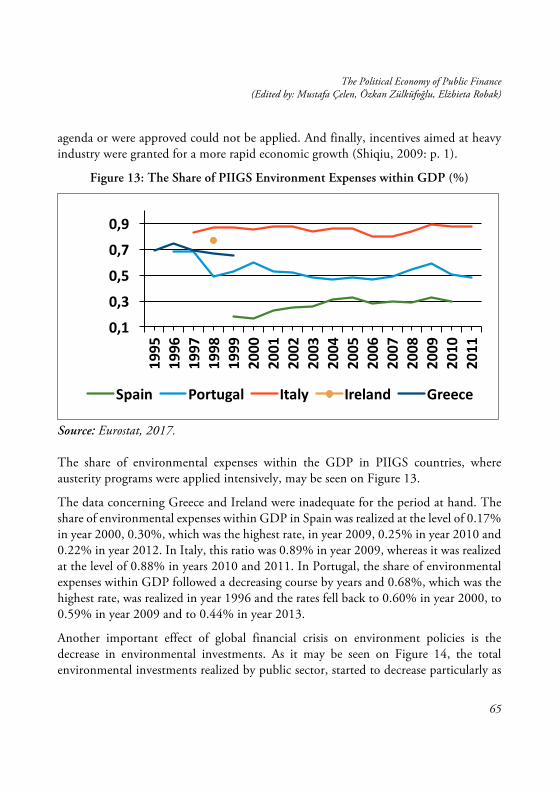
The Political Economy of Public Finance (Edited by: Mustafa Çelen, Özkan Zülküfoğlu, Elżbieta Robak)
65
agenda or were approved could not be applied. And finally, incentives aimed at heavy industry were granted for a more rapid economic growth (Shiqiu, 2009: p. 1).
Figure 13: The Share of PIIGS Environment Expenses within GDP (%)
Source: Eurostat, 2017. The share of environmental expenses within the GDP in PIIGS countries, where austerity programs were applied intensively, may be seen on Figure 13.
The data concerning Greece and Ireland were inadequate for the period at hand. The share of environmental expenses within GDP in Spain was realized at the level of 0.17% in year 2000, 0.30%, which was the highest rate, in year 2009, 0.25% in year 2010 and 0.22% in year 2012. In Italy, this ratio was 0.89% in year 2009, whereas it was realized at the level of 0.88% in years 2010 and 2011. In Portugal, the share of environmental expenses within GDP followed a decreasing course by years and 0.68%, which was the highest rate, was realized in year 1996 and the rates fell back to 0.60% in year 2000, to 0.59% in year 2009 and to 0.44% in year 2013.
Another important effect of global financial crisis on environment policies is the decrease in environmental investments. As it may be seen on Figure 14, the total environmental investments realized by public sector, started to decrease particularly as
0,1
0,3
0,5
0,7
0,9
1995
1996
1997
1998
1999
2000
2001
2002
2003
2004
2005
2006
2007
2008
2009
2010
2011
Spain Portugal Italy Ireland Greece
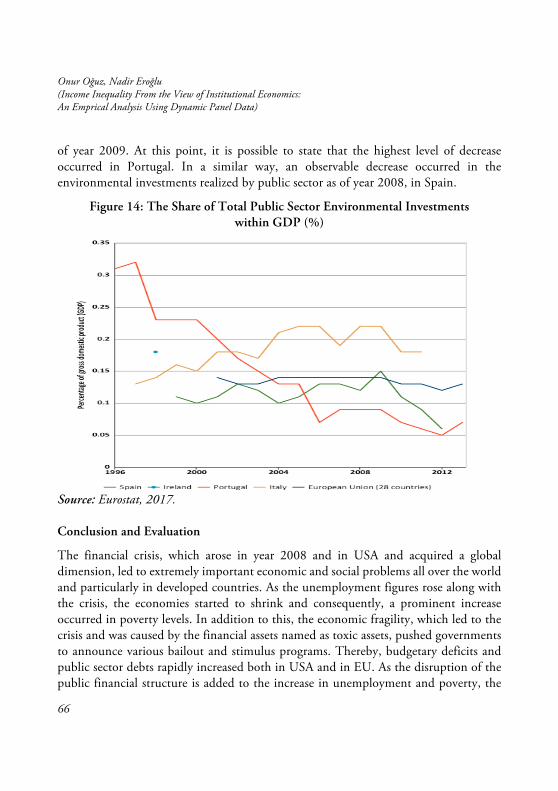
Onur Oğuz, Nadir Eroğlu (Income Inequality From the View of Institutional Economics: An Emprical Analysis Using Dynamic Panel Data)
66
of year 2009. At this point, it is possible to state that the highest level of decrease occurred in Portugal. In a similar way, an observable decrease occurred in the environmental investments realized by public sector as of year 2008, in Spain.
Figure 14: The Share of Total Public Sector Environmental Investments within GDP (%)
Source: Eurostat, 2017. Conclusion and Evaluation
The financial crisis, which arose in year 2008 and in USA and acquired a global dimension, led to extremely important economic and social problems all over the world and particularly in developed countries. As the unemployment figures rose along with the crisis, the economies started to shrink and consequently, a prominent increase occurred in poverty levels. In addition to this, the economic fragility, which led to the crisis and was caused by the financial assets named as toxic assets, pushed governments to announce various bailout and stimulus programs. Thereby, budgetary deficits and public sector debts rapidly increased both in USA and in EU. As the disruption of the public financial structure is added to the increase in unemployment and poverty, the

The Political Economy of Public Finance (Edited by: Mustafa Çelen, Özkan Zülküfoğlu, Elżbieta Robak)
67
spheres of interest of governments and international institutions started to turn towards economic and financial issues. Within this period, issues such as environment became subjects that were attributed relatively less importance. This change is so distinct that the ecological problems became overshadowed by financial and social issues even in EU, which is considered to have one of the best environmental standards in the world.
In times of financial crisis, often environmental protection is seen as a luxury. But, it should be the exact opposite. Citizens/politicians/policy makers aim short-term profit maximization. In the financial crises, politicians and policy makers push aside the environmental policy because of austerity and unfortunately citizens too. In the Greece increase in the oil prices due to the high taxation during the global financial crisis, directed Greek citizens to use different resources for heating. As a result of the high oil prices, illegal wood chopping increased either in rural regions or in natural reserve areas such as national parks.
The aggravation as a result of the crisis, led to the increase in consumption of cheap but poor quality products that are hazardous for environment in EU states, which were affected the most from the crisis such as Greece, also accelerated the destruction of nature. In addition to this, with the efforts to put the austerity policies into practice in countries having economic and financial difficulties and particularly in Southern European countries such as Greece, Spain and Portugal, maintaining the environmental standards started to have secondary importance.
But the financial crises – especially debt crises- go on in the EU, the environmental policy is seen luxury. In the consequence, it may be stated that the effect of crisis on EU environmental standards occurred in two dimensions: One of them environmental problems having secondary importance on the basis of government.
Another issue that should be improved is concerning the public awareness. Although efforts have been made to raise public awareness on environmental issues, lack of familiarity with the concepts of sustainable development still acts as an obstacle for successful policy implementation.
References
Amadeo, K. (2017). TARP Bailout Program: Did TARP Help You or the Banks?. Retrieved May 7, 2017, from https://www.thebalance.com/tarp-bailout-program-3305895.
Onur Oğuz, Nadir Eroğlu (Income Inequality From the View of Institutional Economics: An Emprical Analysis Using Dynamic Panel Data)
68
Bai, L. (2012). Effects of Global Financial Crisis on Chinese Export: A Gravity Model Study. Retrieved May 12, 2017, from http://www.diva-portal.org/smash/get/diva2:531192/FULLTEXT02.
Bibow, J. (2010). Financialization of the U.S. Household Sector: The “Subprime Mortgage Crisis” in U.S. and Global Perspective. IMK Study. No. 3/2010.
Blinder, A. S. and Zandi, M. (2010). How the Great Recession was Brought to an End. Retrieved May 9, 2017, from https://www.economy.com/mark-zandi/documents/End-of-Great-Recession.pdf.
Brown, M., Haughwout, A., Lee, D. and Van der Klaauw, W. (2010). The Financial Crisis at the Kitchen Table: Trends in Household Debt and Credit. Federal Reserve Bank of New York Staff Reports No. 480.
Buchanan, B. G. (2017). The Way we Live Now: Financialization and Securitization. Research in International Business and Finance, 39, 663-677.
Chmelar, A. (2013). Household Debt and the European Crisis. The European Credit Research Institute Report No. 13.
De Beer, P. (2012). The Impact of the Crisis on Earnings and Income Distribution in the EU. European Trade Union Institute Working Paper No. 2012. 01.
DeLong, J. B. and Magin, K. (2006). A Short Note on the Size of the Dot-Com Bubble. NBER Working Paper No. 12011.
Dennis, K. (2009), The Ratings Game: Explaining Rating Agency Failures in The Build Up to the Financial Crisis. Universıty of Miami Law Revıew, 63, 1111-1150.
Duiella, M. and Turrini, A. (2014). Poverty Developments in the EU after the Crisis: A Look at Main Drivers. European Commission ECFIN Economic Briefs, Issue. 31.
Earth Policy Institute (2015). Climate, Energy and Transportation Data. Retrieved May 10, 2017, from http://www.earth-policy.org/data_center/C23.
Eder, K. and Kousis, M. (2001). Environmental Politics in Southern Europe: Actors, Institutions and Discourses in a Europeanizing Society. Dordrecht: Kluwer Academic Publishers.
European Union (2009). EU Sustainable Development Strategy. Retrieved May 10, 2017, from http://eur-lex.europa.eu/legal-content/EN/TXT/HTML/?uri=CELEX:52009DC0400&from=EN.
European Union (2015). The 2030 Agenda for Sustainable Development and the SDGs. Retrieved May 10, 2017, from http://ec.europa.eu/environment/sustainable-development/SDGs/index_en.htm.
The Political Economy of Public Finance (Edited by: Mustafa Çelen, Özkan Zülküfoğlu, Elżbieta Robak)
69
European Union (2017). How is the EU Budget Spent?. Retrieved May 11, 2017, from https://europa.eu/european-union/about-eu/money/expenditure_en.
Eurostat (2016). Environmental Protection Expenditure Accounts. Retrieved May 11, 2017, from http://ec.europa.eu/eurostat/statistics-explained/index.php/Environmental_protection_expenditure_accounts.
Eurostat (2017). Environmental Tax Statistics. Retrieved May 11, 2017, from http://ec.europa.eu/eurostat/statistics-explained/index.php/Environmental_tax_statistics.
Fazi, T. (2016). How Austerity Has Crippled The European Economy-In Numbers. Retrieved May 9, 2017, from https://www.socialeurope.eu/2016/03/austerity-crippled-european-economy-numbers/.
Gardiner, R. and Le Goulven, K. (2002). Sustaining Our Global Public Goods. Retrieved May 10, 2017, from http://www.worldsummit2002.de/downloads/Globalpublicgoods.pdf.
Geels, F. W. (2013). The Impact of the Financial-Economic Crisis on Sustainability Transitions: Financial Investment, Governance and Public Discourse. European Commission Research Area Working Paper No. 39.
Girón, A. and Chapoy, A. (2012). Securitization and Financialization. Journal of Post Keynesian Economics, 35(2), 171-186.
Gravey, V. (2014). Austerity at EU Level? How the Crisis Impacted EU Budget And Policies. Political Perspectives, 8(2), 1-19.
Gros, D. and Aleidi, C. (2010). The Impact of the Financial Crisis on the Real Economy. Intereconomics, 1, 4-10.
Gros, D. and Mayer, T. (2010). Towards a European Monetary Fund. Centre for European Policy Studies Policy Brief No. 202.
Harris, J. M. (2000). Basic Principles of Sustainable Development. Global Development and Environment Institute Working Paper No. 00-04.
Heal, G. (1998). New Strategies for the Provision of Global Public Goods: Learning from International Environmental Challenges. Columbia Business School Working Paper No. 98-11.
IMF (2017). World Economic Outlook Databases (WEO). Retrieved May 5, 2017, from http://www.imf.org/external/ns/cs.aspx?id=28.
International Institute for Labour Studies (2011). A Review of Global Fiscal Stimulus. EC-IILS Joint Discussion Paper Series No. 5.
Onur Oğuz, Nadir Eroğlu (Income Inequality From the View of Institutional Economics: An Emprical Analysis Using Dynamic Panel Data)
70
International Trade Centre (2017). List of Exporters for the Selected Product. Retrieved May 6, 2017, from http://www.trademap.org/tradestat/Country_SelProduct_TS.aspx?nvpm=1|||||TOTAL|||2|1|1|2|2|1|2|5|1.
Junankar, R. (2014). The Impact of the Global Financial Crisis on Youth Labour Markets. IZA Discussion Paper No. 8400.
Kates, R. W., Parris, T. M. and Leiserowitz, A. A. (2005). What is Sustainable Development? Goals, Indicators, Values and Practıce. Environment, 47(3), 10-21.
Kemp, D. D. (2004), Exploring Environmental Issues: An Integrated Approach, London: Routledge.
Krugman, P. (2015). The Case for Cuts was A Lie: Why does Britain Still Believe it? The Austerity Delusion. The Guardian, April 29, 2015.
Lane, P. R. (2012). The European Sovereign Debt Crisis. Journal of Economic Perspectives, 26(3), 49-68.
Lecerf, M. (2016). Poverty in the European Union: The Crisis and its Aftermath. Retrieved May 9, 2017, from http://www.europarl.europa.eu/RegData/etudes/IDAN/2016/579099/EPRS_IDA(2016)579099_EN.pdf.
Lekakis, N. J. and Kousis, M. (2013). Economic Crisis, Troika and the Environment in Greece. South European Society and Politics, 18(3), 305-331.
Marks, J. (2016). The 6 Most Pressing Environmental Issues and What You Can Do to Help Solve Them. Retrieved May 10, 2017, from http://inhabitat.com/top-6-environmental-issues-for-earth-day-and-what-you-can-do-to-solve-them/.
Maurer, H. and Grussenmeyer, P. (2015). Financial Assistance Measures in the Euro Area from 2008 to 2013: Statistical Framework and Fiscal Impact. European Central Bank Working Paper No. 7.
Meyn, M. and Kennan, J. (2009). The Implications of the Global Financial Crisis for Developing Countries’ Export Volumes and Values. Overseas Development Institute Working Paper No. 305.
Monastiriotis, V. (2013). Austerity Measures In Crisis Countries: Results And Impact On Mid-Term Development. Intereconomics, 48(1), 3-32.
OECD (2011). Economic Outlook No. 90. Paris: OECD. OECD (2014). Economic Outlook No. 95. Paris: OECD.
The Political Economy of Public Finance (Edited by: Mustafa Çelen, Özkan Zülküfoğlu, Elżbieta Robak)
71
OECD (2016). General Government Debt Data. Retrieved May 9, 2017, from https://data.oecd.org/gga/general-government-debt.htm.
OECD (2017). Short-Term Labour Market Statistics: Harmonised Unemployment Rates (HURs). Retrieved May 5, 2017, from http://stats.oecd.org/index.aspx?queryid=36324.
Ofek, E. and Richardson, M. (2003). DotCom Mania: The Rise and Fall of Internet Stock Prices. The Journal of Finance, 58(3), 1113-1137.
OXFAM (2013). The True Cost of Austerity and Inequality: UK Case Study. Retrieved May 9, 2017, from https://www.oxfam.org/sites/www.oxfam.org/files/cs-true-cost-austerity-inequality-uk-120913-en.pdf.
Öz, E. ve Kutbay, H. (2016). Ekolojik Vergileme: Seçilmiş Bazı Dünya Ülkeleri ile Türkiye Verilerinin Karşılaştırılması. Eskişehir Osmangazi Üniversitesi İİBF Dergisi, 11(1), 247- 271.
Pinedo, A. T. (2009). Removing Toxic Assets from Balance Sheets: Structures Based on the Good Bank-Bad Bank Model. Journal of Securities Law, Regulation & Compliance, 2(4), 289-309.
Prammer, D. (2011). Qualıty Of Taxatıon and the Crısıs: Tax Shıfts from a Growth Perspectıve. European Commission Directorate-General for Taxation and Customs Union Working Paper No. 29.
Prins, N. (2009). It Takes a Pillage: Behind the Bailouts, Bonuses, and Backroom Deals from Washington to Wall Street. New Jersey: John Wiley & Sons.
Reuters (2013). Greeks Forgo Winter Heating After Jump in Fuel Tax. Retrieved May 28, 2017, from http://www.reuters.com/article/us-greece-fuel-idUSBRE9160R220130207.
Saha, D. and Von Weizsäcker, J. (2009). Estimating the size of the European Stimulus Packages for 2009: An Update. Retrieved May 9, 2017, from http://aei.pitt.edu/10549/1/UPDATED-SIZE-OF-STIMULUS-FINAL.pdf.
Schäfer, D. and Zimmermann, K. F. (2009). Bad Bank(s) and the Recapitalisation of the Banking Sector. Intereconomics, 44(4), 215-225.
Scheuer, S. (2006). Executive Summary. S. Scheuer, (Ed.), in EU Environmental Policy Handbook: A Critical Analysis of EU Environmental Legislation. Brussels: European Environmental Bureau.
Sherman, M. (2009). A Short History of Financial Deregulation in the United States. Washington D.C: Center for Economic and Policy Research.

Onur Oğuz, Nadir Eroğlu (Income Inequality From the View of Institutional Economics: An Emprical Analysis Using Dynamic Panel Data)
72
Shull, B. (2010). Too Big to Fail in Financial Crisis: Motives, Countermeasures, and Prospects. Levy Economics Institute Working Paper No. 601.
Strange, T. and Bayley, A. (2008). Sustainable Development: Linking Economy, Society, Environment. Paris: OECD.
Shique, Z. (2009). The Environmental Impact Of The Financial Crises: Challenges and Opportunities. Retrieved May 4, 2017, from http://carnegieendowment.org/2009/04/11/environmental-impact-of-financial-crisis-challenges-and-opportunities-event-1328.
Thomson Reuters (2013). EU Bank Bailout Breakdown-How 1.6 Trillion Euros were Allocated. Retrieved May 8, 2017, from https://blogs.thomsonreuters.com/answerson/eu-bank-bailout-trillion-euros-allocated-graphic/.
Tichy, G. (2012). The Sovereign Debt Crisis: Causes and Consequences. Austrian Economic Quarterly, 2, 95-107.
Tobin, P. and Burns, C. (2015). Measuring the Impact of Austerity on European Environmental Policy. Political Studies Association Conference. March, 30-April, 1. Sheffield.
Tverberg, G. (2013). High Oil Prices Starting to Affect China and India. Retrieved May 8, 2017, from http://www.theenergycollective.com/gail-tverberg/235156/high-oil-prices-are-starting-affect-china-and-india.
UNIDO (2008). Public Goods for Economic Development. Vienna: United Nations Industrial Development Organization.
Verick, S. and Islam, I. (2010). The Great Recession of 2008-2009: Causes, Consequences and Policy Responses. IZA Discussion Paper No. 4934.
Webel, B. (2013). Troubled Asset Relief Program (TARP): Implementation and Status. Retrieved May 7, 2017, from https://fas.org/sgp/crs/misc/R41427.pdf.
Worldbank (2009). Impact of the Financial Crisis on Employment. Retrieved May 12, 2017, from http://web.worldbank.org/WBSITE/EXTERNAL/NEWS/0,,contentMDK:21039894~menuPK:34480~pagePK:116743~piPK:36693~theSitePK:4607,00.html.
Wren-Lewis, S. (2016). The Financial Crisis, Austerity and the Drift from the Centre. Retrieved May 9, 2017, from https://mainlymacro.blogspot.com.tr/2016/04/the-financial-crisis-austerity-and.html

The Political Economy of Public Finance (Edited by: Mustafa Çelen, Özkan Zülküfoğlu, Elżbieta Robak)
73
Turkish Regional Development Agencies and Evolution of Regional Disparities in Turkey
Cihan Kızıl Abstract
Drawing on regional data, this study aims to answer how regional disparities change over time and evaluate if there is any distinct and positive convergence among regions following the establishment of regional development agencies in Turkey. Even though development agencies are founded within the scope of the policy of reducing the development gap among regions, it is observed that only a few less developed regions manage to converge to relatively developed regions during the investigated period of time. Moreover, the analysis results show that intra-regional differences become more apparent in some regions. Regional development agencies cannot be considered the sole factor in this situation, however, it is also clear that these agencies have not been able to provide sufficient indication for that they are a remedy for regional inequalities.
Keywords: Regional development, development agencies, regional disparities, income differences, regional policy
Introduction
eographical, cultural and historical differences are influential on regional inequalities in Turkey, and such inequalities exist in all countries. Generally, people tend to disregard these inequalities until they start to constitute a
3
G

Cihan Kızıl (Turkish Regional Development Agencies and Evolution of Regional Disparities in Turkey)
74
significant problem across the country. Even though neo-classical economists argue that economical differences will eventually disappear, observations show us that these differences are not self-correcting and require a state intervention.
In the context of international competition, the emergence of regional imbalances is one of the common problems faced by both developed and developing countries and these imbalances play an important role in the occurrence of social, cultural, political and economic issues. As a country where regional inequalities are clearly apparent, Turkey suffers from significant problems such as terrorism and social unrest. In order to solve some of these issues, Turkish authorities have recently started to put more emphasis on regional policies as part of the EU accession process. Especially after the establishment of the State Planning Organization (SPO)1, a few regional plans have been implemented to develop some regions economically. However, regional institutions are not considered necessary by Turkish authorities to mobilize local resources and to coordinate economic activities before it becomes an obligation enforced by EU regulations.
Turkey is divided into 26 NUTS level-2 regions, and development agencies are established in each of these regions with a main objective to reduce both inter-regional and intra-regional disparities. Considering that Turkey has some issues related to regional differences, the objective of regional development agencies (RDAs) and implemented regional policies have great importance. Even though many aspects of Turkish development agencies have been reviewed by researchers, we have too little information about whether they make a significant difference in reducing regional imbalances.
This paper aims to add more information to the literature of regional development and attempts to find out if regional disparities are reduced following the establishment of development agencies in Turkey. Since RDA’s have not existed long enough, it is not appropriate to make an efficiency analysis. Likewise, we do not attempt to find their actual impact econometrically considering numerous exogenous factors affecting regional inequalities in Turkey. Yet, we should observe an improvement in regional
1 In Turkish: Devlet Planlama Teşkilatı (DPT).

The Political Economy of Public Finance (Edited by: Mustafa Çelen, Özkan Zülküfoğlu, Elżbieta Robak)
75
disparities or at least an indication of further improvement considering that there are great expectations from RDA’s in Turkey, and their main objective is to reduce both inter-regional and intra-regional disparities. To answer the question of whether regional disparities are reduced, a socio-economic development index has been constructed between 2004 and 2014. Index scores provide us detailed information on the evolution of regional disparities and give us a chance to observe if there is any distinct and positive impact of development agencies in Turkey during the investigated period of time.
The rest of the paper is organized as follows: Section 2 discusses the NUTS classification and statistical regions of Turkey. Section 3 gives background information on regional development agencies. The data and principal component analysis which is performed in this study are presented in Section 4. Analysis findings are provided in Section 5. In the last section, the main conclusions of the paper are summarized.
1.The NUTS Classification and Statistical Regions of Turkey
The Nomenclature of Territorial Units for Statistics, abbreviated as NUTS (from the French version Nomenclature des Unités territoriales statistiques, also known as Classification of Territorial Units for Statistics) is a hierarchical system for dividing up the economic territory of the European Union (EU) into regions at three different levels. At the beginning of the 1970’s, the NUTS classification was introduced by Eurostat in order to produce harmonised regional statistics for the EU, and it provided a basis for the implementation of European regional policies.
The EU shows a commitment to reduce economic imbalances within the Union, and as an important part of the European integration and cohesion process, the same commitment is expected from the candidate countries including Turkey. Driven by the accession process, Turkey started to apply the NUTS classification in 2002, after the European Commission had approved the proposal of Turkey for the classification of regional units for statistical purposes (Eurostat, 2002, p. 145). By Decision of Council of Ministers No: 2002/4720, each of the Turkish provinces were defined as NUTS level-3 regions, and Turkish territory was classified into 26 NUTS level-2 regions by grouping provinces. Similarly, Turkey was divided into 12 NUTS level-1 regions by grouping level-2 regions.

Cihan Kızıl (Turkish Regional Development Agencies and Evolution of Regional Disparities in Turkey)
76
Defining NUTS level-2 regions was an especially important move for Turkey because it is at this level that European Structural Funds are implemented. Following Turkey’s statistical purposes to align itself with the EU, a National Development Plan was prepared by SPO, outlining the main priority axes and those targeted as “priority regions” for development. These first steps also led the creation of new structures at the regional level, with the longer term view of setting up RDAs in each of the NUTS level-2 regions (Reeves, 2006, p. 35).
Map 1: NUTS level-2 regions and provinces they cover
Map 1 shows the NUTS level-2 regions of Turkey and the provinces they cover. As is evident, three provinces (İstanbul, Ankara and İzmir) appear at level-2 as well2. According to the NUTS classification, regions receive different codes at the different levels even if the regions concerned cover identical territory (Eurostat, 2011, p. 5). Thus, İstanbul receives TR10 region code at level-2, Ankara TR51, and İzmir TR31 while they receive TR100, TR510 and TR310 region codes at level-3, respectively.
2 Istanbul appears at NUTS level 1, 2, and 3.

The Political Economy of Public Finance (Edited by: Mustafa Çelen, Özkan Zülküfoğlu, Elżbieta Robak)
77
2.Regional Development Agencies
There is no common understanding of what a development agency is even though development agencies are popular tools to shape and implement regional policies in our days. They vary in size, scale, and function and have arisen from different starting points. The first development agencies in Europe were founded after the Second World War in order to redevelop damaged sites and promote economic activities. In the 1960s and 1970s, another wave of development agencies appeared in North America to address the impact of de-industrialisation. In the 1980s and 1990s, the first Asian development agencies were established in many parts of East Asia, to help plan and manage rapid urbanisation and industrialisation. In the current era, new development agencies have been established in Latin America, South Asia, Africa and Eastern Europe to accelerate economic development. There has also been a continued process of re-inventing and updating the role of existing development agencies (Mountford, 2009, pp. 2-3).
As previously mentioned, Turkey is divided into 26 NUTS level-2 regions, and development agencies are established in each of these regions. Turkish RDAs exist to implement the regional strategies, to support local economic activities, to ensure sustainable growth and to alleviate regional inequalities in general terms. The Turkish government allocates significant funds to RDAs to achieve these goals. For instance, the total realized income of Turkish development agencies in 2014 is 724.2 million Turkish liras and this indicates how large amounts go to the expense of reducing regional disparities through RDAs (Ministry of Development, 2015, p. 23).
Turkey began to establish RDAs in 2000s because it was one of the necessary regulations of European accession process. Even though the establishment of these institutions was enforced by EU, these agencies were adopted by Turkish authorities in a short time. Each year, more than one thousand projects are supported by RDAs and these agencies use a variety of support mechanisms to enable regional development. However, the question of how the funds to support these projects are distributed arises since Turkey's populist and tumultuous political scene often means funds are distributed erratically rather than logically. It can be even argued that RDAs are just another way of distributing funds with populist motivations. If that’s the case, it is highly possible that the expected outcomes do not occur and regional disparities are not reduced as desired.
Cihan Kızıl (Turkish Regional Development Agencies and Evolution of Regional Disparities in Turkey)
78
3.The Data and Principal Component Analysis
In Turkey, there are various index calculation efforts published by public institutions, private organizations or researchers. The most prominent of these studies are SEGE-2003 prepared by SPO, SEGE-2011 as replicated by Ministry of Development, IGE-2010 and IGE-2012 published by İş Bank. Unfortunately, these extensive studies do not provide time-series data and therefore fail to provide us with sufficient information on the development trend of these cities since their main objective is to rank cities by their levels of development. In addition, even if these studies are conducted by the same institution, they cannot be compared with each other due to their usage of different weights and variables (Kızıl, 2016, p. 34). In this study, the same weights and variables are used for each year to build a regional development index which enables us to compare values between the years 2004 and 2014. Kızıl (2016) also uses the same methodology to build an index to compare development trends of 26 NUTS level-2 regions. However, the index which is calculated here will be able to give us more details because it is possible to perform the same analysis at the provincial level since income variables of NUTS level-3 regions are started to be published.
Since development indicates not only an increase in income but an improvement in quality of life, several economic and social variables are used in order to measure the development level of NUTS level-3 regions. These variables and their sources are summarized in Table 1. Some variables which may be considered as important criteria to measure the development level (such as infant mortality rate, net migration, and key labour market indicators) had to be excluded due to problems3 in data sets.
As Turkish provinces diverge from each other both geographically and demographically, all values belonging to the provinces are normalized by their population except teacher/student ratio. A standardization is also performed due to differences in units and variances. As a result of this standardization process, variables receive values varying between 0 and 100.4
3 For example: deficiency and/or inconsistency in data. 4 For more detailed information on standardization, please refer to Kızıl (2016).

The Political Economy of Public Finance (Edited by: Mustafa Çelen, Özkan Zülküfoğlu, Elżbieta Robak)
79
Table 1: Index variables and their sources
Economic and Social Variables Data Source
GDP TurkStat
Import Ministry of Economy
Export Ministry of Economy
Cars TurkStat
Residences TurkStat
Deposits The Banks Association of Turkey
Theatre and Cinema Audiences TurkStat
Elementary School Teacher/Student Ratio TurkStat
Secondary School Teacher/Student Ratio TurkStat
Hospital Beds TurkStat
Doctors and Dentists TurkStat
Petty Patents & Patents Turkish Patent Institute
Industrial Designs Turkish Patent Institute
Power Consumption TurkStat
The main idea of principal component analysis (PCA) is to reduce the number of dimensions without a significant loss of information. The simplest way of reducing the dimensionality is to take just one element of the observed vector and to disregard all others. However, this is not a very reasonable approach since one variable may not have adequate power to represent the whole. Alternatively, we may also weigh all variables equally. This again is undesirable because equal weights mean that all of the elements have equal importance. A more flexible and logical approach is to find a weighted average which retains the majority of the variance in the data. (Hardle & Simar, 2007, pp. 215-216). This is where we use a popular dimension reduction method, namely PCA. This statistical procedure reduces the dimension of a data set consisting of a large number of correlated variables by transforming them into a new set of uncorrelated variables. These new variables are called principal components and these components

Cihan Kızıl (Turkish Regional Development Agencies and Evolution of Regional Disparities in Turkey)
80
are ordered so that the first few capture most of the variation present in the entire original data set (Jolliffe, 2002, p. 1).5
Table 2: Weights of index variables
Economic and Social Variables Weights
GDP 0.351
Import 0.172
Export 0.211
Cars 0.351
Residences 0.320
Deposits 0.253
Theatre and Cinema Audiences 0.381
Elementary School Teacher/Student Ratio 0.245
Secondary School Teacher/Student Ratio 0.104
Hospital Beds 0.200
Doctors and Dentists 0.227
Petty Patents & Patents 0.300
Industrial Designs 0.224
Power Consumption 0.255
The principal components are determined as the weighted linear combinations of the original variables and the first component accounts for the largest variance. If the percentage of variance explained by the first component gives an adequate
5 Because this paper does not intend to provide a mathematical background, reader may refer to Jolliffe (2002) for more detailed information on the methodology of PCA.

The Political Economy of Public Finance (Edited by: Mustafa Çelen, Özkan Zülküfoğlu, Elżbieta Robak)
81
representation of the data6, we may replace original multidimensional variables with only one component. Thus, we are able to comprehend and examine a complex data set easily. When one desires to construct an index, PCA can be performed to obtain the weights for this index calculation.
In this study, the average of the values belonging to the 11 year period between 2004 and 2014 are used to create another data set, and then principal component analysis is performed to obtain the weights for the regional development index. Table 2 shows the index variables and their weights. The regional development index is generated by using these weights and 14 socio-economic criteria. In the PCA we performed, the first component explains 49.4% of the variance alone. In similar reports released by İş Bank, this rate was 41.6% in İGE (2010) and 46.78% in İGE (2012). In SPO’s SEGE (2003) and the Ministry of Development’s SEGE (2011) reports, this rate was 46.38% and 38.23%, respectively (İş Bank, 2010; İş Bank, 2012; SPO, 2003; Ministry of Development, 2011).
4.Analysis Findings
Index scores of 81 NUTS level-3 regions are summarized in Appendix 1. According to this regional development index, the ten most developed provinces in 2004 are Ankara, İstanbul, İzmir, Bursa, Eskişehir, Antalya, Kocaeli, Yalova, Isparta and Muğla, respectively. In 2014, İstanbul, Ankara, Eskişehir, Kocaeli, Bursa, İzmir, Denizli, Kayseri, Yalova and Antalya take the top ten places. Between the years 2004 and 2014, Istanbul shows a better performance than Ankara and takes the first place. Another striking change belongs to Izmir. Izmir takes the 3rd place in 2004, but in 10 years, it drops three places in rank.
The least developed provinces in 2004 are Şırnak, Ağrı, Hakkâri, Muş, Mardin, Siirt, Iğdır, Van, Bitlis and Kars. In 2014, Şırnak, Ağrı, Hakkâri, Muş, Van, Siirt, Bitlis, Şanlıurfa, Mardin and Batman take the last ten places. As is readily apparent, the four least developed provinces (Şırnak, Ağrı, Hakkâri, Muş) and their rankings do not change in the 11 year period. Şanlıurfa and Batman show relatively worse performances
6 Usually, a ratio above 70% is preferred, but much smaller ratios are considered adequate in social studies.
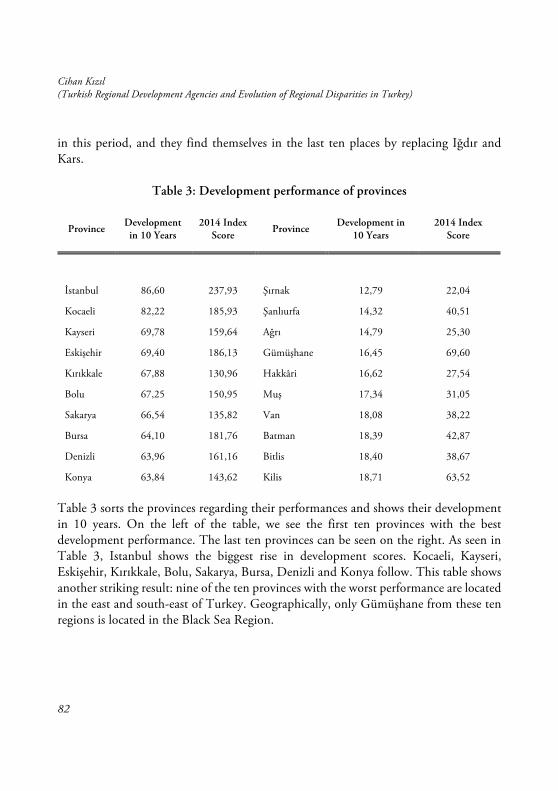
Cihan Kızıl (Turkish Regional Development Agencies and Evolution of Regional Disparities in Turkey)
82
in this period, and they find themselves in the last ten places by replacing Iğdır and Kars.
Table 3: Development performance of provinces
Table 3 sorts the provinces regarding their performances and shows their development in 10 years. On the left of the table, we see the first ten provinces with the best development performance. The last ten provinces can be seen on the right. As seen in Table 3, Istanbul shows the biggest rise in development scores. Kocaeli, Kayseri, Eskişehir, Kırıkkale, Bolu, Sakarya, Bursa, Denizli and Konya follow. This table shows another striking result: nine of the ten provinces with the worst performance are located in the east and south-east of Turkey. Geographically, only Gümüşhane from these ten regions is located in the Black Sea Region.
Province Development in 10 Years
2014 Index Score
Province Development in
10 Years 2014 Index
Score
İstanbul 86,60 237,93 Şırnak 12,79 22,04
Kocaeli 82,22 185,93 Şanlıurfa 14,32 40,51
Kayseri 69,78 159,64 Ağrı 14,79 25,30
Eskişehir 69,40 186,13 Gümüşhane 16,45 69,60
Kırıkkale 67,88 130,96 Hakkâri 16,62 27,54
Bolu 67,25 150,95 Muş 17,34 31,05
Sakarya 66,54 135,82 Van 18,08 38,22
Bursa 64,10 181,76 Batman 18,39 42,87
Denizli 63,96 161,16 Bitlis 18,40 38,67
Konya 63,84 143,62 Kilis 18,71 63,52
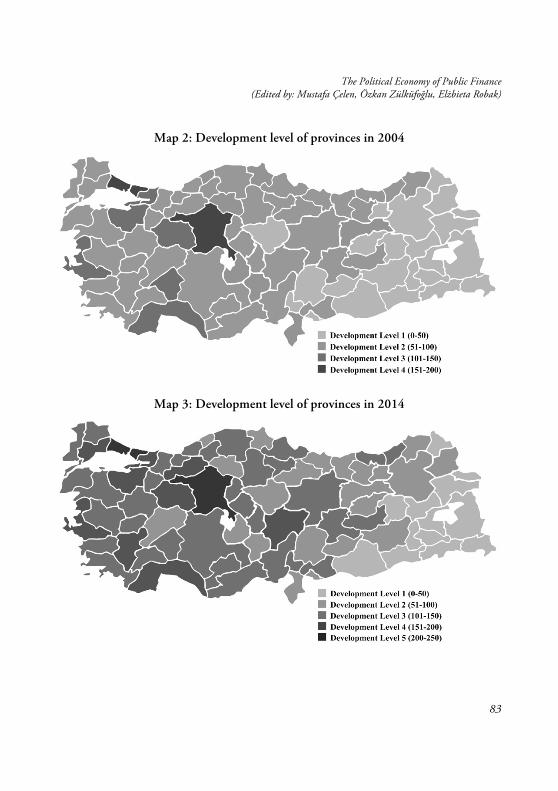
The Political Economy of Public Finance (Edited by: Mustafa Çelen, Özkan Zülküfoğlu, Elżbieta Robak)
83
Map 2: Development level of provinces in 2004
Map 3: Development level of provinces in 2014

Cihan Kızıl (Turkish Regional Development Agencies and Evolution of Regional Disparities in Turkey)
84
Since Turkey has 81 NUTS level-3 regions and it is a bit hard to investigate the results through the table in appendix, we group the provinces according to their development level and show the results on the maps by colouring. These maps help us to visualise and comprehend the results easier. Map 2 shows the situation in 2004. As can be noticed, only Istanbul and Ankara can pass the 150 index score, and there are few provinces which can pass 100 index score. In 2004, most of the provinces take place at the second level.
Map 3 shows that in 2014, we have a new development level which only Istanbul and Ankara can reach. From this map, we can see that there are a lot of provinces which manage to significantly develop. However, it can also be seen that the provinces in Eastern and South-eastern Anatolia get stuck in the first level. Contrary to desired outcomes, Map 3 indicates that regional differences become more apparent in the 11 year period.
Following the establishment of RDAs, we observe that 31 provinces show higher development rates7. However, 10 of these provinces show only a one per cent or less rise in the development rates8. Contrary to expectations, the other 50 provinces including the majority of the least developed regions show a decrease in development rates. Certainly, there are many exogenous factors affecting the Turkish economy and the development levels of its regions. Development agencies cannot be considered the sole factor in this situation, but the results show us where they might be able to make a bigger difference.
In Figure 1, it can be observed how development distribution changes. This graph is prepared by using kernel density function and average development levels of provinces. The whole density function “shifts” to the right over time. This, of course, reflects the fact that regions have developed. We note that density of developed regions increased
7 Kilis, Yalova, Gaziantep, Şanlıurfa, Diyarbakır, Düzce, Tekirdağ, Osmaniye, Adana, Konya, Bartın, Karaman, Mardin, Erzincan, Muğla, Isparta, Antalya, Gümüşhane, Kırıkkale, Manisa, Nevşehir, Kırklareli, Malatya, Bursa, Çankırı, Aydın, Kars, Van, Balıkesir, Ardahan, Çorum. 8 Kırklareli, Malatya, Bursa, Çankırı, Aydın, Kars, Van, Balıkesir, Ardahan, Çorum.
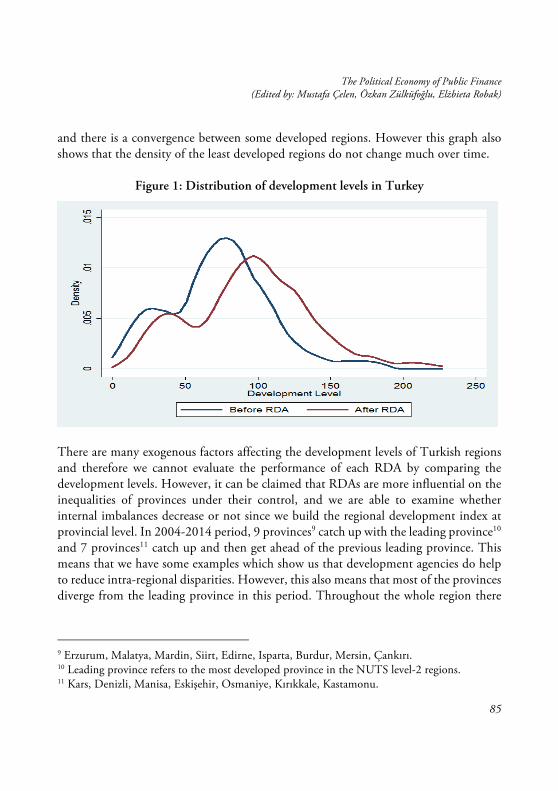
The Political Economy of Public Finance (Edited by: Mustafa Çelen, Özkan Zülküfoğlu, Elżbieta Robak)
85
and there is a convergence between some developed regions. However this graph also shows that the density of the least developed regions do not change much over time.
Figure 1: Distribution of development levels in Turkey
There are many exogenous factors affecting the development levels of Turkish regions and therefore we cannot evaluate the performance of each RDA by comparing the development levels. However, it can be claimed that RDAs are more influential on the inequalities of provinces under their control, and we are able to examine whether internal imbalances decrease or not since we build the regional development index at provincial level. In 2004-2014 period, 9 provinces9 catch up with the leading province10 and 7 provinces11 catch up and then get ahead of the previous leading province. This means that we have some examples which show us that development agencies do help to reduce intra-regional disparities. However, this also means that most of the provinces diverge from the leading province in this period. Throughout the whole region there
9 Erzurum, Malatya, Mardin, Siirt, Edirne, Isparta, Burdur, Mersin, Çankırı. 10 Leading province refers to the most developed province in the NUTS level-2 regions. 11 Kars, Denizli, Manisa, Eskişehir, Osmaniye, Kırıkkale, Kastamonu.
Cihan Kızıl (Turkish Regional Development Agencies and Evolution of Regional Disparities in Turkey)
86
are only two NUTS level-2 regions, namely TR61 and TR62, in which we observe a convergence.
When we look into the internal differences of the 26 NUTS level-2 regions, we observe very different development performances. For example, in TRC1, Gaziantep shows an increase in development scores of 51.30 points, whereas Kilis shows a rise of 18.71 points and Adıyaman shows a rise of 24.86 points. Gaziantep, which was already more developed than Adıyaman and Kilis in 2004, outscored these cities in this period. While Eskişehir and Bursa in the TR41 region have pretty similar development levels and performance, another province from the same region, Bilecik, develops 30 points less in 10 years, and the difference between Bilecik and the other two cities reaches 60 points. Considering the evolution of internal differences, it can be said that expectations from regional development agencies are not met in most of the regions.
Conclusion
In accordance with the EU accession process, Turkish authorities aim to reduce the regional disparities by newly established RDAs. There are many different factors in the development of a region, and it is not an easy task to determine the actual impact of RDAs on socio-economic life. Additionally, it is improper to make an efficiency analysis since Turkish development agencies have not existed long enough. However, they are established with great expectations, and Turkey allocates huge funds for the projects that RDAs support.
Istanbul, which is the socio-economic capital of Turkey, has developed more than the other provinces in the last couple of years. Outside of a few exceptions like Ankara, this situation causes a gap between Istanbul and other provinces. In the NUTS level-2 regions consisting of provinces which are thought to have similar development levels, it becomes evident that the attempt of alleviating the inequalities within the region was mostly unsuccessful. In fact, one might even say that the differences increasing in some NUTS level-2 regions have reached a point where their pre-specified regions might need to be re-arranged.
The Political Economy of Public Finance (Edited by: Mustafa Çelen, Özkan Zülküfoğlu, Elżbieta Robak)
87
With the RDA’s possible contributions, some successful outcomes are obtained in some Western and Central Anatolian regions. However, the development problems in Eastern and South-eastern Anatolia seem to be continuing, and the development level differences between these provinces and the Western provinces seem to be increasing instead of decreasing. Considering that the time period subject to our analysis is one of the most propitious periods to develop the troublesome regions of Eastern and South-eastern Anatolia, the evolution of regional inequalities cause worry that the situation might get even worse following the collapse of the ‘peace process’.
Socio-economic development and reduction of regional disparities require long-term perspectives, and such a distinct transformation takes time. However, the evolution of regional disparities does not encourage hope that RDAs will be a remedy to regional inequalities. Even though it is early to say that RDAs entirely fail to achieve their objective, our findings call for further investigation of the development agencies and their programmes. How the funds are distributed should be examined as well. Since we know which regions develop more and achieve their goals to reduce internal imbalances, the same regional policies applied in these regions may help to set up more successful projects in others. The regional development index we provide in this study also introduces a useful tool that will aid researchers in their own investigations of Turkey.
References
Eurostat (2002). Enlarging the EU Statistical Network. Luxembourg. Eurostat (2011). Regions in the European Union: Nomenclature of territorial units for statistics
NUTS 2010/EU-27. Luxembourg. Hardle, W., & Simar, L. (2007). Applied Multivariate Statistical Analysis. Berlin: Springer. İş Bank (2012). 2005 ve 2010 Verileriyle Türkiye’de İllerin Gelişmişlik Düzeyi Araştırması.
Retrieved April 3, 2017, from https://ekonomi.isbank.com.tr/UserFiles/pdf/ar_03_2012v1.pdf
İş Bank (2014). 2010 ve 2012 Verileriyle Türkiye’de İllerin Gelişmişlik Düzeyi Araştırması. Retrieved April 3, 2017, from https://ekonomi.isbank.com.tr/UserFiles/pdf/ar_03_2012.pdf
Jolliffe, I.T. (2002). Principal Component Analysis (2nd ed.). New York: Springer.

Cihan Kızıl (Turkish Regional Development Agencies and Evolution of Regional Disparities in Turkey)
88
Kızıl, C. (2016). Türkiye’de 2001-2014 Döneminde Uygulanan Bölgesel Kalkınma Politikası Çıktılarının Bölgesel Gelişmişlik Endeksi İle Analizi, İktisat Politikası Araştırmaları Dergisi, Vol: 3 (2), 33-53.
Ministry of Development (2011). İllerin ve Bölgelerin Sosyo-Ekonomik Gelişmişlik Sıralaması Araştırması: SEGE – 2011. Ankara.
Ministry of Development (2015). Kalkınma Ajansları 2014 Yılı Genel Faaliyet Raporu. Ankara. Mountford, D. (2009). Organising for local development: the role of local development
agencies. OECD Summary Report. Retrieved October 5, 2017, from http://www.oecd.org/regional/leed/44682618.pdf
Reeves, T. (2006). Regional Development in the EU and Turkey, Bölgesel Kalkınma ve Yönetişim Sempozyumu, 29-39.
SPO (2003). İllerin ve Bölgelerin Sosyo-Ekonomik Gelişmişlik Sıralaması Araştırması: SEGE - 2003, Ankara.

The Political Economy of Public Finance (Edited by: Mustafa Çelen, Özkan Zülküfoğlu, Elżbieta Robak)
89
Appendix: Regional Development Index Scores
NUTS-3 2004 2005 2006 2007 2008 2009 2010 2011 2012 2013 2014 Istanbul 151.33 158.04 173.34 184.66 201.30 192.26 199.46 210.42 218.64 229.58 237.93
Ankara 151.83 155.77 177.71 182.32 182.18 182.53 190.38 193.04 192.55 208.00 213.98
Eskişehir 116.73 119.73 131.24 132.78 141.27 150.27 154.44 158.00 165.86 179.46 186.13
Kocaeli 103.71 112.71 127.95 140.80 150.24 131.76 158.49 177.02 182.41 180.73 185.93
Bursa 117.66 121.86 135.36 146.10 144.29 135.59 148.23 162.47 164.99 167.14 181.76
Izmir 127.93 133.93 143.00 153.51 162.51 153.81 156.08 162.74 168.10 176.17 181.33
Denizli 97.20 106.52 115.38 122.36 125.29 121.67 134.46 143.10 143.79 150.25 161.16
Kayseri 89.86 100.99 108.37 119.49 123.89 125.68 130.97 144.70 142.11 148.33 159.64
Yalova 103.07 106.82 105.88 104.36 110.91 109.82 134.55 140.81 143.17 147.86 158.41
Antalya 108.09 115.01 118.15 124.56 121.92 120.33 130.93 135.49 142.26 146.90 151.63
Tekirdağ 96.90 101.44 105.53 109.64 109.46 111.28 119.61 131.87 132.02 141.80 151.15
Bolu 83.70 91.70 97.53 100.62 111.62 108.36 131.48 127.16 124.18 127.14 150.95
Isparta 101.63 101.53 106.27 119.28 117.59 114.33 119.32 137.05 141.30 141.47 149.67
Çanakkale 89.33 91.57 101.10 110.83 111.22 115.33 153.32 130.03 138.14 143.54 145.23
Trabzon 84.51 89.99 100.88 107.14 105.20 110.92 124.90 133.57 136.05 137.35 144.95
Konya 79.78 85.51 89.29 97.25 97.06 99.43 106.57 115.68 127.10 134.66 143.62
Edirne 85.74 95.24 96.79 104.55 112.81 110.05 126.80 125.15 132.15 135.19 143.28
Kırklareli 89.03 103.69 97.25 100.88 107.62 105.67 111.17 116.72 121.04 130.75 140.88
Muğla 100.17 104.08 108.71 109.88 111.39 112.42 117.78 120.91 127.83 132.57 140.12
Sakarya 69.28 89.07 88.70 98.78 102.64 102.60 96.82 109.81 116.04 123.93 135.82
Manisa 71.79 76.47 81.55 89.58 91.82 93.03 111.73 119.13 128.16 121.33 135.22
Karabük 85.15 88.11 94.17 104.01 110.04 101.79 110.56 119.76 122.78 122.37 134.83
Uşak 83.79 84.64 91.23 94.76 99.63 115.50 103.82 108.88 112.53 113.66 132.98
Kırıkkale 63.08 72.38 78.42 80.79 83.25 85.68 106.11 110.16 115.67 117.06 130.96
Zonguldak 82.69 89.96 91.20 97.73 101.07 102.66 110.13 119.17 124.55 123.31 130.39
Aydın 81.56 85.26 92.47 99.38 100.43 96.42 108.75 113.64 118.32 122.57 129.43
Burdur 83.60 89.40 100.01 108.01 109.45 118.27 127.07 121.76 123.97 120.36 127.76
Balıkesir 83.60 90.64 94.22 99.35 100.10 97.53 106.38 109.53 116.53 118.79 124.15
Bilecik 84.73 83.70 88.53 100.43 105.96 97.85 94.75 106.16 108.85 116.68 123.97
Kütahya 72.95 78.74 83.31 87.00 95.59 95.11 97.47 108.49 111.39 121.91 123.15
Adana 80.30 82.47 83.86 84.50 92.16 89.07 98.14 102.67 110.98 116.97 119.85
Karaman 77.07 84.60 91.38 92.96 88.16 89.29 95.47 97.35 106.75 119.51 118.13
Nevşehir 73.83 74.54 75.51 81.91 86.39 89.03 100.42 104.18 116.05 111.23 115.30
Kırşehir 58.74 66.32 72.85 82.53 85.72 84.55 98.46 105.30 107.34 109.00 114.81
Mersin 74.05 77.51 84.80 86.05 90.98 90.79 94.73 101.84 102.65 105.39 114.66
Samsun 69.67 73.51 79.54 83.56 91.21 88.77 94.64 101.76 104.92 107.77 113.59
Gaziantep 62.08 64.85 68.50 72.32 73.84 73.81 81.61 89.75 93.76 105.18 113.37
Düzce 53.96 58.18 63.16 68.97 69.59 69.51 76.05 87.01 86.99 89.98 111.54
Sivas 61.81 63.87 72.09 78.81 78.08 83.09 92.56 101.06 99.34 99.23 107.97
Osmaniye 42.56 49.35 50.59 58.10 59.52 61.49 69.35 84.70 93.53 97.87 106.40
Çorum 64.79 67.96 72.37 80.18 79.53 81.64 85.75 93.90 95.95 101.02 105.81
Elazığ 64.41 71.18 75.98 79.98 82.06 82.88 85.43 97.04 98.36 100.47 103.70
Amasya 66.01 65.86 71.82 77.95 80.13 83.40 82.15 90.21 91.32 94.49 102.87
Malatya 61.07 69.61 69.38 73.35 74.39 75.97 84.70 92.03 96.47 94.37 101.58
Kastamonu 66.70 69.06 79.01 79.85 82.92 88.07 91.48 99.99 97.53 95.42 101.50
Rize 64.87 69.64 75.17 78.06 77.46 83.84 88.46 95.58 95.65 94.66 101.01
Hatay 59.79 60.72 65.60 71.84 77.67 74.53 80.27 90.64 92.77 97.03 100.29
A.Karahisar 65.79 69.24 72.99 78.70 79.58 81.48 88.22 92.36 91.84 92.69 99.06
Bartın 70.13 70.94 70.49 75.06 77.44 76.13 83.06 93.94 90.24 90.58 96.54
Çankırı 58.76 67.51 62.66 73.19 72.55 70.65 77.14 87.30 87.33 88.22 95.40
Erzincan 64.60 67.42 69.45 71.76 71.17 75.77 78.50 89.24 93.06 94.10 94.16
Giresun 57.60 59.98 66.35 72.67 73.11 75.94 78.93 83.55 82.82 85.94 94.09
Erzurum 50.07 51.70 55.36 63.80 62.03 73.44 79.90 84.58 87.92 86.48 90.30
Niğde 61.17 67.27 67.28 74.39 73.55 75.15 81.19 86.25 87.53 85.22 90.04
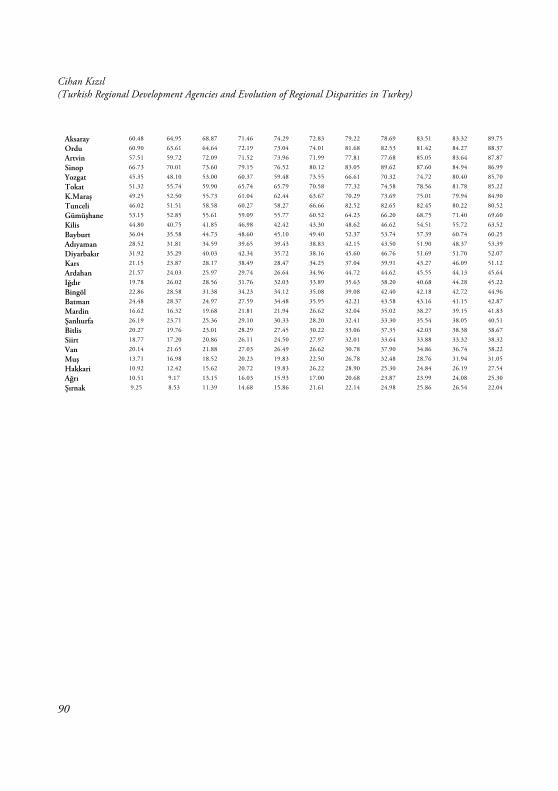
Cihan Kızıl (Turkish Regional Development Agencies and Evolution of Regional Disparities in Turkey)
90
Aksaray 60.48 64.95 68.87 71.46 74.29 72.83 79.22 78.69 83.51 83.32 89.75
Ordu 60.90 63.61 64.64 72.19 73.04 74.01 81.68 82.53 81.42 84.27 88.37
Artvin 57.51 59.72 72.09 71.52 73.96 71.99 77.81 77.68 85.05 83.64 87.87
Sinop 66.73 70.01 73.60 79.15 76.52 80.12 83.05 89.62 87.60 84.94 86.99
Yozgat 45.35 48.10 53.00 60.37 59.48 73.55 66.61 70.32 74.72 80.40 85.70
Tokat 51.32 55.74 59.90 65.74 65.79 70.58 77.32 74.58 78.56 81.78 85.22
K.Maraş 49.25 52.50 55.73 61.04 62.44 63.67 70.29 73.69 75.01 79.94 84.90
Tunceli 46.02 51.51 58.58 60.27 58.27 66.66 82.52 82.65 82.45 80.22 80.52
Gümüşhane 53.15 52.85 55.61 59.09 55.77 60.52 64.23 66.20 68.75 71.40 69.60
Kilis 44.80 40.75 41.85 46.98 42.42 43.30 48.62 46.62 54.51 55.72 63.52
Bayburt 36.04 35.58 44.73 48.60 45.10 49.40 52.37 53.74 57.39 60.74 60.25
Adıyaman 28.52 31.81 34.59 39.65 39.43 38.83 42.15 43.50 51.90 48.37 53.39
Diyarbakır 31.92 35.29 40.03 42.34 35.72 38.16 45.60 46.76 51.69 51.70 52.07
Kars 21.15 23.87 28.17 38.49 28.47 34.25 37.04 39.91 43.27 46.09 51.12
Ardahan 21.57 24.03 25.97 29.74 26.64 34.96 44.72 44.62 45.55 44.13 45.64
Iğdır 19.78 26.02 28.56 31.76 32.03 33.89 35.63 38.20 40.68 44.28 45.22
Bingöl 22.86 28.58 31.38 34.23 34.12 35.08 39.08 42.40 42.18 42.72 44.96
Batman 24.48 28.37 24.97 27.59 34.48 35.95 42.21 43.58 43.16 41.15 42.87
Mardin 16.62 16.32 19.68 21.81 21.94 26.62 32.04 35.02 38.27 39.15 41.83
Şanlıurfa 26.19 23.71 25.36 29.10 30.33 28.20 32.41 33.30 35.54 38.05 40.51
Bitlis 20.27 19.76 23.01 28.29 27.45 30.22 33.06 37.35 42.03 38.38 38.67
Siirt 18.77 17.20 20.86 26.11 24.50 27.97 32.01 33.64 33.88 33.32 38.32
Van 20.14 21.65 21.88 27.03 26.49 26.62 30.78 37.90 34.86 36.74 38.22
Muş 13.71 16.98 18.52 20.23 19.83 22.50 26.78 32.48 28.76 31.94 31.05
Hakkari 10.92 12.42 15.62 20.72 19.83 26.22 28.90 25.30 24.84 26.19 27.54
Ağrı 10.51 9.17 13.15 16.03 15.93 17.00 20.68 23.87 23.99 24.08 25.30
Şırnak 9.25 8.53 11.39 14.68 15.86 21.61 22.14 24.98 25.86 26.54 22.04

The Political Economy of Public Finance (Edited by: Mustafa Çelen, Özkan Zülküfoğlu, Elżbieta Robak)
91
The Government Supports on Livestock Products in OECD Countries and Turkey
Ali Karabacak Savaş Çevik Abstract
Government supports on livestock production are an important part of agricultural supports in worldwide. Government payments are expected to affect the production level and value of livestock products as meat and milk which are basic human food sources. Livestock production support in Turkey shows periodic differences in parallel with EU policies. In this study, it is examined an overview of agricultural subsidies and especially of supports to livestock product in OECD countries and in Turkey in terms share of agricultural value added, GDP and farm receipts. While agricultural subsidies in Turkey account for 2% of GDP, there is unstable trend according to years, and a significant part of total support consists of producer support and lower part is general service supports. Agricultural subsidies constitute approximately 30% of the total agricultural value added. 85% of producer supports are based on product output, and the remains are on input use and depend on land and animal numbers. The most of the general service supports constitute infrastructure development and marketing/promotion supports, while the agricultural knowledge and innovation supports is minimal in Turkey. The supports for beef meat production in the supports to livestock products are significantly higher than other products. Turkey is the country where provides the highest supports to meat product among the OECD and EU
4
Ali Karabacak, Savaş Çevik (The Government Supports on Livestock Products in OECD Countries and Turkey)
92
countries. The aim of the study is to compare the agricultural support in Turkey with the OECD countries and to reveal the agricultural support of Turkey.
Keywords: Agricultural supports, livestock supports, agricultural transfers, agricultural subsidies
Introduction
he agricultural sector has an important place especially in developing country economies. First of all, the sector that meets the nutritional needs of the people still maintains its importance for the country's economy because it provides raw
materials to other sectors, creating employment, providing finance for development and products for foreign trade and earning foreign exchange. The rapid increase in world population further increases the strategic importance of agricultural products. Depending on the growing population and rising prosperity, the food demand increases, and thus, various environmental problems occurs by raising the pressure on natural resources. These pressures led agricultural policies to be revisited (Şahin and Berk, 2008). On the other hand, the efficiency of government policies has been an important interest among policy-makers, scholars and citizens. In order to constitute a developmental economy in even agriculture as well as industry, the government involvement is indispensable and inevitable (Erdogdu, 2015). This is true especially for agricultural sector that is a strategic one and has heavy market-failures. Moreover, the policies on agricultural activities would have the poverty and distribution reflections in developing countries as Turkey (Taşar et al., 2016)
Due to its strategic importance, the agriculture is a sector supported by an agricultural policy specific to its economic structure in each country. The annual budget of agriculture is above $100 billion in the US, $50 billion in the EU and $385 billion in OECD countries (Acar and Aslaner 2006). The total agricultural support per unit area in Turkey is fairly below the OECD averages. However, the share of these subsidies in GDP is above those of the most of the OECD member countries (Ören and Bahadır 2005). The main objective of the policies implemented in the agricultural sector is to establish an organized, competitive, sustainable agricultural sector. Turkey has also aimed to increase the agricultural production with agricultural policies implemented up to now. Nevertheless, it has experienced problems such as the financial burden of these policies on public resources and the inability to reach the target groups (Yalçınkaya et
T
The Political Economy of Public Finance (Edited by: Mustafa Çelen, Özkan Zülküfoğlu, Elżbieta Robak)
93
al., 2006). Because the agriculture policies have lost their effectiveness, a new agricultural policy has introduced in 2000s. This policy focused on environmentally friendly approaches, competitiveness, and fairness while it attempted to have particular target group and to increase farmers’ incomes. In order to ensure these targets, Direct Income Support (DIS) has been introduced. DIS contains the direct income payments non-related to production, compensatory contingent payments to targeted groups, and differential payments. The payments non-related to production are not based on price or quantity.
In the Producer and Consumer Support Estimates Database of OECD (2017) which is employed in this study, the estimates related to agricultural supports are calculated by three indicators (OECD 2016):
1. Producer supports: They are transfers to producers individually regardless of their nature, objectives or impacts on farm production or income, and are measured at the farm-gate level
2. Consumer supports: They are transfers to consumers of agricultural commodities regardless of their nature, objectives or impacts on consumption of farm products. They arise from agricultural policy measures and are measured at the farm gate level.
3. General services supports: They are transfers regarding to improve agricultural services, sector, markets, institutions and infrastructure. The primary beneficiary of these supports is agricultural sector, however, they does not include any payments to individual producers or consumers.
The aim of this study is to compare the agricultural supports and especially the supports livestock products by their levels and types in OECD countries and Turkey. For this aim, in Section 2, we present an overview of agricultural supports in cross-country comparisons and time trends. Section 3 deals with the supports of livestock products by their structures, levels and types. All data employed in the study comes from OECD (2017) and contains some OECD countries and non-OECD countries depending on the data availability. The last section concludes.

Ali Karabacak, Savaş Çevik (The Government Supports on Livestock Products in OECD Countries and Turkey)
94
1. An Overview of Agricultural Supports in OECD and Turkey
In order to capture a general picture of agricultural supports, Figure 1 compares countries by their total agricultural support estimates by as share of GDP and their composition. Accordingly, Turkey is ranked third after Indonesia and China in terms of agricultural support provided from its GDP. As a percentage of GDP, the countries that provide the least support are Ukraine, Australia, New Zealand and Brazil. Turkey's agricultural support is 2% of its GDP and this ratio is higher than the average of EU (28) countries. Agricultural support estimates as a share of GDP for countries like Switzerland, Japan, Russia and Norway are above the EU average.

The Political Economy of Public Finance (Edited by: Mustafa Çelen, Özkan Zülküfoğlu, Elżbieta Robak)
95
Figure 1: The Composition of Total Agricultural Support Estimates
Source: OECD (2017)
Considering the composition of supports, a significant part of the support applied in Turkey constitutes the producer support and the rest is general service support. Turkey does not have consumer supports. The consumer supports are present in the US, Indonesia, Mexico, Russia and Kazakhstan, although it is in a limited extent.
Figure 2 shows total agricultural support estimates as a percentage of agricultural value added. Switzerland, Japan and Korea are the countries which have the highest level of support by agricultural value added. Turkey’s support ratio is under the OECD and
-4% -3% -2% -1% 0% 1% 2% 3% 4% 5%
UkraineAustralia
NewZealandBrazilChile
SouthAfricaCanadaIsrael
UnitedStatesVietNamMexicoEU28
NorwayRussiaJapan
IcelandSwitzerlandColombia
KazakhstanKoreaTurkeyChina
Indonesia
ProducerSupportEstimate(%GDP) ConsumerSupportEstimate(%GDP)GeneralServicesSupportEstimate(%GDP)

Ali Karabacak, Savaş Çevik (The Government Supports on Livestock Products in OECD Countries and Turkey)
96
EU countries. Ukraine, Australia and New Zealand are the least supportive countries in terms of agricultural value added.
Figure 2: Total Support Estimates as a Percentage of Agricultural Value Added (Average 2014-2016)
Source: OECD (2017) Considering the trend of the total supports as percentage of GDP, it is seen that the total support in the EU shows a regular decrease. While the general service supports generally do not change within total support, the producer supports has decreased
-40 -20 0 20 40 60 80 100 120 140 160 180
Ukraine
NewZealand
Chile
SouthAfrica
Mexico
CostaRica
Canada
China
Phillipines
Israel
OECD5
Norway
Japan

The Political Economy of Public Finance (Edited by: Mustafa Çelen, Özkan Zülküfoğlu, Elżbieta Robak)
97
significantly. In Turkey, the support structure is unstable depending on policies applied according to the periods. However, there is a clear decrease in total supports after the earl years of 2000.
Figure 3: Trend and Composition in Support Structure in the EU and Turkey, %GDP (1986-2016)
EU Turkey
Source: OECD
It is worth looking at a little closer to the producer support that constitutes the most important part among total supports. OECD (2017) classifies the producer supports in following subgroups:
• Support based on commodity output • Payments based on input use • Payments based on current A/An/R/I, production required: Supports from
policy measures based on current area, animal numbers, revenue, or income, and requiring production.
• Payments based on non-current A/An/R/I: Supports arising from policy measures based on non-current (i.e. historical or fixed) area, animal numbers, revenue, or income. These are handled in two sub-groups as production required and production not required.
• Payments based on non-commodity criteria.

Ali Karabacak, Savaş Çevik (The Government Supports on Livestock Products in OECD Countries and Turkey)
98
• Miscellaneous payments.
Figure 4 shows the distribution of producer supports by their types. In Turkey, the supports based on commodity output constitutes 85% of the producer supports. The remainders are based on input use and support based on current area, animal numbers, revenue, or income, and requiring production. Chili, Brazil, Australia and Mexico are the countries which implement supports based on input use. Indonesia and Korea are the countries where the commodity based support is the highest (Figure 4).
Figure 4: Distribution of Producer Support Estimate (PSE)
Source: OECD
-60% -40% -20% 0% 20% 40% 60% 80% 100%
VietNam
Brazil
EU28
Kazakhstan
Switzerland
SouthAfrica
Israel
Iceland
Colombia
Turkey
Indonesia
Australia
Supportbasedoncommodityoutput (%PSE)Paymentsbasedoninputuse(%PSE)PaymentsbasedoncurrentA/An/R/I,production required(%PSE)Paymentsbasedonnon-currentA/An/R/I,production required(%PSE)Paymentsbasedonnon-currentA/An/R/I,productionnotrequired(%PSE)
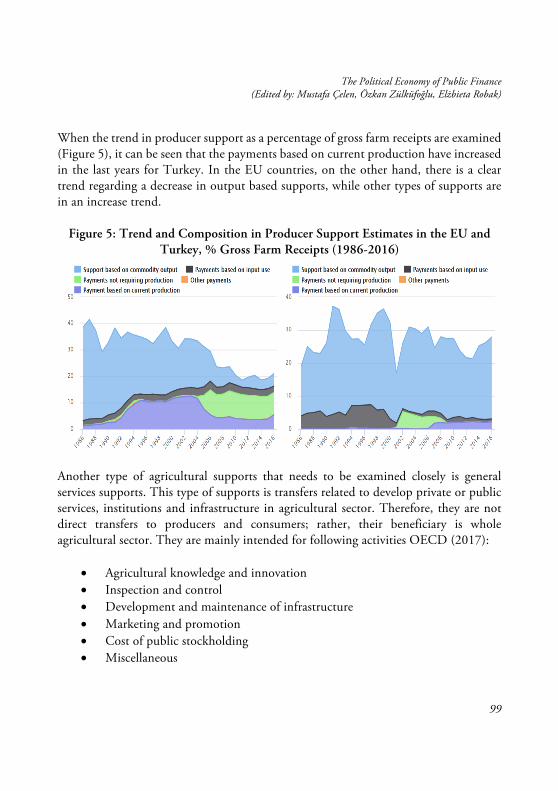
The Political Economy of Public Finance (Edited by: Mustafa Çelen, Özkan Zülküfoğlu, Elżbieta Robak)
99
When the trend in producer support as a percentage of gross farm receipts are examined (Figure 5), it can be seen that the payments based on current production have increased in the last years for Turkey. In the EU countries, on the other hand, there is a clear trend regarding a decrease in output based supports, while other types of supports are in an increase trend.
Figure 5: Trend and Composition in Producer Support Estimates in the EU and Turkey, % Gross Farm Receipts (1986-2016)
Another type of agricultural supports that needs to be examined closely is general services supports. This type of supports is transfers related to develop private or public services, institutions and infrastructure in agricultural sector. Therefore, they are not direct transfers to producers and consumers; rather, their beneficiary is whole agricultural sector. They are mainly intended for following activities OECD (2017):
• Agricultural knowledge and innovation • Inspection and control • Development and maintenance of infrastructure • Marketing and promotion • Cost of public stockholding • Miscellaneous
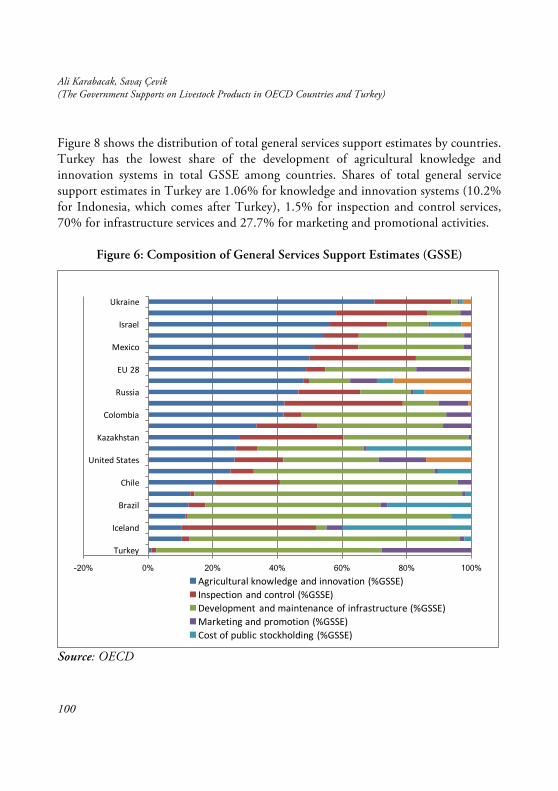
Ali Karabacak, Savaş Çevik (The Government Supports on Livestock Products in OECD Countries and Turkey)
100
Figure 8 shows the distribution of total general services support estimates by countries. Turkey has the lowest share of the development of agricultural knowledge and innovation systems in total GSSE among countries. Shares of total general service support estimates in Turkey are 1.06% for knowledge and innovation systems (10.2% for Indonesia, which comes after Turkey), 1.5% for inspection and control services, 70% for infrastructure services and 27.7% for marketing and promotional activities.
Figure 6: Composition of General Services Support Estimates (GSSE)
Source: OECD
-20% 0% 20% 40% 60% 80% 100%
Turkey
Iceland
Brazil
Chile
UnitedStates
Kazakhstan
Colombia
Russia
EU28
Mexico
Israel
Ukraine
Agriculturalknowledgeandinnovation(%GSSE)Inspectionandcontrol(%GSSE)Development andmaintenanceofinfrastructure(%GSSE)Marketingandpromotion(%GSSE)Costofpublicstockholding(%GSSE)
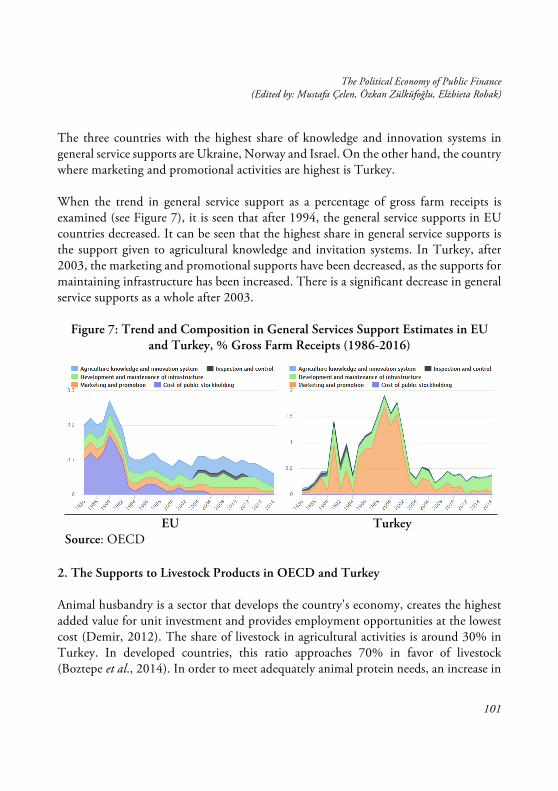
The Political Economy of Public Finance (Edited by: Mustafa Çelen, Özkan Zülküfoğlu, Elżbieta Robak)
101
The three countries with the highest share of knowledge and innovation systems in general service supports are Ukraine, Norway and Israel. On the other hand, the country where marketing and promotional activities are highest is Turkey.
When the trend in general service support as a percentage of gross farm receipts is examined (see Figure 7), it is seen that after 1994, the general service supports in EU countries decreased. It can be seen that the highest share in general service supports is the support given to agricultural knowledge and invitation systems. In Turkey, after 2003, the marketing and promotional supports have been decreased, as the supports for maintaining infrastructure has been increased. There is a significant decrease in general service supports as a whole after 2003.
Figure 7: Trend and Composition in General Services Support Estimates in EU and Turkey, % Gross Farm Receipts (1986-2016)
EU Turkey
Source: OECD
2. The Supports to Livestock Products in OECD and Turkey
Animal husbandry is a sector that develops the country's economy, creates the highest added value for unit investment and provides employment opportunities at the lowest cost (Demir, 2012). The share of livestock in agricultural activities is around 30% in Turkey. In developed countries, this ratio approaches 70% in favor of livestock (Boztepe et al., 2014). In order to meet adequately animal protein needs, an increase in
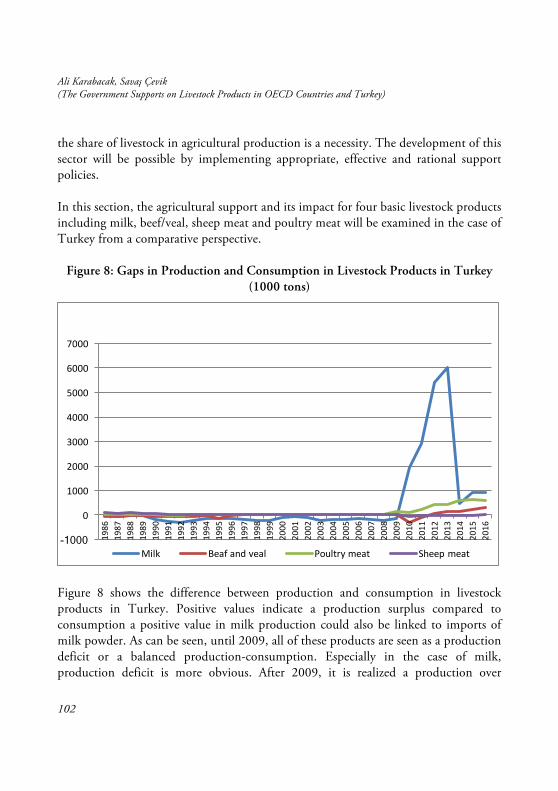
Ali Karabacak, Savaş Çevik (The Government Supports on Livestock Products in OECD Countries and Turkey)
102
the share of livestock in agricultural production is a necessity. The development of this sector will be possible by implementing appropriate, effective and rational support policies.
In this section, the agricultural support and its impact for four basic livestock products including milk, beef/veal, sheep meat and poultry meat will be examined in the case of Turkey from a comparative perspective.
Figure 8: Gaps in Production and Consumption in Livestock Products in Turkey (1000 tons)
Figure 8 shows the difference between production and consumption in livestock products in Turkey. Positive values indicate a production surplus compared to consumption a positive value in milk production could also be linked to imports of milk powder. As can be seen, until 2009, all of these products are seen as a production deficit or a balanced production-consumption. Especially in the case of milk, production deficit is more obvious. After 2009, it is realized a production over
-1000
0
1000
2000
3000
4000
5000
6000
7000
1986
1987
1988
1989
1990
1991
1992
1993
1994
1995
1996
1997
1998
1999
2000
2001
2002
2003
2004
2005
2006
2007
2008
2009
2010
2011
2012
2013
2014
2015
2016
Milk Beafandveal Poultrymeat Sheepmeat

The Political Economy of Public Finance (Edited by: Mustafa Çelen, Özkan Zülküfoğlu, Elżbieta Robak)
103
consumption in poultry meat, beef and cow milk. The increase in the import of milk powder in these years can be seen as the reason for the production surplus in this product. Production-consumption balance in sheep is maintained. Despite the significant decline in sheep number in the country, the increase in meat prices has also reduced consumption.
Figure 9: Transfers to Producer in Livestock Products in Turkey (milion TL)
Figure 9 presents the transfers to producers for livestock products. It can be said that after 1999-2000, the transfers in other products except sheep meat has increased. Transfers to milk producers have started to decline after 2012, following an increase in production surplus. In the same period, supports for beef and veal producers have started to increase considerably.
We compare countries with respect to transfers to livestock product for 2006 in remain of the section. Figure 10 compares countries in transfers to milk. In terms of share of transfers (left axis) in gross farm receipts, the highest supports are in Iceland, Korea and
-5000
0
5000
10000
15000
20000
25000
1986
1987
1988
1989
1990
1991
1992
1993
1994
1995
1996
1997
1998
1999
2000
2001
2002
2003
2004
2005
2006
2007
2008
2009
2010
2011
2012
2013
2014
2015
2016
Milk Beafandveal Poultrymeat Sheepmeat

Ali Karabacak, Savaş Çevik (The Government Supports on Livestock Products in OECD Countries and Turkey)
104
Norway. Depending on the decline in milk supports in recent years, Turkey has the lowest support for this indicator after Ukraine in 2016.
Figure 10: Milk Producer Transfers as Milion US Dolars and as a Percentage of Gross Farm Receipts (2016)
China, Russia and the US are the countries that provide the highest support when looking at producer transfers in terms of US dollars (right axis). Ukraine and Turkey are the countries with the lowest support even in terms of this indicator. Australia, Chile and New Zealand do not provide any transfers to milk.
-2000
0
2000
4000
6000
8000
10000
12000
14000
16000
-40
-20
0
20
40
60
80
Ukraine
Turkey
Australia
Chile
NewZealand
SouthAfric
aCo
staRica
Kazakhstan
Mexico
EU28
Brazil
Colombia
OEC
D-T
otal
Unite
dStates
Indo
nesia
Switzerland
Israel
China
Canada
Russia
Japan
Norw
ayKo
rea
Iceland
ThePercentageofGrossFarmReceipts(%) ProducerTransfers(USDolars)

The Political Economy of Public Finance (Edited by: Mustafa Çelen, Özkan Zülküfoğlu, Elżbieta Robak)
105
Figure 11: Beaf and Veal Producer Transfers as Milion US Dolars and as a Percentage of Gross Farm Receipts (2016)
As can be seen in Figure 11, Turkey has the highest rate of transfer to beef in terms of the percentage of gross farm receipts (left axis) and producer transfers in US dollars (right axis). Turkey is followed by Norway and Switzerland. USA, Canada and Mexico are countries with the lowest transfer to beef and veal.
-5000
0
5000
10000
15000
20000
-10
0
10
20
30
40
50
60
70
80
Colombia
Australia
Chile
NewZealand
CostaRica
SouthAfric
aUk
raine
Unite
dStates
Canada
Brazil
Mexico
Philipp
ines
Kazakhstan
China
OEC
D-T
otal
Russia
Israel
Indo
nesia
EU28
Japan
VietNam
Korea
Iceland
Switzerland
Norw
ayTurkey
ThePercentageofGrossFarmReceipts(%) ProducerTransfers(USDolars)
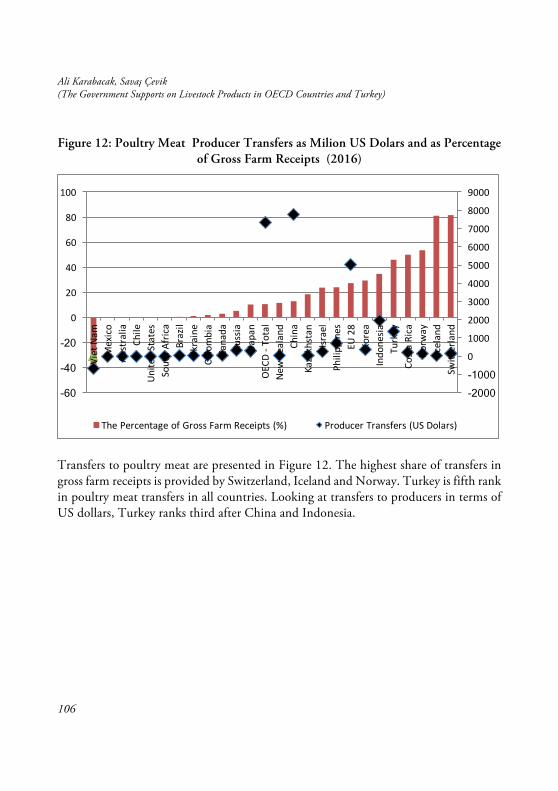
Ali Karabacak, Savaş Çevik (The Government Supports on Livestock Products in OECD Countries and Turkey)
106
Figure 12: Poultry Meat Producer Transfers as Milion US Dolars and as Percentage of Gross Farm Receipts (2016)
Transfers to poultry meat are presented in Figure 12. The highest share of transfers in gross farm receipts is provided by Switzerland, Iceland and Norway. Turkey is fifth rank in poultry meat transfers in all countries. Looking at transfers to producers in terms of US dollars, Turkey ranks third after China and Indonesia.
-2000 -1000 0
1000
2000
3000
4000
5000
6000
7000
8000
9000
-60
-40
-20
0
20
40
60
80
100
VietNam
Mexico
Australia
Chile
Unite
dStates
SouthAfric
aBrazil
Ukraine
Colombia
Canada
Russia
Japan
OEC
D-T
otal
NewZealand
China
Kazakhstan
Israel
Philipp
ines
EU28
Korea
Indo
nesia
Turkey
CostaRica
Norw
ayIceland
Switzerland
ThePercentageofGrossFarmReceipts(%) ProducerTransfers(USDolars)

The Political Economy of Public Finance (Edited by: Mustafa Çelen, Özkan Zülküfoğlu, Elżbieta Robak)
107
Figure 13: Sheep MeatProducer Transfers as Milion US Dolars and as a Percentage of Gross Farm Receipts (2016)
Transfers to sheep meat are lower in Turkey than averages of the EU and OECD countries. Transfers in the highest percentage of gross farm receipts are in Switzerland, Iceland and Norway. The producer transfers in US dollars are the highest in China.
Conclusion
Agricultural support in Turkey is around 2% of GDP and 25% of agricultural value added. Supports as a percentage of agricultural value added are behind the EU and OECD countries. When the support given as GDP% is examined according to the sectors, it is seen that the support in Turkey is compatible with the EU. A significant portion of producer support is based on product output. The majority of the general service supports constitutes the transfers for the development of agricultural infrastructure and for marketing and promotional activities. The share allocated to the development of agricultural knowledge and innovation systems seems to be quite low.
It can be said that the supports to beef meat among the support given to livestock products is considerably higher than other livestock products. The increase in support with beef can be seen due to the fact that the need for red meat is not met adequately. In countries that do not consume pork, the most important alternative to beef in red
0
1000
2000
3000
4000
0102030405060
ThePercentageofGrossFarmReceipts(%) ProducerTransfers(USDolars)

Ali Karabacak, Savaş Çevik (The Government Supports on Livestock Products in OECD Countries and Turkey)
108
meat is sheep meat. Expanding of the supports to beef production in the way of including sheep meat production, would contribute to solve the problems stemming from the supply of red meat. Strengthening of agriculture in Turkey and increasing agricultural value added can be possible with increased support to agricultural information and invitation systems. Thus, the possible problems that may arise in future agricultural production can be prevented, and agricultural production and earnings can be diversified.
References
Acar M. and Aslaner F. (2006). “Turkish Agricultural Statistics in the Process of Adjustment to the EU: Problems, Suggestions”. Proceedings of 15th Statistics Research Symposium ISSN:1306-6951.
Boztepe S. Karabacak A. Çufadar Y. Yıldırım İ. and Aytekin İ. (2014). Genel Hayvan Yetiştirme. ISBN: 978-605-85836-1-0, Konya.
Demir N.(2012). “Comparison of Recent Developments regarding Husbandry Policies in EU and Turkey in Terms of the Harmonization Process”. Alınteri 23 (B), 58-63 ISSN:1307-3311.
Erdogdu, M. Mustafa (2015). “Culture of Development and Developmental Capacity of States: The Korean Case”. In B. Christiansen & J. Koeman (Eds.), Nationalism, Cultural Indoctrination, and Economic Prosperity in the Digital Age, Hershey, PA: IGI Global, pp. 1-51
OECD (2016), OECD’s Producer Support Estimate and Related Indicators of Agricultural Support: Concepts, Calculations, Interpretation and Use (The PSE Manual), http://www.oecd.org/tad/agricultural-policies/full%20text.pdf (May 10, 2017)
OECD (2017), Producer and Consumer Support Estimates Database of OECD, http://www.oecd.org/agriculture/agricultural-policies/producerandconsumersupportestimatesdata base.htm (May 10, 2017)
Oren M. Necat and Bahadır B. (2005). “Livestock Policies and Policy Transfers in Turkey and OECD Countries”. Hayvansal Üretim 46 (1): 1-7.
Şahin A. and Berk A. (2008). “Single Farm Payment Scheme in the European Union and Evaluation in Case of Turkey”. Kamu-İş, 10(2).
Taşar, M. Okan, Çevik, S. and Kaya, P. Hazel (2016), “Rural Origins of Poverty and the Efficiency of Rural Development Policies: A Cross-Country Comparison”, 3rd
The Political Economy of Public Finance (Edited by: Mustafa Çelen, Özkan Zülküfoğlu, Elżbieta Robak)
109
International Conference on Sustainable Agriculture and Environment Proceeding Book, pp. 275-284.
Yalçinkaya N., Yalçinkaya H. and Çilbant C. (2006). “Turkish Agriculture Policies within the Framework of Arrangements for European Union and Effects on About the Future of Sector”. Yönetim ve Ekonomi. 13(2).

The Political Economy of Public Finance (Edited by: Mustafa Çelen, Özkan Zülküfoğlu, Elżbieta Robak)
111
Sovereign Wealth Funds: A Comparison of Turkey and Other Countries
Sevda Akar Abstract
While sovereign wealth funds (SWFs) have existed for some time, policymakers have only focused their attention on SWFs in recent decades, primarily due to the rising effectiveness of these funds. In the wake of the global financial crisis that first emerged in 2008, many countries have established a sovereign wealth fund. Generally, the fundamental aim of an SWF is to ensure macroeconomic stability, success higher returns on investments, and provide for future generations. In general, SWFs are long-term investments, and they tend to stabilize larger economies more effectively than short-term investments. However, during the last financial crisis, SWFs served as major investment funds. The Turkey Wealth Fund (TWF) represents the first sovereign wealth fund in the country, having been legally established in August 2016. In this study, the TWF and the sovereign wealth funds of other countries are compared. The purpose of this study is to investigate the Turkey Wealth Fund’s effectiveness and to propose the relevant policy to enhance the fund’s effectiveness as well as its transparency in the international financial market.
Key Words: Sovereign Wealth Fund, Investment Policies, Turkey
Introduction
ven though wealth funds are not a new phenomenon, their utility has become more debatable since the 2008 global financial crisis. The International Monetary Fund’s (IMF's) work on wealth funds has also encouraged this trend.
5
E

Sevda Akar (Sovereign Wealth Funds: A Comparison of Turkey and Other Countries)
112
National wealth funds are state owned and increase their income through financial investment instruments. Wealth funds are created with the aim of ensuring macroeconomic stability, thereby achieving financial goals and prosperity for future generations.
Wealth funds are generally structured in two types. In the first, funds are financed by commodities. These funds include commodity exports taxed or owned by the government. In the second type, funds are financed by non-commodities. These funds include transfers of assets from official foreign exchange reserves. The fundamental difference between the two groups is that non-commodity funds include exchange rate interventions to mitigate inflationary pressures.
When a wealth fund is created, the fund’s objectives and investment strategies must be clearly defined. The fund’s management mechanism must also be stated. The fund’s structure and all its work must be transparent. In such a case, one can argue that the fund is not under financial protection or government pressure.
This study aims to compare the wealth fund established in Turkey in 2016 with the institutional purpose, organizational structure, portfolio, and other country applications. The study is organized as follows. In the first part, wealth funds are defined, the aims and organizational structure of wealth funds and their development is examined. In the second part, wealth funds’ investment policies are explained. In the third part, certain funds are examined in selected countries and, in the fourth part, the Turkish Wealth Fund is investigated. The last part offers the conclusion.
1.State Capitalism and Sovereign Wealth Funds
Since the 2008 global financial crisis, many developed countries have given treasury guarantees to financial companies. With this government policy response, wealth funds have come to the fore. These funds, which have been established in many countries, are often referred to as state capitalism. It is possible to come across different definitions of state capitalism.

The Political Economy of Public Finance (Edited by: Mustafa Çelen, Özkan Zülküfoğlu, Elżbieta Robak)
113
The first of these definitions is belonging to Lyons (2007). Lyons (2007) expressed that the state capitalism is the use of various government-controlled funds to achieve strategic gains around the world. Authoritarian governments around the world tend to compete internationally by adopting market-based capitalism. When governments invent something new because they fear that the governments will go beyond the controls of free-market mechanics, this is state capitalism. State capitalism is a form of capitalism in which the state acts as a dominant economic player and uses markets primarily for political gain (Bremmer, 2010: 1).
According to Şimşek (2015), state capitalism is a capitalist system that differs from free-market capitalism but does not resemble socialism; it operates under the assumptions of free-market capitalism and therefore maintains its existence as an important element of profit motivation. State capitalism is, in general, a system in which government is included in the economic structure as the main element and is used mainly for political purposes by the markets. The rise of state-owned companies represents a search for stronger integration with transnational corporate networks through protectionist policies.
In the last few years, public wealth, public investments, and public enterprises have made a significant return. This return can be defined as the period of state capitalism. This state-institutional activity is illustrated by the last element of state capitalism: the rise of sovereign wealth funds. States with large foreign exchange assets set up these funds to maximize the return on investment and political influence. While many of these funds' investments seem entirely commercial, sovereign wealth funds are also used to finance infrastructure development, the state sector's recapitalization, and strategic foreign acquisitions. In such, sovereign wealth funds are fundamentally for new state capitalism (Bremmer, 2008: 56). SWFs are a new term for state-owned mutual fund portfolios, and these funds have a growing share in global investment. As a matter of fact, sovereign wealth funds (SWFs) invest in asset management companies through many banks (Şimşek, 2015: 108).
The most decisive feature of state capitalism is the provision of capital by the government. Musacchio and Lazzarini (2012) claimed that there are two broad distinctions between the general varieties of state capitalism. The first type is state-owned enterprises, development banks, pension funds and sovereign wealth funds

Sevda Akar (Sovereign Wealth Funds: A Comparison of Turkey and Other Countries)
114
(SWFs). These funds are a hybrid form of private companies based on minority investments. The second type is the government itself. SWFs have begun to spread rapidly as an alternative way to channel in country savings with higher return and risky investments. Nonetheless, minority shareholding positions listed in publicly held companies have increasingly been the target of these funds. Most of these funds have invested abroad. The main idea is to have a full pool of savings in foreign currency assets.
Wealth funds are defined in several ways in the literature. For example, the US Treasury defines SWFs as "state-owned investment instruments financed by foreign assets and managed separately from official reserves" (Blackburn et al., 2008: 2). The fund executives frequently expect higher returns based on taking higher risk (Blackburn et al., 2008: 2).
Another definition comes from the Sovereign Wealth Fund Institute (SWFI). SWFI (May, 2017), which describes a wealth fund as “a state- owned investment fund or entity that is generally established from balance of payments surpluses, official foreign currency operations, the proceeds of privatizations, governmental transfer payments, fiscal surpluses, and/or receipts resulting from resource exports.” Drezner (2008) states that wealth funds can be defined as government investment tools that use international financial assets to earn a higher than risk-free rate of return.
According to the International Working Group of Sovereign Wealth Funds (IWG) (2008), three main factors define an SWF:
• Ownership: SWFs belong to the general government (both central and local governments).
• Investments: The investment strategies include investments in external financial assets, so funds invested exclusively in domestic assets are excluded.
• Aims and objectives: SWFs set up by the general government for macroeconomic purposes are created to invest government funds to achieve fiscal objectives and carry only defined broad obligations (IWG, 2008: 27).

The Political Economy of Public Finance (Edited by: Mustafa Çelen, Özkan Zülküfoğlu, Elżbieta Robak)
115
Sovereign wealth funds have six fundamental features (Makhlouf, 2010: 36):
• The fund must be completely state owned. • The fund must be managed separately from other government funds. • The fund must be prohibited from holding "explicit pension liabilities." • The fund should invest in diverse asset classes. • The fund should direct its investments to optimize its financial assets. • A significant portion of the fund capital should be allocated to global
investments.
The International Working Group of SWFs has estimated that the total assets of SWFs sextupled between the end of 2002 and the end of 2007, at which point assets under governance were $2.8 trillion (Truman, 2008). Contemporary estimates (Truman, 2010: 17) suggested that they would aggregate as much as $7.5 trillion by 2011, $12 trillion by 2015, and $17.5 trillion by 2017 (Bagnall & Truman, 2013: 2). Drezner (2008) claimed that sovereign wealth funds’ net worth exceeds $3 trillion. SWFs were responsible for 35% of the total union and obtaining activity in the 2007 financial crisis. Figure 1 shows the sovereign wealth fund market size by quarter for 1998-2017.
Figure 1: Sovereign Wealth Fund Market Size by Quarter 1998-2017
Source: http://www.swfinstitute.org/fund-rankings/, 03.05.2017.

Sevda Akar (Sovereign Wealth Funds: A Comparison of Turkey and Other Countries)
116
SWFs have a wide variety of purposes. The aims generally include (Lyons, 2007: 29):
• Ensuring macroeconomic stability: Countries dependent on commodity exports are generally exposed to fluctuations in global prices. The primary purpose of the fund here is to correct short- and medium-term fluctuations.
• Achieving higher returns: Countries seek to maximize returns. This creates opportunity costs associated with funds invested in risk-free assets.
• Supporting domestic industry: Some funds are used to restructure and promote domestic industries.
• Thinking future generations: Until natural resources are exhausted, funds are created for wealth reserves for future generations.
Griffith-Jones and Ocampo (2009) stated that SWFs can be broadly divided into two fundamental types based on their aims:
• Saving funds are considered to be consistent funds and are often associated with nonrenewable natural resources. They have created wealth reserves for future generations, so those generations can benefit from resources after their depletion.
• Stabilization funds are sometimes conditional funds that accumulate resources when paying in the event of high or low government revenues or export prices.
Sometimes, this division includes a third and fourth category. In the third category, the fund is called a financing fund and is designed to finance budget deficits by absorbing budget surpluses in operational rules. An example is the Norwegian fund. A fourth category is development funds that allocate resources to finance priority socio-economic projects, such as infrastructure (Griffith-Jones & Ocampo, 2009: 242).

The Political Economy of Public Finance (Edited by: Mustafa Çelen, Özkan Zülküfoğlu, Elżbieta Robak)
117
Another classification comes from Blackburn et al. (2008), who divided SWFs into two groups according to the sources of their funds. In the first group, funds are financed by commodity exports which are government owned or taxed. In the second group, funds are financed by transfers from surplus foreign exchange reserves. The fundamental difference between the two groups is that non-commodity funds generally contain exchange rate interventions that require the issuance of debt to offset inflationary pressures.
The organization of SWFs should state clear rules regarding how much of the funds will interact with the government budget. Truman (2008), the SWF should not be used as a second budget; unmanaged expenditures of a country’s SWF must be combined with the general budget of the government, and the government should not be explicitly or indirectly indebted to the resources established in the SWF.
2. Sovereign Wealth Funds’ Investment Policies
SWFs are long-term investments and tend to stabilize larger economies more effectively than short-term investments. However, they can cause volatility in the markets. Even so, during the last financial crisis, SWFs served as a major investment fund (Lang, 2011: 20).
The international standard on government cross-border investments by sovereign wealth funds should cover at least the following four topics (Truman, 2007: 7):
• Objectives and investment strategy: Policy objectives must clearly state how governments’ international investment activities are incorporated into the investment mechanism and how the gains are to be spent. The principles of this public policy should not be changed frequently.
• Governance: The role of the government and the managers of the investment mechanism should be clearly stated.
• Transparency: The operations of the investment mechanisms should be as transparent as possible. In practice, transparency should include annual and quarterly reports.

Sevda Akar (Sovereign Wealth Funds: A Comparison of Turkey and Other Countries)
118
• Behavior: Depending on the type of mechanism, its size, and the scope of its activities, it is desirable to establish behavioral guidelines with respect to the fund’s management. The basic case for the proposed approach rests on two major considerations: accountability (including the citizens of the home and host country and the international financial community) and protection (relevant to managers of the investment entity).
There are two investment schemes for SWFs, the administrator model and the investment corporation model. Figure 2 illustrates the investment models of SWFs. In the administrator model, the legal owner (usually the finance ministry) of the asset pool that makes up the SWF issues an investment order to an asset manager. In the investment corporation model, the government establishes an investment company with assets of the proprietary fund. This model is used when the investment strategy means more intensive investments in individual companies and active ownership. The institutional arrangements should be appropriate for the nature of the objectives and investments. The important thing to consider in adopting either approach is cost. For this reason, it may be more cost-effective to manage a small fund in an existing institution.
Figure 2: Investment Models of SWF
Administrator Model
Owner of
Assets
Administrator
Investment Corporation Model
Ope
rate
Owner Of
Investment Corporation Owns
Assets
Gives O
perate To

The Political Economy of Public Finance (Edited by: Mustafa Çelen, Özkan Zülküfoğlu, Elżbieta Robak)
119
Source: Al-Hassan, A., Papaioannou, M., Skancke, M., and Sung, C.C., (2013). Sovereign Wealth Funds: Aspects of Governance Structures and Investment Management. IMF Working Paper, WP/13/ 231, 1- 34.
The best practice is investment management of SWFs, with clear lines of duty and division of authority and responsibilities (Clark & Monk, 2010: 1723). SWFs contribute directly to developments in their own region. They can act as classical development financing institutions in their own countries and thus contribute to the diversification of economies, but when investing abroad these funds tend to act like classical private asset managers (Santiso, 2008: 12).
According to Gelb et al. (2014), if the SWF wants to function as a quality domestic investor, it should not be subject to investment quotas, but expenditure claims and restrictions should be adjustable. SWFs may also benefit from investing in partnerships with other financial agencies, including private investors, other SWFs, and co-financing. This can reduce financial risk, introduce supplementary expertise, and increase the reliability of investment decisions.
On the other hand, sovereign wealth funds cannot be considered as wholly without criticism. The first major criticism of SWFs is related to their activities. Balin (2008) asserted that the SWFs pertain to those funds that are not funded by commodity earnings. In this case, sovereign wealth funds can only grow through sterilized currency intervention and, thus, must garner returns higher than the bonds it disburses during sterilizations. Moreover, sovereign wealth funds have the potential to pose a threat to smaller, emerging market economies due to the lack of proper regulatory frameworks and “star” companies in these capital-hungry countries.
According to Park and Estradada (2009), another major risk to foreign direct investment by SWFs is financial protectionism. SWFs invest overseas rather than at home so their investments necessarily influence the interests of citizens and governments of the countries in which they purchase real and financial assets. Furthermore, host-country governments and citizens are generally more anxious and suspicious of state-owned investors than private sector investors. The high level of corruption and the poor legal environment of many SWF countries means that SWF investments may expose politicians or supporters to the possibility of using them for
Sevda Akar (Sovereign Wealth Funds: A Comparison of Turkey and Other Countries)
120
personal aim (Anthopoulos et al., 2016: 20). The lack of transparency in SWFs gives rise to these suspicions regarding their intentions (Lang, 2011: 20).

The Political Economy of Public Finance (Edited by: Mustafa Çelen, Özkan Zülküfoğlu, Elżbieta Robak)
121
3. Selected Countries with Sovereign Wealth Funds
Seventy-eight SWFs have been established in different countries in different ways (see Appendix). Sovereign wealth funds are not a new institute. SWFs have been applied in many countries for a long time.
Kuwait constituted the first modern fund in 1953. Then Alaska, Norway (the largest sovereign wealth funds), Australia, Canada, New Zealand, Mexico, and South Korea created funds. The Middle East and East Asian economies have the world's largest sovereign wealth funds. Due to SWF size, expected growth rate, recent investment trends, and countries of origin, they have entered the Middle East agenda. Oil-exporting economies have wealth funds that provide long-term revenue streams. These countries have tried to prevent Dutch disease, or the quick inflow of foreign currencies. Foreign investment through sovereign wealth funds can solve these problems. Countries with more exports, such as China, have used sovereign wealth funds to hold their currencies at a low monetary value against the dollar (Drezner, 2008: 222). The rough current dollar value in SWFs per citizen has changed greatly, as shown in Table 1. Moreover, the potential size of these funds is obscure (Blackburn et al., 2008: 3).
Table 1: Dollar Value in Each SWF Per Population and Citizen
$ in SWF per Population $ in SWF per Citizen UAE $191.000 $1.273.333 Kuwait $80.645 $200.000 Singapore $104.255 $132.432 Norway $80.851 $89.835 Russia $1.042 $1.057 China $154 $154
Source : Blackburn, J., DelVecchio, B., Fox, I., Gatenio, C., Khayum, O., Wolfson, D., (2008). Do Sovereign Wealth Funds Best Serve the Interest of Their Citizens?, p. 4.
The Norwegian Government Pension Fund-Global (GPF-G) is one of the world's largest and most transparent sovereign wealth funds. GPF-G is not a pension fund (shown in Figure 3). According to Clark and Monk (2010), GPF-G is a deposit account with the Norwegian National Bank: Assets are managed by Norwegian Bank

Sevda Akar (Sovereign Wealth Funds: A Comparison of Turkey and Other Countries)
122
Investment Management (NBIM). NBIM's investments, the allocation of assets and mission-based policies related to moral investment, are subject to ministry policies. The fund has an obvious task of integrating long-term investments with a bilateral ethical commitment. Long-term investment is governed by the accepted global principles of corporate governance, while the ethical commitment is intended to ensure that the fund is not associated with companies that are at risk for global social and environmental justice. For this reason, the most fundamental feature that differentiates the Norwegian fund from other sovereign wealth funds is that the fund has an ethical mandate.
Figure 3: The Governance of the Norwegian Government Pension Fund-Global
Source: Clark, L. G., Monk, A.H.B., (2010), The Legitimacy and Governance of Norway's Sovereign Wealth Fund: The Ethics of Global Investment, Environment, and Planning, 42, 1730.
The Norwegian Parliament
Ministry of Finance
Norwegian Bank
Act Belong to The Fund
National Budget Annual Report to the
Additional Provisions
Governance Quarterly-Annual Reports

The Political Economy of Public Finance (Edited by: Mustafa Çelen, Özkan Zülküfoğlu, Elżbieta Robak)
123
France created its own SWF in 2008, called Fonds Stratégique d'Investissement (FSI), designed to invest in French companies. The complicated French policy is reflected in the legal structure of the SWF equity investment. In 2005, France passed legislation to provide government control over foreign investment. The government, public institutions, and state-owned companies have actively engaged in cooperation with SWFs. So, for example, in 2009 the FSI signed a letter of intent with Mubadal, an Abu Dhabi SWF. The rise of SWFs and foreign investors in the 2000s was met with concern in Germany. The fear was state capitalism in which SWFs from countries that were not open themselves to foreign investment would take over German firms and then use their holdings for political aims. SWFs have almost always taken restricted shares rather than majority shares (Thatcher, 2013: 7).
In Russia, in 2008, the Oil Stabilization Fund, created in 2004, was divided into a Reserve Fund and National Welfare Fund. The former was capped at 10% of gross domestic product (GDP) and its aim was to ensure the government had funds to finance future fiscal deficits. The latter purpose was inter-temporal savings, chiefly to promote future pension outlays. The Reserve Fund only invests in foreign government bonds. The National Welfare Fund can invest in higher risk assets, including domestic assets such as loans to domestic banks. The future size of the funds will depend on future oil prices and government fiscal performance. However, the Reserve Fund is expected to be exhausted due to the ongoing fiscal deficit (Jaeger, 2010: 3).
Kazakhstan has two roles that play a critical role in the economy. The National Fund for the Future of Kazakhstan (NOF, "national oil fund") serves as a stabilization fund and savings fund. A government-owned holding company, Samruk Kazyna (SK, "sovereign wealth fund") acts as a development fund that focuses on the government's economic development goals. NOF is designed to provide economic stability and savings for future generations. Within the NOF are three separate portfolios or funds, each with unique investment criteria: a dollar-based stabilization fund and a savings fund, both managed by the National Bank of Kazakhstan, and a smaller fund managed by the finance ministry (Kemme, 2012: 2).
According to Balin (2008), the transparency of the SWF is directly related to the openness of the country’s political system: While funds in democratic countries such as Norway, Canada, the United States, and Australia are very open, accountable, and

Sevda Akar (Sovereign Wealth Funds: A Comparison of Turkey and Other Countries)
124
transparent, those of authoritarian countries such as the United Arab Emirates, Saudi Arabia, and Qatar are not.
4.Turkey Wealth Fund
On August 19, 2016, the Turkish Parliament approved the creation of the Turkey Wealth Fund in a vote of 217 to 22. The Official Gazette dated August 26, 2016, was then published and enacted (Kanayıran, 2016: 69). The Turkey Wealth Fund (TWF) is the country’s sovereign wealth fund and was legally established in 2016 by Law No. 6741. The capital of the company is 50,000,000 Turkish liras. If necessary, sub-funds related to the wealth fund can also be established (Official Gazette, 2016: 1)
The Turkey Wealth Fund is intended to achieve the following (Official Gazette, 2016: 1):
• An annual growth rate of 1.5% over the next ten years • Acceleration of growth and deepening in capital markets • Dissemination of the use of Islamic financing assets • Provision of additional employment with the investments to be made • In technology-intensive strategic sectors, support for domestic companies • Provision of financing to major infrastructure projects without raising public
sector debt • Increased share of participation in the financing sector • Direct investments in strategic sectors such as oil and natural gas which are
important for Turkey
The first argument put forward by the government in relation to establishing the Turkey Wealth Fund is the notion that Turkey is the only country in the G20 that does not have a sovereign wealth fund. However, when looking at the wealth funds of the G20 countries, one can see that not all of these funds are within the scope of the SWF and, broadly, the SWF can be evaluated under the state investment fund (Kanayıran, 2016: 71).
The Political Economy of Public Finance (Edited by: Mustafa Çelen, Özkan Zülküfoğlu, Elżbieta Robak)
125
Kanal Istanbul, which is one of the purposes of the fund, and presents the issue of financing specific projects, such as the third airport and installation of a nuclear power plant, indicates that the fund will operate as a certain type of public and private sector cooperation. So, the expected objectives of the Fund should be rational. In other words, the goals that are established should be related to the organizational structure and culture. The objectives of the Fund are stabilizing the economy, realizing growth, finding resources for government projects and creating employment, which are very ambitious. The fundamental reason for the establishment of the Fund is to use public resources more effectively and efficiently. In such a case, the question of whether a new corporation is needed when there is the Republic of Turkey prime ministry privatization administration is another matter to be discussed.
However, another distress factor is that the legal infrastructure is subject to the provisions of private law. It is outside the court of accounts. So another major criticism of its transparency is that audit reports prepared by independent auditors are only discussed in the plan and budget committees and not in the general assembly. This creates the perception that the public will not be able to follow a transparent and accountable institution.
The organization of the fund is in the form of headquarters and the main management units of the fund. The management of the fund for Turkey has consisted of at least five members including the board of directors and the chairman of the board. Since the establishment of the Fund, it hasn't performed any activities and the managers have been reassigned; the idea that the Fund cannot work effectively has become dominant. In addition, the uncertainties regarding the expenditures and investment plans of the Fund caused an increase in negative attitudes towards the Fund and attracted public reaction.
Whereas in many countries, wealth funds are linked to the Central Bank or the Ministry of Finance, confidence in strategic issues may be reduced if they are directly linked to the Prime Ministry in Turkey. They must be accountable, transparent, and outside the supervision of the parliament and the Court of Accounts, whereas the fund, which is connected to the Prime Ministry, is functionally making some sort of covert appropriation.

Sevda Akar (Sovereign Wealth Funds: A Comparison of Turkey and Other Countries)
126
For this reason, it is important that the wealth fund be structured as a state company, subject to Turkish trade laws, with many cases having an exemption and a special status. Company and wealth funds and companies and sub-funds to be established by the company are exempt from income and corporate tax. Furthermore, except for electricity and gas consumption tax and widespread insurance tax, the municipality is exempted from the liabilities of depositing guarantees from the real estate tax, participation fee, approval fee, land registry cadaster, and revolving capital charges in accordance with the law. Entity leasing established in the law on Public Finance and Debt Management Regulation enjoys all rights, exceptions, deductions, and exemptions to its companies. In addition, it is exempt from the registration fees and quotation fees that must be paid to Borsa İstanbul A.Ş. (Official Gazette, 2016: 1).
All of the shares of the Treasury, which are in the capital of the Republic of Turkey Ziraat Bank A.Ş., BOTAS Petroleum Pipeline Corporation, Turkish Petroleum, Postal and Telegraph Corporation (PTT), Borsa İstanbul A.Ş., TURKSAT Company, General Director of Eti Maden, General Directorate of Tea Enterprises (Cay-Kur), and the 6.68% shareholding of Turk Telekom A.Ş. have been transferred to the Turkey Wealth Fund. Furthermore, the immovable properties of Antalya, Aydın, Isparta, Istanbul, İzmir, Kayseri, and Muğla that belong to the Treasury have been transferred to TWF (Official Gazette, 2017: 1). The National Lottery Chance Games (Milli Piyango Şans Oyunları) was given to the Turkey Wealth Fund for 49 years on June 1, 2017. At the same time, the right to organize horse races and accept bets and the delegation of authority were transferred to the TWF. In addition, 49.12% shares of Turkish Airlines and TCDD İzmir Port were transferred to TWF on February 3, 2017. On the same day, 51.11% shares of Halkbank A.Ş. of Turkey and 49% of shares of Türkiye Denizcilik İşletmeleri A.Ş. were transferred to TWF. Also, 10% of the shares of Kayseri Şeker Fabrikası A.Ş. were transferred to TWF (http://www.turkiyevarlikfonu.com.tr/). All of these publicly funded companies were excluded from the scope of privatization and included in the portfolio of the Turkey Wealth Fund.
When a new income is not designated for the TWF, only a portion of the income that goes to the budget is transferred to this fund. Redirecting privatization revenues, which are normally transferred to the budget, to the fund is a development that will lead to a

The Political Economy of Public Finance (Edited by: Mustafa Çelen, Özkan Zülküfoğlu, Elżbieta Robak)
127
reduction in budget revenues and an increase in budget deficits (Eğilmez, 2016: 1). Due to the fact that the entity is not based on any budget and/or current excess, the fund is designed to collect public incomes in a separate pool. The fact that fund incomes are composed of privatization revenues may also cause certain problems in terms of limited revenue sources and income generation during future periods. In this case, the fund will have to borrow from international capital markets in order to generate income.
Yalçıner and Sürekli (2015) claimed that having the sovereign wealth fund will improve the structural problems of the Turkish economy, support economic development, and contribute to Turkey becoming more effective in the international arena. Among the main economic contributions are protection of financial markets during periods of political instability and economic fluctuation, payment of public debts by transferring resources from the fund to the public budget at the rates determined by the law during the crisis periods, development of international competitiveness of domestic companies in technology-intensive strategic sectors such as defense, aviation, and software, and financing of major infrastructure projects
The Turkey Wealth Fund should become more prominent in the international arena. It should take part in the investment market by working more effectively with other funds. The Fund should also make use of its experience by engaging with the others. In this case, it is possible to make changes and transfer sources with other funds. The Turkey Wealth Fund and the Russian Direct Investment Fund cooperated in 2017. With this cooperation, both funds set an investment target. It was understood that the resulting wealth fund acted as an investment fund.
In short, the wealth fund established in Turkey is different from the wealth funding practices in other countries in terms of purpose, function, and responsibility. The Turkish Wealth Fund is perceived in different ways, such as a development bank, public and private sector cooperation and implicit appropriation.
The institutional quality of the Turkey Wealth Fund will be realized over time. The most important issue in terms of supervising the Turkey Wealth Fund’s activities, which is not expected to be subject to Court of Accounts auditing, is Parliamentary Supervision. However, due to state ownership and the use of public resources, the fund must be taxable, transparent, and accountable and have a clear purpose and operation

Sevda Akar (Sovereign Wealth Funds: A Comparison of Turkey and Other Countries)
128
structure. In world applications, while SWFs are transferred to future generations, in Turkey it's the opposite. The Turkey Wealth Fund has structural problems associated with taxation, auditing, accountability, and transparency.
Conclusion
Although wealth funds are not new, they have garnered more attention in recent times. Especially after the 2008 financial crisis, countries have focused attention on these funds due to the purchase of companies’ toxic assets. Wealth funds are usually set up in countries that have a budget or export surplus. One can argue that this is why such funds represent a source of financing to be transferred to future generations and to ensure achievement of macroeconomic aims.
The Turkey Wealth Fund is the country’s sovereign wealth fund and was legally established in 2016 by Law No. 6741. The first argument put forward by the government in relation to establishing the Turkey Wealth Fund is that Turkey is the only country in the G20 that does not have sovereign wealth funds. The Turkey Wealth Fund does not rely on a commodity or an income surplus. On the contrary, Turkey has a current deficit as a structural problem. In addition, fund revenues stem from privatization revenues. However, the fund has been exempted from many taxation and corporate fees and is excluded from the audit of the Court of Accounts.
The TWF is expected to improve the structural problems of Turkey, achieve the economic targets of 2023, support economic development, and increase Turkey’s creditability in the international arena. To achieve these aims, TWF must be more transparently structured, create its own reserves, and start investing in financial markets. The capacity of the Fund should be set to fulfill all expected objectives of the Fund. Another reason for this is that the Fund has no self-owned revenue. In this case, transfer of some assets and revenue that belong to the public economy to the Fund suggests the existence of financial illusion. Some of the public revenues are removed from the budget system. In other words, the amount of extra-budgetary funds and revenues cannot be fully determined. That is why demand for public expenditures has steadily increased. Despite a year since the establishment of the Fund, it has not made any expenditures or investments.
The Political Economy of Public Finance (Edited by: Mustafa Çelen, Özkan Zülküfoğlu, Elżbieta Robak)
129
The Norwegian Government Pension Fund-Global can be taken as an example operating within this framework. The best practice for sovereign wealth funds is in Norway, which is the strongest example of a completely transparent fund. Some Funds are managed by public officials selected from appropriate public institutions. Norway GPF-G is managed by professional managers who have gained the reputation as smart investors. This fund is known to be transparent and well-managed. It is also seen as a model for other funds.
The reforms could have been made to improve existing institutions instead of establishing such a fund that is not based on any resource surplus of Turkey. The establishment of such a fund, in turn, acts as an investment or development fund from the wealth fund. For this reason, it is different from other wealth funds. For the Fund to function in an active manner, a sound and stable financial infrastructure must exist. Financial stability and fiscal discipline should be the primary goals of Turkey.
References
Al-Hassan, A., Papaioannou, M., Skancke, M. & Sung, C.C. (2013). Sovereign Wealth Funds: Aspects of Governance Structures and Investment Management. IMF Working Paper, WP/13/ 231, 1- 34.
Anthopoulos, I., Pitelis, C., & Liakou, C. (2016). The Nature, Performance and Economic Impact of Sovereign Wealth Funds. FESSUD Working Paper, No: 135, 1-38.
Bagnall, E.A., & Truman, M. E. (2013). Progress on Sovereign Wealth Fund Transparency and Accountability: An Updated SWF Scoreboard. Peterson Institute for International Economics. Policy Brief: August. Number: PB13-19, 1-29.
Balin, B.J. (2008). Sovereign Wealth Funds: A Critical Analysis. 1-18. Electronic copy available at: http://ssrn.com/abstract=1477725.
Blackburn, J., DelVecchio, B., Fox, I., Gatenio, C., Khayum, O., & Wolfson, D. (2008). Do Sovereign Wealth Funds Best Serve the Interest of Their Citizens?. Retrieved from: SSRN: https://ssrn.com/abstract=1309285 or http://dx.doi.org/10.2139/ssrn.1309285.
Bremmer, I. (2008). The Return of State Capitalism. Survival Global Poltics and Strategy, 50 (3), 55-64, DOI: 10.1080/00396330802173198.
Bremmer, I. (2010). The End Of The Free Market: Who Wins The War Between States And Corporations?. Retrived from:
Sevda Akar (Sovereign Wealth Funds: A Comparison of Turkey and Other Countries)
130
http://www.ianbremmer.com/sites/default/files/excerpts/ian_bremmer_eofm.pdf
Clark, L. G., & Monk, A.H.B. (2010). The Legitimacy and Governance of Norway's Sovereign Wealth Fund: The Ethics of Global Investment, Environment and Planning, 42, 1723-1738.
Drezner, D. W. (2008). BRIC by BRIC: The Emergent Regime of Sovereign Wealth Funds, in Rising States and Rising Institutions, Alan S. Alexandroff and Andrew F. Cooper (Ed.), (Washington D.C.: Brookings Institution Press, 2010), 218-239.
Eğilmez, M. (2016). Varlık Fonu. http://www.mahfiegilmez.com/2016/08/varlk-fonu.html Retrived Date: 15.05.2017
Gelb, A., Tordo, S., Halland, H., Afraa, N., & Smith, G. (2014). Sovereign Wealth Funds and Long-Term Development Finance Risks and Opportunities. Policy Research Working Paper, No: 6776. http://econ.worldbank.org
Griffith-Jones, S., & Ocampo J. A. (2009). Sovereign Wealth Funds: A Developing Country Perspective . In: Revue d'économie financière. Hors-série, Special Issue. pp. 241-254. http://www.persee.fr/docAsPDF/ecofi_1767-4603_2009_hos_9_1_5511.pdf
IWG. (2008). Sovereign Wealth Funds: Generally Accepted Principles and Practices: Santiago Principles. October, 1-59. Retrieved from: http://www.ecgi.org/codes/documents/iwg_santiago_principles_oct2008_en.pdf
Jaeger, M. (2010). BRIC Sovereign Wealth Funds: The External Wealth of Governments. Deutsche Bank Research, Research Briefing, Economics & Politics, September 24, 1-6.
Kayıran, M. (2016). An Assessment of the Aims and Architecture of Sovereign Wealth Fund of Turkey, (Türkiye Varlik Fonu’nun Kuruluş Amaçlari Ve Yapisi Üzerine Bir Değerlendirme), Education Science Society Journal, 14 (56), 55-90.
Kemme, D. (2012). Sovereign Wealth Fund Issues and The National Fund(s) of Kazakhstan. William Davidson Institute Working Paper, Number: 1036, 1-66. Electronic copy available at: http://ssrn.com/abstract=2188391
Lang, E.L. (2011). Financial Points of Entry. Sovereign Wealth Funds: Hidden Security Threat or Smart Finance?. The Thesis, Faculty of the Graduate School of Arts and Sciences of Georgetown University. 1-34.
Lyons, G. (2007). State Capitalism: The Rise Of Sovereign Wealth Funds. Standard Chartered Bank Publication, https://www.banking.senate.gov/public/_cache/files/633fb894-

The Political Economy of Public Finance (Edited by: Mustafa Çelen, Özkan Zülküfoğlu, Elżbieta Robak)
131
e127-4653-ac4e-d89d6b357903/23C6AE00CC53D93492511CC744028B5E.111407-lyons.pdf
Makhlouf, H.H. (2010). Sovereign Wealth Funds. in International Journal of Government Financial Management. International Consortium on Government Financial Management Publisable, Vo. X, No. 1. 35-42.
Musacchio, A., Lazzarini, S.G. (2012). Leviathan in Business: Varieties of State Capitalism and their Implications for Economic Performance. Harvard Business School Working Paper, No. 12–108, 1-62.
Park, D., & Estrada, G.B. (2009). Developing Asia’s Sovereign Wealth Funds and Outward Foreign Direct Investment. ADB Economics Working Paper Series, No. 169, Electronic copy available at: http://ssrn.com/abstract=1616970
Santiso, J. (2008). Sovereign Development Funds: Key Financial Actors of the Shifting Wealth of Nations. OECD Emerging Markets Network Working Paper. October, 1-23.
Santiso, J. (2013). Sovereign Wealth Funds 2012. Retrieved from: http://itemsweb.esade.edu/wi/Prensa/SWFsReport2012.pdf
Şimşek, O. (2015). Yeni Devlet Kapitalizminin Yükselişi: Küresel Ekonomi-Politik Bir İnceleme. Atılım Sosyal Bilimler Dergisi, 5 (2), 106-144.
Thatcher, M. (2013). National Policies Towards Sovereign Wealth Funds in Europe: A Comparison of France, Germany and Italy. Kuwait Programme on Development, Governance and Globalisation in the Gulf States Policy Brief, No: 2. 1-17 www.lse.ac.uk/LSEKP/
The SWFI. (May, 2015). What Is a SWF. http://www.swfinstitute.org/sovereign-wealth-fund/ Retrived Date: 03.05.2017
Truman, E.M. (2007). Sovereign Wealth Funds: The Need for Greater Transparency and Accountability. Peterson Institute for International Economics. Policy Brief: August. Number: PBO7-6, 1-9.
Truman, M. E. (2008). A Blueprint for Sovereign Wealth Fund Best Practices. Peterson Institute for International Economics. Policy Brief: April. Number: PBO8-3, 1-21.
Türkiye Varlik Fonu Yönetimi Anonim Şirketinin Kurulmasi İle Bazi Kanunlarda Değişiklik Yapilmasina Dair Kanun, (2016), Official Gazette, 29813, 19.08.2016 http://www2.tbmm.gov.tr/d26/1/1-0750.pdf, Retrived Date: 12.05.2017.
Türkiye Varlık Fonuna Aktarılan Kuruluş, Kaynak ve Varlıklar Hakkında Karar, (2017) Official Gazette, 29970, 24.01.2017 http://www.resmigazete.gov.tr/eskiler/2017/02/20170205M1-1.pdf Retrived Date: 20.05.2017

Sevda Akar (Sovereign Wealth Funds: A Comparison of Turkey and Other Countries)
132
Yalçıner, K., & Sürekli, A.M. (2015). The Applicability Of The Sovereign Wealth Fund Model For Turkish Economy, As A Tool Of Diversification Of The Economy (Ekonominin Çeşitlendirilmesinin Bir Araci Olarak Ulusal Refah Fonu Modelinin Türkiye Ekonomisi Açisindan Uygulanabilirliği). Gazi Üniversitesi İktisadi ve İdari Bilimler Fakültesi. 17(3), 1 -29.
http://www.turkiyevarlikfonu.com.tr/ Retrived Date: 20.05.2017
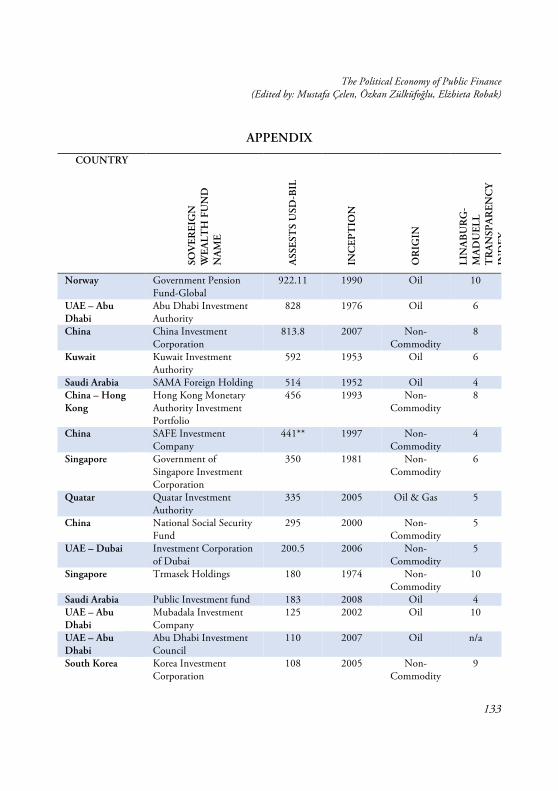
The Political Economy of Public Finance (Edited by: Mustafa Çelen, Özkan Zülküfoğlu, Elżbieta Robak)
133
APPENDIX
COUNTRY
SOV
EREI
GN
W
EALT
H F
UN
D
NA
ME
ASS
EST
S U
SD-B
IL
INC
EPT
ION
OR
IGIN
LIN
AB
UR
G-
MA
DU
ELL
TR
AN
SPA
REN
CY
IN
DEX
Norway Government Pension Fund-Global
922.11 1990 Oil 10
UAE – Abu Dhabi
Abu Dhabi Investment Authority
828 1976 Oil 6
China China Investment Corporation
813.8 2007 Non-Commodity
8
Kuwait Kuwait Investment Authority
592 1953 Oil 6
Saudi Arabia SAMA Foreign Holding 514 1952 Oil 4 China – Hong Kong
Hong Kong Monetary Authority Investment Portfolio
456 1993 Non-Commodity
8
China SAFE Investment Company
441** 1997 Non-Commodity
4
Singapore Government of Singapore Investment Corporation
350 1981 Non-Commodity
6
Quatar Quatar Investment Authority
335 2005 Oil & Gas 5
China National Social Security Fund
295 2000 Non-Commodity
5
UAE – Dubai Investment Corporation of Dubai
200.5 2006 Non-Commodity
5
Singapore Trmasek Holdings 180 1974 Non-Commodity
10
Saudi Arabia Public Investment fund 183 2008 Oil 4 UAE – Abu Dhabi
Mubadala Investment Company
125 2002 Oil 10
UAE – Abu Dhabi
Abu Dhabi Investment Council
110 2007 Oil n/a
South Korea Korea Investment Corporation
108 2005 Non-Commodity
9

Sevda Akar (Sovereign Wealth Funds: A Comparison of Turkey and Other Countries)
134
Australia Australian Future Fund 91.1 2006 Non-Commodity
10
Russia National Welfare Fund 72.2 2008 Oil 5 Libya Libyan Investment
Authority 66 2006 Oil 1
Kazakhstan Kazakhstan National Fun
64.7 2000 Oil 2
Kazakhstan Samruk-Kazyna JSC 60.9 2008 Non-Commodity
10
Iran National Development Fund of Iran
62 2011 Oil & Gas 5
US – Alaska Alaska Permanent Fund 54.8 1976 Oil 10 Brunei Brunei Investment
Agency 40 1983 Oil 1
US – Texas Texas Permanent School Fund
37.7 1854 Oil & Other 9
Malaysia Khazanah Nasional 34.9 1993 Non-Commodity
9
UAE – Federal Emirates Investment Authority
34 2007 Oil 3
Azerbaijan State Oil Fund 33.1 1999 Oil 10 New Zealand New Zealand
Superannuation Fund 22.7 2003 Non-
Commodity 10
US – New Mexico
New Mexico State Investment Council
20.2 1958 Oil & Gas 9
Oman State General Reserve Fund
18 1980 Oil & Gas 4
US – Texas Permanent University Fund
17.3 1876 Oil & Gas n/a
East Timor Timor-Leste Petroleum Fund
16.6 2008 Oil & Gas 8
Russia Reserve Fund 16.2 2008 Oil 5 Chile Social and Economic
Stabilization Fund 14.7 2007 Copper 10
Canada Alberta’s Heritage Fund 13.4 1976 Oil 9 Russia Russian Direct
Investment Fund 13 2011 Non-
Commodity n/a
Bahrain Mumtalakat Hoding Company
10.6 2006 Non-Commodity
10
Chile Pension Reserve Fund 9.4 2006 Copper 10 Ireland Ireland Strategic
Investment Fund 8.5 2001 Non-
Commodity 10
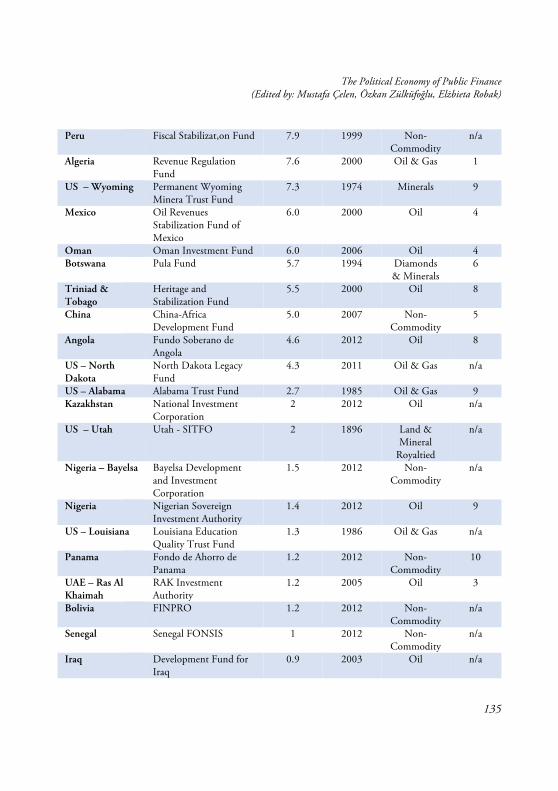
The Political Economy of Public Finance (Edited by: Mustafa Çelen, Özkan Zülküfoğlu, Elżbieta Robak)
135
Peru Fiscal Stabilizat,on Fund 7.9 1999 Non-Commodity
n/a
Algeria Revenue Regulation Fund
7.6 2000 Oil & Gas 1
US – Wyoming Permanent Wyoming Minera Trust Fund
7.3 1974 Minerals 9
Mexico Oil Revenues Stabilization Fund of Mexico
6.0 2000 Oil 4
Oman Oman Investment Fund 6.0 2006 Oil 4 Botswana Pula Fund 5.7 1994 Diamonds
& Minerals 6
Triniad & Tobago
Heritage and Stabilization Fund
5.5 2000 Oil 8
China China-Africa Development Fund
5.0 2007 Non-Commodity
5
Angola Fundo Soberano de Angola
4.6 2012 Oil 8
US – North Dakota
North Dakota Legacy Fund
4.3 2011 Oil & Gas n/a
US – Alabama Alabama Trust Fund 2.7 1985 Oil & Gas 9 Kazakhstan National Investment
Corporation 2 2012 Oil n/a
US – Utah Utah - SITFO 2 1896 Land & Mineral
Royaltied
n/a
Nigeria – Bayelsa Bayelsa Development and Investment Corporation
1.5 2012 Non-Commodity
n/a
Nigeria Nigerian Sovereign Investment Authority
1.4 2012 Oil 9
US – Louisiana Louisiana Education Quality Trust Fund
1.3 1986 Oil & Gas n/a
Panama Fondo de Ahorro de Panama
1.2 2012 Non-Commodity
10
UAE – Ras Al Khaimah
RAK Investment Authority
1.2 2005 Oil 3
Bolivia FINPRO 1.2 2012 Non-Commodity
n/a
Senegal Senegal FONSIS 1 2012 Non-Commodity
n/a
Iraq Development Fund for Iraq
0.9 2003 Oil n/a

Sevda Akar (Sovereign Wealth Funds: A Comparison of Turkey and Other Countries)
136
Palestine Plaestine Investment Fund
0.8 2003 Non-Commodity
n/a
Venezuela FEM 0.8 1998 Oil 1 Kiribati Revenue Equalization
Reserve Fund 0.6 1956 Phosphates 1
Vietnam State Capital Investment Corporation
0.5 2006 Non-Commodity
4
Brazil Sovereign Fund of Brazil 0.5 2008 Non-Commodity
9
Gabon Gabon Sovereign Wealth Fund
0.4 1998 Oil n/a
Ghana Ghana Petroleum Funds 0.45 2011 Oil n/a Mauritania National Fund for
Hydrocarbon Reserves 0.3 2006 Oil & Gas 1
Australia Western Australian Fytyre Fund
0.3 2012 Minerals n/a
Mongolia Fiscal Stability Fund 0.3 2011 Minerals n/a Equatorial Guinea
Fund for Future Generations
0.08 2002 Oil n/a
Papua New Guinea
Papua New Guinea Sovereign Wealth Fund
n/a 2011 Gas n/a
Turkmenistan Turkmenistan Stabilization Fund
n/a 2008 Oil & Gas n/a
US – West Virginia
West Virginia Future Fund
n/a 2014 Oil & Gas n/a
Mexico Fondo Mexicano del Petroleo
n/a 2014 Oil & Gas n/a
UAE – Sharjah Sharjah Asset Management
n/a 2008 Non-Commodity
n/a
Turkey Turkey Wealth Fund n/a 2016 Non-Commodity
n/a
Total Oil & Gas Related $4,220.84 Total Other $3,146.50 TOTAL $7.367.34
**This number is a best guess estimation Source: Sovereign Wealth Fund Institute (SWFI), Updated April 2017 http://www.swfinstitute.org/sovereign-wealth-fund-rankings/
The Political Economy of Public Finance (Edited by: Mustafa Çelen, Özkan Zülküfoğlu, Elżbieta Robak)
137
Intergovernmental Fiscal Transfers And Turkey’s Implementation: Amendments In Fiscal Transfer System Set In Law No. 6360
Aykut Aydın Abstract
It is compulsory to establish a relationship between the local and the central government so that public needs are met quickly and efficiently and resources made available more effectively. Literature generally maintains that the central government should play an important role in ensuring efficient allocation of resources, economic stability and the redistribution of income. However, local governments are also vital to the effective allocation of resources. To accomplish this, one of the most important conditions is to set an effective intergovernmental fiscal transfer system. In this study, the transfer system in Turkey (after and before Law No. 6360) has been analysed numerically. The results of the analysis and the problems arising in this system have been evaluated. Approximately 55 percent of the local government revenues consist of funds transferred through financial transactions This new system has not ushered in any serious changes. There was a relative increase in the share of the metropolitan municipalities from the general budget tax revenues and a relative increase in the share of special provincial administrations per capita.
Key Words: Local Governments, Intergovernmental Fiscal Transfers, Law No. 6360, Turkey.
Introduction
6

Aykut Aydın (Intergovernmental Fiscal Transfers And Turkey’s Implementation: Amendments In Fiscal Transfer System Set In Law No. 6360)
138
he state cannot fulfil public needs only by the activities of the central administration. It is imperative for the central administration and the local authorities to establish a certain relationship to prevent wasteful use of resources
(economic aspect), to eliminate jurisdictional conflicts (political aspect) and to prevent disturbances in society (administrative aspect) (Nadaroğlu, 2001: 51). The theory of fiscal federalism sets out a general normative framework for the allocation of functions at different levels of government using appropriate instruments for providing public service. According to this theory, central administration should perform basic functions such as macro-economic stabilisation, welfare benefit and regulation of income distribution. The primary role of decentralisation is to effectively supply public goods at the local level (Musgrave, 1959: 5-6). Intergovernmental fiscal relations are based on the distribution of the intergovernmental services and hence the distribution of expenditures and that of the revenues to finance the expenditures. In the literature, some developments have emerged on the distribution of implementation of duties and revenue allocation among the government levels, especially in terms of design and effects of intergovernmental fiscal transfers (Bird, 2017: 151-152).
This study focuses on the intergovernmental fiscal transfer system in Turkey. It attempts to determine the principles adopted in fiscal transfers, types of arrangements, the importance and the efficiency of fiscal transfers for the public services provided; how are the fiscal transfers in Turkey organised and its functionality. By evaluating the intergovernmental fiscal transfer system and its existing problems, this study suggests improvements in the transfer system and efficient handling of responsibilities by the local governments. In addition, the study attempts to contribute to the arguments about Law No. 6360 in effect from 30 March 2014 ‘Law on the Establishment of Fourteen Metropolitan Municipality and Twenty-Seven Districts and Amendments made in Certain Laws and Decrees’ and to amendments and regulations concerning the shares of the general budget tax revenue. The first part of the study briefly describes the fiscal transfers within a theoretical framework. The second part explains the design of intergovernmental fiscal relations. First, revenue structures of local governments in Turkey are examined in terms of own revenues and transfer revenues. Second, the methods and principles given in the legislation and the information obtained by literature survey are evaluated and new applications brought to the Turkish fiscal transfer system by Law No. 6360 are evaluated based on the years. The last part of the
T

The Political Economy of Public Finance (Edited by: Mustafa Çelen, Özkan Zülküfoğlu, Elżbieta Robak)
139
study tries to answer how to make the intergovernmental fiscal transfers system better and what kind of arrangements should be made so that the local governments can efficiently fulfil the public services in the areas of their responsibility by evaluating the current problems of the intergovernmental fiscal transfers system in Turkey.
1. Intergovernmental Fiscal Transfer System in Theory
Fiscal transfers are expressed as resources transferred from central government to lower-level government units. However, it is not a definite rule that fiscal transfers are from central government to the local government. In some countries, there is also transfer of resources from the local to the central government. An exception is the transfer from federated states to central government, as in Germany. Transfers to local governments have several purposes. While local governments have the authority to spend on many issues, the sources of revenues to finance them are not as diverse and particularly efficient as the central government. This disproportionate service and revenue distribution occurring between the central government and the lower levels of government is called ‘vertical fiscal imbalance’ (Sağbaş, 2010: 144). ‘Horizontal fiscal imbalance’ arises when local governments at the same level have different financial capacities and needs. These imbalances that occur in financial structures are tried to be balanced out by means of intergovernmental fiscal transfers. Intergovernmental fiscal transfers also aim to ‘internalise the influence of externalities’ (Ahmad and Craig, 1997: 73).
The transfer system can be applied as conditional and unconditional transfers. The central government may transfer funds to the local government to enable a certain financial power so that the essential services can be provided in certain standards only if they are used according to the determined purpose. This transfer is called ‘conditional transfers’ (Rosen and Gayer, 2010: 528). There are two types of conditional transfers: matching grants and non-matching grants. In these transfers, the central government has a unit of grants to the public goods and services that are subject of assistance and the receiving local government also must contribute a certain amount (Blöchliger King, 2006: 172). These transfers are divided into two groups, such as open-ended and close-ended transfers, on the basis of provision. In open-ended matching transfers, there is no upper limit for contribution by the donating government, while close-end matching transfers have an upper limit. The upper limit for contribution of the central

Aykut Aydın (Intergovernmental Fiscal Transfers And Turkey’s Implementation: Amendments In Fiscal Transfer System Set In Law No. 6360)
140
government to the goods and services provided by the local government is predetermined. The central government cannot exceed this upper limit in the transfer of funds. The central government sometimes donates enough to cover the full cost of the service provided with the clause that the donation will be used only for the determined public service. Such grants that are not required to be financially contributed to by local governments are called ‘non-matching’ (Bergvall, Charbit, Kraan and Merk, 2006: 7). In unconditional transfers, no restrictions are imposed on the local governments for use of funds transferred by the central government. The local governments are free to use these transfers as required provided they are compliant with the legislation. Such transfers, which are provided as general budget support, are a necessity that must be fulfilled in accordance with the law. It is also called general purpose transfers.
The distribution criteria of transfers are structured as a fixed percentage of the total national income, referred to as the income sharing method. It is the best way to achieve certain stability and transparency. The central government may allocate a proportion of total revenues or one or more taxes to local governments (Slack, 2007: 461). With this method, local governments have a stable income structure but it limits the flexibility of the central government. Especially during recession, even if the central budget is restricted, it must transfer a fixed percentage of the revenues to local governments. In some cases, some governments may determine distribution pools as part of annual budget decisions, according to their budgeting priorities. This system is based on political consolation or negotiation rather than objective decisions, so that the central government creates an important control mechanism over the local government. Changing from year to year, the amount of pool funding can be ad hoc. Thus, in situations of economic recession, in case of financial crises, local governments may face a massive loss of revenue (Irawan, Tacconiand Ring, 2013:48). In the transfer pool, there are various applications for organising certain expenditure items. The central government predetermines the expenditure items to be covered and then guarantees that this amount will be transferred to local governments within the framework of certain rules. In this cost-dependent method, decisions tend to be ad hoc. In addition, central government has a strong control over local governments since the application of transfer and the determination of the amount are under absolute sovereignty of the central government. The distribution of the transfer pool to the local governments may

The Political Economy of Public Finance (Edited by: Mustafa Çelen, Özkan Zülküfoğlu, Elżbieta Robak)
141
be determined in four methods: (i) Intergovernmental transfer based on tax sharing, a certain part of the tax collected within the boundaries of a settlement is allocated to that government unit. However, local governments have no say in determining tax rates and tax base; (ii) As part of the annual budgeting process of the central government, it is a method of distribution based on negotiation and political opinion, without specific objective rules. Such transfers, which are allocated annually by the central government to local governments by ad hoc method, are more centralised, less transparent and equal and more inefficient and unstable (Slack: 461); (iii) The central government ensures that the local governments will self-finance a few public services. For financing of such services, funds are transferred to local governments after the cost is determined (Bahl and Linn, 1998: 446); (iv) Quantitative and objective criteria are used in the allocation of revenues pool in the formula-based transfer mechanism. Therefore, formula-based transfer mechanism provides the best sense of justice among the recipients (Bahl, Boexand Martinez-Vazquez, 2001: 13).
2.Intergovernmental Fiscal Transfers in Turkey
The local governments in Turkey are characterised by a general framework of the duties of local administrations and income structures as determined in the Constitution. In Article 127 of Turkey Constitution, local governments are defined as public legal entities and their establishment, duties and authorities can be regulated by law in accordance with the local governing principle.1 On the other hand, the Turkish local governments’ own source of revenues are rather limited and have limited scope of increased inflow. Therefore, the most important sources of revenue for the local governments are the shares granted by the central government. The principles and procedures for intergovernmental transfers are also determined by law and are allocated by central to local governments from the general budget tax revenues.
1In a related article of the Constitution (Act No. 2709, the Constitution of the Republic of Turkey.), with the provision of ‘the formation, duties and powers of the local administrations shall be regulated by law in accordance with the principle of local administration’, the duties, powers and fiscal regulations of local governments are formed in accordance with the laws.

Aykut Aydın (Intergovernmental Fiscal Transfers And Turkey’s Implementation: Amendments In Fiscal Transfer System Set In Law No. 6360)
142
2.1.The Revenue Structure of Local Governments in Turkey
In Turkey, the central government allocates some sources of revenues that fall under its administration to ensure that the local governments can fulfil their responsibilities. Allocation is determined in two ways: First, certain resources under the control of the central government are allotted to the local government. The local governments earn revenues from these resources through tax sharing. Second, central government provides financial assistance through transfers to local governments from the sources under its control. This constitutes the structure of the fiscal transfer system. Another source of revenue for local governments is borrowing. However, this aspect is covered in this study.
2.1.1. The Own Source of Revenues of Local Governments in Turkey
The local governments’ own sources of revenues consist of taxes collected based on earning capacity of the local people, as well as revenues other than taxes from potential resources. Accrual, follow-up and collections are made by the local governments (Kerimoğlu, Güngör and Koyuncu, 2009: 79). These sources of own revenues of local governments consist of tax revenues, revenues of institution and enterprises, interest and fine revenues and return on capital.
Of the total revenue, the share of the own revenues of a metropolitan municipal is 25 percent on average, that of the municipalities is 44 percent and that of the provincial special administrations is 8 percent. The total share of tax revenues, among others, is 2 percent for a metropolitan municipal on average, 15 percent on average for provincial municipality and 0.5 percent for provincial private administrations. In other words, local governments have limited flexibility to increase their own revenues. Only the municipalities have regular and predictable own revenues with limited share. The sources such as estate tax, sanitation tax, construction mortar and occupation mortar are included in local taxes and mortars.

The Political Economy of Public Finance (Edited by: Mustafa Çelen, Özkan Zülküfoğlu, Elżbieta Robak)
143
2.1.2. The Transfer Revenues of the Local Governments in Turkey.
In Turkey, the intergovernmental fiscal transfer system is organised as shares allocated to municipalities and the special provincial administrations from the general budget tax revenues (GBTRs) and the ‘intergovernmental donations and grants’ transferred. The shares granted from GBTR and donations have a significant role in local government revenues. In Turkey, the intergovernmental transfer system has been regulated by the laws issued before 1981: Law No. 2380 on the share of GBTR to the municipalities and special provincial administrations, issued in 1981; Law No. 5779 ‘Special Provincial Administrations and Municipalities, General Budget Tax Amendments to the Law on the Appropriation of Revenues’ issued in 2008; the amendments to law 5779 and Law No. 6360 ‘Law on the Establishment of Fourteen Metropolitan Municipality and Twenty-Seven Districts and Amendments made in Certain Laws and Decrees’, which came into force as of March 2014. These regulations give information about the development of the fiscal transfer structure in Turkey.
2.1.2.1. The Transfer System Before 1981
There was no regular transfer system before 1981. In this period, the method of tax revenue sharing system was adopted in financing local governments. This is the most important reason why a regular transfer system could not have been established. However, intermittently, the central government has always granted local governments many donations and grants titled as ‘treasury grants, state grants and central administration grants’. A large part of these grants is included in the category of ‘conditional transfers’. Province and village roads built by the General Directorate of Highways by expending from the GBTR budget is as typical example of this type of transfer application (Nadaroğlu, 1991: 35). Until 1981, the revenues of local governments were allocated by various laws.2 Within the framework of these laws, ‘tax
2The transfer structure of the shares allocated to municipalities and special provincial administrations. was established with the municipal law numbered 1580, Municipal Revenue Law No. 5237, Special Provincial Administration Law dated 1913, Village Law No. 442 and various other laws,

Aykut Aydın (Intergovernmental Fiscal Transfers And Turkey’s Implementation: Amendments In Fiscal Transfer System Set In Law No. 6360)
144
revenue sharing system’ was adopted as central government–allocated shares from the taxes collected to special provincial administrations and municipalities.
2.1.2.2. The Transfer System After 1981
After 1981, a system of distributing shares from the collected GBTR has been adopted in place of the tax revenue sharing system. The percentage and method of allocating shares from GBTR has changed several times since then. Following is a short description of the laws covering the intergovernmental fiscal transfer system chronologically.
Law No. 2380
In accordance to the Law No. 23803 enforced in 1981, it is foreseen to grant shares to the municipalities and special provincial administrations from general budget revenues by considering the population as per the last population census. According to Article 1 of the related law, a 5 percent share is allocated to municipalities and 1 percent share to special provincial administrations over the total of general budget revenues collection. It is foreseen that these shares will be allocated by İLBANK A.Ş. to municipalities and special provincial administrations according to the results of the last general population census (Nadaroğlu, 1991: 39).
Law No.5779
With Article 8 of Law No. 5779 dated 2 July 2008, the provisions related to the shares included in Law No. 2380 and Law No. 5216 were abolished and the shares transferred to local governments were rearranged. With this arrangement, local governments’ share of GBTR has been increased due to the expansion of the pool rather than increasing the ratio, and the distribution criteria of the shares have changed.4 With Law No. 5779,
3It was accepted on 2 February 1981 and published in an Official Gazette dated 5 February 1981 and numbered 17242 4 During the implementations till July 2008, according to the Private Consumption Tax Law No. 4760, all of the Special Consumption Tax over natural gas and petroleum, 28 percent of the Special Consumption Tax on motor vehicles , 28 percent of the Special Consumption Tax on
The Political Economy of Public Finance (Edited by: Mustafa Çelen, Özkan Zülküfoğlu, Elżbieta Robak)
145
5 percent of the GBTRs collected within the geographical size of the metropolitan municipalities is calculated as the metropolitan share; 70 percent of this share is directly related to the metropolitan geographic size, while the remaining 30 per cent is pooled and distributed among the other metropolitan cities in proportion to their population; 2.50 percent of the total of GBTR is the share of metropolitan district municipalities, 2.85 percent is the share of municipalities outside the metropolitan border and 1.15 percent is the share of the special provincial administrations. As much as 30 percent of the share allocated to metropolitan municipalities is set aside as a share of metropolitan district municipalities and 10 percent of the share is allocated to water and sewerage administration shares related to the relevant metropolitan municipality as ordered by the Law No. 2560 titled ‘Law on the Establishment and Duties of General Directorate of Istanbul Water and Sewerage Administration’. The portion of these shares, allocated from GBTR, belonging to the metropolitan municipality is directly allocated to the metropolitan municipal budget by the Ministry of Finance. The shares of the other administrations are allocated to the budgets of the relevant administrations by İLBANK A.Ş.
Law No. 6360
Law No. 6360 dated 6 December 2012, which entered into force with the elections of local governments dated 30 March 2014, brought about significant changes in Law No. 5579 and introduced a big city model for 30 provinces. With this law, 14 metropolitan municipalities and 28 metropolitan district municipalities were established. According to the law, metropolitan district municipalities have increased from 143 to 519, provincial centre municipalities decreased from 65 to 51, district municipalities outside the geographic size of the metropolitan municipalities decreased from 749 to 400, and township municipalities decreased from 1.977 to 396. Municipalities below 2000 have been converted into villages. Consequently, the number of municipalities totalling 2950
alcoholic and sparkling beverages and according to the article 39 of the General Tax law 60 percent of the Special Consumption Tax on tobacco products was not included in the calculation of the share of local governments. With law no. 5779, transfers made to the local governments were increased by including the calculation of the share of these taxes (except for all the special consumption tax on petroleum). The ratio of these taxes to total taxes according to 2007 data is 23 percent (Kerimoğlu, Güngör, Koyuncu: 81)

Aykut Aydın (Intergovernmental Fiscal Transfers And Turkey’s Implementation: Amendments In Fiscal Transfer System Set In Law No. 6360)
146
decreased to 1,396. With these changes in the local government units, the shares granted from the GBTR have also been rearranged.
Pursuant to Law No. 6360, it was concluded that 6 percent of the GBTRs collected within the borders of the metropolitan municipalities and 30 percent of the shares allocated to the metropolitan district municipalities were allocated as the share of the metropolitan municipality. According to this, 60 percent of the 6 percent share which the metropolitan municipalities receive from GBTR will be allocated directly. The remaining 40 percent is pooled (30 percent is distributed according to the geographic size and 70 percent is distributed according to the size population). Metropolitan municipality shares are transferred directly to the relevant municipal budgets by the Ministry of Finance according to the principles set out in the distribution criteria.5
According to the law, the share of the metropolitan district municipality is 4.50 percent; 90 percent of this share is distributed according to the population size and 10 percent according to the geographic size. Of the calculated amount, 10 percent is remitted to the water and sewerage administration6 of the related city and 30 percent to the metropolitan municipality, the remaining amount is transferred to metropolitan district municipalities through İLBANK A.Ş. For the provincial municipalities, 1.50 percent of the GBTR collection is allocated; 80 percent of this share is distributed according to
5In addition, by abolishing the provision ‘The increase in the municipal share of the big city cannot be more than 20 per cent of the amounts accrued in the same month of the previous year, the excess amounts are distributed on the basis of the population, not exceeding this ratio in the metropolitan municipalities with an increase rate of less than 20 per cent’ in law no.5779 a significant advantage provided especially for the metropolitan municipalities with a high collection rate of GBTR collected within their borders. Because the metropolitans with an increase in rate of less than 20 percent were distributed to avoid exceeding this rate, the share of capital (exceeding 20 percent increase) was causing a loss of revenue for the metropolitan municipality. 6In accordance with Law no. 2560, published on 23 November 1981 official gazette, the Establishment and Duties of the General Directorate of Istanbul Water and Sewerage Administration (ISKI).
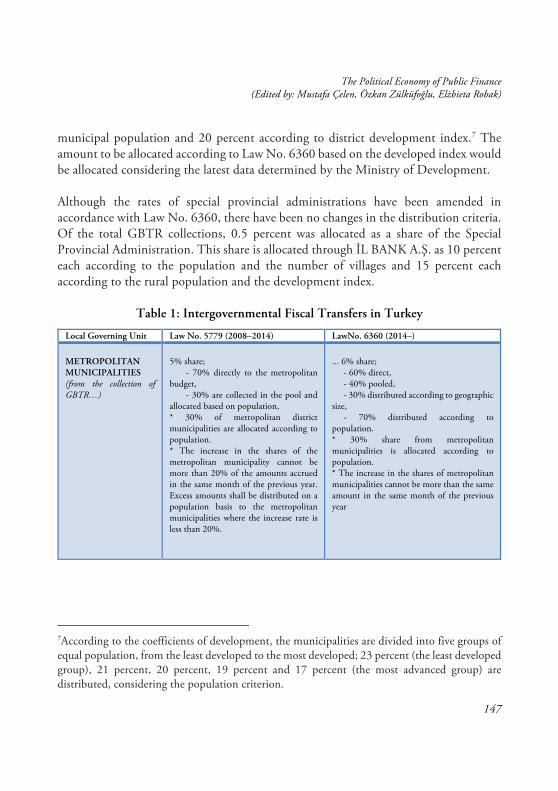
The Political Economy of Public Finance (Edited by: Mustafa Çelen, Özkan Zülküfoğlu, Elżbieta Robak)
147
municipal population and 20 percent according to district development index.7 The amount to be allocated according to Law No. 6360 based on the developed index would be allocated considering the latest data determined by the Ministry of Development.
Although the rates of special provincial administrations have been amended in accordance with Law No. 6360, there have been no changes in the distribution criteria. Of the total GBTR collections, 0.5 percent was allocated as a share of the Special Provincial Administration. This share is allocated through İL BANK A.Ş. as 10 percent each according to the population and the number of villages and 15 percent each according to the rural population and the development index.
Table 1: Intergovernmental Fiscal Transfers in Turkey
Local Governing Unit Law No. 5779 (2008–2014) LawNo. 6360 (2014–)
METROPOLITAN MUNICIPALITIES (from the collection of GBTR…)
5% share; - 70% directly to the metropolitan budget, - 30% are collected in the pool and allocated based on population, * 30% of metropolitan district municipalities are allocated according to population. * The increase in the shares of the metropolitan municipality cannot be more than 20% of the amounts accrued in the same month of the previous year. Excess amounts shall be distributed on a population basis to the metropolitan municipalities where the increase rate is less than 20%.
... 6% share; - 60% direct, - 40% pooled, - 30% distributed according to geographic size, - 70% distributed according to population. * 30% share from metropolitan municipalities is allocated according to population. * The increase in the shares of metropolitan municipalities cannot be more than the same amount in the same month of the previous year
7According to the coefficients of development, the municipalities are divided into five groups of equal population, from the least developed to the most developed; 23 percent (the least developed group), 21 percent, 20 percent, 19 percent and 17 percent (the most advanced group) are distributed, considering the population criterion.

Aykut Aydın (Intergovernmental Fiscal Transfers And Turkey’s Implementation: Amendments In Fiscal Transfer System Set In Law No. 6360)
148
Local Governing Unit Law No. 5779 (2008–2014) LawNo. 6360 (2014–)
METROPOLITAN DISTRICT MUNICIPALITIES (through the collection of GBTR…)
... 2.5% is calculated based on population and this share is distributed as; - 30% to the Metropolitan municipality, - 10% to water and sewerage administration, - 60% is transferred to the metropolitan district municipality. .
... 4.5% share; - 10% is distributed according to the geographic size, - 90% is distributed according to population; This share is distributed as follows: - 30% to Metropolitan Municipality, - 10% to water and sewerage administration, - 60% to metropolitan district municipality.
PROVINCIAL MUNICIPALITIES (through the collection of GBTR…)
…2.85% is allocated - 80% according to population, - 20% according to development index, (according to the latest index determined by State Planning Organization (DPT) 23% (least developed), 21%, 20%, 19% and 17% (most advanced), respectively, for groups with an equal number of districts). * 1/1000 of the latest finalised GBTR is set as compensation to the Ministry of Finance budget. For municipalities up to 5000: 60% of it, For municipalities between 5001 and 9999:40% of it are distributed according to the population.
…1.50% is allocated - 80% according to population, - 20% according to development index, (according to the latest index determined by Ministry of Development 23% (least developed), 21%, 20%, 19% and 17% (most advanced), respectively, for groups with an equal number of districts). * 1/1000 of the latest finalised GBTR is set as compensation to the Ministry of Treasury budget. For municipalities up to 10000: 65% is distributed equally and 35% is distributed according to the population
SPECIAL PROVINCE ADMINISTRATIONS (from the collection of GBTR)
…1.15% of GBTR is distributed - 50% according to population - 10% according to geographic size - 10% according to the number of villages - 15% according to population - 15% according to the development index
…0.50% of the share is distributed - 50% according to population - 10% according to geographic size - 10% according to the number of villages - 15% according to population - 15% according to the development index
EXCEPTIONS
Only for the metropolitan municipalities, All private consumption taxes collected on oil
Only for the metropolitan municipalities, All private consumption taxes collected on oil
Source: Compiled by the author from Law No. 5779 and No. 6360.

The Political Economy of Public Finance (Edited by: Mustafa Çelen, Özkan Zülküfoğlu, Elżbieta Robak)
149
3. A Study to Analyse the Effects on the Fiscal Transfer System Caused by the Changes of Law No. 6360
Under this heading which constitutes the basis of the study, the implementation results of Law No.6360, enacted just after the local elections of 30 March 2014, will be examined. In this respect, information will be given about the revenue structure of local governments by using data obtained from the Ministry of Finance, The General Directorate of Public Accounts.
3.1. Local Government Shares
In Turkey, local governments consist of special provincial administrations, affiliated administrations, municipalities (metropolitan municipalities, provincial centre municipalities, district and township municipalities), villages and local administration associations.
However, this study will focus on the budgets of special provincial administrations and municipality budgets. With the Law No. 6360, 12.5 percent of the GBTRs is allocated to the local governments; 6 percent of these shares are directly transferred to the metropolitan municipalities through the Ministry of Finance. Of these, 6.5 percent is transferred through İLBANK A.Ş. to metropolitan district municipalities (4.5 percent), municipalities outside the metropolitan geographic size (1.5 percent) and special provincial administrations (0.5 percent). In Law No. 5779, 11.5 percent of GBTR was transferred to local governments (5 percent via the Ministry of Finance and 6.5 percent through İLBANK A.Ş. Inc.). Considering the distribution pool, it is seen that Law No. 6360 renders the metropolitan municipalities and metropolitan district municipalities more advantageous in terms of fiscal transfers.
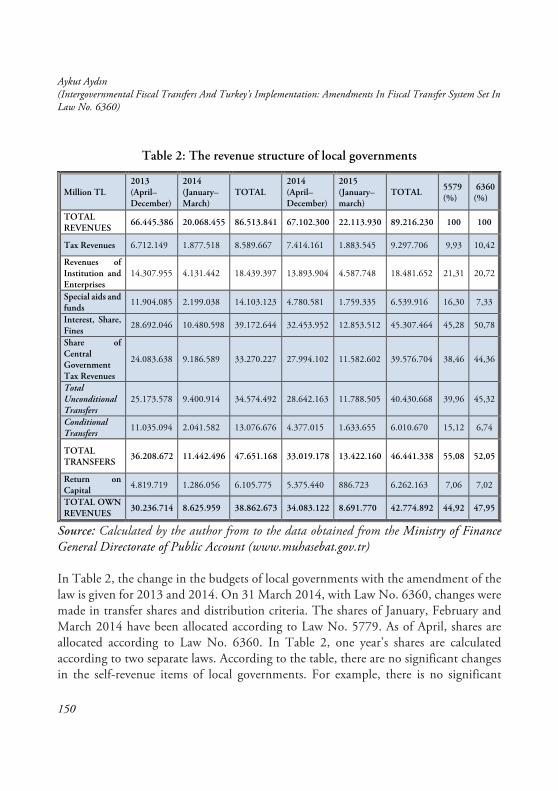
Aykut Aydın (Intergovernmental Fiscal Transfers And Turkey’s Implementation: Amendments In Fiscal Transfer System Set In Law No. 6360)
150
Table 2: The revenue structure of local governments
Million TL 2013 (April–December)
2014 (January–March)
TOTAL 2014 (April–December)
2015 (January–march)
TOTAL 5579 (%)
6360 (%)
TOTAL REVENUES
66.445.386 20.068.455 86.513.841 67.102.300 22.113.930 89.216.230 100 100
Tax Revenues 6.712.149 1.877.518 8.589.667 7.414.161 1.883.545 9.297.706 9,93 10,42
Revenues of Institution and Enterprises
14.307.955 4.131.442 18.439.397 13.893.904 4.587.748 18.481.652 21,31 20,72
Special aids and funds
11.904.085 2.199.038 14.103.123 4.780.581 1.759.335 6.539.916 16,30 7,33
Interest, Share, Fines
28.692.046 10.480.598 39.172.644 32.453.952 12.853.512 45.307.464 45,28 50,78
Share of Central Government Tax Revenues
24.083.638 9.186.589 33.270.227 27.994.102 11.582.602 39.576.704 38,46 44,36
Total Unconditional Transfers
25.173.578 9.400.914 34.574.492 28.642.163 11.788.505 40.430.668 39,96 45,32
Conditional Transfers
11.035.094 2.041.582 13.076.676 4.377.015 1.633.655 6.010.670 15,12 6,74
TOTAL TRANSFERS
36.208.672 11.442.496 47.651.168 33.019.178 13.422.160 46.441.338 55,08 52,05
Return on Capital 4.819.719 1.286.056 6.105.775 5.375.440 886.723 6.262.163 7,06 7,02
TOTAL OWN REVENUES 30.236.714 8.625.959 38.862.673 34.083.122 8.691.770 42.774.892 44,92 47,95
Source: Calculated by the author from to the data obtained from the Ministry of Finance General Directorate of Public Account (www.muhasebat.gov.tr)
In Table 2, the change in the budgets of local governments with the amendment of the law is given for 2013 and 2014. On 31 March 2014, with Law No. 6360, changes were made in transfer shares and distribution criteria. The shares of January, February and March 2014 have been allocated according to Law No. 5779. As of April, shares are allocated according to Law No. 6360. In Table 2, one year’s shares are calculated according to two separate laws. According to the table, there are no significant changes in the self-revenue items of local governments. For example, there is no significant

The Political Economy of Public Finance (Edited by: Mustafa Çelen, Özkan Zülküfoğlu, Elżbieta Robak)
151
increase in the ‘tax revenues’ item. In the transfer revenue, an increase of approximately 6 percent is observed in the item ‘Share of Central Government Tax Revenues’, which expresses the share transferred from GBTR. This represents an increase in unconditional transfers. This increase is due to the increase in share rates transferred to metropolitan municipalities and district municipalities. In conditional transfers, a significant decrease is observed. It can be said that this situation is closely related to the removal of special provincial administrations in 30 metropolitan municipalities, of which approximately 90 percent of the budget consists of conditional transfers.
3.2. Metropolitan Municipality Shares
With Law No. 6360, Metropolitan Municipality was established in the provinces of Aydın, Balıkesir, Denizli, Hatay, Malatya, Manisa, Kahramanmaraş, Mardin, Muğla, Ordu, Tekirdag, Trabzon, Şanlıurfa and Van in addition to the existing 16 metropolitan municipalities. With Law No. 6360, the provinces became the boundaries of all metropolitans (Istanbul and Kocaeli, already had the provincial administrative boundaries). The legal entities of the village municipalities and the township municipalities in 28 metropolitan cities were abolished and the villages were incorporated into towns, where they were affiliated with the metropolitan district municipality. The legal entity of the special provincial administrations (30 metropolises) in these provinces has been abolished.
With Law No. 5579, metropolitan municipalities and district municipalities used to serve a population of approximately 37.5 million (50 percent of the Turkey’s population) and they were granted 43.8 percent of the shares allocated from central government to local governments. With Law No. 6360, since the geographical size of all the metropolitan municipalities were accepted as provincial administrative boundaries, metropolitan and district municipalities began to provide services to the country’s population of about 60 million (76.9 percent of the country's population)8 and began being granted 55 percent of the share transferred to local governments from the GBTRs. However, the fact that the geographic size of a metropolitan municipal is
8According to Turkish Statistic Institute 2016 address-based population registration system, 77.47% (61,837,649 people) of the total population is served by metropolitan municipalities, as required by Law 6360.

Aykut Aydın (Intergovernmental Fiscal Transfers And Turkey’s Implementation: Amendments In Fiscal Transfer System Set In Law No. 6360)
152
within the provincial administrative boundaries means that the metropolitan municipalities also serve the rural population. Therefore, the geographic size criterion is added to the distribution criterion so that the metropolitan municipalities, which expand considerably as their geographic size, can provide effective services to these new regions as well. Thus, the share of the distribution criterion has gained a fairer structure (Demir, 2013: 108-109).
Unconditional transfers to metropolitan municipalities are determined by two methods: first, grant a share on the sum of the collection of GBTRs from the province where the metropolitan municipality is located (derivation-based transfer principle)9 and, second, the shares granted to the district municipalities within the metropolitan municipalities based on population and geographic size.
Although Law No. 6360 has increased the share of the metropolitan municipalities from GBTR, the percentage of share of per capita of some municipalities has decreased. For example, in the province of Bursa, with the expansion of the geographical size that the municipality will serve by 350.9 percent, the amount of the transfers has increased in terms of percentage but the percentage of share per capita has decreased. Despite the 769.9 percent increase in the geographic size of Mersin province and increase in the share, the percentage of share per capita has decreased. In other words, although the pie to be distributed is growing the number of slices have decreased. The other cities with decreasing per capita share are Izmir and Samsun. The most important reason for this is the expansion of provincial administrative boundaries of municipalities and the increase in the population they will serve by the present law, while the GBTRs are low in some cities. Although the GBTRs are high in some, it is not possible to increase the collected amount of GBTRs correspondingly with the number of the population.
9 According to the derivation-based transfer principle, a certain part of the tax collected within the boundaries of a settlement is allocated to that settlement.

The Political Economy of Public Finance (Edited by: Mustafa Çelen, Özkan Zülküfoğlu, Elżbieta Robak)
153
Table 3: Comparison of changes in the population and the geographic size of the 30 metropolitans according to Law No. 5779 and Law No. 6360
Met
ropo
litan
M
unic
ipal
ity
Law
No.
577
9 C
ity P
opul
atio
n
Law
No.
6360
C
ity P
opul
atio
n
Popu
latio
n D
iffer
ence
Popu
latio
n C
hang
e (%
)
Law
No.
5779
G
eogr
aphi
c Si
ze
Law
No.
636
0 to
tal
Geo
grap
hic
Size
Geo
grap
hic
Size
D
iffer
ence
Geo
grap
hic
Size
C
hang
e (%
)
Adana 1.636.229 2.149.260 513.031 31.35 4.994 14.045 9.051 181.24
Ankara 4.630.735 5.045.083 414.348 8.95 10.093 25.401 15.308 151.67
Antalya 1.073.794 2.158.265 1.084.471 100.99 3.780 20.790 17.010 450.00
Bursa 1.983.880 2.740.970 757.090 38.16 2.414 10.886 8.472 350.95
Diyarbakır
892.713 1.607.437 714.724 80.06 6.003 15.204 9.201 153.27
Erzurum 384.399 766.729 382.330 99.46 3.020 25.330 22.310 738.74
Eskişehir 659.924 799.724 139.800 21.18 6.590 13.902 7.312 110.96
Gaziantep 1.438.373 1.844.438 406.065 28.23 2.835 6.844 4.009 141.41
İstanbul 13.710.512 14.160.467 449.955 3.28 5.315 5.315 ---- ----
İzmir 3.401.994 4.061.074 659.080 19.37 9.256 12.015 2.759 29.81
Kayseri 1.004.276 1.295.355 291.079 28.98 3.312 17.109 13.797 416.58
Kocaeli 1.527.407 1.676.202 148.795 9.74 3.625 3.625 ---- ----
Konya 1.107.886 2.079.225 971.339 87.67 6.160 40.813 34.653 562.55
Mersin 876.958 1.705.774 828.816 94.51 1.783 15.512 13.729 769.99 Sakarya 590.498 917.373 326.875 55.36 2.299 4.880 2.581 112.27
Samsun 547.778 1.261.810 714.032 130.35 6.047 9.364 3.317 54.85
Aydın* 611.846 1.020.957 409.111 66.87 631 7.904 7.273 1152.61
Balıkesir* 711.743 1.162.761 451.018 63.37 1.437 14.472 13.035 907.10
Denizli* 670.812 963.464 292.652 43.63 802 11.804 11.002 1371.82
Hatay* 742.590 1.503.066 760.476 102.41 864 5.831 4.967 574.88
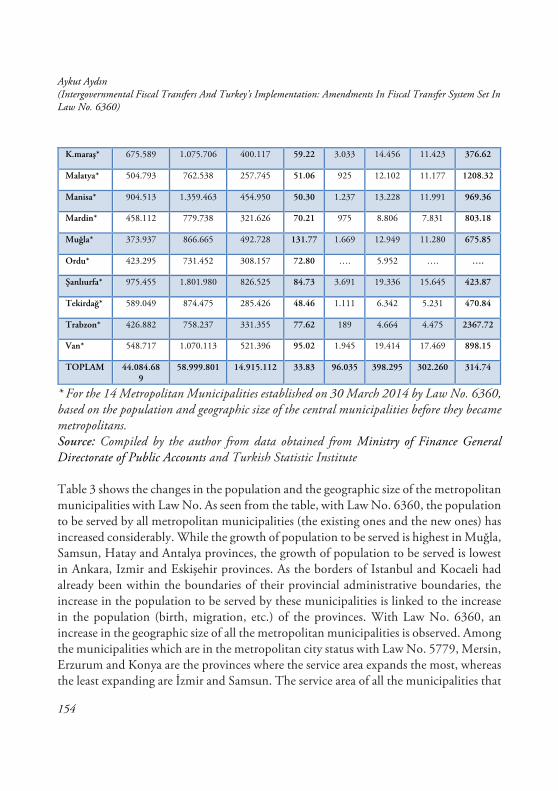
Aykut Aydın (Intergovernmental Fiscal Transfers And Turkey’s Implementation: Amendments In Fiscal Transfer System Set In Law No. 6360)
154
K.maraş* 675.589 1.075.706 400.117 59.22 3.033 14.456 11.423 376.62
Malatya* 504.793 762.538 257.745 51.06 925 12.102 11.177 1208.32
Manisa* 904.513 1.359.463 454.950 50.30 1.237 13.228 11.991 969.36
Mardin* 458.112 779.738 321.626 70.21 975 8.806 7.831 803.18
Muğla* 373.937 866.665 492.728 131.77 1.669 12.949 11.280 675.85
Ordu* 423.295 731.452 308.157 72.80 …. 5.952 …. ….
Şanlıurfa* 975.455 1.801.980 826.525 84.73 3.691 19.336 15.645 423.87
Tekirdağ* 589.049 874.475 285.426 48.46 1.111 6.342 5.231 470.84
Trabzon* 426.882 758.237 331.355 77.62 189 4.664 4.475 2367.72
Van* 548.717 1.070.113 521.396 95.02 1.945 19.414 17.469 898.15
TOPLAM 44.084.689
58.999.801 14.915.112 33.83 96.035 398.295 302.260 314.74
* For the 14 Metropolitan Municipalities established on 30 March 2014 by Law No. 6360, based on the population and geographic size of the central municipalities before they became metropolitans. Source: Compiled by the author from data obtained from Ministry of Finance General Directorate of Public Accounts and Turkish Statistic Institute
Table 3 shows the changes in the population and the geographic size of the metropolitan municipalities with Law No. As seen from the table, with Law No. 6360, the population to be served by all metropolitan municipalities (the existing ones and the new ones) has increased considerably. While the growth of population to be served is highest in Muğla, Samsun, Hatay and Antalya provinces, the growth of population to be served is lowest in Ankara, Izmir and Eskişehir provinces. As the borders of Istanbul and Kocaeli had already been within the boundaries of their provincial administrative boundaries, the increase in the population to be served by these municipalities is linked to the increase in the population (birth, migration, etc.) of the provinces. With Law No. 6360, an increase in the geographic size of all the metropolitan municipalities is observed. Among the municipalities which are in the metropolitan city status with Law No. 5779, Mersin, Erzurum and Konya are the provinces where the service area expands the most, whereas the least expanding are İzmir and Samsun. The service area of all the municipalities that

The Political Economy of Public Finance (Edited by: Mustafa Çelen, Özkan Zülküfoğlu, Elżbieta Robak)
155
have recently obtained metropolitan status has expanded. Trabzon, Denizli, Malatya and Aydın are the provinces where the service area is the most proportionally expanding.
Table 4: The revenue structure of the Metropolitan Municipalities
Million TL 2010 2011 2012 2013 2014 2015 2016
BUDGETREVENUE 13.322.111 15.560.584 17.228.427 20.719.833 29.823.555 33.181.095 37.911.916
Tax Revenues 286.067 333.122 256.984 325.508 446.920 488.616 601.396
Revenues of Institutions and Enterprises
1.397.509 1.302.592 1.893.212 2.906.943 2.913.070 3.444.479 3.530.230
Special aids and funds 58.613 120.000 159.071 137.647 147.761 281.443 256.516
Conditional Transfers 35.860 85.211 50.163 68.526 123.069 216.950 188.253
Interest, Share, Fines 10.006.684 11.928.431 13.663.037 15.729.870 22.003.872 26.954.911 30.457.024
Share of Central Government Tax Revenues
8.706.311 10.335.503 11.953.598 14.031.736 20.012.405 25.020.671 28.382.500
Return on Capital 1.405.948 1.750.415 934.480 1.535.329 1.057.348 1.867.612 2.365.579
TOTAL Own Revenues
4.583.949 5.146.850 5.225.927 6.624.579 9.716.243 7.878.981 9.272.900
Source: According to the data obtained from the Ministry of Finance General Directorate of Public Accounts www.muhasebat.gov.tr
Approximately 25 percent of the revenue of the metropolitan municipalities is composed of own source revenue, while 75 percent is transfer revenue (Table 4). Almost all the transfer revenues consist of shares that are transferred from GBTRs and unconditional transfers. The share of transfers in the budget of the metropolitan municipalities has increased even more since the date of enactment of Law No. 6360 (2014: 68.1 percent; 2015: 75.6 percent; 2016: 74.9 percent). Nonetheless, the share of own source revenue in the budget is quite small. The largest share of own source revenue are from the institutions and enterprises of these municipalities at a rate of 10 percent. Tax revenues have a share of about 1.5 percent. This shows that the metropolitan municipalities are highly dependent on the shares transferred from the central government.
Aykut Aydın (Intergovernmental Fiscal Transfers And Turkey’s Implementation: Amendments In Fiscal Transfer System Set In Law No. 6360)
156
3.3. Shares of the Provincial Municipalities
Pursuant to Law No. 6360, legal entities of 559 municipalities whose population were below 2,000 in provinces have been abolished. The total population served by provincial municipalities has decreased from approximately 32.3 billion to 17.9 billion.10 The total amount of shares obtained from GBTR has decreased from 3.18 billion TL to 2.13 billion TL. The reason for this is the decrease in the number of provinces, districts and provincial municipalities. In the light of this data, it is seen that the per capita amount of the shares that these municipalities receive is also decreasing.
According to Law No. 6360, the municipalities with a population of up to 10,000 are allocated an ‘equalisation allowance’ as a second source of GBTRs. This allowance is set as an equalisation allowance for use by municipalities with a population of up to 10,000 as 1/1000 of the total final budget tax revenue collection. The Ministry of Finance transfers this payment to the account of İLBANK A.Ş. for distribution in two equal instalments in March and July. As much as 65 percent of the payment is transferred to İLBANK A.Ş. account and distributed equally and 35 percent is distributed according to population (By Law No. 5779, 60 percent of the payment was distributed to municipalities with a population of up to 5000, and 40 percent distributed equally to municipalities between 5001 and 9999.) equally to municipalities between 5001 and 9999.)
10According to the 2016 Turkish Statistics Institute According to the address-based Population Registration Statistics, provinces outside the metropolitan municipalities are serving 22.5 percent (17.977.222 people) of the population.

The Political Economy of Public Finance (Edited by: Mustafa Çelen, Özkan Zülküfoğlu, Elżbieta Robak)
157
Table 5: The Budget Structure of Provincial Municipalities
Million TL 2010 2011 2012 2013 2014 2015 2016
TOTAL BUDGET REVENUES
3.872.328 4.518.688 5.183.880 6.412.220 4.362.365 5.315.121 6.006.549
Tax Revenues 587.048 595.026 661.356 744.814 514.808 576.961 625.577
Revenues of Institutions and Enterprises
1.068.781 1.237.736 1.448.565 1.593.223 978.124 1.132.689 1.346.568
Special Aids and Funds
51.810 92.869 72.561 72.400 80.211 113.772 159.818
I. Conditional Transfers
23.282 42.237 32.042 38.654 50.445 80.668 108.043
II. Unconditional Transfers
28.528 50.632 40.519 33.746 29.766 33.104 51.078
Interest, Share, Fines
2.038.648 2.412.481 2.742.717 3.534.739 2.610.923 3.210.586 3.579.638
III. Share of Central Government Tax Revenues
1.781.777 2.164.014 2.438.077 3.183.300 2.386.223 2.923.916 3.244.190
Return on Capital 125.658 180.576 258.681 467.044 178.249 281.113 294.948
B. Total Transfers (I+IV) 1.833.587 2.256.883 2.510.638 3.255.700 2.466.434 3.037.688 3.403.311
C. TOTAL OWN REVENUES
2.038.741 2.261.805 2.673.242 3.156.520 1.895.931 2.277.433 2.603.238
Source: Calculated by the author from the data obtained from the Ministry of Finance General Directorate of PublicAccountswww.muhasebat.gov.tr
share of own source revenues is about 44 percent (Law 6360). Approximately 95 percent of transfers is unconditional. Prior to 2014, approximately 50 percent of previous budget revenues consisted of transfer revenues (Law No. 5779). Own tax revenues have a share of about 10 percent in total revenues and a share of about 24 percent in own source revenues. With Law No. 6360, there is a significant decrease in ratio of the own source revenue in the budget of the provincial municipalities and an increase of about 6 percent in the transfer revenues. With Law No. 6360, the share of transfer revenue in the budget structures of the geographic size of provincial municipalities has increased.

Aykut Aydın (Intergovernmental Fiscal Transfers And Turkey’s Implementation: Amendments In Fiscal Transfer System Set In Law No. 6360)
158
3.4 Shares of Special Provincial Administrations
With Law No. 6360, all the geographical areas covered by metropolitan municipalities were enlarged to provincial administrative boundaries. With the removal of the legal entities of provincial special administrations in 30 metropolitan municipalities, the number of provincial special administrations decreased from 81 to 51. Therefore, the population of 79.814.871 people has decreased to 17.977.222 people.11 Accordingly, the shares transferred to Special Provincial Administrations, which was 3.6 billion TL, has decreased to 1.7 billion TL. The most important reason for this decline in the share is the reduction of 1.5 percent share of the special provincial administrations to 0.5 percent of the special provincial administrations with decrease in the number of special provincial administrations (after the removal of the legal entities of provincial special administrations where the metropolitan municipalities are located). Although there is decrease in the share of the special provincial administrations from the GBTRs, there is increase in the per capita share. In other words, the pie of the Special Provincial Administrations is getting smaller but is divided into larger slices. Although the share allocated to Special Provincial Administrations by GBTRs decreased almost by half, the share per capita increased by 47 percent because of a decrease by about 77 percent in the population served by provincial special administrations.
112016 Turkish Statistic Institute according address-based population registration statistics, 22.5% of the population (17.977.222) is served by special administrations. According to the former law, special provincial administrations could provide services to the total population (79.814.871).
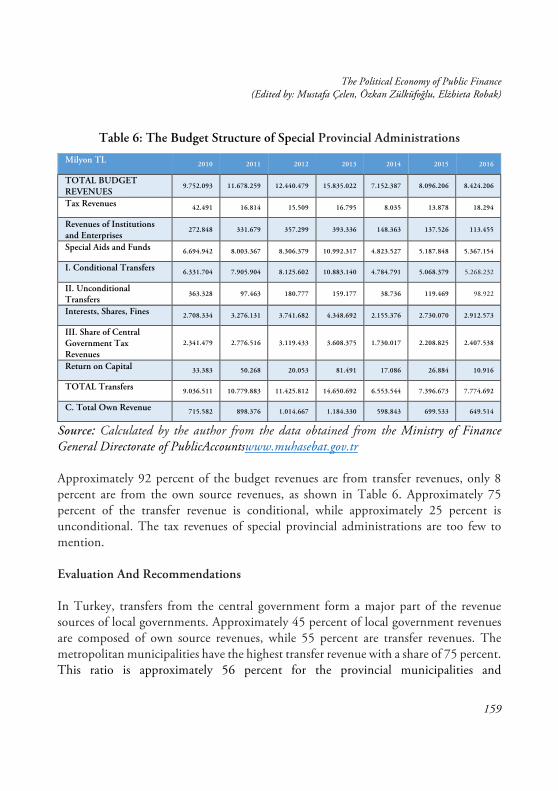
The Political Economy of Public Finance (Edited by: Mustafa Çelen, Özkan Zülküfoğlu, Elżbieta Robak)
159
Table 6: The Budget Structure of Special Provincial Administrations
Milyon TL 2010 2011 2012 2013 2014 2015 2016
TOTAL BUDGET REVENUES
9.752.093 11.678.259 12.440.479 15.835.022 7.152.387 8.096.206 8.424.206
Tax Revenues 42.491 16.814 15.509 16.795 8.035 13.878 18.294
Revenues of Institutions and Enterprises
272.848 331.679 357.299 393.336 148.363 137.526 113.455
Special Aids and Funds 6.694.942 8.003.367 8.306.379 10.992.317 4.823.527 5.187.848 5.367.154
I. Conditional Transfers 6.331.704 7.905.904 8.125.602 10.883.140 4.784.791 5.068.379 5.268.232
II. Unconditional Transfers
363.328 97.463 180.777 159.177 38.736 119.469 98.922
Interests, Shares, Fines 2.708.334 3.276.131 3.741.682 4.348.692 2.155.376 2.730.070 2.912.573
III. Share of Central Government Tax Revenues
2.341.479 2.776.516 3.119.433 3.608.375 1.730.017 2.208.825 2.407.538
Return on Capital 33.383 50.268 20.053 81.491 17.086 26.884 10.916
TOTAL Transfers 9.036.511 10.779.883 11.425.812 14.650.692 6.553.544 7.396.673 7.774.692
C. Total Own Revenue 715.582 898.376 1.014.667 1.184.330 598.843 699.533 649.514
Source: Calculated by the author from the data obtained from the Ministry of Finance General Directorate of PublicAccountswww.muhasebat.gov.tr
Approximately 92 percent of the budget revenues are from transfer revenues, only 8 percent are from the own source revenues, as shown in Table 6. Approximately 75 percent of the transfer revenue is conditional, while approximately 25 percent is unconditional. The tax revenues of special provincial administrations are too few to mention.
Evaluation And Recommendations
In Turkey, transfers from the central government form a major part of the revenue sources of local governments. Approximately 45 percent of local government revenues are composed of own source revenues, while 55 percent are transfer revenues. The metropolitan municipalities have the highest transfer revenue with a share of 75 percent. This ratio is approximately 56 percent for the provincial municipalities and

Aykut Aydın (Intergovernmental Fiscal Transfers And Turkey’s Implementation: Amendments In Fiscal Transfer System Set In Law No. 6360)
160
approximately 45 percent for the other municipalities. Approximately 98 percent of transfers made to local governments are made up of unconditional transfers. With Law No. 6360, another unconditional transfer application is made under the name of equalisation allowance on the Ministry of Finance budget as 1/1000 of the total of GBTR collections.
In Turkey, local governments are granted conditional transfers under various laws as ‘aid or fund’. However, they are very few compared to unconditional transfers. Conditional transfers are mostly used in special provincial administrations. Approximately 91 percent of provincial special administration revenues consist of transfer revenues, while approximately 65 percent of these transfers are designed conditionally. According to the Special Provincial Administration Law,12 it is possible for the general and special budgeted administrations of the central government to make transfers on their fields of activity from their own budgets to local administrations. These transfers can be designed for general (unconditional) and special purposes (conditional). This can be regarded as a transfer application, which is conditional. In particular, appropriations made by the Housing Development Administration, the Ministry of Finance and the Ministry of Culture are examples of such transfers (Çetinkaya ve Demirbaş, 2010: 9).
In terms of determining the transfer pool and distribution criteria, although the distribution of revenue collected in the transfer pool in Turkey has become complicated in recent years, it is regulated in accordance with the principle of simplicity, 12Law on Special Provincial Administration, No: 5302, (Supplementary paragraph: 7/3/2005-5393/85 Art.; Amended second paragraph: 7/24/2008-5793/42 Art.) Ministries and other central government agencies may realize the investments relating to such services as construction, maintenance and repair works, state and provincial roads, potable water, irrigation water, sewer, power transmission lines, health, education, culture, tourism, environment, land development planning and control, public works, settlement, youth and sports and other investments within the purview of ministries and other central government agencies by transferring the appropriations in their budgets earmarked for such services to the special provincial administrations. The transfer shall be subject to the approval of the relevant minister, and such appropriations may not be used for other purposes.

The Political Economy of Public Finance (Edited by: Mustafa Çelen, Özkan Zülküfoğlu, Elżbieta Robak)
161
transparency and predictability. Local governments in Turkey can predict their transfer shares. Distribution criteria are defined by simple formulas and regulated by law. Law No. 5779 and 6360 make clear the components of the distribution formula, as well as the population, geographic size, development index and number of villages. The provision that, ‘In response to the municipal debt, İLBANK A.Ş, cannot cut more than 40 percent from the shares to be allocated to the municipalities’. Law No. 5779 prevents the municipalities from political preferences and ensures some revenue transferred to local governments. This provision, which is included in the law, strengthens the predictability of the transfer system. In the distribution of revenue collected in the transfer pool, the derivation-based transfer method is used for the metropolitan municipalities. While 5 percent of the GBTR collected within the metropolitan municipality borders has been allocated as a metropolitan municipality share in Law No. 5779, this share is applied as 6 percent in Law No. 6360. However, the derivation-based transfer principle method also has some drawbacks. For example, in Law No. 2380 enforced in 1981, the shares were allocated only according to the derivation-based transfer principle and the last general population census. In this case, especially Istanbul and Kocaeli were very profitable. Because the companies with nation-wide commercial activities were operating in other provinces while they were registered with Istanbul and Kocaeli tax offices. Thus, while other cities provided public services to these companies, Istanbul and Kocaeli were receiving the share of the GBTR. With Law No. 6360, it can be seen that a more equitable method has been adopted as 40 percent of the shares allocated by the derivation-based transfer principle are collected in a pool and distributed according to population and geographic size.
More than half of local government revenues come from transfers from the central government. Hence, there is a hidden political control mechanism that is incompatible with local financial autonomy. When assessing the financial structure of local governments in terms of fiscal autonomy, basic conditions such as distribution of local government revenue, taxation autonomy and transfer types made by central government should be considered. In this way, it is possible to judge the financial autonomy of local governments (Yüksel, 2005: 284). The higher the share of own source revenue in the total income of a local government, the stronger that local government is in terms of financial autonomy. In Turkey, own source revenues of local governments are proportionally low in total income. The highest share in own source revenues is ‘revenues of institutions and enterprises managed by municipalities’ at an
Aykut Aydın (Intergovernmental Fiscal Transfers And Turkey’s Implementation: Amendments In Fiscal Transfer System Set In Law No. 6360)
162
average of 22 percent. This suggests that local governments, which are ineffective to raising tax revenues, seek other methods to increase their own income. Local governments can further strengthen their financial autonomy by increasing their own income. The most effective way to increase own revenue is to give local governments the authority to determine the tax base, rates, exceptions and exemptions. However, this warrant is made impossible by Article 73 of the Constitution.13 The low share of own source revenue in total revenues clearly demonstrates this dependence. An average of 55 percent of local government revenue in Turkey depends on transfers.
This dependence undermines the fiscal autonomy of local governments. However, in terms of financial autonomy, the type of transfers, conditional or unconditional, is very important. In Turkey, a significant part of the transfers designed by the central government to the local governments is the shares that are allocated from the GBTR, which are made unconditionally. These shares represent about 85 percent of transfer payments. Approximately 15 percent of the transfers are conditional. Local governments can use the shares transferred from GBTR as they wish. However, if conditional transfers are transferred for a purpose, they must be used for that purpose. The ratios of the shares that are separated from GBTR are unilaterally determined by the central government within the scope of distribution criteria laws. The use of the shares transferred from GBTR in the manner desired by the local authorities is appropriately designed in terms of financial autonomy. However, the fact that the revenues of the local governments are so dependent on the transferred transfers from the central government damages the financial autonomy of the local governments.
In terms of financial balancing; when the current transfer system in Turkey is examined, the share of GBTR distributed to local governments can be regarded as an application to eliminate vertical fiscal imbalance. Vertical balancing applications are mostly made to municipalities with low potential for income generation. However, the more transfers made from central government to local governments to eliminate vertical imbalance,
13Article 73: Authority to make amendments within the upper and lower limits specified by law in the provisions regarding taxes, duties, duties and similar financial liabilities with exemptions, exceptions and reductions can be given to the Council of Ministers.

The Political Economy of Public Finance (Edited by: Mustafa Çelen, Özkan Zülküfoğlu, Elżbieta Robak)
163
the greater is the central governance dependency of the local government. With Law No. 6360, the central government is transferring more resources to local governments from GBTR. More than 55 percent of the revenue sources of local governments in Turkey consist of transfers from the centre. The largest share of transfers made from the centre (around 85 percent) is the appropriations transferred from the GBTR. Hence, as the share of the amount of tax collected by the central government increases, the revenues of the local government also increase. In particular, according to the derivation-based transfer principle, the fact that the metropolitan municipalities receive a 6 percent share of the GBTR collected within their borders reveals the importance of the tax revenues collected within their borders for that municipality. However, every territory of the country does not have equal taxation capacity. The concentration of population and business volume in certain regions can be considered as the main indicators of these differences. These disparities between local governments in terms of expenditure needs and revenue capacities indicate the horizontal imbalance between local authorities. For example, only 0.92 percent of the central government tax revenues are collected in Eastern Anatolia; 1.29 percent is collected from the South Anatolian region of Turkey. Similarly, 2.62 percent of the central government tax revenues are collected in the Black Sea region (0.81 percent for West Black Sea, 0.99 percent for Central Black Sea and 0.82 percent for Eastern Black Sea). The share of these three regions in central government tax revenues is only 4.83. On the other hand, while 60.3 percent of central government taxes are collected in the Marmara Region alone, 89.2 of these taxes are collected from Marmara, Central Anatolia (15.7%) and Aegean (13.1%) regions. In the distribution criteria of the metropolitan municipality shares, 40 percent of the GBTR is allocated to the metropolitan municipalities of Istanbul, Ankara, İzmir, Kocaeli and Bursa. With this application, horizontal imbalance is partially solved. The current system in Turkey does not provide financial equality because the transfer system does not consider the fiscal capacity and fiscal needs of the local governments and the population criterion substantially in determining the expenditure needs (Uzun, 2012: 47). The main reason for using the population criterion in the transfer formula is the presumption that expenditure needs will increase in proportion to the population. However, the need for resources often exceeds the size of the population due to the services of local governments because the increase in the rate of expenditures exceeds the population increase rate. This is the additional cost of increasing population (Nadaroğlu, 2001: 88). Therefore, it is necessary to consider other factors such as summer and winter population, day-and-night population, school-age population and
Aykut Aydın (Intergovernmental Fiscal Transfers And Turkey’s Implementation: Amendments In Fiscal Transfer System Set In Law No. 6360)
164
elderly population besides population in determining expenditure needs (Güner, 2004: 200). The lack of consideration of characteristics such as summer–winter population or day-and-night population in Turkey poses a problem, especially for municipalities which are business and tourist centres. For example, the population of Kocaeli Metropolitan Municipality constitutes 2.2 percent of Turkey, while 12.4 percent of GBTRs is collected in this city. In contrast, the population of Diyarbakır Metropolitan Municipality is 2.1 percent of the population of Turkey, 2.7 percent for Konya Metropolitan Municipality and 2.8 percent for Adana Metropolitan Municipality. However, the contribution of these cities to GBTR is 0.3, 0.7 and 0.7 percent, respectively. As can be seen, although the population densities are almost the same or even larger in some large cities, there are remarkable differences in their contribution to GBTR. In this case, according to the metropolitan share allocation criteria, there is a resource transfer from Kocaeli to the other cities by central government. In other words, efforts are being made to eliminate horizontal imbalance between regions by transferring resources from Marmara, Central Anatolia and Aegean regions, where 89.23 percent of GBTR is collected, to local governments in relatively less developed regions through revenue granting. However, this may lead to injustice to the provinces which create more added value and maximum GBTR is collected. For this reason, the distribution of the shares should be based on local circumstances and allocated according to the services provided. Local governments in regions where both population and business volume are concentrated offer more diverse and comprehensive public services and need more income. For example, more industrialised public services are being offered in Turkey’s province of Kocaeli, where industrialisation is heavily concentrated. On the other hand, municipalities with about 5000 to 1000 population according to the population census in the tourism regions in the Mediterranean region serve 5–10 times more population during the tourism season (Uzun: 50). Therefore, the expenditure needs determined by the result of population census may not reflect reality. Therefore, placing other criteria in the transfer formula would be a more reasonable option. Incorporation of the development index into the share calculation system has the effect of eliminating revenue imbalance/horizontal imbalance between cities with highly developed and high self-generating potentials, and municipalities with underdeveloped and weak self-generating potentials. The 20 percent share of municipal shares distributed outside the metropolitan border based on the development index contributes to ensuring horizontal imbalance by ensuring that municipalities in

The Political Economy of Public Finance (Edited by: Mustafa Çelen, Özkan Zülküfoğlu, Elżbieta Robak)
165
underdeveloped cities receive a larger share than municipalities in relatively developed cities. Similarly, the allocation of 15 percent of the share of GBTR to special provincial administrations according to the development index can be considered as an application for horizontal imbalance. However, since the development index only covers 5 percent of total transfers, the equalisation effect is limited (Kerimoğlu, Güngör, Koyuncu: 82).
One of the characteristics of a good transfer system is the local governments’ efforts to increase their income. As in Turkey, there are some incentive-based problems in the intergovernmental transfer system, where local governments are heavily dependent on fiscal transfers. If local governments regard transfers from the central government as a source of guaranteed income to cover budget deficits, they can behave negatively, such as excessive spending, excessive borrowing, poor quality services and inadequate tax collective effort. Transfer distribution criteria can also produce positive or negative incentives. Regulation of transfer rates transferred from the central government according to the actual financial capacities rather than the potential financial capacities of the local administrations can reduce the tax collection efforts of the local administrations. In this case, as low-income local governments receive more transfers, these governments may be able to make less tax collection efforts or tend to show a lesser income less than usual (Uzun: 51). In Turkey, a large share of local government revenues is transferred from GBTRs. These shares are allocated through ‘collection of GBTRs’. In other words, the transfer distribution criterion in Turkey is regulated according to the actual financial capacity of local governments, not according to their potential financial capacity.
The fiscal transfer system in Turkey is designed to meet the service needs of local governments. However, there is no criterion to increase the own source revenues and financial performances of the local governments. Therefore, in the fiscal transfer system in Turkey, regulations should be framed to encourage municipalities to create their own source revenues and spend effectively. These regulations include criteria for the financial performance of local governments. Many countries, such as Spain, Romania and Korea, have included local governments’ financial performance measures. These measures mostly reflect the tax collection performance of local governments. The introduction of criteria for tax collection performance by local governments could be an incentive for local governments to collect taxes and thus increase local income also in Turkey.
Aykut Aydın (Intergovernmental Fiscal Transfers And Turkey’s Implementation: Amendments In Fiscal Transfer System Set In Law No. 6360)
166
In conclusion, the main subject of this study is the analysis of the intergovernmental fiscal transfers in Turkey. Although the fiscal transfer system has become more complex over the years, it has been arranged in accordance with the principle of predictability, transparency and simplicity. In Turkey, local governments can estimate their transfer shares because the transfer rates and the distribution bases made from the centre are determined by law. However, it is crucial for financial autonomy of the local governments that the shares transferred from the GBTR bear the unconditional transfer nature and that the local governments can expend these resources as they desire without being subject to scrutiny. However, regulations in intergovernmental fiscal transfer in Turkey have increased the share of GBTRs rather than increasing the own source revenues of local governments. This damages the financial autonomy of local governments. Therefore, their financial autonomy should be further strengthened by increasing the own source revenues of local governments. The most effective way to increase own source revenues is to give local governments the power to determine tax rates, limits, exceptions and exemptions. However, Article 73 of the Constitution does not make it possible. Local governments should be given the authority to determine their tax rates within certain limits, which will increase their own source revenue. In Turkey, the method of granting shares from GBTR can be regarded as an application to eliminate vertical imbalance. However, this distribution of shares cannot be regarded as a fair application because there is a distribution in favour of metropolitan municipalities. 82.2 percent of tax revenue is collected from Ankara, Izmir, Istanbul, Kocaeli and Bursa. According to the derivation-based transfer principle, after pooling 40 percent of the share obtained from GBTRs and allocating to other metropolitan municipalities can be regarded as a horizontal balancing application. Horizontal imbalance was not completely eliminated. However, including criteria such as geographic size and development index to the distribution criteria made the system fairer but more complicated. In addition, in districts where the seasonal population disparities, day-and-night population disparities and the business volume are variable, population may change from time to time. Not considering these criteria is being unjustly towards local governments. Therefore, the distribution principles such as the day-to-night population ratio and the summer–winter population average should be included. The fiscal transfer system in Turkey is designed to meet the service expenditures of local governments. However, there is no criterion to increase the own source revenues and financial performances of local governments. In the fiscal transfer

The Political Economy of Public Finance (Edited by: Mustafa Çelen, Özkan Zülküfoğlu, Elżbieta Robak)
167
system in Turkey, it is necessary to make incentive arrangements for the municipalities to create their own revenues and to make effective expenditures. The introduction of measures for tax collection performance could be an incentive for local governments to collect taxes and increase local revenue.
References
Ahmad, E. and Craig, J. (1997), “Intergovernmental Transfer’’, Teresa Ter-Minassian (Edi), Fiscal Federalism in Theory and Practice, Publication Services, Washington: International Monetary Fund.
Bahl, Roy W., Boex J. and Martinez-Vazquez, J. (2001) “Intergovernmental Fiscal Transfers: The Design and Implementation of Intergovernmental Fiscal Transfer’’. Monograph. Atlanta: Andrew Young School of Policy Studies
Bahl, Roy W. and Linn, J. F. (1998), “Urban Public Finance in Developing Countries, Washington: Oxford University Press.
Bird, Richard M. (Date Accessed: 25.06.2017), “Fiscal Federalism”. Bergval, D. Charbit, C., Kraan, D. and Merk, O. (2006), “Intergovernmental Transfers and
Decentralised Public Spending’’, OECD Network on Fiscal Relations Across Levels of Government, Paris: OECD Publishing.
Blochliger, H. and King, D. (2006), “Less Than You Thought: The Fiscal Autonomy of Sub-Central Governments’’, OECD Economic Studies, Paris: OECD Publishing.
Çetinkaya, Ö. and Demirbaş, T. (2010), “Belediye Gelirlerinin Analizi ve Mali Özerklik Açısından Değerlendirilmesi”, İstanbul Üniversitesi Maliye Bölümü Konferansları, Vol. 53.
Demir, İ. (2013), “Belediyelere ve İl Özel İdarelerine Genel Bütçeden Ayrılan Paylara İlişkin Yeni Düzenlemeler”. Uzman Bakış Dergisi. No. 1.
Güner, A. (2004) “Belediyelerin Öz Gelirleri”. Vergi Dünyası Dergisi. Vol. 23, No. 274. Irawan, S. Tacconi, L. and Ring, I. (2013), “Designing Intergovernmental Fiscal Transfers for
Conservation: The Case of REDD Revenue Distribution to Local Governments in Indonesia’’,Amsterdam: Journal of Development Economics.
Kerimoğlu, B. Güngör, H. and Koyuncu, E. (2009), “Belediye Bütçesi Nasıl İzlenir? Yerel Paydaşlar İçin Bir Rehber’’, Tepav Publishing, No. 40.
Ministry of Finance General Directorate of Public Accounts www.muhasebat.gov.tr Musgrave, Richard A. (1959), The Theory of Public Finance: A Study in Public Economy,
Student Edition, New York: McGraw- Hill.

Aykut Aydın (Intergovernmental Fiscal Transfers And Turkey’s Implementation: Amendments In Fiscal Transfer System Set In Law No. 6360)
168
Nadaroğlu, H. (2001), Mahalli İdareler Teorisi, Ekonomisi, Uygulaması, 7. Edition, İstanbul: Beta Press.
Nadaroğlu, H. (1991), “Merkezi İdare ile Mahalli İdareler Arasındaki Mahalli İlişkilerin Dünü ve Bugünü (Türkiye Örneği)’’. Seventh Fiscal Symposium, İstanbul: Maliye Araştırma ve Uygulama Merkezi Yayını.
Rosen, Harvey S. and Gayer, T. (2010), “Public Finance”, 9. Edition. New York: McGraw-Hill International Edition.
Sağbaş, İ. (2010), “Merkezden Yerel Yönetimlere Mali Transferlerde Yeni Döneme İlişkin Gözlemler’’, Nihat Falay and Diğerleri (Edi), Türkiye’de Yerel Yönetimlerin Sorunları ve Geleceği, Ankara: Published by Seçkin.
Slack, E. (2007), “Grants to Large Cities and Metropolitn Area”, Robin Boadway and Anwar Shah (Edi), Intergovernmental Fiscal Transfers Principles and Practice, Washington: The World Bank.
Uzun, A. (2012), “Türkiye’de Genel Bütçe Gelirlerinden Belediyelere Aktarılan Payların Değerlendirilmesi’’, Küresel İktisat ve İşlet
Yüksel, F. (2005), “Yerel Özerklik Kavramı Üzerine Bir İnceleme’’. Hüseyin Özgür ve Muhammet Kösecik (Ed.). Yerel Yönetimler Üzerine Güncel Yazılar-I. Ankara: Nobel Publishing.
Turkish Statistic Institute www.tuik.gov.tr

The Political Economy of Public Finance (Edited by: Mustafa Çelen, Özkan Zülküfoğlu, Elżbieta Robak)
169
BEPS Action Plan and the Current Case of Turkey
Gözde Nalbant Efe Abstract
The effective tax burden of multinational corporations has decreased significantly in recent years. The main reason is that they exploited gaps and mismatches in tax rules, and shifted their taxable income to low or no-tax locations by courtesy of old-fashioned international tax rules and tax competition that came with globalization. OECD and G20 countries understood the importance of tax revenue loss better after the global crisis and initiated a fundamental reform in the international taxation system. The paper analyses progress made in terms of the fifteen actions included in the OECD’s “Action Plan on Base Erosion and Profit Shifting” by evaluating recommendations laid out in the following reports on each action item and it reveals criticism about these recommendations. The paper also assesses consistency of the current tax laws of Turkey with regard to recommendations about each action item, and determines the relevant amendments made in tax legislation of Turkey after approval of BEPS Package.
Keywords: Base Erosion, Profit Shifting, BEPS and Turkey
Introduction
he failure of national tax laws to keep up with globalizing institutions and the digitalized economy allows multinational enterprises (MNEs) to reduce their tax burdens by resorting to artificial methods, that is, by making use of these
loopholes. The "Action Plan on Base Erosion and Profit Shifting (BEPS)”, which was
7
T

Gözde Nalbant Efe (BEPS Actıon Plan and the Current Case of Turkey)
170
initiated by the OECD (Organisation for Economic Co-operation and Development) in 2013, is seen as a global roadmap to ensure that governments receive tax revenue they lose.
BEPS refers to tax planning strategies that exploit gaps and mismatches in tax rules to shift profits artificially to low or no-tax locations, where there is little or no economic activity. (OECD, n.d. (b), para. 2) On the one hand, it undermines the integrity of and equity in the tax system, and on the other hand, it leads to the reduction of tax revenues of the states, damaging the fiscal function of taxation. Following the 2008 financial crisis, the loss of revenue has become even more important for public authorities with the increase in budget deficits and public debt. At G20 leaders’ summit held in 2012, the OECD was called on to develop an action plan to address BEPS issues in a comprehensive manner.
BEPS Action Plan was introduced at the G20 Finance Ministers Meeting in Moscow on July 20, 2013. The announced main objective of the BEPS Action Plan was establishing the international framework of taxation rules to ensure that profits are taxed in the country where economic activity is realized and in which the value is created, and to prevent revenue loss of states. According to the OECD, the BEPS-based tax loss is $100-240 billion per year, which is between 4% and 10% of annual global corporate income tax (CIT) revenues at 2014 levels. (OECD, 2015f, p. 102) If the plan can be successfully and comprehensively implemented then states will improve their fiscal space.1
1 The existing literature seems inconclusive about the scale of the government revenue implications of BEPS. Some examples are as follows; IMF researchers estimated BEPS related worldwide revenue loss as approximately $600 billion, which divides roughly $400 billion for OECD countries, 1% of their GDP, and $200 billion for non-OECD countries, 1.3% of their GDP. (Crivelli, De Mooji & Keen, 2015, p. 21) UNCTAD estimates revenue loss resulting from direct offshore investment links for developed countries is in the order of $100 billion and for developing countries is approximately $90 billion in 2012. (UNCTAD, 2015, pp. 200-201) Gabriel Zuchman estimates that Income Tax loss only caused by financial capital held in “tax havens” by way of banking secrecy principle is £80 billion for 2013. (Zuchman, 2015, pp. 68-70). A country-specific example is that tax revenue loss associated with the income shifting of MNEs for 2008 fiscal year was estimated approximately 30 percent of Corporate Tax Revenues in the United States. (Clausing, 2011, p. 1585). For an extensive literature review on the methods

The Political Economy of Public Finance (Edited by: Mustafa Çelen, Özkan Zülküfoğlu, Elżbieta Robak)
171
As a G20 member country, Turkey has approved the BEPS package and has committed to implement the minimum standards of the BEPS Action Plan. This paper aims to present a summary of the developments in international tax system following the introduction of BEPS Action Plan and investigate the relevant amendments made in tax legislation of Turkey until today. The next section begins with evoking the international tax framework before the Action Plan and summarizes factors leading to BEPS, and negative effects of BEPS on the international tax system. Then in the second section, the paper explains the context of measures included in the Action Plan by classifying the commitments of countries, which approved the BEPS package and it reviews the Inclusive Framework, which was built following the approval of BEPS package. In the third section, the paper analyses progress in the implementation of BEPS measures by looking over each action separately. It examines the consistency of the current case of Turkish tax legislation with BEPS package by including the amendments after the approval of BEPS package. After presenting some assessments on BEPS Action Plan in the fourth section, the paper concludes.
1. International Taxation System before BEPS Action Plan
1.1. OECD’s Role on International Taxation System
Preventing double taxation was the main reason for the emergence of international tax rules, as well as national tax laws. When capital, goods, and (to a lesser extent) labour move around the globe with little restriction, several countries may claim the same taxpayer, the same transaction, or the same activity. Double taxation generally arises where the same income or capital is taxed in more than one country. It can be in the form of juridical or economic double taxation. Juridical double taxation is taxation of the same income or capital in the hands of the same person in more than one country2.
to estimate revenue implications of international tax avoidance see; Dharmapala (2014) and Riedel (2015). 2 Juridical double taxation occurs where the same income is taxed in the hands of a person in both the country where it arises and in the country of which the person deriving the income is a resident (source/residence double taxation); or the same person is treated by both countries as being its own resident and is taxed on worldwide income or capital in both countries (residence/residence double taxation); or a person is taxed in both countries because the income

Gözde Nalbant Efe (BEPS Actıon Plan and the Current Case of Turkey)
172
Economic double taxation is taxation of the same income or capital in the hands of different persons by the two countries.3 (Pickering, 2013, pp. 6-7; Christians, 2012, pp. 1414-5)
To prevent double taxation and coordinate overlapping tax jurisdictions, states mandated laws in the form of domestic statutes, treaties and judicial determinations that are a product of domestic legislative and regulatory power. This was the first form of international tax coordination that comprises hard law.4 However, states sought alternative mechanisms by pursuing bilateral or multilateral agreements to coordinate allocation of taxing rights adequately because the application by all countries of common solutions to same cases of double taxation enables to clarify, standardize and confirm the fiscal situation of taxpayers. This was the second form of international tax coordination that comprises soft law. In the 1950s, OECD has arisen as the main shaper of international soft law5 mechanism in tax-related matters. (OECD, 2014, p. 7; Christians, 2016, pp. 1611-1614).
The first draft bilateral agreement was drawn up in 1928 based on the work initiated by the League of Nations in 1921 and ultimately concluded with Model Agreements of Mexico (1943) and London (1946), the principles of which were followed with certain variants in many of the bilateral conventions during the following decade. However, neither of these Model Agreements was fully and unanimously accepted. The increasing economic interdependence and cooperation in the post-war period have increasingly put emphasis on the importance of measures to prevent international double taxation. The OECD Fiscal Committee set to work in 1956 to establish a draft convention and submitted its final report entitled “Draft Double Taxation Convention on Income and Capital” in 1963. The convention was revised periodically, taking into account the
is treated by both countries as having a source in its jurisdiction (source/source double taxation). (Pickering, 2013, pp. 6-7) 3 The most common form of economic double taxation arises where associated enterprises are treated in different countries as having accrued the same profits. (Pickering, 2013, pp. 6-7) 4 Two methods prevail as follows: credits against domestic taxes for foreign taxes paid and exemptions from domestic tax for foreign income. (Christians, 2012, pp. 1416-17) 5 They are not legally binding but there is an expectation that they will be implemented accordingly by countries that are part of the consensus.
The Political Economy of Public Finance (Edited by: Mustafa Çelen, Özkan Zülküfoğlu, Elżbieta Robak)
173
member countries' recommendations, global economic developments and the innovations needed in the international tax system.6(OECD, 2014, pp. 7-8)
At the beginning of the 1950s, the number of bilateral agreements signed to prevent double taxation among OECD member countries was around 70, and today it reached more than 3000 globally. (OECD, 2017a, p. 6) Since 1963, the OECD Model Convention has had wide repercussions on the negotiation, application, and interpretation of tax conventions, and its impact has extended far beyond the OECD area. It has been used as the basis for the original drafting and the subsequent revision of the “United Nations Model Double Taxation Convention” between developed and developing countries. (OECD, 2014, p. 10) It was estimated that about 75 percent of the language of all bilateral double tax treaties was identical with the words of any other treaties as recommended in OECD Model Tax Convention. (Avi-Yonah, 2007, p. 1)
In applying the principles incorporated in the OECD Model Tax Convention and United Nations Model Double Taxation Convention to the taxation of MNEs, one of the most difficult issues that has arisen was the establishment of appropriate transfer prices7 for tax purposes. Governments need to ensure that the taxable profits of MNEs are not artificially shifted out of their jurisdiction and that the tax base reported by MNEs in their country reflects the economic activity undertaken therein. For taxpayers, it is essential to limit the risks of economic double taxation that may result from a dispute between two countries on the determination of the arm’s length remuneration. Therefore, an international consensus was required on how to establish transfer prices for tax purposes on cross-border transactions. OECD published “Transfer Pricing and Multinational Enterprises” report in 1979 to address these issues. This report repealed
6 The “OECD Model Tax Convention on Income and on Capital 2014”, published with the ninth update, is the current agreement. 7 Transfer prices are the prices at which an enterprise transfers physical goods and intangible property or provides services to associated enterprises and significant for both taxpayers and tax administrations, because they determine the taxable profits of associated enterprises in different tax jurisdictions.

Gözde Nalbant Efe (BEPS Actıon Plan and the Current Case of Turkey)
174
in 1995, and other reports addressing transfer-pricing issues in the context of specific topics were published at certain intervals.8 (OECD, 2017b, pp. 15-18)
Alongside the Model Tax Convention and Transfer Pricing Guidelines, OECD has carried out several studies on aggressive tax planning to help governments to reduce the tax risks. The Forum on Harmful Tax Practices (FHTP), which has been established in 1998, has built support for fair competition, identified more than 40 regimes as potentially harmful over time. Some of them have been abolished and others have been amended to remove their potentially harmful features. (Saint-Amans & Russo, 2013, para. 7)
1.2. Factors Leading to BEPS
Increased financial and economic integration throughout the globalization process has accelerated international tax competition. Along with the race to the bottom on CIT rates, both statutory and effective tax rates have fallen in recent years. (Devereux & Sørensen, 2006, pp. 5-10; Wermeend, Ploeg & Timmer, 2008, p. 175-178) MNEs used the resulting harmful tax practices, differences in tax systems and legislation of the countries to minimize their tax bases in countries with higher tax rates and to shift their profits to countries with lower ones. MNEs’ tax avoidance can be seen as just the flipside of harmful tax competition. If countries have not offered preferential tax rules, including low/no tax regimes for the particular taxpayer or income categories, MNEs tax planning strategies would be ineffective. (Ault, Schön & Shay, 2014, p. 276).
8 The “OECD Transfer Pricing Guidelines for Multinational Enterprises and Tax Administrations 2017”, published with the fifth update, is the current report. It focuses on the application of arm’s length principle as embodied in the OECD Model Tax Convention and 1979 report. The Guidelines analyses the methods for evaluating whether the conditions of commercial and financial relations within a MNE satisfy the arm’s length principle and discuss the practical application of those methods. Thus, tax administrations and MNEs obtain help to find mutually satisfactory solutions to transfer pricing issues, conflicts among them are minimized, and costly litigation option is avoided. (OECD, 2017b, p. 18)
The Political Economy of Public Finance (Edited by: Mustafa Çelen, Özkan Zülküfoğlu, Elżbieta Robak)
175
In 2013, OECD examined the root causes of BEPS in depth and identified six key pressure areas in Addressing Base Erosion and Profit Shifting report as follows (OECD, 2013a, pp. 47-48):
• International mismatches in entity and instrument characterization including hybrid mismatch arrangements and tax arbitrage,
• Application of treaty concepts to profits derived from the delivery of digital goods and services,
• The tax treatment of related party debt-financing, captive insurance, and other inter-group financial transactions,
• Transfer pricing, in particular in relation to the shifting of risks and intangibles, the artificial splitting of ownership of assets between legal entities within a group, and transactions between such entities that would rarely take place between independents,
• The effectiveness of anti-avoidance measures, in particular, general anti-avoidance rules (GAARs), controlled foreign company (CFC) regimes, thin capitalization rules and rules to prevent tax treaty abuse, and
• The availability of harmful preferential regimes.
The factors mentioned above give planning opportunities to MNEs in order to reduce their effective tax burden; even it is possible that their profits will end up untaxed anywhere (double non-taxation). The reason can mainly be summarized that the international tax standards drawn from national experiences to share tax jurisdiction may not have kept pace with the changes in the global business environment9. The international tax regime was built on competition between countries for investment and revenue, and it was based on the source and residence paradigm, which means countries tax their residents on a residence base and tax foreigners with the physical presence in
9 Some rules in international corporate tax policy were built on the assumption that one country would forgo taxation because another country would be imposing a tax. In the modern global economy, this assumption is not always correct and profits may end up untaxed anywhere. In addition, many rules were grounded in an economic environment characterized by fixed assets, plants and machinery and a lower degree of economic integration across borders. However, today’s digital economy allows profits to lie in in risk-taking and intangible assets, such as patents and trademarks. (Saint-Amans & Russo, 2013, para. 9).

Gözde Nalbant Efe (BEPS Actıon Plan and the Current Case of Turkey)
176
that country on a source base. Now neither the developed nor the developing countries are able to collect much tax revenue based on this paradigm. (Brauner, 2014, p. 65)
Kemmeren (2014) points out that tax planning strategies of MNEs have been made possible by the same countries that are now complaining about BEPS, and they were not interested in cooperating with each other until they have realized they had more to gain. Now they are focusing on cooperation among countries to tackle tax revenue raising problem. (p. 190)
1.3. Negative Effects of BEPS on Tax System
Base erosion and profit shifting strategies of MNEs reduce tax revenues of states. This causes public services to be performed with a limited budget or depending on public debt. Besides, BEPS practices of MNEs damages integrity and justice of taxation, distorts the competition between the firms operating on the domestic scale and those operating on the international scale and benefiting from BEPS facilities. If other taxpayers think that multinational corporations can legally avoid paying income tax, this will undermine voluntary compliance by all domestic taxpayers. Fiscal administrations may increase tax rates or introduce new taxes to recover their revenue losses that will result increasing the tax burden on domestic taxpayers unfairly. BEPS also causes an imbalance/injustice distribution of tax revenues across countries all around the world. Due to these negative effects of BEPS on tax systems, it seemed important and necessary to determine the new taxation rules according to changing circumstances. (OECD, 2013a, p. 50; OECD, 2013b, p. 8)
Loss of tax revenue from BEPS caused by globalization and increased tax competition is not a newly emerging issue. However, in recent years it has begun to be dealt with more closely. One of the reasons for this interest is the global economic crisis. While the 2008 crisis caused slowdowns in economies, which led to a decline in tax revenues because of progressive tax systems, public debts increased as governments tried to reduce the effects of the crisis with public expenditures, especially in developed economies. (Gooptu & Braga, 2010, pp. 207-217) It was also necessary to lower the tax burden on labour to stimulate economic growth and it deepened the problem of tax revenue. (EC,
The Political Economy of Public Finance (Edited by: Mustafa Çelen, Özkan Zülküfoğlu, Elżbieta Robak)
177
2015, pp. 23-34) In addition to these developments, in recent years, with Lux-leaks10 and similar scandals, it has been revealed the lowness of effective tax burden of MNEs. (Lepretre, 2014) The increased media attention has encouraged the perception that international tax rules are broken11, and that only the natives are paying taxes. When the debate over BEPS has reached its highest political level, the G20 finance ministers have requested the OECD to initiate a new study regarding this matter in June 2012 and asked OECD to report on this issue by their meeting in February 2013 (Saint-Amans & Russo, 2013, para. 1-4).
Because many BEPS strategies take advantage of the differences between the tax rules of different countries, it may be difficult for any single country, acting alone, to fully address the issue. Furthermore, it could result in the risk of double-taxation for the business that would affect growth, investment, and employment negatively. International coordination of tax policies is required as a condition for any chance of successful international tax reform and the OECD has already jumpstarted the process. (Brauner, 2014, p. 59). The OECD has committed to submit a global and comprehensive action plan based on the identified pressure areas with a view to provide concrete solutions to realign international standards with the current global business environment. (OECD, 2013a, pp. 50-51)
2. The Context of BEPS Action Plan
In the BEPS report, which was published in 2013 and included 15 action plans, necessary steps were determined to tackle BEPS related issues. Particular deadlines were dictated for delivery of a wide set of measures for each action item, and the resources and methods may be required for the implementation of them were specified. As can be seen in Table 1, the actions to tackle BEPS related issues require changes in OECD
10 Lux Leaks made public no less than 550 agreements involve over 340 MNEs and date between 2002 and 2010 that each document involves a specific tax scheme for a company and includes either a signature or a confirmation letter written by a Luxemburg tax office employee. 11 Brauner (2014) emphasizes the increasing media attention and concludes that there is nothing new about BEPS but perhaps MNEs have crossed the line beyond which their advantages in tax planning become obviously visible and thus publicly objectionable. (p. 57)

Gözde Nalbant Efe (BEPS Actıon Plan and the Current Case of Turkey)
178
Model Tax Convention, OECD Transfer Pricing Guidelines, double taxation treaties and domestic rules of countries and to develop a Multilateral Convention.
Table 1: Summary of the BEPS Action Plan
Actions Expected Output Deadline
Action 1: Digital Economy: Changes to the Model Tax Convention
Report identifying issues raised by the digital economy and possible actions to address them
September 2014
Action 2: Hybrids: Neutralizing the Effects of Hybrid Mismatch Arrangements
Changes to the Model Tax Convention September 2014
Recommendations regarding the design of domestic rules
September 2014
Action 3: CFC Rules: Strengthening Controlled Foreign Company Rules
Recommendations regarding the design of domestic rules
September 2015
Action 4: Interest Deductions: Limiting Base Erosion via Interest Deductions and Other Financial Payments
Recommendations regarding the design of domestic rules
September 2015
Changes to the Transfer Pricing Guidelines December 2015
Action 5: Harmful Tax Practices: Countering Harmful Tax Practices More Effectively, Taking into Account Transparency and Substance
Finalize review of member country regimes September 2014
Strategy to expand participation to non-OECD members
September 2015
Revision of existing criteria December 2015
Action 6: Treaty Abuse: Preventing treaty abuse Changes to the Model Tax Convention September
2014
Recommendations regarding the design of domestic rules
September 2014
Action 7. Permanent Establishment Status: Preventing the Artificial Avoidance of Permanent Establishment Status
Changes to the Model Tax Convention September 2015
Action 8. Transfer Pricing: Assuring that Transfer Pricing Outcomes are in line with Value Creation: Intangibles
Changes to the Transfer Pricing Guidelines and possibly to the Model Tax Convention
September 2014
Changes to the Transfer Pricing Guidelines and possibly to the Model Tax Convention
September 2015
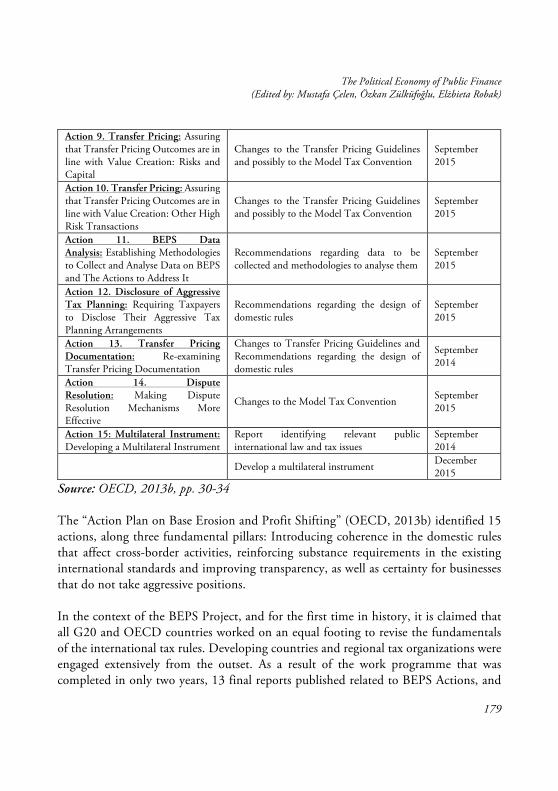
The Political Economy of Public Finance (Edited by: Mustafa Çelen, Özkan Zülküfoğlu, Elżbieta Robak)
179
Action 9. Transfer Pricing: Assuring that Transfer Pricing Outcomes are in line with Value Creation: Risks and Capital
Changes to the Transfer Pricing Guidelines and possibly to the Model Tax Convention
September 2015
Action 10. Transfer Pricing: Assuring that Transfer Pricing Outcomes are in line with Value Creation: Other High Risk Transactions
Changes to the Transfer Pricing Guidelines and possibly to the Model Tax Convention
September 2015
Action 11. BEPS Data Analysis: Establishing Methodologies to Collect and Analyse Data on BEPS and The Actions to Address It
Recommendations regarding data to be collected and methodologies to analyse them
September 2015
Action 12. Disclosure of Aggressive Tax Planning: Requiring Taxpayers to Disclose Their Aggressive Tax Planning Arrangements
Recommendations regarding the design of domestic rules
September 2015
Action 13. Transfer Pricing Documentation: Re-examining Transfer Pricing Documentation
Changes to Transfer Pricing Guidelines and Recommendations regarding the design of domestic rules
September 2014
Action 14. Dispute Resolution: Making Dispute Resolution Mechanisms More Effective
Changes to the Model Tax Convention September 2015
Action 15: Multilateral Instrument: Developing a Multilateral Instrument
Report identifying relevant public international law and tax issues
September 2014
Develop a multilateral instrument December 2015
Source: OECD, 2013b, pp. 30-34
The “Action Plan on Base Erosion and Profit Shifting” (OECD, 2013b) identified 15 actions, along three fundamental pillars: Introducing coherence in the domestic rules that affect cross-border activities, reinforcing substance requirements in the existing international standards and improving transparency, as well as certainty for businesses that do not take aggressive positions.
In the context of the BEPS Project, and for the first time in history, it is claimed that all G20 and OECD countries worked on an equal footing to revise the fundamentals of the international tax rules. Developing countries and regional tax organizations were engaged extensively from the outset. As a result of the work programme that was completed in only two years, 13 final reports published related to BEPS Actions, and

Gözde Nalbant Efe (BEPS Actıon Plan and the Current Case of Turkey)
180
final outputs have been consolidated into a comprehensive BEPS package. This package was approved at the G20 Summit held in Antalya on 15-16 November 2015, and thus a comprehensive package of measures was agreed. (OECD, 2015a, pp. 5-6)
2.1. Commitments of Countries that Approved the BEPS Package
The measures in the BEPS package range from new minimum standards to revision of existing standards, common approaches that will facilitate the convergence of national practices and guidance drawing on best practices. The fifteen actions can be collected underneath different titles according to their bindingness level as follows: (OECD, 2015a, pp. 6-10)
In particular, countries agreed on minimum standards to tackle issues in cases, where no action by some countries would have created negative spillovers in other countries. Recognizing the need to level the playing field, all OECD and G20 countries committed to consistent implementation in the areas of preventing treaty shopping (Action 6), Country-by-Country Reporting (Action 13), fighting harmful tax practices (Action 5) and improving dispute resolution (Action 14).
In other areas, such as hybrid mismatch arrangements (Action 2) and interest deductibility (Action 4), countries agreed on a general tax policy direction based upon changes in OECD Model Tax Convention and Transfer Pricing Guidelines. In these areas, they are expected to converge over time through the implementation of the agreed common approaches, thus enabling further consideration of whether such measures should become minimum standards in the future.
Guidance based on best practices will also support countries that seek to strengthen their domestic legislation relating to mandatory disclosure by taxpayers of aggressive or abusive transactions, arrangements, or structures (Action 12), and the building blocks of effective Controlled Foreign Company (CFC) rules (Action 3).
In the areas, such as transfer pricing (Action 8-9-10) and permanent establishment status (Action 7), countries have agreed that existing standards would be reviewed. Besides, OECD has begun to lead the process of establishing methodologies to collect and analyse data on BEPS (Action 11) and developing a multilateral instrument (Action 15).

The Political Economy of Public Finance (Edited by: Mustafa Çelen, Özkan Zülküfoğlu, Elżbieta Robak)
181
OECD and G20 countries agreed to keep working on an equal footing to monitor the implementation of the BEPS measures. The monitoring consists of an assessment of compliance, in particular, with the minimum standards in the form of peer reviews regarding what countries have done to implement the BEPS Package recommendations. This task was assigned to “Inclusive Framework” which was established soon afterward.
2.2. Inclusive Framework
In October 2015, the G20 Finance Ministers called on the OECD to build a framework on an equal footing involving interested non-G20 countries and jurisdictions, with a focus on developing countries. The OECD established the Inclusive Framework (IF) on BEPS in January 2016 so that all interested countries and jurisdictions can work together. To become a member, a country or jurisdiction needs to commit to the BEPS package and adopt the minimum standards, and pay an annual membership fee.12 (OECD, 2017c, p. 1) At the present time (as of August 5, 2017), 102 countries and jurisdictions have joined the IF. Together, they represent more than 93% of global GDP. (OECD, 2017a, p. 6)
Even though the establishment of IF is a momentous event in international tax governance, it can be criticized for its timing and/or its authorization. Christians (2016) points out that by bringing OECD and non-OECD members together in a problem-solving forum, OECD tries to be as inclusive as the United Nations. However, it is not since BEPS Action Plan was initiated by and for its member countries, and non-OECD countries are expected to follow the agreed agenda rather than open up the discussion again to consider new ideas and issues (p. 1645). In addition, the OECD built up the term “Inclusive Framework” to identify a set of measures that the OECD will use to make equal participation by non-OECD countries under the framework of the OECD, rather than forming a wholly new international institution or turning to the United Nations to host future tax policy development. (p. 1606)
12 A group of other countries and jurisdictions are participating in the inclusive framework, while they are considering whether to commit to the implementation of the BEPS Package. These countries (like China and India) and jurisdictions participate as “Invitees”. Others that committed to implementing minimum standards are referred as “Associates”.

Gözde Nalbant Efe (BEPS Actıon Plan and the Current Case of Turkey)
182
IF has been announced as organized for the purpose of measuring and the monitoring BEPS compliance across countries.13 IF has a mission to peer-review the implementation process of minimum standards14 and published the first BEPS Progress Report covering the period between July 2016 and June 2017. The report consists of two parts; the former summarizes the progress made in the implementation of the BEPS package15 and the latter sets out the work of IF in that 12-month period. The report also reveals the schedule of future peer reviews.16
13 Members of IF are now progressing the IF’s mandate that is to (i) review the implementation of the four minimum standards, (ii) gather data for the monitoring of the other aspects of implementation, including under BEPS Actions 1 (on the tax challenges of the digital economy) and 11 (on measuring and monitoring BEPS), (iii) finalize the remaining technical work to address BEPS challenges, and (iv) support jurisdictions in their implementation of the BEPS package, including by providing further guidance on the standards and by developing toolkits for low income countries. (OECD, 2017a, p. 4) 14 The parameters of compliance with minimum standards are set with agreements of countries in terms of reference for peer review. Approved by the IF; “BEPS Action 5 on Harmful Tax Practices: Transparency Framework – Peer Review Documents” was released in February 2017, “BEPS Action 6 on Preventing the Granting of Treaty Benefits in Inappropriate Circumstances – Peer Review Documents” in May 2017, “BEPS Action 13 on Country-by-Country Reporting – Peer Review Documents” in February 2017 and “BEPS Action 14 on More Effective Dispute Resolution Mechanisms – Peer Review Documents” in October 2016. Besides all members will participate on an equal footing, subsidiary bodies and ad hoc groups are identified to conduct peer reviews for each minimum standards. For example, FHTP will conduct the peer review of Action 5 and delegates of different working parties under the aegis of the IF will conduct the peer review of Action 13. (OECD, 2016; 2017d; 2017j; 2017k). 15 Because the progress about each action mentioned in the next section of the paper, it is not discoursed in here. 16 First peer review of transparency framework for the exchange of tax rulings (Action 5) will be finalized in 2017 for OECD/G20 members, in 2018 for IF (non-developing) members and 2019 for IF (developing) members that requested additional time. In July 2017, FHTP will start reviewing of preferential regimes (Action 5) of new IF members. Between September and December 2018, peer review of treaty shopping (Action 6) for all IF members will be conducted. Peer review of Country-by-country reporting (Action 13) will be handled in 3 phases; in 2017 legal and administrative framework, in 2018 exchange of information framework and in 2019, all aspects of implementation will be reviewed. Mutual agreement procedures (MAP) (Action 14) will be peer-reviewed according to batches, by deferring developing countries and any non-OECD and/or non-G20 countries if its MAP regime is not indicated as requiring improvement

The Political Economy of Public Finance (Edited by: Mustafa Çelen, Özkan Zülküfoğlu, Elżbieta Robak)
183
3. Progress in the Implementation of BEPS Package and the Current Case of Turkey
Action 1, Digital Economy: The Task Force on the Digital Economy (TFDE) that was established in 2013 as a subsidiary body of the Committee on Fiscal Affairs (CFA), in which non-OECD G20 countries participate on an equal footing with OECD countries, has issued the final report that sets out an analysis of international tax challenges posed by the spread of digital economy. Certain business models and key features of the digital economy that may worsen BEPS risks were included in the report. Rules and implementation mechanisms to enable efficient allocation of the collection of value-added tax (VAT) in the country of the consumer in cross-border business-to-consumer transactions were described. The report also discussed and analysed options to deal with the broader tax challenges raised by the digital economy and recommended monitoring the developments in the digital economy over time as a next step.17 A report reflecting the outcome of the continued work concerning the digital economy will be produced by 2020. (OECD, 2015e, pp. 11-13)
by other members of the FTA (Forum on Tax Administration) MAP Forum. (OECD, 2017c, pp. 38-40) 17 The 2015 report presented a number of specific options including a new tax nexus of “significant economic presence”, the use of a withholding tax on certain types of digital transactions and a “digital equalization levy”. None of these options was recommended because it seemed necessary to further the calibration of options and to see the impacts of other BEPS measures on the digital economy, which mitigate some tax challenges of the digital economy. Thus, TFDE is monitoring developments and aiming to carry forward its work until 2020. For an analysis of imposing a withholding tax on business-to-business digital transactions, see; (Baez & Brauner, 2015), for an analysis of developing of a new PE nexus based on digital presence, see; (Hongler & Piston, 2015). Both of these working papers are published under IBFD (International Bureau of Fiscal Documentation) and it is proposed that IBFD academic taskforce views the new PE nexus as the superior solution to the introduction of new withholding taxes. Because it seemed fitting better with OECD’s conservative evolutionary approach and it is easier to fine-tune to reach a stable balance between source and residence taxation. By the way, India has taken a major step and announced the introduction of “Equalization Levy”, with effect from 1st June 2016 at a rate %6 of payment received or receivable. For an examination of Indian experience with digital equalization levy, see; (Lahiri, Ray & Sengupta, 2017)

Gözde Nalbant Efe (BEPS Actıon Plan and the Current Case of Turkey)
184
The Case of Turkey: Turkish Ministry of Finance has begun to consider taxing digital activities in 2013. The finance minister of that period Mehmet Şimşek made a statement that the administration was considering to levy a tax on online advertisement revenues. (Demir, 2013) The administration developed a new software to track sales in the digital economy but it was capable of tracking only companies registered in Turkey. (Biçer & Erginay, 2015, p. 53)
In December 2015, “General Communique on Tax Procedure Law Serial No 464” obligated internet service providers, banks and internet advertising agency starting from June 2016 to submit information permanently on a monthly basis with Turkish customers to Turkish Revenue Administration. The necessary information includes the customers’ personal or corporate name and communication information, websites, addresses, the price of the services and the date of receipts. (464 Sıra Nolu Vergi Usul Kanunu Genel Tebliği, 2015) By including banks in this legal arrangement, Revenue Administration signalled that they were considering introducing a withholding tax on digital incomes.
As a next step, in August 2016, Article 9 of law numbered 6745 added a provision to Tax Procedural Law (Article 11 which regulates “the person responsible for tax”), that authorizes the Council of Ministers to determine the rate of withholding tax -between upper and bounder limits which were designated in tax laws- for parties and intermediaries in taxable transactions regardless of whether the recipient of the payment is a taxpayer, taxpayers or intermediaries of the payments are obliged to withhold tax, the payments relate to the trading of goods or services, the transaction is digital, the payment is deducted from the tax base. (Yatırımların Proje Bazında Desteklenmesi, 2016, Article 9) However, the withholding tax rates have not been announced yet by the Council of Ministers. This amendment can be seen as an important development because the responsibility of withholding has extended to include digital transactions. (Kara & Öz, 2016, p. 36)
The legal infrastructure has been prepared, and we can expect that Turkish Revenue Administration will carry it into practice in a close future. In the recent time, Finance Minister Naci Ağbal has made a public declaration that they were working on a Decree of Council of Minister, to levy a withholding tax on payments made to abroad through

The Political Economy of Public Finance (Edited by: Mustafa Çelen, Özkan Zülküfoğlu, Elżbieta Robak)
185
the transactions made by way of banks. (Karanfil, 2017) Thus, the VAT rules are to be expanded to cover digital sales.18
Action 2, Hybrids: This action provides a common approach that makes the convergence of national practices easier through domestic and treaty rules to neutralise hybrid mismatch arrangements.19 It helps to prevent double non-taxation by eliminating the tax benefits of mismatches and to end multiple deductions for a single expense, deductions in one country without corresponding taxation in another, and the generation of multiple foreign tax credits for one amount of foreign tax paid. Recommendations were developed in 2015 report to make functional these measures, which will go to take place in model treaty provisions. Further to that, new work has been undertaken to consider similar issues that can arise through the use of branch structures, and an updated report was published in June 2017, which includes identifications of five categories of branch mismatch arrangements20 and sets out specific recommendations to domestic legislation. (OECD, 2017a, p. 26-34) Since this action and recommendations are directly related to tax treaties between countries, multilateral convention (Action 15) includes the amendments related to this action.
The Case of Turkey: Turkey has not applied any hybrid mismatch rules to neutralize the tax effects of hybrid mismatch arrangements neither in Turkish tax laws nor in Turkish tax treaties. Therefore, it is unknown whether Turkey will introduce rules in
18 A draft law was presented to the Parliament on September 27, 2017, including a value-added tax registration obligation, which will be introduced for nonresidents who provide online services to end Turkish customer users via electronic media. Detailed explanations of the application are expected. (EY, 2017a) 19 These mismatches are the result of differences in the tax treatment or characterization of an instrument or entity. Different countries that independently employing different -apparently incompatible, yet independently logical- tax rules to similar circumstances, and consequently open the door to tax arbitrage. Such arbitrage is widely considered abusive and leads to double non-taxation. (Brauner, 2014, p. 79) 20 Branch mismatches occur where the residence jurisdiction (in which the head office is established) and a branch jurisdiction (in which the branch is located) take a different view as to the allocation of income an expenditure between the branch and the head office and the branch jurisdiction does not treat the firm as having a taxable income in that jurisdiction because of inconsistencies in the domestic rules. (OECD, 2017l, p. 9)
Gözde Nalbant Efe (BEPS Actıon Plan and the Current Case of Turkey)
186
its tax law. (Biçer & Erginay, 2015, p. 53) We recommend that when the implementation phase of MLI begins, Turkish Tax Authorities must consider this action item according to the proposals within the BEPS package, and necessary provisions must be included in tax laws and treaties to protect the tax base of CIT.
Action 3, Controlled Foreign Company (CFC) Rules: The final report has been issued to serve the benefit of countries proposing recommendations to domestic legislation. The report has set out the following six building blocks for the design of effective CFC rules: (i) Definition of a CFC, (ii) CFC exemptions and threshold requirements, (iii) Definition of income, (iv) Computation of income, (v) Attribution of income, and (vi) Prevention and elimination of double taxation. These measures are not minimum standards but if countries decide to implement, they will effectively prevent taxpayers from shifting income into foreign subsidiaries (OECD, 2015c, pp. 9-10)
Since OECD views CFC regimes as purely domestic anti-abuse rules, this action item develops recommendations to domestic legislation regarding the design of controlled foreign company rules. Brauner (2014) criticizes this perspective at this point because different legislations about CFC rules give opportunities to MNEs for tax planning, and countries must be in coordination when designing their CFC rules. Unless he indicates that the potential of Action 3 is limited. (p. 85-88)
The Case of Turkey: Turkey has had CFC rules in Corporate Tax Law since 2006. If a Turkish resident company controls, directly or indirectly, at least 50% of the share capital, dividends or voting power of a foreign company, then the income of foreign company is subject to CFC rules when following conditions actualize together: 25% or more of the gross income of the CFC consists of passive income, the CFC is subject to an effective tax rate lower than 10 percent in its country of residence and annual total gross profit of the CFC exceeds the foreign currency equivalent of TRY 100,000. (Kurumlar Vergisi Kanunu, Article 7)
The Turkish CFC rules partly comply with the first building block but comply with the second since Turkey applies a 20 percent CIT rate and CFC rules would only apply to CFCs resident in countries with lower than 10 percent. The definition of CFC income must be elaborated to comply with the third block. Turkish CFC rules allow the losses to be offset against the profits of that CFC and to be carried forward for use against profits arising in the next five years but applies the law of the CFC jurisdiction

The Political Economy of Public Finance (Edited by: Mustafa Çelen, Özkan Zülküfoğlu, Elżbieta Robak)
187
thus CFC rules partly comply with the fourth block. Turkish CFC rules do not have a minimum ownership requirement and they are based on ownership of the last day not the actual period of ownership, thus CFC rules comply only some recommendations of the fifth block. Turkish CFC rules allow a credit for foreign income taxes actually paid and exempt dividends where a CFC actually distributes dividends out of income that has already been attributed to its residence shareholders under the CFC rules. However, there is no rule in Turkey to exempt gains on the disposition of CFC shares from taxation if the income of the CFC has previously been subject to CFC taxation. In such a situation, Turkish CFC rules could give rise to double taxation, and do not comply with the sixth block. (Ateş, 2017, pp. 780-781)
The existing CFC rules of Turkey seems inadequate with the recommended building blocks. The Action item is not a minimum requirement but if Turkish Tax Authorities consider revising these rules and strengthen the building blocks, they will prevent taxpayers from shifting income into foreign subsidiaries and preserve CIT base from eroding.
Action 4, Interest Deductions: This Action has come up because most jurisdictions legitimize interest expense on borrowing as a deductible expense. When applied to corporations, this basic rule encourages the use of debt financing rather than equity financing for corporate structures, as interest deductions reduce the tax base while distributions of corporate profits in the form of dividends do not. In addition, MNEs operating in high-tax countries tend to “load” debt into companies and arrange for the interest payments to be received by an entity in a low- or no-tax jurisdiction. This problem becomes more complex where a related shareholder or finance company organized in a low-tax jurisdiction provides the loan. Furthermore, not only can the amount of the loan be excessive, but there is also an incentive to have an excessively high-interest rate on the loan. (Ault & Arnold, 2017, pp. 11-12)
Within the scope of Action 4, the final report has been issued to serve the benefit of countries proposing recommendations to domestic legislation. The report analysed several best practices and recommended a common approach including fixed ratio

Gözde Nalbant Efe (BEPS Actıon Plan and the Current Case of Turkey)
188
rule21, which ensures that an entity’s net interest deductions are directly linked to its level of economic activity. Further work on the aspects of common approach was completed and published as an update regarding the implementation option of group ratio rule. 22 (OECD, 2017e, p. 13)
The Case of Turkey: Turkish law of CIT has introduced a range of rules to limit interest deductions for intra-group, as well as third-party interest payments. Thin capitalization rules are determined with the Article 12 of CIT law, which includes a fixed ratio rule based on a debt-to-equity ratio. If the debt owed by a Turkish entity to its related parties exceeds three times the equity, the excess debt is deemed disguised equity and may not be deducted for corporate tax purposes. (Kurumlar Vergisi Kanunu, Article 12) The final report on Action 4 recommended a fixed ratio rule that limits an entity’s net deductions for interest and payments economically equivalent to interest to a percentage of its earnings before interest, taxes, depreciation, and amortization (EBITDA). Thus Turkish fixed ratio rule is inconsistent with the BEPS package and follows a different method.
The Turkish parliament also adopted a provision (entered into force on January 1, 2013) into the CIT law, which authorizes Council of Ministers to determine the non-deductible interest portion to the extent the maximum limit does not exceed 10 percent. (Kurumlar Vergisi Kanunu, Article 11/i) Such a measure seems to be more effective in reducing the general tax preference for debt over equity in addressing interest related BEPS. (Ateş, 2017, p. 781) However, the regulation has no area of application because a decree setting the percentage of the limitation has not been announced yet.
Action 5, Harmful Tax Practices (minimum standard): The OECD started work on addressing harmful tax competition in the late 1990s, resulting in a 1998 report,
21 Recommended approach is based on a fixed ratio rule that limits an entity’s net deductions for interest and payments economically equivalent to interest to a percentage of its earnings before interest, taxes, depreciation, and amortization (EBITDA). To ensure countries apply a fixed ratio to tackle BEPS, a corridor of possible ratios between %10 and %30 is recommended. 22 With the updated report, it is emphasized that some groups are leveraged with third party debt for non-tax reasons and a group ratio rule is recommended alongside the fixed ratio rule. This rule allows an entity, which has net interest expense above a country’s fixed ratio, to deduct interest up to the level of the net interest/EBITDA ratio of its worldwide group.

The Political Economy of Public Finance (Edited by: Mustafa Çelen, Özkan Zülküfoğlu, Elżbieta Robak)
189
“Harmful Tax Competition: An Emerging Global Issue” (the 1998 Report) and created the Forum on Harmful Tax Practices (FHTP) to take this work forward. With Action 5 in BEPS package, the role of the FHTP expanded by committing to “revamp the work on harmful tax practices.” FHTP was asked to focus particularly on defining substantial activity as a requirement for any preferential regime, improving transparency, including compulsory spontaneous exchange on rulings related to preferential regimes, and evaluating preferential tax regimes in the BEPS context. (OECD, 2015b, pp. 9-11) The FHTP has reviewed 43 preferential tax regimes in 2015 Final Report and concluded that 16 Intellectual Property (IP) regimes23 was not consistent with the agreed Modified Nexus approach24. It suggested countries to proceed with a review of possible amendments of the relevant features of their regimes.25 (OECD, 2015b, p. 62)
Action 5 is a minimum standard and tax authorities that grant preferential tax treatment for IP-related income via administrative rulings are to exchange such rulings and subject to peer review. However, it should be noted that there are no penalties or prohibitions to be imposed for the countries that deviate from the nexus-based minimum standard, and this situation may distort the success of the implementation of Action 5 (Christians, 2016, p. 1631)
Brauner (2014) emphasizes the importance of steps taken by this action like establishing a substance principle linking tax planning and value creation (nexus approach) and
23 For an in-depth analysis of how MNEs IP-based profit shifting strategies work, see; (Fuest, Spengel, Finke, Heckemeyer & Nusser, 2013, p. 3-11) 24 FHTP developed Modified Nexus Approach based on the location of the R&D expenditure incurred in developing the patent or product. This approach requires that substantial economic activities must be undertaken in the jurisdiction where preferential regimes for IP exists. To make this happen, it requires tax benefits to be connected directly to a significant proportion of the actual R&D expenditures. For more details and implementation examples, see (Monsenego, 2017; OECD, 2015g). 25The timetable for amendments: In 2015, countries must begin the process to change their laws for existing IP regimes. By 30 June 2016, (1) new regimes including the modified nexus approach must take effect; (2) existing regimes closed to new entrants (countries can specify an earlier cut-off date if they wish). By 30 June 2021, no more tax benefits under non-nexus compliant regimes (countries can choose an earlier date if they wish). (OECD, 2015b, pp. 35-36)
Gözde Nalbant Efe (BEPS Actıon Plan and the Current Case of Turkey)
190
engaging non-OECD members with IF. However, by indicating that this action item is actually related with tax havens, off-shore regimes and similar rent-seeking regimes, he reminds past initiatives, which have never succeeded, since there was simply too much to lose -or gain- from minor to major non-cooperation. Yet, he concludes that collective action led by the most powerful countries could change this outcome. (pp. 76-79) Zuchman (2015) highlights that even if the countries that were seen as tax havens would sign the agreements that bringing automatic information exchange or abolishing harmful tax practices, it would be a naiveté to believe that these countries are going to give up the chance to manage the wealth of large companies. Because the accounts in tax havens are designed to cut the relationship of money with its real owner by using fictive corporations, fiduciary firms or foundations. In addition, developed countries have no means to audit if these tax havens are behaving according to international rules and regulations. Thus, he proposes that developed countries should threaten the tax havens with economic sanctions to tackle with BEPS-related issues. (pp. 100-108)
Action 5 also brings spontaneous information exchange between countries on certain tax rulings.26 Multilateral Convention on Mutual Administrative Assistance in Tax Matters27 that was opened for signature in 2011 is a useful tool for countries as they seek to implement the BEPS package since it facilitates cross-border co-operation between tax authorities. In particular, the ability to exchange tax information under the Convention provides a legal basis for jurisdictions to meet their commitments to share tax rulings. (OECD, 2017a, pp. 9-10)
The Case of Turkey: In 2015 Final Report, The FHTP indicated that the IP regime of Turkey (namely the technology development zone regime) was not consistent with the agreed Nexus approach. (OECD, 2015b, p. 63) The profits gained by individual and
26 These six categories are (1) rulings relating to preferential regimes; (2) unilateral APAs (Advance Pricing Agreements) or other cross-border unilateral rulings in respect of transfer pricing; (3) cross-border rulings providing for a downward adjustment of taxable profits; (4) permanent establishment (PE) rulings; (5) related party conduit rulings; and (6) any other type of ruling agreed by the FHTP that in the absence of spontaneous information exchange gives rise to BEPS concerns. (OECD, 2015b, p. 46) 27 Updated information about participated jurisdictions can be followed from http://www.oecd.org/tax/exchange-of-tax-information/Status_of_convention.pdf

The Political Economy of Public Finance (Edited by: Mustafa Çelen, Özkan Zülküfoğlu, Elżbieta Robak)
191
corporate taxpayers operating in such zones from software and R&D operations exclusively in these areas are exempt from income and corporate tax until 31 December 2023. (Biçer & Erginay, 2015, p. 55) On the other hand, nexus approach requires tax benefits to be connected directly to a significant proportion of the actual R&D expenditures. In this context, interest payments, building costs, and related-party outsourcing and acquisition costs cannot be included in overall expenditures, and hence do not affect the amount of income that may benefit from an IP regime. The nexus approach, therefore, does not include all expenditures ever incurred in the development of an IP asset in overall expenditures. Instead, it only adds two things to qualifying expenditures: expenditures for related-party outsourcing and acquisition costs. (OECD, 2015b, p. 28)
In addition, a new CIT Article 5/B entitled the “Industrial property rights exemption” that came into force on 1 January 2015 provided a 50 percent reduced rate to income from IP assets. (Aile ve Sosyal Politikalar Bakanlığının, 2014, Article 82) The reduced tax rate not only applies to royalties from the sale of licensing of IP assets but also to embedded royalties, i.e. the sales income from a good or service that was developed using the IP asset. The new introduced regime did not included specific rules for such deductible items too and can cause harmful tax competition. (Ateş, 2017, p. 778) However, in the peer review of preferential regimes of Inclusive Framework, Turkey’s 5/B regime has been found to be not harmful. (OECD, 2017a, p. 24)
Turkish legislation provides for a 30 percent withholding tax on payments made to tax havens. However, the rule is not applying since 2006 because The Council of Ministers should announce the list of jurisdictions engaged in harmful tax practices. (Kurumlar Vergisi Kanunu, Article 30/7)
FHTP has revised only preferential IP regimes until now. Turkey introduced non-IP preferential tax regimes in 2012 and 2016 to stimulate investment. It seems that some tax practitioners are in favour of using preferential tax regimes, even though they may be harmful. Their argument may be that many developed countries are already using potentially harmful tax regimes. (Ateş, 2017, p. 778). In addition, it seems that implementation of Action 5 is getting distorted because there are no penalties or prohibitions to be imposed for the countries that deviate from the nexus-based minimum standard as stated previously.
Gözde Nalbant Efe (BEPS Actıon Plan and the Current Case of Turkey)
192
Turkey has signed Multilateral Convention on Mutual Administrative Assistance in Tax Matters in 2011 but the convention did not enter into force yet. Turkish parliament approved the Convention with an enactment in May 2017 (Vergi Konularında Karşılıklı, 2017) and after publishing in Official Newspaper, a Council of Ministers Decree is required for the convention to go into effect. The Convention will enter into force for Turkey three months later following the agreement, approval, admission and ratification documents would commend. (Erdem, 2017)
Action 6, Treaty Abuse (minimum standard): The phrase “treaty abuse” means tax-planning strategies of taxpayers, which was not intended by the countries that are contracting parties to the effected treaties. Action 6 proposes to counter these gaps by revising the terms of treaties going forward. (Christians, 2016, p. 1634) The 2015 final report about preventing treaty abuse was aimed to develop model treaty provisions regarding the design of domestic rules to prevent the granting of treaty benefits in inappropriate circumstances, clarify that tax treaties are not intended to be used to generate double non-taxation and identify tax policy considerations that countries should consider before entering into a tax treaty with another country. To provide safeguards against the abuse of treaty, anti-abuse rules were introduced and changes that should be included in Model Tax Convention were identified. (OECD, 2015h, pp. 9-14) The implementation of this minimum standard will be carried out with multilateral convention (Action 15).
OECD CFA has published draft contents of the 2017 update to the OECD Model Tax Convention on July 11, 2017. The 2017 update primarily comprised changes to the OECD Model Tax Convention that have been approved as part of the BEPS Package, which was foreseen as part of the follow-up work on the treaty-related BEPS measures. It will be submitted for the approval of CFA and the OECD Council later in 2017. (OECD, 2017f, p. 2)
The Case of Turkey: Currently, Turkey has tax treaties with 84 different countries. (Revenue Administration of Turkey, n.d.) Turkey already has anti-abuse clauses in some of its tax treaties. Yet there are no amendments in legislation regarding the treaty abuse conditions. It is expected that Turkey’s implementation of treaty-based measures will proceed in the context of the MLI. (Ateş, 2017, 785-786)
The Political Economy of Public Finance (Edited by: Mustafa Çelen, Özkan Zülküfoğlu, Elżbieta Robak)
193
The Draft Tax Procedure Code, which was announced in 2016, has a new article that emphasizes that international tax treaties are reserved the right when implementing the TPC Code. (Vergi Usul Kanunu Tasarısı, 2016, Article 2)
Action 7, Permanent Establishment (PE) Status: The definition of “permanent establishment” in Article 5 of the OECD Model Tax Convention was amended to address the use of formalistic planning such as commissionaire structures and offshore rubber-stamping arrangements. Action 7 also updated the specific activity exemptions in Article 5(4) and added a specific anti-abuse rule to prevent MNEs from fragmenting their operations in a country in order to claim exemption from permanent establishment status.28 These measures are expected to be implemented into existing tax treaties of which countries signed the multilateral convention (OECD, 2017a, p. 12)
The language of this action item seemed very narrow and limited by only indicating commissionaire arrangements and specific activity exemptions. Despite the contribution of political pressure by developing and emerging economies, little attention devoted to the main sources of complaints by such countries. The amendments have followed a traditional direction of protecting source taxation, and OECD was criticized as having no consideration of service PE or digital PE option. It can be expected that OECD will handle this issue with Action 1 in the coming future with a holistic approach. Another possibility is that OECD will continue to patch up only the wounds affected by the most conspicuous thorns and this will be the test of BEPS project’s success. (Brauner, 2014, p. 95-96)
The Case of Turkey: In the OECD Model Tax Convention, specific activity exemptions that enable MNEs to avoid from permanent establishment status were stipulated to have a preparatory and auxiliary character. In the forthcoming updated Model Tax Convention, these specific exemptions are updated and storage and delivery activities of products that are subject to digital sales may not be considered as preparatory and auxiliary. (OECD, 2017a, p. 12) Turkish tax law does not include
28 Specific activity exemptions that enable MNEs to avoid from permanent establishment status are stipulated to have a preparatory and auxiliary character. Thereby storage and delivery activities of products that are subject to digital sales may not be considered as preparatory and auxiliary (Kara & Öz, 2016, p. 34)
Gözde Nalbant Efe (BEPS Actıon Plan and the Current Case of Turkey)
194
special rules to prevent the artificial avoidance of PE status. In this way, Tax Authorities will be able to impose a tax on such activities. These amendments are expected to take place in domestic legislation and tax treaties within the process of implementation of MLI.
On the other hand, the Draft Tax Procedure Code which was announced in 2016 includes a new article named “Establishment in the Electronic Environment” which defines it as “If an internet, extranet or the like telecommunication environment or means is assigned or used for commercial, industrial or professional activity, then it is an establishment in the electronic environment”. The Ministry of Finance is authorized to determine the context of the establishment, to oblige the parties involved as a seller or intermediary of the payment to withhold tax. (Vergi Usul Kanunu Tasarısı, 2016, Article 130)
Action 8-9-10, Transfer Pricing: 2017 edition of the OECD Transfer Pricing Guidelines was published on July 10, 2017. This updated edition incorporated the substantial revisions made to reflect the clarifications and revisions agreed in the 2015 BEPS reports on Actions 8-10 and 13 to assure that transfer pricing outcomes are in line with value creation in relation to intangibles, including the hard-to-value ones, to risks and capital, and to other high-risk transactions. It also included the revised guidance on safe harbours approved in 2013, which recognised that properly designed safe harbours can help to relieve some compliance burdens and provide taxpayers with greater certainty. (OECD, 2017b, p. 20)
Tax administrations were stated as better equipped to address profit shifting by MNEs through mechanisms such as (OECD, 2017a, p. 14):
• Contractual allocations of risk to low-taxed affiliates that lack the capacity to assume those risks;
• Provision of capital by an entity that lacks the resources to manage that capital; • Planning based on mere ownership of an intangible by an entity that does not
perform value-creating functions such as development, enhancement, protection, and exploitation of the intangible.
The Political Economy of Public Finance (Edited by: Mustafa Çelen, Özkan Zülküfoğlu, Elżbieta Robak)
195
The fundamental criticism of this Action is about arm’s-length principle. Some NGOs such as BEPS Monitoring Group and Tax Justice Network and authors such as Picciotto (2012), Jansky & Pratz (2015), Zuchman (2015), Avi-Yonah, Clausing & Durst (2009), and Morse (2010) support the evolution towards a unitary approach for the taxation of MNCs, as opposed to the current separate-entity approach on which the arm’s-length principle is based. According to this approach, the income of a group will be consolidated and split between tax authorities according to a predetermined formula that includes proportional costs, assets, payroll, and sales. Advocates of this formulary apportionment approach contend that this approach is more in keeping with economic activity, reduces compliance cost for taxpayers and cause profit shifting mechanisms to fail because locations of costs, assets, payroll or sales are hard to manipulate for MNEs.
OECD is aware of the foregoing considerations and therefore stated in the Updated Transfer Pricing Guidelines that OECD member countries’ continue to support strongly the arm’s length principle. It was also explained in detail why global formulary apportionment was rejected. Main concerns underlined were the requirement of a substantial coordination and consensus on the implementation decision, methods of measurement of a global MNEs tax base, predetermined formulae to split profits and factors that should be used to apportion this profit. Reaching such agreement seemed time-consuming and extremely difficult. (OECD, 2017b, pp. 34-43)
On the other hand, there are some formal initiatives especially in the European Union for replacing the existing system with formula apportionment method. European Commission has proposed to replace the system of separate accounting by formula apportionment in 2011 (EC, 2011), which was discussed to be too ambitious for the Member States to agree upon. Thus, the Commission re-launched its proposal in 2016 since it seemed that there was still strong demand for the benefits that the proposed Common Consolidated Corporate Tax Base (CCCTB) could offer to the Member States. (EC, 2016b) In line with these developments, despite OECD’s negative considerations, it seems important to pursue the academic and state-level discussions regarding the option of shifting to a formulary apportionment method.
The Case of Turkey: Article 59 of law numbered 6728 “The Law Regarding Amendment on Some Legislations with The Aim of Enhancement of Investment Climate” has introduced some amendments to article 13 of CIT law numbered 5520

Gözde Nalbant Efe (BEPS Actıon Plan and the Current Case of Turkey)
196
where Turkish transfer pricing rules have been more converged to OECD transfer pricing guidelines and recent developments regarding the BEPS package. The relevant changes are 10 percent threshold for related party definition29, recognition of Transactional Net Margin Method30 and Profit Split Method, the time extension of APA31 (Council of Ministers are authorized to extend the Advanced Pricing Agreements to five years) and relief from 50 percent of tax penalty in case proper and timely documentation is in place. (Yatırım Ortamının İyileştirilmesi, 2016, Article 59/a-ç; EY, 2016)
In the past, the definition of “related party” in a comprehensive manner (without a threshold) under the Law and related Communiqués had created disputes between the Tax Authority and taxpayers. With this amendment, the issues encountered in practice are eliminated, and compliance ensured with international transfer pricing practices. Transactional profit methods are included and the hierarchy between transactional and traditional methods is eliminated and became consistent with OECD Transfer Pricing Guidelines. Time extension of APA has allowed the application of the method determined under the agreement to be applied to the taxation periods that have not lapsed in the case of agreement between the taxpayer and Ministry of Finance. Tax penalty amendment shows Turkish Tax Authority place importance on transfer pricing documentation, and taxpayers who fully and timely meet their transfer pricing requirements will receive 50% tax penalty protection. (EY, 2016)
29 In the past, the definition of “related party” in a comprehensive manner (without a threshold) under the Law and related Communiqués had created disputes between the Tax Authority and taxpayers. The scope of a related party has been redefined with this amendment to eliminate the issues encountered in practice and to ensure compliance with international transfer pricing practices. 30 With this amendment, the Transactional Profit Methods have also been included in the Law and the Law sets forth how these methods will be applied. Therefore, the elimination of the hierarchy between transactional profit methods and the traditional methods in the OECD Transfer Pricing Guidelines has been adopted into the Turkish local legislation. 31 This amendment has allowed the application of the method determined under the agreement to be applied to the taxation periods that have not lapsed in the case of agreement between the taxpayer and Ministry of Finance. Therefore, taxpayers have been allowed to retroactively apply the relevant APA (roll-back) and hence eliminate tax risks provided they retroactively pay the tax principal and interest charge.

The Political Economy of Public Finance (Edited by: Mustafa Çelen, Özkan Zülküfoğlu, Elżbieta Robak)
197
Action 11, BEPS Data Analysing: The final report has been issued to improve the measuring process of BEPS-related corporate income tax revenue losses. The report scrutinized six indicators of BEPS that confirm the existence of BEPS. It established methodologies to collect and analyse data on BEPS and the actions to address it. It suggested improving access and enhancing analysis of existing data, and proposed new data to be collected. The report also recommended the OECD to work with governments to report and analyse more corporate tax statistics and to present them in an internationally consistent way. (OECD, 2015f, pp. 16-17)
Cobham and Jansky (2015) assert that clearest failure within the fifteen actions occurred in Action 11. Because measuring of BEPS-relates tax revenue losses requires collation and publication of data on the global distribution of MNEs’ declared profit and on the location of their economic activity. However, OECD did not negotiate making the CbC reports public and now seeking to collate aggregated data from willing member states to analyse the revenue effects of MNEs. (p. 3-4)
The Case of Turkey: OECD requested each member country to provide an analysis of BEPS. As of today, Turkish Tax Authorities did not announce any report or press release regarding the scope of BEPS-related revenue loss. However, this action item can trigger Turkish Tax Authorities to develop methodologies to measure the extent of BEPS with the help of OECD’s studies in this area.
Action 12, Disclosure of Aggressive Tax Planning: The final report has been issued for use of countries wishing to implement/amend mandatory disclosure rules to obtain early information on aggressive tax planning schemes and their users. The report included an overview of mandatory disclosure regimes of countries and lined up recommendations for a modular framework. It also set out specific recommendations for rules targeting international tax schemes, as well as for the development and implementation of more effective information exchange and co-operation between tax administrations. The recommendations are not minimum standards but if countries decide to implement, they provide the necessary flexibility to balance a country’s need for better and timelier information with the taxpayers’ compliance burdens. (OECD, 2015d, p. 9)

Gözde Nalbant Efe (BEPS Actıon Plan and the Current Case of Turkey)
198
The Case of Turkey: The draft TPC Article 5 has introduced new phrases under the title of “Commentary and Demonstration”, which would shift the burden of proof to the taxpayer where a tax loss is incurred in the context of a tax planning arrangement. It is highlighted that the concepts of “tax planning” and “aggressive tax planning” still under discussion. (Deloitte, 2017)
Action 13, Transfer Pricing Documentation (minimum standard): In the Transfer Pricing Guidelines, documentation chapter has been amended, new reporting standards have been introduced, and countries have begun to make changes in their domestic legislation including new documentation obligations. In this context, a three-tiered documentation structure is recommended to countries consisting of (i) a master file containing standardized information relevant for all MNE group members, (ii) a local file referring specifically to material transactions of the local taxpayer, and (iii) a Country-by-Country (CbC) report containing certain information relating to the global allocation of the MNE’s income and taxes paid together with certain indicators of the location of economic activity within the group. (OECD, 2017b, pp. 233-236)
The main idea of CbC reporting is to reveal how much tax MNEs pay in each country they operate and to share this information with each country on an equal basis. The inclusion of CbC reporting in BEPS package was motivated by the work of international tax justice advocacy groups.32 (Christians, 2013; pp. 290-292) Even though they have consistently called for CbC reports to be made publicly available, OECD has limited CbC reporting to governments and attached strict use and confidentiality limitations. Yet the European Union has proposed certain CbC reports to made public (European Parliament, 2017) and public disclosure of CbC reports would seem to play a part in the agenda of OECD plan soon (Christians, 2016, p. 1624)
According to the change made in Transfer Pricing Guidelines, The MNEs having total consolidated group revenue of more than 750 million Euro will prepare CbC report. The MNEs having total consolidated group revenue of more than 50 million Euro are obliged to prepare the master file and the local file. The reports will be delivered to the
32 Richard Murphy first developed the idea who is a former chartered accountant working for Tax Justice Network and other civil society organizations. (Fuest, Spengel, Finke, Heckemeyer & Nusser, 2013, p. 17)
The Political Economy of Public Finance (Edited by: Mustafa Çelen, Özkan Zülküfoğlu, Elżbieta Robak)
199
relevant tax administration at the 12th month following the financial year. (OECD, 2017b) Inclusive Framework is monitoring the domestic legal implementation of documentation requirements closely33.
Countries that changing their domestic legislation according to the Action 13 documentation requirements also specify certain penalties for MNEs which would fail to file CbC report or submit incomplete data.34 It should be noted that these penalty amounts vary substantially between countries and can open a new path for MNEs tax planning strategies.
OECD has also opened Multilateral Competent Authority Agreement on the Exchange of Country-by-Country Reports (CbC MCAA) for signature to further facilitate consistent information exchange. The purpose of the CbC MCAA is explained as “to set forth rules and procedures as may be necessary for Competent Authorities of jurisdictions implementing BEPS Action 13 to automatically exchange CbC Reports prepared by the MNE Group and filed on an annual basis between the tax authorities of the jurisdiction of tax residence of that entity and the tax authorities of all jurisdictions in which the MNE Group operates”. In March 2016, the OECD has released its standardised electronic format for the exchange of CbC Reports between jurisdictions – the CbC XML Schema – as well as the related User Guide. The CbC MCAA was signed by 64 countries as of June 2017. It is likely that the first CbC reports exchange will take place in 2018. Because the MNEs will prepare CbC reports for the first time for 2016 fiscal year and deliver them at the end of 2017. (OECD, 2017g)
The Case of Turkey: The amendments made in the Corporate Tax Law gave the Council of Ministers the authority to determine the documentation obligations and to establish the procedures and principles for the mutual sharing of the documents with other countries within the framework of international agreements. Hereby, the legal
33 Updated information received from IF member state position can be followed from http://www.oecd.org/tax/automatic-exchange/country-specific-information-on-country-by-country-reporting-implementation.htm 34 KPMG publishes country implementation summaries, which includes penalties that are foreseen in domestic legislation. (KPMG, 2017a).

Gözde Nalbant Efe (BEPS Actıon Plan and the Current Case of Turkey)
200
basis for the implementation of country-by-country reporting was also prepared. (Yatırım Ortamının İyileştirilmesi, 2016, Article 59/d)
Alongside this initiative, Turkish Revenue Administration has issued the draft of “General Communique on Disguised Profit Distribution through Transfer Pricing Serial No 3” in March 2016. The draft communique (KPMG, 2016):
• Includes new requirements that would extend the current legal requirements35, (that some of them already were put into force with law 6728, see Action 8-9-10):
• Introduces additional transfer pricing documentation requirements, • Contains instructions for additional documentation requirements for
multinational enterprises—including country-by-country reporting, and Master file and Local file reporting.
The transfer pricing documentation is divided into three components (Revenue Administration of Turkey, 2016b):
Master File: Multinational taxpayers having net sales and assets greater than 250 million TRY would be required to prepare a Master file within 2 months after submitting CIT
35 These requirements are as follows: A 10% threshold with respect to the definition of a “related party”; Recognition of the Transitional Net Margin Method (TNMM) and Profit Split Method; Rules for roll back of advance pricing agreements (APAs); Penalty relief (i.e., relief from 50% of a tax penalty in situations when there is proper and timely documentation in place); “Real persons” qualify as related parties; No priority (preference) for transfer pricing methods, Extension of the APA effective period to five years (instead of three years); Requirements that APA renewal applications must be submitted at least six months (instead of nine months) before the APA expires; APA negotiations described as the evaluation of comparable transactions, function analysis, comparable search process, contract terms, transaction adjustments and other key terms; APA roll-backs described so that the APA would correct previous years’ tax returns (those not barred by statute of limitations); any amount of excess taxes paid in previous years would not be refundable (taxpayers could assert provisions in the tax procedure code in relation to the correction of tax failures). (KPMG, 2017b)
The Political Economy of Public Finance (Edited by: Mustafa Çelen, Özkan Zülküfoğlu, Elżbieta Robak)
201
returns and it should be submitted upon request to Tax Authority or the ones who have entitled to tax audit.
Local File: The requirement is quite similar to the former annual transfer pricing report. All taxpayers having cross-border transactions (for large corporation taxpayers both domestic and cross-border intercompany transactions) would have to prepare local transfer pricing report. In addition, companies operating in free trade zones would be required to prepare a transfer-pricing report for their domestic intercompany transactions.
CbC Reports: Taxpayers that belong to a multinational enterprise group having a consolidated revenue of 2.37 billion TRY (approximately €750 million) would be required to prepare this report. It would report the amount of profit/loss before tax, paid/accrued tax, capital, previous year losses, headcount, tangible products (excluding cash and cash equivalents), all of which are generally in line with the OECD measures.
Documentation requirements that would be amended with this communique are in line with the revisions in the OECD Transfer Pricing Guidelines (Action 13). Turkish Revenue Administration has announced the draft on March 16, 2016, and requested the comments and suggestions, which would contribute to the development of amendment of the draft, to be delivered to them in fifteen days. (Revenue Administration of Turkey, 2016a). However, any report providing feedback (i.e. a summary of commentaries or other progress) has not been published up to now. In addition, a penalty is included related to reporting obligations. In the context of information exchange provisions regarding international agreements, taxpayers that have not complied with reporting obligation will pay an irregularity penalty in the amount of 50000 TRY. (Vergi Usul Kanunu Tasarısı, 2006, Article 278/f)
We can expect that the draft will be reviewed and entered into force via the publication of the Council of Ministers Decree before the end of 2017. Along with this regulation, the reports of MNEs will cover the period after 1 January 2016 and will be prepared at the end of 2017 for the first time. It is also expected that Turkey will sign the CbC MCAA and start the automatic information exchange process as of 2018.

Gözde Nalbant Efe (BEPS Actıon Plan and the Current Case of Turkey)
202
Action 14, Dispute Resolution (minimum standard): With this minimum standard, countries agreed to ensure that treaty obligations related to the mutual agreement procedure are fully implemented in good faith and that MAP cases are resolved in a timely manner, the implementation of administrative processes that promote the prevention and timely resolution of treaty-related disputes, and taxpayers can access the MAP when eligible. (OECD, 2015i, p. 9) The implementation of this minimum standard will be carried out with multilateral convention. (Action 15) In addition, mandatory binding arbitration is included in Multilateral Convention as an optional provision to be elected on an opt-in basis.
The Case of Turkey: Turkish tax treaties do not include an arbitration provision. Thus, Mutual Agreement Procedures (MAP) carried out by Turkey and its treaty partners. (Biçer & Erginay, 2015, p. 61)
The Draft TPC has included a new arrangement under the title of “Mutual Agreement” regarding effective implementation of dispute resolution mechanism. This amendment does not point any binding arbitration but organizes the MAP effectively that identifies how taxpayers would apply, any changes in terms of litigation in the process of the MAP, how the MAP will going to be concluded, and its different effects on taxpayer’s right of litigation. (Vergi Usul Kanunu Tasarısı, 2016, Article 303-307) This amendment can be seen as an effort to improve the MAP mechanism in Turkey.
Action 15, Multilateral Instrument (Action 2, 6, 7, and 14 included): Multilateral Convention to Implement Tax Treaty Related Measures to Prevent Base Erosion and Profit Shifting (MLI) was opened for signature. The aim of the MLI is to ensure that the BEPS measures that require changes to tax treaties are implemented in the bilateral tax treaties swiftly. These measures will prevent treaty abuse (Action 6), improve dispute resolution (Action 14), prevent the artificial avoidance of permanent establishment status (Action 7), and neutralise the effects of hybrid mismatch arrangements (Action 2). (OECD, 2017h, p. 7)
Completion of Action 15 was deemed necessary prior to the work on all other actions since it would be inefficient to reform rules that may be incompatible with the framework of the system in which they would operate. (Brauner, 2014, p. 111) Thus, OECD has concentrated on this action and opened for signature swiftly. By means of MLI, it is expected that the amendments to be made to the current bilateral tax treaties
The Political Economy of Public Finance (Edited by: Mustafa Çelen, Özkan Zülküfoğlu, Elżbieta Robak)
203
between countries can be arranged within the scope of a single multilateral international agreement to facilitate implementation. It is likely that the first modifications to covered treaties will become effective in the course of 2018. The timing of entry into effect of the modifications is linked to the completion of the ratification procedures in the jurisdictions that are parties to the covered tax treaty. (OECD, 2017a, p. 13)
As of July 2017, 70 countries have signed the MLI. 2365 bilateral tax treaties were included with current signatories and 1150 of bilateral tax treaties are still out of scope. As the number of countries that signed MLI increases, loopholes that lead to BEPS due to tax treaties will gradually decrease.
MLI is structured to give flexibility for contracting countries to implement the MLI based on their needs. Countries can specify the tax treaties to which they want MLI would apply, there are opt-in and opt-out choices under some conditions and they can choose some provisions, which are optional related to the action. For the minimum standards provisions (some articles relating to preventing treaty abuse (Action 6) and improvement of dispute resolution (Action 14), countries can opt out only if the covered tax agreement already includes these minimum standards. For provisions that are not minimum standards (i.e., articles relating to hybrid mismatches under Action 2, avoidance of PE status under Action 7 and some on prevention of treaty abuse under Action 6), a country may reserve the right to opt out and to not apply these articles to its tax treaties or to a subset of its tax treaties. The MLI also incorporates a number of optional provisions that will apply only if all contracting countries to a covered tax agreement affirmatively choose to apply a particular alternative or option. (EY, 2017b, p. 16) The OECD will be the Depository for the MLI and record and publish all future changes made to MLI positions. (OECD, 2017h, p. 6)
The Case of Turkey: Turkey signed the MLI on 7 June 2017 at the signing ceremony held in Paris. Turkey notified that all tax treaties would be included in the context of MLI but like many other countries it made numerous reservations and did not opt for mandatory binding arbitration. (OECD, 2017i) For MLI to come into effect internationally, it is first required that at least five countries will approve and include it in their legislation. Then, the process for Turkey will be followed as: Firstly, Turkey and a contracting country will complete executive and legislative amendments in their domestic legislation. Then one of the contracting parties (Turkey or country A) will

Gözde Nalbant Efe (BEPS Actıon Plan and the Current Case of Turkey)
204
report to OECD about the completion of their legislation. This notice is going to involve the information about which treaties will be included, which protocols will be changed and which provisions are intended to implement. After three months following the notification, the MLI will be in effect for both sides. (Kahraman, 2017).
4. Assessments on BEPS Action Plan
BEPS Action Plan is a comprehensive package of measures related to the most problematic issues in the international tax regime. It tries to fill a lot of gap at the same time and it was put forward in a short span of time. In this limited period, some developments that followed the introduction of the plan seemed promising and some of them are criticized. At this part of the paper, we will briefly state some developments about the European Union and developing countries regarding BEPS that would be inspiring for further studies and refer the general assessments on BEPS Action Plan before concluding.
Twenty members of EU-28 are also members of OECD, which comprises of 34 countries. Thus, it can be said that European countries have an important role in developing BEPS Action plan. A joint statement by the UK, Germany, and France has triggered G-20 finance ministers to ask the OECD to report on this issue in the first place. (OECD, 2013d, p. 1) Following BEPS package approval, European Commission (EC) released an anti-avoidance package on 28 January 2016, which designed to provide a uniform implementation of BEPS measures and minimum standards across EU countries.36 In October 2016, the EC furthered the agenda and announced a new package of corporate tax reforms.37 Namely, EU is the frontrunner for implementation 36 This package comprised four separate documents (i) a proposed European Union (EU) Anti-Tax Avoidance Directive, (ii) a proposed Directive implementing the automatic exchange of country-by-country (CbC) reports, (iii) a communication proposing a framework for a new EU external strategy for effective taxation (the external strategy communication), and (iv) a recommendation on the implementation of measures against tax treaty abuse. (EC, 2016a). The Anti-Avoidance Directive set out six measures that all member states should apply, which are: Controlled Foreign Company rule, switchover rule, exit taxation, interest limitation, hybrids and general anti-abuse rule. (Ardaus, 2016, para. 7). 37 This package included three separate legislative initiatives, namely (i) a two-stage proposal toward a Common Consolidated Corporate Tax Base (CCCTB); (ii) a Directive on Double Taxation Dispute Resolution Mechanisms in the EU; and (iii) amendments to the Anti-Tax
The Political Economy of Public Finance (Edited by: Mustafa Çelen, Özkan Zülküfoğlu, Elżbieta Robak)
205
of BEPS Actions -even the ones that are not minimum requirements- by tailoring the measures to its own specific needs.38
BEPS is of significance for developing countries due to their reliance on corporate income tax. Developing countries tax income depending on a narrow tax base and they collect income tax revenues heavily from large corporations in the formal sector. 39 (Nalbant Efe & Yetkin Ataer, 2016, pp. 120-124) Furthermore, they are significantly more exposed to tax avoidance by MNEs. There are a lot of reasons may be causing this situation but an important one is the inadequacy of effective anti-avoidance rules for MNEs. (Johannesen, Tørsløv & Wier, 2016, p. 13) With the establishment of Inclusive Framework, all interested developing countries are referred as being able to join the BEPS project on an equal footing.40 Even though “on an equal footing” phrase is used
Avoidance Directive (ATAD) agreed in June 2016, regarding hybrid mismatches with third countries. (EC, 2016c) 38 All of the 28 EU Member states are required to introduce rules based on Action 2 (hybrid mismatches), Action 3 (CFC rules) and Action 4 (interest deductibility) under the EU Council’s Anti-Tax Avoidance Directive (ATAD). The new corporate tax reform package announced by the EU included again the proposals incorporating the BEPS measures introduced under the ATAD. The Code of Conduct Group on Business Taxation submitted a report to the Economic and Financial Affairs Council that outlined the steps taken by the Member States to comply with their commitment to implement the modified nexus approach. (Action 5) The Council of the EU issued a press release setting out the Council’s conclusions on tax transparency. The press release noted that the Commission intends to explore possibilities for Mandatory Disclosure Rules (MDRs) by way of drawing on the experiences in this area of some EU Member States and to come forward with a legislative proposal in 2017. (Action 12) For the 28 EU member states, the obligation to implement CbC reporting has also been enshrined in a binding Directive (Council Directive 2016/881/EU). (Action 13) They are also subject to a Directive for the exchange of information on rulings. The EU is also preparing to adopt the Directive on Double Taxation Dispute Resolution Mechanism on enhancing the effective resolution of international tax disputes between EU Member States (Action 14) and proposing Member countries to transpose this directive by the end of 2017 at the latest. (EY, 2017a; OECD, 2017b) 39 The ratio of corporate income tax revenues to total tax revenues on income is much higher in developing countries contrary to developed countries. 40Forty new countries joined the Committee on Fiscal Affairs and its subsidiary bodies after the establishment of Inclusive Framework. Besides OECD has organized regional meetings to enhance the dialogue process by feeding the Working Parties and the Committee on Fiscal Affairs
Gözde Nalbant Efe (BEPS Actıon Plan and the Current Case of Turkey)
206
in OECD’s official documents, some researchers and publications of the United Nations (UN) underlined that OECD has focused on the priorities of its own member states. With the aim of filling this gap, The UN has initiated a study on the perspectives of developing countries by reaching experiences of developing countries with a questionnaire41 and has launched a project by focusing on topics, which developing countries have specified as most relevant. UN has brought the results together in a handbook named “Protecting the Tax Base of Developing Countries”.42 UN has recently updated and published the second edition of the handbook in August 2017. The handbook can be seen as a valuable resource in terms of technical analysis of BEPS from a developing country perspective. The aim of the study is identified as (Ault & Arnold, 2017, p. 7):
“… to complement and supplement the work of the OECD project on BEPS and the United Nations Committee of Experts by providing additional insight into the issues identified in the OECD project on BEPS when viewed from the perspective of developing countries. It will also supplement the
with priorities and challenges for developing countries. In addition, the IMF, the OECD, the UN, and the WBG launched the “Platform for Collaboration on Tax” as a joint effort in April 2016. The Platform aims to formalize regular discussions between the four international organizations on the design and implementation of standards for international tax matters, to strengthen their ability to provide capacity-building support to developing countries, and to help them deliver jointly developed guidance. Platform members hold regular meetings with representatives of developing countries. Working jointly with IF, the platform purposes to deliver a number of publications and toolkits designed to help developing countries implement the measures developed under the BEPS project. (OECD, n.d. (a)) 41 This study covered the issues included in the Action Plan that were most relevant for them and some additional concerning areas have been identified that were not covered with BEPS Action plan, which includes the taxation of capital gains of non-residents, taxation of income from services as well as tax incentives. 42 The handbook aimed at enhancing the capacity of developing countries in three important areas (Trepelkov, Tonino & Halka, 2015, pp. vı-ıx): -engagement and effective participation in relevant international decision-making processes; -assessment of relevance and viability of potential options to protect and broaden developing countries’ tax base; and -effective and sustained implementation of the most suitable options from which they would benefit.

The Political Economy of Public Finance (Edited by: Mustafa Çelen, Özkan Zülküfoğlu, Elżbieta Robak)
207
OECD work by considering issues involving tax base protection that are of particular importance to developing countries but are not included within the OECD focus.”
The initiative of UN seems an interesting snapshot of how the politics of international tax is changing. (Cobham, 2017, para. 2) China and G77 group are referred as putting pressure on the UN to create a new truly global intergovernmental tax body to develop proposals that are more tailored to developing countries than those proposed under the OECD's BEPS project. (Picciotto, 2017, para. 6; Charalambous, 2017, para. 1) These developments are cliff-hanging about the future of international tax system and require a further study of BEPS from the perspective of developing countries.
When we review general assessments about OECD’s BEPS Action Plan, Christians (2016) sees the strength of OECD consensus as variable. Except for the minimum standards, which are subject to peer review, she believes that other actions are left to good faith alone. She also emphasizes the legal status of OECD, which is not a law-making body and sees the BEPS process as hard to maintain. Because certain states can try to revisit the BEPS bargain. Therefore, countries implementing the actions of BEPS may continue to suffer from the negative effects of tax planning. On the other hand, measures included in BEPS package will extend to other legal regimes that OECD has not reached a consensus yet, and OECD will need to seek future rounds of consensus building. Thus, she expects a BEPS 2.0 in the near future. (pp. 1607-1608)
The signing of MLI by an important majority of states can be seen as a positive improvement in the treaty-related BEPS issues since it is a record of promises made by states to each other rather than left the good faith. On the other hand, the initial lists submitted by signatories show that many OECD/G20 countries have made numerous reservations. BEPS Monitoring Group (2017) finds it disappointing especially in view of the support for the BEPS project voiced by the G20 leaders. They criticize the OECD/G20 countries because they negotiated these provisions themselves and should adopt them with few reservations to encourage developing countries that wish to do so.
Devereux and Vella (2014) evaluate the BEPS initiative as only seeking to close loopholes rather than re-examining the fundamental problems of the international taxation system. They think that a more fundamental reform is needed to generate a
Gözde Nalbant Efe (BEPS Actıon Plan and the Current Case of Turkey)
208
stable long-term system and sort three different options for it: Formulary apportionment, allocation of the tax base regarding the location of sales to third parties or introducing a simpler tax base. They assert that the main problems of the existing system are the reliance on a source/residence dichotomy and competition between national governments. Therefore a stable system must remove the incentives for governments to undercut each other and it can be done only by allocating taxing rights based on factors that have limited mobility. (pp. 470-473)
Zuchman (2015) insists on taxing corporate incomes on the global scale and identifies BEPS initiative as being condemned to fail. He emphasizes that MNEs are always one move ahead of controllers since they have much more resources and facilities to tackle BEPS measures. He also estimates that adoption of unitary taxation of MNEs would cause an increase in global CIT revenues about 30 percent. He asserts that only losing party with such amendment in international taxation system would be consulting firms, which are specialized in financial optimization. (pp. 136-139)
Brauner (2014) has some warnings that need to be emphasized about BEPS package, which covers measures regarding the complete international taxation system, and if it fails, all countries will likely suffer from consequences. Such failure would cause destabilizing of the international taxation system, weakening the OECD’s position as the sole forum for international tax matters, renewing the distrust among developed and developing countries, strengthening the disbelief in international policy cooperation, and deepening the distrust of public in the fairness and legitimacy of the tax system. (p. 112)
OECD’s efforts to increase collaboration with the establishment of Inclusive Framework, to standardize the transfer pricing documentation and to increase transparency by including CbC reporting within the MLI are really important steps. However, Action items like 3, 4, and 5 propose domestic anti-abuse mechanisms, which are going to be guided by OECD’s best practice recommendations, damages the aim of BEPS project that was articulated as having a holistic approach in the first place. To reach a successful international tax reform, some innovations are suggested that are not part of traditional tax policy measures like formulary apportionment or digital PE status. Until now, we can conclude from its claims that OECD is trying to walk on eggshells but it will become known clearly in the forthcoming developments whether it will preserve its conservative approach as in the past.

The Political Economy of Public Finance (Edited by: Mustafa Çelen, Özkan Zülküfoğlu, Elżbieta Robak)
209
Conclusion
Within the scope of cooperation developed in the field of international taxation under the guidance of OECD and G20, BEPS Action Plan aims to restrict the places where MNEs can shift or hide their taxable income to reduce their tax burdens. Establishment of the Inclusive Framework and involvement of other willing countries in this cooperation was a necessary step to strengthen the possible effects of BEPS package. A successful implementation of Multilateral Agreement (MLI) has a potential to make OECD closer to a supranational body in global tax coordination. OECD tries to reach and reinforce this monopolistic power on international tax system by gathering all interested jurisdiction under the roof of Inclusive Framework.
On the other hand, while OECD tries to expand its network, it also backs itself into a corner because managing global tax policy regarding the requests of countries that have conflicting interests make its job harder and exhaust its remedies. The most sounded criticism for BEPS Action Plan is not being a fundamental reform and being an attempt to close loopholes in the existing system. We believe the main reason for this criticism is that OECD tries to walk on a tightrope when designing proposals for the global tax system. The second criticism is that OECD prioritizes its own member states’ interests and not being inclusive. When we remember that the same members put BEPS Action Plan forward in the first place, this should not be a surprising outcome. At this point, we can expect that United Nations will continue to make sound the requests of developing countries.
The recommendations for each action item are criticized or found suitable by different parties in this preliminary stage but the implementation phase will display the exact consequences on the global tax system. The implementation phase will provide a rich array of data for further analysis in the years to come. For the present, we can conclude that there are important developments on the paper that may improve the transparency and coherence of international tax system. If OECD becomes more open to new ideas and reconsiders interests of developing countries, the consensus that was reached on the paper may have a chance to improve the global tax environment and realize the aim of BEPS package.
Gözde Nalbant Efe (BEPS Actıon Plan and the Current Case of Turkey)
210
As being a member of G20 and OECD, Turkey has been involved in the BEPS project since the beginning. In its domestic legislation, Turkey has taken limited implementation so far. As we have analysed in some actions before, most of the amendments are included in the draft tax code or the draft communique and not enacted yet. However, considering the commitments of Turkey with minimum standards that come with the approval of BEPS package and with treaty-related issues that come with signing the MLI, we expect that they will come into effect soon.
Turkey is a member of OECD but at the same time, it is a developing country. Thereby it should closely follow the developments about the OECD’s BEPS Action Plan and the discussions regarding the developing countries perspective when strengthening its domestic legislation. A failure of Turkish Tax Authorities is that there are no official publications regarding the BEPS Action Plan and Turkish perspective on this issue. We recommend that more importance must be attached to this issue and outcomes must be disclosed to the public through an official channel.
References
464 Sıra Nolu Vergi Usul Kanunu Genel Tebliği (2015, December 24). Resmi Gazete (Sayı: 29572). Retrieved October 9, 2017, from http://www.gib.gov.tr/464-sira-nolu-vergi-usul-kanunu-genel-tebligi
Aile ve Sosyal Politikalar Bakanlığının Teşkilat ve Görevleri Hakkında Kanun Hükmünde Kararname ile Bazı Kanun ve Kanun Hükmünde Kararnamelerde Değişiklik Yapılmasına Dair Kanun (2014, February 6). Resmi Gazete (Sayı: 28918). Retrieved October 12, 2017, from http://www.resmigazete.gov.tr/eskiler/2014/02/20140219.pdf
Ardaus, R. (2016, March 13). EU-BEPS Presidency roadmap and the winner is? Retrieved October 5, 2017, from http://blogs.mazars.com/letstalktax/2016/03/beps-eu-presidency-roadmap/
Ateş, L. (2017). Turkey. International Fiscal Association, Cahiers (765-788). 102A. Ault, H. J. & B. J. Arnold (2017). Protecting the tax base of developing countries: an overview.
Trepelkov, A., Tonino, H. & D. Halka (Eds.) (2017) United Nations handbook on selected issues in protecting the tax base of developing countries, Second Edition (1-59). New York, United Nations.
Ault, H. J., Schon, W. & S. E. Shay (2014). Base erosion and profit shifting: A roadmap for reform. Bulletin for International Taxation, 275, 275-279.

The Political Economy of Public Finance (Edited by: Mustafa Çelen, Özkan Zülküfoğlu, Elżbieta Robak)
211
Avi-Yonah, R. S. (2007, December 3). Double tax treaties: An introduction. Available at SSRN: https://ssrn.com/abstract=1048441. or http://dx.doi.org/10.2139/ssrn.1048441
Avi-Yonah, R. S., Clausing, K. A. & M. C. Durst (2009). Allocating business profits for tax purposes: A proposal to adopt a formulary profit split. Florida Tax Review, 9(5), 497-553.
Baez, A. & Y. Brauner (2015, February 2). Withholding taxes in the service of BEPS Action 1: Address the tax challenges of the digital economy. Available at SSRN: https://ssrn.com/abstract=2586202 or http://dx.doi.org/10.2139/ssrn.2586202
BEPS Monitoring Group (2017, June 22). Presentation to the Inclusive Framework of the G20/OECD BEPS project. Retrieved October 8, 2017, from https://bepsmonitoringgroup.files.wordpress.com/2017/06/if-presentation-1706.pdf
Biçer, R. & M. Erginay (2015). Turkish perspective on OECD Action Plan on base erosion and profit shifting. International Transfer Pricing Journal, January-February, 52-61.
Brauner, Y. (2014). What the BEPS? Florida Tax Review, 16(2), 55-115. Charalambous, L. (2017, January 25). Developing Nations planning BEPS mutiny. Retrieved
from October 12, 2017, from https://www.tax-news.com/news/Developing_Nations_Planning_BEPS_Mutiny____73301.html
Christians, A. (2012). How nations share. Indiana Law Journal, 87(4), 1407-1453. Christians, A. (2013). Tax activists and the global movement for development through
transparency. Y. Brauner & M. Stewart (Eds.). Tax, law and development (288-315). UK: Edward Elgar Publishing.
Christians, A. (2016). BEPS and the new international tax order, BYU Law Review, 2016(6), 1603-1647.
Clausing, K. A. (2011). The revenue effects of multinational firm income shifting. Tax Notes, March 28, 1580-1586.
Cobham, A. & P. Jansky (2015). Measuring misalignment: The location of US multinationals’ economic activity versus the location of their profits. ICTD Working Paper, No: 42. Brighton: International Centre for Tax and Development.
Cobham, A. (2017, September 11). New UN tax handbook: Lower-income countries vs OECD BEPS. Retrieved October 12, 2017, from http://www.taxjustice.net/2017/09/11/new-un-tax-handbook-sets-lower-income-countries-oecd-beps/

Gözde Nalbant Efe (BEPS Actıon Plan and the Current Case of Turkey)
212
Crivelli, E., De Mooji, R. & M. Keen (2015). Base erosion, profit shifting and developing countries. IMF Working Paper, WP/15/118.
Deloitte (2017). BEPS Actions implementation by country, Action 12-Disclosure of Aggressive Tax Planning. Retrieved October 13, 2017, from https://www2.deloitte.com/content/dam/Deloitte/global/Documents/Tax/dttl-tax-beps-action-12-disclosure-of-aggressive-tax-planning-implementation-matrix.pdf
Demir, R. (2013, May 12). Maliye on-line reklam pazarını mercek altına aldı. Anadolu Ajansı. Retrieved October 12, from, http://aa.com.tr/tr/ekonomi/maliye-on-line-reklam-pazarini-mercek-altina-aldi/247214
Devereux, M. P. & P. B. Sørensen (2006). The corporate income tax: international trends and options for fundamental reform. European Commission Economic Papers, No: 264.
Devereux, M. P. & J. Vella (2014). Are we heading towards a Corporate Tax System fit for the 21st Century? Fiscal Studies, 35(4), 449-475.
Dharmapala, D. (2014). What do we know about base erosion and profit shifting? A review of the empirical literature. Fiscal Studies, 35(4), 421-448.
EC (European Commission) (2011). Proposal for a council directive on a common consolidated corporate tax base (CCTB). COM (2011), 121/4, Brussels. Retrieved October 10, 2017, from https://ec.europa.eu/taxation_customs/sites/taxation/files/docs/body/com_2011_121_en.pdf
EC (2015). Tax reforms in EU member states 2015, tax policy challenges for economic growth and fiscal sustainability. Institutional Paper 008, Retrieved October 3, 2017, from https://ec.europa.eu/info/sites/info/files/file_import/ip008_en_2.pdf
EC (2016a, January). Anti-tax avoidance package. Retrieved August 8, 2017, from http://ec.europa.eu/taxation_customs/business/company-tax/anti-tax-avoidance-package_en
EC (2016b). Common consolidated corporate tax base (CCCTB). Retrieved October 11, 2017, from https://ec.europa.eu/taxation_customs/business/company-tax/common-consolidated-corporate-tax-base-ccctb_en
EC (2016c). Corporate tax reform package. Retrieved October 11, 2017, from https://ec.europa.eu/taxation_customs/business/company-tax/corporate-tax-reform-package_en
EP (European Parliament) (2017, June 30). Public country-by-country reporting by multinational enterprises. Retrieved October 5, 2017, from http://www.europarl.europa.eu/thinktank/en/document.html?reference=EPRS_BRI%282017%29595867

The Political Economy of Public Finance (Edited by: Mustafa Çelen, Özkan Zülküfoğlu, Elżbieta Robak)
213
Erdem, T. (2017). Otomatik bilgi değişiminde önemli adımlar: Vergi konularında karşılıklı idari yardımlaşma sözleşmesinin onayı ve MCAA imzası. Retrieved October 12, 2017, from http://www.vmhk.org.tr/otomatik-bilgi-degisiminde-onemli-adimlar-vergi-konularinda-karsilikli-idari-yardimlasma-sozlesmesinin-onayi-ve-mcaa-imzasi1/
EY (2016, August 19). Turkey amends transfer pricing legislation. Retrieved October 12, 2017, fromhttp://www.ey.com/Publication/vwLUAssets/Turkey_amends_transfer_pricing_legislation/$FILE/2016G_02520-161Gbl_TP_Turkey%20amends%20transfer%20pricing%20legislation.pdf
EY (2017a, September 28). Turkey introduces new measures to increase tax revenues. Retrieved October 12, 2017, from http://www.ey.com/gl/en/services/tax/international-tax/alert--turkey-introduces-new-measures-to-increase-tax-revenues
EY (2017b). The latest on BEPS – 2016 year–end review. Retrieved October 9, 2017, from http://www.ey.com/Publication/vwLUAssets/EY-US-the-latest-on-beps-2016-in-review/$FILE/EY-US-the-latest-on-beps-2016-in-review.pdf
Fuest, C., Spengel, C., Finke, K., Heckemeyer, J. H. & H. Nusser (2013). Profit shifting and “aggressive” tax planning by multinational firms: Issues and options for reform. ZEW Discussion Paper, No. 13-078, Mannheim.
Gooptu, S. & C. A. P. Braga (2010). Debt management and the financial crisis. O. Canuto & M. Giugale (Eds.). The day after tomorrow: A handbook on the future of economic policy in the Developing World (207-217). Washington D. C.: The World Bank.
Hongler, P. & P. Pistone (2015, January 20). Blueprints for a new PE nexus to tax business income in the era of the digital economy. Available at SSRN: https://ssrn.com/abstract=2586196 or http://dx.doi.org/10.2139/ssrn.2586196
Jansky, P. & A. Prats (2015). International profit shifting out of developing countries and the role of tax havens. Development Policy Review, 33(3), 271-292.
Johannesen, N., Tørsløv, T. & L. Wier (2016). Are less developed countries more exposed to multinational tax avoidance? Method and evidence from micro-data. WIDER Working Paper 2016/10.
Kahraman, A. (2017, June 13). Dolaysız Vergi Kayıp Kaçağına Karşı BEPS Çok Taraflı Vergi Anlaşması Silahı. Retrieved October 12, 2017, from https://www.kpmgvergi.com/Blog/Pages/FullBlog.aspx?article=778
Kara, M. C. & E. Öz (2016). Dijital vergilendirmeye küresel bir bakış. Vergi Dünyası, 36(424), 30-37.

Gözde Nalbant Efe (BEPS Actıon Plan and the Current Case of Turkey)
214
Karanfil, N. (2017, June 11). Kusura bakma stopajı alırım! Hürriyet. Retrieved October 6, 2017, from http://www.hurriyet.com.tr/kusura-bakma-stopaji-alirim-40486716
Kemmeren, E. C. C. M (2014). Where is the EU law in the OECD BEPS discussion? EC Tax Review, 23(4), 190-193.
KPMG (2016, March 18). Turkey: Draft communiqué on transfer pricing documentation, country-by-country reporting. Retrieved October 2, 2017, from https://home.kpmg.com/xx/en/home/insights/2016/03/tnf-turkey-draft-communique-on-transfer-pricing-documentation-country-by-country-reporting.html
KPMG (2017a). BEPS Action 13: Country implementation summary. Retrieved October 8, 2017, from https://home.kpmg.com/content/dam/kpmg/xx/pdf/2017/01/tnf-beps-action-13-january16-2017.pdf
KPMG (2017b, May 29). Tax Bulletin- 2017/01 Draft Council of Minister decision regarding the disguised profit distribution via transfer pricing published. Retrieved October 2, 2017, from https://home.kpmg.com/content/dam/kpmg/xx/pdf/2017/05/tnf-turkey-may30-2017.pdf
Kurumlar Vergisi Kanunu. (2006, Jun 21). Resmi Gazete (Sayı: 26205). Retrieved August 12, 2017, from http://www.resmigazete.gov.tr/eskiler/2006/06/20060621-1.htm
Lahiri, A. K., Ray, G. & D.P. Sengupta (2017). Equalization levy. Brookings India Working Paper, No: 01, January. Retrieved October 10, 2017, from https://www.brookings.edu/wp-content/uploads/2017/01/workingpapertax_march2017_final.pdf
Lepretre, L. (2014, Dec. 8). “Tax Avoidance, The LuxLeaks scandal explained”. Retrieved October 15, 2017, from http://www.cafebabel.co.uk/politics/article/tax-avoidance-the-luxleaks-scandal-explained.html
Monsenego, J. (2017). Implementation of the modified nexus approach (Action 5 of BEPS) - Impact on IP box structures. Retrieved October 4, 2017, from https://gowlingwlg.com/en/global/insights-resources/implementation-of-the-modified-nexus-approach-(action-5-of-beps)---impact-on-ip-box-structures
Morse, S. C. (2010). Revisiting global formulary apportionment. Virginia Tax Review, Vol. 29, 593-644.
Nalbant Efe, G. & M. Yetkin Ataer (2016). Ülke gruplarının vergi yapıları arasındaki farklılıklar ve nedenleri. M. Aydın & S. S. Tan (Eds.). Political economy of taxation (109-125). London: Ijopec Publication.
OECD (2013a). Addressing base erosion and profit shifting. OECD Publishing. http://dx.doi.org/10.1787/9789264192744-en
The Political Economy of Public Finance (Edited by: Mustafa Çelen, Özkan Zülküfoğlu, Elżbieta Robak)
215
OECD (2013b). Action plan on base erosion and profit shifting. OECD Publishing. http://dx.doi.org/10.1787/9789264202719-en
OECD (2013d, February 4). The OECD work on base erosion and profit shifting. Retrieved October 4, 2017, from https://www.oecd.org/ctp/TheOECDworkonBEPS.pdf
OECD (2014). Model tax convention on income and on capital: Condensed version 2014. OECD Publishing. http://dx.doi.org/10.1787/mtc_cond-2014-en
OECD (2015a). OECD/G20 base erosion and profit shifting project, explanatory statement, 2015 final reports. Retrieved August 1, 2017, from www.oecd.org/tax/beps-explanatory-statement-2015.pdf
OECD (2015b). Countering harmful tax practices more effectively, taking into account transparency and substance, Action 5 - 2015 Final report, OECD/G20 base erosion and profit shifting project. Paris: OECD Publishing. http://dx.doi.org/10.1787/9789264241190-en
OECD (2015c). Designing effective controlled foreign company rules, Action 3-2015 final report, OECD/G20 base erosion and profit shifting project. Paris: OECD Publishing. http://dx.doi.org/10.1787/9789264241152-en
OECD (2015d). Mandatory disclosure rules, Action 12-2015 final report, OECD/G20 base erosion and profit shifting project. Paris: OECD Publishing. http://dx.doi.org/10.1787/9789264241442-en
OECD (2015e). Addressing the tax challenges of the digital economy, Action 1-2015 final report, OECD/G20 base erosion and profit shifting project. Paris: OECD Publishing. http://dx.doi.org/10.1787/9789264241046-en
OECD (2015f). Measuring and monitoring BEPS, Action 11-2015 final report, OECD/G20 base erosion and profit shifting project. Paris: OECD Publishing. http://dx.doi.org/10.1787/9789264241343-en
OECD (2015g). Action 5: Agreement on modified nexus approach for IP regimes. Retrieved October 5, 2017, from https://www.oecd.org/ctp/beps-action-5-agreement-on-modified-nexus-approach-for-ip-regimes.pdf
OECD (2015h). Preventing the granting of treaty benefits in inappropriate circumstances, Action 6-2015 final report, OECD/G20 base erosion and profit shifting project. Paris: OECD Publishing. http://dx.doi.org/10.1787/9789264241695-en
OECD (2015i). Making dispute resolution mechanisms more effective, Action 14- 2015 final report, OECD/G20 base erosion and profit shifting project. Paris: OECD Publishing. http://dx.doi.org/10.1787/9789264241633-en

Gözde Nalbant Efe (BEPS Actıon Plan and the Current Case of Turkey)
216
OECD (2016). BEPS Action 14 on More Effective Dispute Resolution Mechanisms – Peer Review Documents. OECD/G20 Base Erosion and Profit Shifting Project, OECD, Paris. Retrieved October 7, 2017, from www.oecd.org/tax/beps/bepsaction-14-on-more-effective-dispute-resolution-mechanisms-peer-review-documents.pdf
OECD (2017a). Inclusive framework on BEPS, progress report July 2016-June 2017. Retrieved August 5, 2017, from http://www.oecd.org/tax/beps/inclusive-framework-on-BEPS-progress-report-july-2016-june-2017.pdf
OECD (2017b). Transfer pricing guidelines for multinational enterprises and tax administrations 2017. Paris: OECD Publishing. http://dx.doi.org/10.1787/tpg-2017-en
OECD (2017c). Inclusive framework on BEPS, a global answer to a global issue. Retrieved August 5, 2017, from http://www.oecd.org/tax/flyer-implementing-the-beps-package-building-an-inclusive-framework.pdf
OECD (2017d). BEPS Action 5 on harmful tax practices-Terms of reference and methodology for the conduct of the peer reviews of the Action 5 transparency framework, OECD/G20 base erosion and profit-shifting project. Paris: OECD. Retrieved August 6, 2017, from www.oecd.org/tax/beps/beps-action-5-harmful-tax-practices-peer-review-transparencyframework.pdf
OECD (2017e). Limiting base erosion involving interest deductions and other financial payments, Action 4-2016 Update: Inclusive framework on BEPS, OECD/G20 base erosion and profit shifting project. Paris: OECD Publishing. http://dx.doi.org/10.1787/9789264268333-en
OECD (2017f). Draft Contents of the 2017 update to the OECD Model Tax Convention. Retrieved August 10, 2017, from http://www.oecd.org/tax/treaties/draft-contents-2017-update-oecd-model-tax-convention.pdf
OECD (2017g). Signatories of the multilateral competent authority agreement on the exchange of country-by-country reports and signing dates. Retrieved August 10, 2017, from http://www.oecd.org/tax/automatic-exchange/about-automatic-exchange/CbC-MCAA-Signatories.pdf
OECD (2017h). Frequently asked questions on the multilateral instrument (MLI). Retrieved July 25, 2017, from http://www.oecd.org/tax/treaties/MLI-frequently-asked-questions.pdf
OECD (2017i). The Republic of Turkey, status of list of reservations and notifications at the time of signature. Retrieved August 10, 2017, from http://www.oecd.org/tax/treaties/beps-mli-position-turkey.pdf
OECD (2017j). BEPS Action 6 on preventing the granting of treaty benefits in inappropriate circumstances – Peer review documents. OECD/G20 Base Erosion and Profit
The Political Economy of Public Finance (Edited by: Mustafa Çelen, Özkan Zülküfoğlu, Elżbieta Robak)
217
Shifting Project, OECD, Paris. Retrieved October 7, 2017, from www.oecd.org/tax/beps/beps-action-6-preventing-the-granting-of-treaty-benefits-in-inappropriatecircumstance-peer-review-documents.pdf
OECD (2017k). BEPS Action 13 on Country-by-country reporting – Peer review documents. OECD/G20 Base Erosion and Profit Shifting Project, OECD, Paris. Retrieved October 7, 2017, from http://www.oecd.org/tax/beps/beps-action-13-on-country-by-country-reporting-peer-review-documents.pdf
OECD (2017l). Neutralising the effects of branch mismatch arrangements, Action 2, Inclusive Framework on BEPS. OECD/G20 Base Erosion and Profit Shifting Project, OECD, Paris. http://dx.doi.org/10.1787/9789264278790-en
OECD (n.d. (a)). Developing countries and BEPS. Retrieved August 6, 2017, from http://www.oecd.org/tax/developing-countries-and-beps.htm#capacitybuilding
OECD (n.d. (b)). About the inclusive framework on BEPS. Retrieved October 5, 2017, from http://www.oecd.org/tax/beps/beps-about.htm
Picciotto, S. (2012). Towards unitary taxation of transnational corporations. London: Tax Justice Network.
Picciotto, S. (2017, April 11). The UN Tax Committee holds out the begging bowl. Retrieved October 12, 2017, from https://www.globalpolicywatch.org/blog/2017/04/11/the-un-tax-committee-holds-out-the-begging-bowl/
Pickering, A. (2013). Why negotiate tax treaties. New York: United Nations, Paper No. 1-N. Retrieved October 3, 2017, from http://www.un.org/esa/ffd/tax/2013TMTTAN/Paper1N_Pickering.pdf
Revenue Administration of Turkey (2016a, March 16). 3 seri no.lu transfer fiyatlandırması yoluyla örtülü kazanç dağıtımı hakkında genel tebliğ taslağı hazırlandı. Retrieved August 12, 2017, from http://www.gib.gov.tr/3-seri-nolu-transfer-fiyatlandirmasi-yoluyla-ortulu-kazanc-dagitimi-hakkinda-genel-teblig-taslagi
Revenue Administration of Turkey (2016b). Transfer fiyatlandırması yoluyla örtülü kazanç dağıtımı hakkında genel tebliğ (Seri No: 3). Retrieved August 14, 2017, from http://www.gib.gov.tr/sites/default/files/fileadmin/mevzuatek/3serinolu/3seritransfertaslak.pdf
Revenue Administration of Turkey (n.d.). Uluslararası mevzuat. Retrieved August 2, 2017, from http://www.gib.gov.tr/uluslararasi_mevzuat
Riedel, R. (2015). Quantifying international tax avoidance: A review of academic literature. ETPF Policy Paper 2. Retrieved October 5, 2017, from http://www.etpf.org/papers/PP002QuantAvoid.pdf

Gözde Nalbant Efe (BEPS Actıon Plan and the Current Case of Turkey)
218
Saint-Amans, P. & R. Russo (2013). What the BEPS are we talking about? Retrieved October 2, 2017, from http://www.oecd.org/ctp/what-the-beps-are-we-talking-about.htm
Trepelkov, A., Tonino, H. & D. Halka (Eds.) (2015) United Nations handbook on selected issues in protecting the tax base of developing countries. New York, United Nations.
UNCTAD (2015). World investment report 2015 – Reforming international investment governance. New York and Geneva: United Nations. Retrieved October 3, 2017, from http://unctad.org/en/PublicationsLibrary/wir2015_en.pdf
Vergi Konularında Karşılıklı İdari Yardımlaşma Sözleşmesinin Onaylanmasının Uygun Bulunduğuna Dair Kanun (2017, May 3). Resmi Gazete (Sayı: 30071). Retrieved October 13, 2017, from http://www.resmigazete.gov.tr/eskiler/2017/05/20170520-2.htm
Vergi Usul Kanunu Tasarısı (2016). Retrieved August 1, 2017, from archive.ismmmo.org.tr/docs/tasari/TASARI_VUK.docx
Vermeend, W., Ploeg, R. & J. W. Timmer (2009). Taxes and the economy: a survey on the impact of taxes on growth, employment, investment, consumption and the environment. UK: Edward Elgar Publishing.
Yatırım Ortamının İyileştirilmesi Amacıyla Bazı Kanunlarda Değişiklik Yapılmasına Dair Kanun (2016, August 9). Resmi Gazete (Sayı: 29796). Retrieved August 12, 2017, from http://www.resmigazete.gov.tr/eskiler/2016/08/20160809-22.htm
Yatırımların Proje Bazında Desteklenmesi ile Bazı Kanun ve Kanun Hükmünde Kararnamelerde Değişiklik Yapılmasına Dair Kanun (2016, August 20). Resmi Gazete (Sayı: 29824). Retrieved October 9, 2017, from http://www.resmigazete.gov.tr/eskiler/2016/09/20160907-1.htm
Zuchman, G. (2015). Vergi cennetleri, ulusların gizli zenginliği. (Çev. Y. Ö. Charles) İstanbul: Yordam Kitap.
The Political Economy of Public Finance (Edited by: Mustafa Çelen, Özkan Zülküfoğlu, Elżbieta Robak)
219
A Comparative Analysis of Advance Pricing Agreements in Turkey and the United States
Burcu Kuzucu Yapar Fatma Turna Abstract
Transfer pricing has increased in importance for businesses and governments. Enterprises attempt to keep taxes paid at their lowest through transfer pricing, yet misuse of transfer pricing is undesirable for governments because doing so creates tax losses. Governments seek to obstruct enterprises, especially multinational corporations, by engaging in various legal arrangements. Through transfer pricing rules, some criteria have been set to determine whether profits have been transferred from one country to another or from one enterprise to another related entity in the same country. In addition to the methods applied to determine the appropriateness of a transfer price according to the arm’s length principle, methods are provided to taxpayers to determine the transfer price by negotiating an advance pricing agreement with the relevant administration. Enterprises are able to designate the method that they will use for transferring to related companies for a certain period when they identify a transfer price through their agreements with the tax administrations of the countries in which they operate. This paper aims to examine the process of advance pricing agreements in Turkey and the United States and makes recommendations for the effective use of agreements to prevent the abuse of transfer pricing in Turkey. The reason for selecting the United States
8
Canan Sancar (Inflation, Interest Rates, and Output Level in Terms of Globalising Monetary Policies)
220
is that this country is the first to apply an advance pricing agreement and one of the countries that mostly applies this method today.
Key Words: Transfer Pricing, Arm’s Length Principle, Advance Pricing Agreements.
Introduction
axes are the most important sources of income for countries and have the largest share among public revenue. Naturally, give this importance; countries do not want to lose out on tax revenues. Because multinational companies are rapidly
increasing in number and can transfer their taxable revenues from one country to another in a manner that favors themselves and is to the detriment of countries, they may cause tax losses. Multinational corporations can easily transfer their taxable income to countries with a low tax rate through associated organizations by assigning high or low transfer prices or costs. Abusing the transfer price to create a tax loss is an unpopular position for countries. States endeavor to prevent such attempts by institutions, notably multinational companies, by enacting legislative regulations.
Precautions also exist in the international domain to prevent the abuse of transfer pricing. In particular, the Organization for Economic Co-operation and Development (OECD) has conducted several studies since 1979. In its 1995 published book, Transfer Pricing Guidelines for Multinational Enterprises and Tax Administrations, the OECD suggested various methods for determining transfer pricing. Although some of these methods focus on the necessity to correctly determine the price or cost to be used for transfer transactions for the precedents, they do not require compliance for the precedents. The book does not oblige the use of the price-specifying methods or the cost correspondent with the precedents. The method that achieves the most reliable precedent needs to be utilized (Ağar, 2011, pp. 61–62). The arm’s length principle is specified by the ninth article of OECD Model Tax Agreement. Hereunder, if the conditions determined or established in commercial relations between two associated institutions differ from the conditions applied for organizations that are independent of each other, the profits that could not be realized for the benefit of one of the companies because of these circumstances are included in the profits of that company and are tariffed as a taxable gain (Organization for Economic Co-operation and Development [OECD], 2017, p. 35).
The classical transaction techniques suggested by the OCED to define the transfer price are the comparable uncontrolled price method, the cost-plus method, and the resale
T

The Political Economy of Public Finance (Edited by: Mustafa Çelen, Özkan Zülküfoğlu, Elżbieta Robak)
221
method. The transactional margin method is composed of the profit split method and the transactional net margin method (OECD, 2017, p. 97). These methods are used to specify the transfer price correspondent with the arm’s length principle in Turkey. Moreover, one additional method from the guidelines—the global distribution formula—is not to be applied in Turkey. This study determines and as the OECD suggested that advance pricing agreements represent the method used to specify the transfer prices eligible for taxpayer precedents by making a deal with the tax administrations.
1.Advance Pricing Agreements
Advance pricing agreements are designed to help traditional administrative and judicial mechanisms find transfer pricing solutions and are very useful if traditional mechanisms fail or cannot be implemented (OECD, 2010, p. 214). The advance pricing agreement is a contract between tax administrations and taxpayers on the proper transfer pricing method to use to quote international transactions between corporations in the future (Givati, 2009, p. 30). This agreement is binding to both taxpayers and tax administrations.
Advance pricing agreements are analyzed under three titles with regard to the contracting parties. Unilateral advance pricing agreements are between the company and the tax authorities of only one country. In the negotiations, bilateral and multilateral advance pricing agreements include more than one country (Becker, Davies & Jakobs, 2016, p. 256). Because unilateral advance pricing agreements consist of only the firm and one state tax administration, the contract provisions are valid only between the parties. This type of agreement doesn’t prevent double taxation because it is not binding for the tax administrations of other countries. Bilateral advance pricing agreements are usually made between the associated firms of transnational companies in two different countries and the tax administrations of those countries. Multilateral advance agreements are realized between taxpayers with a permanent establishment in more than two countries and the tax administrations of those countries (Ağar, 2011, p. 300). Bilateral and multilateral advance agreements are used to avoid international double taxation and clarify the transfer pricing of the corporation. The suggested issue in the OECD guidelines is to prefer to enter into bilateral or multilateral advance pricing agreements. Moreover, bilateral or multilateral advance pricing agreements are
Canan Sancar (Inflation, Interest Rates, and Output Level in Terms of Globalising Monetary Policies)
222
supposed to strengthen the communication and cooperation between the tax administrations of different countries.
The United States is the first country to publish a set of formal and extensive procedures on advance pricing agreements and to apply the arm’s length principle to inter-company transfer prices (PWC, 2015/16, p. 1084). The first multilateral advance pricing agreement was entered into among the United States, Australia, and Apple Inc. in 1991. As a result of the contract, all parties benefited from the advantages, the elasticity on economic double taxation, and the certainty of the advance pricing agreement program (Petruzzi&Spies, 2014, p. 293). The United States led the way on the issue of advance pricing contracts and served as a model for many countries when they created their advance pricing agreement process.
1.1. Advantages of Advance Pricing Agreements
Advance pricing agreements have several benefits and disadvantages. In general, the advantages are as follows: providing certainty in transfer pricing applications and easing tax planning in this manner; motivating taxpayers and tax administrations to collaborate; possible retroaction in some countries; and extending the duration of the agreement before the validity period ends (Köse&Ferhatoğlu, 2008, pp. 109–112). Because the information and documents that a taxpayer gives to the tax administration become clear through the transfer pricing method applied in these agreements, the taxpayer is less likely to receive a heavy penalty from adopting the incorrect method (Çak, 2008, p. 59).
The most significant advantage of advance pricing agreements regarding taxpayers is an increase in the predictability of tax treatments to be applied to cross-border transactions. In other words, under favor of advance pricing agreements, taxpayers are ensured certainty over the tax treatment of cross-border transactions with relevant institutions during the period assigned. Furthermore, these advance pricing agreements help taxpayers avoid exposure to double taxation and heavy penalties because of incorrect transfer pricing, enabling them to reduce lawsuit expenses in the case of an incompatibility (Markham, 2012, p. 100). An advance pricing agreement simply warrants that the tax administration will not launch an investigation into the use of a decided-on transfer pricing method. These agreements do not guarantee that the firm will not be audited for other aspects of transfer pricing activity (Borkowski, 2008, p. 33).

The Political Economy of Public Finance (Edited by: Mustafa Çelen, Özkan Zülküfoğlu, Elżbieta Robak)
223
Both the taxpayer and the tax office prefer to make deals instead of engaging in expensive and time-consuming audit and lawsuit processes. From the viewpoint of the tax administration, entering into an agreement is low in cost relative to starting an investigation or suing the taxpayer (Petruzzi&Spies, 2014, p. 294).
If a taxpayer wants to use an unstated method to make acceptable a stated plan, he or she should consider entering into an advance pricing agreement. The advance pricing agreement process enables the taxpayer to claim that an unstated method is acceptable without facing the risk of punishment. Indeed, one of the major advantages of advance pricing agreements is providing flexibility in stated or unstated method selection (Cole&Byrnes, 2015: pp. 2–31,2–32).
Advance pricing contracts that are collaboration and negotiation mechanisms between taxpayers and the tax administration strengthen their relationships and give them an opportunity to directly solve problems among themselves (KPMG, 2013a, p. 4).
1.2. Disadvantages of Advance Pricing Agreements
The disadvantages are as follows: over-costing of the contract process, time-consuming bilateral or multilateral agreements, and the possibility of the taxpayer being investigated for violations examined but that remain hidden as a result of the documents presented. In other words, a unilateral agreement is binding on only one taxpayer and one country’s tax office, and the taxpayer may be exposed to double taxation by other tax administrations by rejecting compliance on price or cost with the precedents and by surtaxing (Köse&Ferhatoğlu, 2008, pp. 110–112).
Moreover, tax offices need to provide secrecy for critical information and documents. Absolutely applying the rules in the legislation and protecting the validity of this information are important to not disclosing tacit knowledge (OECD, 2017, p. 107).
Another disadvantage appears if the advance price agreement is inelastic. An advance pricing agreement that lacks the required elasticity and that cannot accord with changing market conditions is also not in line with the arm’s length principle at the desired level (OECD, 2017, p. 106).

Canan Sancar (Inflation, Interest Rates, and Output Level in Terms of Globalising Monetary Policies)
224
The time and expenses spent in the first stages of the process are the biggest disadvantages of an advance pricing agreement for the tax office and the taxpayer. The documentation requirements are quite difficult for advance pricing agreements regarding both time and cost; however, undoubtedly, this process is at no cost relative to an investigation or a lawsuit (Markham, 2012, p. 64). For a taxpayer to give sensitive tax planning information to a tax authority is accepted as a disadvantage because, if advance pricing negotiations fail, this information may be used against the taxpayer (Ado, 2015, p. 35).
2.Advance Pricing Agreements in the United States
In the United States, advance pricing agreements are executed by the Internal Revenue Service (IRS) within a program that was called the Advance Pricing Agreement (APA) Program and is currently called the Advance Pricing and Mutual Agreement (APMA) Program. As of today, the APMA Program consists of 62 team leaders and ten groups, and the ten groups have21 economists and ten senior executives(IRS, 2017, p. 2).The advance pricing agreement was first applied in 1991 by the United States. Subsequently, the same application was applied by Canada, France, Germany, Japan, and Australia (Aksümer, 2015, p: 164).
The IRS defines advance pricing agreements as follows: “The Advance Pricing Agreement Program is designed to settle the actual or potential transfer pricing conflicts by a principled and cooperative approach as an alternative to the traditional dispute process.” An advance pricing agreement is viewed as a contract between the IRS and the taxpayer. The taxpayer accepts carrying out transactions consistently using the transfer method agreed on during the time of the contract, and the IRS accepts that it will not make transfer pricing adjustments with respect to the taxpayer (IRS, 2001, p. 1)

The Political Economy of Public Finance (Edited by: Mustafa Çelen, Özkan Zülküfoğlu, Elżbieta Robak)
225
2.1. Agreement Process
The advance pricing process in the United States can be analyzed in five stages. These stages are application, assessment process, analysis, discuss-deal, and draft preparing-reviewing and applying. A sixth stage may be added—filing an annual report by the taxpayer (Markham, 2012, p. 64).
The application stage is the first phase, during which the taxpayer may meet with the IRS in advance in some instances. Before the implementation stage, the advance pricing team conducts an informal interview with taxpayers who are interested in the advance pricing agreement process and determines whether submitting an application conforms with themselves. This informal discussion is called a “pre-filing conference.” Because the taxpayer’s transactions may be under investigation, the investigation staff are not invited to these meetings (Johnson, 2005, pp. 112–113).
Regardless of whether or not the taxpayer engages in the pre-interview, he or she must pay the application fee and fill out a written application before the issue date of the income tax return of the first taxable year to which he wants to attach the scope of the advance pricing agreement (Markham, 2012, p. 68). In the United States, an advance pricing agreement costs between USD 10,000 and 50,000, up to the size of the firm, and the features of the agreement (PWC, 2015/16, p. 1084). The written application must include the name of the taxpayer, the years to which he wants to attach the scope of the contract, and the transactions for which the transfer price will be determined. Moreover, the following documents need to be presented (Johnson, 2005, pp. 113–114):
1. The organization’s structure, taxpayers’ capital structure, and an explanation of their commercial activities;
2. Estimation of the transactions offered for the agreement and estimation of the dollar value of each transaction for each year within the advance pricing agreement;
3. A detailed functional analysis;
Canan Sancar (Inflation, Interest Rates, and Output Level in Terms of Globalising Monetary Policies)
226
4. The symbolic financial data related to the projected end procedures of the parties for the last three years within the scope of the agreement;
5. An example to show why the transfer method suggested is the best for each transaction and one more example to demonstrate the application of this transfer technique for the last three years within the scope of the agreement; and,
6. The content of the taxpayer’s annual report for each year of the period of the advance pricing contract.
When a proper advance pricing agreement application is submitted, the IRS organizes a negotiation team consisting of one team leader, an economist from the IRS, and an international investigation expert. A U.S. national authority attends the negotiation team in the event that the deal is bilateral or multilateral (Johnson, 2005, p. 114). This stage is called the assessment phase.
Economists conduct the analysis stage using the staff for the advance pricing agreement. In a manner similar to the assessment phase, the taxpayer needs to provide additional information to reply to the concerns of the agreement team and the economists. In the analysis stage, the taxpayer and the advance pricing agreement staff discuss the transactions of the contract, the transfer pricing method, the period agreed on, critical assumptions, and other significant issues (Bakker&Obuoforibo, 2009, p. 228). In compliance with the procedure, the taxpayer offers a transfer pricing method and presents data to show that the method offered is the best one to actualize the arm’s length principle between the taxpayer and the associated corporations. The IRS evaluates the agreement request by analyzing the data presented and other information about the contract. After the evaluation, a written agreement is signed by the taxpayer and the IRS if the taxpayer’s offer is accepted (PWC, 2015/16, p. 1084).
The fourth stage, the discuss and deal phase, differs depending on whether the contract is unilateral or bilateral. If the agreement is one-sided, this stage may be more complex. In the discussion and deal stage of a unilateral advance pricing agreement, the taxpayer and the tax office continue to discuss the contract until all critical issues are decided. If the contract is bilateral, the discussion has two parts. First, the taxpayer and the advance pricing agreement team work to reach a consensus on the negotiation position that the U.S. national authority needs to take for meetings with other countries. Second, the
The Political Economy of Public Finance (Edited by: Mustafa Çelen, Özkan Zülküfoğlu, Elżbieta Robak)
227
U.S. governmental power takes the negotiation position offered and presents it to competent authorities. Subsequently, the agreement is usually negotiated between these groups and in face-to-face interviews (Bakker&Obuoforibo, 2009, p. 228).
The last stage starts when the taxpayer and the foreign tax authorities come to terms with the transfer pricing method. The final state of the agreement is reviewed and confirmed by the chief and the director of the advance pricing contract department (Ceteris, 2010, p. 73). The process of unilateral advance pricing agreements is generally concluded within 12 months following a perfect and complete application. In bilateral and multilateral contracts, the purpose is to distribute the negotiation text to the U.S. national authority within the 12 months after the application (Johnson, 2005, p. 115). Thus, the larger the number of tax authorities that are party to the agreement, the longer it takes to make the deal. The lengthy period of making a deal is one of the major disadvantages of advance pricing agreements for the taxpayers.
Before the advance pricing agreement is applied, the taxpayer is allowed to cancel his agreement request. However, the IRS generally does not refund the application fee after the assessment process. Such a cancellation demand, which can be made during each stage of the advance pricing agreement, is expressed in a written application to the director of the contract. From the viewpoint of the IRS, the institution is not obliged to accept each agreement application and has the right to subsequently deny an application. The taxpayer can meet with the advance pricing agreement director about the reason for a denial (Ceteris, 2010, p. 73).
Taxpayers may want to apply the same transfer pricing method to transactions in previous years that are not covered by the agreement. The contract confirmed is binding for the taxpayer, the IRS, and the foreign country tax office, if available. The agreement is limited to the years and transactions mentioned in the application and the taxpayer who is party to the contract (Ceteris, 2010, p. 73). Therefore, other taxpayers who apply the transfer pricing method in the agreement cannot eliminate criminal liability by pointing to a precedent.
Canan Sancar (Inflation, Interest Rates, and Output Level in Terms of Globalising Monetary Policies)
228
2.2. Application, Abrogation, and Renewal of the Agreement
The taxpayer must write a faultless annual report on a timely basis for each year of the contract. The taxpayer’s compliance with the conditions of the agreement must be documented in the report. The taxpayer may demand to arrange, renew, or abrogate the agreement. The taxpayer who keeps the documents shows the compatibility of the transactions with the agreement and must provide these documents to the IRS within 30 days, if the IRS makes such a demand. The IRS can abrogate the agreement if the taxpayers are found guilty of forgery of material facts or misconduct. The agreement can be revoked if the taxpayer does not prepare an annual report or disobeys any rules. Moreover, if an assumption mentioned in the agreement negotiation is not realized, the IRS will abrogate the agreement until it is realized by the taxpayer (Ceteris, 2010, p. 74).
Advance pricing contracts are in place for at least five years as long as the taxpayer does not want to shorten the period. A review of IRS statistics from 2016 shows that some agreements are14 years long. Taxpayers can demand that an agreement be renewed at least nine months before its expiration date (Ceteris, 2010, p. 74). Renewing an application necessitates fee.
Despite the long and expensive deal process in the United States, taxpayers mostly prefer to enter into advance pricing agreements. According to IRS data from2016, 1,844 advance pricing agreements were made between 2000 and 2016 in the United States. Of these, 556 are unilateral, 1,278 are bilateral, and 10 are multilateral. The vast majority of the contracts from 2016 were signed with India and Japan (IRS, 2017, p. 3).
3.Advance Pricing Agreements in Turkey
The advance pricing agreement first signed in 2011 with Turkey reflects a method accepted that is in compliance with the 5th sub article of the 13th provision of Corporate Tax Law numbered 5520. An advance pricing agreement is a contract between the taxpayer and the Revenue Administration to determine the transfer pricing method to use for the transaction price or cost. The validity period of the contract is limited to three years.

The Political Economy of Public Finance (Edited by: Mustafa Çelen, Özkan Zülküfoğlu, Elżbieta Robak)
229
Individual taxpayers cannot submit an application for an agreement. Corporate taxpayers have the right to submit an application for transactions with other associated corporate taxpayers in free zones. According to the General Communique About Hidden Income via 2 Serial Numbered Transfer Pricing, corporate taxpayers have the right to apply this method for transactions realized with corporate taxpayers who are non-operating companies in these zones.
3.1.Agreement Process
The advance pricing agreement process is defined by the Cabinet Decision on Hidden Income Distribution via Transfer Pricing. The competent authority is the Exchequer Revenue Administration, and the agreement process consists of five stages: appeal, pre-assessment, analysis, acceptance or rejection of the contract, and agreement signing (GIB, 2010, p. 10).
The process starts with a written application by the taxpayer. In Turkey, the application fee is expensive in contrast to countries such as Belgium, Ireland, Spain, France, Italy, Lithuania, Netherlands, and United Kingdom, which do not demand any fee (European Commission, 2016, pp. 1–3). Taxpayers must pay the application fee as per “the fees for the method specifying XII-Transfer pricing” section of the Act of Fees. Within this context, the 2017 application fee is 56,979.40 TL and the renewal fee is 45,583.30 TL. An application without a fee is not considered. Taxpayers who seek to submit a deal application first pay the application fee and include the bank receipt with the letter of implementation.
According to the General Communique About Hidden Income via 1 Serial Numbered Transfer Pricing, the taxpayer must also present the following information and documents:
• All information on assumed functions, risks, and assets used; • Information on critical assumptions and reasons (explanations for the
conditions and assumptions constitute the basis for selecting and implementing this method, the analyses, and others);
Canan Sancar (Inflation, Interest Rates, and Output Level in Terms of Globalising Monetary Policies)
230
• Information on the ownership of intangible assets and the royalties received or paid;
• Information on the different accounting standards and methods, if available;
• Product price lists for the financial year including the date of the application;
• Productions costs of the financial year including the date of the application;
• The intercorporate pricing policy for transactions between associated parties;
• The invoice, receipt, and other documents for transactions made with related and unrelated people within the financial year including the day of the application;
• The financial statements, income, or corporation tax declaration samples and copies of contracts on overseas transactions of associated parties;
• Economic data and their documents for the last three years of support for the transfer pricing method offered;
• The arm’s length price range and the process determining this range in the case of two or more comparable transactions; and,
• Other required documents that support the arm’s length price.
The second stage starts after these documents are approved and the Revenue Administration makes pre-estimates on the compatibility of entering into an advance pricing agreement. This pre-assessment does not mean that the contract will be completed. Using the information and documents on the taxpayer’s application, the administration makes a pre-estimate to determine the required information and whether the advance pricing agreement is compatible (KPMG, 2013, p.5).Within this pre-assessment process, the administration may demand subsequent information and documents from the taxpayer, and may even meet with him or her.
After preparing all possible information and documents, the analysis stage starts and the Revenue Administration evaluates the applicable methods, agreement conditions, comparable transactions, functions performed, risks undertaken, and assets used. At the end of the analysis, the administration may directly accept or agree on a condition of the request or deny the request. If the application is accepted, the advance pricing agreement is signed between the taxpayer and the tax office (Denge, 2015, p. 3).
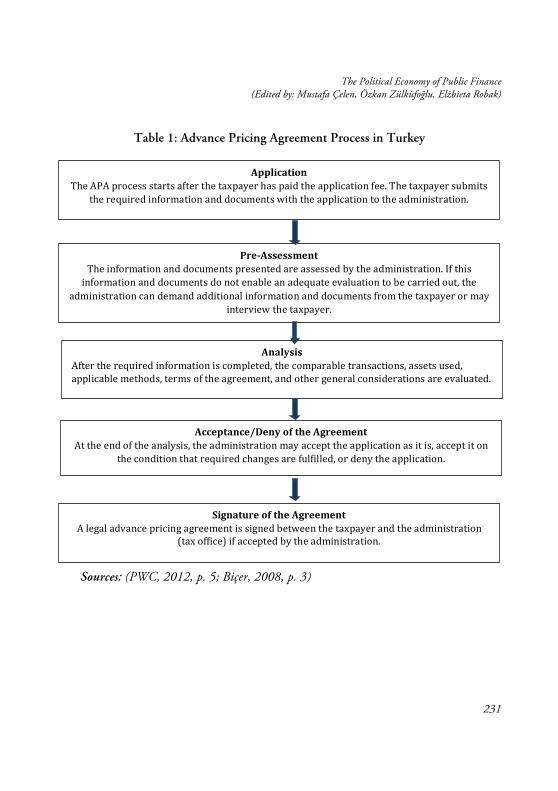
The Political Economy of Public Finance (Edited by: Mustafa Çelen, Özkan Zülküfoğlu, Elżbieta Robak)
231
Table 1: Advance Pricing Agreement Process in Turkey
Sources: (PWC, 2012, p. 5; Biçer, 2008, p. 3)
ApplicationTheAPAprocessstartsafterthetaxpayerhaspaidtheapplicationfee.Thetaxpayersubmits
therequiredinformationanddocumentswiththeapplicationtotheadministration.
Pre-AssessmentTheinformationanddocumentspresentedareassessedbytheadministration.Ifthisinformationanddocumentsdonotenableanadequateevaluationtobecarriedout,the
administrationcandemandadditionalinformationanddocumentsfromthetaxpayerormayinterviewthetaxpayer.
AnalysisAftertherequiredinformationiscompleted,thecomparabletransactions,assetsused,applicablemethods,termsoftheagreement,andothergeneralconsiderationsareevaluated.
Acceptance/DenyoftheAgreementAttheendoftheanalysis,theadministrationmayaccepttheapplicationasitis,acceptiton
theconditionthatrequiredchangesarefulfilled,ordenytheapplication.
SignatureoftheAgreementAlegaladvancepricingagreementissignedbetweenthetaxpayerandtheadministration
(taxoffice)ifacceptedbytheadministration.

Canan Sancar (Inflation, Interest Rates, and Output Level in Terms of Globalising Monetary Policies)
232
3.2.Application, Abrogation, and Renewal of the Agreement
The taxpayer renews the contract by submitting an application at least nine months before the expiration date. Sustaining the agreement for one more period may be acceptable if the administration confirms that the conditions and assumptions in the available contract continue and the method determined is fit for the arm’s length principle (GIB, 2007, p. 25).
The duration of the agreement is valid as of the date of signing and for a maximum of three years. The taxpayer is allowed to appeal to the administration to arrange the contract if a critical assumption in the agreement is not realized, if a change occurs because of changing legislative regulations, or if other countries’ tax offices make changes or abrogate bilateral or multilateral agreements. The taxpayer must present the required documents to the Revenue Administration about the arranging request. The new conditions will be valid until the expiration date of the contract if the administration accepts this demand. However, the agreement continues in much the same fashion if the government does not approve the request. In this circumstance, the taxpayer may demand abrogation of the contract. If the change request comes from the Revenue Administration, the contract will be arranged or may be canceled if the taxpayer does not confirm the arrangement (GIB, 2007, p. 25).
The administration can cancel the contract or start a tax investigation if the annual reports or documents are imperfect, mistyped, or misleading (GIB, 2007, p. 25). The agreements are binding only for the parties to the contract. The contract cannot be used or be shown as a precedent to an advance pricing agreement by other taxpayers.
Actualizing the contract is not guaranteed to lie beyond the scope of the investigation. Whether the method is applied correctly or the rules are obeyed is the subject of a survey. The administration will ensure that the taxpayer follows the rules through the annual reports falling within the period during which the corporate tax return is submitted.
Four advance pricing agreements were signed between the Revenue Administration and taxpayers in 2011, 2012, and 2013. All of the agreements were unilateral (Denge, 2015,

The Political Economy of Public Finance (Edited by: Mustafa Çelen, Özkan Zülküfoğlu, Elżbieta Robak)
233
p. 4). The Revenue Administration announced that the first bilateral advance pricing agreement was entered into at the end of 2016 through the participation of the Belgium tax office.
4.Comparative Analysis of Advance Pricing Agreements in Turkey and the United States
Beyond a doubt, several regulations need to apply to provide for use of the agreements. Recommending that Turkey look to the United States is possible. We are of the opinion that adding a pre-interview stage will be beneficial to meeting the concerns of taxpayers who want to learn about advance pricing agreements. Providing such an unofficial interview will be in good taste and will encourage taxpayers to make deals.
The extremely high application fees are a deterrent for taxpayers seeking to submit an application. Taxpayers face the disadvantage that their demands may be rejected regarding paying the high fee or the renewal fee. We believe that these high charges for both the application and the renewal process are reasons why advance pricing agreements are not preferred in Turkey. A regulation on refunding the fee to taxpayers whose applications are denied may allay their concerns.
Taxpayers in Turkey receive written or verbal justifications of any denial. Giving taxpayers an opportunity to meet over the denial with an officer of the Revenue Administration will be useful. Furthermore, that these agreements are for a maximum of three years is a disadvantage to taxpayers who pay for the costly and time-consuming approval process. The cost of renewing the agreement is almost the same as paying for a new contract. Taxpayers need to be allowed to enter into advance pricing contracts for more than three years, as is done in other countries.
The advance pricing agreement processes in Turkey and the United States have similarities as well as differences. Both countries have right and wrong procedures. For this reason, both countries can take lessons from the agreement process. The following table comparatively analyzes the process of making agreements in Turkey and the United States.

Canan Sancar (Inflation, Interest Rates, and Output Level in Terms of Globalising Monetary Policies)
234
Table 2: APA Process in Turkey and the Unites States
UNITED STATES TURKEY
Application &
Application
The pre-filing conference may be actualized for determining whether the agreement is applicable for
the taxpayer.
There is no pre-interview process before the application stage.
The written application is actualized by paying the application fee.
The fee is refunded in the case of non-acceptance of the agreement request.
The fee is not refunded in the case of non-acceptance of the agreement request.
Fact Finding Process &
Pre-assessment
Conducted to specify the required information and whether the advance pricing agreement is compatible through information and documents on the taxpayer’s application.
Analysis Stage &
Analysis Stage
The taxpayer recommends a transfer pricing method.
The taxpayer needs to provide additional information to the agreement team and economists.
Data are provided to show that it is the best method. The IRS evaluates the claim by
analyzing the data and other information related to the agreement.
The evaluation of comparable transactions, the functions performed,
the risks involved, the assets used and the applicable methods, the terms of the
agreement, and other key issues by the Revenue Administration (RA).
If the proposal is accepted, a written agreement is signed between the taxpayer and the IRS/RA.
Discussion and Agreement Stage
& Acceptance/Denial of
Agreement
As a result of the analyses, the IRS/RA may accept the taxpayer’s application as it is, accept it on the condition of fulfilling the required changes, or deny the application.
Draft Preparation-Review and
Implementation &
Signing the Agreement
A deal on the transfer pricing method is made by the taxpayer and, if any, foreign tax authorities.
The taxpayer may withdraw the written agreement request at any stage of the APA.
However, the application fee is not refunded by the IRS after the fact-finding process. The application fee paid is not refunded.
The IRS/RA does not have to accept every agreement request. They may later deny an application accepted.

The Political Economy of Public Finance (Edited by: Mustafa Çelen, Özkan Zülküfoğlu, Elżbieta Robak)
235
If an agreement request is rejected, the taxpayer can interview the APA director about the reason
for the decision.
If the APA application is rejected, the reason is not informed to the taxpayer as
written or verbal.
Implementation, Cancellation, and
Renewal of Agreement &
Implementation, Cancellation, and
Renewal of Agreement
Each year, the taxpayer prepares an annual report under compliance with the rules and conditions.
The taxpayer may request the correction, renewal, or cancellation of the agreement in his or her report.
The agreement process is terminated by the IRS/RA if information and documents presented by the taxpayer are found to be misleading.
Agreements are made for at least five years. Applications for five years are made for
agreements that last longer than five years. Additional years are determined between the
parties.
The agreement’s validity period cannot exceed three years.
Taxpayers must request a renewal of the agreement at least nine months before the end date of the current APA. Refurbishment applications are extra.
Conclusion
Transnational corporations’ attempts to transfer their taxable income to countries with low tax rates by determining whether low or high transaction prices may cause tax losses, which is to the detriment of the countries. Both national and international precautions are taken to avoid such unwelcomed activities. The subjects of this research are the OECD studies on transfer pricing and advance pricing agreements using methods offered by the OECD through the “Transfer Pricing Manual for Multinational Corporations and Tax Offices.” Advance pricing agreements determine the transfer pricing method when dealing with the relevant administration. Firms can specify the method used by dealing with the tax office of the relevant country.
Advance pricing agreements that first started in the United States and spread through other countries’ legislations using the OECD guide are alternatives to the traditional methods of determining the transfer price. One of the highest priorities of the tax offices is ensuring that the transfer price is in accord with the precedents to avoid being exposed to tax losses. Taxpayers who want to determine an arm’s length price or cost can choose one of the methods from the OECD manual or the legislation of the country in which
Canan Sancar (Inflation, Interest Rates, and Output Level in Terms of Globalising Monetary Policies)
236
they operate. Taxpayers who believe that these methods are improper for their activities or prefer methods that they determine to be more effective to actualize an arm’s length principle can decide on the method by dealing with the related tax office. A preferable method throughout the world has been applied eight times in our country since 2011. Using advance pricing agreement techniques in Turkey is beneficial to avoiding transfer pricing abuses.
The legislation on advance pricing agreements in Turkey is disorderly relative to that in the United States. This problem is expected to be eliminated by enforcing the Advance Pricing Agreement Guide published in 2015 as a draft by the Revenue Administration. Introducing this draft or a different regulation will be useful for rendering clearer and more understandable the available irregular and complex legislation.
References
Ado, M. (2015), “Transfer Pricing Disputes in Kenya: Advance Pricing Agreements the Way Forward?” Master Thesis in Lund University.
Ağar, S. (2011), Transfer Fiyatlandırması Örtülü Kazanç Dağıtımı, Yaklaşım Yayıncılık. Aksümer, E. (2015). “Peşin Fiyatlandırma Anlaşmaları İle İlgili Vergi Sistemimizde Yer Alan
Düzenlemeler”. Mali Çözüm Volume 131, pp. 163-173. Bakker, A. & Obuoforibo, B. (2009). Transfer Pricing and Customs Valuation: Two Worlds to
Tax as One, IBFD. Becker, J. &Davies, R. &Jakobs, G. (2016). “The Economics of Advance Pricing Agreements”.
Journal of Economic Behavior&Organization Volume 134, pp. 255–268. Biçer, R. (2008). “Transfer Fiyatlandırması Uygulamasında Peşin Fiyatlandırma Anlaşmaları”.
Vergi Sorunları Volume 243, pp.1-6. Borkowski, B. (2008). “The History of PATA and Its Effect On Advance Pricing Arrangements
and Mutual Agreement Procedures”, Journal of International Accounting, Auditing and Taxation, 17, pp. 31–50.
Ceteris 2010. Guide To International Transfer Pricing: Law, Tax Planning and Compliance Strategies. Kluwer Law International.
Cole, R. T. &Byrnes, W. (2015). “Framework for U.S. Transfer Pricing Analysis Under Treasury Regulation Section 1.482 and the OECD Guidelines Compared” Texas A&M University Scholl of Law Legal Studies Research Paper Series Research Paper No. 16–57.
Çak, M. (2008), Uluslararası Vergi Rekabeti Transfer Fiyatlaması ve Vergilendirme, Maliye Bakanlığı Strateji Geliştirme Başkanlığı Yayınları.

The Political Economy of Public Finance (Edited by: Mustafa Çelen, Özkan Zülküfoğlu, Elżbieta Robak)
237
Denge (2015), Peşin Fiyatlandırma Anlaşması Sirküleri. Available: http://www.dengeakademi.com/Files/Circular/1596.pdf [Accessed 1 May 2017]
European Commission (2016). Statistics on APAs in the EU at the End of 2015. Available: https://ec.europa.eu/taxation_customs/sites/taxation/files/jtpf0152016enapa.pdf [Accessed 21 May 2017]
GIVATI, Y. (2009), “Resolving Legal Uncertainty: The Unfulfilled Promise Of Advance Tax Rulings”. Virginia Tax Review 29, pp. 137-175.
GIB, 2007. Transfer Fiyatlandırması Yoluyla Örtülü Kazanç Dağıtımı Hakkında Genel Tebliğ (Seri No: 1), Available: http://www.gib.gov.tr/sites/default/files/fileadmin/user_upload/Tebligler/5520/Trans_Fiyat_Teb1/1_serno_tfyokd_genteb.pdf [Accessed 10 May 2017]
IRS (2001). Announcement and Report Concerning Advance Pricing Agreements. Available: https://www.irs.gov/pub/irs-apa/apa_report_final_draft.pdf [Accessed 21 May 2017]
IRS (2017). Announcement and Report Concerning Advance Pricing Agreements. Available: https://www.irs.gov/pub/irs-utl/2016_apma_statutory_report.pdf [Accessed 7 April 2017]
Johnson, A. (2005). U.S. Transfer Pricing Sourcebook. World Trade Executive Köse, T. & Ferhatoğlu, E. (2008), Transfer Fiyatlandırması (Üretim İşletmelerinde Uygulama),
Maliye ve Hukuk Yayınları. KPMG (2013a). Advance Pricing Agreement in Turkey. Available:
http://www.kpmgvergi.com/PDF/Yayinlar/Guncel-Yayinlar/KPMG%20Turkey%20APA%20Guide%2023july.pdf [Accessed 21 April 2017]
KPMG (2013b). Peşin Fiyatlandırma Anlaşması Rehberi: En Çok Sorulan 15 Soru Available: https://assets.kpmg.com/content/dam/kpmg/pdf/2013/05/PFA-Rehberi-9-5-2013.pdf [Accessed 19 October 2017]
MARKHAM, M. (2012), Advance Pricing Agreements Past, Present and Future. Kluwer Law International.
OECD (2017). OECD Transfer Pricing Guidelines for Multinational Enterprises and Tax Administrations.
Petruzzi, R. &Spies, K. (2014). Tax Policy Challenges in the 21st Century. 752 SeitenLindeVerlag.

Canan Sancar (Inflation, Interest Rates, and Output Level in Terms of Globalising Monetary Policies)
238
PWC (2015/16). International Transfer Pricing. Available: http://www.pwc.com/gx/en/international-transfer-pricing/assets/itp-2015-2016-final.pdf [Accessed 21 May 2017]
PWC (2012). 10 Soruda Peşin Fiyatlandırma Anlaşmaları. Available: https://www.pwc.com.tr/tr/microsite/transfer-pricing/assets/pdf/10-soruda-pesin-fiyatlandirma-anlasmalari-2.pdf [Accessed 21 October 2017]


