The Political Economy of Malaysian Federalism Economic...
50
Copyright UNU/WIDER 2002 1 University of Malaya, 50603 Kuala Lumpur, Malaysia, Fax 603 79567252, e-mail [email protected]; 2 Universiti Teknology Mara, Kuching, Sarawak, Malaysia, e-mail [email protected]. This study has been prepared within the UNU/WIDER project on Why Some Countries Avoid Conflict While Others Fail which is co-directed by Tony Addison and S. Mansoob Murshed. Discussion Paper No. 2002/113 The Political Economy of Malaysian Federalism Economic Development, Public Policy and Conflict Containment Jomo K. S. 1 and Wee Chong Hui 2 November 2002 Abstract Conflicts within the Malaysian federation have been rooted in socio-economic disparities and the struggle for control of natural resource rents, which State Governments previously had exclusive control over, as originally provided for by the federal constitution. The advance of fiscal centralization since then has also aggravated federal-state tensions, which have been relatively ignored due to the long-standing Malaysian pre-occupation with inter-ethnic tensions. Inter-regional resource transfers and central fiscal and political dominance have been used to undermine the more independent State Governments, especially those held by opposition parties. While the federal government is clearly dominant, central control over the State Governments has varied, especially in Sabah and Sarawak, with the continued hegemony of the national ruling coalition depending on successfully combining the carrot with the stick. Keywords: conflict, fiscal policy, regional policy, Malaysia JEL classification: O1, R58, O53, O23
Transcript of The Political Economy of Malaysian Federalism Economic...
Copyright � UNU/WIDER 20021 University of Malaya, 50603 Kuala Lumpur, Malaysia, Fax 603 79567252, e-mail [email protected];2 Universiti Teknology Mara, Kuching, Sarawak, Malaysia, e-mail [email protected] study has been prepared within the UNU/WIDER project on Why Some Countries Avoid ConflictWhile Others Fail which is co-directed by Tony Addison and S. Mansoob Murshed.
Discussion Paper No. 2002/113
The Political Economy of MalaysianFederalismEconomic Development, Public Policyand Conflict Containment
Jomo K. S.1 and Wee Chong Hui2
November 2002
Abstract
Conflicts within the Malaysian federation have been rooted in socio-economicdisparities and the struggle for control of natural resource rents, which StateGovernments previously had exclusive control over, as originally provided for by thefederal constitution. The advance of fiscal centralization since then has also aggravatedfederal-state tensions, which have been relatively ignored due to the long-standingMalaysian pre-occupation with inter-ethnic tensions. Inter-regional resource transfersand central fiscal and political dominance have been used to undermine the moreindependent State Governments, especially those held by opposition parties. While thefederal government is clearly dominant, central control over the State Governments hasvaried, especially in Sabah and Sarawak, with the continued hegemony of the nationalruling coalition depending on successfully combining the carrot with the stick.
Keywords: conflict, fiscal policy, regional policy, Malaysia
JEL classification: O1, R58, O53, O23

UNU World Institute for Development Economics Research (UNU/WIDER)was established by the United Nations University as its first research andtraining centre and started work in Helsinki, Finland in 1985. The purpose ofthe Institute is to undertake applied research and policy analysis on structuralchanges affecting the developing and transitional economies, to provide aforum for the advocacy of policies leading to robust, equitable andenvironmentally sustainable growth, and to promote capacity strengtheningand training in the field of economic and social policy making. Its work iscarried out by staff researchers and visiting scholars in Helsinki and throughnetworks of collaborating scholars and institutions around the world.
UNU World Institute for Development Economics Research (UNU/WIDER)Katajanokanlaituri 6 B, 00160 Helsinki, Finland
Camera-ready typescript prepared by Janis Vehmaan-Kreula at UNU/WIDERPrinted at UNU/WIDER, Helsinki
The views expressed in this publication are those of the author(s). Publication does not implyendorsement by the Institute or the United Nations University, nor by the programme/project sponsors, ofany of the views expressed.
ISSN 1609-5774ISBN 92-9190-352-3 (printed publication)ISBN 92-9190-353-1 (internet publication)
Acknowledgements
We are grateful to S. Mansoob Murshed and an anonymous WIDER reader for theirhelpful comments and to Foo Ah Hiang for his assistance with preparing this paper.

1
1 Introduction
This paper reviews the relationship between economic development, public policy andconflict containment in Malaysia, focussing especially on regional tensions within theMalaysian federation. The main focus of conflict containment efforts in Malaysia hasbeen on inter-ethnic tensions, especially between the politically and demographicallydominant Muslim ethnic Malays, who also comprise the vast majority of Bumiputeraindigenes in Peninsular Malaysia, and the more business successful and ubiquitousethnic Chinese, especially since the post-election riots of May 1969.
This paper suggests that while understandable, this singular public policy priority hasneglected other potential sources of conflict, most importantly regional frustrations andtensions, which have long been important, though not unchanging. It goes on to identifypoverty and fiscal discrimination as the likely sources of regional resentment, andsuggests a likely vicious cycle of federal fiscal bias against opposition-controlled stategovernments reinforcing regional resentment expressed in support for ‘regional’opposition. However, the federal government has sought to address this by seeking tocontrol and claim control for federal government spending in such states in contrast tothe opposition-held state government’s meagre budgetary resources.
2 Malaysia’s political economy
For over a century, Malaysian economic growth spurts have mainly been export-associated, if not led. The openness of the Malaysian economy – high even bydeveloping country standards – is due to the structural transformation it has undergone,especially during and since the British colonial period. Like so many other ex-colonies,contemporary Malaysian history has also been complicated by the politicaldevelopments of the colonial era. Of course, the reshaping of the Malaysian economydid not stop with independence, but continues to the present, accelerating in the post-colonial era, especially since the 1970s.
Malaysia’s export-led growth record in the last century has been quite impressive.During colonial times, Malaya was, by far, Britain’s most profitable colony, creditedwith providing much of the export earnings that financed British post-war imperialreconstruction. However, only a few industries were allowed to develop by the colonialauthorities, who generally considered the colonies as suppliers of raw materials andimporters of manufactured goods. Most industries then were set up to reduce transportcosts of exported or imported goods, such as factories for smelting (refining) tin-ore andbottling imported drinks. Local industries often developed most when economicrelations with the colonial power were weak, e.g. during the Great Depression and theJapanese Occupation.
The Malayan economy grew impressively, especially during the first quarter of thetwentieth century, to become the single most profitable British colony. Malaysia’seconomic infrastructure (e.g. railways, roads, ports, utilities, etc.) – so crucial forprofitable capitalist investment – was generally more developed than in most otherBritish possessions other than the settler colonies. Such infrastructure construction –

2
mainly using imported British materials – was paid for by taxes levied on the populationby the colonial government.
Colonial monopolies thwarted the development of a strong local capitalist classproducing for the domestic market; instead, local investors found it more profitable toengage in production for export, commerce and usury, i.e. largely complementing,rather than opposing colonial economic interests. Malays remained largely marginal tothe growing capitalist sector, with the elite integrated into the colonial state apparatus,and the masses remaining in the countryside as peasants. Instead, emerging businessopportunities were mainly taken by some of the more urbanized and commerciallybetter-connected Chinese.
After their ignominious defeat by the Japanese at the beginning of the Pacific War in theearly 1940s, the British returned to reclaim its possessions in 1945 in the face of strong,but ethnically segmented anti-colonial movements. The military repression of thecommunist-led armed insurgency from June 1948 was not especially successful in theearly years until it sought to ‘win hearts and minds’ from 1951. The new strategyinvolved a range of political reforms to establish partially elected legislatures andmunicipal authorities for the first time, labour reforms to build and legitimize a‘moderate’ and ‘responsible’ anti-communist trade union movement, agrarian reformsto reduce rural exploitation and poverty as well as to consolidate an ethnic Malayyeoman peasantry, and the beginnings of pro-Malay ethnic affirmative actionprogrammes.
These reforms – mainly in response to a major threat to the security of the late-colonialstate and associated colonial business interests – have had a profound and ongoingimpact on the development-conflict containment nexus. The colonial authoritiesreluctantly responded to the challenge with rural development initiatives it had neverpreviously considered, let alone implemented, as well as co-opting and legitimizingreforms allowing greater popular participation in politics and trade unions on the onehand besides ‘protecting’ the Malay community on the other.
In the post-Second World War period, Malaysia has experienced relatively rapidgrowth, particularly during the Korean War boom, the oil boom of the 1970s and withthe relocation of East Asian industry into Southeast Asia for a decade from the late1980s. Since 1955, the same ruling coalition has been continuously in power at thedecisive federal level, though the nature and degree of state intervention and publicsector expansion has changed considerably, almost coming full circle by the mid-1990scompared to the situation following independence for Malaya (now PeninsularMalaysia) in 1957, and fiscal expansion in the 1970s and early 1980s.
After independence in 1957, and especially during the 1960s, the Malaysian economydiversified from the twin pillars of the colonial economy, i.e. rubber and tin. TheMalaysian economy continued to experience rapid economic growth in the first quartercentury after independence. The average annual growth rate of the Gross DomesticProduct (GDP) in Peninsular Malaysia was 5.8 per cent during 1957-70 (Rao, 1976),while the GDP for the whole of Malaysia rose by an average of 7.8 per cent per yearbetween 1971 and 1980 despite greater economic instability (Malaysia, 1981).
Primary commodity production continued to dominate the economy in the early yearsafter independence. In fact, Malaysia extended its colonial pre-eminence in rubber, tin

3
and pepper to palm oil, pepper, tropical hardwoods and cocoa. In the mid-1970s,petroleum production – off the East Coast of Peninsular Malaysia – beganprovidentially, as oil prices soared after 1973. Since the early 1980s, petroleum gasproduction – almost exclusively for the Japanese economy – has come on stream,offering yet another primary commodity engine for the growth of the Malaysianeconomy. Cocoa production, mainly in Sabah, also became increasingly significantfrom the early 1980s.
Meanwhile, biased and conservative, but nonetheless pro-active post-colonial ruraldevelopment efforts – arguably, mainly to secure rural electoral support – contrastedwith British colonial neglect, especially in the pre-war period. Initially, such effortswere aimed at securing crucial electoral support from the Malay yeoman peasantrywithout drastic redistribution measures. Since the early 1980s, however, underMahathir, official policy has sought to develop commercial agriculture – involvinglarger farms, using more profitable, productivity-raising and cost-saving modernmanagement methods – for export markets. Agricultural diversification continues, butthere is no obvious candidate for leading, let alone sustaining future growth.
After independence, the government encouraged industries to manufacture previouslyimported goods. Most of these import-substituting industries were set up as subsidiariesof foreign companies to finished goods produced with imported materials for veryprofitable sale within the protected domestic market. Many of these industries onlyreplaced imports of finished goods with semi-finished goods (e.g. the motor carassembly industry). Since most of these industries are generally capital-intensive, notrequiring many workers), unemployment as well as wage rates in these industries roseduring this phase. The technology used, usually developed for and more suited toforeign conditions, was typically imported from the parent company abroad. Hence,these industries often generated relatively little employment, whether directly orindirectly, in linked industries.
Policies to attract such industries have often involved reduction of government taxrevenue. The size of the local market was also limited by the level and distribution ofincome. By the mid-1960s, the problems of import-substituting industrialization hadbecome quite apparent. In 1965, the Federal Industrial Development Authority (FIDA,now known as MIDA, the Malaysian Industrial Development Authority) was set up toattract industrial investment. By this time too, to reduce production costs, some trans-national corporations were planning to relocate their more labour-intensive productionprocesses abroad, often to East Asia.
3 Regional tensions and federalism
Although the Malaysian economy has changed significantly since independence, manyfeatures reflecting uneven development can be traced to the crucial formative decadesunder colonial rule that shaped its economic structure. For instance, differences betweenthe East Coast and the West Coast of Peninsular Malaysia can be traced to unevenregional growth dating back to the location of the early tin mines, staggered colonialannexation and infrastructure development, as well as subsequent economic growthreflecting prior unevenness.

4
Differences between the rice growing North and the rest of the peninsula are related todemographic history as well as the British policy of preserving Malay peasants as ricefarmers, despite the rational peasant preference for rubber cultivation, which threatenedBritish plantation interests. The urban-rural gap is, of course, reflective of the changingroles of town and country in Malaysian capital accumulation. The relative backwardnessof the peasantry compared to plantations is only the most obvious of various differencesin the rural economy. Ethnic differences have often coincided with class, occupationaland other differences originating in the colonial economy.
Malaysia is now a federation made up of the eleven States of Peninsular Malaysia, theformer Federation of Malaya (including the Federal Territory of Kuala Lumpur, thecapital), plus the former British Borneo possessions of Sabah and Sarawak (Table 1).The peninsular States gained independence from the British in 1957 and formed theFederation of Malaya prior to the formation of the Malaysian Federation in 1963.Singapore, Sabah and Sarawak gained independence from Britain through the formationof Malaysia.
Table 1Malaysia: area and population by State, 1999
State Area (sq. km.) Population (thousands)
Johore 18,986 (5.6%) 2,670.7 (11.8%)
Kedah 9,426 (2.9%) 1,579.8 (7.0%)
Kelantan 14,920 (4.5%) 1,522.2 (6.7%)
Melaka 1,651(0.5%) 593.2 (2.6%)
Negri Sembilan 6,643 (2.0%) 836.5 (3.7%)
Pahang 35,964 (10.9%) 1,291.5 (5.7%)
Perak 21,005 (6.4%) 2,118.1 (9.3%)
Perlis 795 (0.2%) 226.2 (1.0%)
Pulau Pinang 1,030 (0.3%) 1,246.8 (5.5%)
Sabah 73,619 (22.3%) 2,970.4 (12.7%)
Sarawak 124,449 (37.7%) 2,027.1 (8.9%)
Selangor 7,955 (2.4%) 3,188.7 (14.0%)
Terengganu 12,955 (3.9%) 1,033.5 (4.6%)
Malaysia 329,758 (100.0%) 22,710 (100.0%)
Source: Department of Statistics, Handbook of Statistics, Malaysia, 1999.
The British wanted to disengage from governing Sabah, Sarawak and Singapore, whilesafeguarding their interests in the region. Both British and local leaders perceivedPeninsular Malaysia as Malay-dominated, and capable of containing leftist Chineseascendancy in Singapore by incorporating the latter. The larger and more diverseindigenous populations of Sabah and Sarawak (Table 2) were also perceived asoffsetting Chinese domination of the federation. Sabah and Sarawak were lessdeveloped than the other States and hoped for net transfers of development funds byjoining the Federation.

5
Table 2Sabah and Sarawak: population, 1999 (thousands)
Sabah Sarawak
Bumiputera*: Bumiputera*:
Malay 192.7 (6.5%) Malay 435.0 (21.5%)
Dusun/Kadazan 529.4 (17.8%) Iban 576.0 (28.4%)
Bajau 332.0 (11.2%) Bidayuh 164.5 (8.1%)
Murut 863.0 (2.9%) Melanau 112.8 (5.6%)
Other Bumiputera 393.4 (13.2%) Other Bumiputera 117.4 (5.8%)
Non-Bumiputera 1436.6 (48.4%) Non-Bumiputera 621.4 (30%)
Total 2970.4 (100.0%) Total 2027.1 (100.0%)
Non-Malay Bumiputera 1341.1 (45.1%) Non-Malay Bumiputera 970.7 (47.9%)
(% Malaysia's population) (5.9%) (% Malaysia's population) (4.3%)
* Indigenous ethnic groups
Source: Department of Statistics, State/District Data Bank, 1999.
In 1961, the first Malayan Prime Minister, Tunku Abdul Rahman endorsed the Britishplan to form Malaysia to include the eleven states of Malaya, Singapore, North Borneo(now Sabah), Sarawak and Brunei, i.e. all the former British territories in the region.The oil-rich sultanate of Brunei withdrew before the new federation was established inSeptember 1963. Before the Japanese Occupation (during the Second World War),North Borneo was run as a virtual fiefdom by a British chartered company, whileSarawak was ruled by a series of white rajahs from the Brooke family. After theJapanese Occupation, they were both administered by the British Colonial Office, butstill quite separately from Malaya and Singapore.
Nevertheless, the formation of Malaysia was pushed through by the British, despite theserious difficulties involved, not least of which was the contrived nature of the newnation, convenient only to the former colonial power. Within less than two years,Singapore left the Federation in August 1965, after acrimonious conflicts with leaders inthe peninsula. Singapore has since industrialized rapidly, while also developing as amajor regional and global centre for financial services besides consolidating its positionas a major international logistics centre.
Hence, since August 1965, Malaysia has included the eleven states of what was thencalled West Malaysia and the two Borneo states of East Malaysia. In the early 1970s,after the secession of Bangladesh from Pakistan, the official terminology changed toPeninsular Malaysia for the old Malaya, and Sabah and Sarawak, probably to limit anynascent sense of East Malaysian solidarity. After all, only about a third of thosesurveyed in Sabah (the former British North Borneo) and Sarawak had wanted to joinMalaysia. Most Malaysians, especially in the peninsula, have long forgotten that bothBorneo states joined with the former Federation of Malaya to form Malaysia, and thattheir leaders and people expected to enjoy privileged treatment within the newfederation.

6
One of the major economically significant consequences of incorporation into Malaysiafor the Borneo States was becoming part of the expanded federation’s principal customsarea, e.g. in terms of being subject to the same import and export duties. This haspresumably limited the potential for import-substituting industrialization in the EastMalaysian States, with protection extended instead to such industries established in thepeninsula, with its larger market. Hence, the Borneo States have been obliged to payhigher prices for protected goods from the peninsula without being able to developimport-substituting manufacturing industries of their own, as infrastructure, cost andmarket size considerations favour such industrial location on the peninsula.
Natural resource exports from Sabah and Sarawak have ensured healthy trade surplusesfor the federation as a whole (Wee, 1995). Malaysia’s merchandise trade account wouldhave had more modest surpluses, if not more frequent deficits, if not for the primarycommodity exports from Sabah and Sarawak. On the other hand, most new import-substituting as well as export-oriented industries have been located in the peninsula.
Although the armed struggle led by the North Kalimantan People’s Army (Paraku)petered out in the 1960s and 1970s, desires for greater autonomy, including flirtationswith secession, continued into the 1980s. However, the federal government in KualaLumpur has successfully forged dominant Muslim-Chinese partnerships in both states,which have alienated many of the politically and economically un-influential, thoughdemographically numerous, non-Muslim Bumiputeras. Most academic and politicalanalyses of Malaysian unity have ignored the changing tensions involving Sabah andSarawak, and the complexities of Malaysian federalism.
Instead, most analyses focus on the other important source of conflict in post-colonialPeninsular Malaysia. The ethnic conflict between the stereotyped politically dominantMalays and the economically successful Chinese dramatically came to a head with raceriots in May 1969 (Butcher, 2001). This conflict is often articulated in terms of therivalry between indigenous Bumiputera, literally sons of the soil – i.e. Malays, theaboriginal Orang Asli and the Muslim as well as non-Muslim indigenous communitiesof Sabah and Sarawak on Borneo island – and non-autochthonous non-Bumiputera, i.e.mainly ethnic Chinese and Indians.
4 Ethnicity and the New Economic Policy (NEP)
Helped by favourable commodity prices and some early success in import-substitutingindustrialization, the Malayan and then the Malaysian economy sustained a high growthrate with low inflation until the early 1970s. Official statistics – though strictly non-comparable for methodological reasons – suggests a worsening distribution of incomeover the 1990s, a growing gap between town and country, and growing inequalityamong all the major ethnic groups. Inequality in the Malay community increased most –from a situation of least intra-ethnic inequality in 1957 to greatest inequality in 1970.
This growing inequality did not only result in growing inter-class tensions, but wasprimarily perceived in ethnic terms, not least because of officially-sanctioned politicalmobilization along racial lines. Hence, Malay resentment to domination by capital wasexpressed primarily against ethnic Chinese, who comprise the bulk of the businesscommunity, while non-Malay frustrations were directed against the Malay-dominated
7
post-colonial state machinery, increasingly identified with United Malays NationalOrganization (UMNO), the dominant partner in the ruling coalition.
Such popular ethnic perceptions resulted in widespread racially inspired opposition inPeninsular Malaysia to the ruling Alliance government of the 1960s. The decade hadseen an import-substituting industrialization programme that generated relatively littleemployment and had largely petered out by the mid-1960s. Rural development efforts,initially inspired by counter-insurgency considerations in the early 1950s, increasinglyemphasized productivity increasing measures, while avoiding redistribution in favour ofthe poorly capitalized land-hungry peasantry.
The general election results and ‘race riots’ of May 1969 reflected such ethnicconsequences and dimensions of the new post-colonial socio-economic structure.Meanwhile, the emerging Malay middle class, who had nominal political control,perceived the gradual decline of British economic hegemony giving way to Chineseascendance. This ‘political-bureaucratic’ fraction became more assertive from the mid-1960s, establishing increased dominance after May 1969.
Foreign experts and international consultants encouraged the Malaysian government toswitch to export-oriented industrialization, which it did from the late 1960s. Theopenness of the Malaysian economy has been deepened by new largely export-orientedindustries established since then. The Industrial Incentives Act was passed in 1968,while labour laws were amended in 1969 to help create an investment climate moreattractive to such industries. Together with other new incentives, free trade zones andother facilities were also provided for this purpose. These new export-orientedindustries seeking cheap labour succeeded in reducing unemployment at the expense ofwages until declining unemployment pushed wages up once again in the late 1970s andearly 1980s, and again for a decade from the late 1980s.
Much of such manufacturing in Malaysia is still limited to relatively low-skill, labour-intensive aspects of production, e.g. electronic component assembly, though moreskilled and complex production processes and training have developed, but somewhatbehind Singapore, which has emerged as a sort of regional centre in the newinternational division of labour. The potential for and likelihood of such progress hasbeen and will be determined by the interests and preferences of trans-nationalcorporations, as well as their perceptions of likely prospects in alternative hostcountries.
Hence, export-oriented industrialization has significant, but nonetheless limitedpotential for sustained and integrated industrial development, especially because of thetechnological dependence involved. Yet, despite this impressive performance, largelyattributable to favourable resource endowments and external conditions, it has becomeincreasingly clear, especially since the mid-1990s, that many of the sources of export-led growth in the Malaysian economy are not indefinitely sustainable. On the otherhand, the very success of export-led growth in the past has probably discouraged seriousefforts to develop a more balanced and integrated national economy.
Much public policy since then, notably the New Economic Policy (NEP), firstannounced in 1970, has been dominated by inter-ethnic distributional considerations,and most public policy is widely seen through the lenses of ostensible ethnic interests.Malaysia has implemented the NEP since 1971. The NEP has the two-pronged

8
objectives of poverty reduction irrespective of race (ethnicity) and ‘restructuringsociety’ to eliminate the identification of race with economic function and location, i.e.reduce inter-ethnic socio-economic disparities between Bumiputera indigenes and thenon-Bumiputeras.
The Bumiputera are to be protected with constitutionally provided ‘special privileges’,i.e. a form of positive discrimination or affirmative action. The ‘Bumiputera’ categoryincludes the indigenous peoples of Sabah, Sarawak and the Orang Asli in PeninsularMalaysia, for whom the race riots of 1969 were largely irrelevant. The NEP is perceivedto have done relatively little for non-Muslim indigenous minorities, mainly in theBorneo States of Sabah and Sarawak.
Since Mahathir took over leadership of the government in 1981, he has introduced otherpublic policy priorities, gradually diluting the previously almost single-minded NEPredistribution agenda. After some apparent (political and economic) success with partialeconomic liberalization after the 1985-86 economic recession, the shift wasconsolidated by declaring a broad new national project under the rubric of a new visionfor the nation to be achieved by the year 2020. Vision 2020 has since been affirmed bythe announcement of successor policies to the NEP in the form of the NationalDevelopment Policy associated with the Second Outline Perspective Plan, 1991-2000(OPP2) and the National Vision Policy associated with the Third Outline PerspectivePlan, 2001-2010 (OPP3).
It is generally agreed that the NEP’s redistribution measures were conceived in responseto the events of May 1969, i.e. the pre-election ethnic tensions, the ruling coalition’selectoral setback and the post-elections’ palace coup against the incumbent primeminister. While redistributive in intent, NEP social policy enhanced Malaysian humanresources in ways that reduced poverty, especially among the children of the Malaypeasantry (Jomo and Gomez, 1997). In particular, greater education enabled them togain more remunerative modern sector employment. However, there is considerableevidence (Jomo, 1989; Jomo, 1990) that much of the expenditure ostensibly allocatedfor poverty reduction never really benefited the poor.
Instead, the NEP increasingly emphasized reducing inter-ethnic economic disparities,especially between ethnic Malays and ethnic Chinese, rather than poverty reduction(Gomez and Jomo, 1999). While the NEP probably reduced some ethnic Malayresentments of Chinese economic success by accelerating the advance of Malay middleclass and business interests, it may well also have generated even greater Malayexpectations of their rights, entitlements and privileges under the Malaysian sun, thusinadvertently fuelling inter-ethnic resentment at the same time.
Meanwhile, the same NEP probably fuelled non-Malay resentment of abuses associatedwith UMNO’s political hegemony and its main policy consequence, the NEP itself.While the NEP objectives of reducing poverty and inter-ethnic economic disparitieswere presented as means for achieving ‘national unity’, primarily understood in terms ofostensibly reducing Malay resentment against the Chinese, there is little real evidencethat this has been achieved with implementation of the NEP. The virtual absence of asubsequent recurrence of inter-ethnic violence on a comparable massive scale is notnecessarily evidence of greater ‘national unity’, even as narrowly conceived in terms ofreduced inter-ethnic resentment.

9
Table 3Malaysia: summary of Federal and State Government functions
Federal State
1. External affairs 1. Muslim laws and custom
2. Defence 2. Land
3. Internal security 3. Agriculture and forestry
4. Local government4. Civil and criminal law and the administration of justice
5. Federal citizenship & alien naturalization
6. Federal Government machinery
7. Finance
8. Trade, commerce and industry
5. Local public services: boarding
houses, burial grounds, pounds and
cattle trespass, markets and fairs,
licensing of theatres and cinemas
9. Shipping, navigation and fishery 6. State works and water
10. Communication and transport 7. State government machinery
11. Federal works and power 8. State holidays
12. Surveys, inquiries and research 9. Inquiries for State purpose
13. Education
14. Medicine and health
15. Labour and social security
16. Welfare of aborigines
10. Inquiries for State purpose
Creation of offence and indemnities
related to State matters
17. Professional licensing 11. Turtles and riverine fishery
18. Federal holidays; standard of time
19. Unincorporated societies Supplementary list for Sabah
20. Agricultural pest control and Sarawak
21. Publications 12. Native law and custom
22. Censorship
23. Theatres and cinemas
13. Incorporation of State authorities and
other bodies
24. Co-operative societies
25. Prevention of and extinguishing fires
14. Ports and harbours other than those
declared federal
15. Cadastral land surveys
16. In Sabah, the Sabah Railway
Shared Functions
1. Social welfare
2. Scholarships
Additional shared functions for Sabah
and Sarawak
17. Personal law3. Protection of wild animals and birds; national parks
4. Animal husbandry
18. Adulteration of foodstuff and other
goods
5. Town and country planning 19. Shipping under fifteen tons
6. Vagrancy and itinerant hawkers 20. Water power
7. Public health
8. Drainage and irrigation
21. Agriculture and forestry research
22. Charities and charitable trusts9. Rehabilitation of mining land and land which has
suffered soil erosion
10. Fire safety measures
23. Theatres, cinemas and places of
amusement
11. Culture and sports, housing
Source: Malaysia, Constitution of Malaysia – Ninth Schedule (Article 74, 77) on ‘LegislativeLists’.

10
To describe the NEP as Malaysia’s second ‘social contract’ implies some parity amongwilling parties. Many non-Malays still complain that the NEP was imposed by adominant UMNO on the ethnic minorities against their will. With a dominant, thoughunofficial ideology that has portrayed non-Malays as ‘immigrant sojourners’, exit –through emigration or by bypassing the government – has been the main alternative toresignation (‘loyalty’). Voice has largely been left to a few braver souls between four tofive yearly elections, when dissent can be secretly expressed at the ballot box, with littlereal consequence in a heavily gerrymandered and controlled electoral system.
5 Malaysian federalism
The Malaysian Constitution defines federal-state relations, the division of authoritygenerally (Table 3) as well as over revenue sources (Table 4). Thus, the spirit andconstitution of the Malaysian Federation imply complementary and shared functions forthe Federal and State Governments. However, the expansion of the federation – and itssubsequent contraction with the secession of Singapore in August 1965 – was contestedfrom the outset1 (Poulgrain, 1998), with lingering consequences for the present.
6 Socio-economic conditions by state
In general, one would expect state GDP per capita to reflect relative development andwelfare by state (Table 5). At least since 1963, Kedah, Kelantan and Perlis have hadlower per capita GDP compared to the national average, while Selangor’s has beenhigher. The less developed states of Sabah and Pahang saw their ratios worsening, whilethe more developed states of Johor, Melaka, Negri Sembilan and Pulau Pinangexperienced improving ratios. The high and rising ratios for the less developed states ofSarawak and Terengganu have been due to petroleum and related (gas) production inthese states, with limited trickle-down effects perpetuating high rates of poverty in bothstates (Table 6). Meanwhile, the relative decline of Perak has been largely due to thecollapse of tin mining in the 1980s (Jomo, 1990) as well as its limited industrialization.
With petroleum output capped since the mid-1980s, and related production (petroleumproducts, steel) levelling off soon after, GDP growth rates for Terengganu and Sarawakhave slowed down in recent years. Terengganu had achieved a growth rate of 7.8 percent per annum during 1971-90, i.e. the third highest state growth rate for the NEP’sfirst Outline Perspective Plan (OPP) period. It had a growth rate of 8.0 per cent perannum during 1991-95, before dropping by almost half during 1996-2000. As Malaysiaexperienced its worst-ever post-war recession in 1998, Terengganu maintained sixthposition among the states. Meanwhile, Sarawak had a growth rate of 5.4 per cent – ninthamong the states – during the OPP era (1971-1990). The state’s performance wasrelatively better in the 1990s, but its growth rate slowed down more than in most of therest of the country in the late 1990s. This slowdown coincided with the decline oflogging output as timber resources approached exhaustion (Table 7).
1 The Sultan of Kelantan, then a member State of the Federation of Malaya, filed a suit in High Court
against the Malaysia Act (Straits Times, 11 September 1963, cited in records of the Colonial Office).

11
Table 4Malaysia: summary of Federal and State Government revenue
Federal State
Tax revenue1. Direct taxes
i. Income tax Individuals Companies Co-operatives Petroleum tax Development tax
ii. Taxes on property and capital gains Real property gains tax Estate duty
2. Indirect taxes i. Taxes on international trade
Export duties: palm oil, petroleum Import duties: tobacco, cigars and cigarettes, petroleum, motor vehicles, surtax on imports
ii. Taxes on production and consumption Excise duties: heavy fuel oils, petroleum, spirits, motor vehicles Sales tax Service tax
iii. Others Stamp duties Gaming tax Betting and sweepstakes Lotteries Casino Pool betting duty
Non-tax revenue and non-revenue receipts1. Road tax2. Licences3. Service fees4. Fines and forfeitures5. Interests6. Contributions from foreign governments and
international agencies7. Refund of expenditure8. Receipts from other government agencies9. Royalties
Tax revenue1. Import and excise duties on
petroleum products andexport duties on timber andother forest products forSabah and Sarawak, exciseduty on toddy for all States
2. Forests3. Lands and mines4. Entertainment duties
Non-tax revenue andNon-revenue receipts1. Licences and permits2. Royalties3. Service fees4. Commercial undertakings,
water, gas, ports andharbours
5. Receipts from land sales6. Rents on State property7. Zakat, fitrah and Bait-ul-Mal
and similar Islamic religiousrevenues
8. Proceeds, dividend andinterests
9. Federal grants andreimbursements
Source: Constitution of Malaysia.

12
Table 5Malaysia: ratios of per capita state GDPs to national averages, 1963-1975
1963 1964 1965 1966 1967 1968 1969 1970 1975
Johor 0.97 0.95 0.99 0.97 0.93 0.90 0.97 0.98 0.96
Kedah 0.81 0.86 0.83 0.84 0.84 0.83 0.81 0.81 0.56
Kelantan 0.58 0.57 0.52 0.42 0.47 0.49 0.51 0.52 0.39
Melaka 0.82 0.75 0.73 0.79 0.70 0.69 0.79 0.69 0.81
N. Sembilan 1.30 1.06 1.11 1.18 1.14 1.14 1.16 1.16 0.92
Pahang 1.10 1.16 1.11 1.12 1.06 1.06 1.05 1.04 0.89
Perak 1.03 1.09 1.12 1.09 1.09 1.06 1.08 1.07 0.87
Perlis 0.70 0.77 0.76 0.81 0.84 0.91 0.85 0.80 0.56
P. Pinang 0.67 0.71 0.73 0.75 0.75 0.77 0.76 0.78 1.17
Sabah n.a. n.a. n.a. n.a. 1.18 1.22 1.21 1.25 1.12
Sarawak n.a. n.a. n.a. n.a. 0.87 0.93 0.92 0.99 0.80
Selangor** 1.53 1.56 1.47 1.48 1.56 1.52 1.49 1.49 1.88
Terengganu 0.69 0.68 0.61 0.57 0.61 0.58 0.57 0.60 0.52(continued)
Table 5Malaysia: ratios of per capita state GDPs to national averages, 1978-2000* (continuation)
1978 1980 1983 1985 1986 1988 1990 1995 1998 2000
Johor 0.94 0.59 0.96 0.88 0.88 0.88 0.91 0.93 0.96 0.96
Kedah 0.54 0.65 0.59 0.63 0.63 0.63 0.59 0.59 0.66 0.61
Kelantan 0.38 0.46 0.48 0.46 0.42 0.40 0.40 0.42 0.33 0.43
Melaka 0.73 0.71 0.83 0.74 0.78 0.80 0.82 1.05 0.97 1.08
N. Sembilan 0.88 1.07 1.03 1.02 0.89 0.90 0.87 0.84 0.93 0.88
Pahang 1.04 0.99 1.03 0.93 0.80 0.76 0.75 0.7 0.81 0.71
Perak 0.84 0.89 0.89 0.85 0.78 0.77 0.76 0.86 0.86 0.90
Perlis 0.54 0.70 0.69 0.69 0.66 0.65 0.68 0.71 0.67 0.74
P. Pinang 1.13 1.13 1.22 1.10 1.05 1.09 1.12 1.4 1.37 1.47
Sabah 1.31 0.95 0.95 0.95 1.06 1.06 1.02 0.67 0.53 0.63
Sarawak 0.76 0.71 0.68 0.82 0.96 0.92 0.88 0.86 0.87 0.88
Selangor** 1.84 1.43 1.41 1.32 1.42 1.47 1.49 1.32 1.43 1.19
Terengganu 0.60 1.15 0.87 1.26 1.62 1.54 1.62 1.54 1.63 1.58
* Ratios for 1963-1970 refer to ratio to the mean for Peninsular Malaysia
GDP for 1983 in constant 1970 prices
GDP values for 1975-88 in constant 1978 prices
GDP values for 1990-2000 in constant 1987 prices
** Excludes Federal Territory of Kuala Lumpur
Sources: Calculated with data from Malaysia Plan documents and population statistics fromDepartment of Statistics, Malaysia.
13
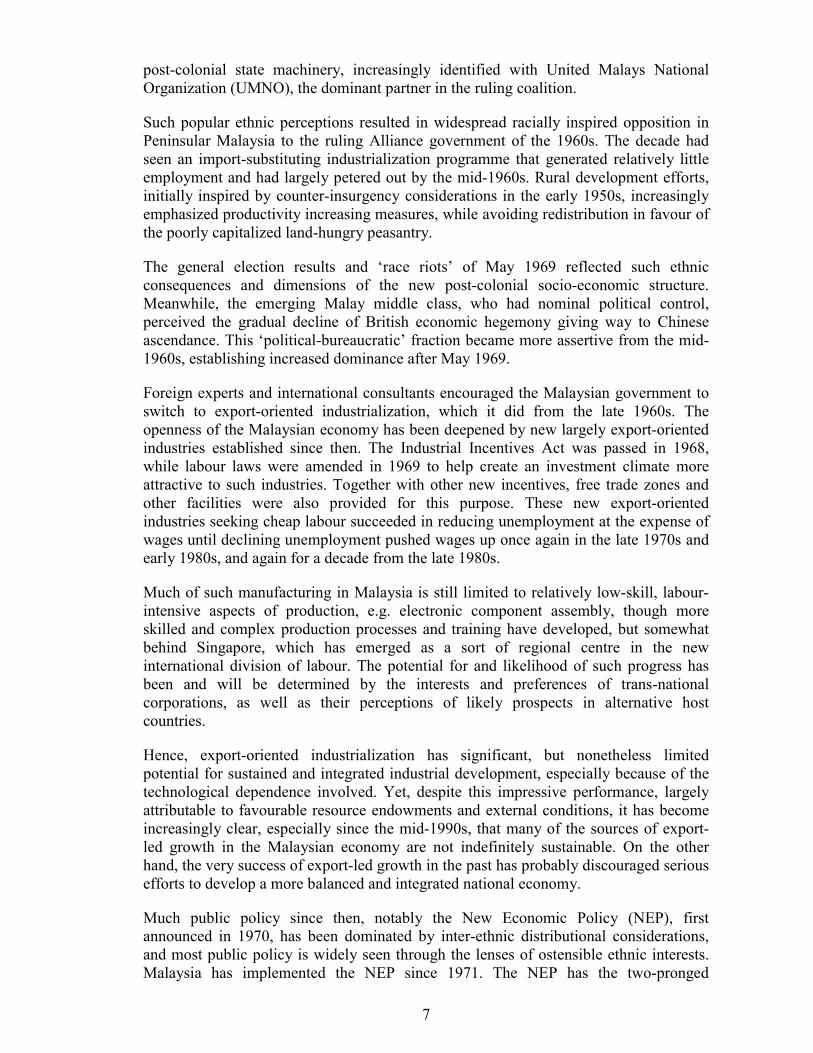
Table 6Malaysia: incidence of poverty (%) by state, 1970-1999
1970 1976 1984 1987 1990 1995 1997 1999
Johor 45.7 29.0 12.2 11.1 10.1 3.1 1.6 2.5
Kedah 61.1 61.1 36.3 31.3 30.0 12.2 11.5 13.5
Kelantan 74.1 67.1 39.2 31.6 29.9 22.9 19.5 18.7
Melaka 34.1 32.4 15.8 11.7 12.4 5.3 3.6 5.7
N. Sembilan 50.5 33.0 13.0 21.5 9.5 4.9 4.5 2.5
Perak 52.2 43.0 20.3 19.9 19.4 9.1 4.5 9.5
Perlis 63.2 59.8 33.7 29.1 17.2 11.8 10.6 13.3
Pahang 56.1 38.9 15.7 12.3 10.3 6.8 4.1 5.5
P. Pinang 52.7 32.4 13.4 12.9 8.0 4.0 1.6 2.7
Sabah - 58.3 33.1 35.3 34.4 22.4 22.1 20.1
Sarawak - 56.5 31.9 24.7 21.0 10.0 7.5 6.7
Selangor 42.7 22.9 8.6 8.9 7.8 2.2 1.3 2
Terengganu 65.1 60.3 28.9 36.1 31.2 24.3 17.3 14.9
Malaysia 56.7 37.7 20.7 19.3 17.1 8.7 6.8 7.5
* For Peninsular Malaysia only.
Sources: Fifth Malaysia Plan, 1986-1990 (5MP), Mid-Term Review of the Fifth Malaysia Plan,1986-1990 (MTR5MP), Second Outline Perspective Plan, 1991-2000 (OPP2), Mid-Term Reviewof the Seventh Malaysia Plan, 1996-2000 (MTR7MP), Eighth Malaysia Plan, 2001-2005 (8MP).
Table 7Malaysia: average GDP growth rate by state, 1971-2000 (% per annum)
1981-83 1971-1990 1991-95 1996-2000
Johor 5.4 (9a) 7.8 (3a) 10.0 (2a) 5.2 (3)
Kedah 4.4 (11) 6.9 (6) 9.9 (3) 4.8 (4)
Kelantan 5.4 (9b) 5.0 (11) 6.2 (9) 3.2 (10)
Melaka 6.2 (7) 7.0 (5) 9.6 (4) 3.9 (9a)
N. Sembilan 5.7 (8) 7.1 (4) 8.8 (5) 4.5 (5)
Pahang 7.3 (3) 5.3 (10) 7.5 (7a) 4.0 (8)
Perak 6.4 (6) 6.0 (8) 7.5 (7b) 3.9 (9b)
Perlis 5.1 (10) 6.7 (7) 7.0 (8) 3.9 (9c)
P. Pinang 6.9 (4) 8.0 (2) 10.0 (2b) 5.4 (2)
Sabah 7.7 (1) 4.9 (12) 5.0 (11) 4.1 (7)
Sarawak 6.8 (5) 5.4 (9) 6.0 (10) 4.2 (6a)
Selangor 5.4 (9c) 8.3 (1) 10.9 (1) 5.6 (1)
Terengganu 7.4 (2) 7.8 (3b) 8.0 (6) 4.2 (6b)
K. Lumpur 6.2 7.8 8.8 4.2
Malaysia 6.2 7.0 8.7 4.7
Sources: Mid-Term Review of the Fourth Malaysia Plan, 1981-1985, Table 5-2; SeventhMalaysia Plan, 1996-2000, Table 5-3; Eighth Malaysia Plan, 2001-2005, Table 5-4; ThirdOutline Perspective Plan, 2001-2010, Table 4-10.
14
In the Eighth Malaysia Plan for 2001-2005, Perlis, Kedah, Kelantan, Terengganu,Pahang, Sabah and Sarawak are categorized as less developed states, while Johor,Melaka, Negri Sembilan, Perak, Pulau Pinang, Selangor and KL are considered moredeveloped. Using a national average development index base of 100 for 1990, thedevelopment indices for the less developed states ranged from 86.8 to 98.8 in 1990 andfrom 113.8 to 126.1 in 2000. The development indices for the more developed stateswere higher, ranging from 100.0 to 109.9 in 1990 and from 131.9 to 139.2 in 2000.Selangor and Pulau Pinang had the highest development index scores (Table 8).
The composite development index is constructed from an economic development indexand a social development index. The less developed states had lower economic indexranges, i.e. 89.9 to 96.7 in 1990 and 100.6 to 117.1 to 125.0 in 2000, compared to 99.4to 112.6 in 1990 and 129.7 to 142.1 in 2000 for the more developed states. Similarly,the social development indices for less developed states were lower during the periodunder review – 83.6 to 100.9 and 110.4 to 128.5 for the less developed states, comparedto 100.6 to 108.3 in 1990 and 132.5 to 140.6 in 2000 for the more developed states.
The ratio of the average development index for the more developed states to that for theless developed states declined from 1.14 in 1990 to 1.10 in 2000. This suggests amodest narrowing of the gap between the more developed and the less developed statesby four per cent in the decade under review. In fact, the average development index forthe less developed states increased by only slightly more than that for the moredeveloped states (29.2 per cent compared to 29.0 per cent). The ratio of the economicdevelopment index for the more developed states to that for the less developed statesdecreased slightly from 1.13 in 1990 to 1.11 in 2000 – i.e. narrowing the gap by a meretwo per cent. Similarly, the ratio for the social development indices narrowed by fourper cent from 1.13 to 1.09.
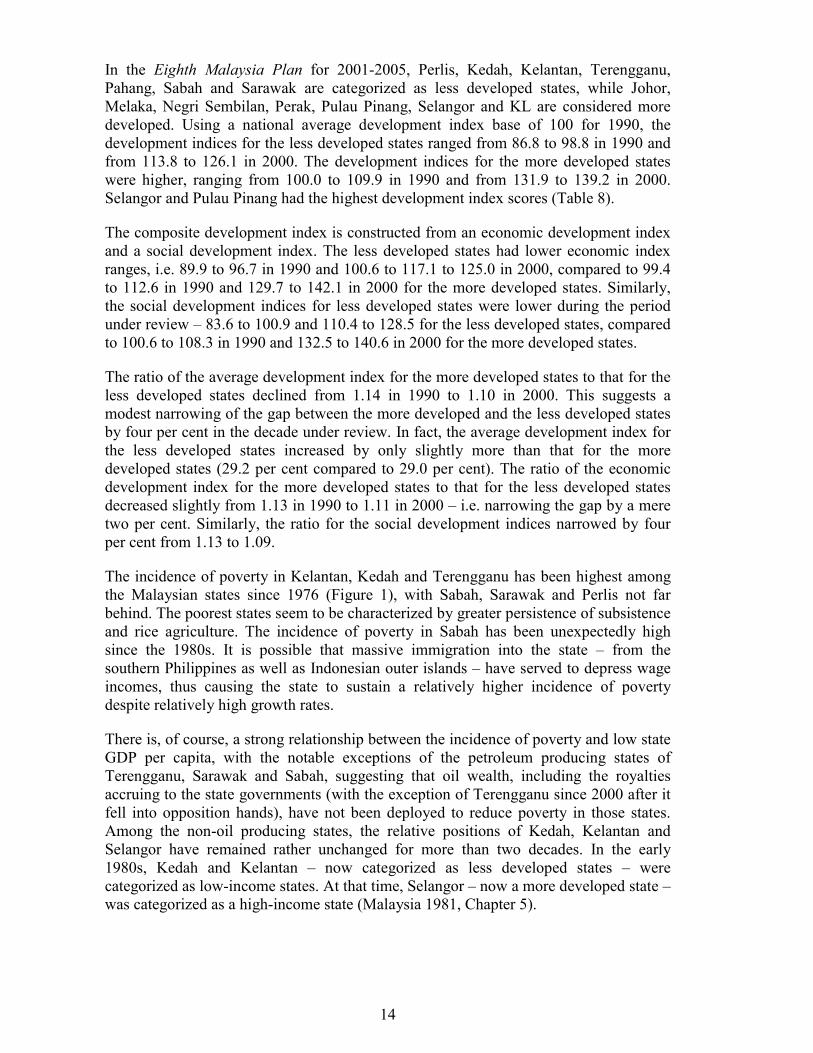
The incidence of poverty in Kelantan, Kedah and Terengganu has been highest amongthe Malaysian states since 1976 (Figure 1), with Sabah, Sarawak and Perlis not farbehind. The poorest states seem to be characterized by greater persistence of subsistenceand rice agriculture. The incidence of poverty in Sabah has been unexpectedly highsince the 1980s. It is possible that massive immigration into the state – from thesouthern Philippines as well as Indonesian outer islands – have served to depress wageincomes, thus causing the state to sustain a relatively higher incidence of povertydespite relatively high growth rates.
There is, of course, a strong relationship between the incidence of poverty and low stateGDP per capita, with the notable exceptions of the petroleum producing states ofTerengganu, Sarawak and Sabah, suggesting that oil wealth, including the royaltiesaccruing to the state governments (with the exception of Terengganu since 2000 after itfell into opposition hands), have not been deployed to reduce poverty in those states.Among the non-oil producing states, the relative positions of Kedah, Kelantan andSelangor have remained rather unchanged for more than two decades. In the early1980s, Kedah and Kelantan – now categorized as less developed states – werecategorized as low-income states. At that time, Selangor – now a more developed state –was categorized as a high-income state (Malaysia 1981, Chapter 5).

15
Table 8Malaysia: development composite index by state, 1990, 2000 (1990 = 100)
More developed states
Indicator Year Total Johor Melaka Negri
Sembilan
Perak Pulau
Pinang
Sela-
ngor
K.L.
1990 104.4 97.0 100.1 94.9 95.1 106.4 114.4 120.6Per capita GDP
2000 133.8 128.5 131.2 126.8 127.4 140.0 133.7 154.1
1990 106.2 108.0 104.6 106.6 102.2 107.6 110.0 104.2Unemployment rate
2000 133.2 132.5 132.5 131.8 128.4 138.0 130.4 138.7
1990 106.5 100.0 95.7 97.2 102.7 112.7 112.8 124.5Urbanization rate
2000 135.9 129.1 126.0 125.0 134.4 142.9 144.4 149.3
1990 108.2 108.3 104.8 105.3 99.3 117.8 113.7 108.2Registered cars &
motorcycles* 2000 139.9 136.8 138.2 134.9 134.2 148.7 130.3 156.1
1990 106.6 101.2 99.0 99.7 97.9 108.6 113.3 126.4Telephones*
2000 134.2 130.9 130.7 129.9 130.5 140.8 147.8 128.8
1990 107.2 107.3 105.1 107.9 98.3 108.5 109.6 113.5Incidence of poverty*
2000 130.3 132.5 127.5 132.5 121.6 132.2 133.3 132.8
1990 108.1 101.2 108.7 105.5 104.1 112.6 110.4 114.2Piped water*
2000 142.2 141.1 142.0 142.0 142.9 142.9 142.0 142.9
1990 105.0 99.1 107.6 106.8 99.1 106.8 107.6 107.6Electricity*
2000 135.9 135.9 135.9 135.9 135.9 135.9 135.9 135.9
1990 106.0 102.5 107.1 104.3 103.4 108.9 105.9 109.7Infant mortality rate per
1000 live births 2000 133.4 139.2 125.2 134.0 138.2 136.6 144.4 116.4
1990 105.0 97.4 99.2 100.0 98.3 104.7 101.9 132.9Doctors per 10,000
population 2000 133.4 122.6 132.1 126.0 126.3 133.9 147.4 145.5
1990 106.3 102.9 100.8 100.7 99.4 110.6 112.6 116.8Economic development
index 2000 135.5 131.6 131.7 129.7 131.0 142.1 137.3 145.5
1990 106.2 101.6 105.5 104.9 100.6 108.3 107.01 115.6Social development
index 2000 135.1 134.3 132.5 134.1 133.0 136.3 140.6 134.7
1990 106.3 102.2 103.2 102.8 100.0 109.5 109.9 116.2Development composite
index 2000 135.3 132.9 132.1 131.9 132.0 139.2 139.0 140.1
Change in index 29.0 30.7 28.9 29.1 31.9 29.7 29.1 23.9
(Continued)

16
Table 8Malaysia: development composite index by state, 1990 and 2000 (1990 = 100) (continuation)
Less developed statesIndicator Year
Total Kedah Kelantan Pahang Perlis Sabah Sarawak Terengganu
1990 94.6 88.3 84.3 94.2 90.1 96.3 99.2 108.2Per capita GDP
2000 123.9 120.9 116.8 123.1 123.7 121.2 126.7 142.3
1990 93.8 102.2 95.4 108.0 101.7 79.9 80.9 88.6Unemployment rate
2000 118.8 131.1 112.5 124.2 128.4 108.3 111.8 115.2
1990 93.5 92.8 93.2 91.8 90.0 93.1 95.2 98.4Urbanization rate
2000 121.8 122.5 121.2 118.6 119.4 120.7 126.4 124.1
1990 91.8 94.5 89.5 96.3 98.1 84.4 91.0 88.9Registered cars &
motorcycles* 2000 125.4 127.9 123.8 127.8 128.5 119.6 125.6 124.2
1990 93.4 92.0 89.6 93.2 94.7 95.9 96.9 91.6Telephones*
2000 117.8 115.9 115.4 122.4 115.9 115.9 120.1 119.0
1990 92.8 87.8 87.9 107.1 100.3 83.5 96.6 86.5Incidence of poverty*
2000 115.7 115.3 107.2 127.8 115.7 105.1 125.9 113.2
1990 91.9 94.5 79.8 98.7 92.3 93.0 87.9 97.2Piped water*
2000 131.2 141.1 115.6 136.5 138.3 111.9 137.4 137.4
1990 95.0 100.9 95.0 103.8 106.8 77.2 79.5 102.1Electricity*
2000 128.1 135.9 135.9 135.9 135.9 107.7 109.1 135.9
1990 94.0 100.8 103.1 98.7 97.1 71.2 87.6 99.9Infant mortality rate per
1000 live births 2000 125.1 128.8 122.6 1210 131.3 113.3 140.8 117.9
1990 95.0 94.7 95.3 96.1 97.2 93.3 93.6 95.0Doctors per 10,000
population 2000 119.4 121.1 122.6 119.9 121.1 114.1 118.0 119.0
1990 93.4 93.9 90.4 96.7 94.9 89.9 92.6 95.2Economic development
index 2000 121.7 123.7 117.9 123.2 123.2 117.1 122.1 125.0
1990 93.8 95.7 92.2 100.9 98.7 83.6 89.0 96.1Social development
index 2000 123.9 128.5 120.8 128.2 128.5 110.4 126.2 124.7
1990 93.6 94.8 91.3 98.8 96.8 86.8 90.8 95.7Development composite
index 2000 122.8 126.1 119.4 125.7 125.8 113.8 124.2 124.8
Change in index 29.2 31.2 28.1 26.7 29.0 27.0 33.3 29.2
Source: Third Outline Perspective Plan, 2001-2010, Table 4-8.
Note: * per 1000 population.

17
Figure 1: Malaysia: incidence of poverty by State, 1976-99
0
10
20
30
40
50
60
70
Johor
Melaka
Negri S
embil
an
Selang
or
Perak
P. Pina
ng
Perlis
Kedah
Kelanta
nTren
ggan
u
Pahan
g
Sabah
Sarawak
StateSources: various Malaysia Plan documents.
Inci
denc
e of
pov
erty
(%
)
0
5
10
15
20
25
30
1976198419871990199519971999

18
Figure 2: Malaysia: gross domestic product growth rate by State, 1991-2000
0
2
4
6
8
10
12
Johor
Kedah
Kelanta
n
Melaka
Negri S
embil
an
Pahan
g
Perak
Perlis
P. Pina
ng
Sabah
Sarawak
Selang
orTren
ggan
u
StateSource: Seventh Malaysia Plan , Table 5-2.
Gro
wth
(%
p.a
.)
1991-1995
1996-2000

19
Figure 3: Malaysia: gross domestic product per capita by State, 1990-2000
0
0.2
0.4
0.6
0.8
1
1.2
1.4
1.6
Kedah
Kelanta
n
Melaka
Negri S
embil
an
Pahan
g
Perak
Perlis
P. Pina
ng
Sabah
Sarawak
Selang
orTren
ggan
u
StateSource: Seventh Malaysia Plan, Table 2-7.
Rat
io to
nat
iona
l ave
rage
1990
1995
1998
2000estimate
20
Figure 4: Malaysia: mean household income by State, 1976-1999
0
500
1000
1500
2000
2500
3000
3500
4000
4500
Johor
Melaka
Negri S
embil
an
Selang
or
Perak
P. Pina
ng
Perlis
Kedah
Kelanta
nTren
ggan
u
Pahan
g
Sabah
Sarawak
StateSources: various Malaysia Plan documents.
Mea
n m
onth
ly h
ouse
hold
inco
me
(RM
)
1976198519871990199519971999

21
Figure 5: Malaysia: development allocation by State, 1976-2000
0
500
1000
1500
2000
2500
3000
3500
4000
4500
5000
Johor
Kedah
Kelanta
n
Melaka
Negri S
embil
an
Pahan
g
Perak
Perlis
P. Pina
ng
Sabah
Sarawak
Selang
orTren
ggan
u
StateSources: various Malaysia Plan documents.
Allo
catio
n (R
M m
illio
n)
Third Malaysia Plan,1976-1980Fourth Malaysia Plan,1981-1985Fifth Malaysia Plan,1986-1990Sixth Malaysia Plan,1991-1995Seventh MalaysiaPlan, 1996-2000

22
Figure 6: Malaysian States: development allocation by area , 1976-2000
0
200
400
600
800
1000
1200
1400
1600
1800
2000
Johor
Kedah
Kelanta
n
Melaka
Negri S
embil
an
Pahan
g
Perak
Perlis
P. Pina
ng
Sabah
Sarawak
Selang
orTren
ggan
u
StateSources: various Malaysia Plan documents.
Allo
catio
n (R
M m
illio
n pe
r '0
00 s
quar
e ki
lom
etre
)
Third Malaysia Plan,1976-1980Fourth Malaysia Plan,1981-1985Fifth Malaysia Plan,1986-1990Sixth Malaysia Plan,1991-1995Seventh MalaysiaPlan, 1996-2000
s

23
Figure 7: Malaysia: development allocation per capita by States, 1976-2000
0
1000
2000
3000
4000
5000
Johor
Kedah
Kelanta
n
Melaka
Negri S
embil
an
Pahan
g
Perak
Perlis
P. Pina
ng
Sabah
Sarawak
Selang
orTren
ggan
u
StateSources: various Malaysia Plan documents.
Allo
catio
n pe
r ca
pita
(R
M)
Third Malaysia Plan,1976-1980Fourth Malaysia Plan,1981-1985Fifth Malaysia Plan,1986-1990Sixth Malaysia Plan,1991-1995Seventh MalaysiaPlan, 1996-2000

24
Figure 8: Malaysia: five year development plan allocations, 1971-2005
0
10,000
20,000
30,000
40,000
50,000
2 MP 1971-75
3 MP 1976-80
4 MP 1981-85
5 MP 1986-90
6 MP 1991-95
7 MP 1996-2000
8 MP 2001-2005
Sources: various Malaysia Plan documents.
Allo
catio
n (R
M m
illio
n) EconomicDevelopment
SocialDevelopment

25
The poverty rates in Sabah and Sarawak have been higher than the average in thepeninsula,2 though Sabah and Sarawak had higher growth rates than the peninsula duringthe 1971-90 period. In fact, Sabah had the highest growth rate of all the States (Wee,1995: 56-58). The growth rates of the Borneo States were boosted in part by theproduction of petroleum, the benefits of which have mainly accrued to foreign productioncompanies and the Federal Government since the Petroleum Development Act of 1974.
The last decade saw Malaysia’s gross domestic product (GDP) growing at an average 8.7per cent per annum for 1991-1995 and by 8.0 per cent for 1996-2000 despite the deepnational recession in 1998. Meanwhile, Kelantan, Sabah and Sarawak grew slower thanthe other States in the 1990s (Figure 2). Together with the northern States of Kedah andPerlis, they have had consistently lower per capita GDPs compared to the nationalaverage (Figure 3). The decline in Sabah’s growth rate to lag behind the peninsula can beattributed to declining natural resource extraction, especially of timber.
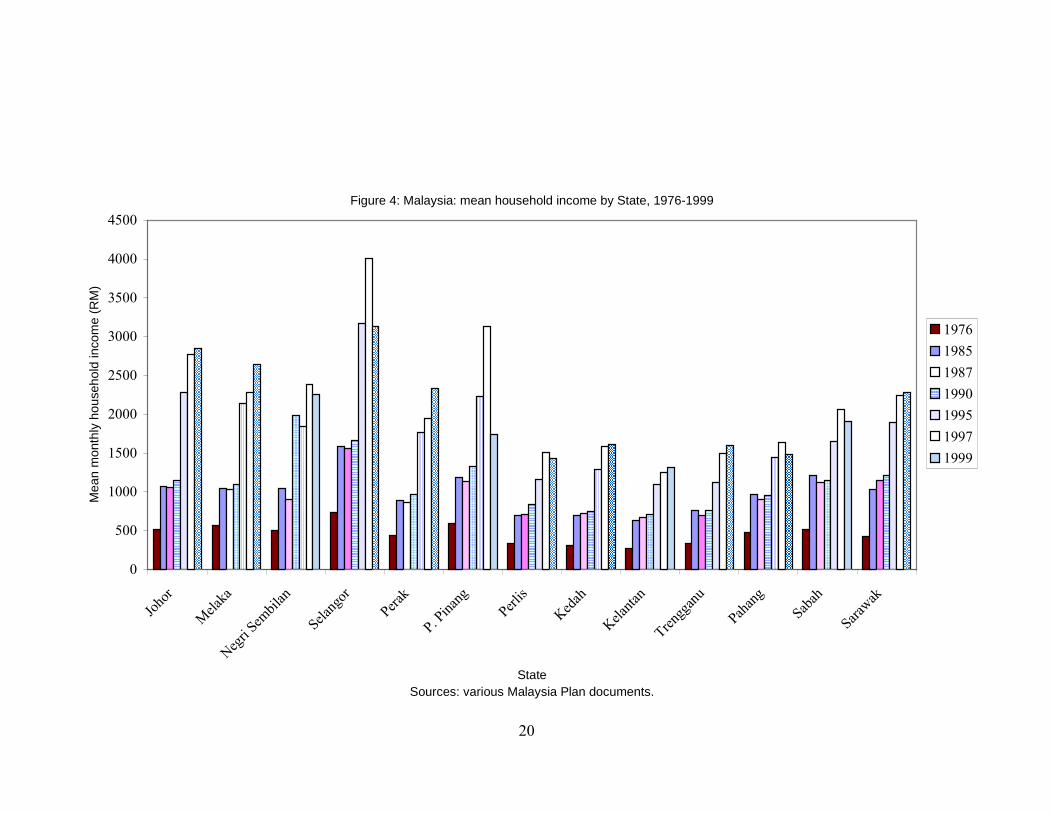
The Northern and East Coast States of Kedah, Perlis, Kelantan and Terengganu have alsohad relatively low household incomes (Figure 4). Although household incomes for theBorneo States of Sabah and Sarawak have been comparable with most other States, thecosts of living in the Borneo States have been much higher, requiring higher poverty linesthan in the peninsula. Poverty has also been reflected in their higher infant mortality ratesand fewer motorcycles, motorcars and telephone services per capita (Table 9).
2 Some predominantly Malay States in northern Peninsular Malaysia and on its East Coast also have high
poverty rates, while there are also pockets of poverty in the more developed States, especially amongurban squatters and Orang Asli communities.

26
Table 9Malaysia: socio-economic indicators by State, 1999
State Infantmortality rate#
Populationper motorcar
Populationper motorcycle
Populationper telephone
Johor 1865 (8) 6 (7a) 3 (6a) 6 (7a)
Kedah 1882 (7) 13 (3) 5 (5) 7 (6a)
Kelantan 2099 (5) 16 (2a) 7 (3a) 13 (2)
Melaka 1242 (12) 5 (8) 3 (6b) 5 (8a)
N. Sembilan 1505 (10) 6 (7b) 3 (6c) 5 (8b)
Pahang 2300 (4) 10 (4) 6 (4a) 9 (5)
Perak 1498 (11) 7 (6) 3 (6d) 6 (7b)
Perlis 1895 (6) 29 (1) 8 (2a) 7 (6b)
P. Pinang 1061 (13) 4 (9) 2 (7) 5 (8c)
Sabah 4249 (1) 16 (2b) 42 (1) 19 (1)
Sarawak 2585 (2) 9 (5) 7 (3b) 11 (3)
Selangor 1584 (9) 6 (7c) 6 (4b) 4* (9)
Trengganu 2467 (3) 16 (2c) 8 (2b) 10 (4)
Malaysia 1477 8 5 7
# No. of deaths of infants less than 1 year old per 1000 live births, for 1998.
* Excludes Multi-media Super-corridor (MSC).
Note: Figures in parentheses show ranks.
Sources: Department of Statistics, Malaysia, Social Bulletin of Statistics, 2000. Calculated fromdata in Department of Statistics, Malaysia, State/District Data Bank, 1999.

27
Table 10Malaysia: federal and consolidated state government revenues and expenditures, 1985-1999 (RM '000 million)
1985 1990 1995 1999
Federal Government Revenue 21.114 29.521 50.954 58.675
Consolidated State Government Revenue 4.245 6.718 8.261 8.228
Federal Government Expenditure 26.82 34.19 49.03 68.162
Consolidated State Government Expenditure 5.61 8.54 10.534 8.91
Sources: Ministry of Finance, Economic Report, various issues.
Table 11Malaysia: grants to State governments, 1975-1999
1975 1980 1985 1990 1995 1999
Grants to State Governments (% Federal Government Operating Expenditure) 9.0 11.0 4.5 3.8 3.5*
Deficit grants (RM million) 27.50 13.56 17.11
Development grants (RM million) 99.60 166.39 165.93
Contingency grants (RM million) 262.50 797.80 1216.60 1021.80
Outstanding Loans Due to Federal Govt from State Govts (RM million) 1107 2461 6118 7317 7330 9335*
* 2000 estimate
Sources: Economic Report, various issues; Federal Public Accounts, various issues.

28
7 Federal and state government finances
Under the Malaysian Constitution, taxes may only be levied with authorization byfederal law. The Federal Government collects direct taxes such as income taxes onindividuals, companies and cooperatives, as well as capital gains taxes, import andexport duties. The State Governments are assigned residual revenues such as thoserelated to land, real property, agriculture and forestry. Within constitutionally set limits,the Federal Government can influence such State government revenue sources.
For instance, the federal-owned Petroleum Nasional Berhad (Petronas) is empowered tocontract out exploration and production of petroleum under the Petroleum Act, 1974. Ifthe Federal Government directs – through Petronas – such activities away from aparticular State during a certain period, the State Government concerned will have lessroyalty revenue in that period. The 1991 federal ban on log exports from Sabah – thenheld by the opposition PBS (Parti Bersatu Sabah) government – undermined Stategovernment revenue (Wee, 1995: 24).
In essence, the State’s financial powers are limited. State Governments receive grantsfrom the Federal Government, given in consultation with the National Finance Council,which comprises the Prime Minister and ministers appointed by the Prime Minister andone representative from each State (Constitution of Malaysia, Article 108). Since thePrime Minister can appoint various ministers to the Council, he has much more powerthan any State representative. Current Prime Minister Mahathir Mohamad has been themost powerful and assertive among the four Malaysian prime ministers to date.
Grants to the States take the form of tax-sharing grants,3 general grants4 and specificgrants.5 Federal Government expenditure has been far larger than for all the StateGovernments taken together (Table 10). Federal government revenue has contributedfrom between 77 to 91 per cent of total government revenue since 1963. Federal 3 Tax-sharing grants include 10 per cent of export duties on tin, iron and other minerals based on the
‘derivation’ principle. Under Article 110 (3A), the Federal Constitution allows the FederalGovernment to increase this grant for the peninsular States to more than the minimum 10 per cent ofexport duties on minerals. This tax-sharing grant was created at the same time that State royalty rightsto minerals were prohibited unless provided for by federal law. If export duties are abolished in linewith World Trade Organization (WTO) proposals, State Government revenue from such tax-sharinggrants will be reduced.
4 General grants include capitation grants, State Reserve Fund grants, Contingencies Fund grants, StateAdvance grants and special grants. The capitation grants are based on a State’s population size. StateReserve Fund grants are for supplementing State Government revenues (deficit grants) and fordevelopment (development grants) as deemed necessary for the year. The Contingencies Fund grantsare given for unforeseen needs. The State Advance Fund grants provide cash advances to StateGovernments facing cash flow problems.
5 Special grants have been given to the Governments of Kedah, Selangor, Sabah and Sarawak. Thesegrants may be seen as compensation for land surrendered by the respective State Governments to theFederal Government. The grants to Sabah and Sarawak were given on the basis of the conditions forincorporation into Malaysia that were supposedly subject to later review, which has never taken place.Currently, RM26.7 million goes to Sabah and RM16 million to Sarawak. Specific grants to the StateGovernments include State road grants, service charge grants and cost reimbursement grants. Thus,the State Government may be regarded as the implementing agency, whose services are subject tofederal decisions.

29
government operating expenditure made up more than 70 per cent of total governmentoperating expenditure for the period 1963-80, more than 50 per cent in the 1980s, andabout 40 per cent in the 1990s. The period also saw higher federal current accountsurpluses as well as higher overall federal deficits.
Meanwhile, federal development expenditure constituted 68 to 90 per cent of totaldevelopment expenditure during the period under review. For the period 1985-99,federal government expenditure was at least four and a half times the consolidated Stategovernment expenditure. It increased to more than five times in 1995, and to aboutseven and a half times in 19996. Similarly, federal government revenue has exceededconsolidated State government revenues. Federal government revenue grew from fourtimes the consolidated State government revenues to seven times in the period underreview.7
Federal Government financial allocations to State Governments have shifted fromgrants to loans over time. Federal Government grants to the States decreased from 9.0per cent of its operating budget in 1975 to 3.5 per cent in 1999 (Table 11). At the sametime, outstanding loans from the Federal Government to the State Governmentsincreased from RM1,107 million to over RM9,000 million. In general, deficit grantsallocated from the State Reserve Fund to the State Governments declined from the late1980s to the early 1990s, but have risen again recently, especially since the Asianfinancial crisis of 1997.
Besides special grants, federal grants contribute proportionately more to Stategovernment revenue in Selangor, Kedah, Johor, Pulau Pinang, Negri Sembilan andKelantan.8 Because of their limited financial resources, State Governments have 6 In 1999, federal government expenditure was estimated at RM68,187 million, compared to RM8,912
million for consolidated State government expenditure.7 In 1999, federal government revenue was estimated at RM58,675 million, compared to the
consolidated State government revenues of RM8,228 million.8 With the exception of Pulau Pinang, these States as well as Sarawak and Pahang had the most federal
loans for 1996-99 (see table below). Except for Kelantan, most of the loans were for housing andwater supply. Forty-five per cent of outstanding loans to Kelantan in 1999 were for its State EconomicDevelopment Corporation. These consisted of two rescheduled loans given in 1997. The loans wereprobably rescheduled because the Kelantan State Government was unable to pay as originallyscheduled. The Federal Government is also guarantor for two statutory bodies each in Sabah andSarawak, as well as a statutory body in Pahang – RM169.2 million for the Sabah Electricity Board,RM8 million for the Sabah Ports Authority, RM424.1 million for the Sarawak Electricity SupplyCorporation, RM2 million for the Sibu Water Board and RM32.4 million for the Pahang StateDevelopment Authority in 1996.Malaysia: Outstanding Federal Loans to State Governments, 1996, 1998, 1999 (RM million)State 1996 1998 1999Johor 821 961 944Kedah 1168 1257 1315Kelantan 678 636 639Melaka 372 503 574Negeri Sembilan 678 859 992Pahang 642 751 829Perak 193 190 183Perlis 120 122 175Pulau Pinang 197 309 312Sabah 140 231 456Sarawak 790 862 1124Selangor 1147 1084 1039Trengganu 553 746 751Sources: Federal Public Accounts, various issues.

30
attempted to reduce their fiscal gaps by cutting spending in line with their revenues(Umikalsum, 1992: 327) and handing over some functions to the Federal Government,leading to further centralization since the formation of Malaysia (Wee, 1996: 285).
Spending has been uneven among the states, reflecting federal government preferencesas well as state government financial resources. The public sector was smallest in theBorneo states of Sabah and Sarawak, contributing the lowest shares of state GDPsduring the NEP era. Public sector shares of state GDPs in the northern states of Perlis,Kedah, Pulau Pinang and Perak were relatively small in the early 1970s, but grew in the1980s. The reverse was observed for Selangor, while Melaka’s relatively large publicsector share was maintained during this period (Table 12).
As noted earlier, the federal government has been fiscally much more important than the13 state governments put together. With its greater financial resources, there has beengreater attention to federal government efforts in reducing inter-regional welfaredifferences and ensuring more equitable development. Malaysia has had eight five-yeardevelopment plans since 1966. More development funds have been channelled toSelangor and Johore, both absolutely and relatively (Figures 5 and 6). The smallerStates of Melaka, Pulau Pinang and Perlis have been allocated the most developmentfunds in relation to area. Conversely, the larger States of Pahang, Sabah and Sarawakhave received the lowest allocations in relation to area.
The Seventh Malaysia Plan (1996-2000) saw relatively higher allocations for the poorStates of Sabah and Sarawak. Besides Pahang, the poor State of Terengganu also got themost allocations per capita (Figure 7). However, Terengganu’s allocations have beenreduced relatively after electing a PAS government in late 1999. The poorest State inthe peninsula, Kelantan, has long experienced such discrimination since electing PASState governments from 1959 until 1978, and then again from 1990. Since the FederalGovernment is in a better position to finance development, discrimination against thesetwo States has aggravated tensions between them and the Federal Government.
More government development allocations have been allocated for economic, ratherthan social development (Figure 8). Economic development programmes here includeagricultural development, mineral resources development, commercial and industrialdevelopment, development of transport, communications, energy and water resources,and related feasibility studies as well as research and development to increase incomes.Social development programmes include provision of piped water supply, electricity,housing, sewerage and rubbish disposal, health services, roads or transport systems. Thepoor generally have less access to piped water supply and electricity than higher incomegroups. Among the urban poor, housing as well as sewerage and rubbish disposalservices are relatively inaccessible.

31
Table 12Malaysia: Government services as proportion of gross domestic product in purchasers’ prices by State, 1970-90
1970 1971 1975 1980 1983 1985 1986 1988 1990
Johor 7.49 (5) 10.98 (6) 7.05 (6) 9.57 (6) 11.94 (4) 11.72 (5) 11.65 (6) 12.52 (6) 10.36 (6)
Kedah 6.20 (4a) 10.14 (5a) 6.72 (5a) 11.85 (10) 19.26 (11) 15.34 (10) 16.11 (11) 16.48 (10) 15.02 (10)
Kelantan 8.62 (7) 12.59 (7) 9.16 (9) 16.45 (13) 22.64 (13) 20.38 (13) 24.82 (13) 24.65 (13) 22.26 (13)
Melaka 11.03 (11) 17.96 (12) 10.65 (11) 14.37 (11) 16.79 (10) 17.55 (11) 15.47 (9) 16.51 (11) 13.67 (8)
N. Sembilan 8.86 (8) 13.55 (10) 8.31 (7) 9.79 (8) 13.54 (6) 12.60 (8) 14.81 (8) 15.52 (8) 13.90 (9)
Pahang 8.98 (9) 12.83 (8) 9.17 (10) 10.73 (9) 13.09 (5) 13.09 (9) 16.09 (10) 16.25 (9) 15.41 (11)
Perak 4.28 (1) 7.85 (2) 4.36 (1) 9.75 (7) 13.83 (8) 12.25 (7) 13.95 (7) 14.30 (7) 12.71 (7)
Perlis 6.20 (4b) 10.14 (5b) 6.72 (5b) 14.54 (12) 21.67 (12) 17.67 (12) 20.03 (12) 21.13 (12) 17.46 (12)
P. Pinang 5.19 (2a) 7.29 (1) 6.27 (4) 9.21 (4) 10.68 (3) 12.00 (6) 11.24 (5) 12.22 (5) 9.84 (5)
Sabah 5.19 (2b) 9.83 (4) 5.80 (3) 9.56 (5) 10.15 (2) 8.73 (2) 7.44 (1) 7.94 (1) 8.07 (4)
Sarawak 5.23 (3) 9.78 (3) 5.22 (2) 6.77 (1) 13.71 (7) 10.08 (4) 8.62 (4) 8.68 (4) 6.41 (1)
Selangor 10.26 (10) 13.30 (9) 11.10 (12) 7.85 (2) 7.71(1) 8.38 (1) 7.47 (2) 8.28 (3) 6.86 (3)
Terengganu 8.51 (6) 14.18 (11) 8.63 (8) 7.95 (3) 14.55 (9) 9.45 (3) 8.42 (3) 8.16 (2) 6.75 (2)
Kuala Lumpur n.a. n.a. n.a. 14.78 18.27 16.43 16.26 17.58 15.42
n.a. - Not available
Figures in brackets indicate ranks from highest to lowest proportions.
Sources: Calculated with data from Third Malaysia Plan, 1971-1975, Table 10-1 and 10-3; Fourth Malaysia Plan, Table 5-1; Mid-Term Review of the FourthMalaysia Plan, Tables 5-1 and 5-3; Fifth Malaysia Plan, 1986-1990, Tables 5-2, 5-3; Second Outline Perspective Plan, 1991-2000, Tables 4-6, 13.

32
In 1990, government spending on health came to three per cent of the gross domesticproduct (Economic Planning Unit, 1995, cited in Low et al., 1996), well below the fiveper cent recommended by the World Health Organization (WHO). In 1998, governmentoperating expenditure through the Ministry of Health represented about 1.2 per cent ofthe gross domestic product (calculated from information in Federal Public Accounts,1999 and from Ministry of Finance statistics). It is generally acknowledged that theMalaysian Government has provided reasonably good health services and that the costof coverage has been kept reasonably low through the efficient use of resources.However, the distribution of health service delivery has been regionally inequitable. Ofparticular concern has been the relative lack of health personnel in Sabah, Sarawak,Terengganu, Kedah and Kelantan (Table 13). Skilled personnel, including doctors,would rather stay in the more developed States, where modern facilities as well asrecreational and entertainment services are closer to their expectations. However,improved community health may not be seen as developmental or improving incomes.9
The development of road transport can be very important for improving the quality oflife and incomes. Better road networks have lowered transport costs and increasedmarketing opportunities nationwide. In Sarawak, roads linking rural communities tohealth centres also increase access to health services. With the exceptions of Selangorand Johor, which have higher road densities relative to size, large States tend to havelower road densities. In fact, the Kelang Valley in Selangor is currently burdened bytraffic congestion. In contrast, Sarawak, Sabah and Kelantan have lower road densityrelative to size.
Educational opportunities and scholarships have been politicized. Education has beenand is perceived as a means to increase chances of participation in high-incomeemployment. Most government educational opportunities and scholarships are reservedfor Bumiputeras under the NEP. However, the ethnic quota system has failed toprivilege the poor among the Bumiputeras. The siting of universities in various Stateshas been similarly politicized. Universiti Malaysia Sarawak (Unimas) was set up when aSarawakian was the federal Minister of Education. Some Sarawakians welcomed sitingthe university in the State, but many more still bemoan the low proportion ofSarawakian students in the university and the teachers’ training colleges in the State.
Besides politicising development allocations and depriving States controlled by theopposition, the location of economic development projects and programmes have alsobeen politicized to marginalize those States led by opposition governments. Theconsequence of such bias is to further increase the disparities as opposition parties havebeen strongest in States characterized by poverty, fiscal discrimination and slowereconomic growth if not for natural resources – especially petroleum and timber –extraction activities.
9 The opportunity cost of poor health in terms of increased medical care requirements is not obvious.
Politicians find it easier to win over voters through projects with more apparent direct benefits.

33
Table 13Malaysia: health facilities and road density by State, 1995-1999
Population Per Personnel/FacilityState
Doctor,1999
Nurse,1998
GovernmentHospital Bed, 1999
Dentist,1999
Road Density,1995
(km/km2)
Johor 1,808 (7) 1,228 (4) 1,001 (3) 12,538 (9) 0.341514 (7)
Kedah 1,915 (6) 1,173 (7) 771 (7) 17,360 (3) 0.427010 (6)
Kelantan 1,962 (5) 1,357 (5) 943 (4) 16,727 (5) 0.189745 (11)
Melaka 1,111 (12) 939 (10) 710 (8) 10,785 (10) 0.837674 (3)
Negri Sembilan 1,455 (10) 932 (11) 630 (10) 9,958 (11) 0.577299 (5)
Pahang 2,110 (4) 1,087 (8) 787 (6) 14,676 (7) 0.190718 (10)
Perak 1,483 (9) 996 (9) 615 (12) 14,409 (8) 0.290978 (9)
Perlis 1,701 (8) 873 (13) 560 (13) 16,175 (6) 0.777358 (4)
Pulau Pinang 1,063 (13) 923 (12) 620 (11) 8,906 (13) 1.979611 (1)
Sabah 4,015 (1) 1,788 (2) 1,073 (2) 40,207 (1) 0.147244 (12)
Sarawak 2,629 (2) 1,544 (3) 676 (9) 25,659 (2) 0.041125 (13)
Selangor 1,431 (11) 2,609 (1) 1,261 (1) 9,085 (12) 1.087115 (2)
Trengganu 2,194 (3) 1,195 (6) 874 (5) 17,225 (4) 0.308529 (8)
Malaysia 1,465 1,223 806 11,897 0.195076
Note: Figures in parentheses show ranking.
Sources: Department of Statistics, Malaysia, Social Bulletin of Statistics, 2000.
Calculated from data in Department of Statistics, Malaysia, State/District Data Bank, 1999.
Handbook of Statistics, Malaysia, 1999.

34
Table 14Malaysia: Government revenue, 1975-2001 (RM million)
1975 1978 1980 1982 1983 1984 1985 1990 1996 2001
Federal government:
Petroleum income tax 322 771 1,736 2,075 1,998 2,570 3,130 2,644 2,203 9,858
Petroleum royalty 78 116 345 425 491 581 619 627 848 2,000
Total 400 887 2,081 2,500 2,489 3,151 3,749 3,271 3,051 11,858
% Total federal government revenue 7.82 10.03 14.94 14.98 13.38 15.15 17.76 11.08 5.24 14.90
Sabah 0.85 50.74 74.98 87.71 118.84 104.55 104.32 115.37 80.47 N.A.
% State government revenue 0.32 6.53 4.87 5.92 9.03 7.82 9.02 7.12 5.28
Sarawak 112.35* 64.50* 116.00* 159.93* 171.71* 216.70* 210.66* 204.90 320.00 N.A.
% State government revenue 54.44* 27.01* 29.00 23.18* 17.36* 24.63* 22.41* 22.00 14.00
Terengganu - 13.20 0 181.94 0 0 280.92 0 0 N.A.
% State government revenue 22.37 0.70 83.07
* Refers to revenue from land and mines, the majority of which is from crude oil and natural gas.
2001: forecast only.
Sources: Calculated with data from State Financial Statements, various issues.
Economic Report, various issues.
http://www.bnm.gov.my (Bank Negara Malaysia).

35
The (usually federal) government-financed development of industrial infrastructure isgenerally expected to bring in employment-generating foreign investments. However,even without bias or neglect, it is often the case that poorer States and regions are morelikely to be bypassed for cost, feasibility or viability considerations, leading to lowerallocations to poorer States. Certain States may also lack the skilled human resources orother capabilities required for implementing some development projects. Limitedcapacities and capabilities are still common, and some development allocations have notbeen spent for such reasons.
8 Tensions between the centre and the Borneo StatesSince the mid-1970s, petroleum resources have been managed by the federalgovernment-owned Petronas.10 The issue of increasing petroleum royalties forproducing States has often been raised.11 Based on the principle of ownership of thecontinental shelf by adjoining regions, Sabah and Sarawak could claim ownershipbefore incorporation into Malaysia in 1963. The status quo could have been maintainedinsofar as the Malaysian Constitution is silent on the matter. Thus, the federalgovernment claim to ownership has been construed as annexation.12
The Federal Government gets far more petroleum revenue than the governments of thepetroleum producing States (Table 14). Besides getting the same five per cent royaltiesfrom petroleum output as the State government concerned, the Federal Government getsdividends from Petronas. Furthermore, it also taxes the profits of the oil producing-companies and Petronas itself. Since 1985, Federal Government revenue frompetroleum tax and royalties have totalled more than RM3,000 million per annum,
10 Distribution of the gross value of petroleum output has been prescribed by the 1974 Petroleum
Development Act as follows (Wee, 1995: 24-25):Government of producing-State 5% royalty on the gross value of petroleum outputFederal Government 5% royalty on the gross value of petroleum outputProducer-company 20% for cost recoveryTotal 30%Producer-company 21% (30% of remaining 70%)Petronas 49% (70% of remaining 70%)Total 100%
11 For instance, in 1969, the Sarawak Chief Minister claimed that the federal government had orallyassured Sarawak that it could have all the revenue from offshore petroleum in return for a lower grant(Leigh, 1988: 133). During the election campaign of October 1990, Joseph Pairin Kitingan, theincumbent Chief Minister of Sabah, argued that the petroleum royalty rate for the State should beincreased from 5 to 50 per cent.The issue of Sarawak ownership of offshore petroleum was especially mentioned in the 1960s.Although petroleum royalties in general have long been an issue of contention, there has been littlepublicity on the matter in the Malaysian media. Members of Parliament from Sarawak have inquiredabout the value of petroleum royalties due to the State at various points in time. However, disputes onthe formula for sharing petroleum revenues have never been well reported, reflecting the federalgovernment’s sensitivity to the matter and tight control of the mass media. The mention of benefitsfrom petroleum resources – in the form of profits to government-owned shipping facilities nowprivatized and owned by Sarawakians – hint of public opinion in the Borneo States being critical ofthe matter (Abang Karim, 1999).
12 See Bob Reece in Far Eastern Economic Review, 30 October 1969 and 12 March 1970, quoted inLeigh, 1971: 233.

36
representing at least five per cent of total revenue. It is estimated that at least half thisrevenue is from petroleum resources in the Borneo States.13
Both Sabah and Sarawak seemingly enjoy favoured financial positions among theMalaysian States (Table 15). They receive more grants compared to other States, partlyrationalized by being among the three founding members of the federation. However,over time, the grants negotiated at the time of formation of the Malaysian federationhave been abolished and/or reduced.14
Table 15Malaysia: Federal Government grants by State, 1964-1996 (RM million)
State 1964-1970 1971-1980 1981-1990 1991-1996
Johor 80.77 182.37 350.04 423.46
Kedah 75.79 157.74 439.38 353.56
Kelantan 50.48 110.86 256.60 227.07 (8)
Melaka 34.36 72.31 128.45 (4) 85.23 (9)
N. Sembilan 42.38 99.21 199.87 101.13 (10)
Pahang 52.54 136.50 539.69 (5) 189.83 (11)
Perak 137.24 282.72 (1) 221.38 (6) n.a.
Perlis 8.31 20.12 (2) n.a. 59.55 (12)
P. Pinang 42.86 44.84 (3) n.a. n.a.
Sabah 267.20 421.11 885.78 585.23
Sarawak 312.00 525 1,098.31 746.719
Selangor 11,753,216.00 840.42 3005.25 (5) n.a.
Terengganu 11,643,013.00 106.82 245.65 (7) 214.01
(1) For 1971-79(2) For 1971, 1973, 1974, 1976-78(3) For 1973, 1975-77(4) For 1981-89(5) For 1981-85, 1987-89(6) For 1981, 1983-86(7) For 1981-87, 1989, 1990(8) For 1991-95(9) For 1991-94(10) For 1991-93(11) For 1992-96(12) For 1993-96
Sources: Various State Financial Statements.
The export ban on logs from Sabah has been another point of contention between theSabah State Government and the Federal Government. The federal Minister of PrimaryIndustries, with whom some powers over timber policy have been vested, banned log 13 Crude petroleum exports constituted at least half of petroleum production in the mid-1990s, and
exports from Sabah represented a fifth of exports, while those from Sarawak represented some 30 to40 per cent (calculated with data from the Department of Statistics, Malaysia). However, Sabah’shighest ever petroleum royalty was RM161 million, or 9.9 per cent of total government revenue in1990. Sarawak’s petroleum royalty was about RM200 million for the period, 1985-1998. Thecontribution of petroleum royalties to Sarawak State Government coffers decreased from 21.8 per centin 1985 to 8.7 per cent in 1998.
14 There should have been reviews of the grants in 1973 and in subsequent decades, but no such reviewhas been completed. It is anticipated that Sarawak and Sabah will lose their favoured financialpositions within the Malaysian Federation over time. In a Sarawak State Government Assembly sittingin 2000, the need to review the escalating grant from the Federal Government to the State – perArticle 112D of the Federal Constitution – was raised.

37
exports from the State in 1992. The ostensible reason for the ban was to encourage thegrowth of wood-based industries in Sabah, though it is widely attributed to the Sabahruling party’s post-nomination, pre-election defection to the opposition in late 1990.The Sabah Chief Minister unsuccessfully argued that the ban was only acceptable withcompensation from the federal government for the State’s anticipated revenue loss. Thefederal Minister had initially stated that the State would be compensated. He laterclaimed that the federal government was not in a position to do so, after the ruling partyin Sabah had defected to the opposition (Wee, 1995: 22, 24).
In negotiations before the formation of Malaysia, Sabah and Sarawak politicians hadinsisted on Borneo-ization, i.e. staffing state civil services with Sabahans andSarawakians respectively, as a condition for joining the federation. Many in Sabah andSarawak still do not welcome the federal employees from the peninsular States, who aresaid to resent being sent there, to patronize the ‘locals’ or to take time to adjust to life inthe two States. Relations between Malaysians from the peninsula and ‘locals’ in theBorneo States have, however, improved over the years. Nevertheless, social andeconomic difficulties, e.g. perceived higher rates of graduate unemployment, canthreaten such relations, as in the past.
Although Sarawak was far more important historically in developing a sense ofnationalism, these movements were largely co-opted in the 1970s, when the SarawakUnited People’s Party (SUPP) and then the Sarawak National Action Party (SNAP)joined the ruling coalition. In contrast, Sabah’s status was rendered ambiguous byFilipino claims to territory once associated with the Sulu Sultanate. However, in recentdecades, tensions between the centre and the Sabah State Government have been greaterthan those between the centre and the Sarawak State Government. Suggestions ofsecession have surfaced during periods of tension.
The mid-1970s saw the federal government oust the Mustapha government in favour ofBerjaya. Tensions between the centre and Sabah rose again in the mid-1980s after PartiBersatu Sabah (PBS) defeated the incumbent Berjaya with strong support from theKadazandusun and ethnic Chinese communities. However, the PBS joined the rulingcoalition, in which it felt discriminated against. After the PBS defected to the oppositionduring the 1990 general elections, federal government discrimination against the PBSstate government – and the state – became more pronounced. However, this wasreversed when the national ruling coalition recaptured the state in 1994 by engineeringdefections from the PBS after it narrowly won the state election. Support for the PBShas since declined, and the leadership rejoined the ruling coalition in early 2002.
Before the 1990s, peninsula-based political parties did not operate in the Borneo States.After the heightened tensions between Sabah and the Federal Government in the 1980sculminated in Sabah’s ruling party, PBS, defecting to the opposition just before the1990 federal parliamentary elections, peninsular-based political parties began operatingin the State to undermine the PBS. The United Malays National Organization (UMNO),the most powerful party in the ruling national coalition, spread its wings to Sabah, evenaccepting non-Muslim Bumiputera members. After UMNO’s entry into and take-overof the State in 1994, a two-year rotating chief ministership replaced the previouslyrenewable full term chief ministership, still practiced in the other States. Sabah has

38
Table 16Sabah and Sarawak: net transfers of revenue from federal Government, 1966-1989 (RM million)
Sabah Sarawak
1966-70 1971-75 1976-80 1981-85 1986-88 1964-65 1966-70 1971-75 1976-80 1981-85 1986-89
Federal allocations 299 350 363 1,732 382 72 240 225 300 543 491
Federal expenditure 1,140 2,284 3,741 9,283 4,159 209 614 1,190 1,815 6,139 4,741
Total 1,439 2,634 4,104 11,015 4,541 281 854 1,415 2,115 6,682 5,232
Federal revenue 655 1,152 4,922 9,415 2,195 130 441 692 1,906 5,346 3,741
Petroleum royalty - 1 168 496 219 - - 109 355 940 547
Petroleum dividend* - - - 932* 751 - - - - 2,048* 2,474
Petroleum tax* - - 845 1,894 1,023 - - - 584 646 1,942
Total 655 1,153 5,935 12,737 4,188 130 441 801 2,845 8,980 8,704
% total federal revenue 7% 6% 13% 14% 6% 5% 4% 4% 6% 10% 10%
Net transfer 784 1,481 -1,831 -1,722 353 151 413 614 -730 -2,298 -3,472
* Petroleum dividend for the period 1983-85.
Source: Wee, 1995: Table 2.17.

39
since had two Muslim Chief Ministers, two Chinese Chief Ministers15 and one KadazanChief Minister who did not even finish his two-year term after losing in the 1999 Stateelections.
This happened in spite of lower net transfers out of Sabah – compared to Sarawak – tothe peninsula (Table 16). This may be due to poorer economic conditions in Sabahrelative to Sarawak. Federal domination has been consolidated since the mid-1990s withfederal patronage of a Muslim-Chinese elite alliance, not unlike the one that emerged inSarawak in the 1970s – and was consolidated in the 1980s – that has also marginalizednon-Muslim Bumiputeras.
Sarawak’s relatively large area, lower population density, huge rural constituencyareas,16 and State-level rivalries among its politicians have limited effective challengesfrom the State to the Federal Government. Citizens’ protests have mainly been in therural areas, where politically affiliated logging companies are active, and timberconcessionaires threaten ‘native’ communities’ claims to the forests for theirlivelihoods. Forests are a State matter, and hence, the protests have been directed at theState government. However, State politicians have been able to contain challenges fromrural protestors, who are often spread over vast areas and largely cut off from oneanother, to the politicians’ advantage. In fact, citizens’ protests against the StateGovernment of Sarawak have sometimes served to strengthen the State government’sautonomy. Symbiotic relations between federal and State politicians have also helpeddiffuse federal-State conflicts.17
9 Tensions between the centre and North East Peninsular Malaysia
At the time of Malayan independence in 1957, the ruling Alliance coalition gave lipservice to State autonomy in finances, as this had been the status quo, especially for thefive Unfederated Malay States of Johore, Kedah, Perlis, Kelantan and Terengganu18.However, according to the Malaysian Constitution, tax may be levied only by thefederal government or with the authority of federal law.19 State Governments can only
15 Although Sabah briefly had a Chinese Chief Minister right after joining Malaysia, other Malaysian
States, except for the predominantly Chinese State of Pulau Pinang, have never had a Chinese chiefminister.
16 Sarawak, the largest State in Malaysia, has an area of 124,499 square kilometres, while Sabah has anarea of 73,619 square kilometres, less than sixty per cent of Sarawak’s size. Sarawak has a smallerpopulation than Sabah. In 2000, the Sarawak population was 2.01 million, compared to 2.45 million inSabah.
17 State elections in Sarawak have also been held at different times than federal parliamentary elections,when federal politicians – to whom State politicians are allied – can help in political campaigns. Thishas been an incentive for politicians in the State ruling coalition to consolidate their alliance with theFederal Government ruling coalition. Sarawak has the most parliamentary seats, i.e. 27 of the 192 forthe whole nation. Symbiotic alliances with Sarawak politicians have given the federal ruling coalitionmore members of parliament, ensuring continued incumbency for both.
18 The chief minister of Kedah, for example, noted, on 25 July 1956, that Kedah had enjoyed greateradministrative autonomy before the Japanese Occupation during the Second World War.
19 In December 1999, the PAS State government in Terengganu was reported to have been consideringthe collection of an agricultural land tax known as kharaj. Since land is a State matter, kharaj wouldfall under the State government’s jurisdiction. Disputes between the State Government and the FederalGovernment over the issue eventually fizzled out as the Terengganu State government shelved itsplans.

40
borrow from the Federal Government or from sources approved by the FederalGovernment for up to five years.20
As noted earlier, Kelantan has been led by the Pan-Malaysian Islamic Party (PAS) formany years, and has long had conflicts with the Federal Government.21 PAS ruledKelantan from 1959, joined the expanded ruling coalition in 1973, and then was forcedout just before the 1978 state election, in which it lost Kelantan. During its years inpolitical opposition to the ruling coalition, Kelantan has been discriminated against interms of federal grant allocations. In the mid-1970s, PAS joined the ruling coalition fora few years and was rewarded with higher federal allocations for Kelantan. After PASrecaptured the state in 1990, Kelantan’s allocations have again been adversely affected.
In the federal and peninsular State elections of 1999, PAS made significant inroads,capturing Terengganu and many seats in Kedah and Pahang as well. Since then, theruling UMNO has sought to isolate and weaken the seemingly ascendant PAS, evenwithholding petroleum royalties previously paid directly to the Terengganu Stategovernment.
The government of the East Coast State of Terengganu filed a suit against Petronas andthe Federal Government on 8 March 2001 over this non-payment of petroleum royaltiesto the State.22 The Federal Government had told Petronas to stop paying petroleumroyalties to the Terengganu State Government. The Federal Government has divertedthe oil royalties to a discretionary fund for expenditure in the State under FederalGovernment and federal ruling coalition control.23 The Federal Government tookRM521,863,062 as special payment from Petronas for the people of Terengganu, which
20 ‘Borrowing’ is interpreted to include raising money by entering into an agreement whereby the
Government has to repay or refund any benefits it enjoys under the agreement (Constitution ofMalaysia, Article 111(2)). This constitutional amendment sought to overcome the Court’s decisionagainst the Federal Government argument that the agreement between the Kelantan State Governmentand a corporation for advance royalty payments amounted to borrowing (Shafruddin, 1987: 66-67).
21 Kelantan’s problems of insufficient financial resources date back to colonial times. A Memorandumof the Ex-Officio Members of the Kelantan State Executive Council in 1956 stated that there wereinsufficient development grants then for roads, land development and water supply (Records of theColonial Office).
22 Terengganu Economic Development, Petroleum and Human Resources Committee chairman MustafaAli said, ‘The action is taken since there is no clear signs (sic) that the rights to the royalty will begiven back to the government and people of Terengganu after they were taken away six months ago.The grounds given for the action against Petronas were breach of agreement signed with the Stategovernment, discrimination against the Terengganu Government, deprivation of property right (sic)without adequate compensation in breach of Article 13 of the Federal Constitution. That equitableestoppel does not enable the royalty payment to Terengganu, which had been going on for more than20 years, to be stopped and that Petronas ought not to have complied with illegal direction of thefederal government’ (Sarawak Tribune, 9 March 2001, ‘Terengganu govt files suit on oil royalty’).
23 It was reported that the Terengganu State Government will receive RM90 million from the FederalGovernment if the State runs a budget deficit. The Parliamentary Secretary to the Finance Ministrytold Parliament (Dewan Rakyat, or Lower House) that the allocation would be made after the Auditor-General’s Department verified that the State was experiencing a deficit. The RM90 million was part ofan initial allocation of RM400 million approved for 2000/2001 for the special fund established forTerengganu.

41
was credited into the trustee account of the special fund under Section 9 of the FinancialProcedures Act 1957.24
These conflicts between the Federal Government on the one hand and the oppositionPAS-held States of Terengganu and Kelantan on the other reflect party rivalries. Greaterelectoral support for PAS not only reflects resurgent Islamism’s growing politicalinfluence, but also greater marginalization, socio-economic deprivation, frustration anddissent in the two East Coast States. Both States have had the two highest incidences ofpoverty in the Peninsula from pre-independence days (according to Colonial Officerecords) despite Terengganu’s thriving economy two centuries ago and more recent oilwealth.
Apparently, development allocations to the states do not seek to reduce inter-state orinter-regional inequalities. The improved allocations for Kedah from the tenth highestduring the Third Malaysia Plan period (1976-80) to the sixth highest in the currentEighth Malaysia Plan period (2001-2005) is widely attributed to the Kedah-born PrimeMinister’s political concerns and provincialism. Conversely, Kelantan’s sharedeteriorated from seventh to tenth over the same period. Meanwhile, the allocation forSelangor rose from sixth highest to third highest. Similarly, the poor state ofTerengganu has also been allocated relatively less development funds, while the reversehas been true for the more developed state of Johor (Table 17 and Figure 5).
As stated earlier, the relatively greater funds allocated to the poor states of Sabah andSarawak – compared to their counterparts in the peninsula – have not been enough tocompensate for the states’ much large sizes (Table 18 and Figure 6). Sarawak wasfavoured from the 1980s, after the state ruling coalition was challenged from within,with the contending factions remaining within the national ruling coalition. However,no similar privileges have been accorded to the other poor states of Kelantan, Sabah andTerengganu, where opposition to the national ruling coalition has been stronger and ledto opposition control of the state governments. In fact, the relative per capita allocationto Sabah declined over the period reviewed (Table 19 and Figure 7) despite the growingincidence of poverty in the state.
10 Conclusion
The Federation of Malaya had a centralized administration developed towards the endof the British colonial period. The circumstances of the formation of the Federation ofMalaysia initially reversed this trend temporarily, with guarantees of greater autonomyfor Sabah and Sarawak to induce them to join the new Malaysian federation. However,centralization has advanced over the years since within the context of a federal system.
24 Up to mid-March, such spending included the Program Mesra Rakyat (Befriend the People)
(RM7,609,305), the Natural Disaster Fund (RM298,648), management of institutions of higherlearning in the State (RM40 million), the Terengganu Education Fund (RM35,595,450), welfareprogramme (RM500,000), the Special Entrepreneur Development Programme (RM1,908,392) and theSpecial Rural Development Programme (RM3,106,420) (Sarawak Tribune, 30 March 2001,‘Terengganu to receive RM90 million if in deficit’).
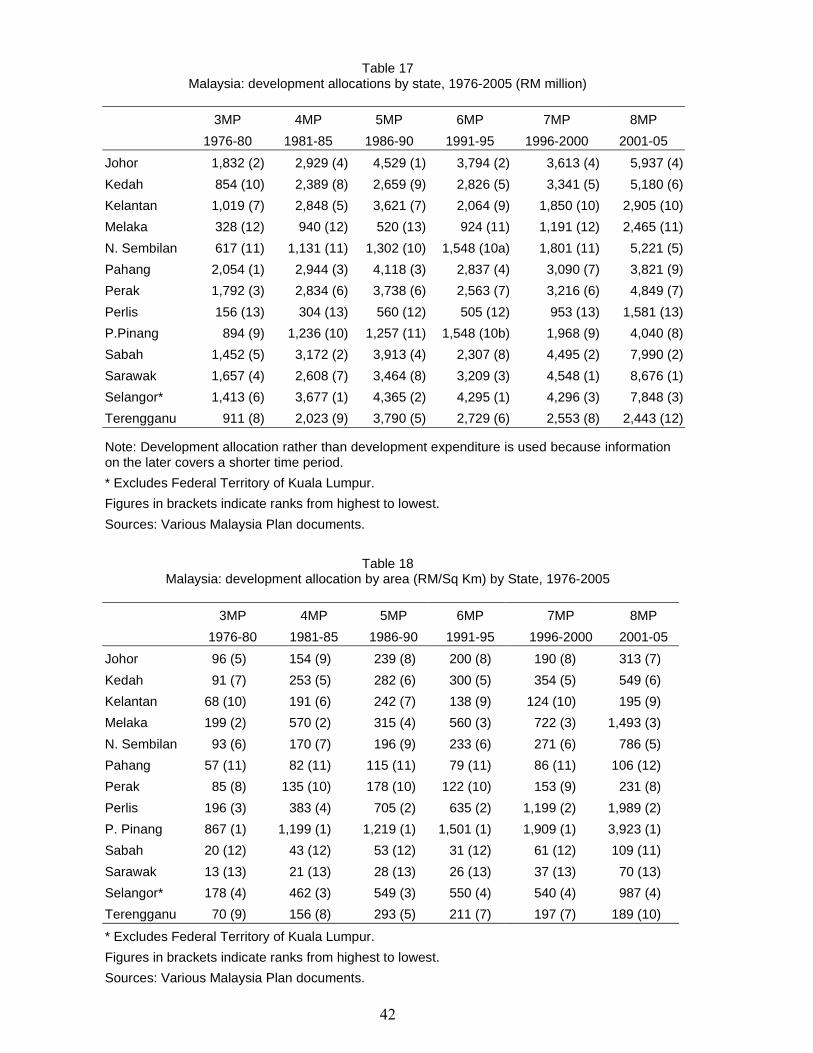
42
Table 17Malaysia: development allocations by state, 1976-2005 (RM million)
3MP
1976-80
4MP
1981-85
5MP
1986-90
6MP
1991-95
7MP
1996-2000
8MP
2001-05
Johor 1,832 (2) 2,929 (4) 4,529 (1) 3,794 (2) 3,613 (4) 5,937 (4)
Kedah 854 (10) 2,389 (8) 2,659 (9) 2,826 (5) 3,341 (5) 5,180 (6)
Kelantan 1,019 (7) 2,848 (5) 3,621 (7) 2,064 (9) 1,850 (10) 2,905 (10)
Melaka 328 (12) 940 (12) 520 (13) 924 (11) 1,191 (12) 2,465 (11)
N. Sembilan 617 (11) 1,131 (11) 1,302 (10) 1,548 (10a) 1,801 (11) 5,221 (5)
Pahang 2,054 (1) 2,944 (3) 4,118 (3) 2,837 (4) 3,090 (7) 3,821 (9)
Perak 1,792 (3) 2,834 (6) 3,738 (6) 2,563 (7) 3,216 (6) 4,849 (7)
Perlis 156 (13) 304 (13) 560 (12) 505 (12) 953 (13) 1,581 (13)
P.Pinang 894 (9) 1,236 (10) 1,257 (11) 1,548 (10b) 1,968 (9) 4,040 (8)
Sabah 1,452 (5) 3,172 (2) 3,913 (4) 2,307 (8) 4,495 (2) 7,990 (2)
Sarawak 1,657 (4) 2,608 (7) 3,464 (8) 3,209 (3) 4,548 (1) 8,676 (1)
Selangor* 1,413 (6) 3,677 (1) 4,365 (2) 4,295 (1) 4,296 (3) 7,848 (3)
Terengganu 911 (8) 2,023 (9) 3,790 (5) 2,729 (6) 2,553 (8) 2,443 (12)
Note: Development allocation rather than development expenditure is used because informationon the later covers a shorter time period.
* Excludes Federal Territory of Kuala Lumpur.
Figures in brackets indicate ranks from highest to lowest.
Sources: Various Malaysia Plan documents.
Table 18Malaysia: development allocation by area (RM/Sq Km) by State, 1976-2005
3MP
1976-80
4MP
1981-85
5MP
1986-90
6MP
1991-95
7MP
1996-2000
8MP
2001-05
Johor 96 (5) 154 (9) 239 (8) 200 (8) 190 (8) 313 (7)
Kedah 91 (7) 253 (5) 282 (6) 300 (5) 354 (5) 549 (6)
Kelantan 68 (10) 191 (6) 242 (7) 138 (9) 124 (10) 195 (9)
Melaka 199 (2) 570 (2) 315 (4) 560 (3) 722 (3) 1,493 (3)
N. Sembilan 93 (6) 170 (7) 196 (9) 233 (6) 271 (6) 786 (5)
Pahang 57 (11) 82 (11) 115 (11) 79 (11) 86 (11) 106 (12)
Perak 85 (8) 135 (10) 178 (10) 122 (10) 153 (9) 231 (8)
Perlis 196 (3) 383 (4) 705 (2) 635 (2) 1,199 (2) 1,989 (2)
P. Pinang 867 (1) 1,199 (1) 1,219 (1) 1,501 (1) 1,909 (1) 3,923 (1)
Sabah 20 (12) 43 (12) 53 (12) 31 (12) 61 (12) 109 (11)
Sarawak 13 (13) 21 (13) 28 (13) 26 (13) 37 (13) 70 (13)
Selangor* 178 (4) 462 (3) 549 (3) 550 (4) 540 (4) 987 (4)
Terengganu 70 (9) 156 (8) 293 (5) 211 (7) 197 (7) 189 (10)
* Excludes Federal Territory of Kuala Lumpur.
Figures in brackets indicate ranks from highest to lowest.
Sources: Various Malaysia Plan documents.

43
Table 19Malaysia: development allocation per capita by State, 1996-2000 (RM)
3MP
1976-80
4MP
1981-85
5MP
1986-90
6MP
1991-95
7MP
1996-2000
Johor 1,114 (6) 1,651 (11) 2,276 (6) 1,800 (6) 1,353 (11)
Kedah 761 (10b) 1,983 (6) 2,092 (8) 2,000 (5a) 2,115 (6)
Kelantan 1,207 (5) 2,892 (3) 3,231 (3) 1,700 (7) 1,215 (13)
Melaka 644 (11) 1,889 (8) 1,015 (13) 1,600 (8a) 2,008 (7)
N. Sembilan 1,003 (7) 1,833 (9) 1,979 (10) 2,100 (4) 2,153 (5)
Pahang 2,885 (1) 3,378 (2) 3,574 (2) 2,700 (2a) 2,393 (3)
Perak 930 (9) 1,464 (12) 1,861 (11) 1,200 (10) 1,518 (9)
Perlis 761(10a) 1,911 (7) 3,162 (4) 2,700 (2b) 4,213 (1)
P. Pinang 935 (8) 1,222 (13) 1,137 (12) 1,499 (9) 1,578 (8)
Sabah 1,762 (2) 2,797 (4) 2,712 (5) 1,600 (8b) 1,513 (10)
Sarawak 1,372 (4) 1,851 (10) 2,059 (9) 2,000 (5b) 2,244 (4)
Selangor* 643 (12) 2,444 (5) 2,145 (7) 2,200 (3) 1,347 (12)
Terengganu 1,732 (3) 3,391 (1) 5,346 (1) 3,700 (1) 2,470 (2)
* Excludes Federal Territory of Kuala Lumpur.
Figures in brackets indicate ranks from highest to lowest.
Source: Calculated with data from various Malaysia Plans and Yearbook of Statistics, Malaysia.
Consequently, State Governments have surrendered various functions to the FederalGovernment for various reasons, including lack of fiscal resources. In response, StateGovernments – including those led by members of the ruling Barisan Nasional coalition– have requested reassigning certain revenues from the Federal Government to Statecoffers.25 Such views have been most strongly expressed by representatives of theBorneo States of Sabah and Sarawak as well as Terengganu asking for higher petroleumroyalties for their States. As founding members of the Malaysian Federation, the BorneoStates have emphasized that they had expected net transfers of public funds in theirfavour – rather than the converse – from joining the federation. Instead, there isconsiderable evidence of a significant drain of economic resources away from the twoStates to national (Kuala Lumpur) and regional centres (Singapore, Hong Kong,Australia, New Zealand). Consequently, many in the Borneo states are of the view thattheir expectations from joining the Malaysian federation have been betrayed.
Over the decades, Federal Government financing for State Governments has shiftedfrom grants to loans, further reinforcing federal control of the States. While disbursingloans – instead of grants – may require greater accountability on the part of the StateGovernments, expecting repayment is unrealistic because of the State Governments’limited revenue sources. However, the loans enable the Federal Government to assert 25 During the colonial era, State Governments also requested reassigning certain revenues from the
Federal Government to the State Governments, in one case reflecting conflicts between Kedah andsome southern States of the peninsula. The conflicts included the imposition of export duties forcertain exports to Singapore and the ban on exports of certain tree species.

44
greater control over the State governments, particularly when they are run by oppositionparties or coalitions, or even by more independently minded members of the rulingcoalition. Among the Malaysian States not under opposition control, the Sarawak Stategovernment probably enjoys most autonomy after the successful entry of UMNO intoSabah (Lim, 1997). Although the Borneo States have more constitutionally guaranteedautonomy than the Peninsular Malaysian States, they probably suffer greater abuse andpoverty, partly because their greater autonomy has been abused by self-serving politicalbusiness elites.
In short, economic resource (especially petroleum, gas and timber) extraction andpolitical competition have reshaped federalism in Malaysia. This has led to the‘politicization’ and manipulation of the original terms of Malaysian federalism –especially federal-state relations with regard to finances – to force opposition-heldStates to capitulate and, in the event of failure to do so, to ‘buy votes’ for recapture ofthose States. Such tactics have exacerbated federal-State conflicts and previouslyencouraged occasional threats to secede in the absence of any federal governmentindication of willingness to reform more equitably, e.g. through devolution or fiscalreform.
While federal arrangements may well be superior to unions or unitary states in dealingwith regional diversity, this paper has suggested that the overwhelming power of thecentre (federal government) at the expense of the States has increased over time sinceMalayan independence in 1957 and the creation of the Malaysian federation in 1963.Undoubtedly, the federal government has successfully used – and abused – its authorityand powers to overcome regional political opposition expressed in the capture of Stategovernments. This has enabled the federal government to secure the bulk of petroleumrents extracted from the States, especially Sabah, Sarawak and Terengganu.
The apparently generous fiscal transfers from the centre to these petroleum rich Statesactually obscure the considerable oil rent transfers to the centre from these States. Someof this seeming generosity has been due to the terms of the Borneo States’ entry into theMalaysian federation as well as the earlier hints of secession or demands for greaterregional autonomy as options, especially before the 1990s. However, resource transfersfrom the States to the federal centre are not obvious to most in Sabah and Sarawak, andhave probably been obscured by the regional elites’ rapacious and ostentatiousaccumulation and abuse of timber wealth.
Continued access to this dwindling source of natural resource wealth has probably alsodeterred the States’ elites from challenging the centre’s claim to most petroleumresource rents. As timber resources are exhausted, these elites will inevitably turn theirsights to the oil and gas offshore, but since they have never really claimed these mineralresource rents strongly before, their belated efforts may not enjoy much popularlegitimacy and potential for political mobilization, let alone succeed.
Not surprisingly, there continues to be considerable resentment in the two Borneo Statesof the federal government, expressed in various changing ways over time.26 However,for the time being, the challenges from the Borneo States – which peaked in the 1980s –seem to have receded with the consolidated hegemony of Muslim-Chinese-led 26 Including bloody fights between troops recruited from Sarawak and those deployed from the peninsula, or
in the especially strong support for Borneo football teams playing against teams from the peninsula.

45
consociational elite alliances. While non-Muslim Bumiputeras have becomeincreasingly alienated, most do not see any alternative in the short term, but to make themost of patronage by these alliances. Things seem to have changed in recent years,however, with the ultimate central control over the Sabah government since 1994, andthe dependence of the Taib government for central support since the failed ‘palacecoup’ in 1987 known as the Ming Court Hotel affair, and the more recent Muslim-Malay challenge to his supposed ‘Melanau clique’ control.
With the declining legitimacy of the ruling Barisan Nasional (National Front) coalitionamong Muslim Malays in the peninsula, especially after the sacking of then DeputyPrime Minister Anwar Ibrahim in September 1998, and the federal government’sincreased demonization and persecution of the Islamist Parti Islam SeMalaysia (Pan-Malaysian Islamic Party, or PAS) after its electoral gains in the November 1999 federalelections, it has used the federal financial system to put the two PAS-held States undergreater fiscal pressure, especially by depriving the State of Terengganu of its petroleumroyalty payments. With increased support for the opposition in Kedah and Pahang, it isquite possible that the ruling coalition’s drive against the opposition will be reflected innew abuses of Malaysian federalism, especially federal-state finances.
It therefore seems quite likely that the federal system may be further de-legitimized andeven undermined in Malaysia, not only by persistent frustrations in the Borneo States,but also by greater opposition from those States in the peninsula disaffected with thecurrent regime. For the time being though, the successful reconfiguration of ethnicpolitics in the Borneo States – with hegemonic Muslim-Chinese elite alliances andhapless large non-Muslim Bumiputera minorities – has contained the challenge fromSabah and Sarawak.
However, the increasingly ham-fisted ‘choking’ of the Peninsular Malaysian Malayopposition, especially through discriminatory treatment of the two PAS-held States ofKelantan and Terengganu, could well further undermine the legitimacy of existingfederal arrangements, with possibly unpredictable consequences. While this politicalrivalry is currently primarily understood in terms of the Malay supremacist UMNOversus the Islamicist PAS, its political expression – in terms of the unilateral reorderingof previous federal financial arrangements to deprive the opposition State governmentsof fiscal means – could well unintentionally provoke regional responses which mayundermine the very legitimacy and unity of the Malaysian federation.
Political developments since late 1998 continued to erode and undermine the legitimacyof Prime Minister Mahathir’s leadership, especially among ethnic Malays in thenorthern and central States of Peninsular Malaysia, although his acceptability amongnon-Malays did not change much after his unprecedentedly large electoral victory of1995 until events from 2000 – the al-Maunah arms heist and its aftermath, the 11September 2001 terror attacks in the US and the Bush-led anti-terror campaign as wellas the Terengganu state government’s insistence on legislating onerous ostensiblyIslamic hudud punishments in mid-2002. It also appears that the ruling Barisan Nasionalcoalition has managed to secure acceptance as the only viable option in the BorneoStates despite festering non-Muslim Bumiputera frustrations as well as Malayopposition to the incumbent Chief Minister of Sarawak. Meanwhile, the continuingheavy-handed ruling coalition responses to the Islamic Party’s electoral success in theNovember 1999 general elections, including PAS victories in Kelantan and Terengganu,may sustain growing regional tensions within Peninsular Malaysia, even if unintended.

46
BibliographyAbang Karim bin Abang Openg (1999). ‘Private Sector Participation’. In Seminar on
‘The Sarawak Economy in the New Milenium’. Jointly organized by the MARAInstitute of Technology, Sarawak and the Sarawak Development Institute, Kuching.
Auditor-General, Malaysia. Federal Public Accounts. Various issues.
Auty, Richard (2001). Resource Abundance and Economic Development. OxfordUniversity Press, Oxford.
Bank Negara Malaysia. Quarterly Economic Bulletin. Various issues.
Butcher, John (2001). ‘May 13: A Review of Some Controversies in Accounts of theRiots’. In Jomo K. S. (ed.) Reinventing Malaysia. Penerbit Universiti KebangsaanMalaysia, Bangi, Selangor: 35-56.
Department of Statistics. Handbook of Statistics, Malaysia. 1999.
Department of Statistics. Social Statistical Bulletin. 1999.
Department of Statistics. State/District Data Bank. 1999.
Department of Statistics. Yearbook of Statistics, Malaysia, 1999 http://www.census.gov/
Gomez, E. T. and Jomo K. S. (1999). Malaysia’s Political Economy: Politics,Patronage and Profits. Second Edition. Cambridge University Press, Cambridge.
Holzhausen, W. (1974). Federal Finance in Malaysia. Penerbit Universiti Malaya,Kuala Lumpur.
Jomo K. S. (1989). Beyond 1990: Considerations for a New National DevelopmentStrategy. Institute of Advanced Studies, University of Malaya, Kuala Lumpur.
Jomo K. S. (1990). Growth and Structural Change in the Malaysian Economy.Macmillan, London.
Jomo K. S. (ed.) (1990). Undermining Tin: The End of Malaysian Pre-eminence,Transnational Corporations Research Project, University of Sydney, Sydney.
Jomo K. S. and E. T. Gomez (1997). ‘Rents and Development in Multiethnic Malaysia’.In Masahiko Aoki, Hyung-Ki Kim and Masahiro Okuno-Fujiwara (eds) The Role ofGovernment in East Asian Economic Development. Oxford University Press, NewYork: 342-72.
Kamal Salih and Zainal Aznam Yusof (1989). ‘Overview of the New Economic Policyand Framework for the Post-1990 Economic Policy’. Paper presented in KualaLumpur, 31 July - 1 August; later published in Malaysian Management Review.
Khoo Boo Teik (1995). Paradoxes of Mahathirism. Oxford University Press, KualaLumpur.
Khoo Khay Jin (1992). ‘The Grand Vision: Mahathir and Modernization’, in Kahn,Joel S. and Francis Loh Kok Wah (eds) Fragmented Vision: Culture and Politics inContemporary Malaysia. Allen & Unwin, Sydney.
Khor Kok Peng (1983). The Malaysian Economy: Structure and Dependence. Maricans,Kuala Lumpur.

47
Leigh, Michael B. (1971). ‘The Development of Political Organizations and Leadershipin Sarawak, East Malaysia’. Ph.D. thesis, Cornell University, Ithaca, New York.
Leigh, Michael B. (1988). The Rising Moon: Political Change in Sarawak. SydneyUniversity Press, Sydney.
Lim Hong Hai (1997). ‘Sabah and Sarawak in Malaysia; the Real Bargain or WhatHave They Gotten Themselves Into?’. In Francis Loh Kok Wah (ed.) Sabah andSarawak, the Politics of Development and Federalism. Special issue of Journal ofMalaysian Studies, 15(1&2), January/December: 15-81.
Low Wah Yun, Siti Norazah Zulkifli, Wong Yut Ling and Khairuddin Yusof (1996).‘Dawn of a New Millennium: Future of Public Health Issues in Malaysia’. In Issuesand Challenges of Public Health in the 21st Century. Social Obstetrics andGynaecology Unit, Faculty of Medicine, University of Malaya, Kuala Lumpur: 191-232.
Mahathir Mohamad (1991). ‘Malaysia: The Way Forward’. Speech delivered at theinauguration of the Malaysian Business Council, ISIS, Kuala Lumpur.
Malaysia (1971). Second Malaysia Plan, 1971-1975. Economic Planning Unit, PrimeMinister’s Department, Kuala Lumpur.
Malaysia (1973). Mid-Term Review of the Second Malaysia Plan, 1971-1975. EconomicPlanning Unit, Prime Minister’s Department, Kuala Lumpur.
Malaysia (1976). Third Malaysia Plan, 1976-1980. Economic Planning Unit, PrimeMinister’s Department, Kuala Lumpur.
Malaysia (1979). Mid-Term Review of the Third Malaysia Plan, 1976-1980. EconomicPlanning Unit, Prime Minister’s Department, Kuala Lumpur.
Malaysia (1981). Fourth Malaysia Plan, 1981-1985. Economic Planning Unit, PrimeMinister’s Department, Kuala Lumpur.
Malaysia (1984). Mid-Term Review of the Fourth Malaysia Plan, 1981-1985. EconomicPlanning Unit, Prime Minister’s Department, Kuala Lumpur.
Malaysia (1986). Fifth Malaysia Plan, 1986-1990. Economic Planning Unit, PrimeMinister’s Department, Kuala Lumpur.
Malaysia (1989). Mid-Term Review of the Fifth Malaysia Plan, 1986-1990. EconomicPlanning Unit, Prime Minister’s Department, Kuala Lumpur.
Malaysia (1991a). Sixth Malaysia Plan, 1991-1995. Economic Planning Unit, PrimeMinister’s Department, Kuala Lumpur.
Malaysia (1991b). Second Outline Perspective Plan, 1991-2000. Economic PlanningUnit, Prime Minister’s Department, Kuala Lumpur.
Malaysia (1994). Mid-Term Review of the Sixth Malaysia Plan, 1991-1995. EconomicPlanning Unit, Prime Minister’s Department, Kuala Lumpur.
Malaysia (1996). Seventh Malaysia Plan, 1996-2000. Economic Planning Unit, PrimeMinister’s Department, Kuala Lumpur.
Malaysia (1999). Mid-Term Review of the Seventh Malaysia Plan, 1996-2000.Economic Planning Unit, Prime Minister’s Department, Kuala Lumpur.

48
Malaysia (2001a). Third Outline Perspective Plan, 2001-2010. Economic PlanningUnit, Prime Minister’s Department, Kuala Lumpur.
Malaysia (2001b). Eighth Malaysia Plan, 2001-2005. Economic Planning Unit, PrimeMinister’s Department, Kuala Lumpur.
Ministry of Finance, Malaysia. Economic Report. various issues
Musgrave, Richard (1983). ‘Who should tax, where and what?’. In C. E. McLure, Jr.(ed.) Tax Assignment in Federal Countries. Australian National University Press,Canberra: 2-19.
Okruhlik, Gwenn (1999). ‘Rentier Wealth, Unruly Law and the Rise of Opposition’.Comparative Politics, 31(April).
Poulgrain, Greg (1998). The Genesis of Konfrontasi. Hurst, London.
Rao, V. V. Bhanoji (1976). National Accounts of West Malaysia, 1941-1971,Heinemann Educational Books, Singapore.
Ross, Michael L. (1999). ‘The Political Economy of the Resource Curse’. WorldPolitics, 51 (January).
Ross, Michael L. (2001). ‘Does Oil Hinder Democracy?’. World Politics, 53 (April):325-61.
Sachs, Jeffrey D. and Andrew M. Warner (1999). ‘The Big Push, Natural ResourceBooms and Growth’. Journal of Development Economics, 59 (February).
Sarawak Tribune. 9 March 2001.
Sarawak Tribune. 30 March 2001.
Shafruddin, B. H. (1987). The Federal Factor in the Government and Politics ofPeninsular Malaysia. Oxford University Press, Singapore.
Supian Haji Ali (1988). ‘Malaysia’. In Gus Edgren (ed.) The Growing Sector: Studies inPublic Sector Employment in Asia. ILO-ARTEP, New Delhi.
Tornquist, Olle (1990). ‘Rent Capitalism, State and Democracy: A TheoreticalProposition’. In Arief Budiman (ed.) State and Civil Society in Indonesia. MonashPapers on Southeast Asia No. 22, Monash University, Clayton, Victoria.
Umikalsum Haji Mohd Noh (1992). ‘Fiscal Federalism in Malaysia, 1971-1987’. Ph.D.thesis, Faculty of Economics and Administration, University of Malaya, KualaLumpur.
Various State Financial Statements.
Wee Chong Hui (1995). Sabah and Sarawak in the Malaysian Economy. Institute ofSocial Analysis, Kuala Lumpur.
Wee Chong Hui (1996). ‘Fiscal Federalism’. In Jomo K. S. and Ng Suew Kiat (eds)Malaysia’s Economic Development: Policy and Reform. Pelanduk Publications,Kuala Lumpur: 277-316.