
The Political Economy of Inclusive Agricultural Growth · The Political Economy of Inclusive...
39
The Political Economy of Inclusive Agricultural Growth Michael R. Carter† University of California, Davis; NBER, Giannini Foundation John Morrow University of Essex and CEP, LSE September 2015 Abstract Commentators on the ‘East Asian Miracle’ of inclusive growth often credit win-win or shared growth policies for the region’s economic success. In agriculture, the state provided public goods that underwrote rapid, inclusive growth and poverty reduction. While sensible, these policies were neither surprising nor miraculous. Why then were these policies chosen in East Asia but less frequently elsewhere? To explore this question, this paper assembles a two- period, integrated political-economy model. The model reveals that when initial inequality is low (as it was in East Asia), the only political economic equilibrium is one in which public goods are provided. When inequality (or agricultural risk) is high, the model admits multiple equilibria, including one with minimal public good provision. We discuss ways in which some policies (e.g., those that reduce risk in the agricultural sector) may create knock-on effects by bringing high public good equilibria into the range of feasible political outcomes. JEL Codes: O1, D2, H4, Q1. Keywords: Poverty traps, political increasing returns, inequality, class formation. Acknowledgments. We thank Yasushi Asako, Teodora Borota, Swati Dhingra, Shuhei Kitamura, Yu-Hsiang Lei, Fidel Perez, Shen Qu, Liam Wren-Lewis, Jisang Yu, anonymous referees and seminar participants at the JICA-SOAS Workshop on Institutional Foundation of Inclusive Development in Africa, SITE Institu- tional Challenges in Emerging Economies, GPEN-CGR, Namur, Chulalongkorn, University of California- Davis, University of California-Merced, University College Dublin, European Public Choice Society, Royal Economic Society, 5th GREThA Conference on Economic Development, 2nd InsTED Workshop, Univer- sity of Essex, Econometric Society and University of Alicante. †Corresponding Author: Department of Agricultural & Resource Economics, University of California, Davis, CA 95618; 530.752.4672 (phone); 530.752.5614 (fax); [email protected]
Transcript of The Political Economy of Inclusive Agricultural Growth · The Political Economy of Inclusive...
The Political Economy of Inclusive Agricultural Growth
Michael R. Carter†University of California, Davis;
NBER, Giannini Foundation
John MorrowUniversity of Essex and CEP, LSE
September 2015
Abstract
Commentators on the ‘East Asian Miracle’ of inclusive growth often credit win-win orshared growth policies for the region’s economic success. In agriculture, the state providedpublic goods that underwrote rapid, inclusive growth and poverty reduction. While sensible,these policies were neither surprising nor miraculous. Why then were these policies chosen inEast Asia but less frequently elsewhere? To explore this question, this paper assembles a two-period, integrated political-economy model. The model reveals that when initial inequality islow (as it was in East Asia), the only political economic equilibrium is one in which publicgoods are provided. When inequality (or agricultural risk) is high, the model admits multipleequilibria, including one with minimal public good provision. We discuss ways in which somepolicies (e.g., those that reduce risk in the agricultural sector) may create knock-on effects bybringing high public good equilibria into the range of feasible political outcomes.
JEL Codes: O1, D2, H4, Q1.
Keywords: Poverty traps, political increasing returns, inequality, class formation.
Acknowledgments. We thank Yasushi Asako, Teodora Borota, Swati Dhingra, Shuhei Kitamura, Yu-HsiangLei, Fidel Perez, Shen Qu, Liam Wren-Lewis, Jisang Yu, anonymous referees and seminar participants atthe JICA-SOAS Workshop on Institutional Foundation of Inclusive Development in Africa, SITE Institu-tional Challenges in Emerging Economies, GPEN-CGR, Namur, Chulalongkorn, University of California-Davis, University of California-Merced, University College Dublin, European Public Choice Society, RoyalEconomic Society, 5th GREThA Conference on Economic Development, 2nd InsTED Workshop, Univer-sity of Essex, Econometric Society and University of Alicante. †Corresponding Author: Department ofAgricultural & Resource Economics, University of California, Davis, CA 95618; 530.752.4672 (phone);530.752.5614 (fax); [email protected]
1 Introduction
Twenty years ago scholars and practitioners of economic development paused to consider themeaning of the ‘East Asian Miracle’ of rapid and inclusive economic growth. Standing in sharpcontrast to the miracle of East Asia were Latin America and Africa, described by some as miredin vicious circles of modest and exclusionary growth. While much was learned about the sharedgrowth policies that helped create inclusive development in East Asia (Page (1994)), there wasalso a revisionist reminder that policymaking is not cookery, and that successful recipes form onelocale will not necessarily be replicated elsewhere by a set of politically disinterested chefs. Inother words, the revisionist question was not what was done differently in East Asia, but why didpolitical actors choose different policies there than they did elsewhere in the global South.
These questions stand out in particularly strong relief in the agricultural sector. While theWorld Bank’s East Asian Miracle study (World Bank (1993)) focussed on industrial and macroe-conomic policies, this seminal study noted that rapid agricultural growth underwrote the overallEast Asian economic growth experience. The more recent monograph by Fan and Brzeska (2010)digs more deeply into the policy choices that supported rapid East Asian agricultural growth andrural poverty reduction. These authors highlight as key a suite of public good investments in bothmaterial (roads, schools), knowledge (agricultural research) and institutional (finance, credit andmarketing cooperatives) infrastructure. Following work such as Fan and Pardey (1992), Fan andBrzeska note that conventional growth accounting misses the role of these public goods in creatingimprovements in use and productivity of the standard factors of production.
While other authors have attempted to distill the agricultural policy lessons from East Asia forother world regions (e.g., see Carter and Coles (1998) on Latin America), our goal in this paper isto explore the political economy behind the policy choices that do, or do not, promote the kind ofinclusive agricultural growth pattern observed in East Asia. While other commentators (includingWorld Bank (1993) and Fan and Brzeska (2010)) note in passing that East Asian policymakingtook place in the wake of redistributive land reforms (instituted in most cases by foreign powersfollowing their own logic), we explicitly model the connection between the wealth distribution andpoliticians’ delivery of inclusive growth.
At the heart of our analysis is an integrated political economy model wherein shareable publicgoods (access to markets and information on new technologies) enhance the returns to privateinvestment (say, in technologically improved inputs), but they do not replace it. While large-scale private producers can build their own roads or hire their own technical experts, governmentprovision of these public goods can not only increase growth (by crowding-in private investmentby small-scale producers), it can reduce inequality by creating inclusive growth, as it facilitatesthe transition of low wealth individuals from subsistence to more remunerative, petty commercial
1
production. But, because the benefit of public goods varies by asset level, so does the willingnessto pay for them through taxes. Under a linear tax scheme, large-scale producers, who wouldotherwise invest in their own roads and experts, pay more in taxes than they receive back in publicgoods. Ironically, the small-scale marginal commercial producers who stand to benefit most frompublic goods are limited in their ability to pay taxes and, or make political contributions to securethe public good because every dollar of tax or political contribution reduces funds available tomake the investment required to benefit from the public good.
Assembling these considerations into a formal two period framework, we model agents’ en-dogenous production strategies around which political lobbies form. We show that the emergentequilibrium policy is sensitive to the initial distribution of wealth.1 Wealth conditions not onlythe set of voters in favor of public goods, but the strength of their preferences through campaigncontributions. This sets in motion increasing political returns: public good commitments openup new productive possibilities to voters, who can use their newfound income to lobby and politi-cally enforce these commitments. Accordingly, the model can exhibit multiple equilibria. Crediblepromises of large leaps (perhaps by committed governments or charismatic leaders) may be nec-essary to move from low to high growth outcomes.2
For these reasons, inclusive growth policies, i.e. policies that increase public goods to rational-ize widespread commercial participation, are more likely under lower inequality scenarios. Politi-cal equilibria which fail to provide any public goods coincide with societies that fail to maintain amiddle class. Conversely, societies with a stronger incipient middle class capable of transitioningto commercial production will provide more public goods. Notably, the class division of soci-ety varies by the implicit strength of classes under the same productive possibilities, as opposedto being technologically determined (e.g. Matsuyama, 2006). From this perspective, the exten-sive land reforms carried out in Japan, Korea and Taiwan designed to create a prosperous class ofcommercially oriented farmers may have laid the foundation for future successes.3,4
The remainder of this paper is dedicated to taking seriously the suggestion that inclusive growthrequires that lower wealth agents be of interest to both economic and political entrepreneurs. Thus,this paper models political economy in the spirit of work such as Roemer (1982) and Eswaran andKotwal (1986) and thereby provides a complementary mechanism in ‘stagnation to growth’ storiesof development.5 Previous work has noted the crucial role of non-convexities in accumulation and
1This can lead to multiple equilibria consisting of both low and high levels of public good provision. See Olovssonand Roine (2008) for a literature overview and an example in the case of public education.
2This formalizes insights by Pierson (2000) regarding the consequences of increasing returns in politics.3For a detailed analysis of the political consequences of land reform in Japan, see Kitamura (2013).4It is additionally possible that low inequality prefigured inclusive institutions which interacted with export led
growth to encourage successful institutions akin to (Acemoglu et al., 2005).5Existing theories depict the role of technology, financial development, accumulation, institutional development
and evolving social preferences (Doepke and Zilibotti, 2005), and export led growth (Akerman et al., 2013). However,
2
the importance of different production modes (e.g. Galor et al. (2009)). Distinct from previouswork where inequality is mediated through labor or credit markets, here we focus on the role ofclass-based politics wherein groups rather than individuals attempt to circumvent market imper-fections.6 The unique insight of our special interest politics approach is that increased productivepossibilities, such as those of an emerging middle class, can further power reforms when moneymatters in politics.
Finally, as pointed out by Acemoglu and Robinson (2013), the analysis of economic policyneeds to include the consequences for political outcomes, as otherwise ‘good economic policy canmake bad politics’. We have discussed why reductions in inequality may have political knock-on effects through political increasing returns. However, this is not the only (or most pragmatic)policy space in which we might expect to see political shifts flowing from economic policy (Dixit,1997). Risk and isolation can trap large numbers of households at low levels of income, makingthem of little interest to both economic and political entrepreneurs.7 In this circumstance, the latterhave little to gain from offering policies designed to appeal to the trapped population. Thereforeeven economies with relatively modest levels of asset inequality may operate like high inequalityeconomies, with politicians eschewing investment in shared growth-promoting public goods infavor of other pathways to political power. This suggests an emphasis on economic policies thatbreak or relax the poverty trap logic, thereby changing the political calculus in ways that wouldmake inclusive growth policies more likely and self-sustaining.
The remainder of this paper is organized as follows. Section 2 revisits the earlier East Asianmiracle debate. Section 3 lays out an economy in which voters endogenously adopt technology,which determines their material interests in shared growth. Section 4 formalizes a political econ-omy model that codifies insights that emerged from the debate about the impact of initial assetinequality and risk on endogenous policy choices. Section 5 considers the impact of isolation andrisk on policy choices and the potential for positive political externalities. Section 6 concludes.
2 Theoretical Foundations of Inclusive Growth
The observation that East Asian economies simultaneously experienced rapid growth with low anddiminishing inequality provoked a rethinking of the linkages between growth and inequality.8 This
the role of democracy in jointly directing the public and private sector is often neglected (Sen et al., 1990).6See, for instance, the review of Matsuyama (2011).7Such households are likely those that would additionally face expropriation risk in the absence of broadly acces-
sible property rights as emphasized by other authors, see Chapter 13 of Ferguson (2013).8The World Bank’s The East Asian Miracle (Page, 1994), as well as debates (Rodrik, 1994; Wade, 2004), and
follow-up work reported in Aoki et al. (1998), played important roles in sparking this rethinking. The aptly namedbook, Beyond Tradeoffs: Market Reform and Equitable Growth in Latin America, (Birdsall et al., 1998) emerged fromthis discussion and was intended to be a policy primer to enable Latin American governments to emulate the inclusive
3
section considers the micro-foundations for such linkages, using them as a springboard to launcha deeper exploration of the political economy of inclusive growth.9
There is in fact no shortage of theoretical papers that establish foundations for that linkage.To pick one example, Ljungqvist (1993) explores how the absence of capital and insurance mar-kets leads poor people to under invest in human capital. Holding per-capita income constant, anincrease in inequality will push more people below the income threshold where human capitalunderinvestment begins.10
Similarly, there is a large literature that shows that imperfect rural financial markets can createan economic dynamic that squeezes out low wealth producers.11 Similar to Lunqvist’s analysis,increases in asset inequality that push more individuals beyond the reach of financial marketsimplies a deepening pattern of exclusion. From these theoretical perspectives, the sensitivity ofthe income distribution consequences of growth to initial inequality rests squarely on financialmarket failures. The theories of credit rationing12 that explain these sorts of wealth biased financialmarket failures are essentially saying that low wealth agents are of no interest to the economicentrepreneurs on the supply side of financial markets. Facing these issues, East Asian governmentsundertook measures that bolstered the competitiveness of small farm sector.13 These shared growthpolicies reshaped markets in ways that enabled the small farm sector to flourish and underwrote aninclusive growth strategy.14
These observations are consistent with those of Aoki et al. (1998). Like others writing inthis area, these authors note that East Asian governments engaged in a wide range of policies,which they describe as “market enhancing,” meaning that the state carefully intervened in thoserealms where markets work least well (e.g., providing capital and insurance), and by so doingenabled markets to then effectively coordinate fundamental decisions of resource allocation andinvestment.
Others have noted this disciplined intervention of East Asian states, and some have tried toexplain it in terms of a disciplined culture or a Confucian ethic of public service. In contrast,
growth patterns observed in East Asia.9Appendix ?? briefly reviews some of the macro-econometric evidence about these linkages.
10Krebs (2003) further shows that these effects are large, to the extent that government sponsored insurance is likelywelfare improving, even if financed in a second-best fashion.
11The dynamic stochastic programming analysis of Zimmerman and Carter (2003) shows how these missing marketscan create exclusionary patterns in which initial asset inequality deepens over time. Work on agricultural growth boomsin Latin America, summarized by Carter and Barham (1996), finds empirical evidence of many of these same patterns.
12See for example Stiglitz and Weiss (1981) for a general treatment of credit rationing, and Carter (1988) andBoucher et al. (2007) for extensions and applications to rural financial markets.
13A quick review shows that agricultural policy in Japan, Taiwan and Korea shows a common emphasis on smallfarm credit, extension and price stabilization. For a brief overview of rural and agricultural policy concerns andobjectives, see Wye Group (2011).
14Indeed, even within highly advanced economies, the exclusion of farmers from agricultural support programs cancause rapid and drastic exit from commercial production Cowan and Feder (2012).
4

Aoki et al. (1998) suggest a material explanation for this disciplined state behavior. Low levelsof initial inequality (and a weak elite) in East Asia implied that the only viable constituency for agovernment seeking political support was a broadly-based one built around shared growth policies.Agricultural policy provides one of the clearest examples of the endogeneity of a broadly-basedor shared growth strategy to low levels of initial inequality. Land reform in much of East Asianot only deeply redistributed land ownership rights, but also imposed land ownership ceilings ofonly a few hectares. Aoki et al. speculate that the absence of a strong rural elite deprived EastAsian governments of a politically influential target group for the sorts of divisible and privatelyappropriable goods which governments so often provision to develop the rural sector.15
Instead, policy focused on discovering and providing the key indivisible, quasi-public goodsthat markets were ill-conditioned to offer: goods which are difficult to exclude (roads),16 thatinvolve large fixed costs (dams, R&D),17 or face coordination problems (irrigation and sanitationsystems)18. In addition, governments targeted institutional innovations to open credit and insuranceoptions. What other observers of East Asian agricultural policy have attributed to an exogenousobjective of shared growth (Tomich et al., 1995) is, in the argument of Aoki et al., a product of lowinitial inequality operating through a political economy circuit. The next section will model thisintuition with a political economy of shared growth policies.
3 Asset Inequality and the Politics of Shared Growth
This section offers our core economic model designed to shed light on the economic and politi-cal forces that determine whether governments choose to provide tax-financed public goods thatcomplement private investment, or whether they choose a low tax rate regime which allows indi-viduals to enjoy more private goods. The implicit underlying role of public good provision canbe thought of as a second-best policy which encourages high productivity activities when incom-plete financial markets otherwise constrain agents, thus generating inclusive growth.19 Under ourmodel, the complementary value of public goods depends on an individual’s wealth, which impliesheterogeneous preferences for the level of public good expenditure. In particular, public goods areespecially valuable for those enabled to transition from subsistence to commercial production.20
15E.g. subsidized credit, machinery subsidies, investment credits, etc.16When geographically separate ethnic concentrations make roads functionally excludable, public investment is
likely misallocated as Burgess et al. (2013) find.17Dams also present coordination issues due to the redistributional pattern of downstream winners and local losers
(Duflo and Pande, 2007).18The extent of such coordination problems may be exacerbated by agro-ecological conditions (Wade, 1988).19Note that the core model here is a two-period poverty trap model. Subsistence Producers are trapped at a low level
of well-being by the combination of their own initial asset level and their inability to borrow.20In this sense, we provide a microeconomic foundation for the G and K phases of rapid economic development as
laid out by Chapter 1 of Aoki et al. (2012).
5
Because the economic valuation of public goods varies across voters, politics will matter for thechoice of policy in potentially interesting ways.
As a preview, the timing of a political-economic cycle is:
1. Voters choose their class, contingent on a rational expectation of political outcomes.
2. Parties propose platforms, maximizing their probability of being elected.
3. Commercial lobbies contribute to campaigns to maximize constituent welfare.
4. Voters elect parties, the winner’s platform is implemented, and voters produce.
Since the model can be solved by backward induction, this section takes the level of public goodprovision as exogenous to focus on production by voters. We then examine endogenous classformation in response to economic incentives and public good provision, and then consider voters’political preferences. The following section then details the behavior of lobbies and parties toarrive at political-economic equilibria.
3.1 Investment, Production and Consumption
We consider a society comprised of a unit mass of voters who live two-periods. Politically, eachindividual is endowed with one vote. Economically, each individual i enjoys an initial wealthendowment, Ai, where A(i) denotes the distribution of wealth in period 0. Before consideringhow the overall society operates, and how its operation is influenced by inequality, we need to firstcharacterize economic behavior and political preferences along the wealth continuum.
To generate income, each individual has access to two capital-dependent technologies: a sub-sistence technology, and a higher yielding commercial technology that depends on both public andprivate capital. Wealth Bi invested in the subsistence technology generates returns at a constantrate r, generating an income flow of rBi.
Wealth not allocated to the subsistence technology can be allocated to the commercial technol-ogy F which generates an income stream given by:
F (Ki,κi) = θ (Kαi /2+κ
αi /2)1/α with α,θ ∈ (0,1) ,
where Ki is private capital, while κi is a quasi-public capital good that is complementary to privatecapital in production. Use of the commercial technology requires payment of a fixed, start-up costof cF . We additionally assume θ > 21/αr, so that once cF is paid, investments Ki always dominatethe subsistence technology.21 As a quasi-public good, κi can be provided both publicly (P) and
21Note that the marginal investment product of F is (θ/2)Kα−1i (Kα
i /2+καi /2)1/α−1 ≥ θ2−1/α > r.
6
privately (Pi) so that individual i has access to:
κi = P+Pi.
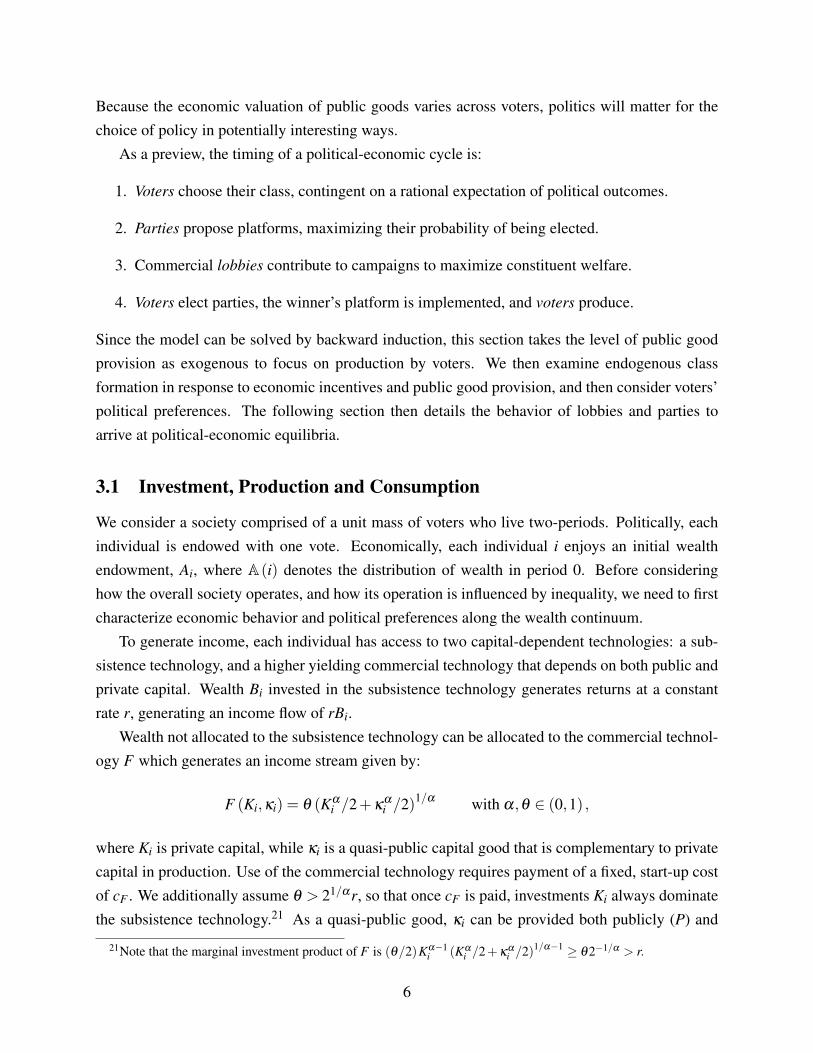
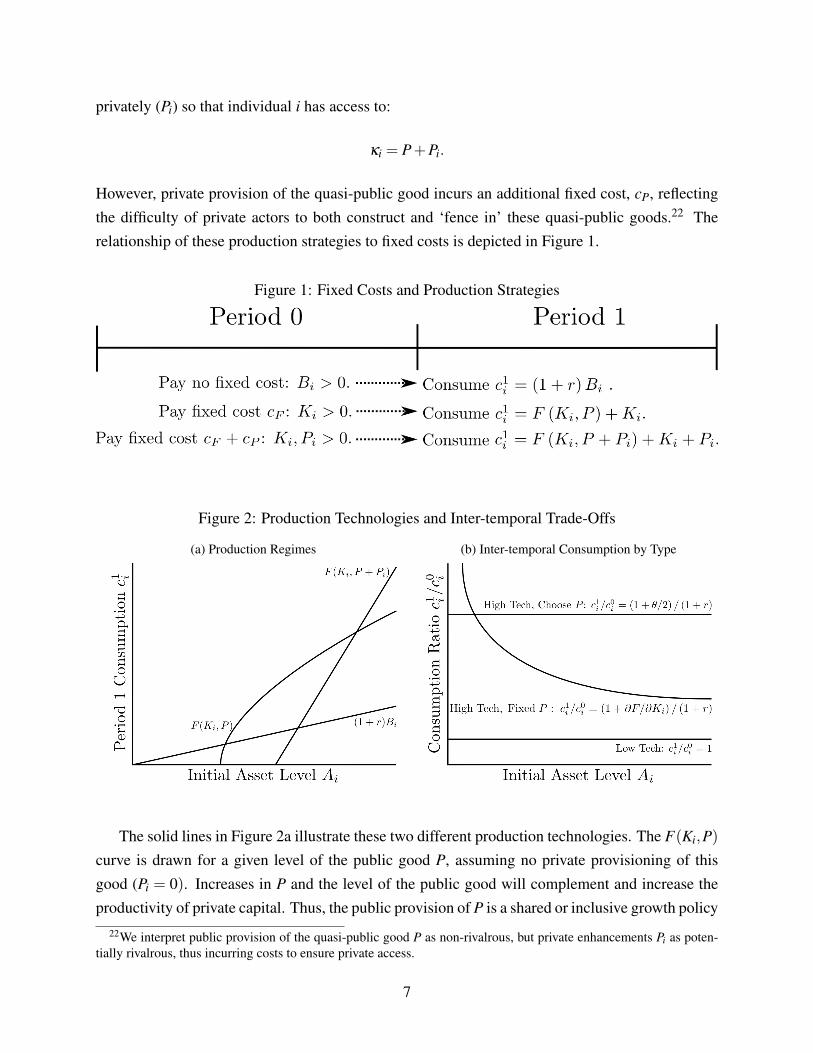
However, private provision of the quasi-public good incurs an additional fixed cost, cP, reflectingthe difficulty of private actors to both construct and ‘fence in’ these quasi-public goods.22 Therelationship of these production strategies to fixed costs is depicted in Figure 1.
Figure 1: Fixed Costs and Production Strategies
Figure 2: Production Technologies and Inter-temporal Trade-Offs
(a) Production Regimes (b) Inter-temporal Consumption by Type
The solid lines in Figure 2a illustrate these two different production technologies. The F(Ki,P)
curve is drawn for a given level of the public good P, assuming no private provisioning of thisgood (Pi = 0). Increases in P and the level of the public good will complement and increase theproductivity of private capital. Thus, the public provision of P is a shared or inclusive growth policy
22We interpret public provision of the quasi-public good P as non-rivalrous, but private enhancements Pi as poten-tially rivalrous, thus incurring costs to ensure private access.
7
as investments in P not only boost the productivity of all individuals who employ the commercialtechnology, but also opens a door of upward mobility for some individuals who would otherwisefind themselves using only the subsistence technology.
Given these production possibilities, agents make their production choices in order to maximizetheir two-period utility, discounted at rate β = (1+ r)−1:
[log(c0
i)+β log
(c1
i)]/(1+β ) . (1)
The budget constraints faced by each voter across periods are given by
c0i ≤ Ai−Ki−Bi−Pi− cF ·1Ki>0− cP ·1Pi>0, (2)
c1i ≤ F (Ki,P+Pi)+Ki +Pi +(1+ r)Bi,
where 1Ki>0 and 1Pi>0 are the binary indicator variables that take the value of one when whenthe agent respectively invests in Ki and Pi and must pay the fixed costs cF and cP.23 Note thatan individual’s initial wealth endowment needs to fund both period 0 consumption and capitalallocated to produce income for period 1. Period 1 consumption is then the income flows generatedplus assets retained. Finally, agents cannot borrow, and hence the additional constraints that:
Bi, Ki, Pi ≥ 0. (3)
Letting c0i and c1
i denote the values of consumption that maximize (1) subject to (2)-(3), wedenote an agent’s welfare after making investment and consumption decisions as
U (Ai,P)≡maxc0
i ,c1i
[log(c0
i)+β log
(c1
i)]/(1+β )= log c0
i(c1
i /c0i)1/(2+r)
.
3.2 Economic Classes as Endowment-necessitated Behavior
The model outlined in the prior section leads to three possible livelihood strategies or potentialeconomic classes defined by the inequality constraints in (3):24
1. Subsistence Producers (Bi > 0, Ki = 0, Pi = 0). These individuals, whom we would expectto be at the bottom of the asset distribution, will not pay cF nor cP and optimally chooseBi = Ai/(2+ r) and c0
i = c1i = (1+ r)Ai/(2+ r). The first order condition for Bi implies
23This setting corresponds to the definition of ‘natural’ inequality deriving from differences in economically valu-able assets across voters as opposed to inequality rooted in politically captured rents (Cogneau, 2012). Alternatively,the ability to access commercial technologies or privately invest in Pi could be modeled as being allocated by existinginstitutions which would distinguish the role of wealth and political resources in voters’ economic interests.
24Note that certain possible classes, e.g. Bi,Ki > 0, are ruled out by technology assumptions.
8
c1i = c0
i , so each voter’s inter-temporal allocation of assets must satisfy Bi = Ai/(2+ r).Consequently, the welfare of a Subsistence Producer, denoted US, is given by
US (Ai,P) = log((1+ r)Ai/(2+ r)) .
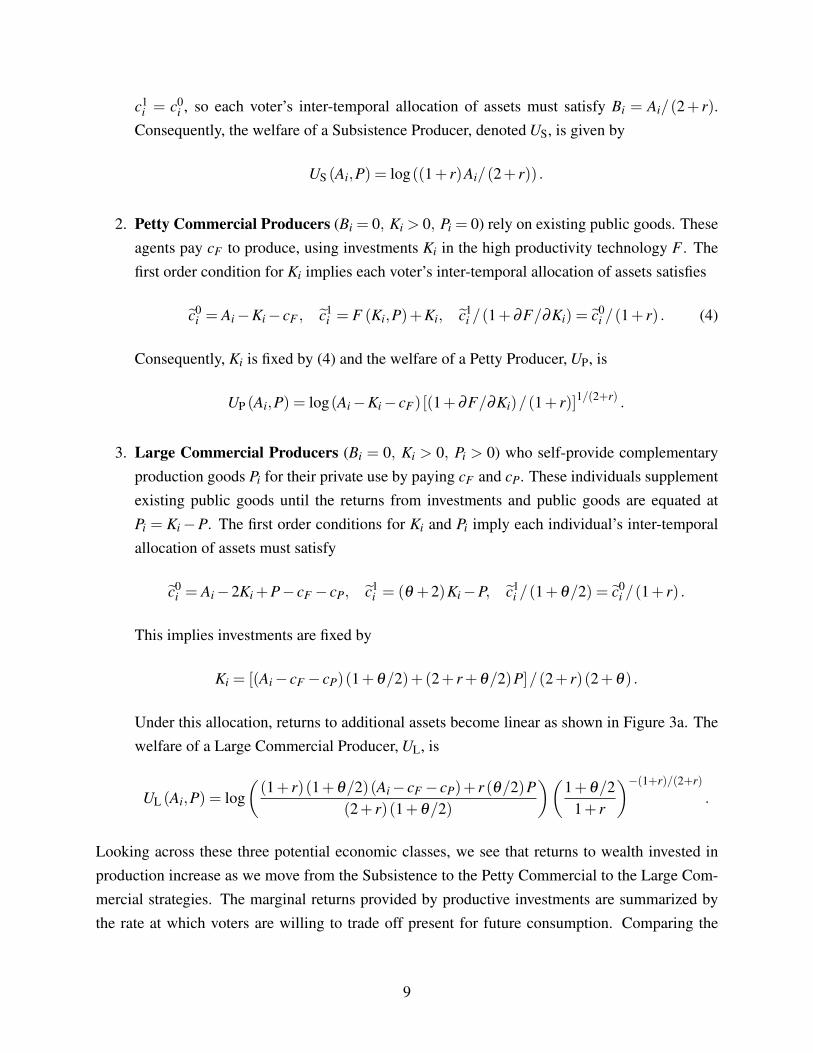
2. Petty Commercial Producers (Bi = 0, Ki > 0, Pi = 0) rely on existing public goods. Theseagents pay cF to produce, using investments Ki in the high productivity technology F . Thefirst order condition for Ki implies each voter’s inter-temporal allocation of assets satisfies
c0i = Ai−Ki− cF , c1
i = F (Ki,P)+Ki, c1i /(1+∂F/∂Ki) = c0
i /(1+ r) . (4)
Consequently, Ki is fixed by (4) and the welfare of a Petty Producer, UP, is
UP (Ai,P) = log(Ai−Ki− cF) [(1+∂F/∂Ki)/(1+ r)]1/(2+r) .
3. Large Commercial Producers (Bi = 0, Ki > 0, Pi > 0) who self-provide complementaryproduction goods Pi for their private use by paying cF and cP. These individuals supplementexisting public goods until the returns from investments and public goods are equated atPi = Ki−P. The first order conditions for Ki and Pi imply each individual’s inter-temporalallocation of assets must satisfy
c0i = Ai−2Ki +P− cF − cP, c1
i = (θ +2)Ki−P, c1i /(1+θ/2) = c0
i /(1+ r) .
This implies investments are fixed by
Ki = [(Ai− cF − cP)(1+θ/2)+(2+ r+θ/2)P]/(2+ r)(2+θ) .
Under this allocation, returns to additional assets become linear as shown in Figure 3a. Thewelfare of a Large Commercial Producer, UL, is
UL (Ai,P) = log((1+ r)(1+θ/2)(Ai− cF − cP)+ r (θ/2)P
(2+ r)(1+θ/2)
)(1+θ/2
1+ r
)−(1+r)/(2+r)
.
Looking across these three potential economic classes, we see that returns to wealth invested inproduction increase as we move from the Subsistence to the Petty Commercial to the Large Com-mercial strategies. The marginal returns provided by productive investments are summarized bythe rate at which voters are willing to trade off present for future consumption. Comparing the
9
three regimes, we see that inter-temporal consumption patterns satisfy the following:
Subsistence :c1
i
c0i= 1, Petty :
c1i
c0i=
1+∂F/∂Ki
1+ r, Large :
c1i
c0i=
1+θ/21+ r
. (5)
Figure 2b graphs these marginal returns to investment for each class.These inter-temporal trade-offs determine the marginal welfare of assets and public goods. To
see this, consider the welfare transformation exp(U (Ai,P)) and note that for any economic class,
∂ exp(U (Ai,P))/∂Ai = (1+ r)/(2+ r) ·(c1
i /c0i)1/(2+r)
. (6)
Combining Equations (5) and (6) shows that the graphs of exp(U (Ai,P)) would appear much asin Figure 2a. As assets increase, producers initially receive low returns from subsistence, achieveaccelerated gains as Petty producers, and at the highest asset levels receive the greatest returns.
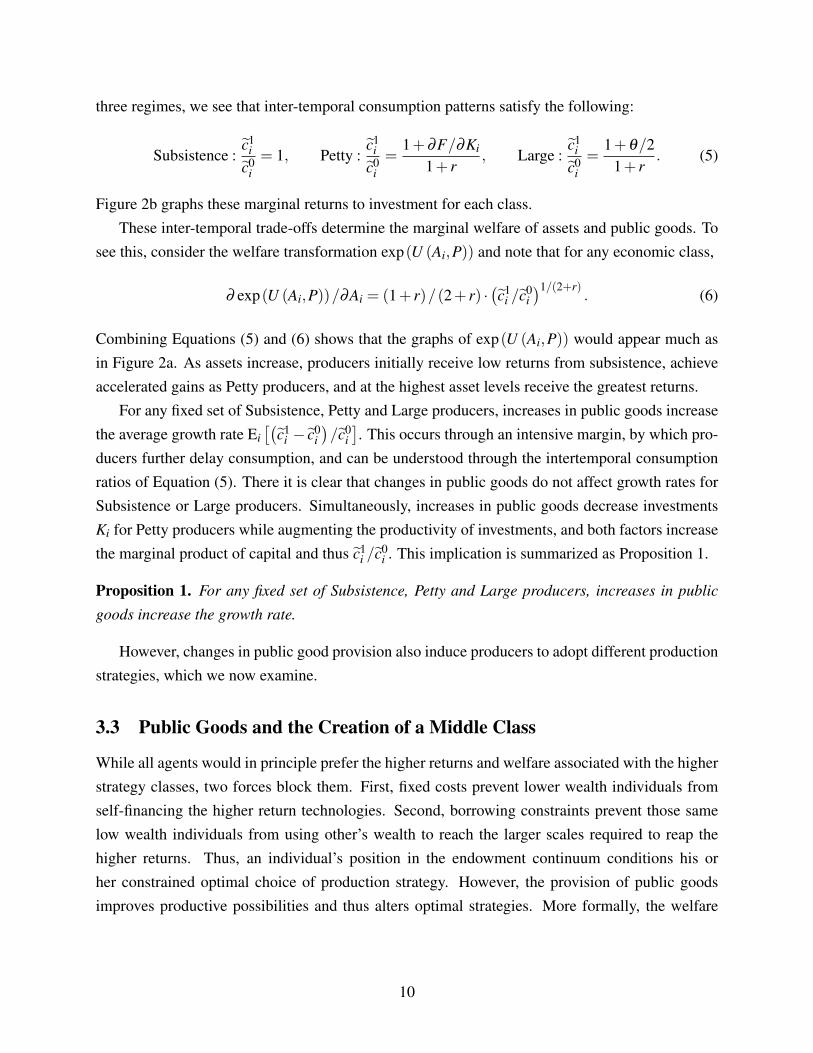
For any fixed set of Subsistence, Petty and Large producers, increases in public goods increasethe average growth rate Ei
[(c1
i − c0i)/c0
i]. This occurs through an intensive margin, by which pro-
ducers further delay consumption, and can be understood through the intertemporal consumptionratios of Equation (5). There it is clear that changes in public goods do not affect growth rates forSubsistence or Large producers. Simultaneously, increases in public goods decrease investmentsKi for Petty producers while augmenting the productivity of investments, and both factors increasethe marginal product of capital and thus c1
i /c0i . This implication is summarized as Proposition 1.
Proposition 1. For any fixed set of Subsistence, Petty and Large producers, increases in public
goods increase the growth rate.
However, changes in public good provision also induce producers to adopt different productionstrategies, which we now examine.
3.3 Public Goods and the Creation of a Middle Class
While all agents would in principle prefer the higher returns and welfare associated with the higherstrategy classes, two forces block them. First, fixed costs prevent lower wealth individuals fromself-financing the higher return technologies. Second, borrowing constraints prevent those samelow wealth individuals from using other’s wealth to reach the larger scales required to reap thehigher returns. Thus, an individual’s position in the endowment continuum conditions his orher constrained optimal choice of production strategy. However, the provision of public goodsimproves productive possibilities and thus alters optimal strategies. More formally, the welfare
10
impact of public good provision is stark across classes since
∂ exp(U (Ai,P))/∂P = (∂F/∂P)/(2+ r) ·(c1
i /c0i)−(1+r)/(2+r)
.
Thus, Subsistence producers who do not use the production technology F have d exp(US)/dP = 0,while the welfare of Commercial producers increases. This implies that when public goods in-crease, the set of Commercial producers expands at the expense of Subsistence producers. Equa-tion (7) computes the value of public goods across Commercial producers. Large producers canfluidly move investments across periods, so absorb public goods as to achieve a return of θ/2 inperiod 1, while Petty producers are constrained and achieve a return of ∂F/∂P.
∂ expUL
∂P=
θ/22+ r
(1+ r
1+θ/2
)1+r/2+r
,∂ expUP
∂P=
∂F/∂P
2+ r
(1+ r
1+ ∂F/∂Ki
)1+r/2+r
. (7)
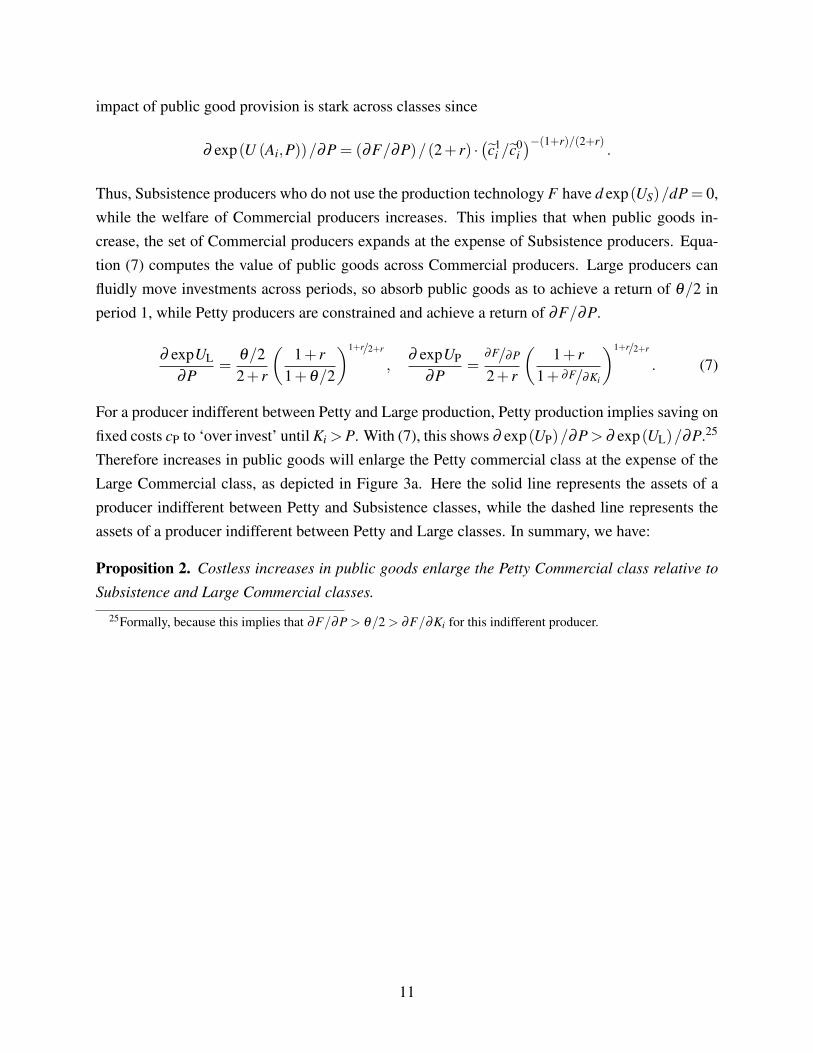
For a producer indifferent between Petty and Large production, Petty production implies saving onfixed costs cP to ‘over invest’ until Ki >P. With (7), this shows ∂ exp(UP)/∂P> ∂ exp(UL)/∂P.25
Therefore increases in public goods will enlarge the Petty commercial class at the expense of theLarge Commercial class, as depicted in Figure 3a. Here the solid line represents the assets of aproducer indifferent between Petty and Subsistence classes, while the dashed line represents theassets of a producer indifferent between Petty and Large classes. In summary, we have:
Proposition 2. Costless increases in public goods enlarge the Petty Commercial class relative to
Subsistence and Large Commercial classes.
25Formally, because this implies that ∂F/∂P > θ/2 > ∂F/∂Ki for this indifferent producer.
11

Figure 3: Public Goods and Class
(a) Public Goods and Class Formation (b) Numerical Production Regimes
We also claim that, absent any restrictions on the range of initial assets, the economy willexhibit all three classes when sufficient public goods are provided. First, subsistence is alwayschosen by those with insufficient assets to join the Commercial classes. Second, as P grows large,any producer with the assets cF to join the Commercial classes would be rewarded with highconsumption in period 1, justifying any amount of low consumption in period 0. Third, producerswith assets in [cF ,cP) can afford to become Petty but cannot afford to become Large. Finally, forany fixed level of public goods, the higher asset returns of the Large commercial class are alwaysrational provided sufficiently high initial assets.26 Proposition 3 summarizes this argument.
Proposition 3. Provided initial assets range from zero to infinity, economies with sufficiently high
levels of public goods will exhibit all classes.
Proof. See Appendix.
Finally, the adoption of technology as assets range from zero to infinity can be seen by combin-ing Propositions 2 and 3. At high levels of public goods, there are three endogenously determinedgroups of Subsistence, Petty Commodity and Large-scale producers as in Figure 3a. At low assetlevels (Ai ≤ AP), producers choose Subsistence, while for high asset levels (AL ≤ Ai), producersjoin the Large commercial class. Intermediate asset levels (AP ≤ Ai ≤ AL) correspond to Pettycommercial production. These three endogenously determined groups of Subsistence, Petty Com-
26Formally, limAi→∞ d [expUL− expUS]/dAi ≥[(1+θ/2)1/(2+r)−
(1+θ2−1/α
)1/(2+r)]/(2+ r)> 0.
12
modity and Large-scale producers have respective population shares
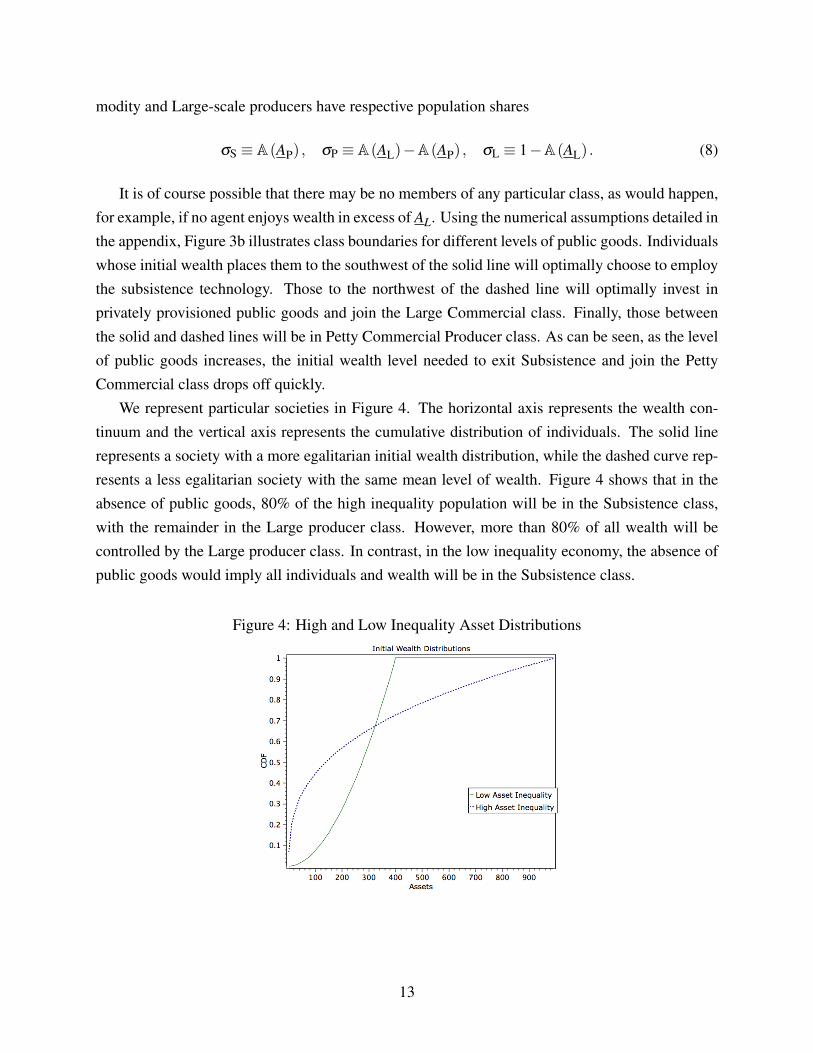
σS ≡ A(AP) , σP ≡ A(AL)−A(AP) , σL ≡ 1−A(AL) . (8)
It is of course possible that there may be no members of any particular class, as would happen,for example, if no agent enjoys wealth in excess of AL. Using the numerical assumptions detailed inthe appendix, Figure 3b illustrates class boundaries for different levels of public goods. Individualswhose initial wealth places them to the southwest of the solid line will optimally choose to employthe subsistence technology. Those to the northwest of the dashed line will optimally invest inprivately provisioned public goods and join the Large Commercial class. Finally, those betweenthe solid and dashed lines will be in Petty Commercial Producer class. As can be seen, as the levelof public goods increases, the initial wealth level needed to exit Subsistence and join the PettyCommercial class drops off quickly.
We represent particular societies in Figure 4. The horizontal axis represents the wealth con-tinuum and the vertical axis represents the cumulative distribution of individuals. The solid linerepresents a society with a more egalitarian initial wealth distribution, while the dashed curve rep-resents a less egalitarian society with the same mean level of wealth. Figure 4 shows that in theabsence of public goods, 80% of the high inequality population will be in the Subsistence class,with the remainder in the Large producer class. However, more than 80% of all wealth will becontrolled by the Large producer class. In contrast, in the low inequality economy, the absence ofpublic goods would imply all individuals and wealth will be in the Subsistence class.
Figure 4: High and Low Inequality Asset Distributions
13
3.4 Public Policy and Political Interests
We now consider individuals’ preferences for government action. While government provision ofpublic goods provides a benefit to all (incipient) commercial producers, a key political question isfor whom this benefit is worth the cost. To explore this question, we need to first specify a modelof public finance that defines the government’s budget constraint. We restrict our attention to thesimple case in which the government taxes assets at a flat rate τ , or does not tax, thereby directlyincreasing individuals’ private assets.27 Average wealth in the economy is µ ≡
∫AidA(i) so that
the total tax raised to provide public goods is τµ . As mentioned above, the provision of publicgoods is a shared growth policy in the sense that it provides a benefit to all commercial producers.It is also an inclusive growth policy as it reduces the critical initial wealth threshold, AP, allowingmore individuals to graduate from subsistence to petty commercial production.
To simplify the analysis, we assume that Large Commercial producers are the sole participantsin domestic financial markets. The resulting equilibrium interest rate of θ/2 reflects that for theseindividuals, both investments and public goods yield a one period total return of 1+θ/2. Thus, thegovernment may borrow at interest rate θ/2 to purchase P units of the public good. The rationalefor modeling public good provision as a one period ‘rental’ is that it maintains symmetric treatmentof capital goods (which are consumed in period 1) and public goods, which are consumed by LargeCommercial producers through capital markets.28
We assume that everyone in society receives an equal per-capita share of the total public goodsprovided, which is therefore equal to P. To cover the interest on this debt, the government raisestaxes τµ in period 0 and saves them for a total return of (1+θ/2)τµ in period 1 to service thedebt.29 This implies the level of public good provision must satisfy the inter-temporal budgetconstraint
Government Budget Constraint : (1+θ/2)τµ = (1+θ/2)P−P, (9)
This budget constraint reflects the fact that the government can save collected taxes τµ for oneperiod and use its total budget to pay the debt service.
We now consider the competing effects of taxation and public good provision on well-being
27More complex tax regimes would certainly influence political outcomes. Following the analysis below, progres-sive schemes would further antagonize Large producer support for public goods, while driving up the benefit of publicgoods to Petty producers thus increasing their support for public goods.
28This is easily formalized by putting explicit government bonds in the model, whose return is fixed by opportunitycost of investment for Large Commercial producers, 1+θ/2.
29While state capacities to literally implement this type of tax may be lacking, many government policies formimplicit taxes which are enacted in practice such as tariffs, royalties collected from natural resources or existingmonopolies, choices made in state owned sectors, etc.
14
across economic classes. The total effects of government policy for any Commercial class are30
dU/dτ = (1+θ/2)µ/(θ/2) ·∂U/∂P−Ai ·dU/dAi. (10)
Equation (10) sets the beneficial effect of public good provision against the detrimental costs oftaxation, and characterizes the policy regime that each individual would support politically.
For Subsistence Producers, the lack of access to the production technology F implies ∂U/∂P=
0, so they pay taxes with no hope of compensation and would prefer that no taxes are levied. Atthe other extreme, members of the Large Commercial class are free to reduce Pi to offset increasesin P, so they are immune to ‘forced purchase’ of public goods. Therefore a Large CommercialProducer’s welfare increases in τ so long as the tax paid, τAi is less than the discounted value ofpublic goods provided in period 1, so Equation (10) becomes31
dUL/dτ = (µ−Ai) ·dUL/dAi. (11)
Equation (11) shows members of the Large Commercial class prefer higher taxes only when theirassets are below average, so for this class, taxes are purely redistributive. Clearly then, the wealth-iest members of the society will oppose the taxation needed for a shared growth policy.
Finally, for Petty Commercial Producers, Equation (10) can be written
dUP/dτ =
µ−Ai︸ ︷︷ ︸Redistributive
+
[1+θ/2
θ/2∂F/∂P
1+∂F/∂Ki−1]
µ︸ ︷︷ ︸Benefit of Public Goods
·dUP/dAi.
Decomposing this equation shows that Petty producers are motivated by both redistributive con-cerns and the productive benefits of public goods. For a Petty producer who happens to equatethe marginal product of private and public investments (Ki = P), the benefit term above vanishesas for Large producers.32 Petty producers with more assets increase private investment, makingthe benefit term positive, since the potential return of public goods to such producers is higherthan the opportunity cost of providing public goods, θ/2. Similarly, Petty producers with fewerassets achieve returns on public goods below θ/2, yielding a negative benefit term. Ultimately, thecombined effects are positive so long as taxes aren’t prohibitively high.33
30An increase in taxes τ decreases available assets at rate Ai, as ∂U/∂τ|P fixed = −Ai · dU/dAi, so the impact oftaxation is known from (6) above. Conversely, an increase in τ provides public goods to all voters at rate P/τ =(1+ θ/2)µ/θ/2, which implies ∂U/∂τ|(1−τ)Ai fixed = (1+θ/2)µ/(θ/2) ·dU/dP.
31Formally, the envelope theorem shows that ∂U/∂P = ((∂F/∂P)/(2+ r)) ·(c0
i /c1i)·dU/dAi.
32The condition of Proposition 3 guarantees this Petty producer exists.33While the costless provision of public goods enlarges the Petty Commercial class, the taxation required for these
15
Informed by this analysis, we restrict τ to moderate levels in order to analyze economies wherepublic goods have some positive benefit for Petty producers, i.e. that taxes have not immiseratedproducers into highly unproductive behaviors, as laid in Assumption 1. Conditions 1 and 2 of thisassumption means that the class boundaries above do not violate producers ability to pay for theirpreferred class plus a small margin, and in order to be violated, taxes have to approach 1/(2+ r),i.e. almost 50% at standard discount rates. For condition 3 to be violated at tax rates below 50%would require extremely high marginal returns to public goods of over 200%.
Assumption 1. Moderate taxation.
1. (1− τ)AP− cF > (1+ r)τAP.
2. (1− τ)AL− cP > 0.
3. 1− ∂F/∂P|Ai=AL/4≥ τ .
Under moderate taxation, all Petty producers receive positive marginal benefits from increasedtaxation. We summarize these political interests as
Proposition 4. The political interests of Large producers are redistributive, while Petty producers
care also about the productive benefits of public goods. Under moderate taxation:
1. dUL/dτ ≷ 0 if and only if µ ≷ Ai.
2. dUP/dτ ≥ 0 for all Ai ≥ AP.
Proof. See Appendix.
While we have seen that costless increases in public goods enlarge the Petty Commercial class,the introduction of taxes to pay for public goods introduces income effects which might also shrinkthis class. However, at moderate tax rates, the productive benefits of publicly augmenting privateinvestments dominate income effects, as summarized in Proposition 5:
Proposition 5. Under moderate taxation, increases in public goods enlarge the Petty Commercial
class relative to Subsistence and Large Commercial classes.
Proof. See Appendix.
Until now, we have exogenously modeled public good provision. We now model public goodsas the outcome of a political contest between parties who are lobbied along class lines.
goods drains producers of wealth, potentially disincentivizing high return production. The most obvious way thismight occur is under prohibitively high taxes which preclude producers from paying the fixed costs of adoption. Forexample, at a 100% taxation rate, all producers are immiserated to subsistence by the lack of assets to pay cF .
16
4 Political Parties and Electoral Competition
In this section, we lay out a model of electoral competition in which the economic strength ofclasses manifests through lobbying.34 We then establish the behavior of political parties and an-alyze the resulting political-economic equilibrium. All voters have random political preferencesthat make them more likely to vote for one of the two political parties. Voters involved in thecommercial economy are informed and tend to vote and lobby for their economic interest.35 Unin-formed voters are swayed by political expenditures made by the parties. In our modeling, we payparticular attention to each agent’s constrained willingness to pay for a particular policy. We thenexplore the suggestion that the extent of initial asset inequality and risk will fundamentally shapewhether the political-economic processes will result in the choice of shared growth policies.
4.1 Voters, Parties and Lobbies
To explore the politics of policy choice, we assume a two-party political system consisting of Red(R) and Green (G) parties. Parties are office motivated and offer platforms (τR,PR) and (τG,PG)
composed of a flat income tax τ used to finance public goods P through the government budgetconstraint (9).36 Voters have idiosyncratic preferences δi in favor of party R, distributed uniformlyover [−1/2ψ,1/2ψ], where ψ determines the range and density of political preferences. Petty andLarge Commercial producers are informed voters who vote on the basis of economic policy. Thewelfare of an informed voter i under a platform (τ,P) is
U ((1− τ)Ai,P)+δi ·1R elected.
Therefore commercial voters prefer a Red platform over a Green platform whenever
U ((1− τR)Ai,PR)+δi ≥U ((1− τG)Ai,PG) .
34Of course, this presumes a democratic political regime (at at least a regime in which elections are de jure de-termined by votes but de facto in part determined by bribing or deluding voters. This likely better reflects the latterstages of East Asian success as democracy was consolidated. Similar results that realistically reflect the more auto-cratic regimes in place at the beginning of the East Asian ‘miracle’ would likely follow based on the same productiontechnologies here but under the implicit threat of insurgency, e.g. (Acemoglu and Robinson, 2006).
35A lobby might also be interpreted as a broad based interest group represent common economic interests. Moredirectly, instead of modeling lobbies, one could presume that parties directly pursue welfare maximization for theirconstitutency, which would reparamaterize the model but look very much the same in terms of policy equilibria.
36We abstract from factors that might influence the application of taxes towards public good provision, such asgovernment leakages or the capacity of politicians to effectively provide public goods once funds are allocated. Therole of these factors when local politics are distinct or fractionalized is an area for further work (Gehlbach, 2006).
17
Subsistence producers are uninformed as public goods do not directly impact them.37 Instead, theyare swayed by campaign contributions CR and CG, and vote for the Red party whenever
CR +δi ≥CG.
Given party platforms and contributions, the probability that the Red party is elected (ρ) is:
ρ = 1/2+ψ
∫∞
AP
[U ((1− τR)Ai,PR)−U ((1− τG)Ai,PG)]dA(i)+ψ
∫ AP
0[CR−CG]dA(i) .
Once parties have chosen platforms to maximize their election chances, commercial lobbies makecampaign contributions.
A Large Commercial lobby and a Petty Commercial lobby provide contributions towards par-ties which maximize the aggregate welfare of their constituencies. We assume per capita contribu-tions incur a quadratic welfare cost, so that for a given platform (τ,P), the aggregate welfare forLarge producers (UL) and Petty producers (UP) is
UL (τ,P) =∫
∞
AL
[U ((1− τ)Ai,P)− ((CR +CG)/σL)
2 /2]
dA(i) ,
UP (τ,P) =∫ AL
AP
[U ((1− τ)Ai,P)− ((CR +CG)/σP)
2 /2]
dA(i) .
As elections are probabalistic, the Large Commercial lobby makes contributions to solve
maxCR,CG
ρ (CR,CG)UL (τR,PR,CR,CG)+ [1−ρ (CR,CG)]UL (τG,PG,CR,CG) .
Similarly, the Petty Commercial lobby contributes according to
maxCR,CG
ρUP (τR,PR)+ [1−ρ]UP (τG,PG) .
Once contributions are allocated, voters elect parties, the winner’s platform is implemented,and voters produce. Note that all of these stages are contingent on the fixed costs paid by vot-ers which determine their class, which in turn depend on a rational expectation of the politicaloutcome. We now turn to examine when such expectations are in fact equilibrium outcomes.
37Similar to Bardhan and Mookherjee (2000), this implies that the share of informed voters increases with wealth.Our assumption that the poorest voters are uninformed permits the added complexity of endogenous group formation.
18
4.2 Equilibrium
With these building blocks, we take a standard approach and model the behavior of class-basedlobbies. As is well known in this setting, (Persson and Tabellini, 2000; Gehlbach, 2013), in equi-librium each party selects the same platform and no contributions are made. Equilibrium platformscoincide with the solution to a weighted sum of Petty and Large Commercial Producer welfare:38
max(τ,P)
(1+ψσL)UL (τ,P)+(1+ψσP)UP (τ,P) subject to (9). (12)
Of the range of possible equilibrium tax rates between zero and one, extremely high tax rates(e.g. τ = 1) will not be offered by parties. This is for the simple reason that the high levels of publicgoods thereby provided are of low value to voters with few assets left after taxes. Conversely, lowexpectations of public good provision could lead to an anemic Petty class (UP = 0), allowing for acorner solution to Equation (12) of no public goods (τ = 0). However, in the presence of a middleclass (UP > 0), Petty producers enforce public good provision politically. To see this, examine thefirst order condition for Equation (12) to hold at an interior equilibrium:
0 = (1+ψσL)(dUL (τ,P)/dτ
)︸ ︷︷ ︸Marginal Cost of τ to Large Producers
+ (1+ψσP)(dUP (τ,P)/dτ
)︸ ︷︷ ︸Marginal Benefit of τ to Petty Producers
. (13)
As the marginal benefit of public goods to Petty producers is arbitrarily high at low tax rates inEquation (13), the existence of a middle class guarantees at least some positive level of publicgoods. This yields Proposition 6.
Proposition 6. The only class structure compatible with no public good provision is an economy
composed solely of Subsistence and Large Commercial Producers.
These results show that the strength of a class to pursue its interests in the political arena dependon the fixed investments voters make. Since investments in turn depend on the expected level ofpublic goods provided by politicians, good and bad expectations can lead to inclusive or exclusivepolicies. We now address these outcomes by investigating voter interests as class strength changes.
4.3 Inequality, Risk and Public Good Provision
The initial distribution of assets impacts public good provision through Equation (13). To see this,note that in light of Proposition 4, voters with assets greater than maxAL,µ prefer lower taxesand voters with fewer assets down to AP prefer higher taxes. Now consider two economies with
38Note that this political-economic outcome does not strictly reflect output or welfare maximization, as we mightexpect for theoretical and empirical reasons. See Cheibub and Przeworski (1997).
19
identical technologies, but one with asset distribution A and another with asset distribution B thatexhibits a stronger (incipient) Petty class. Formally, suppose B results from A by redistributingfrom rich voters with Ai > max
A1
L,µ
) to poorer voters so that there are more voters at everyasset level below max
A1
L,µ
. In this second B economy, Equation (13) must be positive at theequilibrium tax rate of A. As (13) decreases in τ for any fixed set of producers under moderatetaxation (see Appendix), it follows that a B distribution economy has a higher equilibrium tax rate.This result, linking the relative strength of Petty producers more equal economies to increasedpublic goods is Proposition 7.
Proposition 7. Under moderate taxation, economies with a stronger incipient Petty class have
higher levels of public goods.
Risk also prevents voters from adopting higher productivity technologies and thereby reducesthe size of the incipient Petty class. Thus, reducing risk may in fact crowd in public goods, whichwe now explain.
In order to model high yielding technologies which may entail risk, further suppose that com-mercial production yields variable total returns of c1
i = [F (Ki,κi)+Ki +Pi] ·ωi where ωi is ran-domly distributed with E [ωi] = 1 and support on
[θ2−1/α − r,∞
). This implies commercial pro-
duction always yields higher returns than subsistence, but risk as measured by Ω≡ |E [lnωi]|makesCommercial production less rewarding. Increases in risk Ω do not change the relative attractivenessof Petty versus Large Commercial production across asset levels, but risk does make Subsistencemore appealing than Commercial production. Thus, risk increases AP and shrinks the Petty class.Following the logic above through Equation (13), decreases in risk thereby crowds in politicalcapital in support of public goods, summarized as Proposition 8.
Proposition 8. Under moderate taxation, less risky economies have higher levels of public goods.
Propositions 7 and 8 thus show that while both inequality and risk decrease public good provi-sion, there is a trade off between the two under which governments will provide the same level ofpublic goods. We next illustrate the mechanisms of the model with an example to fix ideas.
4.4 Endogenous Class and Willingness to Pay for Public Policy
In an effort to understand each agent’s potential budget-constrained willingness to make politicalcontributions off the equilibrium path (where contributions are zero), we perform a thought ex-periment wherein a Reform party tactically promises public good provision in the face of a StatusQuo party that offers none. This illustrates the impetus behind political contributions that shapesequilibrium outcomes, by calculating how much initial wealth each voter would be willing to giveup in order to obtain (or avoid) the Reform policy with probability one.
20
These amounts calculated can be considered as upper bound estimates of the political contri-butions the Reform party could collect. While individuals would likely contribute less than thisupper-bound estimate (given electoral uncertainty, among other things), these estimates do providea window into the interaction between politics and economics.
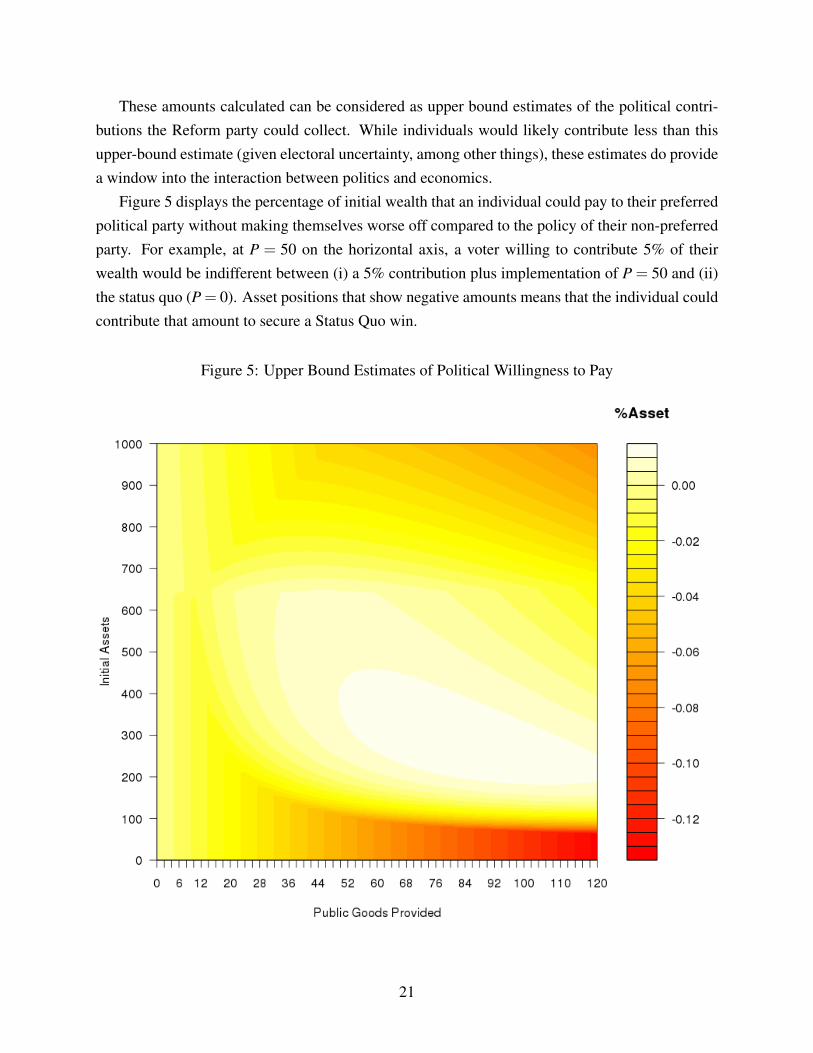
Figure 5 displays the percentage of initial wealth that an individual could pay to their preferredpolitical party without making themselves worse off compared to the policy of their non-preferredparty. For example, at P = 50 on the horizontal axis, a voter willing to contribute 5% of theirwealth would be indifferent between (i) a 5% contribution plus implementation of P = 50 and (ii)the status quo (P = 0). Asset positions that show negative amounts means that the individual couldcontribute that amount to secure a Status Quo win.
Figure 5: Upper Bound Estimates of Political Willingness to Pay
21
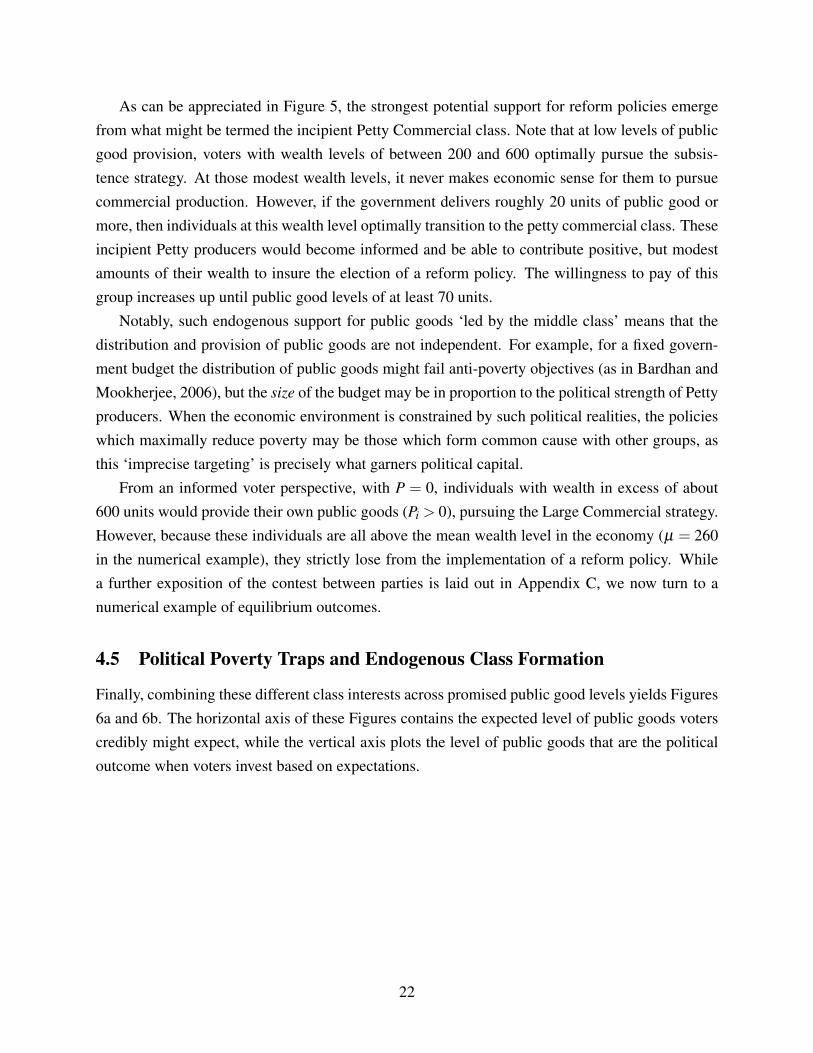
As can be appreciated in Figure 5, the strongest potential support for reform policies emergefrom what might be termed the incipient Petty Commercial class. Note that at low levels of publicgood provision, voters with wealth levels of between 200 and 600 optimally pursue the subsis-tence strategy. At those modest wealth levels, it never makes economic sense for them to pursuecommercial production. However, if the government delivers roughly 20 units of public good ormore, then individuals at this wealth level optimally transition to the petty commercial class. Theseincipient Petty producers would become informed and be able to contribute positive, but modestamounts of their wealth to insure the election of a reform policy. The willingness to pay of thisgroup increases up until public good levels of at least 70 units.
Notably, such endogenous support for public goods ‘led by the middle class’ means that thedistribution and provision of public goods are not independent. For example, for a fixed govern-ment budget the distribution of public goods might fail anti-poverty objectives (as in Bardhan andMookherjee, 2006), but the size of the budget may be in proportion to the political strength of Pettyproducers. When the economic environment is constrained by such political realities, the policieswhich maximally reduce poverty may be those which form common cause with other groups, asthis ‘imprecise targeting’ is precisely what garners political capital.
From an informed voter perspective, with P = 0, individuals with wealth in excess of about600 units would provide their own public goods (Pi > 0), pursuing the Large Commercial strategy.However, because these individuals are all above the mean wealth level in the economy (µ = 260in the numerical example), they strictly lose from the implementation of a reform policy. Whilea further exposition of the contest between parties is laid out in Appendix C, we now turn to anumerical example of equilibrium outcomes.
4.5 Political Poverty Traps and Endogenous Class Formation
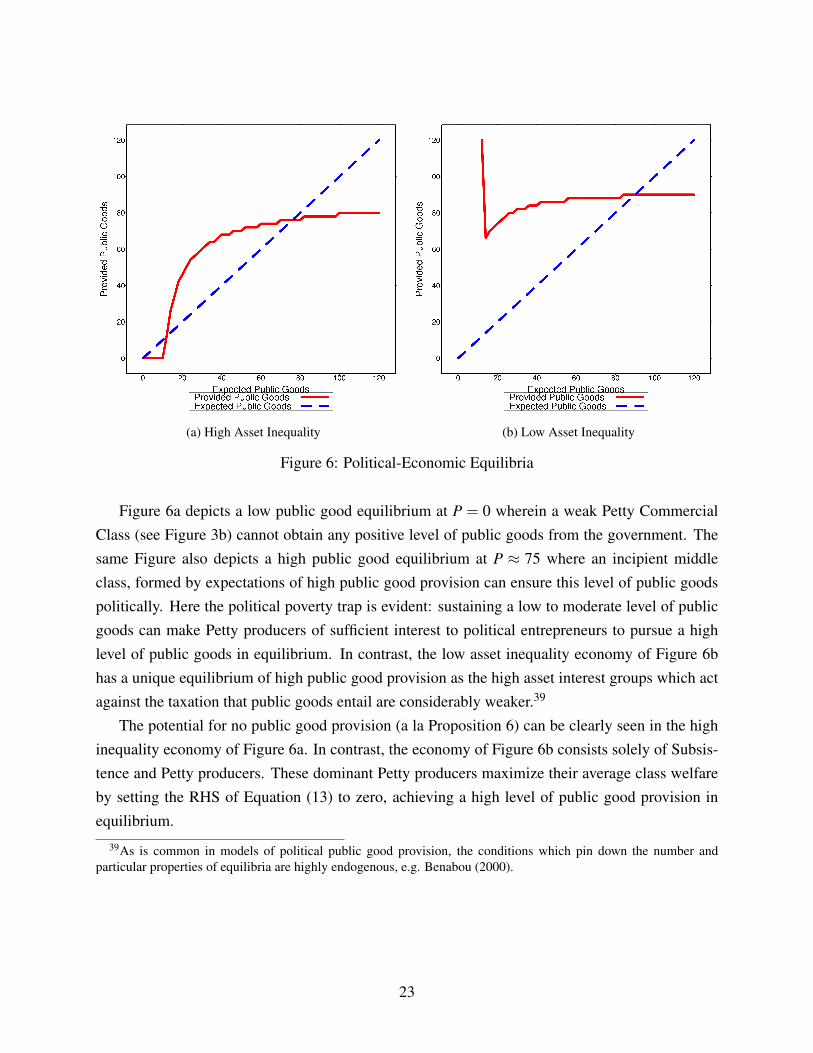
Finally, combining these different class interests across promised public good levels yields Figures6a and 6b. The horizontal axis of these Figures contains the expected level of public goods voterscredibly might expect, while the vertical axis plots the level of public goods that are the politicaloutcome when voters invest based on expectations.
22
(a) High Asset Inequality (b) Low Asset Inequality
Figure 6: Political-Economic Equilibria
Figure 6a depicts a low public good equilibrium at P = 0 wherein a weak Petty CommercialClass (see Figure 3b) cannot obtain any positive level of public goods from the government. Thesame Figure also depicts a high public good equilibrium at P ≈ 75 where an incipient middleclass, formed by expectations of high public good provision can ensure this level of public goodspolitically. Here the political poverty trap is evident: sustaining a low to moderate level of publicgoods can make Petty producers of sufficient interest to political entrepreneurs to pursue a highlevel of public goods in equilibrium. In contrast, the low asset inequality economy of Figure 6bhas a unique equilibrium of high public good provision as the high asset interest groups which actagainst the taxation that public goods entail are considerably weaker.39
The potential for no public good provision (a la Proposition 6) can be clearly seen in the highinequality economy of Figure 6a. In contrast, the economy of Figure 6b consists solely of Subsis-tence and Petty producers. These dominant Petty producers maximize their average class welfareby setting the RHS of Equation (13) to zero, achieving a high level of public good provision inequilibrium.
39As is common in models of political public good provision, the conditions which pin down the number andparticular properties of equilibria are highly endogenous, e.g. Benabou (2000).
23
4.6 Breaking the Political Poverty Trap
More broadly, this political poverty trap can be broken when political parties can credibly promiseto deliver a minimal threshold of public goods, which brings voters into the Petty commercial classand crowds in both physical and political capital to support inclusive growth. This relationship isdepicted in both Figure 6a and Figure 6b, which show that the level of public goods providedby political contests increases as voters come to expect them. This is analytically formalized asProposition 9.
Proposition 9. Assume moderate taxation and that there are sufficient Petty producers (σP) who
receive high benefits of taxation (dUP/dτ|Ai=AL) relative to Large producers and the benefits they
receive:
σP · dUP/dτ|Ai=AL> σL · dUL/dτ|Ai=AL
. (14)
Then increases in expected public goods crowd in delivered public goods.
Proof. Equation (14) means that when considering the benefits of taxation to a voter indifferentbetween Petty and Large production, the benefit to Petty production weighted by the mass of Pettyproducers is larger than the corresponding quantity for Large production. This will hold wheneverthe value of public goods are high or when the Large Commercial class is relatively small. For theformal proof, see Appendix.
Note that parallel to asset based poverty traps, here non-convexities in production manifest asnon-convexities in politics. As exhibited in Figure 6a, a discrete jump in promised public goods isrequired to garner any possibility of politically enforced public goods.
We now briefly discuss the role of risk which is endemic to small entrepreneurs in developingcountries and crucially shapes their economic lives. In this framework, risk alters productionstrategies which in turn informs the political interests of producers. Thus, risk has spillover effectson the national development strategy akin to the role of initial inequality.
5 Viable Producers as the Foundation for Inclusive Growth
While highly stylized, our political economy model implies that in the presence of high levels ofrisk, the kinds of shared growth policies that underwrote the rural foundations of the East Asianmiracle are not politically viable, even in economies with modest levels of asset inequality. Beforeturning to consider what might be done to rectify that situation, it is important to recall that themodel itself rests on an assumption of financial market failure. Formally, it is the inability of low
24

wealth agents to borrow large amounts of resources that keep them from leapfrogging from thesubsistence to the Petty Commercial class and higher rates of returns to the assets that they own.40
While this assumption seems reasonable, it is essentially a statement that low wealth agents are ofno more interest to economic entrepreneurs than they are to political entrepreneurs. As exhibited inthe last section, risk plays a key role in this exclusionary process, and reductions in risk may havepolitical knock on effects. We now speculate on the policy implications of our political economyframework for the likelihood that polities might support and sustain inclusive growth policies,taking Africa as an example.
5.1 The Political Ramifications of Risk in Africa
Risk plays an important part in explaining rural financial market failures. Only a tiny fractionof agricultural land in sub-Saharan Africa is irrigated, in sharp contrast to other world regions.41
While the absence of irrigation reduces productivity, it also has a large impact on the risk to whichfarmers are exposed. In an analysis of West Africa, Carter (1997) documents the magnitude ofthis risk, showing not only that is larger than other world regions, but also that if left unmanagedexposes households to huge consumption risk. Households of course do manage that risk, but oftenby avoiding higher yielding, but risky and more expensive technologies.
Should the higher yielding technology exhibit risk in the model above, investment incentives toabandon subsistence would be reduced as agents would be tempted to consume more in the initialperiod rather than risking resources in investment projects which perhaps do not pay off. As shownin Figure (3ab), it is this class that sacrifices the most to invest by having already precariously lowperiod 0 consumption. In addition, as already demonstrated in dynamic poverty trap models, anincrease in risk pushes out the initial asset level at which individuals will attempt the transitionfrom a low-level equilibrium strategy to a higher level equilibrium strategy.42
These two fundamental changes brought by risk have important implications for political econ-omy. For a given initial asset distribution, the rightward shift in AP thins the ranks of those whosupport Government investment in public goods. In addition, for those who remain Petty Com-modity Producers, it reduces their material gain from policies that promote public goods. Together,these two forces imply that a broader class of wealth distributions will not be able to endogenouslysustain inclusive growth policies. Put differently, office-seeking political entrepreneurs have little
40Our model shares this characteristic with the general category of multiple equilibrium poverty trap models ana-lyzed by Barrett and Carter (2013).
41The 2008 World Development Report indicates that less than 5% of land is irrigated in Africa, compared to 39%in South Asia and 29% in East Asia.
42E.g. in the frame work of Carter and Ikegami (2009), this impact appears as a shift out in what they call the Mi-cawber Frontier. In our model, it will appear as rightward shift in AP, the asset level at which individuals endogenouslymove from the subsistence class to the petty commodity class.
25
to gain from offering public goods to a population that will remain trapped at relatively low levelsof economic well-being even after public goods are provided. Risk, especially at the levels ob-served across wide parts of rural Africa, not only discourages investment, but also fundamentallybreaks the political-economic logic that could create and sustain inclusive growth policies.
5.2 Policy Interventions Through the Lens of Political Economy
Models, such as the one developed in this paper that indicates that initial conditions matter, areproblematic in terms of their policy implications. The Peruvian economist, Adolfo Figueroa, oncecommented that Latin America needed a “refoundational shock” to reduce asset inequality so thatit could start over with different initial conditions. While the desirability and certainly politicalfeasibility of a refoundational shock are questionable, is it any more reasonable to think aboutchanging the foundational agroecological conditions across parts of Africa that trap individuals insituations in which they are of little interest to both economic and political entrepreneurs?
Somewhat surprisingly, the answer to this question may be yes. Recent years have seen anoutpouring of efforts to index insurance contracts that transfer the correlated component of risk outof African agricultural systems. Janzen and Carter (2013) show that insurance payments to herdersin remote pastoral regions of Northern Kenya have indeed served to guard family consumptionstandards and to protect families from further asset loss and decapitalization. As described byMcIntosh et al. (2013), weather index insurance contract targeted at low productivity Ethiopiangrain farmers provided the liquidity needed to adopt improved seeds and fertilizers. The hopeis that this new source of liquidity, combined with the risk reduction of the insurance contractwould crowd-in technology uptake and, in the language of the model here, create a transition froma Subsistence to a Petty Commercial class. With modest public investment, these projects havetried to change the landscape for economic entrepreneurs, converting low wealth households intoa bankable investment project. If these efforts can indeed succeed and sustain themselves, then thepolitical economic calculus of the sort examined here may turn in change, creating a novel variantof the virtuous circle that underlay the East Asian Miracle a generation ago.
6 Conclusion
Rapid, poverty-reducing agricultural growth in East Asia rested on policies that provisioned keypublic goods, creating the foundation for inclusive, broadly based growth. Less surprising than thepolicies themselves is the fact that they were systematically chosen across the East Asian region,whereas they have not been a staple of policy in other developing regions of the world. In an effortto understand this puzzle, we have created an integrated economic and political model to explore
26
how the distribution of productive assets, and the severity of production risk, shape whether andhow many public goods are politically provisioned.
The implications of the model are striking. In an economy characterized by an asset distribu-tion akin to those that emerged post-World War II in the East Asian miracle countries, the onlypolitical economy equilibrium which emerges is one in which the government provides high lev-els of public goods and effectively moves most small scale producers into the petty commercialproduction, thereby generating broadly based agricultural transformation. It is not that East Asianpolicymakers were different–say more public-spirited–but that the wealth distribution left themonly one winning political strategy.
In contrast, when the initial asset distribution is less equal–as in Latin America–or risk levels orhigher–as in Africa–the model admits multiple equilibria, one with minimal public good provisionand the other with public goods. The former seems much more likely given that the latter wouldrequire substantial political contributions from the incipient petty commercial class, and makingthose contributions would undercut their ability to make the private investment needed to takeadvantage of, and benefit from, public goods.
The political economy model from which these results emerge is distinctive in that it rests onserious microfoundations. Individuals are distributed along an initial wealth continuum and facea unified budget constraint as they make their political and economic choices. In this two periodmodel, initial wealth constrains how much an individual consumes in the first period, how muchthey invest, how much they pay in taxes, and, potentially, how much they contribute to a politicallobby. In this model, production strategy, or economic class, is endogenous to this choice problem,as is affiliation and willingness to contribute to a particular political lobby. Public goods, whichthe government might provide and pay for through taxation, are valuable only in that they canenhance the productivity of private investment. However, the very fact that the individual mustpay taxes–and possibly make political contributions–to obtain public goods means that she maynot have sufficient left to invest and reap the benefits from the public goods. In the context of apolitics where money matters to sway disinterested or uninformed voters, this tradeoff creates theprospect of a lower growth, inequality-increasing, zero public good equilibrium in the context ofhigh inequality and, or risk.
Within the context of a wider argument that economic interventions have political dimensionsthat need consideration when crafting policy, the model illustrates underlying interconnectionsbetween the economic and political realms. Specifically considering the selection of inclusivegrowth policies in development and the role of risk, we have discussed the potential for recentinterventions to expand the Petty Commercial class, which could have political knock-on effects.Future work might test or craft interventions (and subsequent monitoring) with these considerationsin mind. This could help policymakers more deeply understand and shape the political forces set
27
in motion by economic policy.This paper has focused on conflicting political interests played out in a democratic setting, al-
beit one in which wealth may heavily influence policy outcomes. How these conflicts play outunder alternative political institutions such as autocracies (e.g. De Luca et al., 2013), which there-after transition to democracies, could yield a more complete narrative exploring the influence ofinequality on inclusive growth.43 The existence of multiple equilibria as exhibited here mightalso motivate a more stylized setting wherein voter-producers face a distribution over politicaloutcomes which impacts class formation and therefore political interests. A political landscapeinhabited by widely divergent, but electable parties (or the potential for coups) might inhibit theformation of a Petty Commercial class and therefore sabotage stable political-economic public sup-port for widespread commercial engagement. This might speak to the mixed relationship betweendemocracy and growth (see the review of Przeworski and Limongi, 1993) as only consolidateddemocracies which have escaped low level equilibria might have growth advantages over autocra-cies.
Finally, one interpretation of our results is that a more equitable distribution of wealth maytrigger virtuous growth cycles. However, distinct from mechanisms in other research, here weemphasize the role of an incipient middle class to be of interest to political entrepreneurs throughspecial interest politics. It is the size of this class that politically ensures public good provision,and thus decreases in inequality are meaningful only insofar as they strengthen this group relativeto the wealthy: in our setting, only such ‘targeted’ policies or events change the political calculus,in line with evidence as provided by Acemoglu et al. (2005). This observation suggests that theempirical tests of the relationship between inequality and growth might be confounded by the factthat it is not overall inequality, but rather the balance of economic strength between actors above acertain asset threshold that matters for inclusive growth.
ReferencesACEMOGLU, D., S. JOHNSON, AND J. ROBINSON (2005): “The Rise of Europe: Atlantic Trade,
Institutional Change, and Economic Growth,” American Economic Review, 546–579.
ACEMOGLU, D. AND J. A. ROBINSON (2006): Economic Origins of Dictatorship and Democ-racy, Cambridge University Press.
——— (2013): “Economics versus Politics: Pitfalls of Policy Advice,” Journal of Economic Per-spectives, 27, 173–192.
43Indeed, there is evidence that the accumulation of human capital generates later improvement in political insti-tutions (Glaeser et al., 2004). If human capital is complementary to commercial production as modelled here, thenhuman capital accumulation would later improve institutions and growth simultaneously.
28
AKERMAN, A., A. L. SEIM, AND A. NAGHAVI (2013): “Autocracies and Development in aGlobal Economy: A Tale of Two Elites,” Working Paper.
AOKI, M., T. KURAN, AND G. ROLAND (2012): Institutions and Comparative Economic Devel-opment, vol. 150, Palgrave Macmillan.
AOKI, M., M. OKUNO-FUJIWARA, AND H.-K. KIM, eds. (1998): The Role of Governmentin East Asian Economic Development: Comparative Institutional Analysis, Oxford UniversityPress, USA.
BARDHAN, P. AND D. MOOKHERJEE (2000): “Capture and Governance at Local and NationalLevels,” The American Economic Review, 90, 135–139.
——— (2006): “Pro-poor Targeting and Accountability of Local Governments in West Bengal,”Journal of Development Economics, 79, 303–327.
BARRETT, C. B. AND M. R. CARTER (2013): “The Economics of Poverty Traps and PersistentPoverty: Policy and Empirical Implications,” Journal of Development Studies.
BENABOU, R. (2000): “Unequal Societies: Income Distribution and the Social Contract,” Ameri-can Economic Review, 96–129.
BIRDSALL, N., C. GRAHAM, AND R. H. SABOT (1998): Beyond Tradeoffs: Market Reforms andEquitable Growth in Latin America, Brookings Institution Press.
BOUCHER, S. R., M. R. CARTER, AND C. GUIRKINGER (2007): “Risk Rationing and WealthEffects in Credit Markets: Theory and Implications for Agricultural Development,” AmericanJournal of Agricultural Economics, 90, 409–423.
BURGESS, R., R. JEDWAB, E. MIGUEL, A. MORJARIA, AND G. P. I. MIQUEL (2013): “TheValue of Democracy: Evidence from Road Building in Kenya,” NBER Working Paper.
CARTER, M. AND J. COLES (1998): “Inequality-reducing growth in agriculture: a market-friendlypolicy agenda,” Beyond tradeoffs: market reforms and equitable growth in Latin America, 147–182.
CARTER, M. R. (1988): “Equilibrium Credit Rationing of Small Farm Agriculture,” Journal ofDevelopment Economics, 28, 83–103.
——— (1997): “Environment, Technology, and the Social Articulation of Risk in West AfricanAgriculture,” Economic Development and Cultural Change, 45, 557–590.
CARTER, M. R. AND B. L. BARHAM (1996): “Level Playing Fields and Laissez Faire: PostliberalDevelopment Strategy in Inegalitarian Agrarian Economies,” World Development, 24, 1133–1149.
CARTER, M. R. AND M. IKEGAMI (2009): Poverty Dynamics: Interdisciplinary Perspectives,Oxford University Press, chap. Looking Forward: Theory Based Measures of Chronic Povertyand Vulnerability.
29

CHEIBUB, J. A. AND A. PRZEWORSKI (1997): “Government Spending and Economic GrowthUnder Democracy and Dictatorship,” in Understanding Democracy, ed. by Breton, A., et al,Cambridge University Press, 107–124.
COGNEAU, D. (2012): “The Political Dimension of Inequality During Economic Development,”Region et Developpement, 35, 11–36.
COWAN, T. AND J. FEDER (2012): “The Pigford Cases: USDA Settlement of Discrimination Suitsby Black Farmers,” Congressional Research Service.
DE LUCA, G., A. LITINA, AND P. G. SEKERIS (2013): “Growth-friendly Dictatorships,” Journalof Comparative Economics.
DIXIT, A. (1997): “Economists as Advisers to Politicians and to Society,” Economics & Politics,9, 225–230.
DOEPKE, M. AND F. ZILIBOTTI (2005): “Social Class and the Spirit of Capitalism,” Journal ofthe European Economic Association, 3, 516–524.
DUFLO, E. AND R. PANDE (2007): “Dams,” The Quarterly Journal of Economics, 122, 601–646.
ESWARAN, M. AND A. KOTWAL (1986): “Access to Capital and Agrarian Production Organiza-tion,” Economic Journal, 96, 482–498.
FAN, S. AND J. BRZESKA (2010): Handbook of Agricultural Economics, vol 4, Elseveir Press,chap. Production, Productivity and Public Investment in East Asian Agriculture.
FAN, S. AND P. PARDEY (1992): Agricultural research in China: Its institutional developmentand impact, International Service for National Agricultural Research.
FERGUSON, W. (2013): Collective Action and Exchange: A Game-theoretic Approach to Contem-porary Political Economy, Stanford University Press.
GALOR, O., O. MOAV, AND D. VOLLRATH (2009): “Inequality in Landownership, the Emer-gence of Human-capital Promoting Institutions, and the Great Divergence,” The Review of Eco-nomic Studies, 76, 143–179.
GEHLBACH, S. (2006): “Electoral Institutions and the National Provision of Local Public Goods,”Quarterly Journal of Political Science, 2, 5–25.
——— (2013): Formal Models of Domestic Politics, Cambridge University Press.
GLAESER, E. L., R. LA PORTA, F. LOPEZ-DE SILANES, AND A. SHLEIFER (2004): “Do Insti-tutions Cause Growth?” Journal of Economic Growth, 9, 271–303.
JANZEN, S. A. AND M. R. CARTER (2013): “After the Drought: The Impact of Microinsuranceon Consumption Smoothing and Asset Protection,” NBER Working Paper.
KITAMURA, S. (2013): “Loyalty and Treason: Theory and Evidence from Occupied Japan,” Work-ing Paper.
30
KREBS, T. (2003): “Human Capital Risk and Economic Growth,” The Quarterly Journal of Eco-nomics, 118, 709–744.
LJUNGQVIST, L. (1993): “Economic Underdevelopment: The Case of a Missing Market for Hu-man Capital,” Journal of Development Economics, 40, 219–239.
MATSUYAMA, K. (2006): “The 2005 Lawrence R. Klein Lecture: Emergent Class Structure,”International Economic Review, 47, 327–360.
——— (2011): “Imperfect Credit Markets, Household Wealth Distribution, and Development,”Annual Review of Economics, 3, 339–362.
MCINTOSH, C., A. SARRIS, AND F. PAPADOPOULOS (2013): “Productivity, Credit, Risk, andthe Demand for Weather Index Insurance in Smallholder Agriculture in Ethiopia,” AgriculturalEconomics, 44, 399–417.
OLOVSSON, C. AND J. ROINE (2008): “On the Possibility of Political Change,” Working Paper.
PAGE, J. (1994): “The East Asian Miracle: Four Lessons for Development Policy,” in NBERMacroeconomics Annual 1994, Volume 9, MIT Press, 219–282.
PERSSON, T. AND G. TABELLINI (2000): Political Economics: Explaining Economic Policy, MITPress.
PIERSON, P. (2000): “Increasing Returns, Path Dependence, and the Study of Politics,” AmericanPolitical Science Review, 251–267.
PRZEWORSKI, A. AND F. LIMONGI (1993): “Political Regimes and Economic Growth,” TheJournal of Economic Perspectives, 51–69.
RODRIK, D. (1994): “King Kong Meets Godzilla: The World Bank and the East Asian Miracle,”Centre for Economic Policy Research.
ROEMER, J. E. (1982): A General Theory of Exploitation and Class, Cambridge, MA: HarvardUniversity Press.
SEN, A., N. STERN, AND J. STIGLITZ (1990): “Development Strategies: The Roles of the Stateand the Private Sector,” in Proceedings of the World Bank Annual Conference on DevelopmentEconomics, 421–35.
STIGLITZ, J. E. AND A. WEISS (1981): “Credit Rationing in Markets with Imperfect Informa-tion,” The American Economic Review, 71, 393–410.
TOMICH, T. P., P. KILBY, AND B. F. JOHNSTON (1995): Transforming Agrarian Economies:Opportunities Seized, Opportunities Missed, Cornell University Press.
WADE, R. H. (1988): “The Management of Irrigation Systems: How to Evoke Trust and AvoidPrisoner’s Dilemma,” World Development, 16, 489–500.
31
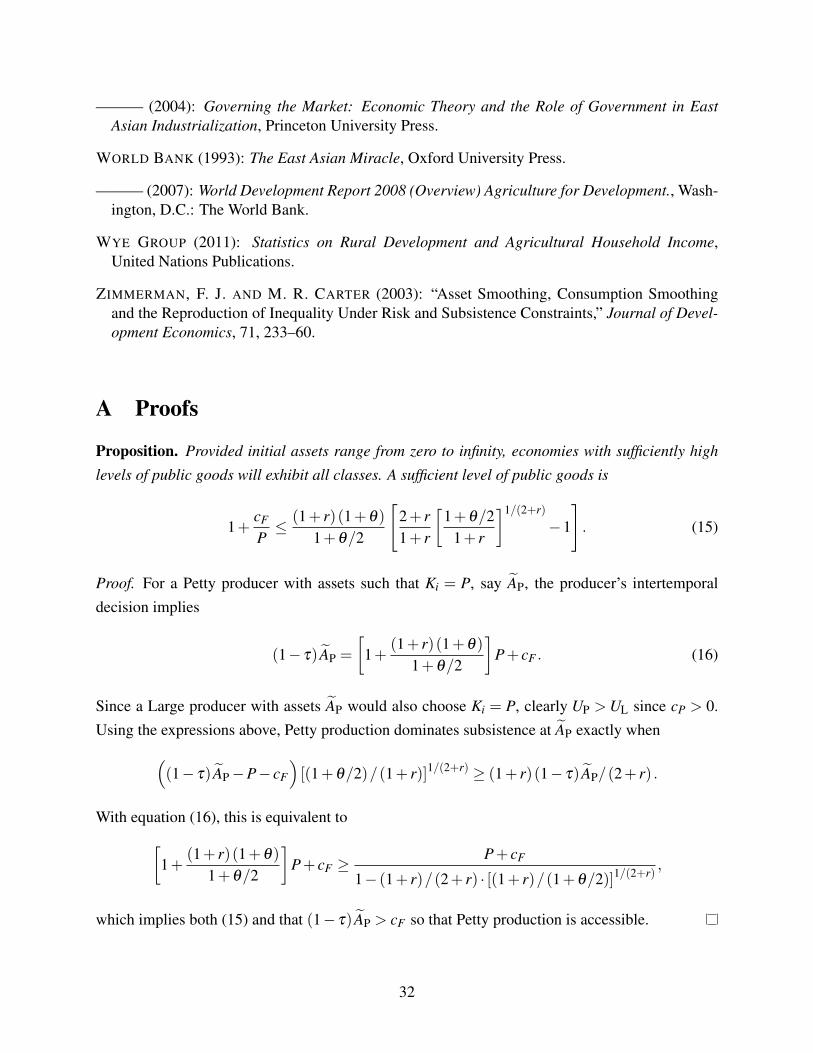
——— (2004): Governing the Market: Economic Theory and the Role of Government in EastAsian Industrialization, Princeton University Press.
WORLD BANK (1993): The East Asian Miracle, Oxford University Press.
——— (2007): World Development Report 2008 (Overview) Agriculture for Development., Wash-ington, D.C.: The World Bank.
WYE GROUP (2011): Statistics on Rural Development and Agricultural Household Income,United Nations Publications.
ZIMMERMAN, F. J. AND M. R. CARTER (2003): “Asset Smoothing, Consumption Smoothingand the Reproduction of Inequality Under Risk and Subsistence Constraints,” Journal of Devel-opment Economics, 71, 233–60.
A Proofs
Proposition. Provided initial assets range from zero to infinity, economies with sufficiently high
levels of public goods will exhibit all classes. A sufficient level of public goods is
1+cF
P≤ (1+ r)(1+θ)
1+θ/2
[2+ r1+ r
[1+θ/2
1+ r
]1/(2+r)
−1
]. (15)
Proof. For a Petty producer with assets such that Ki = P, say AP, the producer’s intertemporaldecision implies
(1− τ) AP =
[1+
(1+ r)(1+θ)
1+θ/2
]P+ cF . (16)
Since a Large producer with assets AP would also choose Ki = P, clearly UP > UL since cP > 0.Using the expressions above, Petty production dominates subsistence at AP exactly when(
(1− τ) AP−P− cF
)[(1+θ/2)/(1+ r)]1/(2+r) ≥ (1+ r)(1− τ) AP/(2+ r) .
With equation (16), this is equivalent to[1+
(1+ r)(1+θ)
1+θ/2
]P+ cF ≥
P+ cF
1− (1+ r)/(2+ r) · [(1+ r)/(1+θ/2)]1/(2+r),
which implies both (15) and that (1− τ) AP > cF so that Petty production is accessible.
32
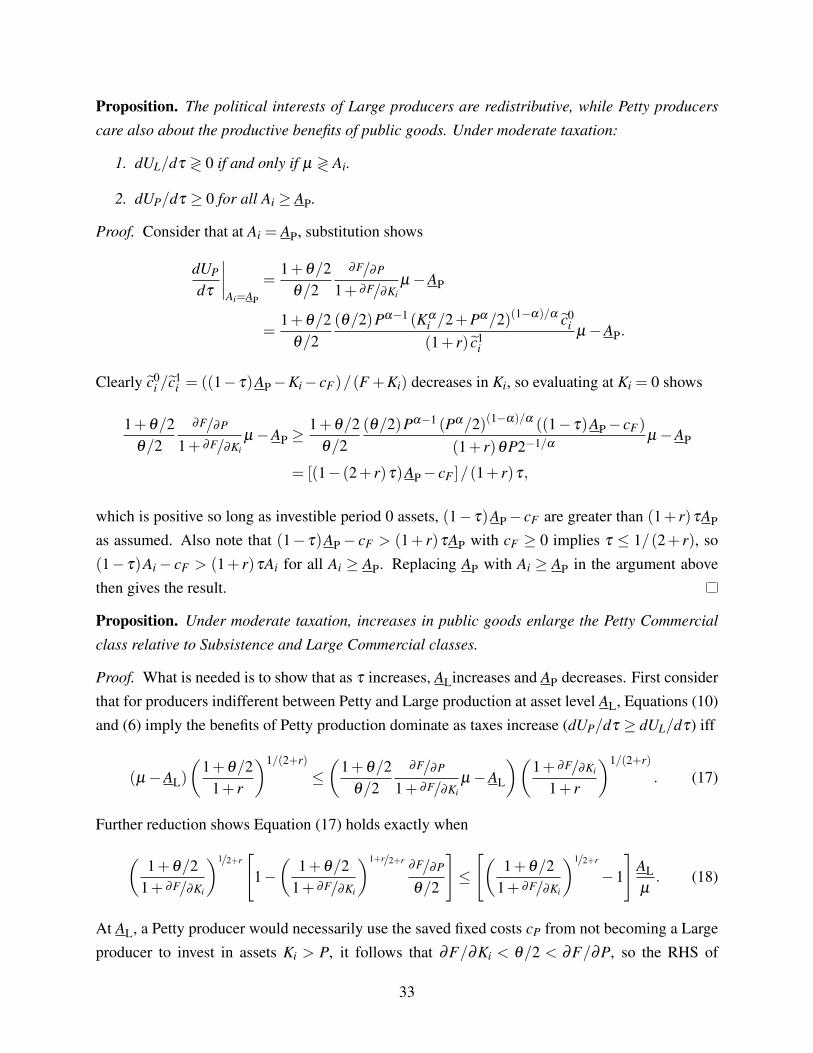
Proposition. The political interests of Large producers are redistributive, while Petty producers
care also about the productive benefits of public goods. Under moderate taxation:
1. dUL/dτ ≷ 0 if and only if µ ≷ Ai.
2. dUP/dτ ≥ 0 for all Ai ≥ AP.
Proof. Consider that at Ai = AP, substitution shows
dUP
dτ
∣∣∣∣Ai=AP
=1+θ/2
θ/2
∂F/∂P
1+ ∂F/∂Kiµ−AP
=1+θ/2
θ/2(θ/2)Pα−1 (Kα
i /2+Pα/2)(1−α)/α c0i
(1+ r) c1i
µ−AP.
Clearly c0i /c1
i = ((1− τ)AP−Ki− cF)/(F +Ki) decreases in Ki, so evaluating at Ki = 0 shows
1+θ/2θ/2
∂F/∂P
1+ ∂F/∂Kiµ−AP ≥
1+θ/2θ/2
(θ/2)Pα−1 (Pα/2)(1−α)/α ((1− τ)AP− cF)
(1+ r)θP2−1/αµ−AP
= [(1− (2+ r)τ)AP− cF ]/(1+ r)τ,
which is positive so long as investible period 0 assets, (1− τ)AP− cF are greater than (1+ r)τAP
as assumed. Also note that (1− τ)AP− cF > (1+ r)τAP with cF ≥ 0 implies τ ≤ 1/(2+ r), so(1− τ)Ai− cF > (1+ r)τAi for all Ai ≥ AP. Replacing AP with Ai ≥ AP in the argument abovethen gives the result.
Proposition. Under moderate taxation, increases in public goods enlarge the Petty Commercial
class relative to Subsistence and Large Commercial classes.
Proof. What is needed is to show that as τ increases, ALincreases and AP decreases. First considerthat for producers indifferent between Petty and Large production at asset level AL, Equations (10)and (6) imply the benefits of Petty production dominate as taxes increase (dUP/dτ ≥ dUL/dτ) iff
(µ−AL)
(1+θ/2
1+ r
)1/(2+r)
≤(
1+θ/2θ/2
∂F/∂P
1+ ∂F/∂Kiµ−AL
)(1+ ∂F/∂Ki
1+ r
)1/(2+r)
. (17)
Further reduction shows Equation (17) holds exactly when
(1+θ/2
1+ ∂F/∂Ki
)1/2+r[
1−(
1+θ/21+ ∂F/∂Ki
)1+r/2+r∂F/∂P
θ/2
]≤
[(1+θ/2
1+ ∂F/∂Ki
)1/2+r
−1
]ALµ. (18)
At AL, a Petty producer would necessarily use the saved fixed costs cP from not becoming a Largeproducer to invest in assets Ki > P, it follows that ∂F/∂Ki < θ/2 < ∂F/∂P, so the RHS of
33
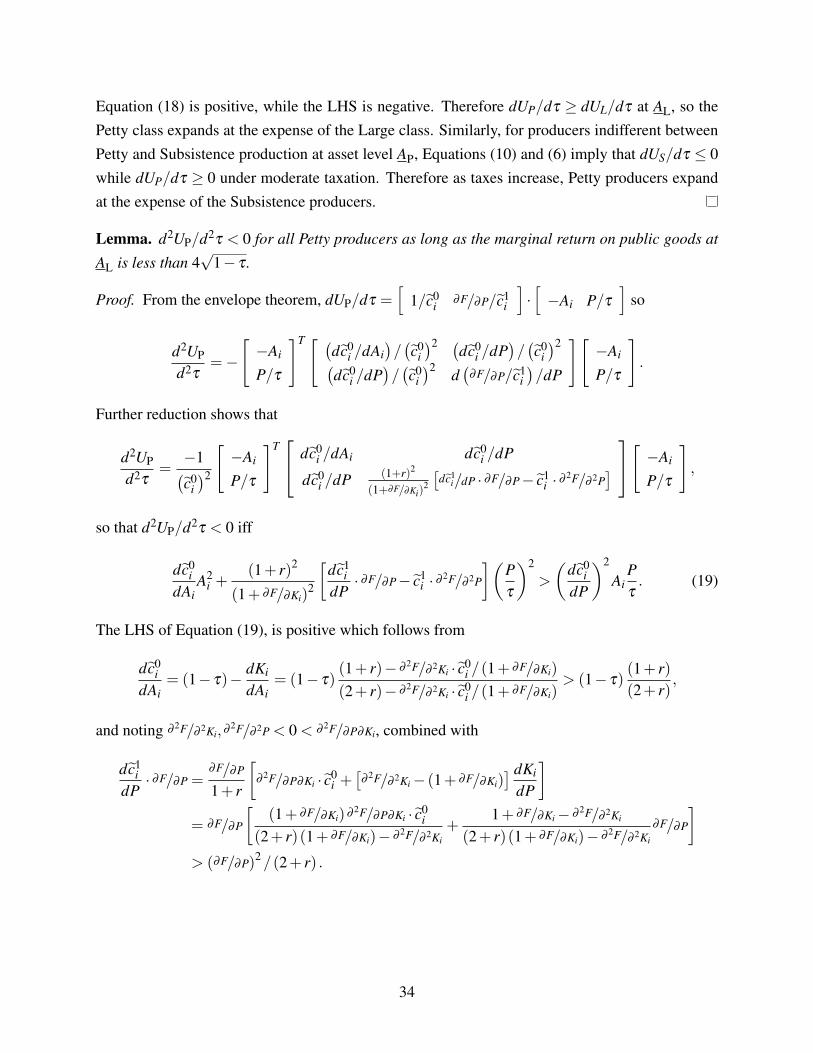
Equation (18) is positive, while the LHS is negative. Therefore dUP/dτ ≥ dUL/dτ at AL, so thePetty class expands at the expense of the Large class. Similarly, for producers indifferent betweenPetty and Subsistence production at asset level AP, Equations (10) and (6) imply that dUS/dτ ≤ 0while dUP/dτ ≥ 0 under moderate taxation. Therefore as taxes increase, Petty producers expandat the expense of the Subsistence producers.
Lemma. d2UP/d2τ < 0 for all Petty producers as long as the marginal return on public goods at
AL is less than 4√
1− τ .
Proof. From the envelope theorem, dUP/dτ =[
1/c0i
∂F/∂P/c1i
]·[−Ai P/τ
]so
d2UP
d2τ=−
[−Ai
P/τ
]T [ (dc0
i /dAi)/(c0
i)2 (
dc0i /dP
)/(c0
i)2(
dc0i /dP
)/(c0
i)2 d
(∂F/∂P/c1
i)/dP
][−Ai
P/τ
].
Further reduction shows that
d2UP
d2τ=−1(c0
i)2
[−Ai
P/τ
]T dc0
i /dAi dc0i /dP
dc0i /dP (1+r)2
(1+∂F/∂Ki)2
[dc1
i/dP · ∂F/∂P− c1i · ∂
2F/∂ 2P][ −Ai
P/τ
],
so that d2UP/d2τ < 0 iff
dc0i
dAiA2
i +(1+ r)2
(1+ ∂F/∂Ki)2
[dc1
idP· ∂F/∂P− c1
i · ∂ 2F/∂ 2P
](Pτ
)2
>
(dc0
idP
)2
AiPτ. (19)
The LHS of Equation (19), is positive which follows from
dc0i
dAi= (1− τ)− dKi
dAi= (1− τ)
(1+ r)− ∂ 2F/∂ 2Ki · c0i /(1+ ∂F/∂Ki)
(2+ r)− ∂ 2F/∂ 2Ki · c0i /(1+ ∂F/∂Ki)
> (1− τ)(1+ r)(2+ r)
,
and noting ∂ 2F/∂ 2Ki,∂ 2F/∂ 2P < 0 < ∂ 2F/∂P∂Ki, combined with
dc1i
dP· ∂F/∂P =
∂F/∂P
1+ r
[∂ 2F/∂P∂Ki · c0
i +[
∂ 2F/∂ 2Ki− (1+ ∂F/∂Ki)] dKi
dP
]= ∂F/∂P
[(1+ ∂F/∂Ki)∂ 2F/∂P∂Ki · c0
i(2+ r)(1+ ∂F/∂Ki)− ∂ 2F/∂ 2Ki
+1+ ∂F/∂Ki− ∂ 2F/∂ 2Ki
(2+ r)(1+ ∂F/∂Ki)− ∂ 2F/∂ 2Ki
∂F/∂P
]> (∂F/∂P)2 /(2+ r) .
34
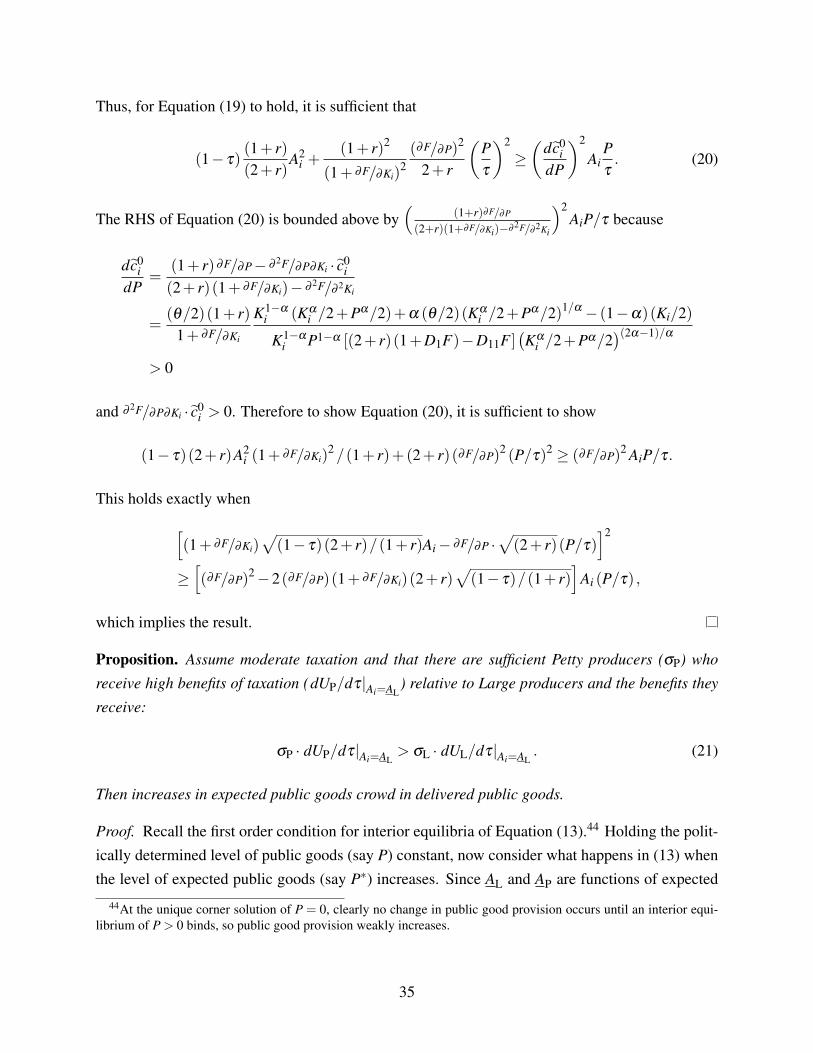
Thus, for Equation (19) to hold, it is sufficient that
(1− τ)(1+ r)(2+ r)
A2i +
(1+ r)2
(1+ ∂F/∂Ki)2(∂F/∂P)2
2+ r
(Pτ
)2
≥(
dc0i
dP
)2
AiPτ. (20)
The RHS of Equation (20) is bounded above by(
(1+r)∂F/∂P
(2+r)(1+∂F/∂Ki)−∂2F/∂2Ki
)2AiP/τ because
dc0i
dP=
(1+ r)∂F/∂P− ∂ 2F/∂P∂Ki · c0i
(2+ r)(1+ ∂F/∂Ki)− ∂ 2F/∂ 2Ki
=(θ/2)(1+ r)
1+ ∂F/∂Ki
K1−α
i (Kαi /2+Pα/2)+α (θ/2)(Kα
i /2+Pα/2)1/α − (1−α)(Ki/2)
K1−α
i P1−α [(2+ r)(1+D1F)−D11F ](Kα
i /2+Pα/2)(2α−1)/α
> 0
and ∂ 2F/∂P∂Ki · c0i > 0. Therefore to show Equation (20), it is sufficient to show
(1− τ)(2+ r)A2i (1+ ∂F/∂Ki)
2 /(1+ r)+(2+ r)(∂F/∂P)2 (P/τ)2 ≥ (∂F/∂P)2 AiP/τ.
This holds exactly when[(1+ ∂F/∂Ki)
√(1− τ)(2+ r)/(1+ r)Ai− ∂F/∂P ·
√(2+ r)(P/τ)
]2
≥[(∂F/∂P)2−2(∂F/∂P)(1+ ∂F/∂Ki)(2+ r)
√(1− τ)/(1+ r)
]Ai (P/τ) ,
which implies the result.
Proposition. Assume moderate taxation and that there are sufficient Petty producers (σP) who
receive high benefits of taxation (dUP/dτ|Ai=AL) relative to Large producers and the benefits they
receive:
σP · dUP/dτ|Ai=AL> σL · dUL/dτ|Ai=AL
. (21)
Then increases in expected public goods crowd in delivered public goods.
Proof. Recall the first order condition for interior equilibria of Equation (13).44 Holding the polit-ically determined level of public goods (say P) constant, now consider what happens in (13) whenthe level of expected public goods (say P∗) increases. Since AL and AP are functions of expected
44At the unique corner solution of P = 0, clearly no change in public good provision occurs until an interior equi-librium of P > 0 binds, so public good provision weakly increases.
35
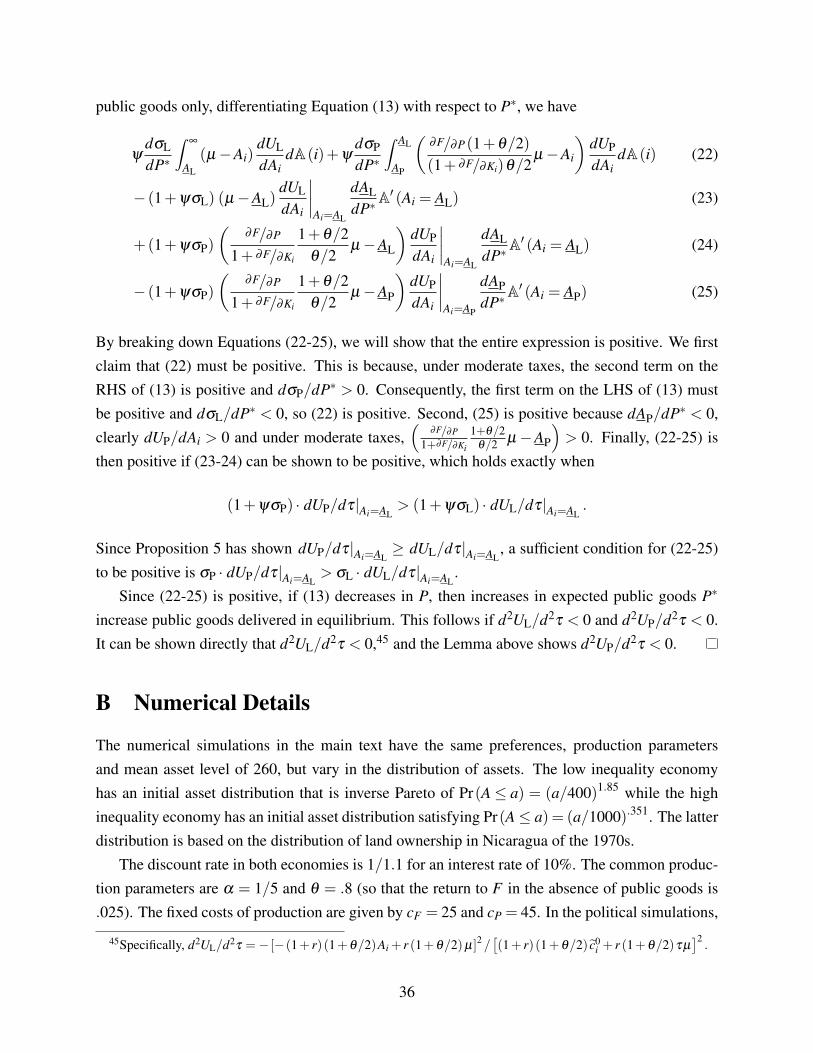
public goods only, differentiating Equation (13) with respect to P∗, we have
ψdσL
dP∗
∫∞
AL
(µ−Ai)dUL
dAidA(i)+ψ
dσP
dP∗
∫ AL
AP
(∂F/∂P(1+θ/2)(1+ ∂F/∂Ki)θ/2
µ−Ai
)dUP
dAidA(i) (22)
− (1+ψσL) (µ−AL)dUL
dAi
∣∣∣∣Ai=AL
dALdP∗
A′ (Ai = AL) (23)
+(1+ψσP)
(∂F/∂P
1+ ∂F/∂Ki
1+θ/2θ/2
µ−AL
)dUP
dAi
∣∣∣∣Ai=AL
dALdP∗
A′ (Ai = AL) (24)
− (1+ψσP)
(∂F/∂P
1+ ∂F/∂Ki
1+θ/2θ/2
µ−AP
)dUP
dAi
∣∣∣∣Ai=AP
dAPdP∗
A′ (Ai = AP) (25)
By breaking down Equations (22-25), we will show that the entire expression is positive. We firstclaim that (22) must be positive. This is because, under moderate taxes, the second term on theRHS of (13) is positive and dσP/dP∗ > 0. Consequently, the first term on the LHS of (13) mustbe positive and dσL/dP∗ < 0, so (22) is positive. Second, (25) is positive because dAP/dP∗ < 0,clearly dUP/dAi > 0 and under moderate taxes,
(∂F/∂P
1+∂F/∂Ki
1+θ/2θ/2 µ−AP
)> 0. Finally, (22-25) is
then positive if (23-24) can be shown to be positive, which holds exactly when
(1+ψσP) · dUP/dτ|Ai=AL> (1+ψσL) · dUL/dτ|Ai=AL
.
Since Proposition 5 has shown dUP/dτ|Ai=AL≥ dUL/dτ|Ai=AL
, a sufficient condition for (22-25)to be positive is σP · dUP/dτ|Ai=AL
> σL · dUL/dτ|Ai=AL.
Since (22-25) is positive, if (13) decreases in P, then increases in expected public goods P∗
increase public goods delivered in equilibrium. This follows if d2UL/d2τ < 0 and d2UP/d2τ < 0.It can be shown directly that d2UL/d2τ < 0,45 and the Lemma above shows d2UP/d2τ < 0.
B Numerical Details
The numerical simulations in the main text have the same preferences, production parametersand mean asset level of 260, but vary in the distribution of assets. The low inequality economyhas an initial asset distribution that is inverse Pareto of Pr(A≤ a) = (a/400)1.85 while the highinequality economy has an initial asset distribution satisfying Pr(A≤ a) = (a/1000).351. The latterdistribution is based on the distribution of land ownership in Nicaragua of the 1970s.
The discount rate in both economies is 1/1.1 for an interest rate of 10%. The common produc-tion parameters are α = 1/5 and θ = .8 (so that the return to F in the absence of public goods is.025). The fixed costs of production are given by cF = 25 and cP = 45. In the political simulations,
45Specifically, d2UL/d2τ =− [−(1+ r)(1+θ/2)Ai + r (1+θ/2)µ]2 /[(1+ r)(1+θ/2) c0
i + r (1+θ/2)τµ]2.
36
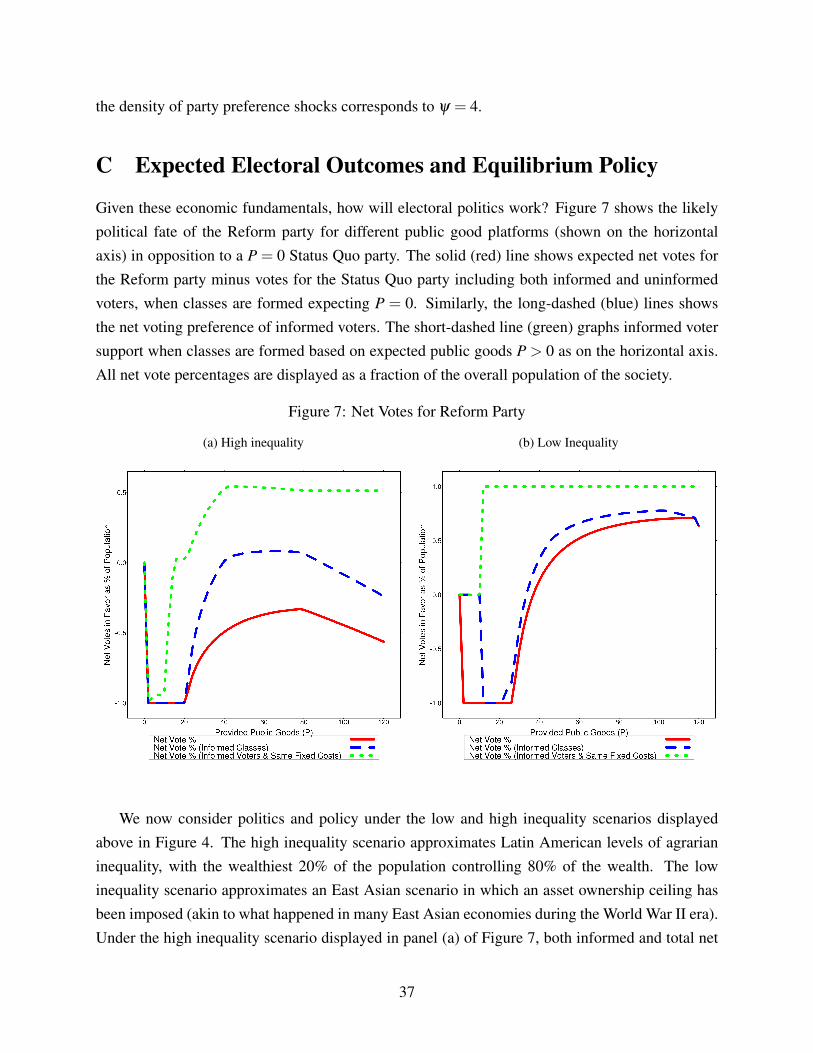
the density of party preference shocks corresponds to ψ = 4.
C Expected Electoral Outcomes and Equilibrium Policy
Given these economic fundamentals, how will electoral politics work? Figure 7 shows the likelypolitical fate of the Reform party for different public good platforms (shown on the horizontalaxis) in opposition to a P = 0 Status Quo party. The solid (red) line shows expected net votes forthe Reform party minus votes for the Status Quo party including both informed and uninformedvoters, when classes are formed expecting P = 0. Similarly, the long-dashed (blue) lines showsthe net voting preference of informed voters. The short-dashed line (green) graphs informed votersupport when classes are formed based on expected public goods P > 0 as on the horizontal axis.All net vote percentages are displayed as a fraction of the overall population of the society.
Figure 7: Net Votes for Reform Party
(a) High inequality (b) Low Inequality
We now consider politics and policy under the low and high inequality scenarios displayedabove in Figure 4. The high inequality scenario approximates Latin American levels of agrarianinequality, with the wealthiest 20% of the population controlling 80% of the wealth. The lowinequality scenario approximates an East Asian scenario in which an asset ownership ceiling hasbeen imposed (akin to what happened in many East Asian economies during the World War II era).Under the high inequality scenario displayed in panel (a) of Figure 7, both informed and total net
37
votes for the Reform party are overwhelmingly negative, especially for small steps away from theP = 0 status quo. It is of course the money the informed voters (large scale commercial producersin this case) that drive the votes of the large mass of uninformed voters. Even if the Reform partyradically promises a policy of relatively high taxes and public good provision, net votes still remainnegative. Wealth inequality in this case continues to drive politics even though more individualsbecome informed and interested in supporting public good policies.
It is important stress here that politics are here being driven by the same liquidity constraintsthat drive production choices. Individuals must self-finance their own investment through reducedconsumption. Similarly, the assumed borrowing constraint prevents voters from borrowing to fi-nance the election of a party that would improve their economic well-being.
Panel b of Figure 7 displays expected electoral outcomes under the low initial inequality sce-nario. Here, a Reform party promise of modest amounts of public good will meet with neithersupport nor opposition by any informed group. Elections should thus be a toss-up. However, aReform party promise of more significant amounts of public goods (P≈ 30) begins to garner someinformed support. A promise of quite high levels of tax-financed public goods (P > 100) gar-ners the greatest amount of informed political support. While there are still taxpayers in the lowinequality economy that will pay more in taxes then they receive in public goods, the returns topublic goods are extraordinarily high for this class of voters as public capital augments the pro-ductivity of private capital. These groups thus find it in their interest to support reform parties andpolicies for relatively high public expenditure levels.
38


