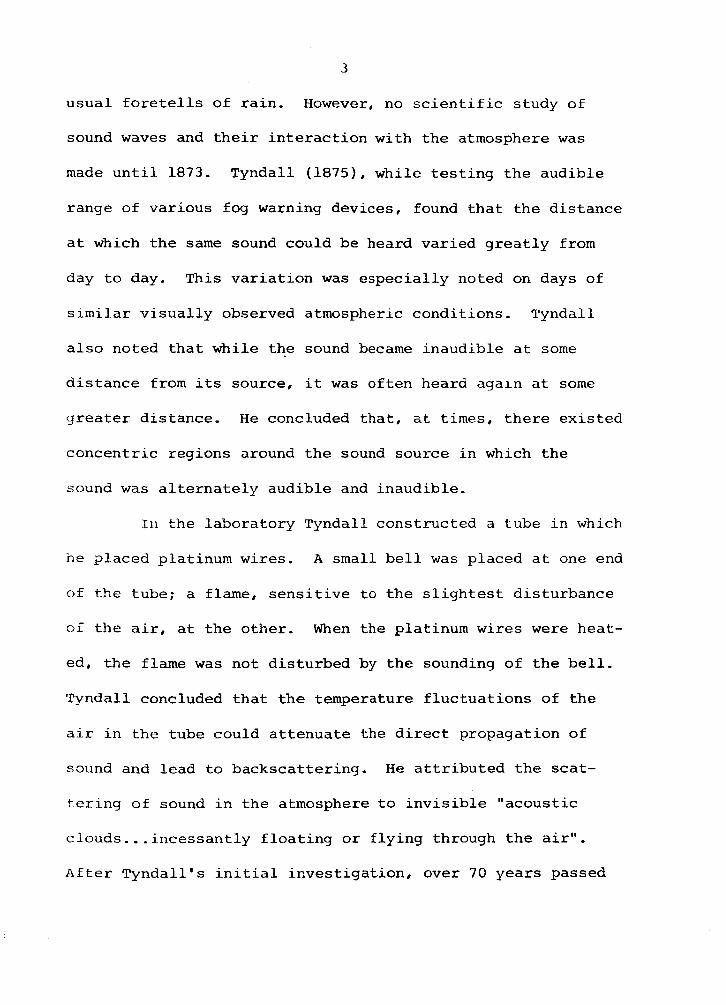
THE PLMETARY BOUNDARY LAYER - NASA. Acoustic radar facsimile record for 1700-2100 CST 4 August 1972...
90
THE PLMETARY BOUNDARY LAYER an, Okh 73~143 https://ntrs.nasa.gov/search.jsp?R=19740015049 2018-06-25T11:06:21+00:00Z
Transcript of THE PLMETARY BOUNDARY LAYER - NASA. Acoustic radar facsimile record for 1700-2100 CST 4 August 1972...
THE PLMETARY BOUNDARY LAYER
an, O k h 73~143
https://ntrs.nasa.gov/search.jsp?R=19740015049 2018-06-25T11:06:21+00:00Z
I . REPORT NO. 2. GOVERNWMT ACCESSION NO. 3. RECIPIENT'S CATALOG NO. ma43
Edward H. Kelly
University of Oklahoma 3. PERFORMING ORGANIZATION NAME Aillo ADDRESS
Norman, Oklahoma 73069
2. SPONSORING AGENCY NAME AM0 ADDRESS
1. T I T L E AN0 SUBTITLE I 5. REPORT. OATE I
10. WORK UNIT NO.
11. CONTRACT OR GRANT NO. NAS8-28659 13. OF REPORC dr PERIOD COVERE0
Acoustic Sounding i n the Planetary Boundary Layer I 6. PERFORMlNG ORGANIZATION CCOE I M i 2 7 I g.PERFORMING ORGANIZATION REPORr # 7. AUTHORIS)
National Aeronautics and Space Administration Washington, D.C. 20546 Contractor
I
15. SUPPLEMENTARY NOTES
Prepared under t h e technical monitorship of t h e Aerospace Environment Division, Aero-Astrodynamics Laboratory, NASA-Marshall Space Fl ight Center.
16. ABSTRACT Three case s tudies are presented involving data from an acoustic radar. The first
two cases examine da ta col lected during t h e passage of a mesoscale cold-air in t rus ion , probably thunderstorm outflow, and a synoptic-scale cold front . radar da ta a r e compared t o conventional meteorological da ta obtained from t h e WKY tower f a c i l i t y f o r t h e purpose of radar d a t a Znterpretation. radar echoes reveal t h e boundary between warm and cold a i r and o ther areas of turbulent mixing, regions of strong vertical temperature gradients, and areas of weak o r no wind shear.
The t h i r d case study examines the relat ionship between the nocturnal rad ia t ion inversion and t h e low-level wind maximum o r j e t i n the l i g h t of conclusions presented by Blackadar (1957). inversion. Sudden rapid growth of t h e inversion occurs which brings t h e top of the inversion t o a height equal t h a t of t h e j e t . inversion is a sudden decrease i n the i n t e n s i t y of t h e acoust ic radar echoes i n t h e inversion layer . It is suggested t h a t t h e decrease i n echo i n t e n s i t y reveals a decrease i n turbulent mixing i n t h e inversion layer a s predicted by Blackadar. The observed wind speed and d i r e c t i o n a r e seen t o correspond very w e l l with those predicted by t h e i n e r t i a l o s c i l l a t i o n theory suggested by Blackadar.
lower atmosphere and suggestions are made as t o possible uses.
I n these s tud ies t h e
It is shown t h a t t h e acoust ic
The low-level je t is seen forming w e l l above t h e top of t h e
Coincident with t h e rapid growth of t h e
It is concluded t h a t t h e acoust ic radar can be a valuable t o o l f o r study i n t h e
(8. DlSTRlblKlON STATEMENT 17. K E t WORDS
Acoustic Sounding Boundary Layer Remote Sensing
I CIYP. 20 121. NO. OF PAGES 22. PRICE f 19. SECURITY CLASSIF. (d t u
ACKNOWLEDGMENTS
The
and t h e A i r
opportuni ty
The
Inman under
couragement
i
I
author w i s h e s t o thank t h e A i r Weather Service
Force I n s t i t u t e of Technology f o r providing t h e
and scholarsh ip which made t h i s study possible .
author extends s ince re g r a t i t u d e t o D r . Rex L.
whose guidance t h i s research w a s done. H i s en-
and i n t e r e s t w e r e e s s e n t i a l t o t h e undertaking
and completion of t h i s study. Sincere apprec ia t ion i s ex-
I pressed t o Professors Yoshikazu Sasaki and Frank Hall f o r
t h e i r review of t h e manuscript and t h e i r h e l p f u l suggestions.
The author is deeply indebted t o Jack Marks f o r h i s
a s s i s t a n c e and encouragement; t o Charles Doswell whose ear
w a s always open: and t o Joe McFarland f o r placing a l i g h t
a t t h e end of t h e tunnel .
The personnel of t h e National Severe Storms Labora-
t o r y deserve a word of thanks for t h e i r i n t e r e s t i n t h i s
research and f o r supplying t h e WKY t o w e r da ta .
An expression of g r a t i t u d e and love is extended t o
my wife , Ina, and my t w o daughters, J e n n i f e r and Teresa,
iii
for their patience and understanding through, though they
will not admit it, a difficult time,
This research was done in connection with graduate
study at the University of Oklahoma. This research was
partially supported by the Atmospheric Sciences Section,
National Science Foundation, N S F Grant GA-35403, and by
the George C. Marshall Space Flight Center, contract NAS8-
28659.
iv
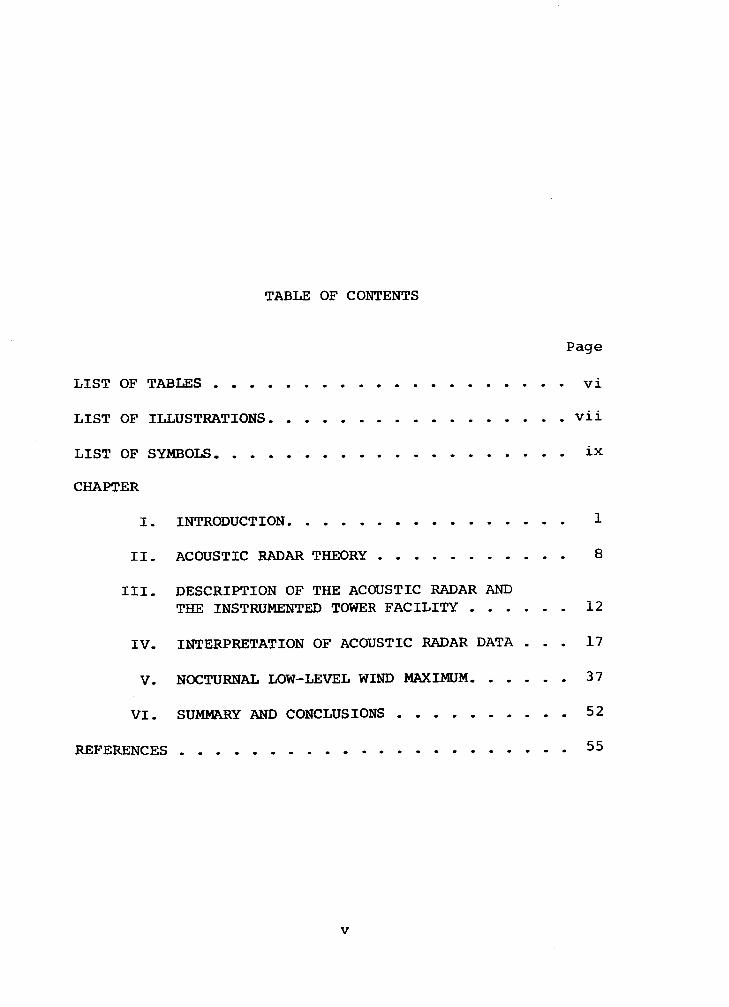
TABLE OF CONTENTS
P a g e
L I S T OF T A B L E S . . . . . . . . . . . . . . . . . . . . v i
L I S T OF ILLUSTRATIONS. . . v i i
L I S T OF SYMBOLS.. . . . . . . . . . . . . . . . . . . ix CHAPTER
I . INTRODUCTION. . . . . . . . . . . . . . . . 1
11. ACOUSTIC RADAR THEORY . . . . . . . . . . . 8
111. DESCRIPTION OF THE ACOUSTIC RADAR AND THE INSTRUMENTED TOWER FACILITY . . . . . . 12
I V . INTERPRETATION OF ACOUSTIC RADAR DATA . . . 17 V. NCXXTJRNAL LOW-LEVEL WIND MAXIMUM. . . . . . 37
V I . SUMMARY AND CONCLUSIONS . . . . . . . . . . 52 REFERENCES. . . . . . . . . . . . . . . . . . . . . . 55
V
LIST OF TABLES
Table Page
1. Acoustic radar parameters. . . . . . . . . . . 5 7
vi
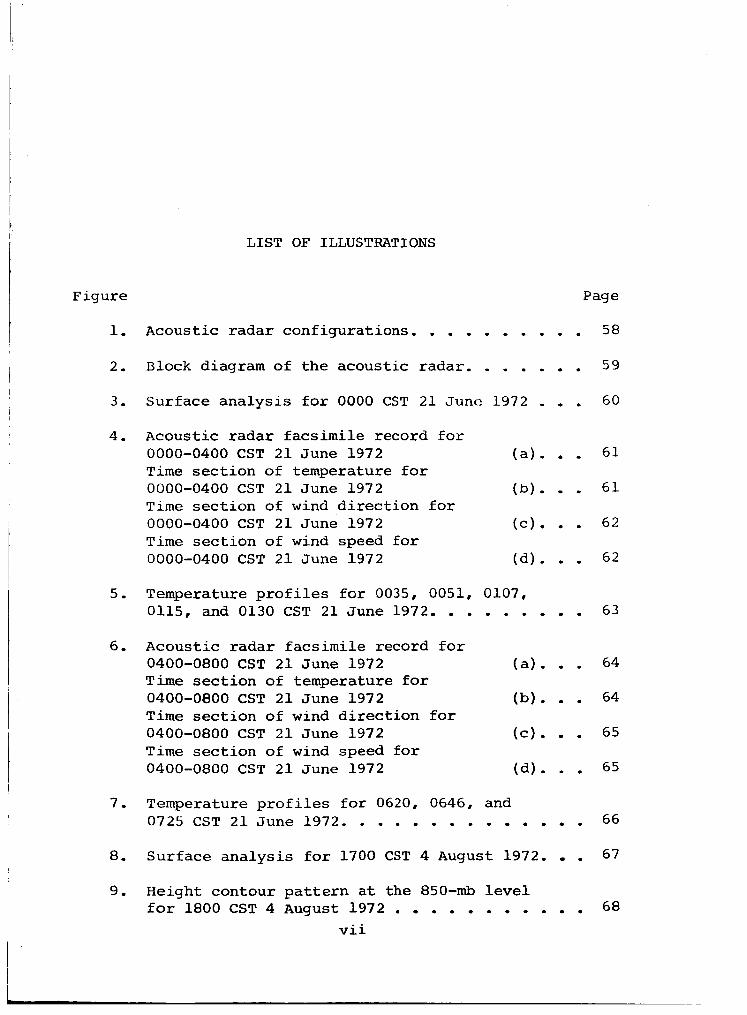
LIST OF ILLUSTRATIONS
Figure
1.
2.
3.
4.
5.
6 .
7.
8.
9.
Page
Acoustic r ada r configurat ions. . . . . . . . . . 58
Block diagram of t h e acoustic radar . . . . . . . 59
Surface a n a l y s i s f o r 0000 CST 2 1 June 1972 . . , 60
Acoustic r ada r f acs imi l e record for 0000-0400 CST 2 1 June 1972 ( a ) . . . 61 T i m e s e c t i o n of temperature f o r 0000-0400 CST 2 1 June 1972 (b). . . 61 T i m e s e c t i o n of wind d i r e c t i o n f o r 0000-0400 CST 2 1 June 1972 (c). . . 6 2 T i m e sect ion of wind speed f o r 0000-0400 CST 2 1 June 1972 (a ) . . . 62
Temperature p r o f i l e s f o r 00358 00518 01078 0115, and 0130 CST 2 1 June 1972. . . . . . . . . 63
Acoustic r ada r f acs imi l e record f o r 0400-0800 CST 2 1 June 1972 ( a ) . . . 64 T i m e section of temperature f o r 0400-0800 CST 2 1 June 1972 (b). . . 64 T i m e section of wind d i r e c t i o n f o r 0400-0800 CST 2 1 June 1972 ( c ) , . . 65 T i m e section of wind speed f o r 0400-0800 CST 2 1 June 1972 ( d ) . . . 65
Temperature p r o f i l e s f o r 0620, 0646, and 0725 CST 2 1 J u n e 1972. . . . . . . . . . . . . . 66
Surface a n a l y s i s f o r 1700 CST 4 August 1972. . 67
Height contour p a t t e r n a t t h e 850-mb level f o r 1800 CST 4 August 1972 . . . . . . . . . . . 68
v i i
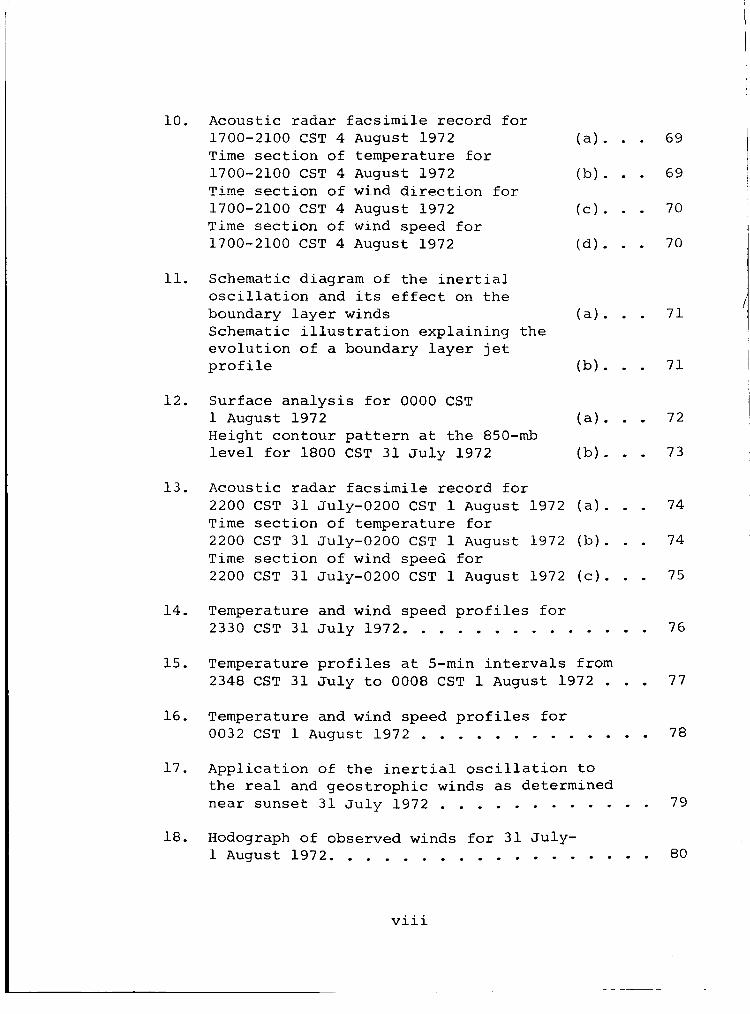
10. Acoustic radar facsimile record for 1700-2100 CST 4 August 1972 (a). . . 69 Time section of temperature for 1700-2100 CST 4 August 1972 (b). . . 69 Tirne sectior? of wind direction f o r 1700-2100 CST 4 August 1972 (c). . . 70 Time section of wind speed for 1700-2100 CST 4 August 1972 (d). . . 70
11. Schematic diagram of the inertial oscillation and its effect on the boundary layer winds (a). . . 71 Schematic illustration explaining the evolution of a boundary layer jet profile (b). . . 71
12. Surface analysis for 0000 CST 1 August 1972 (a). . . 72 Height contour pattern at the 850-mb level for 1800 CST 31 July 1972 (b). . . 73
13. Acoustic radar facsimile record for
Time section of temperature for
Time section of wind speed for
2200 CST 31 July-0200 CST 1 August 1972 (a). . I 74
2200 CST 31 July-0200 CST 1 August 1972 (b). . . 74 2200 CST 31 July-0200 CST 1 August 1972 (C). . . 75
I
14. Temperature and wind speed profiles for 2330 CST 31 July 1972. . . . . . . . . . . . . . 76
15. Temperature profiles at 5-min intervals from 2348 CST 31 July to 0008 CST 1 August 1972 . . . 77
16. Temperature and wind speed profiles for 0032 CST 1 August 1972 . . . . . . . . . . . . . 78
17. Application of the inertial oscillation to the real and geostrophic winds as determined near sunset 31 July 1972 . . . . . . . . . . . . 79
18. Hodograph of observed winds for 31 July- 1 August 1972. . . . . . . . . . . . . . . . . . 80
viii
LIST OF SYMBOLS 1
A antenna collecting area (m 2 )
1 C the speed of sound (m sec-l)
I temperature structure constant ( OK cm-1/3)
velocity structure constant (m sec-l cm-1'3)
cT
cv I
D air column depth
DT
D,
temperature structure function ( " 2 K )
velocity structure function (m2 sec-2)
f
k
L
P
Pr
r
R
t
T
V
Va
Coriolis parameter (sec-')
wave number of the ac'bustic wave (cm-l)
an attenuation factor
transmitted acoustic power (w)
received acoustic power (w)
distance (cm)
range (m)
time
temperature ( O K )
wind speed (m sec-l)
vector difference between the geostrophic and real wind
,
ix
t
geostrophic wind vg
Vmax p red ic ted maximum wind
vr r e a l wind
V ( t ) p red ic ted r e a l ' wind a t t i m e t
Td dry ad iaba t i c lapse ra te
i r e l a t i v e v o r t i c i t y (sec- l )
0 d i r e c t i o n acous t ic power i s s c a t t e r e d measured from the i n i t i a l d i r e c t i o n of propagation
x t ransmi t ted wave length ( c m )
CJ s c a t t e r e d power per uni . t volume pe r u!iit: incident f l u x pe r u n i t s o l i d angle i n t h e backsca t te r d i r e c t i o n
U ( 8 ) s c a t t e r e d power _ner u n i t volume per u n i t i n c i d e n t flux per u n i t s o l i u angle a t angle C from t h e i n i t i a l d i r e c t i o n of propagation
T t ransmi t ted pulse length ( S C C )
X
ACOUSTIC SOUNDING I N THE PLANETARY BOUNDARY LAYER
CHAPTER I
INTRODUCTION
I n recent years i t has become increas ingly evident
;.hat a b e t t e r understanding is needed. of the phys ica l pro-
zesses which are a c t i v e i n t he planetary boundary layer .
‘?his need i s e s p e c i a l l y apparent i n t n e a reas of low-level
c l o u d pred ic t ion , severe weather fa recas t1 nq, and t h e pre-
ciizcs101-i bf a i r po l lu t ion t ranspor t . The study necessary for
bet ter iiiiderstanding of t hese compiex processes has been ser-
ieusly hampered by t h e lack of ava i l ab le data. I n t h e p a s t ,
d i rect sensing methods such a s a i r c r a f t , instrumented towers,
and balloon-borne packages have been used to obta in d a t a f r o m
t:he boundary layer . ~ l l of these methods are expensive and,
ic: v a r y i n g degrees, d i s t u r b the f i e l d i n whicn measurements
.xe being made. Thus, i t has been d i f f i c u l t t o ob ta in t h e
q u a n t i t y and q u a l i t y of d a t a needed f o r meaningful study.
T h e search f o r a s o l u t i o n t o t h e problem of d a t a c o l l e c t i o n
1
2
i n t h e lower atmosphere has l ed meteorologis ts t o remote
sensing.
The chief advantage of a remote sensing instrument
i s its a b i l i t y t o ga the r information from reyions here-to-
f o r e inaccess ib le o r , a t best, d i f f i c u l t t o reach. The ob-
serva t ions a r e made remotely, without requi r ing t h a t the
instrument be placed i n t h e region from which information
i s desired. With remote sensing t h e r e i s no d is turbance o r
modification of t he f i e l d from which d a t a are bci.ny co l l ec t ed .
O f t h e remote sensing instruments deveioped i n re-
c e n t years t h e most promising as a t o o l f o r boundary l a y e r
study i s %he acous t ic radar . Because t h e atmosphere i s t h e
transmi.tting vehic le f o r sound waves, ~ C E : acous t i c radar i s
highly s e n s i t i v e to f l u c t u a t i o n s i n both temperature and ve-
Iclci ty , much more so than remote sensors employiriq e l e c t r o -
iiiaqnetic waves. The acous t i c r ada r can t h e r e f o r e be con-
s t ruc t ed from r e l a t i v e l y simple equipment which r e s u l t s i n
a l o w i n i t i a l c o s t compared t o a l t e r n a t i v e sounding methods.
The acous t ic radar can provide continuous h igh- reso lu t ion
observations automatical ly and inexpensively.
That t h e propagation of sound i s a f f e c t e d by atmos-
pheric condi t ions has been known f o r hundreds of years .
Digqes (1555) s t a t e d t h a t be l l s being heard f a r t h e r than
3
usual foretells of rain. However, no scientific study of
sound waves and their interaction with the atmosphere was
made until 1873. Tyndall (1875), while testing the audible
range of various fog warning devices, found that the distance
at which the same sound could be heard varied greatly from
day to day. This variation was especially noted on days of
similar visually observed atmospheric conditions, Tyndall
also noted that while the sound became inaudible at some
distance from its source, it was often heard again at some
greater distance. He concluded that, at times, there existed
concentric regions around the sound source in which the
sound was alternately audible and inaudible.
In the laboratory Tyndall constructed a tube in which
he placed platinum wires. A small bell was placed at one end
of the tube; a flame, sensitive to the slightest disturbance
of the air, at the other. When the platinum wires were heat-
ed, the flame was not disturbed by the sounding of the bell,
Tyndall concluded that the temperature fluctuations of the
air in the tube could attenuate the direct propagation of
sound and lead to backscattering. He attributed the scat-
tering of sound in the atmosphere to invisible "acoustic
clouds,,.incessantly floating or flying through the air".
After Tyndall's initial investigation, over 70 years passed
4
b e f o r e t h e t e c h n i q u e w a s s t u d i e d a g a i n as an a tmosphe r i c
p robe
I n 1944, Gilman e t a l . (1946) used a c o u s t i c b a c k s c a t -
t e r t o s t u d y low- leve l t e m p e r a t u r e i n v e r s i o n s and t h e i r e f f e c t s
on t h e p r o p a g a t i o n of microwave communications.
amount o f a tmosphe r i c s t r u c t u r e unde r t h e i n v e r s i o n s w a s de-
t e c t e d by a c o u s t i c sounding , and a s t r o n g c o r r e l a t i o n was
no ted between the ac0us t i . c i n v e r s i o n echo and microwave fad -
ing . The c o n c l u s i o n s reached w e r e t h a t the b a c k s c a t t e r e d
a c o i i s t i c ene rgy w a s t h e r e s u l t n o t o n l y of s t r o n g tempera-
t u r e g r a u i - e n t s b u t a lso, of turb.ul .ent temperature f l u c t u a -
t i o n s , aad t h a t these f l u c t u a t i o n s w e r e t h e p r imary c a u s e
of b a c k s c a t t e r i n g . The breakup of noctur1-:;11. i n v e r s i o n s ant!
the Iror'mat.ion of daytime t h e r m a l s w e r e a A . 5 ~ ot.:~:.;~rvc!d.
An unexpected
The f i r s t s t e p i n t h e evolu t i ion of acot1sti.c soundinq
as a t o o l f o r m e t e o r o l o g i s t s o c c u r r e d i n 1967. An a c o u s t i c
sounding exper iment w a s set up i n A u s t r a l i a t o s t u d y t h e t e m -
p e r a t u r e s t r u c t u r e of t h e l o w e r a tmosphere and i t s r e l a t i o n
t - o abnormal p r o p a g a t i o n of radio w a v e s . The p r e l i m i n a r y re-
sults of t h i s exper iment w e r e r e p o r t e d by M c A l l i s t e r ( 1 9 6 8 ) .
I t demons t r a t ed t h a t a c o n t i n u o u s r e c o r d of t h e h e i g h t , move-
i n e n t , and s p a t i a l d i s t r i b u t i o n of i n h o m o g e n e i t i e s i n t he t e m -
p e r a t u r e s t r u c t u r e o f t h e l o w e r a tmosphere c o u l d be o b t a i n e d
I I
3
; ) y a c c ~ u s t I . ~ c ~ scjuncirq. Later McAI.li : j tcr &- i i909) prc-
s e n t e d c? (?e-cai led r e p o r t of t h i s exper iment . Var ious mete-
croioqical phenozcna w e r e examined such a s t h e r m a l p l u m e s ,
rrii: I 2 ti,nn i rivers ions , a:?d b reak ing wac3es T 3 i s experiment
ronf i.rmed t h a t t u r b u l e n t temperature and v e l o c i t y f l u c t u a -
r_isi?s a r e t he pr imary scatterers of acoust,.;: energy . it w a s
onatrated t h a t i t i s possible t o s e p a r a t e the c o n t r i b u -
- .
t i c:r:ci t o t h o scat t e rcd ene rgy made by the temper&tl~:re f l u c -
,..~.iat.:~c,n:i and by the vel city f l u c ~ ~ a t . L c ) n : ; i3y c;perar iny t iic
:, .L,..,..ti " , \. 2 c c radar i n t h e i .nc l ined mc.no::; tatic and i2istat.i.c mode
; r i g * lj .
~ i - 1 a s t u d y of t h e r m a l plumes and. n o c t u r n a l i n v e r s i o n s
.;-3t..r-ay-t _- r_.t - al. (1371) used a c o u s t i c scjunding equipment t o de-
' . r -zz 1 . ~ 2 v e r t i c a l v e l o c i t i e s , By observing t h e Conpler s h i f t
.!.a f r e t -pency of t k e b a c k s c a t t e r e d a c o u s t i c s i g n a l t h e y cai-
r i i l - a ted d e t a i l e d vertical . v e l o c i t y p a t t e r n s , a c c u r a t e tG
2 rJ.2 n? sec
t i c Doppler s h i f t as a means to ga in new i n s i g h t i n t o such
;>rcjblerns a s low- leve l h e a t flux and t h e s t r u c t u r e and motion
.J i- wave phenomena,
-1 . They demons t r a t ed t h e p o t e n t i a l of t h e acous-
I n one of t h e m o s t r e c e n t s t u d i e s CroRenwett e t a l .
( 1 9 7 2 ) h a v e s u g g e s t e d t h a t the a c o u s t i c r a d a r may be u s e f u l
in p r e d i c t i n g t h e fo rma t ion and d i s s o l u t i o n o f low-level
6
s t r a t u s clouds. They a l s o found t h a t t h e acous t ic radar i s
capable of de t ec t ing and measuring the ve loc i ty of s m a l l
p a r t i c u l a t e matter i n t h e a i r . These measurements w i l l be
~f i n t c r c s t i n t h e s t s d y of po l lu t ion d i f fus ion . Marks ( 1 9 7 2 )
has suggested another app l i ca t ion of t h e acous t i c radar t o
a i r pGllution meteorology. In observing nocturnal inversions
he found t h a t t h e acous t i c radar d a t a r evea l a r eas of s t rong
temperature g rad ien t s , areas of tu rbu len t mixing, and t h e
exact t i m e of invers ion breakdown. Marks also found t h a t
che amount of f i n e s t r u c t u r e revealed by the acous t i c radar
record cannot be a t t a i n e d by conventional instruments.
The purpose of t h i s research i s threefo ld : t o add t o
t . he knowledge of p a t t e r n recogni t ion and i n t e r p r e t a t i o n of
acocstic radar da t a ; t o demonstrate t h e usefu lness of t h e
acoust ic radar a s a t o o l f o r meaningful s tudy of t h e lower
atmosphere; and t o ga in knowledge of t h e processes i n a c t i o n
i n t h e boundary l aye r . TWO a r eas of i n t e r e s t have been in-
ves t iya ted . F i r s t , a s tudy was made of acous t i c r ada r d a t a
coll-ectcd during t h e passage of a mesoscale co ld-a i r i n t r u -
sion and a weak co ld f r o n t . Resul t s are presented as case
s tudies r e l a t i n g t h e synopt ic s i t u a t i o n obtained from conven-
cional t e l e type and f acs imi l e d a t a , t h e acous t i c r ada r record,
and t i m e sec t ions of temperature, wind speed, and wind
7
t
direction obtained from the meteorologically instrumented WKY
television tower. In these case studies, attention is focused
on the interpretation of the acoustic radar data.
I n the second area of interest, attention is aimed at
the relationship between the nocturnal temperature inversion
and the low-level wind maximum. The WKY tower data are dis-
cussed in the light of theory presented by Blackadar (1957)
on the interactions of these phenomena. In the presentation
of the results of this study, the acoustic radar data will
play an important supportive role.
CHAPTER I1
ACOUSTIC W A R THEORY
Transmission of acous t ic energy i n t o t h e atmosphere
may result i n r e f l e c t i o n , absorpt ion, or scattering. Re-
f l e c t i o n occurs when the acous t ic energy encounters sharp
g rad ien t s i n the mean a i r temperature. Atmospheric absorp-
t i o n reduces the e f f e c t i v e range of t h e radar by decreasing
t h e amount of energy ava i l ab le f o r r e f l e c t i o n o r s c a t t e r i n g .
Absorption v a r i e s d i r e c t l y with t h e t ransmi t ted frequency
and t h e r e l a t i v e humidity of t h e a i r and inve r se ly with the
Lemperature. Sca t t e r ing of acous t i c energy is caused by
turbulen t f l uc tua t ions of both wind v e l o c i t y and tempera-
ture. Variat ions of w a t e r vapor p re s su re a l s o cause scat-
t e r ing of acous t ic energy. However, c a l c u l a t i o n s made by
M c A l l i s t e r -- e t a l . (1969) i n d i c a t e t h a t t h e e f f e c t s of water
vapor are below t h e threshold of d e t e c t a b i l i t y of p re sen t
equipment.
The theory of t h e s c a t t e r of acous t i c energy i n dry
air has been presented by Monin (1962). For a KolmOgOrOV
8
9
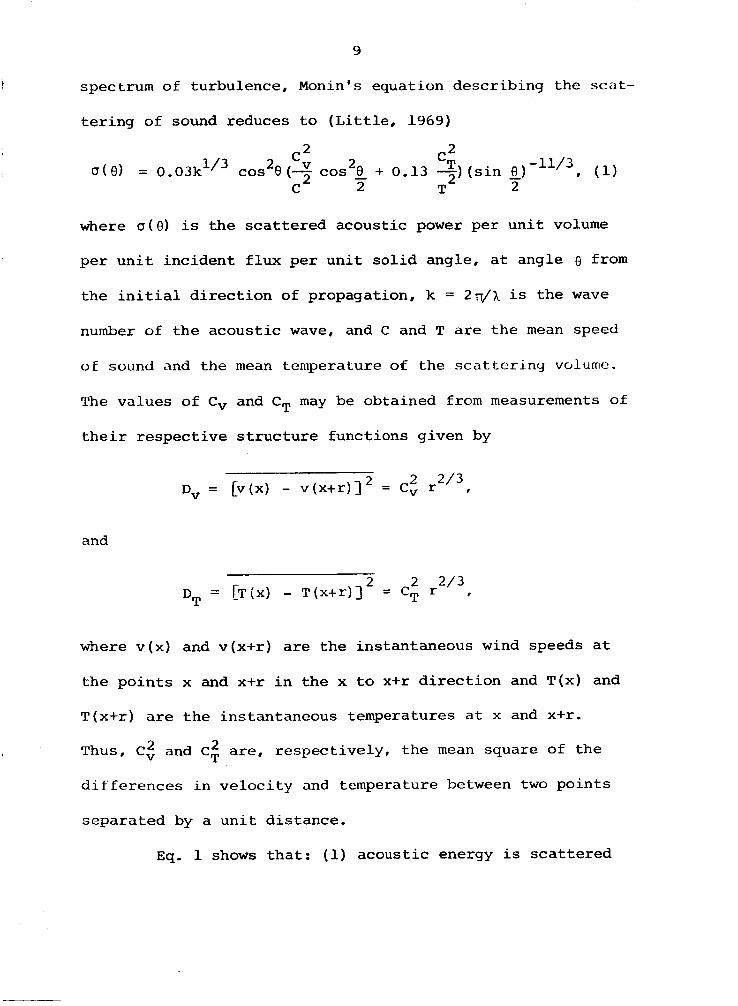
I spectrum of turbulence, Monin's equation Gzscribing the scnt-
tering of sound reduces to (Little, 1969)
* (1) 2 cv 2 c: -11/3
2
u ( 0) = 0.031~~'~ COS 9 (- cos S + 0.13 2) (sin (3) 2 2 T 2 C
where a(0) is the scattered acoustic power per unit volume
per unit incident flux per unit solid angle, at angle 0 from
the initial direction of propagation, k = 2r/X is the wave
number of the acoustic wave, and C and T are the mean speed
oE sound and the mean temperature of the scatLcring volume.
The values of Cv and CT may be obtained from measurements of
their respective structure functions given by
and
2 2 2/3 = [Tjx) - T(x+r)] = cT r I DT
where v(x) and v(x+r) are the instantaneous wind speeds at
the points x and x+r in the x to x+r direction and T(x) and
T(x+r) are the instantaneous temperatures at x and x+r.
Thus, C , and C$ are, respectively, the mean square of the
differences in velocity and temperature between two points
separated by a unit distance.
2
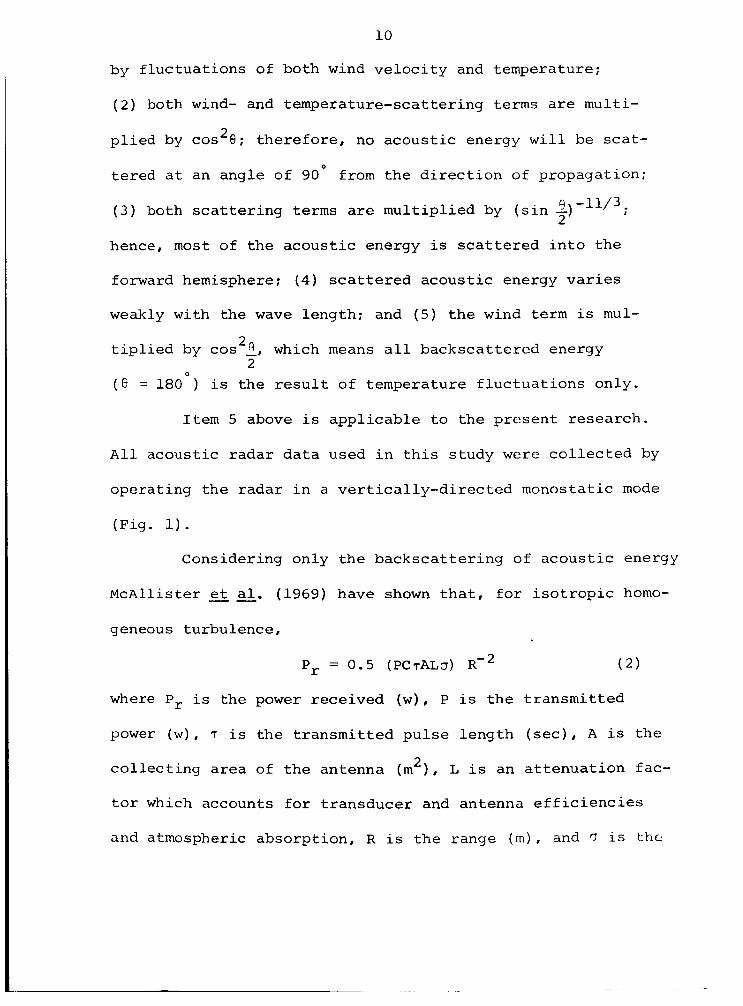
Eq. 1 shows that: (1) acoustic energy is scattered
10
by fluctuations of both wind velocity and temperature;
(2) both wind- and temperature-scattering terms are multi-
2 plied by cos 8: therefore, no acoustic energy will be scat-
tered at an angle of 90' from the direction of propagation;
( 3 ) both scattering terms are multiplied by (sin -) Q -1113. 2
hence, most of the acoustic energy is scattered into the
forward hemisphere: (4) scattered acoustic energy varies
weakly with the wave length; and ( 5 ) the wind term is mul-
tiplied by cos2fi, which means all backscattered energy
( 0 = 180 1 is the result of temperature fluctuations only. 2
0
Item 5 above is applicable to the present research.
All acoustic radar data used in this study were collected by
operating the radar in a vertically-directed monostatic mode
(Fig. 1).
Considering only the backscattering of acoustic energy
McAllister et al. (1969) have shown that, for isotropic homo-
geneous turbulence,
P, = 0.5 ( P C ~ A L ~ ) R - ~ ( 2 )
where Pr is the power received (w), P is the transmitted
power (w), 7 is the transmitted pulse length (sec), A is the
collecting area of the antenna (m ) , L is an attenuation fac- 2
tor which accounts for transducer and antenna efficiencies
and atmospheric absorption, R is the range (rn), and T is t h c
11
s c a t t e r e d power per u n i t volume per u n i t i nc iden t f l u x p e r
u n i t s o l i d angle i n t h e backsca t te r d i r e c t i o n . The equat ion
for D is given as
(J = 0.008 (C,3-1/3) T-2
where 1 i s t h e t r a n s m i t t e r wave length (cm).
CHAPTER I11
DESCRIPTION O F THE ACOUSTIC RADAR AND THE
INSTRUMENTED TOWER FACILITY
The acous t ic radar used i n t h i s research w a s con-
s t ruc t ed and placed i n operat ion a t t h e Universi ty of Okla-
homa i n 1971 . Bas ica l ly , the acous t ic radar i s a convent ional
pulsed radar which t ransmi ts a b r i e f b u r s t of acous t ic energy.
Backscattered and r e f l e c t e d energy i s then received a t some
l a t e r time and displayed. Fig. 2 shows the func t iona l block
diagram of t h e radar and Table 1 l i s t s the equipment para-
meters . The cyc le of operat ion begins a t t h e facs imi le re-
corder. When t h e recorder begins i t s t r a c e across the paper,
a synchronizing pulse i s s e n t t o t h e tone b u r s t generator .
This pulse allows the tone b u r s t genera tor t o pass a sho r t
burst of audio s i g n a l from t h e audio o s c i l l a t o r through a
r i l t e r to the power ampl i f i e r . The amplif ied audio pu l se i s
conveyed by t ransmission l i n e t o t h e t ransducer s i t e . There
t h e t ransmit-receive (TR) switch couples t h e audio pulse t o
12
1 3
t h e d r i v e r which i n t u r n produces v e r t i c a l l y - d i r e c t e d sound.
The TR switch provides a very important funct ion. While i n
the t ransmi t mode t h e TR s w i t c h disconnects t h e r ece ive r
s ec t ion of t h e r ada r f r o m t h e t ransducer , This prevents
t h e high-power t ransmi t ted pu l se f r o m en te r ing t h e r e c e i v e r
s ec t ion and a l l o w s t h e t ransducer to be used as a t r ans -
m i t t e r and a rece iv ing antenna.
I
A s h o r t t i m e a f t e r t ransmission has begun, t h e se-
quence t i m e r , a c t i v a t e d by a pulse from tne t c n e b u r s t gen-
crstor a t t h e beginning of transmission, resets t h e TR switch
t o t h e r ece ive mode, The sequence t i m e r also i n i t i a t e s t h e
genera t ion of a vo l tage ramp which increases l i n e a r l y with
t i m e during each cyc le , The acous t ic s i g n a l amplitude de-
CrEtases as range increases . By multiplying t h e received
acous t i c s i g n a l by t h e vol tage ramp, d is turbances of equal
amplitude, bu t a t d i f f e r e n t he ights , w i l l be depic ted as
silch.
The r e tu rn ing acous t i c energy i s converted t o a vol-
t age by t h e t ransducer and conveyed through t h e TR switch
b t o t h e preampl i f ie r . The returned s i g n a l then passes through
the r e c e i v e r and t h e ampl i f i e r t o t h e m u l t i p l i e r . H e r e t he
v o l t a g e ramp i s appl ied. The s igna l then passes through t h e
r eco rde r d r i v e r and on t o t h e facs imi le recorder where it is
14
displayed visually. This ends the cycle. The received sig-
nal may also be recorded on magnetic tape or displayed on
an os c i 1 1 os cope.
Since June, 1972, the University of Oklahoma acous-
tic radar has been in operation at a site near the meteor-
<;logically instrumented WKY television tower. The tower
is located about 6 n mi north of Oklahoma City, Oklahoma.
The terrain around the tower-radar site is gently rolling
and covered with wild grass and weeds. The radar is sit-
ilat.ed about 450 m from the tower. The tower is 458 m tall
and is instrumented at seven levels (23, 45, 90, 177, 266,
355 , 444 m) . Horizontal wind speed, wind direction, and tempera-
ture are measured at all seven levels of the tower facility.
Mcasurcments of wind speed and direction are made with a
13endi.x Model 120 Aerovane. The wind ?peed sensor has a
threshold speed of about 0.85 m sec", a distance constant 1
of 5 m, and an accuracy of 2 0.25 m sec". At each level an
Acrovanc is mounted 10 ft from the tower on a boom attached
to the tower. The temperature measurements are made by a
cornhination of two independent systems. The ambient System
makes an absolute ambient temperature measurement at 23 and
The distance constant is defined as wind passage by the propeller required for the anemometer output to reach 63% of a step speed change.
1
15
444 m, The d e l t a system measures d i f f e rence temperatures
a t a l l l e v e l s referenced t o t h e ambient reading a t t h e 444-m
l e v e l . The sensors a r e l i nea r i zed thermis te r composites
housed i n hea t s ink s t a i n l e s s s t e e l probes, which a r e mounted
i n motor a sp i r a t ed r a d i a t i o n sh ie lds , This s h i e l d reduces
r a d i a t i o n heat ing e f f e c t s t o less than O , l l ” C , The absolu te
accuracy of t h e thermis tors has been found t o be within 0.2OC.
Each d e l t a t h e m i s t o r is c a l i b r a t e d t o t h e reference ther -
m i s t e r a t t he 444-m l eve l , with t h e depar ture from t h e re-
ference within -f 0,06°C,
The G i l l p rope l l e r anemometer model 27100 i s used
tc. measure the v e r t i c a l component of wind v e l o c i t y a t 23,
177, ax?d 444 m. The threshold speed f o r this instrument is
aboitt 0 . 2 5 m sec-l and i L s accuracy is better than 0 - 1 2 mi
sec - A t t hese same th ree l eve l s the wet-bulb temperature
i s measured with a cloth-wrapped thermistor mounted i n a
motor a s p i r a t e d sh ie ld , The c lo th is kept moist by a cap i l -
l a r y sys t em.
-1
Atmospheric pressure i s measured a t t he base of t h e
tower with a Be l fo r t Model 6068 Microbarograph with a d i g i t a l
output . Changes i n pressure a r e sensed by a bellows t h a t
t r a n s m i t t s i t s motion through a s y s t e m of l e v e r s and gears t o
a low-torque potentimometer, A dc vol tage i s appl ied t o the
1 6,
potent ione ter and i ts outpct is a dc vo l tage propor t iona l c o
the pressure. The i n s t r u m e n t has an a l s o l u t e accuracy of
- ci. 5 mi, with a serisit-.ivit.y of ? 3. 2 ml>. e-
F,L ~ : : e da ta col1cct;cci by ti::.? tc,wer j.nst.rimc?ni::; a r c re-
corded by two independent s y s terns. The analog system records
aJ1. w i n d , temperature, and pressure d a t a on s t r i p c h a r t s .
;rile d i g i t a l s y s t e m records this data on maqnetic tape. In
t9,i.s syst .cn: c;ch input chi lnnel .is appi ied tc , a 100-channel
:scanner - The scanner seq! ien t ia l i y s c m s t ! I r b > ' i i < 7 h a n y pre-
:jet. riurnl>er c7f chaniic?ls from 1 to 3 . 0 ~ ~ a i a r G t r _ . C I E 200 than-
ncls scc . T h e sclcctcd o:itput c : f t l l r ? scdnricr is diqi t i .zed
j.11 a thret;-l;--r: UCD word. U;! ;K mala2 t:o di.yj . ta1. conver te r .
' L ' ~ ! : ~ L t l i g i t:+l tl: LCI art: theti co!n!>iac:?, :.I i..r.!l t ir,c d a t a i n an I L\M
compat~I~1e Ccrmat and w r i t t e n cn n i a q n e c i c t apc~ .
-1
The cii.(ji t a l recording system i s q u i t e f l e x i b l e and
!.,f!tera a w i c ? e choice of .;ampling r a t e s and d a t a record lengths .
7 t - i ~ r a p i d l y changing weather condi t ions the svs tern can scan
.zii<i record all parameters a t 2-scc i n t e r v a l s . The d a t a used
ii- th i s s t u d y w e r e r-ampled a t l - m i n i n t e r v a l s .
A crmplete d e t a i l e d d e s c r i p t i o n of t h e W K Y tower
fx : i 1 i t.y 11~3s Ixen reported by Carter (19'70) .
CHAPTER I V
INTERPRETATION OF ACOUSTIC RADAR DATA
To f u l l y r e a l i z e t h e capabili t ies and t h e p o t e n t i i l
usefu lness of t h e acous t i c radar, knowledge must be gained
i n the a rea of p a t t e r n recogni t ion and i n t e r p r e t a t i o n of the
.
radar data, It i s t o t h i s end t h a t t hese s t u d i e s are pre-
:i en t ed . The f i r s t case s tudy examines i n d e t a i l d a t a c o l l e c t -
cd c!t7ri ny t h e passage of a s h a l l o w ~~icsoscalc co ld-a i r i n t ru -
s ion . I t i s be l ieved the co ld air w a s thunaerstorm outflow.
i iravy thunderstorm a c t i v i t y had begun i n southeas te rn Kansas
i n t he e a r l y af ternoon and had continued u n t i l s h o r t l y before
midnight. It w a s f r o m t hese thunderstorms t h a t t h e co ld a i r
i.3 thought t o have or iy ina ted . It w a s then c a r r i e d by t h e
ad2ient flow i n t o c e n t r a l Oklahoma. I n t h e second case,
data collected during t h e passage of a shallow synoptic-
scale c o l d f r o n t i s examined.
I
I t should be of i n t e r e s t here t o make some compari-
scns on t h e observed s t r u c t u r e and behavior of t h e mesoscale 1 7
c o l d i n t r u s i o n and t h e synopt ic-scale f r o n t . Both 2henomena
displayed a leading head2 of co ld a i r i n t h e c e n t e r of which
w a s a c o r e of c o l d e s t a i r . The leading head of the cold in-
t h e co ld f r o n t w a s almost v e r t i c a l . This w a s more a func t ion
of wind speed as the i n t r u s i o n w a s accompanied by s t ronge r
winds. On the leading edge o f both t h e i n t r u s i o n and t h e
f r o n t , t h e h o r i z o n t a l temperature g r a d i e n t w a s weakest a t
t h e sur face . This was due t o turbulent mixinc; w i t h w a r m e r
t h c su r face f e l l as the f ron t passed but increased behind t h e
The wind s t r u c t u r e (.)E the two phcriornena was quitch
; ~ ~ " i 1 . a r e x c e p t f o r t h e d i r e c t i o n o: c h c w i n d shif: . Therc
wds r h t appca;aniie o E a ld'y'er of maxLmum winds above t h e sur -
face i n t h e co ld a i r . This w a s espcr5c:ially noted in t h e case
o f t h e co ld f i -onk . The f r o n t w a s made up of t h r e e s e p a r a t e
:;crgcs of cc.1~1 a1.r. Each surge d isp layed a wind maximum.
'rke wind s h i f t i n each case occurred a t t h e s u r f a c e be fo re
the Cold a i r a r r ived . Above t h e s u r f a c e t h e s h i f t came with
3 &'The term head, used h e r e as an analogy t o heads i n
labora tory g r a v i t y c u r r e n t s , describes t h e area a t t h e f r o n t ~ f l t h e co ld a i r m a s s where t h e depth of t h e cold a i r 1s j ec;)ter than a t p o i n t s upstream.
1 9
t h e co ld a i r . The most obvious d i f f e rence i n t h e wind s t r u c -
t u r e is the d i r e c t i o n of t h e wind s h i f t . A s t h e co ld f r o n t
passed, t h e wind d i r e c t i o n changed i n a clockwise sense
f o r a synopt ic-scale co ld f ron t . The wind s h i f t accompany-
ing the co ld i n t r u s i o n , although s l i g h t , was i n t h e oppos i te
sense. This d i f f e r e n c e w a s t h e majcr i nd ica to r t h a t tnese
two phenomena, although s i m i l a r i n many r e spec t s , w e r e on
d i f f e r e n t scales of atmospheric motion.
Case I
The su r face synopt ic s i t ua%ion f o r 0000 C S T 21 J u n e
1 3 7 2 i s shown i n F ig . 3 - A cold frofit which passed the
Oklahoma C i t y a rea 22 h r s ear l ie r wa.q lc,c.it-.+ *dri a 1,uhbock-
Dallas-Texarkana l i n e moving sc;uthward a t 8 - l G k t . The f r o n t
cxrendcd nQrtheastward from 'Texarkana i n t o t h e Chicago area .
Winds behind +_ne f r o n t throughout Oklahoma w e r e f r o m tne
nGrthEast qua",rant, A surface high pres su re c e n t e r w a s s i t -
uated on t h e c e n t r a l Nebraska-South Dakota border. A t t h e
850-mb l e v e l t h e co ld f r o n t was about 20-30 n m i south of
Oklahoma City; winds behind t h e f ront a t t h a t l e v e l w e r e from ,
the eas t -nor theas t . There w a s an area of s c a t t e r e d moderate
thunderstorms along and behind the su r face f ron t i n extreme
sou theas t e rn Oklanoma, northwestern Texas, and southwestern
2 0
Arkansas. There w a s an area of l i g h t thunderstorms i n north-
western Oklahoma and t h e northern Texas panhandle, and moder-
a t e rainshowers w e r e occurr ing i n southeastern Kansas. These
.- L a i l l . - , l J u w - L - -,-I.. r.._.- - / - 3 ~ e r e the reirisins of the t h ~ f i d e r ~ t ~ r ~ a ~ t i ~ i ~ y
discussed ear l ie r . Clouds over t h e s i te cons is ted of two
broken l aye r s , one a t 12000 f t and t h e o the r a t 25000 f t .
T h e c!.c\~id cover remained unchanged between 0000 and 0 8 O C C S T .
At 0000 CST t h e ai .r i n the lower 450 m a t the radar
s i t e w a s near ly isothermal with only a l ° C drop from t h e
sLrface t-.o t h e top of t he tower (Fig. 3b). 'The wind speea
increaccii rap id ly from t h e s u r f a c e t o 175 m, .then remained
:?early constant above t h a t l e v e l (Fig. 4 d ) . Mixing cause6
U;, t h e stironq v e r t i c a l shear i n t h e su r face t o 175 m l a y e r
co!rib~.nc?d. w i t h t h e tcmnperature l apse r a t e less than dry adia-
L)L+ t-ic t:o produce turbulen t temperature f luc tua t ions . These
E:l uctuations were recorded a s backsca t te red ac0usti .c e n e r y y
on the radar record (Fig. 4 a ) . The he igh t of t h e recorded
echoes corresponds c l o s e l y with t h e he igh t of t h e s t rong
shear layer (Fig. 4d ) . Above 1 7 5 m t h e r ada r record indi-
n a t e s the absence of t u rbu len t temperature f l u c t u a t i o n s a l -
though t h e temperature p r o f i l e i n t h i s reg ion w a s much l i k e
t h a t below 1 7 5 m, i .e., a l a p s e r a t e t h a t w a s less than dry
ad iaba t ic . The weak v e r t i c a l wind shea r above 175 m y ie lded
21
t h i s r e s u l t . As shown by t h e radar record (Fig. 4 a ) , t h i s
s i t u a t i o n continued wi th l i t t l e change u n t i l 0045 CST.
There was a gradual bu t s i i g h t i nc rease i n the depth
of t h e s t rong shear l a y e r between 9000 and 0045, This in-
c r ease i s m o r e no tab le i n t h e radar record than i n t h e wind
speed d a t a from t h e t o w e r (Fig. 4d) , One can a l s o see a
raggedness i n t h e he ight of t h e recorded echoes which cannot
be seen i n t h e analyses of t h e t o w e r da ta . I t nus t be point-
ed out h e r e t n a t t he acous t i c radar is recording a v e r t i c a l l y
continuous observat ion every four seconds and the tower in-
struments a r e sampling t h e parameters a t one-minute i n t e r v a l s
and are mounted a t l e v e l s phys ica l ly separa ted by a s much as
89 m. The radar can, t he re fo re , revea l f i n e s t r u c t u r e which
w i i l n o t be found i n t h e tower data . The black d o t s seen on
t h e r a d a r record a t 0027, 0033, and 0042 CST a t var ious he igh t s
are probably echoes f r o m b i r d s or l a r g e bugs. These observa-
t i o n s are q u i t e common.
A t 0045 CST t h e co ld i n t r u s i o n passed t h e s i te . The
passage w a s marked by decreasing temperature a t a l l l e v e l s
(Fig. 4 b ) , a s l i g h t wind s h i f t i n t h e su r face t o 360-m l a y e r
(F ig , 4 c ) , and an inc rease i n wind speed (Fig. 4d) . The
h o r i z o n t a l temperature g rad ien t across t h e leading edge of
I t h e c o l d a i r was s t ronges t i n t h e 250 t o 350-m l aye r .
L L
Surface f r i c t i o n apparent ly was r e t a rd ing t h e advance of the
cold a i r a t t he sur face . The r e t a r d a t i o n r e s u l t e d i n a pro-
t ruding nose on t h e leading edge of t h e co ld a i r . Turbulent
. . n - - ~ ~ n r r ef the cold air afis the amhiefit air t h e p ~ 9 -
'3 1 1 1 . L L L . L L Z
t ruding nose had weakened t h e h o r i z o n t a l temperature g rad ien t
in t h i s region (Fig. 4b ) . The temperature drop accompanying
t h e cold i n t r u s i o n a r r ived f i r s t and was sharpes t a t t he
l e v e l of t he protruding nose.
The passage of t he co ld i n t r u s i o n i s q u i t e no tab le
on the acous t ic r ada r record (Fig.. 4 a ) . A t 0045 CST t h e
appearance of t h e r ada r d a t a changed abrupt ly . A s t h e pro-
tirudinq nose cooled the l aye r between 250 and 350 m, t h e
lapse r a t e from the su r face t o 350 m began t o approach t h e
d ry ad iaba t i c l apse r a t e . The temperature p r o f i l e s f o r 0035
m c i 0051 a r e shown i n Fig. 5. These p r o f i l e s r evea l t h e
change which occurred a s t h e nose of co ld a i r passed t h e
tower. The wind shear i n t h e s u r f a c e t o 1 7 5 In l a y e r weak-
ened rap id ly following the passage of t h e co ld a i r (F ig . 4 d ) .
'The d r y dd iaba t ic l a p s e r a t e and weak shear reduced t h e poss i -
1) L lity o f t u r b u l e n t temperature f l u c t u a t i o n s and hence pro-
duced a n absence of echoes i n t h e su r face t o 350 m l a y e r
(Fig. 4 a ) . The tu rbu len t mixing below t h e protruding nose
can be seen a s an a rea of weak echoes a t t h e su r face b e t w e e n
23
0045 and 0052 CST. The upper boundary between t h e ambient
a i r and t h e co id a i r i s marked by a l a y e r of echoes approxi-
mately 100 m i n depth. This r e su l t ed from both backsca t te r
from turbulen t mixing between t h e two a i r masses and r e f l ec -
t i o n from t h e s t rong v e r t i c a l temperature grad ien t a t t h e
350-m l e v e l (Fig. 4b). The he ight of t h i s s t rong v e r t i c a l
g rad ien t decreased behind t h e upraised leading nose. ~ This
decrease i n he ight i s noted on t h e radar record (Fig. 4a)
as the he ight of the echo l a y e r began t o lower s h o r t l y before
0100 CST,
A f t e r t h e cold a i r passed a t t he sur face , t he l apse
r a t e f r o m t h e sur face t o 325 m was no longer equal t o but
less than t h e dry ad iaba t i c lapse r a t e . The temperature
p r o f i l e f o r 0107 is shown i n Fig. 5. A t t h i s same t i m e t he
wind speed i n the lower 200 m became q u i t e gusty and t h e
wind shear i n t h i s l a y e r increased (Fig. 4d ) . The r e s u l t a n t
t u rbu len t mixing is seen on the acoust ic radar record a s t h e
bottom of t h e echo l aye r became quite ragged and echoes w e r e
seen near t h e surface. By 0115 the l apse r a t e below 180 m
w a s again near ly dry ad iaba t i c (Fig. 5) a s cold advection
a t 180 m was s t ronger than a t t h e surface. Although the
wind shea r continued s t rong and t h e wind speed gusty u n t i l
0138 (Fig. 4d) t h e lower ragged echoes disappeared from t h e
2 4
radar record a t 0113 (Fig. 4a) i n response t o t h e dry adia-
b a t i c l apse r a t e .
.
O n the leading edge of t h e co ld in t rus ion thc 1ni.n.i-
mum temperature i n t h e co ld a i r w a s near 340 m. Upstream i n
t he co ld a i r t h e l e v e l of minimum temperature decreased. By
0130 CST t h e minimum temperature w a s a t 250 m (Fig. 4 b ) . B e -
L o w t h i s l e v e l t h e l apse ra te was nea r ly dry ad iaba t i c . Above
250 m s. temperature invers ion ex i s t ed . Fig. 5 shows t h e
temperature p r o f i l e f o r t h i s t i m e . Upstream behind t h e pro-
t ruding nose and j u s t above t n e l e v e l of m i n i m u m temperature
i n t h e co ld a i r w a s a l a y e r of maximum wind s p e d (Fig . 4d ) .
The wind speed maximum f i r s t appeared a t 0116. A t 0130 tiic
ver t ica .1 shear assoc ia ted wi th t h e wind speed maximum m u
the invers ion above 250 m produced if l aye r of echoes on t h e
radar record from 250 t o 450 m. By 0147 t h e l e v e l of mini-
r c i m temperature had lowered t o 235 m as t h e leading head of
co.'I.d a i r passed t h e s i t e (Fig. 4 b ) . Preceding t h e a r r i v a l
of t h e deeper co ld a i r t h e r e was a broad region of upward
v e r t i c a l motion a t t h e 444-m l e v e l with v e l o c i t i e s on t h e
1 order of 0.5 t o 1.0 m sec- . A t 23 m t h e motion w a s down-
w a r d wi th v e l o c i t i e s as h igh as 1.1 m sec-' recorded.
0147 t h e v e r t i c a l wind shear w a s s t rong i n t h e l a y e r between
250 and 375 m (Fig. 4d ) . O n t h e r ada r record (Fig. 4a) t h e
A t
25
turbulen t f l uc tua t ions caused by t h i s l aye r of shear can be
seen a s the heavy l aye r of echoes between 250 and 375 m,
Above 375 m t h e r e w a s an a rea r e l a t i v e l y free of echoes.
H e r e t h e v e r t i c a l temperature grad ien t was weaker (Fig, 4b)
as was t h e wind shear (Fig. 4d). The l a y e r of weak echoes
from 450 t o 525 m marks t h e turbulen t mixing a t t h e boundary
between t h e cold a i r and t h e ambient air.
Following t h e leading head of cold a i r downward
v e r t i c a l motion produced a broad th’ermal maximum centered
a t 0305 CST (Fig. 4b ) , The temperature p r o f i l e a t 0305
cons is ted of a less than dry ad iaba t i c l apse r a t e from the
su r face t o 225 m, t h e l e v e l of minimum temperature; a s t rong
invers ion from 225 to 365 m; and a n e u t r a l l aye r above 365 m.
The l e v e l of maximum wind speed was 260 m (Fig. 4d) . The
acous t i c radar record (Fig. 4a) revealed turbulen t tempera-
t u r e f l u c t u a t i o n s from t h e surface t o 275 m; a l aye r of s t rong
echoes from 275 t o 325 m associated with t h e s t rong wind shear
and s t rong vertical grad ien t of temperature i n t h i s l aye r ; and
a l a y e r of weaker echoes from 325 t o 365 m, where t h e shear
and v e r t i c a l g rad ien t of temperature w e r e s l i g h t l y weaker
than i n t h e 275 t o 325 m layer .
Af te r 0305 CST t h e depth of t h e cold a i r and the
he igh t of t h e wind speed maximum began t o increase. This
26
i n turn caused an inc rease i n he igh t of the region of s t rong
wind shear above the wind speed maximum (Fig. 4d) and of
s t rong v e r t i c a l temperature g rad ien t between 275 and 365 m
(F ig . 4 b ) . This increase i n he ight w a s s t r i k i n g l y displayed
on the acous t ic radar record (Fig. 4a ) . The l a y e r of s t rong
shear and s t rong v e r t i c a l temperature g rad ien t i s seen a s a
l aye r of s t rong echoes w h i c h had separated from t h e lower
region of echoes and was gradual ly increas ing i n he ight .
By 0350 t h i s l a y e r w a s between 350 and 450 m. T h e he igh t s
a r e v e r i f i e d by t h e acous t i c echoes (Fig. 4a), the tempera-
t u r e d a t a (Fig. 4 b ) , and t h e wind speed a n a l y s i s (Fig. 4 d ) .
The echo-free region between 300 and 350 m, a t f irst look,
ind ica ted a weakening of t he wind shear and v e r t i c a l g rad ien t
of temperature i n t h i s l aye r . Closer i n spec t ion of t h i s
region revealed an almost t o t a l absence of wind shear ac ross
t h e wind speed maximum. The temperature p r o f i l e of t h i s
region, a weak invers ion , would enhance t h e p o s s i b i l i t y of
turbulen t f l u c t u a t i o n s of temperature. The absence of echoes
i n t h i s region, and hence the absence of t u rbu len t f l uc tua -
t i o n s , implies a lack cf v e r t i c a l shear ac ross t h e wind speed
maximum. The l e v e l of maximum winds had become a l a y e r Of
maximum winds w i t h an almost cons t an t speed through t h e l a y e r .
The depth of t he l aye r of n e a r l y cons t an t wind speed i s Seen
I
27
as t h e depth of t h e echo-free region on t h e radar record
(Fig. 4 a ) -
Af te r 0400 CST t h e l aye r of maximum winds continued
t o increase i n he ight (Fig, 6d) as t h e cold a i r deepened.
The l a y e r a l s o deepened a s ind ica ted by t h e increased depth
of t h e echo-free region on t h e radar record (Fig, 6a ) . A t
0430 t h e echo-free region extended from 350 t o 525 m, The
l a y e r of echoes from t h e sur face t o 350 m continued t o show
t h e r e s u l t of shear b e l o w the layer of maximum winds and t h e
l apse r a t e less than dry ad iaba t ic . These echoes had weak-
ened somewhat, e s p e c i a l l y those between 200 and 350 m, By
0500 t h e echoes had a l l bu t disappeared i n t h e 200 t o 350 m
l a y e r (Fig. 6a ) . The echoes w e r e s t i l l s t rong below 200 m
and weaker echoes w e r e seen a t 650 m. The l a t t e r echoes
w e r e t h e continued backsca t t e r from t h e tu rbu len t mixing i n
t h e region of s t rong shear above t h e l aye r of maximum winds.
There s e e m s no apparent reason f o r t h e disappearance of t he
echoes from t h e 200 t o 350 m layer . The l apse r a t e i n t h i s
region was s t i l l less than dry ad iaba t i c (Fig. 6b) and t h e
v e r t i c a l wind shear was unchanged (Fig. 6d) . A poss ib le
explanat ion is t h a t t h e ana lys i s of the wind speed d a t a i s
i n c o r r e c t . T h i s ana lys i s was done without consul t ing t h e
acous t i c radar record. The wind shear seen a t 0500 between
28
t h e 1 7 7 - m and 266-m tower d a t a c o l l e c t i o n l e v e l s may have
been concentrated near t h e 1 7 7 - m l e v e l with less shear abovc:
200 m. By 0530 it can be seen t h a t t h e wind shear i n t h e
region had weakened (Fig. 6d) .
The passage of t h e e leva ted head of co ld a i r a t 0147
and the s t rong downward motion behind t h e head c rea t ed a
g r a v i t y wave upstream i n t h e co ld a i r . This wave motion was
q u i t e no tab le i n a l l parameters from 0550 t o 0800. The wind
d i r e c t ion
was s l i g h t
speed (F ig
wind speed
Fig. 6c) showed some p e r i o d i c change although i t
compared t o t h e p e r i o d i c i t y revealed by the wind
6d) and t h e temperature d a t a (Fig. 6b ) . The
maximum responded t o t h i s wave motion by o s c i l -
l a t o r y changes i n he ight . This produced a l t e r n a t i n g reg ions
of upward and downward v e r t i c a l motion. V e r t i c a l v e l o c i t i e s
a s high as 1.4 m sec" w e r e recorded during t h i s per iod .
a l t e r n a t i n g ver t ica l motion i n t u r n caused a l t e r n a t i n g reg ions
of cold a i r due t o r i s i n g motion and reg ions of warm a i r due
t o subsidence. This l a r g e scale o s c i l l a t i o n i n all parameters
is q u i t e obvious from t h e analyses and a d e t a i l e d d i scuss ion
i s not needed. A t t e n t i o n must be drawn, however, t o t h e
higher frequency wave motion superimposed on t h e long wave.
T h i s shor t wave motion was most no tab le i n t h e wind speed
ana lys i s (Fig. 6d) . One can e a s i l y see t h i s between 0645
The
I
2 9
and 0655 a s t h e sho r t wave trough coincided with the long
wave ridge. Again between 0700 and 0718, t he sho r t wave
motion was very apparent. The wind d i r e c t i o n a l s o respond-
ed t o t h e sho r t wave motion (Fig. 6c). The d i r e c t i o n became
q u i t e e r r a t i c a f t e r 0613, about the same t i m e t h e wind speed
began t o r e f l e c t t h i s motion.
The acous t ic radar record also revealed both t h e
long and shor t wave motion (Fig. 6a). The long wave motion
was q u i t e obviously displayed as t h e per iodic height changes
of t h e echo layer . The he igh t of t he echo l aye r was grad-
u a l l y increas ing during t h e per iod from 0550 t o 0800 b u t t h e
wave motion can be seen superimposed on t h i s r i s i n g t rend.
The per iod was on the order of one hour, t h e same noted i n
t h e analyses of t h e tower da ta , T h e sho r t wave motion i s
c l e a r l y seen, e spec ia l ly between 0645 and 07108 as o s c i l l a -
t i o n s wi th in t h e l a y e r of echoes. N o more d iscuss ion of t he
radar record is needed here save the cause of t h e echoes.
A t 0545, about 30 min a f t e r sunr i se , t h e su r face
began t o warm. This warming resu l ted i n a l aye r of a i r a t
t h e su r face i n which t h e lapse r a t e w a s dry ad iaba t ic . A s
t h i s l a y e r deepened t h e r e l a t i v e l y echo-free region a t t h e
s u r f a c e deepened (Fig. 6a ) . The cause of t h e l aye r of echoes
seen on t h e record may be bes t seen by s e l e c t i n g a few po in t s
3 0
i n t i m e and examining t h e d a t a a t t hese poin ts .
A t 0620 t h e l a y e r of echoes appeared between 100 a n d
2 C O m (Fig. 6 a ) . The temperature p r o f i l e f o r 0620 (Fig. 7 )
shews t h e 1a-c- Y U b rate was n e a r l y drjj- ad iaba t i c frsm t h e sux-
face t o about 100 m. Above, i t w a s less w i t h an invers ion
between 180 and 350 m. On t h e wind speed ana lys i s (Fig. 6d)
one can see t h e s t ronge r wind shear from t h e su r face t o 200 m.
The echoes between 100 and 200 m w e r e caused by tu rbu len t
mixing of t h e a i r i n t h e region where t h e lapse rate w a s
less than d r y ad iaba t i c .
A t 0646 t h e l apse r a t e w a s d ry a d i a b a t i c from t h e
sur face t o 310 m (Fig. 7 ) . This w a s caused not on ly by t h e
s u n ' s warming a t t h e su r face b u t a l s o by t h e formation of
t h e co ld a i r pocket cen tered a t 310 m (Fig. 6b ) . The echo-
i r e e area had deepened t o about 250 m (Fig. 6 a ) . The echoes
w e r e a l so s t ronge r than those seen a t 0620. This increased
i n t e n s i t y w a s caused by t h e sharp v e r t i c a l g r a d i e n t of t e m -
pe ra tu re above the pocket of co ld a i r . By 0725 t h e bottom
of t h e l a y e r of echoes w a s l o w e r as the warming by subsidence
above 150 m rendered t h e lapse ra te above t h a t he igh t less
than dry ad iaba t i c (Fig. 7 ) . The echoes became much weaker
here as t h e r e no longer e x i s t e d any reg ion of s t rong v e r t i -
ca l temperature g r a d i e n t (Fig. 6a ) .
31
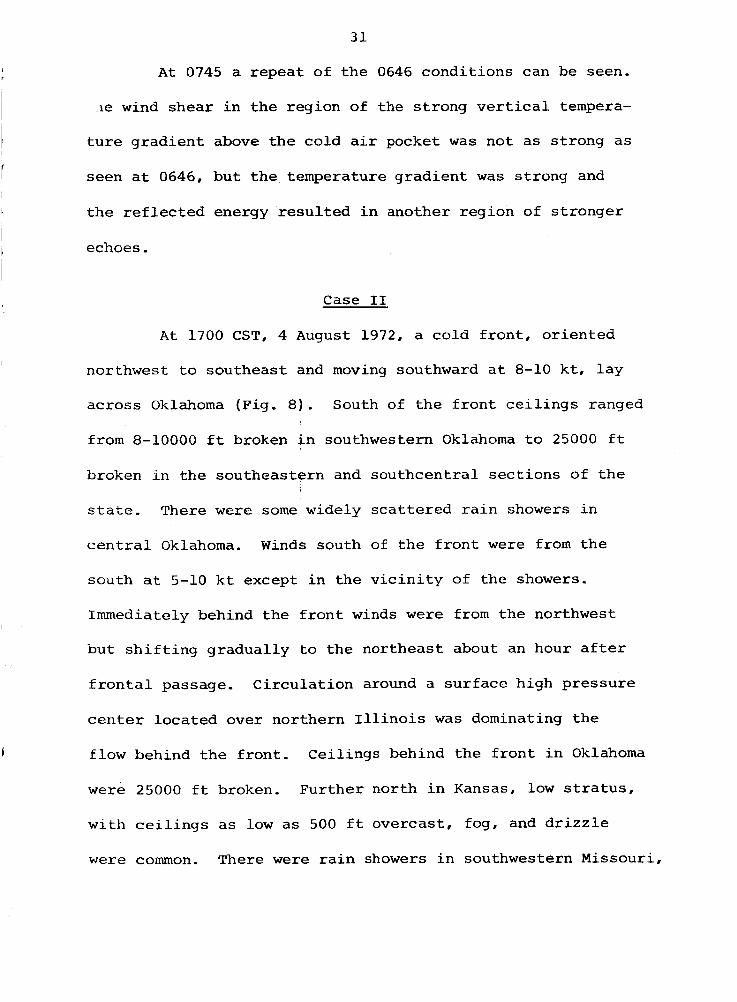
A t 0745 a r epea t of t h e 0646 condi t ions can be seen.
.le wind shear i n t h e region of the s t rong v e r t i c a l tempera-
t u r e g rad ien t above t h e co ld a i r pocket was not a s s t rong as
seen a t 0646, bu t t h e temperature g rad ien t w a s s t rong and
t h e r e f l e c t e d energy r e s u l t e d i n another region of s t ronge r
echoes.
C a s e I1
A t 1700 CST, 4 August 1972, a co ld f r o n t , o r i en ted
northwest t o southeas t and moving southward a t 8-10 k t , l a y
ac ross Oklahoma (Fig, 8). South of t h e f r o n t c e i l i n g s ranged
from 8-10000 f t broken i n southwestern Oklahoma t o 25000 f t
broken i n t h e southeas te rn and southcent ra l s ec t ions of t h e
s ta te , There w e r e s o m e widely s c a t t e r e d r a i n showers i n
c e n t r a l Oklahoma. Winds south of t h e f r o n t w e r e from t h e
south a t 5-10 k t except i n t h e v i c i n i t y of the showers.
Immediately behind t h e f r o n t winds w e r e from t h e northwest
bu t s h i f t i n g gradual ly t o t h e nor theas t about an hour a f t e r
f r o n t a l passage.
c e n t e r l oca t ed over northern I l l i n o i s w a s dominating t h e
flow behind t h e f r o n t . Cei l ings behind t h e f r o n t i n Oklahoma
w e r e 25000 f t broken. Fur ther north i n Kansas, low s t r a t u s ,
wi th c e i l i n g s a s l o w a s 500 f t overcas t , fog, and d r i z z l e
w e r e common. There w e r e r a i n showers i n southwestern Missouri ,
C i r cu la t ion around a su r face high p res su re
3 L
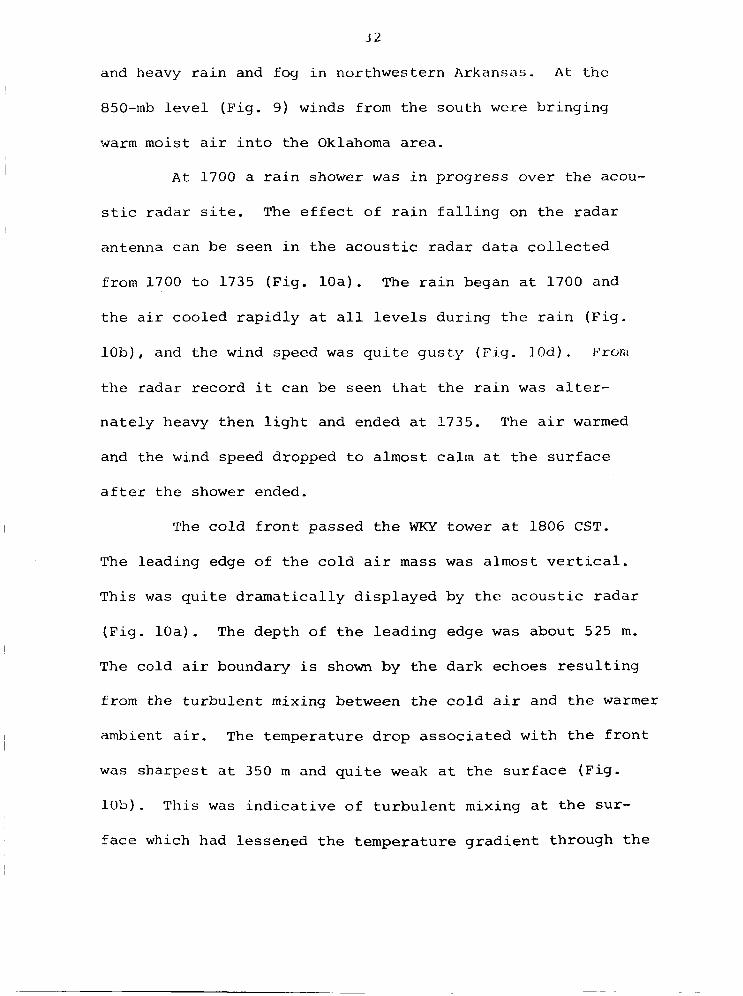
and heavy r a i n and fog i n northwestern Arkansas. A t the
850-mb l e v e l (Fig. 9 ) winds from t h e south w e r e bringing
w a r m moist a i r i n t o t h e Oklahoma area.
A t 1700 a r a i n shower w a s i n progress over t h e acou-
s t i c radar s i te . The e f f e c t of r a i n f a l l i n g on t h e radar
antenna can be seen i n t h e acous t i c radar d a t a c o l l e c t e d
from 1700 t o 1735 (Fig. l o a ) . The r a i n began a t 1700 and
t h e a i r cooled r ap id ly a t a l l l eve l s during t h e r a i n (Fig.
l o b ) , and the wind specd w a s q u i t e g u s t y ( F i g . 10d) . From
t h e radar record it can be seen t h a t the r a i n was a l te r -
na t e ly heavy then l i g h t and ended a t 1735. The a i r warmed
and the wind speed dropped t o almost calm a t t h e su r face
a f t e r t h e shower ended.
The cold f r o n t passed t h e WKY t o w e r a t 1806 CST.
The leading edge of t h e co ld a i r m a s s w a s almost v e r t i c a l .
This w a s q u i t e dramat ica l ly displayed by t h e acous t i c radar
(Fig. l o a ) . The depth of t h e leading edge w a s about 525 m.
The cold a i r boundary i s shown by t h e dark echoes r e s u l t i n g
from the turbulen t mixing between t h e co ld a i r and t h e warmer
a m b i e n t a i r . The temperature drop a s soc ia t ed with t h e f r o n t
w a s sharpest a t 350 m and q u i t e weak a t t h e su r face (Fig.
10b) . This was ind ica t ive of t u r b u l e n t mixing a t t h e sur-
face which had lessened t h e temperature g r a d i e n t through t h e
33
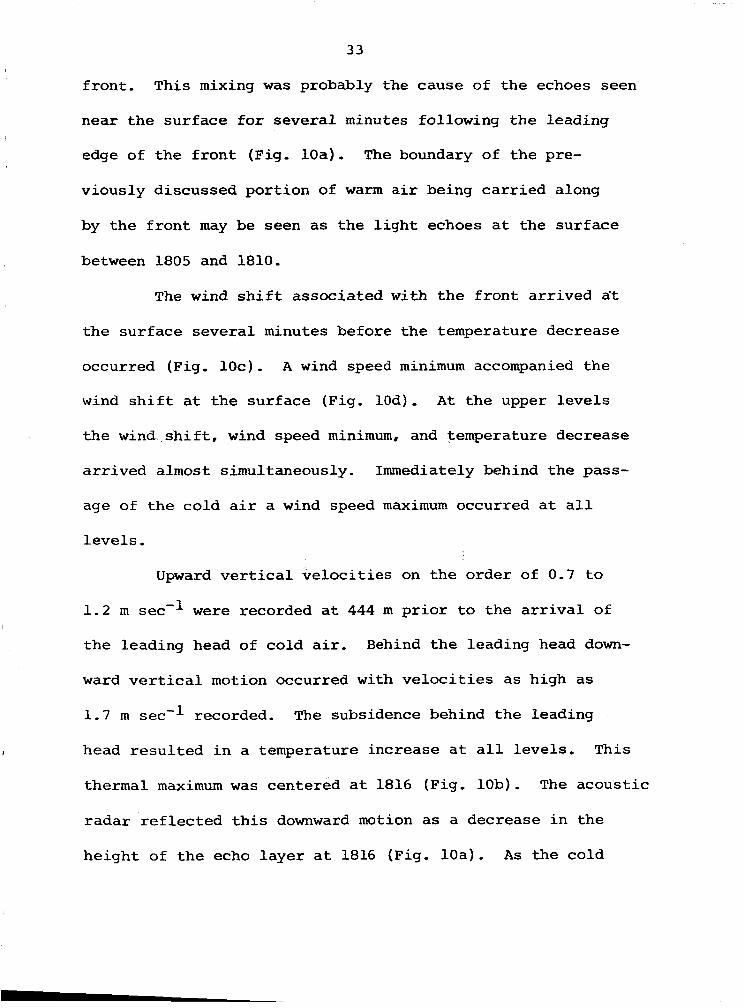
f ron t . This mixing w a s probably the cause of t h e echoes seen
near t h e su r face f o r s eve ra l minutes following t h e leading
edge of t h e f r o n t (Fig. l o a ) . The boundary of t h e pre-
viously discussed po r t ion of warm a i r being c a r r i e d along
by t h e f r o n t may be seen as t h e l i g h t echoes a t t he sur face
between 1805 and 1810.
The wind s h i f t assoc ia ted with t h e f r o n t a r r ived a't
t h e sur face seve ra l minutes before t h e temperature decrease
occurred (Fig. 1 O c ) . A wind speed minimum accompanied the
wind s h i f t at t h e sur face (Fig. loa). A t t h e upper l e v e l s
t h e w i n d s h i f t , wind speed minimum, and temperature decrease
a r r ived almost simultaneously. Immediately behind t h e pass-
age of t h e co ld a i r a wind speed maximum occurred a t a l l
l e v e l s .
Upward v e r t i c a l v e l o c i t i e s on t h e order of 0.7 t o
1.2 m sec'l w e r e recorded a t 444 m p r i o r t o t h e a r r i v a l of
t h e leading head of co ld a i r . Behind t h e leading head down-
ward v e r t i c a l motion occurred with v e l o c i t i e s as high as
1.7 m sec-l recorded. The subsidence behind t h e leading
I head r e s u l t e d i n a temperature increase a t a l l l eve ls . This
thermal maximum w a s centered a t 1816 (Fig. l o b ) . The acous t ic
r ada r r e f l e c t e d t h i s downward motion a s a decrease i n t h e
he igh t of t h e echo l a y e r a t 1816 (Fig. l o a ) . As t he cold
34
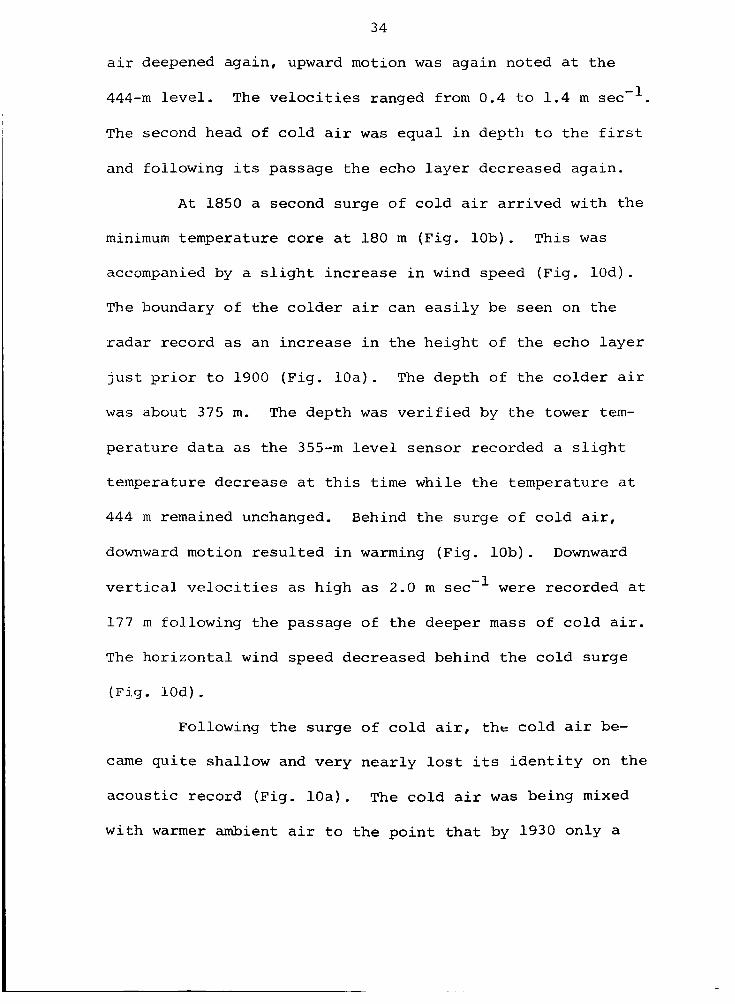
a i r deepened again, upward motion was again noted a t t h e
444-m l eve l .
The second head of cold a i r was equal i n depth t o the f i r s t
and following i t s passage the echo l aye r decreased again.
The v e l o c i t i e s ranged from 0.4 t o 1.4 m sec-’.
A t 1850 a second surge of cold a i r a r r ived with the
m i n i m u m temperature core a t 180 m (Fig. l o b ) . This was
accompanied by a s l i g h t increase i n wind speed (F ig . l oa ) .
T h e boundary of t he co lder a i r can e a s i l y be seen on the
radar record a s an increase i n the height of the echo l aye r
j u s t p r i o r t o 1900 (Fig. l o a ) . The depth of t he co lder a i r
was about 375 m. The depth was v e r i f i e d by the tower tem-
pera ture da t a a s t he 3 5 5 - m l e v e l sensor recorded a s l i g h t
temperature decrease a t t h i s time while t he temperature a t
444 m remained unchanged. Behind the surge of co ld a i r ,
downward motion r e su l t ed i n warming (Fig. l o b ) . Downward
v e r t i c a l v e l o c i t i e s as high a s 2.0 m sec’l were recorded a t
1 7 7 m following the passage of t he deeper mass of co ld a i r .
T h e hor izonta l wind speed decreased behind t h e cold surge
( F i g . 10d) .
Following t h e surge of cold a i r , t he co ld a i r be-
came qu i t e shallow and very near ly l o s t i t s i d e n t i t y on t h e
acoust ic record (Fig. l o a ) . The co ld a i r was being mixed
with warmer ambient a i r t o t h e po in t t h a t by 1930 only a
35
very t h i n l a y e r of cold a i r remained on the surface. Above
t h i s ex i s t ed a deep boundary of mixed a i r . Th i s continucd
u n t i l t h e a r r i v a l of another surge of co ld a i r a t approxi-
mately 2006,
This t h i r d surge of co ld a i r was, l i k e t h e second,
most pronounced a t t h e 177-m l e v e l (Fig. l o b ) . B u t , unl ike
t h e second, it was noted a t a l l l eve l s of the tower a s t he
depth of t h i s surge w a s about 500 m. The co ld a i r w a s accom-
panied by an increase i n wind speed a t a l l l e v e l s (Fig. 10d).
The increase was m o s t notable i n the l aye r from 100 t o 230 m,
corresponding roughly t o the layer of most pronounced t e m -
pe ra tu re change. The speed increase was l e a s t a t t he su r face
and t h e top of t o w e r , The wind s h i f t was most pronounced a t
t h e 444-m l e v e l however (Fig. 1Oc). The wind a t and near
t h e su r face had been gradual ly s h i f t i n g toward t h e e a s t fo l -
lowing t h e i n i t i a l r ap id s h i f t accompanying t h e f ron t . A t
t h e upper l e v e l s of t h e tower the winds had s h i f t e d back t o
t h e southwest following t h e passage of the deep leading head
of co ld a i r , Therefore, t he a r r i v a l of another deep l a y e r
of a i r caused a more pronounced wind s h i f t a t 355 and 444 m.
The a r r i v a l of t he t h i r d surge of cold a i r was noted
on t h e radar record a t 2006 (Fig. l o a ) , The boundary of
mixing co ld and warmer ambient a i r extended t o about 500 m,
36
This surge had an upraised leading nose followed by a deeper,
colder head. This i s seen very c l e a r l y i n t h e temperature
ana lys i s (Fig. lob) as w e l l as t h e acous t ic radar record.
I t ' s appearance is somewhat siinilar t o t h e leading edge of
the co ld i n t r u s i o n discussed i n C a s e I of t h i s s ec t ion .
Turbulent mixing w a s again seen near t h e su r face below t h e
leading nose of co ld a i r .
Following t h e l a s t surge of co ld a i r , t h e co ld a i r
again became shallow and soon l o s t i t s i d e n t i t y as t h e w a r m e r
a i r above mixed with it. Evidence of mixing a t t h e su r face
lasted u n t i l a few hours a f t e r sunr i se .
CHAPTER V
NOCTURNAL LOW-LEVEL W I N D MAXIMUM
The vertical profile of horizontal wind speed some-
times shows a relatively sharp peak or "nose" within the
lowest 1500 m of the atmosphere. This thin layer of maxi-
mum wind speed is generally known as the "low-level jet".
Wind speeds in the jet are often twice those found a few
hundred meters below or above. The low-level jet has been
observed in all parts of the United States, in all seasons,
and at all hours of both day and night (Banner, 1968)- How-
ever, the low-level wind maxima achieve greatest development
and occur most frequently in the central and southern plains
areas of the United States during the summertime between mid-
night and sunrise, The most frequently observed direction
is southerly.
The low-level jet is of great interest to meteorolo-
gists because of the indirect evidence which may be inferred
about turbulent mass transport in the lower atmosphere and
because of the apparent relationship between the jet and the
high frequency of nocturnal thunderstorms in the plains area
37
3 8
of t h e United S ta t e s . The phenomenon i s a l s o of p r a c t i c a l
i n t e r e s t . The low-level j e t has proven t o be very hazardous
t o a i r c r a f t landing operat ions. The s t rong v e r t i c a l shear
helm: t hc l i iyer of maximum wind speed r e s u l t s i n a rap id l o s s
of a i rspeed f o r a descending a i r c r a f t .
dangerous f o r j e t a i r c r a f t which normally land a t n e a r - s t a l l
speeds. The low-level j e t i s a l s o known a s a f u e l or t i m e
saver f o r t h e p i l o t of t h e s m a l l p r i v a t e a i rp l ane . One such
p i l o t reported f ly ing from New Orleans t o Cleveland v i a
J o l i e t , a d i s t ance of 1180 m i , i n a p lane with a range of
oiily 1050 m i (Durosko, 1962).
This can be e s p e c i a l l y
There have been s e v e r a l t h e o r i e s proposed f o r t h e
formation of t h e low-level wind maximum. Blackadar (1957)
saggested t h a t t h e boundary l a y e r winds, which include t h e
low-level j e t , undergo a d i u r n a l o s c i l l a t i o n s imi l a r t o t h e
t h e o r e t i c a l i n e r t i a l o s c i l l a t i o n (see H e s s , 1959, 170-172).
During t h e day t h e real wind is a balance between t h e pres-
s u r e grad ien t , C o r i o l i s , and f r i c t i o n a l forces . Near sunse t
a r ad ia t ion invers ion forms a t t h e sur face . The a i r above
t h e inversion l aye r , no longer being mixed wi th t h e a i r i n
t h e inversion layer , i s e s s e n t i a l l y decoupled from t h e f r ic-
t i o n a l force and i s allowed t o accelerate. I t i s acce le ra t ed
by the r o t a t i o n of t h e ageostrophic vec to r ( V a i n Fig. l l a ) ,
39
the vector difference between the geostrophic wind (Vg in
Fig. lla) and the real wind (Vr in Fig. lla), The maximum
boundary-layer speed during the night is related to the mag-
nitude of the ageostrophic vector at the time of decoupling.
At its maximum the wind speed would be equal to the geo-
strophic wind speed plus the magnitude of the ageostrophic
vector. The period for one complete oscillation is one-half
pendulum day and the wind speed reaches its maximum about 6
pendulum hours after sunset. Since the magnitude and direc-
tion of the real wind approach those of the geostrophic wind
as the height increases, the largest ageostrophic vector, and
hence, the greatest acceleration, would occur at or just
above the top of the radiation inversion (Fig. llb). It is
at this level the low-level jet would appear.
Another prominent theory, proposed by Wexler (19611,
involves the turning northward along the Central American
mountains of tradewind air that enters the Gulf of Mexico.
Wexler proposed a two-layer model, the upper layer station-
ary, the lower flowing northward below 2 km. This air moving
northward provides the volume used by the high-speed low-level
jet. The principle of the jet is explained by the conserva-
tion of potential vorticity.
columns moving northward and if D, column thickness, remains
If (f + C)/D is constant for air
40
constant , then as f , t he C o r i o l i s parameter, increases with
increasing l a t i t u d e , t h e columns of a i r m u s t take on increas-
ing an t icyc lonic r e l a t i v e v o r t i c i t y , C. I f t h i s i s converted
t o an t icyc lonic shear , then a high-speed flow must develop on
t h e western boundary of t h e north-moving layer . F r i c t i o n
along t h e high p l a i n s and Rocky Mountains would cause s t rong
shear of t h e oppos i te sense on t h e western s i d e of t he f l o w ,
r e s u l t i n g i n t h e appearance of a t r u e j e t i n t h e ho r i zon ta l .
F r i c t ion a t t h e su r face would cause v e r t i c a l wind shear i n
t h e lower layer . This combined with t h e s t a t i o n a r y l a y e r
above 2 km would g ive t h e flow a j e t - l i k e appearance i n t h e
v e r t i c a l . A s r a d i a t i o n a l t e r n a t e s t o create and des t roy t h e
surface nocturnal inversion, t h e v e r t i c a l f r i c t i o n a l stresses
would undergo a s t rong d i u r n a l v a r i a t i o n , and so change t h e
v e r t i c a l p r o f i l e of t h e j e t .
There are s t rong and weak p o i n t s i n both of t h e
theor ies descr ibed above. Wexler 's theory implies the j e t
would be i n ac t ion both day and n igh t , with some v a r i a t i o n
caused by sur face f r i c t i o n during t h e day, and t h a t t h e low-
l eve l w i n d maxima have a j e t - l i k e appearance i n t h e hor i -
zontal a s w e l l as t h e v e r t i c a l . Hoecker (1963) found t h e
j e t does o f t e n p e r s i s t during t h e day and does e x h i b i t a
wind speed maximum i n t h e h o r i z o n t a l . Wexler's theory,
41
however, pu t s a l i m i t on t h e d i r e c t i o n of t h e jet , souther ly ,
and c a l l s t h e Rocky Mountains t h e wes te rn boundazy of occur-
rence, Bonner (1968) showed t h a t souther ly is t h e host
common, but c l e a r l y not t he only d i r e c t i o n from which t h e
j e t has been observed. Studies made by Rider and Armendariz
(1966, 1971) i n d i c a t e t h a t t h e low-level jet occurs w e s t of
t h e Rockies. Blackadar 's theory implies t h a t t h e formation
of t h e jet depends on t h e formation of t h e nocturnal radia-
t i o n inversion.
when t h e temperature p r o f i l e is dry ad iaba t i c (Hoecker, 1963)
and t h a t t h e nocturnal inversion may occur without the for-
mation of t h e low-level jet . Blackadar 's theory i s s t rength-
ened by t h e f a c t t h a t most occurrences of t h e low-level jet
a r e i n t h e n ight t i m e hours and a r e accompanied by a sur face
r a d i a t i o n invers ion with the top of t h e inversion below o r
a t t h e l e v e l of maximum wind speed (Bonner, 1968; Rider and
It has been found*that t h e j e t can occur
Armendariz, 1971).
It is not t h e purpose of t h i s research t o examine
e i t h e r t h e formation of the low-level j e t o r t he m e r i t of
any theory on i t s formation, but r a t h e r t o inves t iga t e t h e
r e l a t i o n s h i p of t he je t t o the nocturnal inversion i n t h e
l i g h t of conclusions reached by Blackadar (1957). In t h e
p re sen ta t ion of h i s theory, he d e a l t a t s o m e length on t h e
42
r e l a t i o n s h i p of t h e two phenomena. Above t h e he ight of about
one m e t e r , t h e rate of nocturnal cooling i s too l a r g e t o be
accounted f o r by r a d i a t i o n a l o r conductive f luxes . I t i s
the re fo re evident t h a t t u r b u l e n t t r a n s f e r i s t h e ch ief
con t ro l on t h e rate of upward propagation of t h e invers ion
surface. The cause of t h e turbulence l i e s i n the s t rong
wind shear which develops wi th in t h e invers ion and which
suppl ies t h e tu rbu len t energy t o overcome s t a b i l i t y . When
s t a b i l i t y is overcome t h e invers ion may be destroyed, deepen
i n a chao t i c fashion, o r grow slowly and o rde r ly upward.
The cha rac t e r of t h e wind p r o f i l e w i l l determine which a l t e r -
na t ive w i l l occur.
Blackadar concluded t h a t i f t h e wind speed maximum
i s some d i s t ance above t h e top of t h e invers ion , t h e inver-
s ion w i l l e i t h e r be destroyed o r grow upward c h a o t i c a l l y .
However, while t he wind shear i s probably s t rong enough t o
allow a cont inua l genera t ion of turbulence, t h e presence of
t h e wind speed maximum a t t h e top of t h e invers ion a s su res
tha t t h e generat ion of tu rbulence i s kept under con t ro l .
The inversion w i l l grow upward slowly and o rde r ly , with t h e
he ight of t h e wind speed maximum inc reas ing slowly t o remain
coincident with t h e top of t h e deepening invers ion . The
ex is tence of a j e t - l i k e p r o f i l e w i th a wind maximum a t t h e
1
4 3
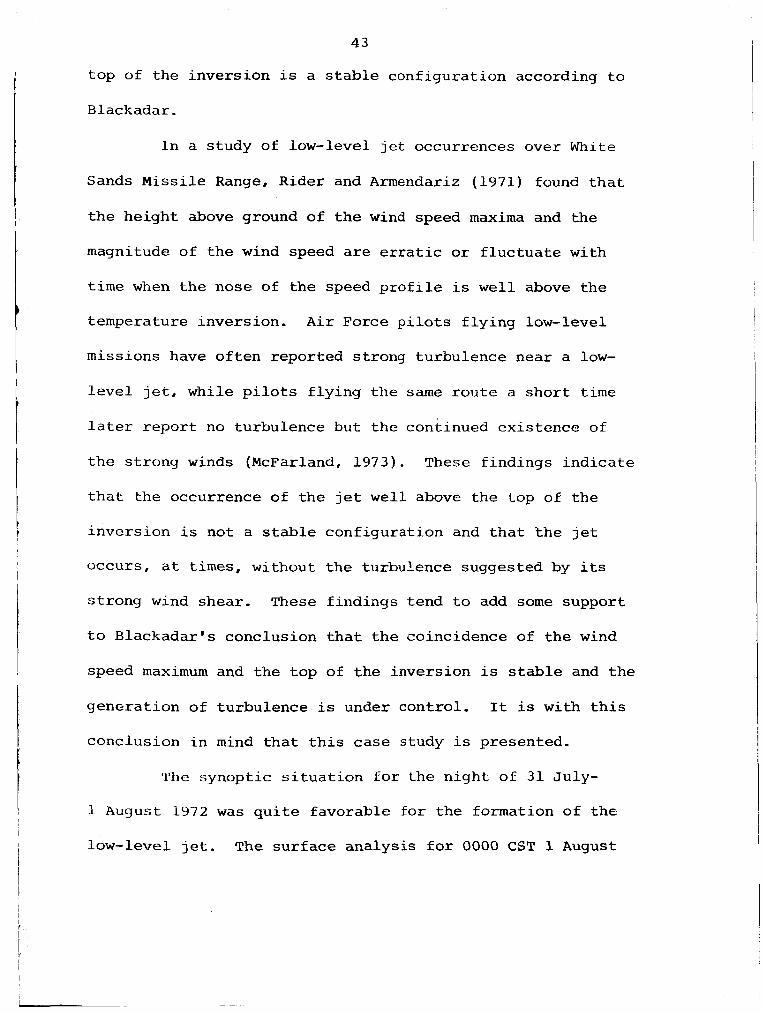
t o p of t he invers ion is a s t a b l e conf igura t ion according t o
Blackadar.
I n a s tudy of low-level je t occurrences over White
Sands M i s s i l e Range, Rider and Armendariz (1971) found t h a t
t h e he ight above ground of t h e wind speed maxima and t h e
magnitude of t h e wind speed are erratic or f l u c t u a t e with
t i m e when t h e nose of t h e speed p r o f i l e is w e l l above t h e
temperature inversion. A i r Force p i l o t s f l y i n g low-level
missions have o f t e n reported s t r o n g turbulence near a low-
l e v e l j e t , while p i lo t s f l y i n g t h e same route a s h o r t t i m e
la ter r e p o r t no turbulence but t h e continued ex i s t ence of
t h e s t rong winds (McFarland, 1 9 7 3 ) . These f ind ings i n d i c a t e
t h a t t h e occurrence of t h e j e t w e l l above t h e top of t h e
inve r s ion i s not a stable conf igura t ion and t h a t t h e j e t
occurs , a t times, without t h e turbulence suggested by i t s
s t rong wind shear . These f indings tend t o add s o m e support
t o Blackadar 's conclusion t h a t t h e coincidence of t h e wind
speed maximum and t h e t o p of t h e inversion is stable and t h e
gene ra t ion of turbulence is under cont ro l . It is with t h i s
conclusion i n mind t h a t t h i s ca se study i s presented.
The synopt ic s i t u a t i o n f o r t h e n igh t of 31 July-
1 August 1972 w a s q u i t e favorable f o r t he formation of t h e
low-level je t . T h e su r f ace ana lys i s f o r 0000 CST 1 August
44
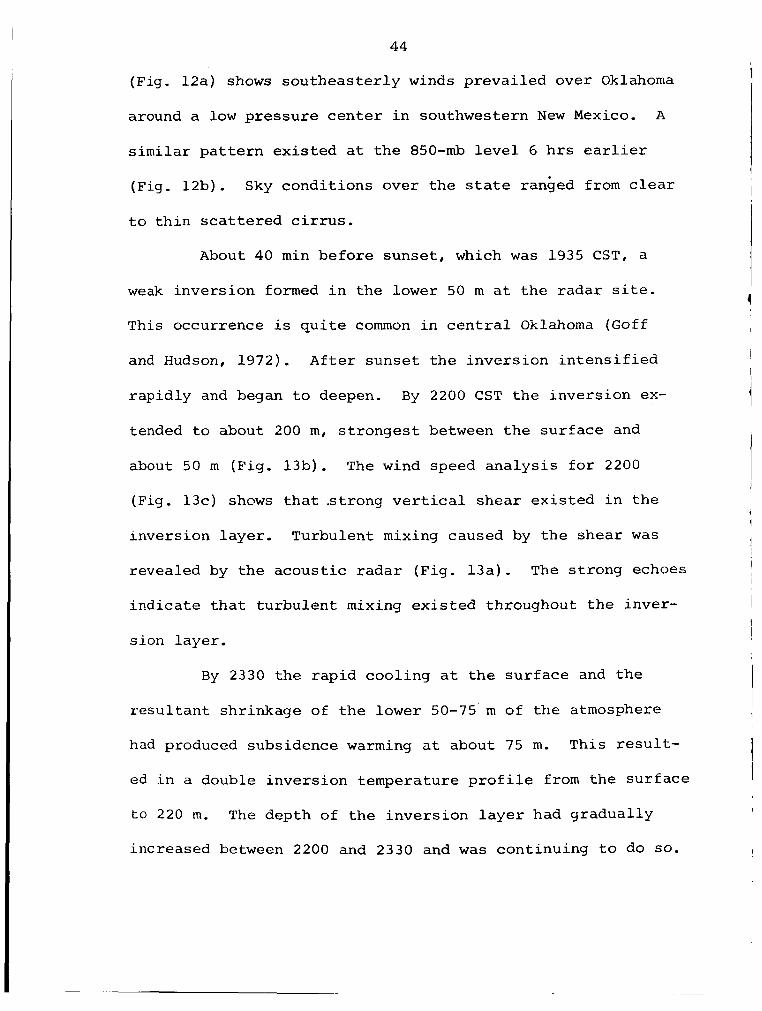
(Fig. 12a) shows sou theas t e r ly winds preva i led over Oklahoma
around a low p res su re center i n southwestern New Mexico, A
similar p a t t e r n e x i s t e d a t t h e 850-mb l e v e l 6 h r s ear l ier
(Fig. 12b). Sky condi t ions over t h e s t a t e ranbed from clear
t o t h i n s c a t t e r e d c i r r u s .
About 40 m i n before sunse t , which w a s 1935 CST, a
weak invers ion formed i n t h e l o w e r 50 m a t t h e radar s i t e .
This occurrence i s q u i t e common i n c e n t r a l Oklahoma (Goff
and Hudson, 1972). Af t e r sunse t t h e invers ion i n t e n s i f i e d
rap id ly and began t o deepen. By 2200 CST t h e invers ion ex-
tended t o about 200 m, s t ronges t between t h e su r face and
about 50 m (Fig. 13b) . The wind speed ana lys i s f o r 2200
(Fig. 13c) shows t h a t s t r o n g v e r t i c a l shear e x i s t e d i n t h e
inversion layer . Turbulent mixing caused by t h e shear w a s
revealed by t h e acous t i c r ada r (Fig. 13a ) . The s t rong echoes
ind ica t e t h a t t u rbu len t mixing e x i s t e d throughout t h e inver-
s ion layer .
By 2330 t h e rap id cool ing a t t h e su r face and t h e
r e s u l t a n t shrinkage of t h e lower 50-75'm of t h e atmosphere
had produced subsidence w a r m i n g a t about 75 m. This r e s u l t -
ed i n a double invers ion temperature p r o f i l e from t h e su r face
to 220 in. The depth of t h e inve r s ion l a y e r had g radua l ly
increased between 2200 and 2330 and w a s cont inuing t o do SO.
1
,
45 I
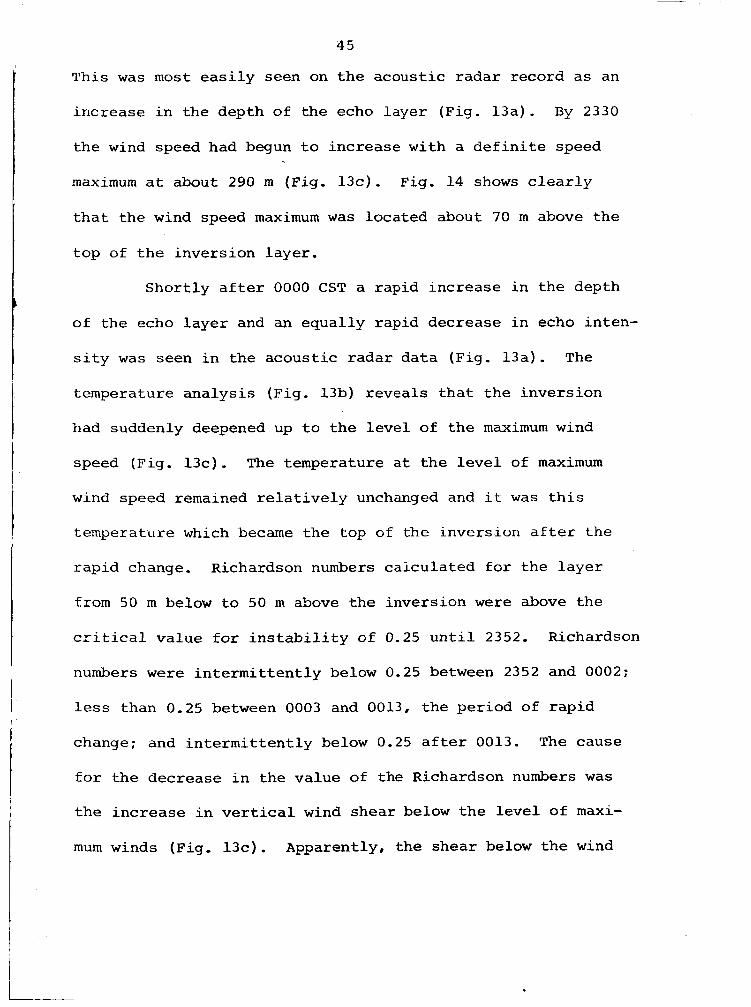
! T h i s was most e a s i l y seen on t h e acoust ic radar record a s an
increase i n t he depth of t he echo layer (Fig. 13a) . By 2330
the wind speed had begun t o increase with a d e f i n i t e speed
maximum a t about 290 m (Fig. 13c). Fig. 14 shows c l e a r l y
t h a t t he wind speed maximum w a s located about 70 m above t h e
top of t h e inversion l aye r ,
Shor t ly a f t e r 0000 CST a rapid increase i n t he depth t
of the echo l aye r and an equal ly rapid decrease i n echo i n t e n -
s i t y was seen i n the acous t ic radar da t a (Fig. 13a) . The
temperature ana lys i s (Fig. 13b) reveals t h a t t h e invers ion
had suddenly deepened up t o t h e l e v e l of t h e maximum wind
speed (Fig, 13c) . The temperature a t t h e l e v e l of m a x i m u m
wind speed remained r e l a t i v e l y unchanged and it was t h i s
temperature which became the top of the inversion a f t e r t he b
I
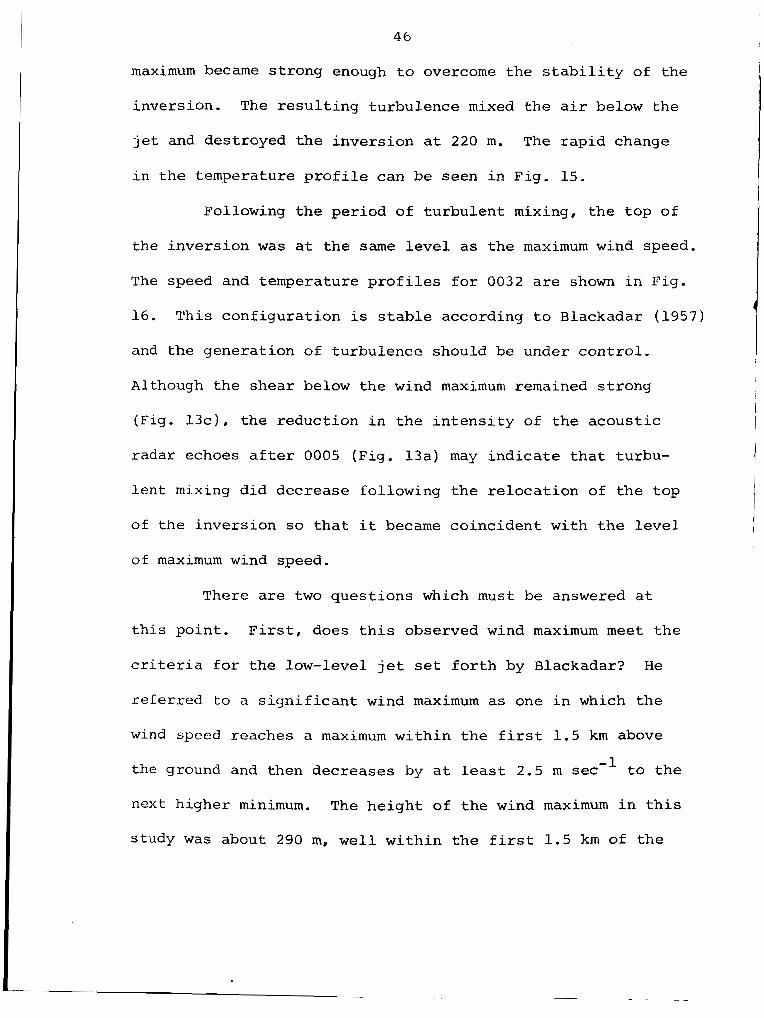
46
maximum became s t rong enough t o overcome the s t a b i l i t y of the
inversion.
j e t and destroyed t h e invers ion a t 220 m.
i n t he temperature p r o f i l e can be seen i n Fig. 15.
The r e s u l t i n g turbulence mixed the a i r b e l o w the
The r ap id change
Following t h e per iod of t u rbu len t mixing, the t o p of
the invers ion was a t t h e same l e v e l a s t h e maximum wind speed.
The speed and temperature p r o f i l e s f o r 0032 a r e shown i n Fig.
16 . T h i s conf igura t ion i s stable according t o Blackadar (1957)
and t h e generat ion of turbulence should be under con t ro l .
Although t h e shear below t h e wind maximum remained s t rong
(Fig. 1 3 c ) , t he reduct ion i n t h e i n t e n s i t y of t he acous t ic
radar echoes a f t e r 0005 (Fig. 13a) may i n d i c a t e t h a t turbu-
l e n t mixing d id decrease following t h e r e l o c a t i o n of the t o p
of the invers ion so t h a t i t became coinc ident with t h e l e v e l
of maximum wind speed.
There a r e two ques t ions which m u s t be answered a t
t h i s po in t . F i r s t , does t h i s observed wind maximum m e e t t h e
c r i t e r i a for the low-level j e t set f o r t h by Blackadar? H e
r e f e r r e d to a s i g n i f i c a n t wind maximum a s one i n which the
w i n d speed reaches a maximum wi th in the f i r s t 1.5 k m above
the ground and then decreases by a t l e a s t 2.5 m sec t o t h e
n e x t higher minimum. The h e i g h t of the wind maximum i n t h i s
study was about 290 m, w e l l w i t h i n t h e f i r s t 1.5 k m of t h e
-1
47
lower atmosphere. The magnitude a t t h e maximum l e v e l a t 2330
was about 15.5 m sec-'.
speed was 12.4 m sec-l a t 2330.
w a s a t t h e top of the tower, t he wind maximum did m e e t t h e
c r i t e r i o n . It i s l i k e l y t h a t t h e next h igher m i n i m u m was
much h igher and t h e wind speed much less than 12.4 m sec'l
a s t he wind speed a t t h e 850-mb l e v e l was on t h e order of
6-8 m sec-l. This wind maximum a l s o m e t t h e c r i t e r i a set
by Bonner (1968) t o be c l a s s i f i e d a s a low-level jet.
A t t h e 444-m l e v e l of t h e tower t h e
If t h e next higher minimum
The second quest ion involves the change i n i n t e n s i t y
of t h e acous t ic radar echoes which occurred with t h e change
i n t h e depth of t h e inversion. Could some c h a r a c t e r i s t i c of
t h e radar cause such a change? There a r e two p o s s i b i l i t i e s
here. If an acous t ic wave i s t ransmit ted v e r t i c a l l y i n t o a
l aye r i n which t h e wind speed i s increas ing i n he ight , t he
path of t h e wave w i l l be curved. As t h e wave t rave led higher ,
s c a t t e r i n g volumes, which could r e s u l t i n backscat tered
energy, would be f u r t h e r removed hor i zon ta l ly from t h e ver-
t i c a l "aim" of t h e t ransmi t te r . Likewise t h e energy back-
s c a t t e r e d would r e t u r n t o the rece iver i n a curved path. A
change i n t h e wind p r o f i l e , i n speed or d i r e c t i o n , over t he
radar s i t e could r e s u l t i n a change i n echo i n t e n s i t y a s i t
would phys ica l ly change t h e region i n t o which t h e acous t ic
48
energy is being t ransmi t ted . However, t h i s change would
have t o be r a t h e r abrupt t o cause an abrupt change i n t h e
radar data . A s can be seen i n Fig. 13c, t h e r e was no abrupt
chanqe i n wind speed. The wind d i r e c t i o n was cons tan t a t
a l l l e v e l s of t h e t o w e r throughout t h e per iod. The second
p o s s i b i l i t y i s a change i n the s c a l e of tu rbu len t mixing.
The acous t ic radar i s most s e n s i t i v e t o tu rbu len t temperature
f luc tua t ions on the o rde r of 10 cm. The breakdown of t h e
invers ion a t 220 m may have caused t h e s c a l e of f l u c t u a t i o n s
t o change to a dimension t o which the radar i s not a s sen-
s i t i v e . Hence, a change i n the qcho i n t e n s i t y would have
occurred. A s can be seen i n Fig. 15 , t h e breakdown of the
inversion d i d not a f f e c t t h e temperature p r o f i l e t o any
l a r g e degree below 150 m. B u t t he i n t e n s i t y of t h e r ada r
echoes d id change i n t h i s region (Fig. 13a ) . This would
ind ica t e t h a t t h i s c h a r a c t e r i s t i c of t h e radar probably
had l i t t l e t o do with t h e observed change of i n t e n s i t y .
I f i t can now be assumed t h a t t h e decrease i n echo
i n t e n s i t y was caused by a decrease i n t u r b u l e n t mixing below
t h e j e t , t h i s low-level j e t - inve r s ion occurrence f i t s q u i t e
w e l l Blackadar 's conclusion. The inve r s ion began t o form
near s u n s e t . Severa l hours l a t e r t h e j e t formed above t h e
top Of t h e inversion. Strong wind shear caused tu rbu len t
~ 49
f mixing in the inversion layer. The heavy layer of echoes on
the acoustic radar record (Fig. 13a) gave some measure of
t that turbulent mixing. Then came the sudden increase in the
height of the inversion layer up to the level of the jet.
The jet speed continued to increase and the shear below the
jet became stronger. But the turbulent mixing below the jet
I
I decreased, as revealed by the change in echo intensity on
the radar record.
The top of the inversion add the jet remained at the
same height, 290 m, until about 0315 CST, then, remaining
coincident, began a slow increase in height to 450 m by sun-
rise. After sunrise the jet-inversion structure broke up.
To close out this case study, it should be of inter-
est to compare the speed and direction of the observed jet
with those of the jet predicted by Blackadar's inertial
oscillation. To find the predicted wind, the real wind
and the geostrophic wind are needed at the time of the de-
coupling described earlier. The surface inversion formed
at 1855 CST; sunset occurred at 1935. The average of these
times, 1915, was taken as an estimated time for decoupling.
The surface geostrophic wind speed, 11.5 m sec-l, was com-
puted from 1900 CST surface observations. The direction,
178O, was estimated from the surface analysis for 1900.
I
i
50
1 The r e a l wind speed, 8.5 m sec- , and d i r e c t i o n , 1 5 1 ° , w e r e
the averages of a 10-min per iod of da t a , centered a t 1915,
from t h e upper t h r e e l e v e l s of t h e tower, 266 355, and
444 rn. These t h r e e l e v e l s w e r e ckcseri because the j e t was
observed between 290 and 450 m, The r e a l and geostrophic
winds ( V r and Vs, r e spec t ive ly , i n Fig. 1 7 ) w e r e p l o t t e d and
the ageostrophic vec tor (Va i n Fig. 1 7 ) was determined. Fig.
1 7 shows the v a l i d t i m e , d i r e c t i o n , and speed of t h e winds
pred ic ted by t h e i n e r t i a l o s c i l l a t i o n . Note t h a t t h e maxi-
mum wind was predic ted t o occur a t 0308 CST, from 1 7 8 O , and
with a speed of 16.0 m sec-l.
t i m e s may be found by i n t e r p o l a t i n g along t h e c i rc le t o t h e
d i s i r e d t i m e , measuring t h e length f r o m t h e o r i g i n t o t h a t
po in t , 1,'' = 1 m sec-', and measuring tile angle a s i nd ica t ed
(Fig. 1 7 ) .
Predicted winds for o t h e r
Fig. 18 shows t h e speeh and d i r e c t i o n of t h e r e a l
winds. These w e r e p l o t t e d from t h e t o w e r da ta . They re-
present t h e speed and d i r e c t i o n of t h e maximum wind recorded
for the t i m e given.
the night was 17.5 m sec", from 1 7 2 " , a t 0323 CST, very
c lose on a l l measures t o t h e maximum p r e d i c t e d (Fig. 1 7 ) .
I t should be noted t h a t t h e observed winds followed t h e pre-
d i c t ed p a t t e r n more c l o s e l y a f t e r 0000 cST than before, o r
The h ighes t wind speed recorded during
I
51
a f t e r t h e top of t h e temperature inversion became coincident
with t h e low-level jet.
CHAPTER VI
SUMMARY AND CONCLUSIONS
The acoustic radar proved to be a valuable asset to
the study of the planetary boundary layer at the very outset
of this research. The low-level jet-nocturnal inversion ob-
served 31 July-1 August 1972 occurred when the conventional
synoptic information indicated little of interest was taking
place. The WKY tower data is much too voluminous for routine
inspection The acoustic radar,record, however, can be exam-
ined daily \ in a matter of minutes. Examination of the radar
data for th night of 31 July-1 August revealed that some-
thing had qccurred that warranted investigation.
the acoustic radar as a monitor of the lower atmosphere could
I The use of
/
be very important.
The case studies presented here suggest other impor-
tant uses for the acoustic radar. AS theory predicted, these
studies confirmed that the primary Sources of backscattered
acoustic energy are turbulent fluctuations of temperature
and Strong temperature gradients. This being true, much can 5 2
53
be inferred about the temperature and wind structure of the
lower atmosphere from the examination of acoustic radar data,
The boundary between air masses of differing temperatures
can easily be seen as was shown in the studies of the cold
intrusion and the cold front. Changes in the height of such
a boundary would yield qualitative information of the ver-
tical motions along that boundary, This suggests that the
acoustic radar should be a useful tool in the study of cold
outflow from thunderstorms, fronts, thermal, and wave motion
in the atmosphere, The indication of regions of strong wind
shear on the acoustic radar data implies that the radar could
be a valuable aid in aircraft operations, particularly in
the case of light aircraft, to which strong shear is a
definite hazard.
Although these studies and the above suggestions have
been limited to qualitative interpretation of acoustic radar
data, this does not imply that the acoustic radar is limited
to qualitative data only. Determination of the structure
constants of wind and temperature and the use of the Doppler
shift of the acoustic returns would yield quantitative infor-
mation on horizontal and vertical velocities and temperature.
The acoustic radar data was used in the study of the
low-level jet occurrence not to suggest, but to demonstrate
54
the usefulness of the radar. T h i s j e t - invers ion occurrence
behaved almost exac t ly as p red ic t ed by Blackadar (1957) .
The acoustic radar c l e a r l y revealed t h e sudden rap id growth
of the inversion, and a f t e r t h e invers ion top and t h e j e t
became coincident , t h e r ada r may have ind ica ted a decrease
i n the amount of t u rbu len t mixing i n t h e invers ion l a y e r
below t h e jet. T h e decrease i n tu rbu len t mixing could not
have been seen with conventional meteorological instruments.
However, more s tudy i s needed i n t h i s a r ea t o determine t h e
c a p a b i l i t i e s of t h e acous t i c radar i n t h e measurement of
tu rbulen t mixing.
A s i d e from t h e acous t i c radar , t h i s case s tudy o f f e r s
some i n s i g h t i n t o one of t h e most i n t e r e s t i n g of boundary
l aye r phenomena. I t suggests t h a t , al though t h e low-level
j e t does occur when o t h e r temperature p r o f i l e s a r e observed,
t h e p re fe r r ed o r stable conf igura t ion is one i n which t h e
cernperature p r o f i l e i s somewhat s i m i l a r t o t h a t of t h e wind
speed, and t h a t when t h i s conf igu ra t ion i s a t t a i n e d , the je t
winds follow Blackadar 's i n e r t i a l o s c i l l a t i o n c lose ly . This
conclusion must be viewed i n t h e l i g h t of t h e f a c t t h a t t h i s
was the study of only one such occurrence. Clear ly , more
study is needed i n t h i s area.
REFEFtENCES
I Beran, D. W., C. G. L i t t l e , and B. C. Willmarth, 1971: Acoustic Doppler Measurements of V e r t i c a l V e l o c i t i e s i n t h e Atmosphere. Nature, 2308 160-162.
Blackadar, A. K., 1957: Boundary Layer Wind M a x i m a and Their S igni f icance f o r the Growth of Nocturnal Inversions. Bull. mer. Meteor. SOC., 38, 283-290.
Bonner, W. D,, 1968: Climatology of the Low Level Jet. Mon. W e a . Rev., 96, 833-850.
Ca r t e r , J. K., 1970: The Meteorologically Instrumented WKY-TV I T o w e r Fac i l i t y . National Severe Storms Laboratory,
Tech. Memo. No . 50, 18 pp.
Cronenwett, W. T., G. B. Walker, and R. L. Inman, 1972: Acoustic Sounding of Meteorological Phenomena i n t h e P lane tary Boundary Layer. J. A p p l . Meteor., 11, 1351-1358.
Digges, L., 1555: A Proqnostication of Riqht Good Effect . London.
Durosko, T., 1962: Low-Level Je t Streams. Flying, 71.
G i l m a n , G, W., H. B. Coxhead, and F. H. W i l l i s , 1946: Ref lec t ion of Sound Signals i n t h e Troposphere. J. Acoust. SOC. Amer . , 18, 274-283.
Goff, R. E., and H. R. Hudson, 1972: The Thermal S t ruc tu re of the Lowest Half Kilometer i n Cent ra l Oklahoma: December 9, 1966-May 318 1967. National Severe Storms Laboratory, Tech. Memo. No . 58, 53 pp.
H e s s , S. L., 1959: Introduct ion t o Theore t ica l Meteorology.
55 H o l t , Rinehart, and Winston, New York, 170-172.
56
Hoecker, W. H., Jr., 1963: Three Southerly Low-Level Jet Systems Delineated by the Weather Bureau Special Pibal Network of 1961. Mon. Wea. Rev., 91, 573-582.
Little, C. G., 1969: Acoustic Methods for the Remote Probing of the Lower Atmosphere. Proc. I.E.E.E., 57, 571-578.
Marks, Jr. R., 1972: Acoustic Radar Investiyation of Boundary Layer Phenomena. Master's Thesis, University of Oklahoma.
McAllister, L. G., 1968: Acoustic Sounding of the Lower Tropo- sphere. J. Atmos. Terr. Phys., 30, 1439-1444.
McAllister, L. G., J. R. Pollard, A. R. Mahoney, and P. J. R. Shaw, 1969: Acoustic Sounding--A new Approach to the Study of Atmospheric Structure. Proc. I.E.E.E., 57, 579-587.
McFarland, M. J., 1973: Personal communication.
Monin, A. S., 1962: Characteristics of the Scattering of Sound in a Turbulent Atmosphere. Akusticheskij Zhur- nal, Vol. 7, 457-461 (Sov. Phys. Acoust., Vol. 7, 370-373).
Rider, L. J. and M. Armendariz, 1966: Low-Level Jet Winds at Green River, Utah. J. Appl. Meteor., 5, 733-736.
Rider, L. J. and M. Armendariz, 1971: Nocturnal Maximum Winds in the Planetary Boundary Layer at White Sands Missile Range, New Mexico. J. Appl. Meteor., 10, 1154-1161.
Tyndall, J., 1875: Sound. Appleton Co., London, 3 ed., Ch 7-
Wexler, H., 1961: A Boundary Layer Interpretation of the Low-Level Jet. Tellus, 13, 369-378.
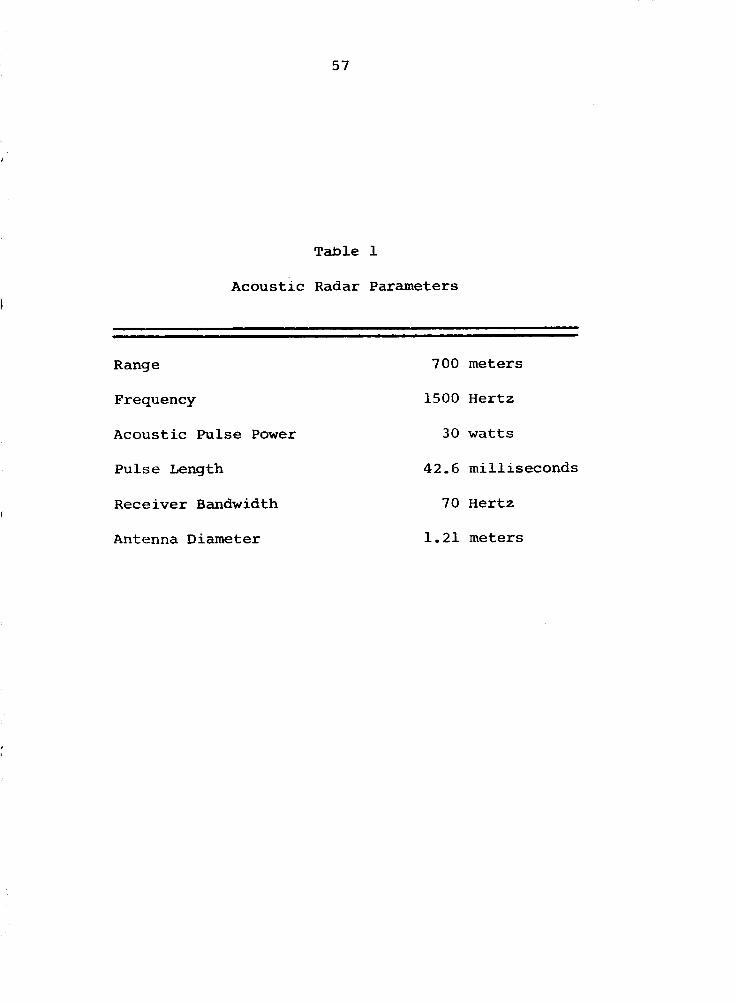
57
Table 1
Acoustic Radar Parameters
Range 700 meters
Frequency 1500 Hertz
Acoustic Pulse Power 30 watts
Pulse Length 42.6 milliseconds
Receiver Bandwidth 70 Hertz
Antenna Diameter 1.21 meters
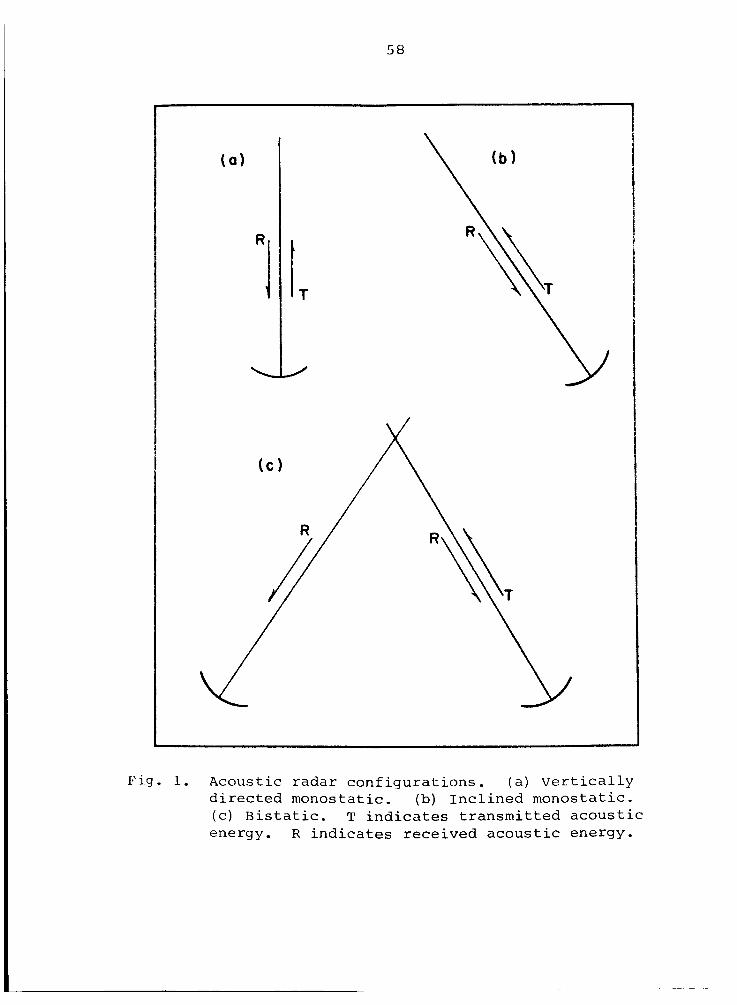
5 8
E’i.9. 1. Acoustic r ada r conf igu ra t ions . ( a ) V e r t i c a l l y d i r e c t e d monostatic. (b) I n c l i n e d monostat ic . ( C ) B i s t a t i c . T i n d i c a t e s t r a n s m i t t e d a c o u s t i c energy. R i n d i c a t e s rece ived a c o u s t i c energy.
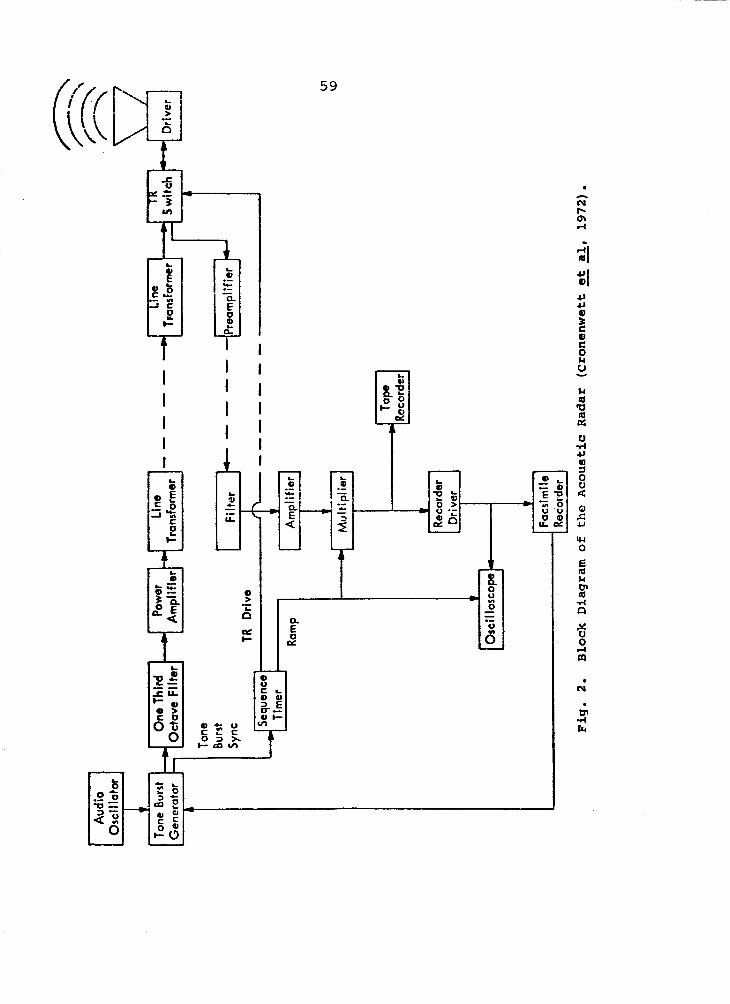
I
59
.
G
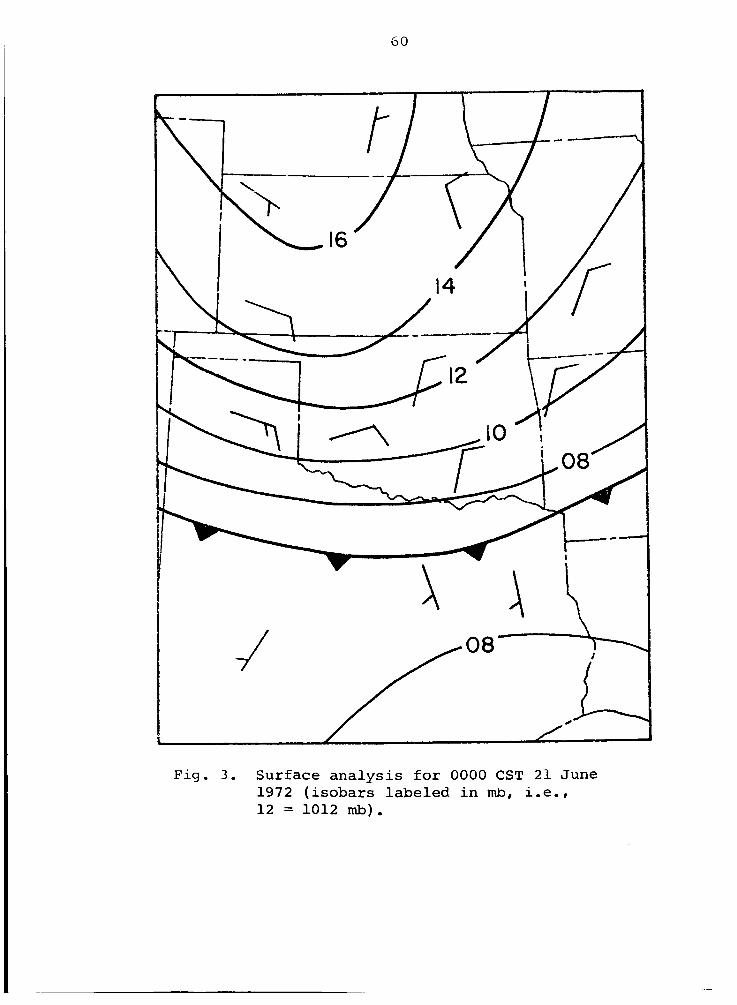
60
J
Fig. 3. S u r f a c e analysis f o r 0000 CST 21 J u n e 1972 (isobars labeled in mb, i.e.8 12 = 1012 mb).
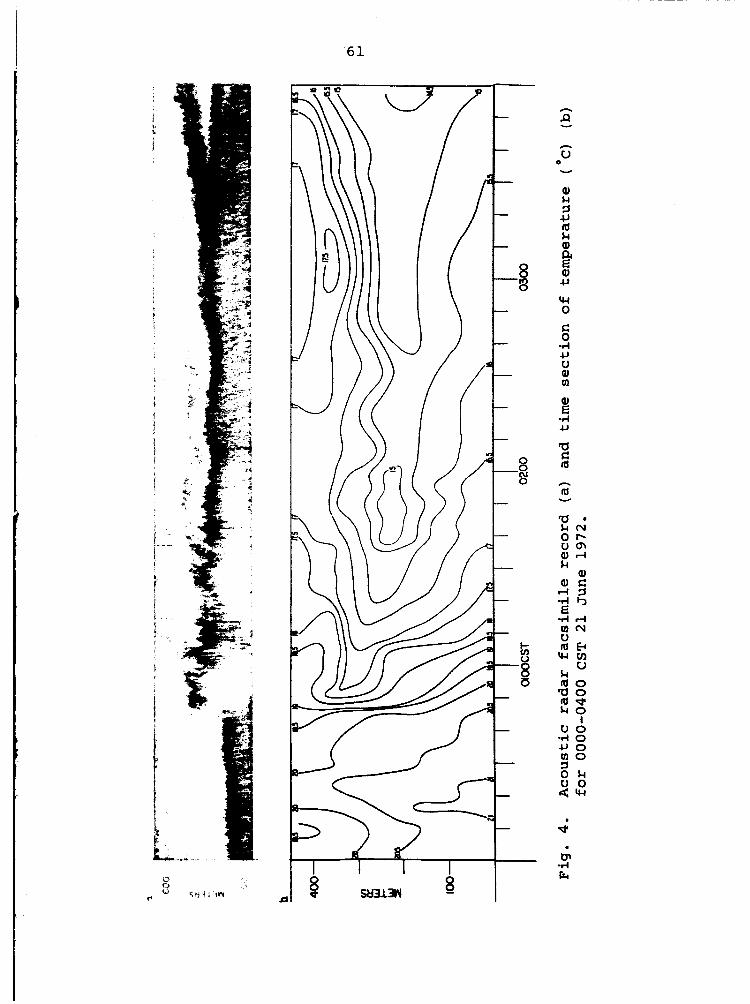
61
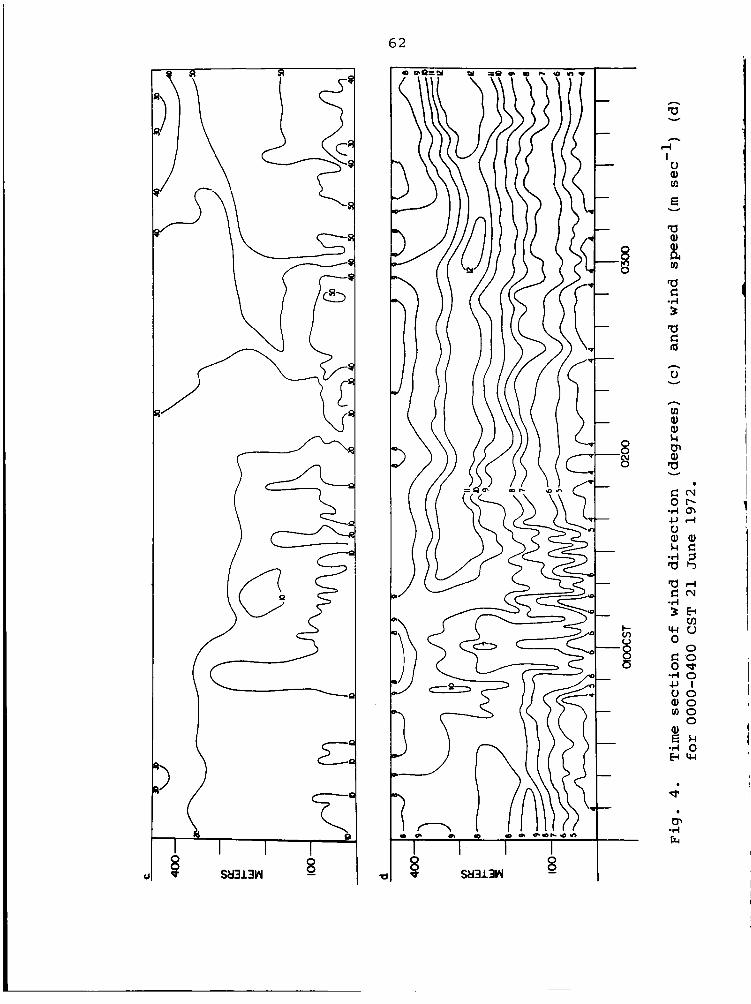
62
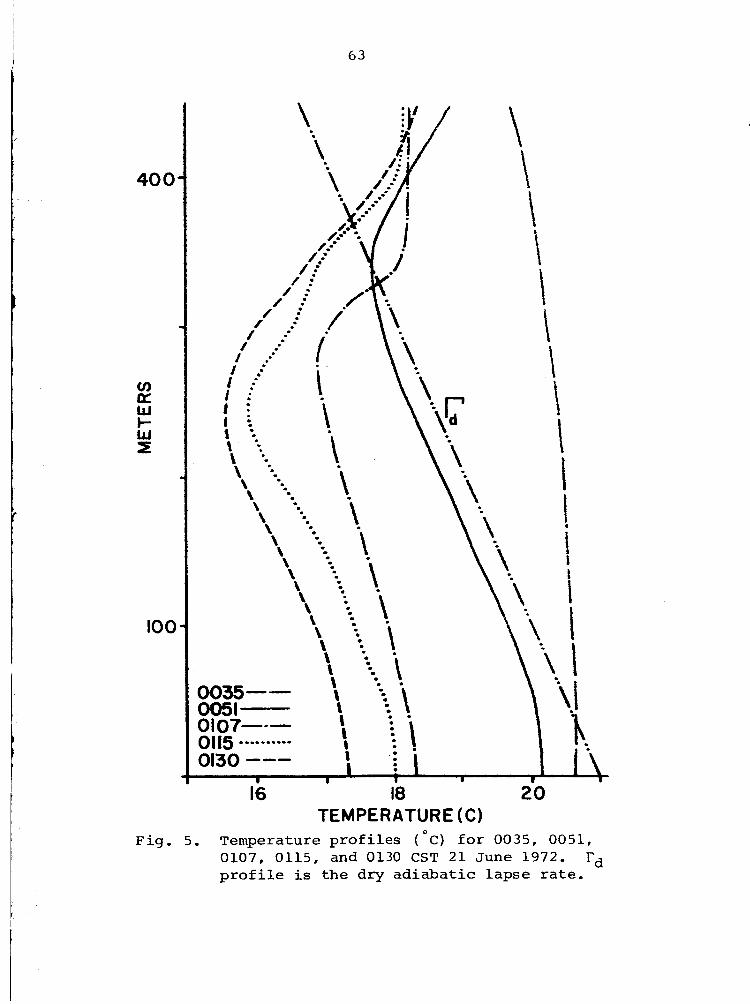
6 3
400
v)
w I- w z
a
100
16 18 20 TEMPERATURE (C)
F i g . 5. Temperature p r o f i l e s (OC) f o r 0035, 0051, 0107, 0115, and 0130 CST 2 1 June 1972. rd profile is the dry ad iaba t i c lapse r a t e .
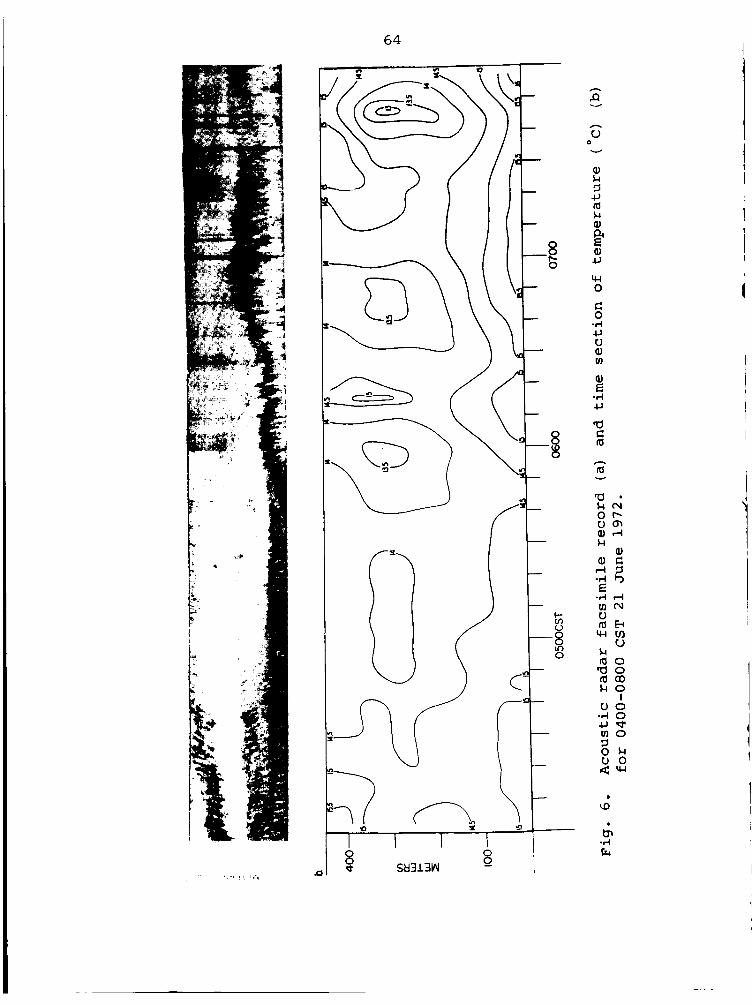
c
64
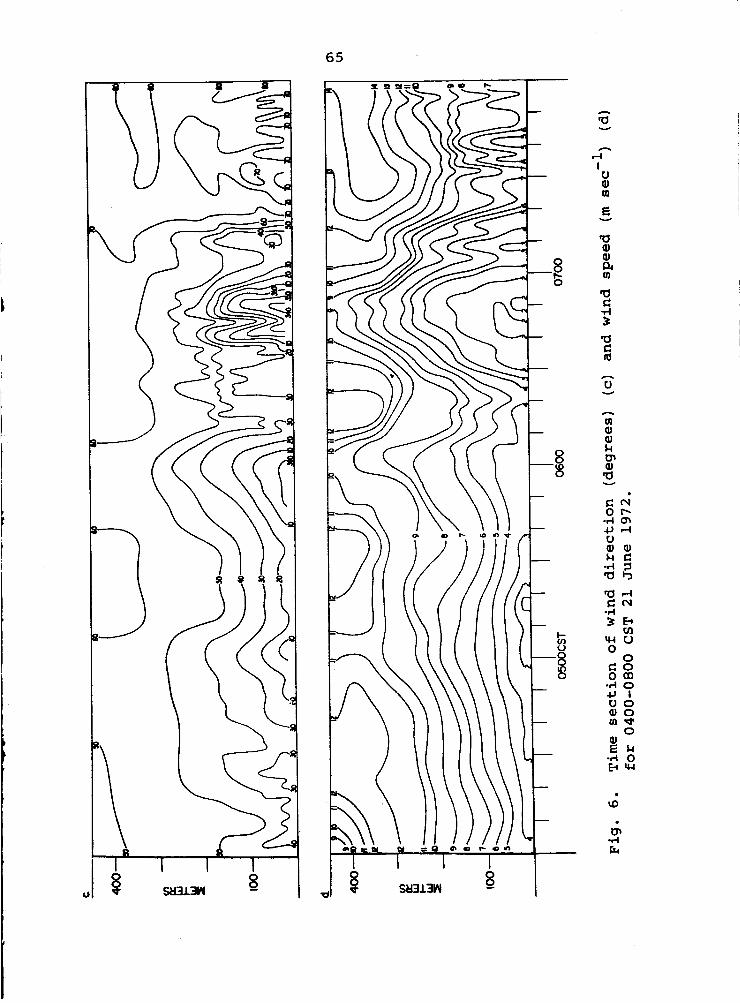
65
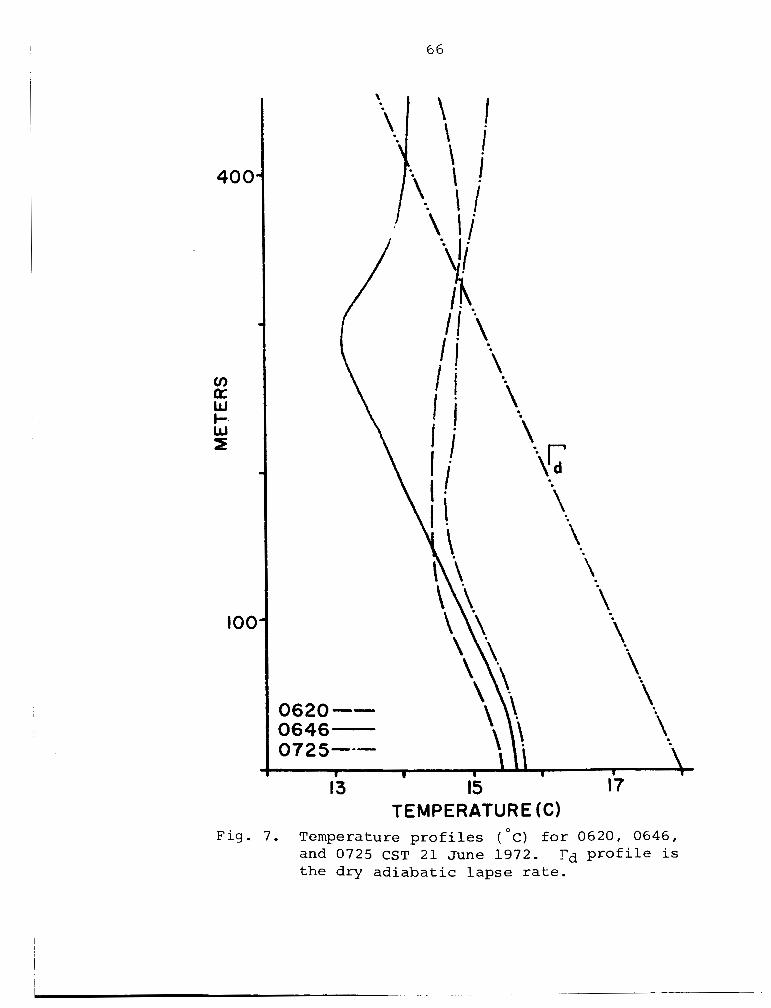
66
TEMPERATURE (C) F i g . 7. Temperature profiles ( ' C ) for 0620, 0646,
and 0725 CST 21 June 1972. rd profile i s the dry adiabatic lapse rate.
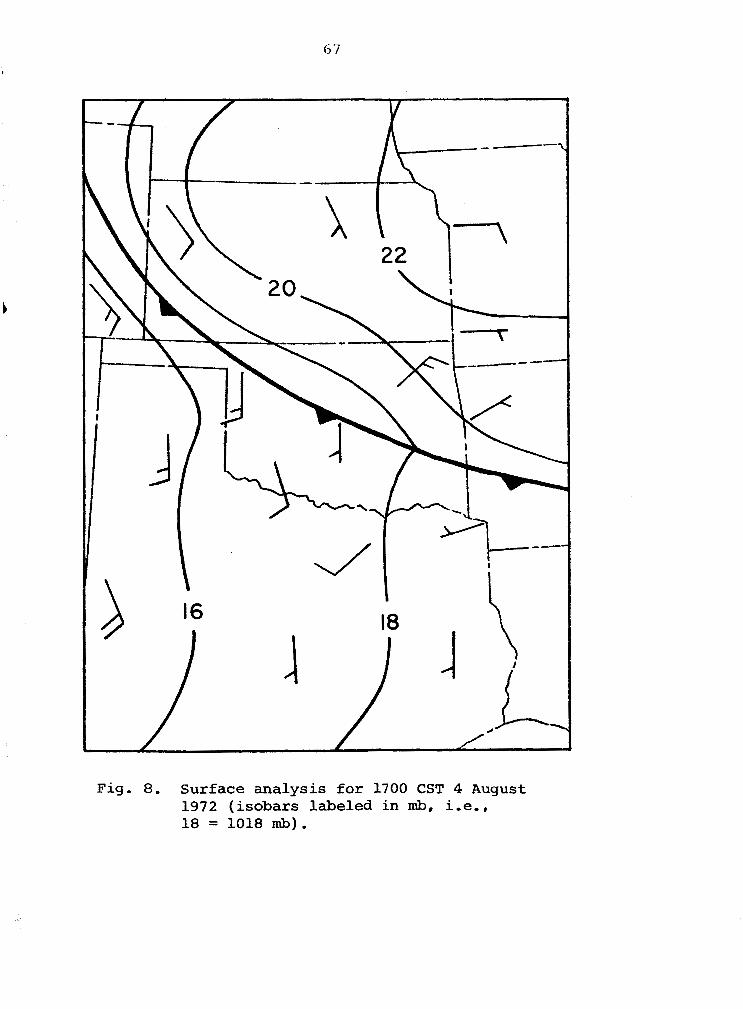
67
c
16
!---
18 I
Fig. 8 . Surface analysis for 1700 CST 4 August 1972 (isobars labeled i n m b 8 i.e.8
18 = 1018 mb) .
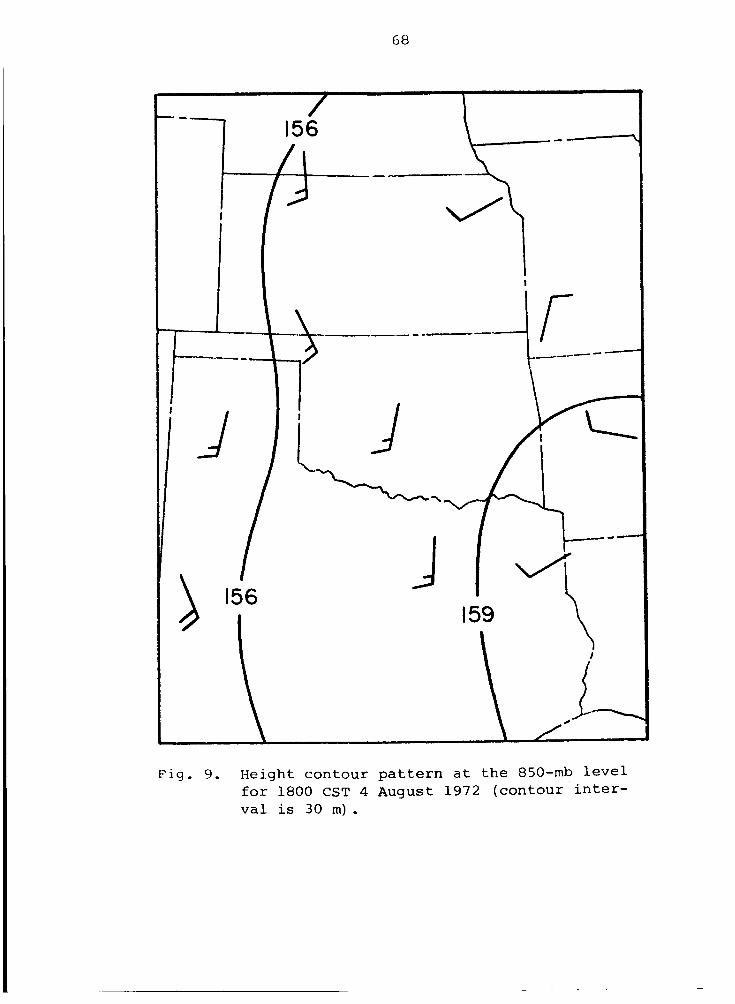
G 8
I 156
b 156 4
I59
F i g . 9. Height contour pattern at the 850-mb level f o r 1800 CST 4 August 1972 (contour inter- val is 30 m).
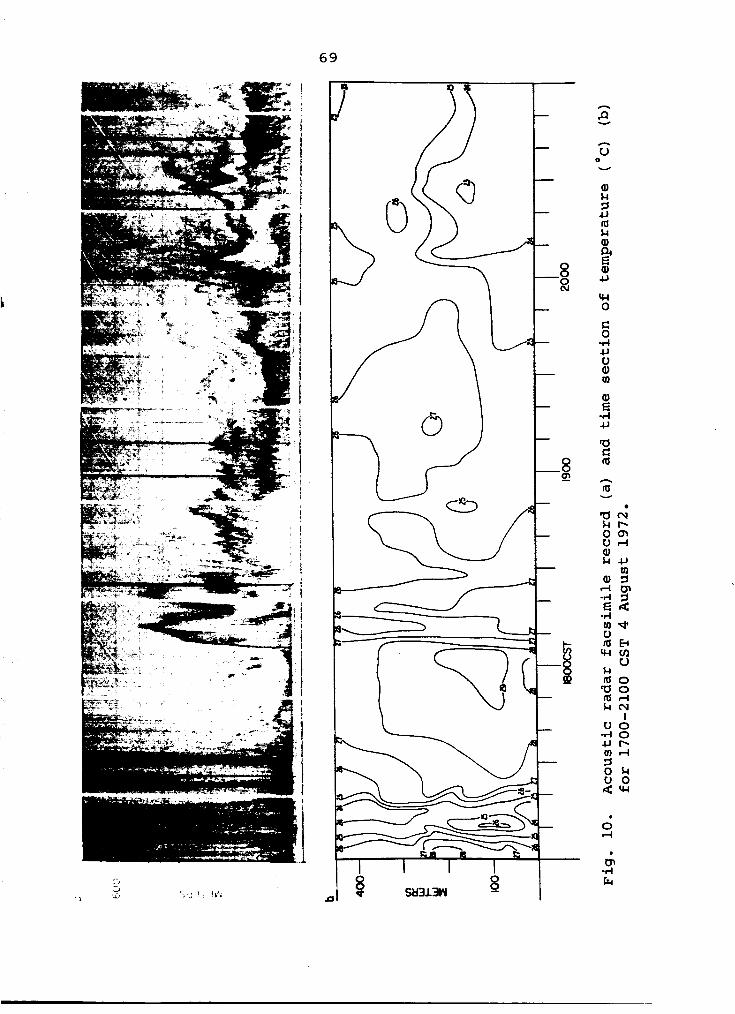
69
!
h
n Y
h
U Y
a, k I 4J m k a, a E a, 4J
w 0 c 0
-rl 4J CJ a, rn a, E
-rl 4J
a c m
m
acv kl- o m v r l a, kC,
rn a 7
E 4 .rl r n * U a t 3 w v l
U k m o a 0 m r l k c v
I 0 0 -4 0 4 J l -
O k 0 0 4 w
h
v
i s
Z d
. 0 rl
tn .rl E
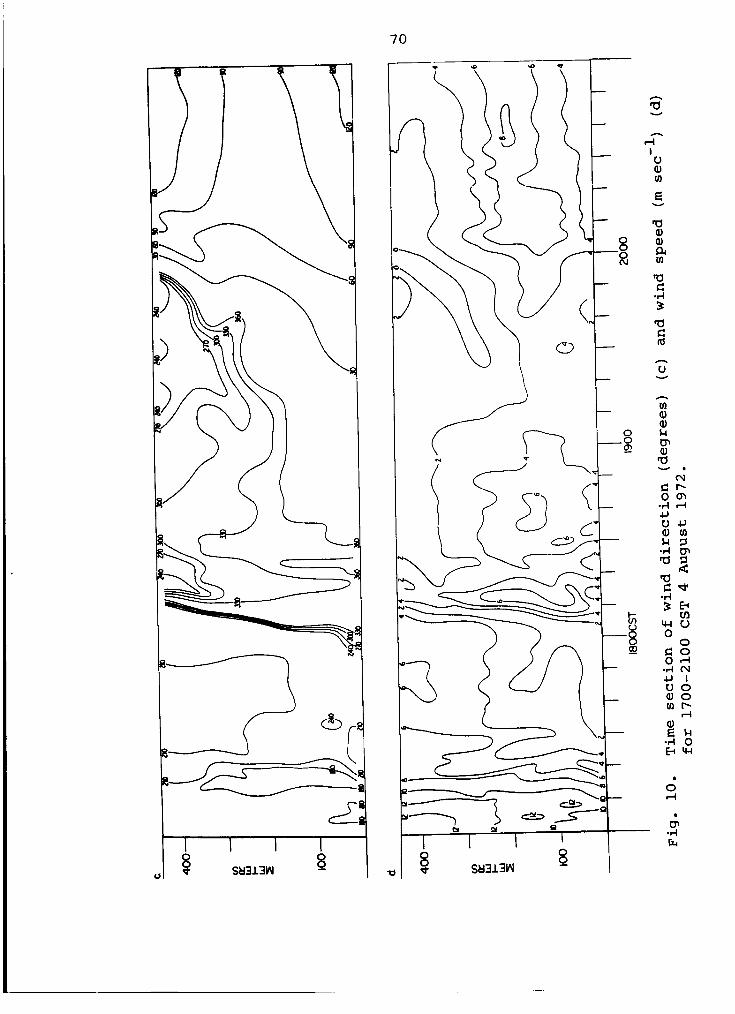
70
\ I-
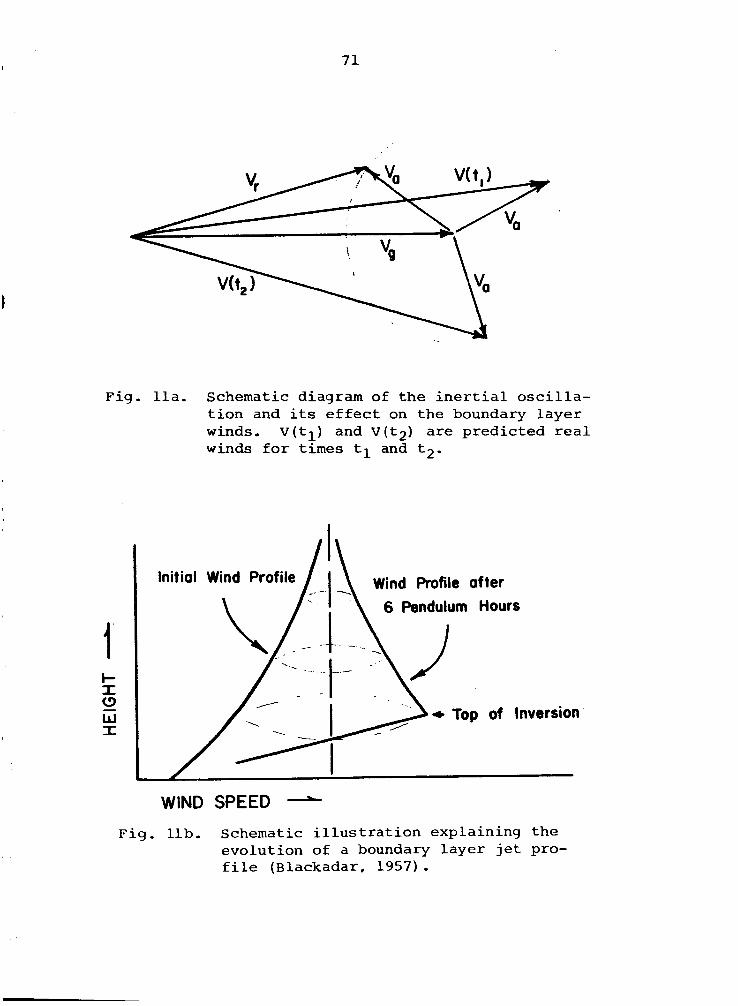
71
F i g . l l a . Schematic diagram of t h e i n e r t i a l o s c i l l a - t i o n and its e f f e c t on the boundary l aye r winds. v ( t l ) and V ( t 2 ) a r e pred ic ted r e a l winds for t i m e s tl and t2.
I- I a W I -
WIND SPEED -.-
A\ Initial Wind Profile Wind Profile after
6 Pendulum Hours
+ TOP of Inversion
Fig. l l b . Schematic i l l u s t r a t i o n explaining t h e evolut ion of a boundary layer j e t pro- f i l e (Blackadar, 1957).
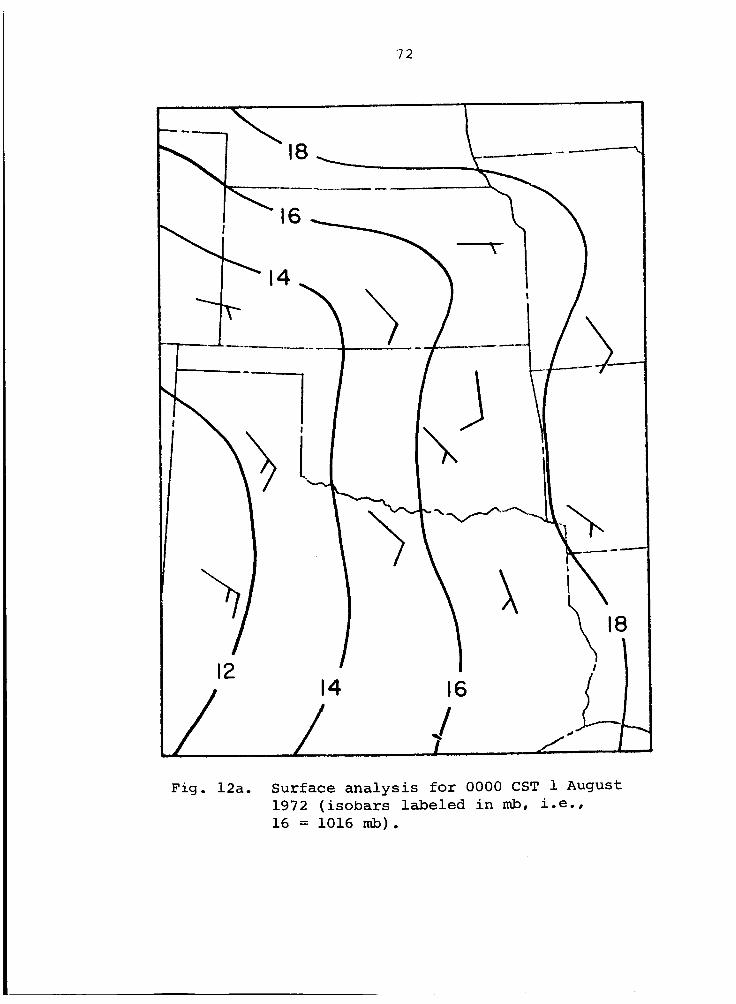
12
7 2
14 16
Fig. 12a. Surface analysis for 0000 CST 1August 1972 (isobars labeled in mb, i.e.8 16 = 1016 m b ) .
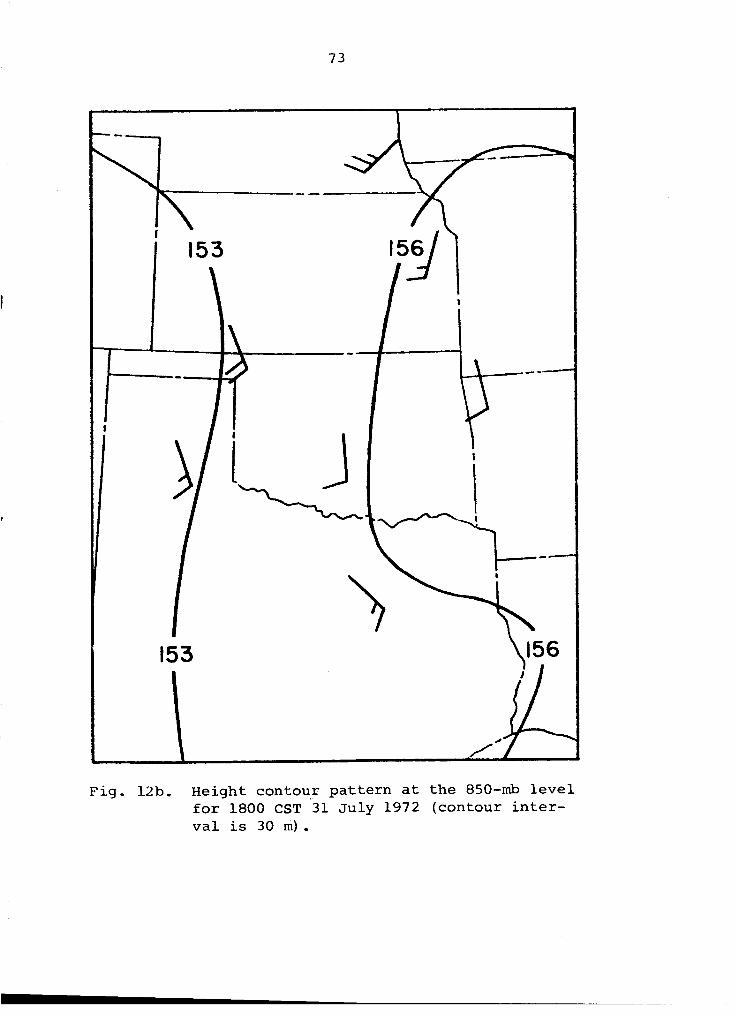
7 3
F i g . 12b. H e i g h t c o n t o u r p a t t e r n a t the 850-mb l e v e l for 1800 CST ‘31 July 1972 ( c o n t o u r i n t e r - v a l i s 30 rn).
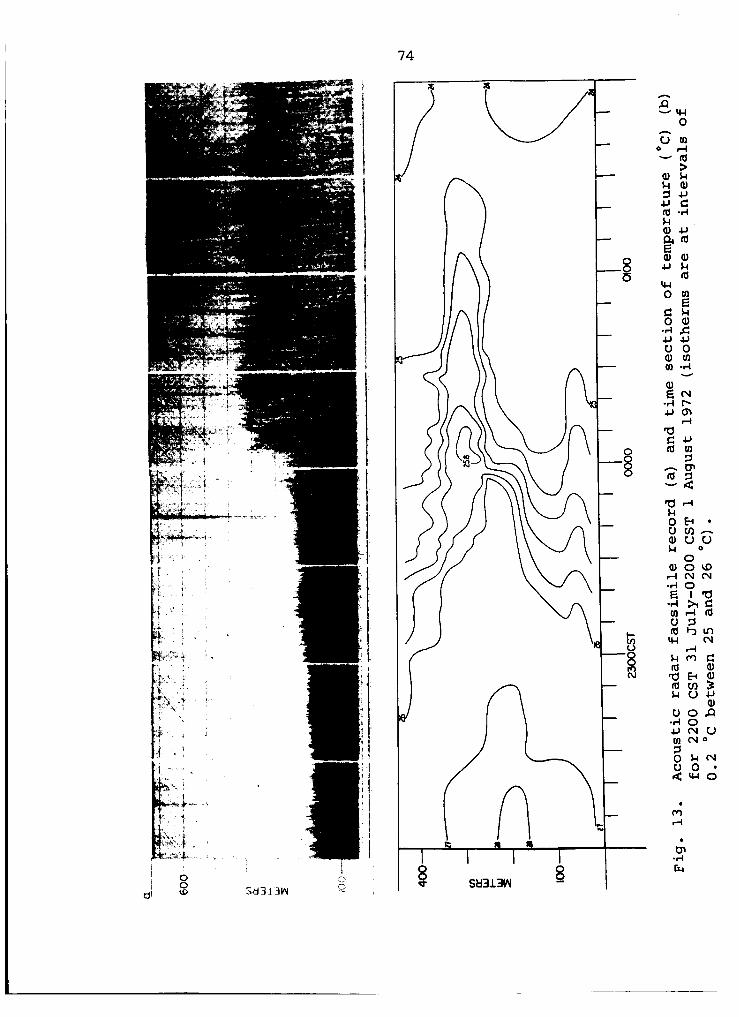
74
' .
k - O E ' o m -
Li al u y
I * m 4
m -4 1 - crc
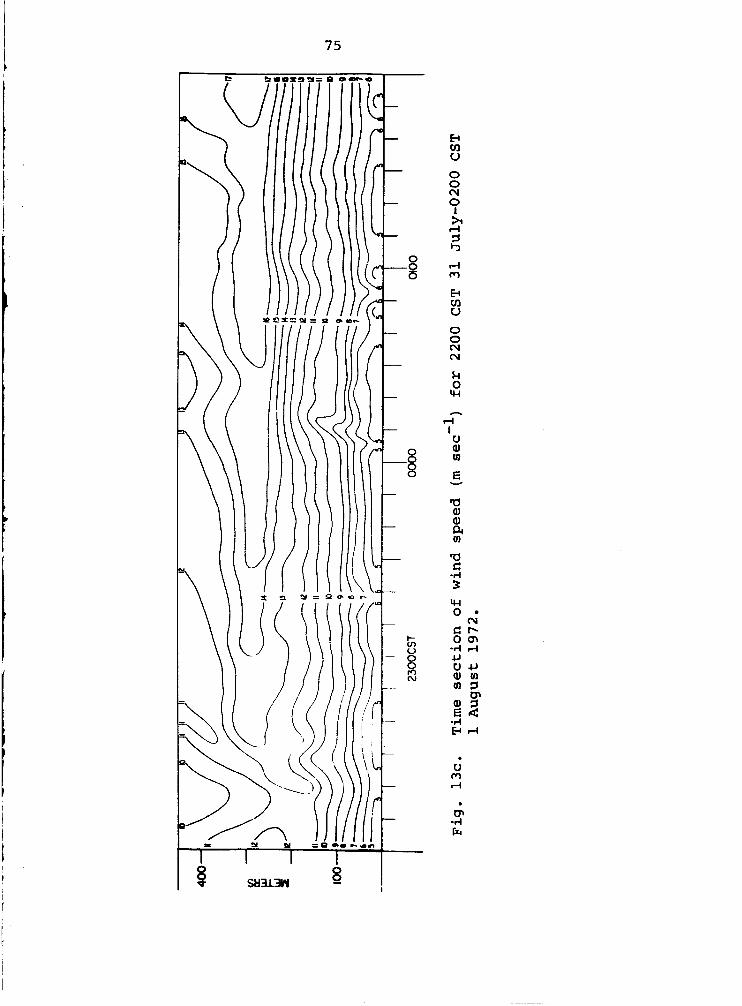
75
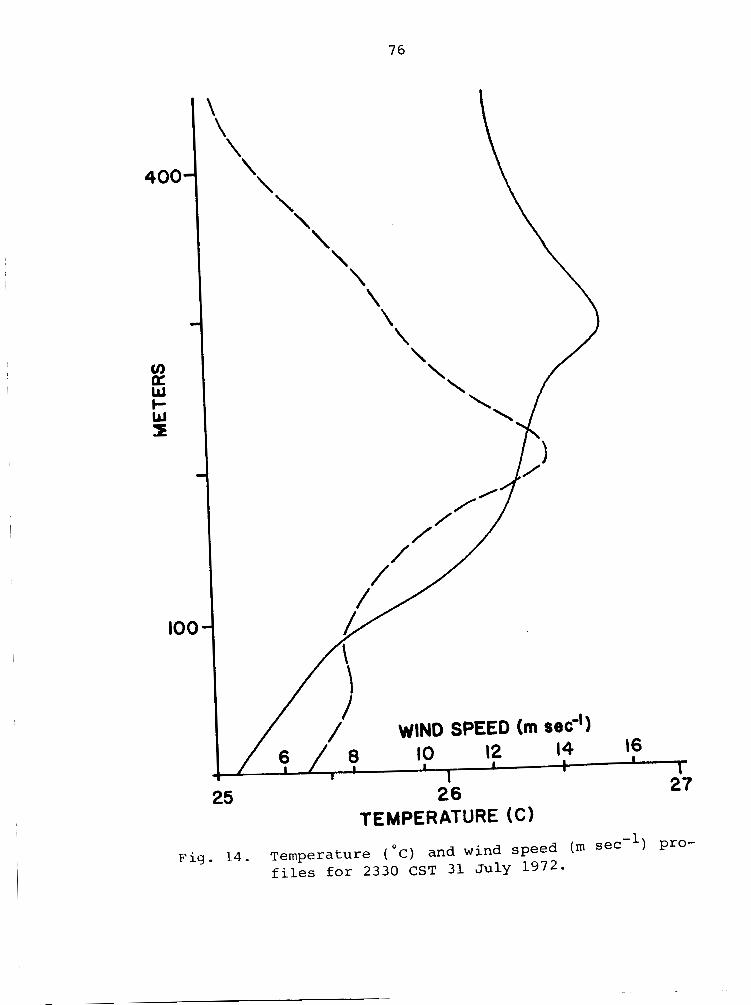
76
c
400-
6 / 0 IO 12 14 16 I L 1 1
u)
w c- w I
a
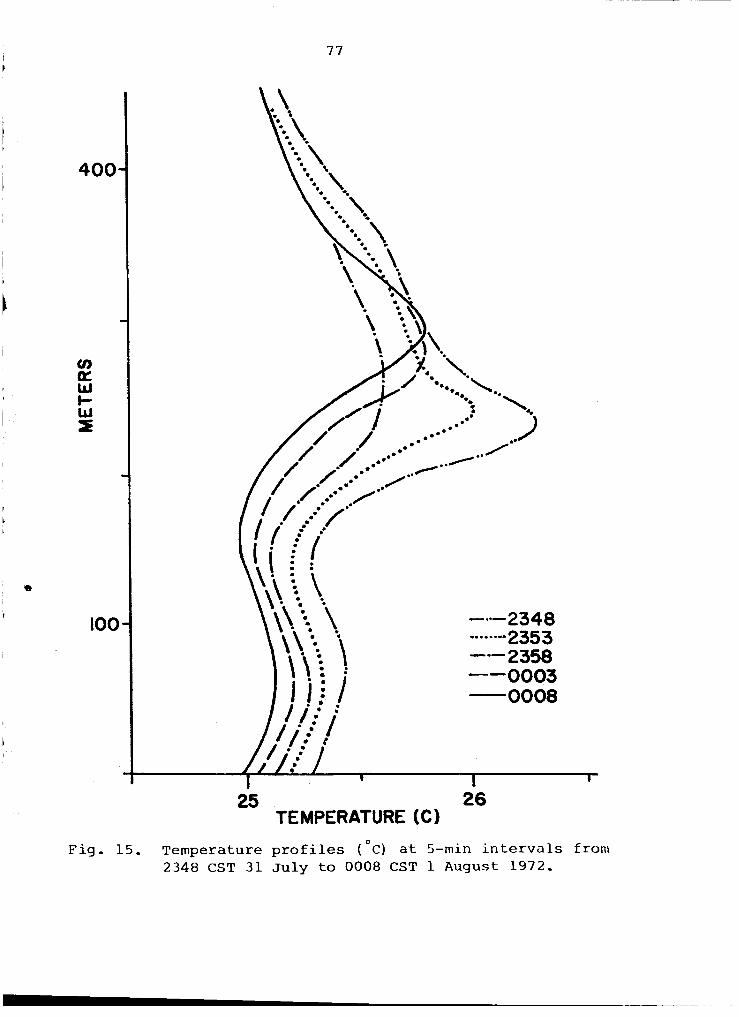
77
400.
I
u) a W t- W s
100 -a*- 23 48 ........ 2353 ---2358 --0003 -0008
25 26 TEMPERATURE (C)
Fig. 15. Temperature prof i les (OC) a t 5-min i n t e r v a l s from 2348 CST 3 1 July to 0008 CST 1 August 1972.
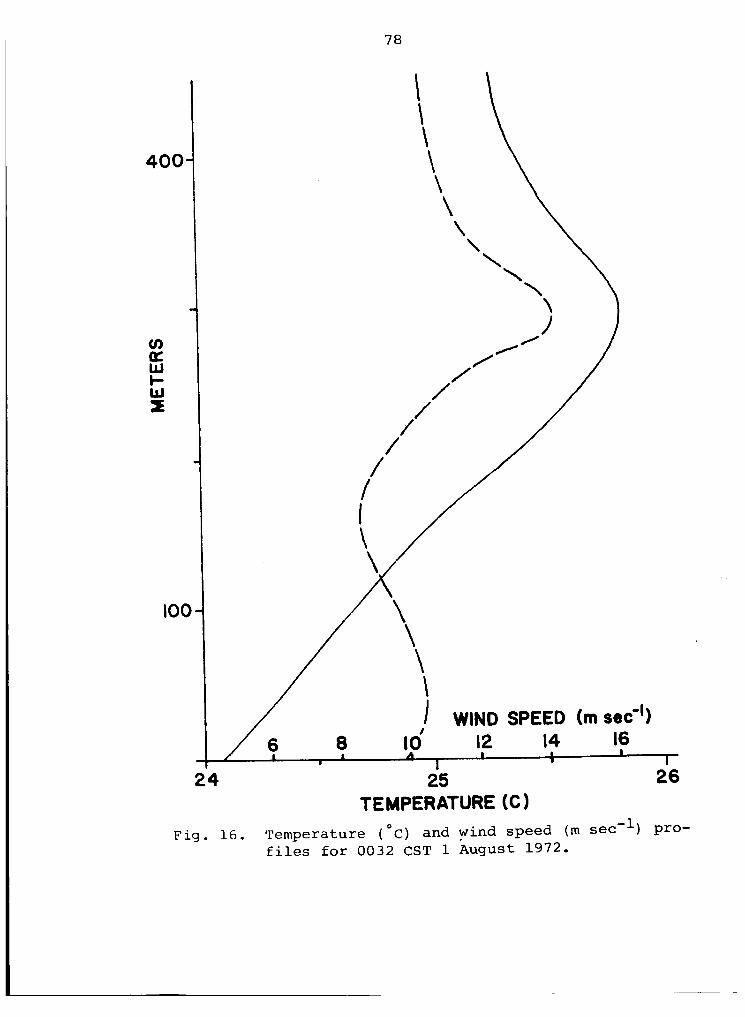
i 400
100
\
I WINO SPEED (msec-1) 6 8 !o’ 12 14 16
TEMPERATURE (C)
I I I 1 I
24 25 26
F i g . 16. Temperature ( O c ) and wind speed ( m sec’l) pro- f i l e s for 0032 CST 1 August 1972.
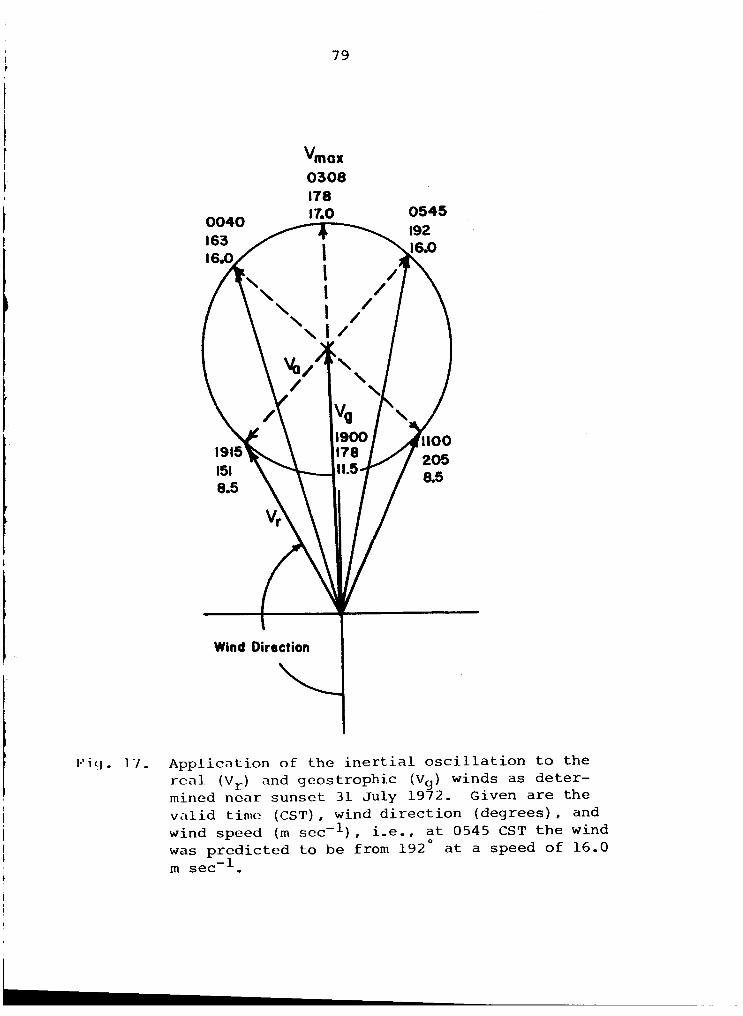
79
"man 0300 178
Applicat ion of t h e i n e r t i a l o s c i l l a t i o n t o t h e real (V,) and geostrophic (Vg) winds as de te r - mined n e a r sunse t 31 July 1972, Given a r e t h e v a l i d t i n i c (CST) wind d i r e c t i o n (degrees) and wind speed ( m sec-I) , i.e., a t 0545 CST t h e wind was p red ic t ed t o be from 192' a t a speed of 16.0 m sec-1.
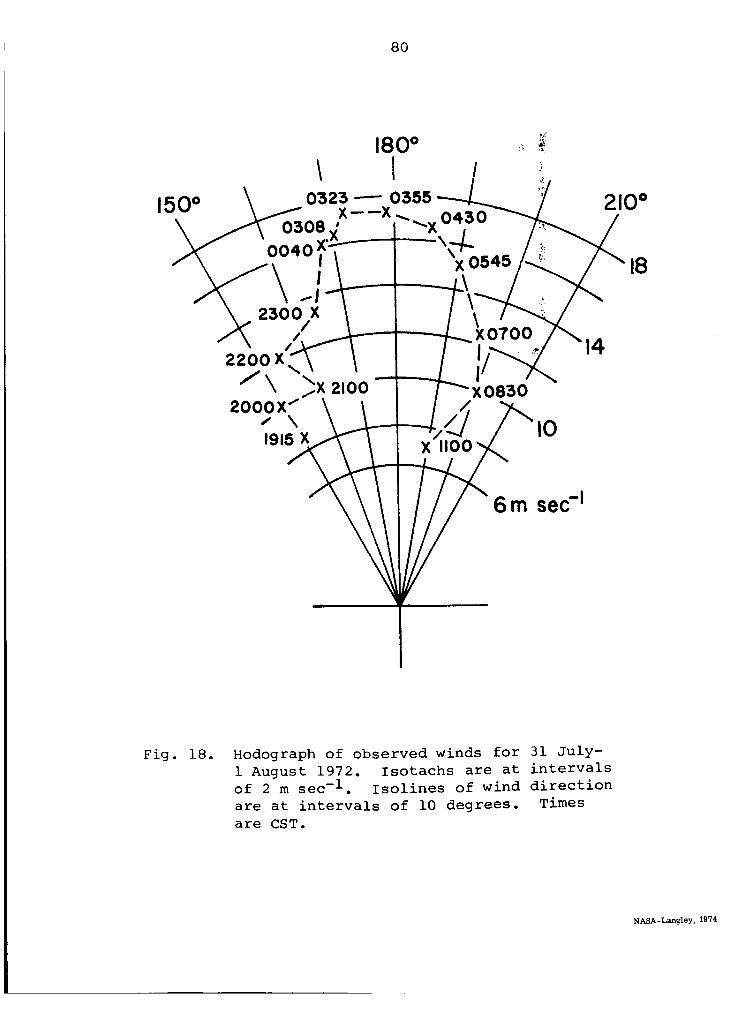
80
180' ._ 4
0323 - 0355
Fig. 18, Hodograph of observed winds for 31 July- 1 August 1972. of 2 m sec-l, are at intervals of 10 degrees. Times are CST.
Isotachs are at intervals Isolines of wind direction
NASA-Langley, 1974


![glbeylhj LH - c-o-k.ru · Mkljhckl\h j_]mebjh\Zgby DigiPro ... 1350 1000 1350 1000 1350 1000 1350 1000 1350 1000 H[ .\ha^ .V O [f 3 /q] 2100 1700 2000 1600 1800 1450 1700 1350 2100](https://static.fdocuments.net/doc/165x107/5b3dc0587f8b9a213f8e1028/glbeylhj-lh-c-o-kru-mkljhcklh-jmebjhzgby-digipro-1350-1000-1350-1000.jpg)