The Physico-Chemical Characterization of Soymilk Particles and ...
141
The Physico-Chemical Characterization of Soymilk Particles and Gelation Properties of Acid-Induced Soymilk Gels, as a Function of Soymilk Protein Concentration. by Elise Ringgenberg A thesis Presented to The University of Guelph In partial fulfillment of requirements for the degree of Master of Science in Food Science Guelph, Ontario, Canada © Elise Ringgenberg, October, 2011
Transcript of The Physico-Chemical Characterization of Soymilk Particles and ...
The Physico-Chemical Characterization of Soymilk Particles and
Gelation Properties of Acid-Induced Soymilk Gels, as a Function of
Soymilk Protein Concentration.
by
Elise Ringgenberg
A thesis
Presented to
The University of Guelph
In partial fulfillment of requirements
for the degree of
Master of Science
in
Food Science
Guelph, Ontario, Canada
© Elise Ringgenberg, October, 2011

ABSTRACT
THE PHYSICO-CHEMICAL CHARACTERIZATION OF SOYMILK
PARTICLES AND GELATION PROPERTIES OF ACID-INDUCED SOYMILK
GELS, AS A FUNCTION OF SOYMILK PROTEIN CONCENTRATION.
Elise Ringgenberg Advisor:
University of Guelph, 2011 Professor Milena Corredig
The physico-chemical characteristics of soymilk particles and the gelation
properties of soymilk were investigated as a function of soymilk protein concentration,
by preparing soymilk samples from different water-to-bean ratios. Particles from
different soymilk protein concentrations showed similar protein composition and surface
hydrophobicity, but different -potential, size and protein content. The particle
voluminosity was derived using a relation between the effective refractive index of
soymilk and the turbidity parameter determined experimentally. For the first time,
experimental data was compared to theoretical models, drawing general conclusions
about colloidal properties of soymilk particles. Protein concentration and the rate of
acidification did not have a significant effect on the acid-induced gelation of soymilk.
Results demonstrated that decreased charge is a prerequisite for particle aggregation,
which is driven by hydrogen bridging. This thesis provides soymilk processors with
general principles on the colloidal behaviour of soymilk, valuable information for new
product development and better process design.
i
Acknowledgements
I would like to thank my advisor Milena Corredig for all the support, help and
guidance she provided me throughout this project. She was very patient with me and
always there to help me overcome problems and provide suggestions. You always had
something positive to say about my soymilk data! I feel very lucky to have had you as an
advisor. I wish to also thank Marcela Alexander, who was an incredible help throughout
this process. She spent a lot of time on this project, helping with data analysis, and
explaining various fun physics and DWS concepts to me. Thank for being patient with
me and my data, without your tough love I would not have learned some very important
lessons! I also want to thank committee member Massimo Marcone, for providing
valuable input and suggestions throughout this project, and for taking the time to review
this thesis. Thank you to all my colleagues in Food Science, who helped make this a
unique experience! Val, I had fun being one of the blondes with you! I would like to
thank Amir, who first introduced me to the world of soymilk and how to make it. I owe
him a coffee or five, for all your trouble shooting help. Thank you Ibrahim for helping me
with the ultrasound machine, Eleana with fluorescence and rheology and Sandy Smith for
the help with microscopy. I will miss Edita and her contagious smile and colourful
clothes. I want to thank my family, Albrecht, Annelies, Nadine, Caleb and William, and
friends, who were there throughout my masters to support me. The funding for this
research was provided by the Soybean Growers of Ontario and NSERC. I would like to
thank them for this opportunity. I won’t ever be able to eat tofu without thinking... yup
that’s hydrogen bonding.

ii
Table of Contents
Acknowledgements ...............................................................................................................i
List of Tables ....................................................................................................................... v
List of Figures .....................................................................................................................vi
List of Abbreviations ..........................................................................................................ix
Chapter 1: ............................................................................................................................. 1
General Introduction ............................................................................................................ 1
Chapter 2: ............................................................................................................................. 6
Literature Review................................................................................................................. 6
2.1. Soybeans ...................................................................................................................... 6
2.2. Soymilk ........................................................................................................................ 8
2.2.1. Soymilk Characteristics ............................................................................................ 9
2.3. Interactions between colloidal particles ..................................................................... 12
2.4. Soy Proteins ............................................................................................................... 16
2.4.1. Glycinin................................................................................................................... 18
-conglycinin .......................................................................................................... 20
2.5. Soymilk Gelation ....................................................................................................... 24
2.5.1. Heat-induced Gelation ............................................................................................ 26
2.5.2. Acid and Salt-Induced Gelation .............................................................................. 27
2.5.3. Effect of Glycinin and -conglycinin on gelation .................................................. 31
2.6. Outlook ....................................................................................................................... 33

iii
Chapter 3: ........................................................................................................................... 34
Physico-chemical characterization of soymilk particles as a function of their volume
fraction: comparison with theoretical systems. .................................................................. 34
3.1. Abstract ...................................................................................................................... 34
3.2. Introduction ................................................................................................................ 34
3.3. Materials and Methods ............................................................................................... 37
3.3.1. Soymilk preparation ................................................................................................ 37
3.3.2. Determination of total solids and protein concentration ......................................... 39
3.3.3. Particle protein content and composition ................................................................ 39
3.3.4. Refractometry ......................................................................................................... 40
3.3.5. Gel Electrophoresis ................................................................................................. 41
3.3.6. Fluorescence measurements.................................................................................... 42
3.3.7. Light Scattering measurements ............................................................................... 43
3.3.8. Electro-acoustic spectroscopy ................................................................................. 45
3.3.9. Flow behaviour measurements ............................................................................... 46
3.3.10. Microscopy ........................................................................................................... 46
3.3.11 Statistical analysis .................................................................................................. 48
3.4. Results ........................................................................................................................ 48
3.4.1. Characterization of the soymilk particles prepared from 4 and 7% protein soymilk
........................................................................................................................................... 48
3.4.2. Effect of serial dilution on 4, 5, 7% protein soymilk .............................................. 62
iv
3.4.3. Comparison of experimental data with theoretical models ..................................... 70
3.5. Conclusions ................................................................................................................ 81
Chapter 4: ........................................................................................................................... 83
Effect of concentration and temperature on the acid induced aggregation of soymilk ..... 83
4.1. Abstract ...................................................................................................................... 83
4.2. Introduction ................................................................................................................ 84
4.3. Materials and Methods ............................................................................................... 88
4.3.1. Soymilk preparation ................................................................................................ 88
4.3.2. Acidification ........................................................................................................... 89
4.3.3. Gel Electrophoresis ................................................................................................. 90
4.3.4. Light Scattering measurements ............................................................................... 91
4.3.5. Rheological measurements ..................................................................................... 93
4.3.6. Statistical analysis ................................................................................................... 93
4.4. Results and Discussion .............................................................................................. 94
4.4.1. Physicochemical changes of soymilk particles preceding gelation ........................ 94
4.4.2. Aggregation behaviour of soymilk ......................................................................... 99
Chapter 5. ......................................................................................................................... 109
General Conclusions ........................................................................................................ 109
6. References .................................................................................................................... 112

v
List of Tables
Table 3.1. Ion composition of the ultrafiltered serums obtained from 4% protein soymilk
prepared from a water-to-soybean protein ratio of 22:1 and 7% protein soymilk prepared
from a water-to-soybean protein ratio of 12:1 ………..……...…………………………50
Table 3.2. Experimental values of the fluorescence spectrum and surface hydrophobicity
using ANS as a probe, of diluted 4% and 7% soymilk samples in phosphate buffer (pH
7). ....................................................................................................................................... 54
Table 3.3. Size and -potential measurements of 4 and 7% protein soymilk particles
measured by DLS and DWS. ............................................................................................. 56
Table 4.1. Gelation parameters measured during acidification of soymilk for two
different concentrations of GDL and for 4 and 7% protein soymilk. .............................. 101
Table 4.2. Gelation parameters measured during acidification of soymilk with 0.8% GDL
at 30oC and 7
oC ................................................................................................................ 105

vi
List of Figures
Figure 2.1. Crystal structures of the glycinin A3B4 homohexamer (from Utsumi et al.,
1997). ................................................................................................................................. 21
Figure 2.2. Crystal structure of β-conglycinin β homotrimer (from (Utsumi et al., 1997).23
Figure 2.3. Gelation mechanism of soybean proteins in the presence of GDL or CaSO4:
(circles) protein molecules; (black areas) hydrophobic regions, as postulated by
(Kohyama et al., 1995a). .................................................................................................... 30
Figure 3.1. SDS-PAGE under reducing conditions of soymilk samples and their
corresponding supernatant after 20,000 g (see methods) (1) 4% soymilk, (2) 4%
supernatant, (3) 7% soymilk, (4) 7% supernatant. ............................................................. 52
Figure 3.2. Fluorescence spectrum derived from particles of 4% (filled circles) and 7%
(open squares) protein soymilk samples highly diluted in phosphate buffer (pH 7). ........ 53
Figure 3.3. Scanning electron microscopy images of 4% protein soymilk (A, B) and 7%
protein soymilk (C, D). ...................................................................................................... 59
Figure 3.4. Cryogenic transmission electron microscopy images of 4% protein
soymilk…………………………………………………………………………………...61
Figure. 3.5. Total solids content as a function of protein content of 4% protein soymilk
(filled circles), 5% protein soymilk (open triangles) and 7% protein soymilk (filled
squares) diluted in their respective serum prepared by ultrafiltration. .............................. 63
Figure 3.6. Refractive index of 4% protein soymilk (filled circles), 5% protein soymilk
(open triangles) and 7% protein soymilk (filled squares) diluted in their stock-derived
serum. ................................................................................................................................. 64

vii
Figure 3.7. DWS results of (A) photon transport mean free path, 1/l*, and (B) diffusion
coefficient of 4% protein soymilk (filled circles), 5% protein soymilk (open triangles)
and 7% protein soymilk (filled squares) diluted in their stock-derived serum. ................. 66
Figure 3.8. Viscosity of soymilk samples measured at 100 s-1
for 4% protein soymilk
(filled circles), 5% protein soymilk (open triangles) and 7% protein soymilk (filled
squares) diluted in water. ................................................................................................... 69
Figure 3.9. DWS results of (A) photon transport mean free path, 1/l*, and (B) diffusion
coefficient of 4% protein soymilk (filled circles), 5% protein soymilk (open triangles)
plotted as a function of volume fraction. ........................................................................... 73
Figure 3.10. Viscosity measured at 100 s-1
of 4 (filled circles), 5 (open triangles) and 7%
(filled squares) protein soymilk samples and plotted as a function of volume fraction.. .. 76
Figure 3.11. Normalized dynamic electrophoretic mobility of soymilk particles measured
by electro-acoustic spectroscopy for 4% protein soymilk (open circles), 5% protein
soymilk (open triangles) and 7% protein soymilk (open squares) diluted in their stock-
derived serum. .................................................................................................................... 79
Figure 4.1. -potential (A) and apparent diameter (B) measured by dynamic light
scattering of soymilk samples acidified with GDL............................................................ 95
Figure 4.2. Densitometric analysis (as area % of total bands area) for polypeptides
present in the soluble fraction, analyzed by SDS-PAGE analysis, of 4% (A) and 7% (B)
protein soymilk samples. ................................................................................................... 97
Figure 4.3. Gelation behaviour of soymilk containing 0.8% (open symbols) or 1.6%
(filled symbols) GDL. A) Storage modulus (G’) obtained from rheology data; B)
apparent radius of particles and C) turbidity (1/l*) parameter obtained from diffusing

viii
wave spectroscopy measurements of 4% protein soymilk (circles) and 7% protein
soymilk (triangles). .......................................................................................................... 100
Figure 4.4. Gelation behaviour of soymilk containing 4% protein and 0.8% GDL,
incubated at 30oC (open circles) and at 7
oC (filled circles). A) Storage modulus (G’)
obtained from rheology data; B) apparent radius and C) the turbidity (1/l*) parameter
obtained from diffusing wave spectroscopy. ................................................................... 104

ix
List of Abbreviations
Glucono--lactone…………………………………………………………………….GDL
PAGE- Sodium Dodecyl Sulfate-Polyacrylamide Gel Electrophoresis……………….SDS
1-anilino-8-naphthalene sulfonate………………………………………………...…. ANS
Apparent dissociation constant …………………..…….…………………….……… Kdapp
Overall binding capacity ……………………………………………………….…… Fmax
Protein surface hydrophobicity ……………………….………………………..…….. PSH
Colloidal Vibration Current…………………………………………………………....CVI
SEM-Scanning Electron Microscopy…………………………………………………SEM
Cryogenic Transmission Electron Microscopy……………………………..…..Cryo-TEM
Dynamic Light Scattering …………………………………………………………….DLS
Diffusing Wave Spectroscopy………………………………………………………..DWS
Turbidity parameter …………………………………..……….……..….……….l*
Form factor ……………………………….……………………………..…… F(q)
Structure factor ……………………………………………………......……... S(q)
Volume fraction…………………………………………………………………………...
Refractive index……………………………………………………………….…………..n
Voluminosity………………………………………………………………….…………..V
Intrinsic viscosity………………………………………………………………………….
Elastic modulus…………………………………………………………………………..G’
1
Chapter 1:
General Introduction
Soybeans are known to have beneficial health effects, and consumption in the
western world has been rising for the past few decades. The consumption of soy foods
has been linked to the prevention and treatment of chronic diseases, potentially lowering
cancer mortality rates, and reducing the risk of heart disease due to the cholesterol
lowering effect of soy proteins (Sirtori et al., 1993; Messina et al., 1994; Kennedy, 1995).
Currently the main types of soy products relatively high in soy protein and which utilize
the majority of the bean are soymilk and tofu (Liu, 1997). Although these products have
been manufactured for centuries in East and South Eastern Asia, the physicochemical
nature of soymilk particles, their colloidal behaviour and their interactions in soymilk are
not well understood. The use of soymilk as a base ingredient in other foods has great
potential, due the high nutritional value of soymilk and its relatively simple production
process. However, a better understanding at the molecular scale is needed to engineer
novel products using soymilk and to predict their processing behaviour.
The production of soymilk consists of grinding soaked beans with water,
removing some of the insoluble fiber, heat treating the slurry, and homogenizing the mix,
not necessarily in this exact order. The final composition of soymilk is around 8-10%
total solid, including 3.6% protein, 2% fat, 2.9% carbohydrates, and 0.5% ash, and it
depends on processing conditions and soybean variety used (Liu, 1997). Heat treatment
of soymilk is necessary for several reasons: to achieve microbial safety, enhance shelf-
life and colloidal stability, enhance flavor and nutritional value by denaturing trypsin
2
inhibitors, haemagglutinins, saponins and other antinutritional compounds (Rackis, 1974;
Kwok and Niranjan, 1995; Iwuoha and Umunnakwe, 1997; Kwok et al., 2002).
Research on soymilk and soymilk particles has received little attention, while the
majority of the results reported to date relate to isolated soy protein systems, which differ
considerably from soymilk. Past research has shown that heat treatment of soymilk
increases the fraction of medium sized particles (40-100 nm) at the expenses of large
ones, thereby reducing the average particle size (Ono et al., 1991). Homogenization
further decreases particle size and produces a narrow size distribution (Malaki Nik et al.,
2008). It has been established that during the making of soymilk, the heat-induced
denaturation of soy proteins causes the rearrangement and association of protein subunits
to form soluble aggregates. The aggregates form predominantly via non covalent
interactions, although some disulphide interchange also occurs (Kwok and Niranjan,
1995; Lakshmanan et al., 2006; Malaki Nik et al., 2008; Ren et al., 2009). The
macroscopic and microscopic properties of soymilk particles depend on the structure, size
and interactions of the protein aggregates with the suspension material and other protein
assemblies present. Hence, a good understanding of the fundamental properties of
soymilk particles is imperative to predicting the colloidal behaviour of soymilk. In the
study of the behaviour of concentrated colloids such as soymilk, comparison with
theoretical models on ideal colloidal systems can be a useful tool. However, these models
require a good knowledge of the physicochemical characteristics of the colloidal
particles, so that comparisons and accurate predictions can be made. Very little
information is yet available for soymilk particles.

3
Tofu is very popular food in East and South Eastern Asian countries, and is an
important dietary source of protein and lipid. It is essentially the curd of soymilk, made
by addition of coagulant to heat treated soymilk, causing the soy proteins in soymilk to
aggregate and form a network, trapping water, lipids, carbohydrates and other
components found in soymilk (Poysa and Woodrow, 2002). The main types of coagulant
used to produce tofu are salts and acids (Guo et al., 2002; Poysa and Woodrow, 2002).
The molecular interactions involved in the aggregation and coagulation of
proteins in soymilk are not well understood. Indeed, most of the knowledge on the
mechanisms involved in gelation of soy protein has been derived from information on
soy protein isolates. A more complete knowledge of the physicochemical characteristics
of soymilk particles would also aid in elucidating the gelation mechanism of soymilk.
Determining the effect of soymilk concentration on its gelation properties could lead to
the use of concentrated soymilk as a base ingredient. Furthermore, a better understanding
of the gelation mechanism of soymilk at different concentrations, would allow for the
development of novel food products taking advantage of the gelation properties of
soymilk.
A better understanding of the physicochemical characteristics of soymilk particles
could lead to the development of novel products using soymilk as a source of protein, as
opposed to soy protein isolate. This could allow for more efficient conversion of
soybeans to consumable food products, in terms of the extent of processing needed while
maximizing the use of the whole bean. This could potentially increase local use and
processing of soybeans, as soymilk processing does not require large infrastructure
investments compared to a defatting and soy protein isolate facility. Understanding of the

4
effect of the water-to-bean ratio used to prepare soymilk on the physicochemical
properties and colloidal behaviour of soymilk particles could potentially lead to the
utilization of concentrated soymilk dispersions. This research will focus on elucidating
the physicochemical characteristics of soymilk particles using a multi-technique
approach, and by preparing soymilk from different water-to-protein ratios. The behaviour
of soymilk particles as a function of volume fraction will be evaluated and compared to
theoretical models. The volume fraction will be derived from experimental data. The
gelation mechanism of soymilk particles will also be investigated, to better understand
the molecular mechanisms involved in aggregation. The overall objectives of this
research can be summarized as follows:
to obtain a better understanding of the physicochemical characteristics of soymilk
particles;
to derive general principles of colloidal behaviour of soymilk particles, by
comparing experimental data with theoretical models of colloidal systems;
to investigate the molecular details of the acid-induced gelation of soymilk;
to determine the effect of concentration and incubation temperature on the
gelation properties of soymilk.
To achieve the outlined objectives, the first part of the research tested the hypothesis that
the physico-chemical properties of soymilk are affected by the soymilk protein
concentration, and the behaviour of soymilk can be approximated to that of colloidal
hard spheres. In the second part of the research, the gelation mechanisms were
investigated, by testing the hypothesis that the gelation properties of soymilk are a

5
function of protein concentration, and hydrophobic forces are the main forces leading to
aggregation.

6
Chapter 2:
Literature Review
2.1. Soybeans
Soybean is one of the oldest crops of the Far East and has long been consumed by
a significant portion of the world population as one of their most important sources of
dietary protein and oil. Soybeans produce the highest amount of protein per unit area and
hence are a very important source of non-animal protein. In general, soybean contains 35-
40% protein, 15-20% oil and from 20-25% carbohydrates depending on the variety
(Messina, 1995). Soybean production in the West began early in the twentieth century.
Since then soybeans have been utilized in numerous ways, from animal feed to value-
added food protein ingredients, to industrial paints and an array of other industrial uses.
Parts of the soybean are used differently, for instance soybean oil is predominantly used
for human food such as shortening and margarine, while a smaller portion of the total
protein is used for human consumption (Kwok and Niranjan, 1995), as soybean meal is
mainly employed as livestock feed. Amongst the most widespread soy foods are whole
bean products such as soymilk or tofu (Liu, 1997). Soy foods have grown in popularity in
the western world due to the increased demand for alternative, vegetable based, sources
of proteins, and the increased evidence of health benefits associated to their consumption.
Soy foods contain a number of beneficial components, such as proteins, peptides and
isoflavones (Messina et al., 1994).
The conversion of the protein present in the soybean to soy protein isolates is
highly inefficient and expensive, and thus more direct utilization of soybeans in forms
such as soymilk or tofu, provide more efficient means of incorporating soy protein in the

7
human diet (Liu, 1997). It is important to point out that soybean protein is a high quality
protein (meaning fully digestible, with an amino acid composition closely matching the
amino acid pattern required for human consumption) but somewhat low in sulfur
containing amino acids, with methionine being the limiting amino acid (Young, 1991).
Consumption of soy has been linked to the prevention and treatment of chronic
diseases. Much evidence exists to suggest that diets containing considerable soybean
products are associated with overall lower cancer mortality rates, particularly for colon,
breast and prostate cancer (Kennedy, 1995). Soy protein has been shown to be a factor in
reducing the risk of heart disease due to their cholesterol lowering effect (Sirtori et al.,
1993). A number of different compounds found in soybeans are thought to have anti-
carcinogenic activity, for instance soy isoflavones (Messina and Messina, 1991; Messina,
1995; Setchell, 2001; Munro et al., 2003). However, raw soybeans also contain some
anti-nutritional factors, including phytic acid, which binds and prevents absorption of
some minerals, and growth inhibitory substances, such as soybean trypsin inhibitors,
haemagglutinins, saponins and antivitamins. Trypsin inhibitors in raw soybean, soy meal,
or soy flour, when fed to animals, have been reported to interfere with the digestion and
absorption of proteins and cause pancreatic enlargement (Rackis, 1974). Heating,
especially in combination with moisture, has been shown to be an effective treatment to
reduce the levels of trypsin inhibitors (Anderson, 1992; Liu, 1997).

8
2.2. Soymilk
Soymilk is essentially a water extract of soybeans, and contains all of the
components of the bean, except for some insoluble fiber removed during processing
(called okara). Soymilk composition varies depending on processing conditions and bean
variety (Kwok and Niranjan, 1995; Mullin et al., 2001; Akintunde and Akintunde, 2002;
Lakshmanan et al., 2006) and in general contains about 8-10% total solids, 3.6% protein,
2.0% fat, 2.9% carbohydrates and 0.5% ash (Liu, 1997). Due to its many components, the
physicochemical characteristics of soymilk are a result of complex interactions occurring
between the various colloidal molecules and particles. Some research has been conducted
on the bulk properties of soymilk, as well as the requirements to produce a safe, stable
and nutritious food product; however, very little is understood about the molecular and
macromolecular changes occurring during its manufacture and processing.
Heat treatment of soymilk during and after extraction is necessary to achieve the
highest possible quality of soymilk. Adequate heat treatment was shown to increase the
colloidal stability of soymilk, maximize yield in terms of total solids and protein recovery
(Shimoyamada et al., 2008), improve nutritional value by inactivation of anti-nutritional
factors such as trypsin inhibitors and spoilage enzymes such as lipoxygenases, increase
protein digestibility, increase shelf-life by destruction of spoilage microorganisms, and
improve sensory qualities by minimizing off-flavours and improving colour (Kwok and
Niranjan, 1995; Kwok et al., 2002; Iwuoha and Munnakwe, 1997). Adequate heat
treatment is a balance between inactivation of anti-nutritional factors and satisfactory
retention of nutrients. Excessive heat treatment, indeed, can cause adverse effects in

9
terms of sensory attributes such as development of browning and cooked flavour, and
destruction of essential amino acids and vitamins (Kwok et al., 2002).
2.2.1. Soymilk Characteristics
The colloidal properties of soymilk particles need to be followed during
processing, to determine possible changes in quality and stability of the soymilk. Particle
size distribution is a useful parameter to follow such changes. Ono and others (1991)
showed that the distribution of particles in raw soymilk consists of 40% large particles
(>120 nm in diameter), 20% medium particles (40-120 nm) with the remainder being
small soluble particles (<40 nm). The same study showed that heat treatment decreases
the fraction of large particles by disrupting aggregates and increasing the fraction of
medium size particles, thereby decreasing the average particle size to around 40-100 nm.
Particle size distribution of defatted soymilk was reported to range between 40-200 nm in
diameter, with only few particles above 200 nm (Ren et al., 2009). High pressure
treatment following extraction of beans at 80oC was shown to also reduce particle size; in
this case, ultra high temperature treatment did not further reduce average size (Cruz et al.,
2007). Homogenization after heating results in a narrow size distribution with a decrease
in the average particle diameter, from about 200 nm to about 130 nm (Malaki Nik et al.,
2008).
Soy proteins contain two main fractions, glycinin and -conglycinin, accounting
for 40% and 30% of total protein, respectively. Their structure and physicochemical
characteristics are discussed in detail in the next section. Previous research showed that
large particles in unheated soymilk are composed mostly of glycinin protein, which
precipitate upon centrifugation, and that the ratio of -conglycinin/glycinin in the

10
supernatant increases with subsequent centrifugation steps (Ono et al., 1991; Malaki Nik
et al., 2008). Glycinin subunits precipitation decreases when heating and/or
homogenization are applied to soymilk (Malaki Nik et al., 2008). It has been established
that during the making of soymilk, the heat-induced denaturation of soy proteins causes
them to rearrange and form aggregates. The aggregates contain varying ratios of all
subunits present in glycinin and -conglycinin (Ono et al., 1991; Malaki Nik et al., 2008;
Ren et al., 2009).
Heat treatment of soymilk causes protein denaturation, which exposes reactive
amino acid side groups (nonpolar and sulfhydryl groups) normally buried in the
hydrophobic core of the proteins (Doi, 1993). This was reported to occur in soy protein
isolate suspensions, where an increase in the surface hydrophobicity was observed after
heat denaturation (Takagi et al., 1979; Nakai, 1983; Sorgentini et al., 1995;
Shimoyamada et al., 2008). Surface hydrophobicity plays a crucial role in soy protein
solubility and the tendency for soy proteins to aggregate. Generally, as surface
hydrophobicity decreases, so does the solubility of soy proteins (Wagner et al., 2000).
This is due to the unfolding of protein, exposing the hydrophobic core, which increases
surface hydrophobicity. However, partially denatured or totally denatured soy protein
also show higher solubility, and hence surface hydrophobicity (Wagner et al., 2000)
Once denatured, the protein subunits rearrange and associate to form soluble
aggregates, predominantly via non covalent interactions such as hydrophobic interactions
and hydrogen bonding, although some disulphide interchange also occurs (Ono et al.,
1991; Lakshmanan et al., 2006; Malaki Nik et al., 2008; Ren et al., 2009). The subunit
of -conglycinin was said to interact with the basic subunit of glycinin predominantly

11
through electrostatic interactions (Utsumi et al., 1984), while the acidic polypeptide of
glycinin and the and ’ subunits of -conglycinin tend to interact to form soluble
aggregates (Ono et al., 1991; Guo et al., 1997; Ren et al., 2009).
Generally soymilk contains about 2% fat, mainly in the form of triglycerides, with
a fatty acid composition of poly-and mono-unsaturated hydrocarbon chains (Liu, 1997).
Its presence and concentration plays an important role in the texture and sensory quality
of soy products such as soymilk and tofu (Liu, 1997). Lipid-protein interaction in
soymilk has been investigated by several authors (Ono et al., 1996; Guo et al., 1997;
Taha and Mohamed, 2004; Toda et al., 2008). In raw soymilk, about 60% of total lipids
are found in the protein particles, while only a small portion (about 3% of the total)
remains following heat treatment (Ono et al., 1996). Once released from raw protein
particles, lipids form droplets in soymilk of 200-400 nm in diameter (Ono, 2000), and are
emulsified by small proteins such as oleosins, and some glycinin and -conglycinin, as
well as some triglycerides (Guo et al., 2002; Toda et al., 2008).
The majority of neutral lipids moves from the particles to the floating (or
creaming) fraction, while about half of the phospholipids remains in the particles. It has
been suggested that phospholipids are able to bind to proteins in the raw soymilk protein
particles, while the neutral lipid are released during heating of soymilk (Ono et al., 1996).
The migration of lipids during heat treatment was suggested to occur in three stages: 1) at
65-75oC, some of the lipids are released from the raw lipid-protein particles into the
soluble (supernatant) fraction, as the complexes undergo disruption, 2) at 75oC, the lipids
begin to migrate from the soluble phase to the floating (creaming) fraction and finally 3)
above 90oC, almost all the lipids migrate to the floating fraction (Ono et al., 1996).

12
However, some lipids are visible in complexes with protein aggregates in the supernatant
after centrifugation of soymilk at 40,000 g (Malaki Nik et al., 2008). The interactions
between lipids and proteins are reported to occur during heat induced protein
denaturation (Taha and Mohamed, 2004).
2.3. Interactions between colloidal particles
Soymilk is a colloidal dispersion containing almost all components of the
soybean, including protein, fat and carbohydrates. A colloid can be defined as the
suspension of one or more substances evenly dispersed throughout another substance,
producing a system consisting of two separate phases, continuous and dispersed, which
may be gas, solid or liquid (Dickinson, 1992). The forces that play an important role in
the interactions between particles, and particles and the components present in the
continuous phase, include coulombic or electrostatic interactions, hydrophobic and
hydrogen bridging, covalent bonds and steric repulsion forces. These forces govern the
physico-chemical properties of the protein assemblies and their stability to aggregation
(Dickinson, 1992; Bremer et al., 1993).
The significant changes that occur in colloids are usually a result of alterations in
spatial distribution of molecules, such flocculation, coalescence, creaming or settling,
rather than alteration of their chemical structure. The spatial distribution of molecules in a
colloidal system is mainly governed by non-covalent interactions with neighbouring
particles (McClements, 2005). As discussed above, hydrogen bonding and hydrophobic
interactions are believed to be the main forces involved in the formation of soymilk
particles during heat treatment (Ren et al., 2009). Some disulfide bonding was reported to
13
also be involved in soymilk particle formation. Once the particles are formed, further
interactions take place, which either cause colloidal particles to become stable, or may
force further rearrangements. Thus, a good understanding of the general forces involved
in colloidal systems is imperative to studying the physicochemical nature of soymilk and
soymilk particles. To achieve colloidal stability, repulsive forces in a system must be
greater than attractive ones, in order to prevent particle flocculation, aggregation with
eventual creaming or settling. Electrostatic interactions occur between all types of
molecules in the dispersed and continuous phase and are widely recognized as playing a
major role in colloidal stability and prevention of particle aggregation, particularly when
involving proteins. Colloidal particles can carry an electrical charge, and therefore
electrostatic interactions affect their overall physicochemical properties and colloidal
stability (Dickinson, 1992; Demetriades et al., 1997a). The electrostatic interactions
between colloidal particles are dependent on the characteristics of their surface and on
their surrounding medium, such as pH, temperature and ionic strength (Hunter, 1986).
Intermolecular van der Waals forces occur as a result of the polarization of molecules,
and occur between all of the molecules in both the dispersed and continuous phase. The
net van der Waals forces are always attractive (Hunter, 1986; Israelachvili, 1991). They
arise from the uneven distribution of electrons spinning around a nucleus, creating a
dipole, which can effectively generate an electrical field that induced a dipole in
neighbouring molecules, and so on. These forces are most important in nonpolar
molecules, where electrostatic interactions are minimal and become strong at short range
(McClements, 2005).

14
In some cases, the particles can have unevenly distributed charges on the surface.
This heterogeneity of charge can affect the molecule’s electrostatic interactions (Holt and
Chan, 1997). While the molecule is neutral, it can still interact electrostatically with
neighbouring particles, through the positive or negatively charged regions. Electrostatic
interaction with charged polymers and ionic species can also occur (McClements, 2005).
This may apply to soy protein dispersions, due to the presence of various soy protein
subunits.
Hydrogen bonds are formed between polar side groups of amino acids, more
specifically between electronegative atoms (oxygen or nitrogen atoms), and continually
break and reform (Dickinson and McClements, 1995). Hydrogen bonding strength was
shown to be greater in hydrophobic or nonpolar environment, which is due to the
electrostatic nature of hydrogen bonds, as they will be stronger in a more non-polar
environment (Gao et al., 2009).
The properties of protein in suspension are strongly influenced by their
interactions with water molecules. Some water molecules are located inside protein
aggregates in suspension, while some form a hydration layer surrounding the protein.
Hydrogen bonds are relatively strong (stronger than Van der Waals forces) and increase
in strength with decreasing temperature (Dickinson and McClements, 1995). The amount
of hydrogen bonds formed with water molecules depends on the type of group involved,
whether they are ionized polar groups, non-ionized polar groups or hydrophobic groups
(Fennema, 1977). Hence, the amount of bound water on a protein depends heavily on pH.
The particle charge and hence its interaction with other suspended particles, can
be affected by pH and ionic strength. When ionic strength of the suspension medium is

15
high, charge screening can occur, due to counter-ions (oppositely charged ions)
accumulating on the surface of the molecule. This can lessen the particle charge, and in
extreme cases even reverse it (McClements, 2005). The thickness, or length, of this
adsorbed layer of counter-ions is related to the Debye length, which is a measure of how
far the electrical properties of the interface are sensed by counterions in the surrounding
solution (Evans and Wennerstrom, 1994).
Steric interactions are also very important in the stabilization of colloids. Steric
forces are mostly entropic in nature and occur between particles which have a polymer-
covered surface. In the case of soymilk particles, steric interaction could play a part in
particle stabilization; however, the structure, shape and composition of the surface of the
particles are still unknown, and hence it is unknown if steric interactions are involved.
The range and magnitude of steric interaction depends on the characteristics of the
interfacial layers, such as thickness, packing, flexibility, viscoelasticity and molecular
interactions. At short distances, steric interactions are strongly repulsive. Colloids can be
entirely stabilized by steric or electrostatic interactions, or from a combination of steric
and electrostatic interactions. A combination can provide good resistance to both
flocculation and coalescence. Steric interactions tend to be less sensitive to changes in pH
and ionic strength (Hunter, 1986).
Hydrophobicity is another important property affecting colloidal particle
interaction. Hydrophobicity can be described as the physical property of a material which
gives it a tendency to prefer a non-aqueous to an aqueous environment. Hydrophobic
interactions are essentially an entropic effect, resulting from the disruption of hydrogen
bonding between water molecules by non-polar molecules (Al-Bakkush, 2008;

16
Damodaran et al., 2008). Hydrophobic interactions between colloidal particles can
promote aggregation, especially during heat treatment of globular proteins, as
hydrophobic regions become exposed and promote protein-protein associations
(Monahan et al., 1996; Demetriades et al., 1997b). This mechanism seems to play an
important role during heating of soy proteins suspensions (Takagi et al., 1979; Nakai,
1983; Sorgentini et al., 1995; Wagner et al., 2000; Shimoyamada et al., 2008).
Hydrophobic interactions tend to increase in strength with temperature, and decrease
again at high temperature (Israelachvili, 1991).
2.4. Soy Proteins
Soy proteins are the main constituent in soymilk and play a major role in imparting its
processing functionality. Soy protein based ingredients are usually employed because of
their emulsification activity and stability, fat absorption, hydration capacity, colloidal
stability, acid and heat gelation, adhesion/cohesion, thickening and foaming abilities
(Wolf, 1970; Morr, 1979; Liu, 1997). Soy proteins are mainly used in the food industry in
form of soy flours and grits (40-50% protein), concentrates (70% protein) and isolates
(>90% protein). For this reason, most of the fundamental research on structure–function
of soy proteins is carried out on protein isolates. Soy proteins are classified as globulins,
because of their increased solubility in salt solutions. The solubility of soy proteins is a
very important property, as it is strongly linked to various processing functionalities, and
it can be adversely or favourably affected by processes such as heating, drying, pressure
treatments, exposure to polar organic solvents and chemical changes to their
environment, such as change in pH and ionic strength (Lee et al., 2003).

17
Heat treatment is the most frequently used method to modify the structure of proteins.
In soy proteins, it has been suggested that high temperature processing induces the
disruption and rearrangements of disulfide bonds, release of amine from amide groups,
and dissociation of subunits. Protein dissociation may play a role in increasing protein
solubility (Yamagishi et al., 1983). The pH of the environment in which soy proteins are
dispersed plays an important role in solubility. Soy proteins are most soluble at pH values
far from their isoelectric point, where electrostatic repulsive forces are greatest,
decreasing protein-protein interactions and their tendency to aggregate and precipitate
(Kinsella, 1979; Malhotra and Coupland, 2004). Protein concentration in suspensions was
shown to have a significant impact on protein solubility, as protein-protein interactions
increase (Sorgentini et al., 1995; Wagner et al., 2000).
Ionic strength also affects soy protein solubility, by altering electrostatic interactions
and hydrogen bonding. Low ionic strengths can cause salting-in effects, increasing the
solubility of proteins, due to ions in solution interacting with the adsorbed counterions on
the surface of the protein, forming a double layer of ionic groups, and increasing protein
hydration (Vojdani, 1996). However, at high ionic strengths, the solubility of protein is
reduced. This is because more salt ions attract a higher number of water molecules, which
decreases the number of water molecules available for the protein to interact with,
thereby increasing protein-protein interactions (Arakawa and Timasheff, 1984; Curtis et
al., 1998).
Because of the widespread use of soy protein isolates and concentrates, and an
increased interest in the production of ingredients with increased processing
functionality, the extraction, fractionation and characterization of soy proteins have been
18
subject of considerable research in the past (Wolf and Briggs, 1959; 1961; Sato et al.,
1986). Thanh and Shibasaki (1976) developed a method to simultaneously extract
glycinin and -conglycinin, the two main components of soybean storage proteins. This
method makes use of the differences in solubility between the proteins. Soy proteins are
generally divided in four groups, based on separation by ultracentrifugation at pH 7.5, as
15S, 11S and 7S and 2S (Wolf, 1969). The 11S and 7S fractions account for over 70% of
the total soy protein, and are composed mainly of glycinin and -conglycinin,
respectively. On the other hand, the 15S is a polymer of glycinin (Wolf, 1970). The 2S
fraction consists of the whey protein (soluble proteins) and includes enzymes, the trypsin
inhibitors Kunits and Bownman-Brik, as well as cytochrome C. This fraction accounts for
about 20% of the total protein (Wolf, 1970; Nielsen, 1985). As glycinin and -
conglycinin account for more than 80% of the total storage protein, the study of the
interactions between these two proteins and their processing behaviour is of great
importance to understand the functional properties of soy proteins when used as
ingredients in foods.
2.4.1. Glycinin
Glycinin, often called 11S, is the single largest fraction of soy protein, and it
usually accounts for over 40% of total seed protein, although this may vary between
varieties (Murphy and Resurreccion, 1984; Lakemond et al., 2000). The structure of
glycinin has been described as a hexamer, with molecular weight varying between 320-
360 kDa, depending on the subunit composition (Nielsen et al., 1989). The protein has
only a small glycosylated section (Lei and Reeck, 1987). Each subunit of glycinin is
19
composed of an acidic and basic polypeptides, with molecular weight of 31-45 and 18-20
kDa, respectively (Brooks and Moor, 1985). The isoelectric points are around pH 4.8-5.5
and 6.8-8.5, for the acidic and basic polypeptide, respectively (Staswick et al., 1981; Lei
and Reeck, 1987), with the variation depending on the genetic variants. The overall
isoelectric point of glycinin was reported at pH 4.9 (Koshiyama, 1983).
The quaternary structure of glycinin consists of two layers of trimers held together
by disulfide bridges and hydrogen bonding (Badley et al., 1975), each trimer consisting
of three pairs of acid and basic polypepetides linked together via a single disulfide bond
(Badley et al., 1975; Martin et al., 2002). Lakemond et al. (2000) reported that at pH 7.6,
a hexameric complex is formed, whereas at pH 3.8, glycinin is present as a trimeric
complex. Figure 2.1 shows the three-dimensional structure of the homohexamer A3B4
(referring to the combination of acidic and basic polypeptides) (Utsumi et al., 1997). The
quaternary structure can be disrupted by urea, strong acid and base, heat, or SDS in
combination with a disulfide reducing agent (Wolf, 1970). Glycinin contains 3-4 times
more methionine and cysteine per unit protein than conglycinin, which is evident by the
number of disulfide bonds stabilizing its quaternary structure (Kitamura, 1995). For the
same reason, glycinin is very stable to heat, with a denaturation temperature reported
around 85-95oC (Utsumi et al., 1997; Zhang et al., 2004).
Dissociation into subunits seems to be a necessary step prior to thermal
aggregation of glycinin (Koshiyama et al., 1981). High ionic strength (by addition of salt)
seems to prevent the dissociation of the quaternary structure, that is, to stabilise the
structure against dissociation and denaturation (Koshiyama et al., 1981).

20
-conglycinin
The 7S fraction separated by ultracentrifugation, is composed of -, -, and -
conglycinin, -amylase, lipoxygenase and hemagglutinin (Nielsen, 1985). -conglycinin,
the largest fraction of 7S, is a heterogeneous trimer with a molecular weight around 180-
210 kDa (Wolf, 1970; Maruyama et al., 2002) and constitutes about 30% of total seed
protein, depending on the soybean genotype (Liu, 1997). -conglycinin contains
glycosilated moieties, roughly 4-5% carbohydrate (Yamauchi et al., 1975).

21
Figure 2.1. Crystal structures of the glycinin A3B4 homohexamer (from Utsumi et al.,
1997).
22
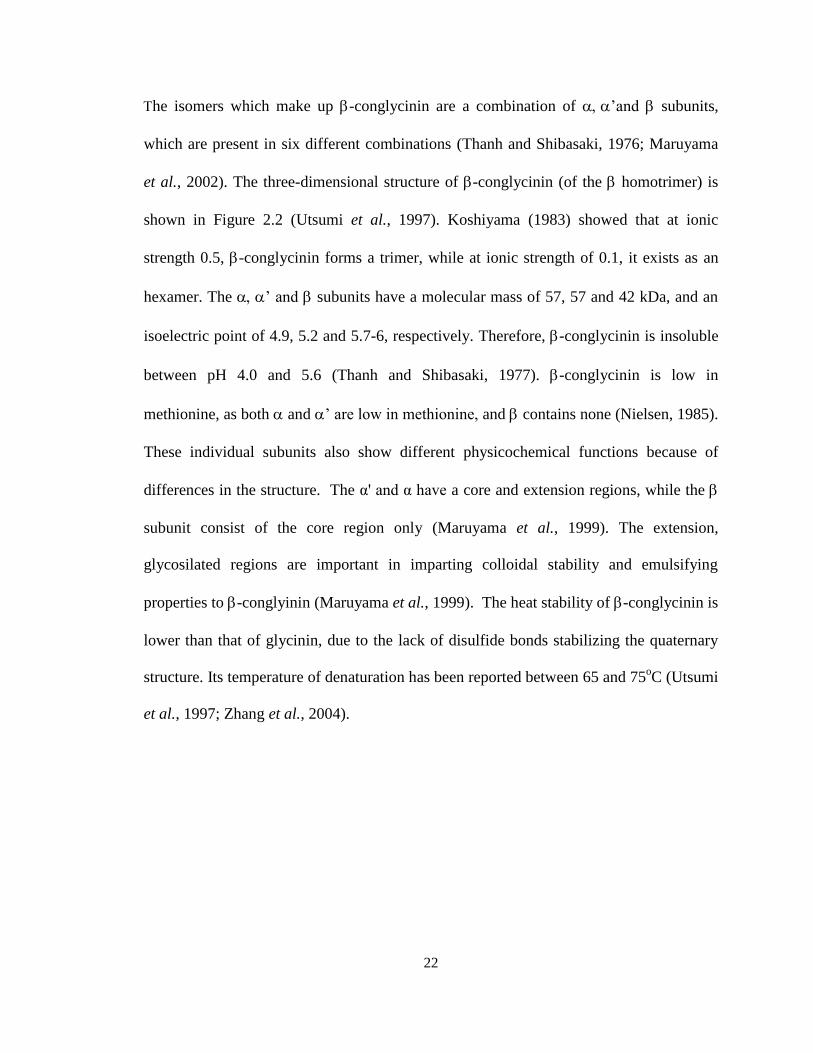
he isomers which make up -conglycinin are a combination of ’and subunits,
which are present in six different combinations (Thanh and Shibasaki, 1976; Maruyama
et al., 2002). The three-dimensional structure of -conglycinin (of the homotrimer) is
shown in Figure 2.2 (Utsumi et al., 1997). Koshiyama (1983) showed that at ionic
strength 0.5, -conglycinin forms a trimer, while at ionic strength of 0.1, it exists as an
hexamer. The ’ and subunits have a molecular mass of 57, 57 and 42 kDa, and an
isoelectric point of 4.9, 5.2 and 5.7-6, respectively. Therefore, -conglycinin is insoluble
between pH 4.0 and 5.6 (Thanh and Shibasaki, 1977). -conglycinin is low in
methionine, as both and ’ are low in methionine, and contains none (Nielsen, 1985).
These individual subunits also show different physicochemical functions because of
differences in the structure. The α' and α have a core and extension regions, while the
subunit consist of the core region only (Maruyama et al., 1999). The extension,
glycosilated regions are important in imparting colloidal stability and emulsifying
properties to -conglyinin (Maruyama et al., 1999). The heat stability of -conglycinin is
lower than that of glycinin, due to the lack of disulfide bonds stabilizing the quaternary
structure. Its temperature of denaturation has been reported between 65 and 75oC (Utsumi
et al., 1997; Zhang et al., 2004).

23
Figure 2.2. Crystal structure of β-conglycinin β homotrimer (from Utsumi et al., 1997).

24
2.5. Soymilk Gelation
Tofu is one of the most important and popular foods in East and South Eastern
Asian Countries, providing an important dietary source of protein. It is essentially a
soymilk curd, made by addition of coagulant to heat treated soymilk. The coagulation
forms a protein network trapping water, lipids, carbohydrates and other components
found in soymilk. The aggregation of soy proteins has been studied in detail, but mostly
on soy protein isolates with various processing history. Gelation can be induced using
heat or hydrostatic-pressure alone, or in combination with a change in pH and ionic
strength. The main types of coagulant used to produce tofu include salts such as MgCl2,
CaCl2, CaSO4 and acids such as glucono-delta-lactone (GDL) (Guo et al., 2002; Poysa
and Woodrow, 2002), which change the ionic strength or pH of the environment. The
resulting textural properties of the network and the types of bonds formed depend on
factors such as protein concentration and composition, pH, temperature, ionic strength,
type of ions and pressure applied (Skurray et al., 1980; Babajimopoulos et al., 1983;
Utsumi and Kinsella, 1985; Totosaus et al., 2002), processing history and total solids
content of soymilk (Liu, 1997; Cai and Chang 1998; 1999). Liu and Chang (2004) found
that the amount of coagulant required was correlated to the phytate content, pH, the
protein composition (ratio between polypeptides), the titratable acidity and the original
calcium content in the soymilk.
The gelation mechanism has been investigated on isolated glycinin, -conglycinin or
a mixture of the two (Utsumi and Kinsella, 1985; Kohyama and Nishinari, 1993;
Kohyama et al., 1995a). However, soymilk is a much more complex system, as it
contains protein aggregates. Nevertheless, the gel formation of soymilk was proposed to
25
be similar to that of soy protein isolate suspensions, where soy proteins are involved in
gel network formation, entrapping other components such as water, lipids and
carbohydrates (Ono et al., 1996; Guo and Ono, 2005).
The proposed mechanism of soy protein gelation in the production of tofu is a two
step process; as heat-induced denaturation of proteins causes the formation of soluble
complexes and subsequent addition of salt or acid causes coagulation of the proteins.
Gelation is thought to be caused by charge dispersion. With the decrease in electrostatic
repulsion the particles can come closer together and aggregation can occur via
hydrophobic interactions (Kohyama and Nishinari, 1993; Kohyama et al., 1995a; Guo
and Ono, 2005). It has been suggested that the formation of a network in tofu results from
a combination of hydrogen bonding, hydrophobic interactions, and electrostatic bridges
(Utsumi and Kinsella, 1985). Previous research has also shown that disulfide bonding is
involved in gel structure formation for isolated glycinin (Nakamura et al., 1985) as well
as in mixed systems (Utsumi and Kinsella, 1985).
It has been reported that large protein particles, containing more glycinin, aggregate
at lower concentration of coagulant, compared to -conglycinin rich soluble protein
particles (Guo and Ono, 2005). The breaking stress of tofu curd increases with increasing
protein content, due to an increased number of molecular bonds (Guo and Ono, 2005). It
was also demonstrated that the particle size in important for the rheological properties of
the curd, as they noted that the propeller blade and size, as well as the mixing speed
affect tofu texture (Cai and Chang, 1998; Hou et al., 1997; Shih et al., 1997).
The formation of a soybean curd is complex, as the outcome is influenced by a
multitude of factors. Tezuka et al. (1995) showed that -conglycinin-rich soymilk

26
requires a higher coagulant concentration than glycinin-rich soymilk or soymilk
containing both fractions. Gels made with glycinin rich fractions are significantly harder
than those made with -conglycinin rich fractions (Saio, 1969; Murphy et al., 1997).
Tezuka et al. (2000) similarly suggested that a higher content of glycinin in the bean
would yield soymilk with a higher particle content, leading to a stronger (a higher
breaking stress) tofu.
Tofu is generally classified into soft (silken), firm and extra firm tofu, depending on
textural properties and water content. The main differences between these types of tofu
arise from the water-to-bean ratio used to prepare soymilk, the type of concentration of
coagulant used, and the amount of whey pressed out. Each type of tofu is prepared for
specific applications, based on their textural and processing functionalities (Liu, 1997).
This work focuses on the soft, or silken, tofu, as no whey is pressed out.
2.5.1. Heat-induced Gelation
Heat-induced gel formation of soy proteins has been described in considerable
detail. After the initial heat-induced denaturation of the proteins, there is a gradual
increase in storage modulus, with a continuous incorporation of proteins in the gel
network upon continued heating, and finally the thermo-reversible stiffening of the gel on
cooling, as seen by a further increase in G’ (Renkema et al., 2002; Renkema and van
Vliet, 2002). The type of forces involved in heat induced protein-protein interactions
include disulfide bonding, electrostatic interactions, hydrophobic interactions, and
hydrogen bonding (German et al., 1982; Nakamura et al., 1986; Puppo and Anon, 1998;
Renkema and van Vliet, 2002).
27
Several authors (Babajimopoulos et al., 1983; Utsumi and Kinsella, 1985)
suggested that hydrogen bonding and disulfide bonding are important in maintaining the
network structure of heat-induced soy protein gels. Renkema and Van Vliet (2002)
reported that disulfide bonds are involved in gel formation in the presence of glycinin,
while they are not involved in gels containing isolated β-conglycinin. Disulfide
interchange occurs during heating between the basic polypeptide of glycinin and the
subunit of -conglycinin, to form soluble macrocomplexes, also involved in the gel
network structure (Utsumi et al., 1984). Hydrogen bonding plays a major role in gel
stiffening during cooling (Renkema and van Vliet, 2002)., Further rearrangement in the
network structure can occur as a result of further heating, change in pH, and presences of
ionic species (Renkema, 2001).
2.5.2. Acid and Salt-Induced Gelation
There are two types of chemical coagulants for soy proteins, acids and salts. The
yield and quality of tofu are affected by the variety of bean used (Cai and Chang, 1998).
The amount of coagulant used and the amount of protein present were found to have an
effect on the textural properties (hardness and cohesiveness) of the curd (Skurray et al.,
1980). Generally, higher protein content produces harder gels, as a result of the higher
number of linkages in the network. As well, the protein composition was found to have
an effect on gelling points and gel hardness (Nakamura et al., 1986). Salts such as
magnesium chloride or calcium sulphate have been traditionally used to induce soy
protein aggregation. In the case of soymilk, pH or salt induced aggregation results in a
very common type of soybean curd, called tofu. Glucono-delta-lactone (GDL) is usually

28
used as an acidifying agent in the processing of soy gels, as it is a slow releasing acid,
and results in homogenous gels (Kohyama and Nishinari, 1993).
The mechanism of acid induced gelation lies in the solubility of proteins at certain
pH conditions, a behavior that can be predicted by knowing the proteins’ isoelectric
points. Each protein has an isoelectric point, or overall charge, which is dependent on
their amino acid sequence (Damodaran et al., 2008). The isoelectric point of glycinin is
around 4.5 to 5.0, while that of -conglycinin is around 6.3 to 7.0 (Brooks and Morr,
1985). The nature of the gel network formed is also influenced by the final pH and/or
ionic strength. Gels become coarser at pH values close to the isoelectric point of the
proteins, or with increasing ionic strength (Renkema, 2001).
The acid induced gelation of soy proteins have been described as a series of steps,
the first of which is heat induced protein denaturation. Heating causes structural changes
and makes the proteins prone to aggregation (Alting et al., 2002; Renkema and van Vliet,
2002). The consequent addition of ions causes neutralization or screening of the surface
charges, thereby increasing protein-protein interactions. The process, as described by
Kohyama and others (1995), is illustrated in Figure 2.3. The driving forces involved in
soy protein aggregation are non-covalent in nature, namely, hydrophobic interactions,
hydrogen bonding and van der Waals (Kohyama et al., 1995a; 1995b).
While disulfide bridging plays a major role in heat-induced gels, it does not seem
to be involved in acid induced gel network formation, although it is still important in the
formation of the aggregates prior to acidification. Generally, the addition of GDL to
heated soy protein produces gels in the range of pH 5.0-5.5, close to the pI of the acidic
subunit of glycinin (4.8-5.5) as well as the and ’ subunits of -conglycinin (4.9 and

29
5.18, respectively) (Thanh and Shibasaki, 1977; Staswick et al., 1981). However, the
final pH of the acid gels, which can be controlled by the amount of GDL added, may
influence the type of gel formed, i.e. physical properties such as texture, microstructure,
appearance and water-holding capacity (Tay and Perera, 2004).

30
Figure 2.3. Gelation mechanism of soybean proteins in the presence of GDL or CaSO4:
(circles) protein molecules; (black areas) hydrophobic regions, as postulated by Kohyama
et al. (1995a).

31
Malaki Nik et al. (2011) showed that the point of onset of gelation of soymilk, containing
4% protein, is around pH 5.7-5.8, and no significant differences in the pH of gelation
exist with faster gelation (using different GDL concentrations, 0.8 and 1.6%w/v).
However, the gel structure seems to be affected by the amount of GDL added, or rate of
acidification.
Similar behaviour is reported for soymilk gels prepared using salt as the
coagulant. Gels made with crude glycinin fractions gel faster than those prepared with -
conglycinin, in agreement with the results reported for GDL. Specific glycinin protein
subunits (those related to the genotypes with group 1 and A5A4B3) seem to increase tofu
firmness (Fukushima, 1991; Cai and Chang, 1999; Tezuka et al., 2000). The gelation of
soy proteins with addition of ions was described by Babajimopoulos et al. (1983),
reporting that the major forces involved in the formation of the network are hydrogen
bonding and van der Waals interactions, with negligible contributions of hydrophobic and
electrostatic interactions.
Calcium induced gelation occurs more rapidly than acid induced gelation (Ono et al.,
1993), causing textural differences (Hashizume et al., 1975; Ono et al., 1993).
2.5.3. Effect of Glycinin and -conglycinin on gelation
Glycinin and -conglycinin, the two main soy protein fractions, have different
functional properties, and as such gel properties vary depending on the ratio of
glycinin/-conglycinin in the soy protein fraction. Kohyama and Nishinari (1993)
showed that individually, -conglycinin and glycinin produce gels with different
properties. Several authors have reported that the glycinin content in protein isolates
32
positively correlates with gel firmness (Saio, 1969; Kang et al., 1991; Murphy et al.,
1997). The protein subunit composition significantly affects the development of gel
structure during acidification of soymilk, and gels made with a higher glycinin/-
conglycinin ratio are stiffer (Malaki Nik et al., 2011). Yoshida and others (1992) noted
that polymers with a higher molecular weight tend to form stronger gels than low
molecular weight polymers, which could also help explain why glycinin forms harder
gels. However, there is still disagreement on the effect of protein composition on the
properties of the final gels. It has been also reported that -conglycinin forms firmer gels
than glycinin (Utsumi and Kinsella, 1985a), or that there is no significant correlation
between the glycinin and -conglycinin ratio and tofu quality (defined by taste, colour
and texture measurements) (Skurray et al., 1980). It was also shown (Tay and Perera,
2004) that gels of isolated fractions of glycinin and -conglycinin have similar storage
and loss moduli at the final stages of gelation. However, there are several differences
between the fractions: glycinin forms gels with a coarser structure and larger pore sizes,
while gels prepared with isolated -conglycinin have finer aggregates, and show lower
cohesiveness, gumminess and lightness than glycinin gels. As well, a slower gelation
time and higher final pH is reported for gels prepared with -conglycinin compared to
glycinin gels (Kohyama and Nishinari, 1993; Kohyama et al., 1995a; 1995b; Tay and
Perera, 2004). Differences in the types of bonds forming the gel network exist between
glycinin and -conglycinin gels. Disulfide bonding plays a role in the structure formation
of glycinin networks, while it does not seem to be important in -conglycinin gels
(Renkema and van Vliet, 2002). The ratio of glycinin to -conglycinin has also been
reported to affect the amount of fat retained in the curd, due to the different manner by

33
which the two protein fractions interact with lipids (Guo et al., 2002; Toda et al., 2007).
It has been recently demonstrated that the pH of gelation, as measured by rheology, is not
dependent of soy protein composition (Malaki Nik et al., 2011).
2.6. Outlook
Soymilk and tofu are nutritional soy-based foods with strong evidence to suggest
their positive impact on health. Soymilk production is relatively simple and requires only
a few steps, as well as tofu production. Both of these foods utilize the whole bean and
provide an efficient means of converting raw soybeans into edible products. Because
little is known and understood about the physicochemical characteristics of soymilk and
molecular interactions between particles, production can be unpredictable and no
significant advances have occurred in the area of product development. Obtaining a better
understanding of the physicochemical characteristics of soymilk and its colloidal
properties could help to increase local utilization, processing and consumption of
soybeans, and aid in the development of novel products using soymilk as a base. There is
also great potential to use the gelation properties of soymilk to aid in structuring gelled
food products.

34
Chapter 3:
Physico-chemical characterization of soymilk particles as a function of their
volume fraction: comparison with theoretical systems.
3.1. Abstract
The physico-chemical properties of soymilk particles were investigated as a
function of concentration of protein in soymilk. Soymilk samples were prepared using
different water-to-protein ratios, resulting in 4%, 5% and 7% protein content. The
soymilk particles were not significantly different in their protein composition, surface
hydrophobicity and intrinsic fluorescence; however, their surface charge, particle size and
protein content were affected by the water-to-bean ratio. Using a relation between the
effective refractive index of soymilk and the turbidity parameter determined
experimentally using diffusing wave spectroscopy, it was possible to estimate, for the
first time, a voluminosity of 4.11 mL/g and a refractive index of 1.388 for the colloidal
particles. This allowed conversion of protein content to volume fraction, and comparison
of the experimental data collected by diffusing wave spectroscopy, rheology and
ultrasonic spectroscopy with theoretical models.
3.2. Introduction
Consumers in western countries are increasingly seeking food products that offer
added health benefits, in part due to an increased awareness of the effects of diet on
health. Over the past two decades, research has shown strong evidence for the potential
use of soy in the prevention of chronic diseases, which has positively affected soymilk
35
and soy-foods consumption (Sirtori et al., 1993; Messina et al., 1994; Setchell, 2001). To
meet this growing demand, food companies are faced with new challenges to formulate
innovative products that provide added health benefits. One of the possible ways to
achieve this would be to exploit the use of soymilk as an ingredient base in foods and
beverage products; however, a better understanding of the fundamental colloidal
characteristics of soymilk is required to succeed.
Soymilk particles are colloidal assemblies derived from the aqueous extraction of
soybeans and are made up of various components, including lipids (such as triglycerides
and phospholipids), proteins, complex carbohydrates, minerals and phytates
(Lakshmanan et al., 2006; Malaki Nik et al., 2008). There are two major proteins in
soymilk, namely glycinin and β-conglycinin, constituting about 40% and 30% of total
soy protein, respectively. Research on the chemical nature of soymilk particles revealed
that they are composed of all the major subunits present in the original storage protein in
the seed (Malaki Nik et al., 2008; Shimoyamada et al., 2008; Ren et al., 2009).
Heat treatment of soymilk is necessary to denature antinutritional components,
prolong shelf-life and stability, as well as to improve sensorial characteristics of the final
product (Kwok and Niranjan, 1995; Liu, 1997; Kwok et al., 2002). Several studies report
that heat treatment is essential to achieve colloidal stability of soymilk (Kwok and
Niranjan, 1995; Iwuoha et al., 1997). Protein particles are formed during heating through
disruption, and subsequent rearrangement and aggregation of the storage proteins present
in the seed (Damodaran and Kinsella, 1982; Utsumi et al., 1984; Ono et al., 1991; Ono et
al., 1993; Guo and Ono, 2005; Lakshmanan et al., 2006; Malaki Nik et al., 2008;
Shimoyamada et al., 2008). Heat treatment was found to decrease the fraction of large

36
particles, defined as particles larger than 100 nm (by differential centrifugation), and
increase the fraction of medium-sized particles, defined as particles between 40-100 nm,
which form by association of supernatant proteins with each other. The increase in
medium sized particles seemed to be responsible for the colloidal stability of the system
(Ono et al., 1991; Malaki Nik et al., 2008; Shimoyamada et al., 2008). In agreement,
another study reported that soymilk particles after heat-treatment are polydisperse in size
with an average particle diameter of around 0.20 ± 0.01 m (Malaki Nik et al., 2008).
Research has been conducted on the behaviour and bulk properties of soymilk
undergoing various processing methods such as heating, homogenization and high-
pressure treatment, to identify ideal processing conditions (Kwok and Niranjan, 1995;
Guo et al., 1997; Kwok et al., 2002; Zhang et al., 2005; Lakshmanan et al., 2006; Cruz et
al., 2007) as well as the structural characteristics of soymilk particles such as size,
composition, chemical nature of inter-particle bonds and the general physico-chemical
characteristics (Ono et al., 1991; Malaki Nik et al., 2008; Ren et al., 2009; Sivanandan et
al., 2010). However, very little is known on the physical nature of soymilk particles, and
if their behaviour can be somewhat predicted by using established theoretical models of
colloidal science.
Knowing that soymilk particles are formed through the disruption and subsequent
rearrangement and aggregation of soy protein subunits during heat treatment, this work
investigates the dependence (if any) of the physical characteristics of the ensuing soymilk
particles after this disruption and rearrangement process, as a function of soymilk protein
concentration, which depends on the water-to-bean ratio used to prepared soymilk.
Whether an effect on the nature of the particles is observed presents important

37
implications in terms of the colloidal and processing behaviour of soymilk. The
comparison of physical properties of soymilk particles made from different water-to-bean
ratios was investigated, such as size, surface hydrophobicity, intrinsic fluorescence, -
potential. Furthermore, the mass-to-volume conversion factor of the soymilk particles
was calculated, allowing for a comparison between experimental results and theoretical
models. As a corollary, the index of refraction of the soymilk particle was estimated.
3.3. Materials and Methods
3.3.1. Soymilk preparation
Soybean seeds (Harovinton variety) were obtained from the Greenhouse and
Processing Crops Research Centre of Agriculture and Agri-Food Canada (Harrow,
Ontario). All chemicals used in this work were purchased from Sigma Chemical (St
Louis, MO, USA) or at Fisher Scientific (Mississauga, ON, Canada). Ultrapure water was
used for the preparation of soymilk (Milli-Q Integral Pure and Ultrapure water systems,
Billerica, MA, USA).
Soymilk was prepared as previously described (Malaki Nik et al., 2008) with
slight modifications. Three stock batches of soymilk were prepared with varying protein
concentration (4, 5 and 7%), using three ratios of water-to-soybeans (based on protein):
22:1, 18:1 and 12:1, respectively. These ratios were used to calculate the specific amount
of water to be added to the beans, in order to yield a soymilk base with a specific protein
concentration. The soymilk protein concentrations of 4, 5 and 7% were selected because
4 is a typical protein concentration found in commercially produced soymilk. 5% protein

38
provided an additional, higher concentration. 7% was the highest protein concentration
which could be used, without causing the soymilk to gel during heat treatment. The
soybeans used had 43.5% protein (as determined by Grainspec near infra-red
spectroscopy).
Soybeans were weighed and soaked overnight for 12-18 h, at room temperature in
ultrapure water. Once soaked, the soybeans were rinsed and drained with cold water
several times, then reweighed to determine the amount of water absorbed by the beans.
The amount of water to be added to the soaked beans before blending was determined by
correcting for the amount of absorbed water:
)()()( watergWWxCWAx wbdbpdb [3.1]
where A is the desired ratio of water-to-protein, Wdb is the weight of dry beans, Wwb is
the weight of wet beans and Cp is the original concentration of protein in the bean. Of the
water to be added to the soaked beans, about half was added at room temperature (23oC)
and blended with the beans (commercial blender, WARING, New Hartford, CT) at high
speed for 3.5 min. The remaining water was heated to 60oC and added to the slurry to
enhance protein extraction. This mixture was blended for an additional 30 s at high speed.
The slurry was passed through a juice extractor (Juiceman, professional series 211,
Korea) to remove coarse material (okara, which is mainly composed of insoluble fibre
material), and was then passed through the juice extractor a second time. The soymilk
obtained was further filtered through a cheese cloth.
Soymilk was transferred into 20 mL test tubes and placed in a water bath set at
95˚C. After heating for 7 min, the tubes were then immediately cooled to room
temperature in an ice-water bath. To further remove residual fiber and large particles

39
(Malaki Nik et al., 2008), the soymilk was centrifuged at 8000 g for 30 min at 20oC
(Optima LE-80K Beckman Coulter, CA, USA) and filtered through cellulose paper filters
(25 m, Fisherbrand, Fisher Scientific).
Soymilk serum was obtained by ultrafiltration using centrifugal microfilters (10
mL Macrosep 10K Omega, Pall Corporation, NY, USA), by centrifuging at 5000 g for 2
hrs (Beckman Coulter, J2-21, CA, USA). The ionic composition of the serum was
analyzed by atomic absorption spectroscopy by Laboratory Services, Agriculture and
Food Laboratory, Guelph, Ontario.
3.3.2. Determination of total solids and protein concentration
The total solids content was determined using a forced air oven method, by
placing the samples in dry aluminum dishes containing dried sea-sand as a dispersing
agent (Fisher Scientific), and drying at 105oC until constant weight.
Protein was determined using a modified Lowry assay method, according to
manufacturer’s instructions (DC Protein Assay, Bio-Rad, Hercules, CA). Bovine Serum
Albumin (Thermo Scientific, Rockford, USA) was used as the standard.
3.3.3. Particle protein content and composition
Previous research revealed that over 50% of proteins in soymilk are present as
medium and large size particles (>40 nm) while the rest is present as supernatant particles
(< 40 nm) (Ono et al., 1991). Other studies showed that the average particle size of
soymilk and defatted soymilk is roughly between 40-200 nm (Malaki Nik et al., 2008;
Ren et al., 2009). To better understand the composition of the soymilk particles (> 40
40
nm), 4 and 7% protein soymilk samples were centrifuged at 100,000 g for 30 min at
20oC. The pellet obtained from centrifugation at 100,000 g (soymilk particles) was then
resuspended in 0.1 M phosphate buffer (pH 8) using a dispersing instrumen (UltraTurrax,
PowerGen 125, Fisher Scientific) for 90 s. After resuspension in buffer, samples were
centrifuged further at 20,000 g for 30 min at o
C. Both pellets and supernatants were
analyzed in terms of total solids and protein content. Total solids were measured by the
drying oven method as described above, while the protein content was determined by the
DUMAS method, using a Nitrogen Analyzer (LECO, FP-528, Mississauga, ON, Canada).
EDTA was used as a standard for calibration and the conversion factor used was 6.25.
3.3.4. Refractometry
The refractive index of soymilk at different dilutions was recorded at room
temperature using a Carl Zeiss refractometer (Model 74108, Germany). Soymilk batches
(4, 5 and 7% protein) were diluted in series with their respective serums prepared by
ultrafiltration. Six dilutions were made per batch, down to a dilution of 60:40 soymilk-to-
serum (v/v). For each dilution, the amount of protein was determined using the modified
Lowry method (see above). Results were obtained for triplicate soymilk batches. The
refractive index of the serum was measured for each soymilk batch. Ultrapure water was
used as the reference, with a measured refractive index of 1.333 at o C.

41
3.3.5. Gel Electrophoresis
Sodium Dodecyl Sulfate-Polyacrylamide Gel Electrophoresis (SDS-PAGE) was
carried out on the soluble fraction of the resuspended pellet centrifuged at 100,000 (the
supernatant after 20,000 g as described above) of 4 % and 7% protein soymilk.
Extraction buffer (50mM Tris-HCl, 5M urea, 1% SDS, and 4% 2-
mercaptoethanol, pH 8.0) was added to soymilk samples in varying amounts depending
on the initial sample protein concentration, and the mixture was incubated for 1 h at room
temperature. Electrophoresis buffer (200 µL) (125 mM Tris-HCl, 5M urea, 1% SDS,
20% glycerol, 4% 2-mercaptoethanol, and 1% bromophenol blue, pH 6.8) was then added
to each sample, to bring the final volume to 600µL. The final protein concentration in
these sample mixtures was 0.286g/100 mL. The solutions were heated at 95°C for 5 min
and centrifuged at 6,000 g for 10 min using an Eppendorf centrifuge (Brinkmann
Instruments, Westbury, NY, USA). Sample aliquots of 6 μL were loaded into a 12.5%
acrylamide running gel with a 4% stacking gel in Bio-Rad mini-protein electrophoresis
unit (Bio-Rad Laboratories, Hercules, CA, USA), at a constant voltage of 175 V.
Molecular weight standards were loaded in 10 μL aliquots (BIO-RAD Molecular Weight
Standards, Low Range, BIO-RAD Laboratories, Hercules, CA, USA). Gels were then
stained with Coomassie blue R-250 stain solution and destained according to
manufacturer’s instructions. The protein bands were analyzed using image analysis
software (Image-Master®
1D, version 2.0, Amersham Biosciences, Quebec, Canada) and
scanned using a SHARP JX-330 scanner (Amersham Biosciences, Quebec, Canada).

42
3.3.6. Fluorescence measurements
The fluorescence spectrum of the protein present in the 4% and 7% soymilk
samples was measured using a Shimadzu RF-5301 PC spectrofluorophotometer (Mandel
Scientific, Guelph, Canada), using 280 nm as excitation wavelength, with excitation and
emission slots of 5 nm. Samples were prepared by diluting soymilk in 30 mM phosphate
buffer (pH 7) to a final concentration of 20 g/mL. The fluorescence spectrum was
collected at 300-400 nm.
Surface hydrophobicity of the protein complexes was determined using 1-anilino-
8-naphthalene sulfonate (ANS). Titrations were carried out using a Mandel
Spectrofluorophotometer (RF-5301 PC, Shimadzu, North America) on soymilk samples
containing 4 and 7% protein. The samples were diluted in 30 mM phosphate buffer (pH
7) to a final protein concentration of 50 g/mL, and ANS was added incrementally in a
range of concentration from 0.003 to 0.25 mM. Excitation was set at 390 nm and the
fluorescence spectrum (400-650 nm) was measured, with bandwidths of 5 nm. The
intensity at the maximum peak of emission (470 nm) was then measured at each ANS
concentration. Sigmaplot Enzyme Kinetics 1.3 was used to fit the plot to the Michaelis-
Menten model (single substrate binding model), from which the apparent dissociation
constant of the protein-ANS complex (Kdapp
) and the overall binding capacity Fmax was
measured. The ratio Fmax/ Kdapp
was also calculated, which gives an estimate of protein
surface hydrophobicity index (PSH), which takes into account the affinity and the
number of hydrophobic sites (Moro et al., 2001).
43
3.3.7. Light Scattering measurements
Dynamic light scattering (DLS) was employed to determine the average
hydrodynamic size and -potential of the soymilk particles. For size measurements,
soymilk samples were diluted ~10,000 times in filtered phosphate buffer (pore size 0.22
m) at pH 8.0 (as used in previous research) (Ren et al., 2009), and placed in a Zetasizer
Nanoseries (Nano ZS, Malvern Instruments, Worcestershire, UK). The cuvettes were pre-
rinsed with filtered buffer prior to adding the sample to ensure no dust or other
particulates were present. ζ-potential measurements were also performed with the
Zetasizer, diluting the soymilk samples ~ 5000 times with their respective stock-derived
serums, using DTS1060C clear disposable zeta cells (Malvern Instruments).
Since the measurements described above required the samples to be highly
diluted, diffusing wave spectroscopy (DWS) was also employed, as this technique does
not require dilution of soymilk. It was then possible to measure the hydrodynamic size
and turbidity parameter of the soymilk particles as a function of the concentration of
protein present. The dilutions were made for all three batches of soymilk dispersed in
their own respective serum (as prepared by ultrafiltration, see above).
The DWS equipment consisted of passing a monochromatic variable power Verdi
V-2 pumped Nd:YAG laser (Coherent Inc., Santa Clara, CA, USA) emitting at 532 nm
and power of 300 mW (Coherent), through the sample. The sample (~2 mL) was
contained in a glass cuvette with a path length of 5 mm (Hellma Canada Limited,
Concord, Canada). A water bath was used to maintain sample temperature at o
C.
Calibration of the laser intensity was performed daily and used to calculate the turbidity

44
(1/l* parameter) and apparent radius of the sample particles, using specially designed
software (Mediavention Inc, Guelph, Ontario, Canada).
In general, the position of particles with respect to one another will affect the
angular distribution of the scattered light, giving rise to changes in turbidity, since 1/l* is
a cooperative randomization of light. For completely non-interacting scatterers, only the
physical and optical characteristics of the scatterers, such as refractive index contrast,
size and shape (related by the form factor F(q)) determine their scattering behavior. In
concentrated systems such as those described in this work, however, the spatial
correlation between the particles will also depend on the interactions between them, as
given by the structure factor, S(q). The general expression for l∗ in systems with
interacting particles will be then given by
1
3
2
0
)()(*
dqqqSqFl
k
[3.2]
where q = 2 k sin /2 is the wave vector of the light (Weitz et al., 1993). Therefore,
changes in the 1/l* parameter can be taken as indications of changes in the organization
of the colloids within the suspension (due to concentration effects, electrostatic charges,
etc) when all other physical parameters mentioned above remain constant. Most
importantly, a correlation in the positions of the particles will also play an important role
in the degree of mobility of the individual particles. The dynamics of the sample will in
turn be displayed in the diffusion coefficient obtained from the experimental correlation
functions collected by DWS.
45
3.3.8. Electro-acoustic spectroscopy
Electroacoustics also does not require sample dilution and allows in-situ
investigation of particle characteristics such as -potential and size of concentrated
suspensions (Dukhin and Goetz, 2002; O'Brien et al., 2003). For electroacoustic analysis,
an ultrasound wave is applied to a sample, generating an electric potential, which is
registered as colloidal vibration current (CVI), and can be related to dynamic
electrophoretic mobility, d (O'Brien et al., 2003).
d
m
ZFACVI
)()(
[3.3]
where A() is a calibration function, F(Z) is determined by the acoustic impedance of the
suspension and is automatically measured by the instrument, is the volume fraction of
particles, and is the difference in density between the particles and the suspension
medium which has density mAccording to this theory, the complete functional
dependence of the CVI on potential, particle size and frequency are incorporated in the
dynamic mobility.
The dynamic mobility was obtained for the 4%, 5% and 7% protein soymilk
samples over a range of dilutions prepared using their corresponding serum. The total
solids content (% w/w) was determined for each dilution using the forced-air oven drying
method, as described above. The background CVI, was measured individually for each
sample using the appropriate stock-derived serum. The dynamic mobility was also
determined for model silica Ludox particle suspensions (AS-30, Sigma-Aldrich) of
volume fractions ranging from 2.3% to about 16.3%.

46
Calibration of the equipment was performed using a 10% w/w Ludox silica
particles suspended in 10 mM KCl. Ultrasound pulses were transmitted through the
sample at a constant frequency of 3 MHz. Parameters for the background medium were
defined as water with the following physical characteristics: density of 0.997 g/cm3
(at
25˚C), thermal conductivity of 6.065 mW/cm/C, heat capacity of 4.18 J/g/C, thermal
expansion of 2.570x 10⁴
1/C, sound speed of 1496.7 m/s, intrinsic attenuation at 100
MHz of 0.186 db/cm/MHz. The dispersed particles were defined as soft particles (temp,
25oC), with the following characteristics: density of 1.2800 g/cm
3 (arbitrary number),
thermal conductivity of 1.150 mW/cm/°C, heat capacity of 1.000 J/g/°C, thermal
expansion of 2.700x10⁴ 1/°C.
3.3.9. Flow behaviour measurements
Flow behaviour measurements were carried out with an Anton-Paar rheometer
(MCR 301, Anto-Paar, Graz, Austria), using a concentric cylinder with a 1 mm gap.
Soymilk samples were diluted to various protein concentrations (from ~0.01% protein to
undiluted soymilk) using ultrapure water and measurements were carried out at 23˚C. A
shear ramp of 0.8-100 s-1
was used. Time between measurements was increased from an
initial 100 s to a final 1 s.
3.3.10. Microscopy
Scanning electron microscopy (SEM) and cryo-transmission electron microscopy
(cryo-TEM) were employed to observe the microstructure of the soymilk. Samples for
SEM were prepared on well-polished carbon planchets sputtered with gold for 3.5 min
(Emitech K550, Ashford, Kent, UK) using a self assembled monolayer technique

47
(Uricanu et al., 2004; Martin et al., 2006). Carbon planchets were incubated for at least
18 h into a 2 mM 11-mercapto-undecanoic acid (11-MUA) solution, diluted with 100%
ethanol to a concentration of 0.044% to form the self-assembled monolayer. A mixed
solution of chemical linkers consisting of N-hydroxysulfosuccinimide and 1-ethyl-3-(3-
dimethylaminopropyl) carbodiimide was used for the protein binding. The carbon
planchets were rinsed with ultrapure water and placed in the soymilk samples for 1 h,
after which the soymilk was exchanged with water. The water was then replaced with
1.5% glutaraldehyde solution (the fixing agent), and left to soak for 30 min. The carbon
planchets were then rinsed by ultrapure water and subjected to critical point drying. Once
dry, the carbon planchets were put in a desiccator overnight and sputter coated for 2 min
with gold before taking the images. Imaging was performed with the SEM Hitachi S-570
(accelerated voltage kept at 10kV) and viewed digitally using Quartz PCI software
(Version 8, Vancouver, BC, Canada). Efforts were made to select two micrographs that
best represent a total of 30 and 50 micrographs taken of the 4 and 7% protein soymilk
samples, respectively.
For CryoTEM samples, quantifoils grids with 2 µm holes, spaced 2 µm apart on
200 µm mesh copper grids, were prepared by glow-discharging using an air
plasma cleaner (Harrick plasma cleaner/ sterilizer PDC-32G) for 2 min. Soymilk samples
(~5µL) were placed onto the grids, blotted two times for 2 seconds each, using the
Vitrobot (FEI, Oregon, USA), and cryogenically frozen in liquid ethane immediately
after. The samples were kept at -175°C until use. The structure of soymilk particles was
observed using a TECNAI Cryo-Transmission Electron Microscope (G2 F20, FEI,
Oregon, USA).

48
3.3.11 Statistical analysis
All experiments were conducted at least three times. Statistical differences were
calculated using least-squares regression lines where applicable, and independent sample
t-test, using the statistical analysis program R (R Development Core Team, R Foundation
for Statistical Computing, version 2.12.2. Vienna, Austria). Differences in this
manuscript are significant at a level of p<0.05.
3.4. Results
3.4.1. Characterization of the soymilk particles prepared from 4 and 7% protein
soymilk
Due to the sensitive nature of the stability of colloidal protein aggregates to their
environment, the serum in which the particles are dispersed will influence particle
structure and interactions (Hunter, 1986). The ionic composition of the serum obtained by
ultrafiltration (see Methods) is summarized in Table 3.1. The two soymilk samples,
prepared with the lowest and the highest water-to-bean ratio (resulting in a 7% and 4%
final protein composition), showed different serum composition. As expected, the higher
bean-to-water ratio (7% protein soymilk) produced serum with a higher concentration of
ions than the 4% protein soymilk. Accordingly, 7% protein soymilk contained higher
total solids (10.8% w/w) compared to 4% protein soymilk (5.9% w/w). The increase in
ion concentration was roughly double between 4% and 7% soymilk serum, as were the
total solids between the 4 and 7% protein soymilk samples.
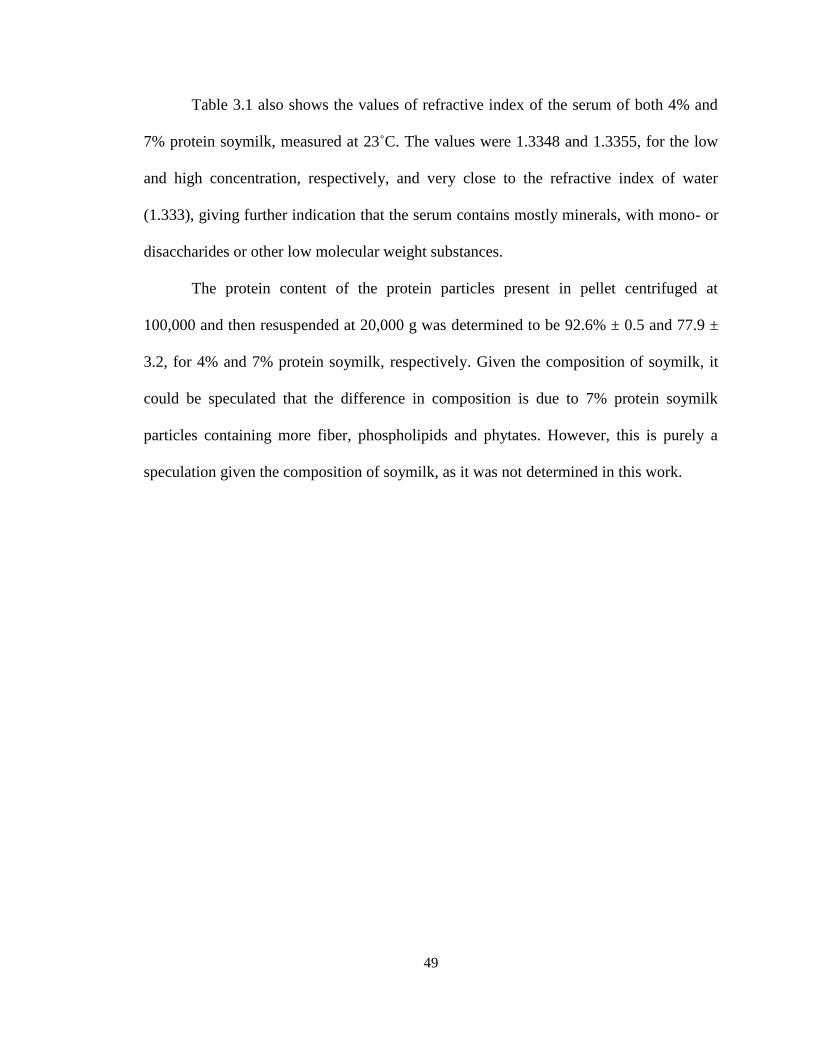
49
Table 3.1 also shows the values of refractive index of the serum of both 4% and
7% protein soymilk, measured at 23˚C. The values were 1.3348 and 1.3355, for the low
and high concentration, respectively, and very close to the refractive index of water
(1.333), giving further indication that the serum contains mostly minerals, with mono- or
disaccharides or other low molecular weight substances.
The protein content of the protein particles present in pellet centrifuged at
100,000 and then resuspended at 20,000 g was determined to be 92.6% ± 0.5 and 77.9 ±
3.2, for 4% and 7% protein soymilk, respectively. Given the composition of soymilk, it
could be speculated that the difference in composition is due to 7% protein soymilk
particles containing more fiber, phospholipids and phytates. However, this is purely a
speculation given the composition of soymilk, as it was not determined in this work.
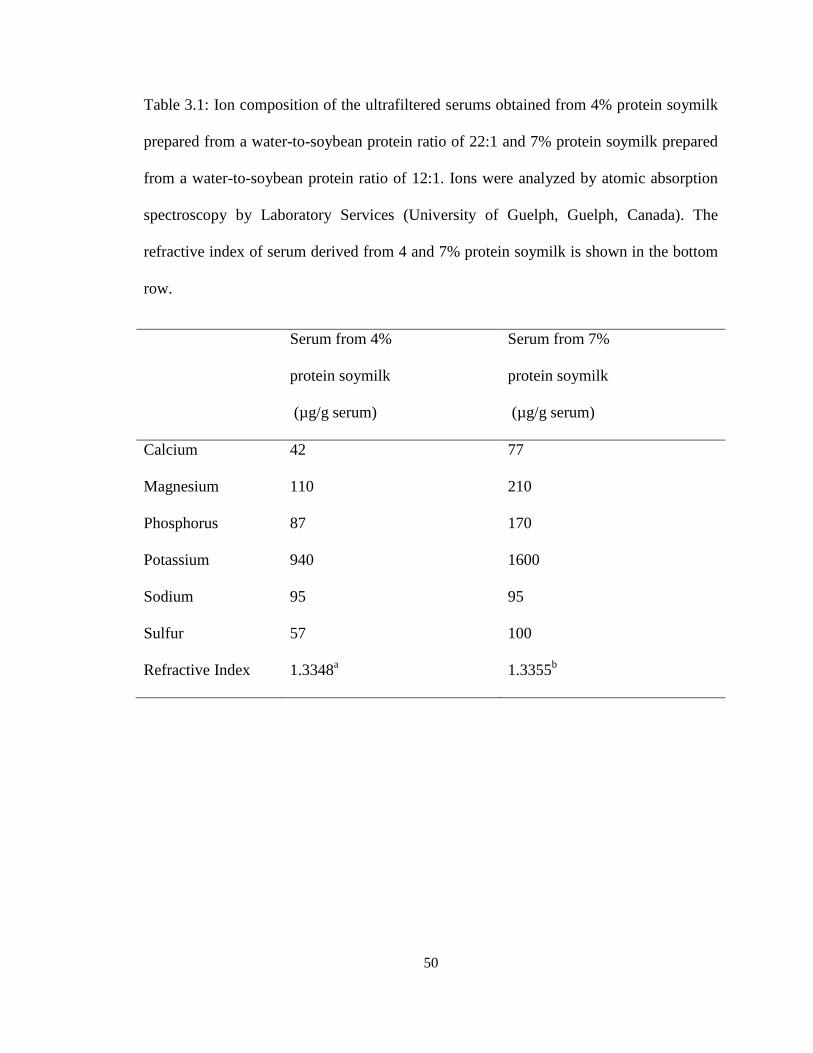
50
Table 3.1: Ion composition of the ultrafiltered serums obtained from 4% protein soymilk
prepared from a water-to-soybean protein ratio of 22:1 and 7% protein soymilk prepared
from a water-to-soybean protein ratio of 12:1. Ions were analyzed by atomic absorption
spectroscopy by Laboratory Services (University of Guelph, Guelph, Canada). The
refractive index of serum derived from 4 and 7% protein soymilk is shown in the bottom
row.
Serum from 4%
protein soymilk
(µg/g serum)
Serum from 7%
protein soymilk
(µg/g serum)
Calcium 42 77
Magnesium 110 210
Phosphorus 87 170
Potassium 940 1600
Sodium 95 95
Sulfur 57 100
Refractive Index 1.3348a 1.3355
b

51
The difference in composition of the protein particles from the two different soymilk
bases clearly indicates that the protein content relative to total solids diminishes when
soymilk is prepared using a lower water-to-bean ratio. The protein subunit composition
of the resuspended protein particles (after centrifugation at 100,000g, resuspension and
centrifugation at 20,000g) is shown in Figure 3.1. Lanes 1 and 3 show the polypeptide
composition of 4 and 7% protein soymilk, respectively, while lanes 2 and 4 show the
composition of the supernatant. Although the protein content of the soymilk particles was
different, all the major soy protein subunits (α, α’, β of conglycinin and acidic and
basic of glycinin) were present in the supernatant from both soymilk bases. This is in
agreement with previous reports (Ono et al., 1991; Malaki Nik et al., 2008; Ren et al.,
2009). These experiments were repeated on the resuspended pellet without the second
centrifugation at 20,000 g and the protein subunit composition obtained was similar to
those shown in Figure 3.1.
To gain further insight into possible structural changes of the proteins present in
4% and 7% protein soymilk, the protein particles from the soymilk were diluted to the
same protein content in phosphate buffer, and subjected to fluorescence measurements; to
test the hypothesis that soymilk samples prepared with a different water-to-bean ratio
have a different protein structural organization. Figure 3.2 illustrates the average intrinsic
fluorescence spectra for the 4 and 7% protein soymilk samples. Table 3.2 shows the
results in terms of the wavelength of maximum intensity (max ) and value of maximum
fluorescence intensity (Imax). Both the max and the Imax were not significantly different
from each other, suggesting high similarities between the protein structures present in
both soymilk preparations.

52
Figure 3.1. SDS-PAGE under reducing conditions of soymilk samples and their
corresponding supernatant after 20,000 g (see methods) (1) 4% soymilk, (2) 4%
supernatant, (3) 7% soymilk, (4) 7% supernatant. Lane 5 shows the molecular mass
markers. All samples were loaded at the same protein content of 20 g per well.

53
Figure 3.2. Fluorescence spectrum derived from particles of 4% (filled circles) and 7%
(open squares) protein soymilk samples diluted in phosphate buffer (pH 7). The data
shows the fluorescence intensity as a function of wavelength. Error bars represent the
standard deviation from three replicates.
Wavelength (nm)
280 300 320 340 360 380 400 420
Flu
ore
sce
nce
in
ten
sity (
a.u
.)
0.00
0.02
0.04
0.06
0.08
0.10

54
Table 3.2. Experimental values of the fluorescence spectrum and surface hydrophobicity
using ANS as a probe, of diluted 4% and 7% soymilk samples in phosphate buffer (pH
7). Within a row, values with different superscripts are significantly different (p<0.05).
4% protein soymilk 7% protein soymilk
Intrinsic Fluorescence
max (nm) 334a 334
a
Imax (nm) 0.0727a 0.0855
a
Surface Hydrophobicity
Fmax 22092a 19877
a
Kdapp
(mol ANS) 54.2a 60.3
a
PSH 411a 332
a

55
Given that previous authors (Utsumi et al., 1984; Ono et al., 1991; Ono et al., 1993;
Lakshmanan et al., 2006; Malaki Nik et al., 2008; Shimoyamada et al., 2008)
hypothesized that soymilk protein particles are formed through the dissociation and
subsequent rearrangement of protein subunits during heating, the fluorescence results
obtained suggest that the water-to-bean ratio used during extraction and heating of
soymilk had no effect on the arrangement of protein particles and that soybean proteins
were present in a somewhat similar conformation in soymilk.
To further determine if different protein arrangements may be present in the
protein particles from soymilk with different protein concentration, surface
hydrophobicity was measured by titration using the hydrophobic probe ANS. The
titration results (Table 3.2) confirmed the conclusions derived from intrinsic fluorescence
measurements, as there were no significant differences between the affinity of the protein
particles (Kd values) from 4 and 7% protein soymilk samples. ANS binding to protein
hydrophobic regions relies on their respective degree of exposure, which is dependent on
protein structure and conformation. Hence, this would suggest that different water-to-
bean ratios used to prepare soymilk yielded particles with similar overall surface
hydrophobicity.
The size or overall charge of the soymilk particles varied with soymilk preparation
conditions (water-to-bean ratios) as shown in Table 3.3. The apparent hydrodynamic
radius and the -potential were measured after dilution of the soymilk samples containing
4 and 7% protein in buffer (for size) or their respective sera (for charge measurements)
using DLS.
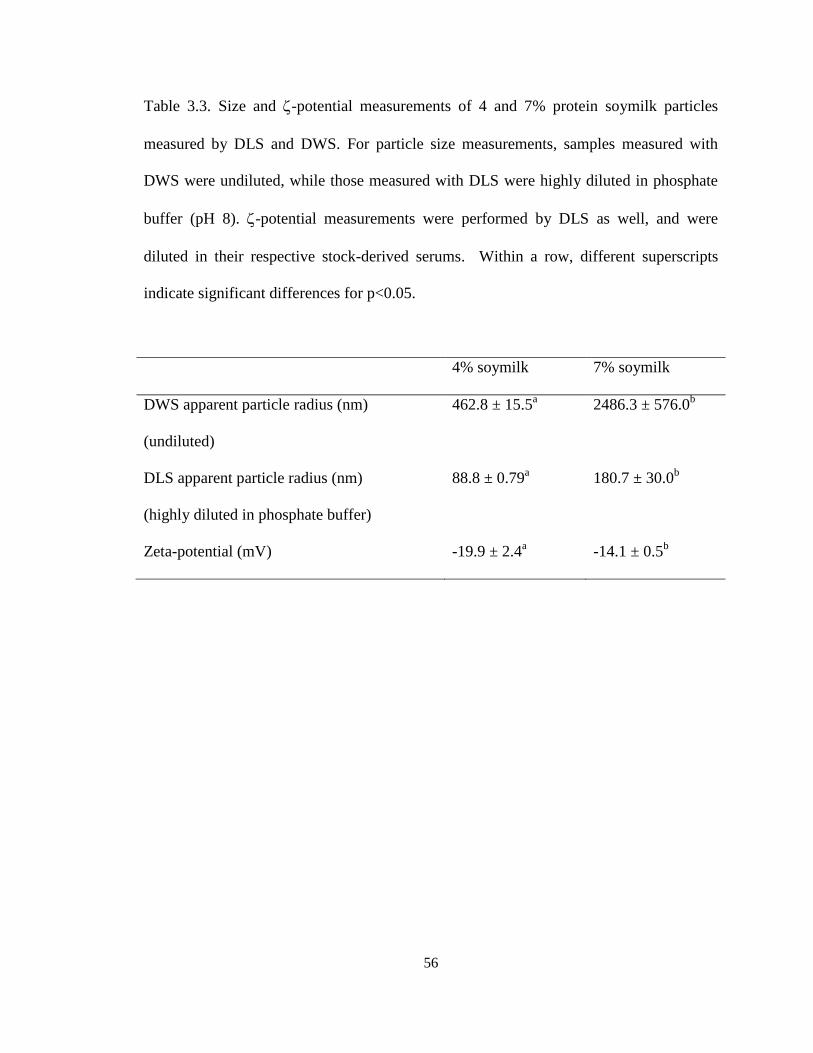
56
Table 3.3. Size and -potential measurements of 4 and 7% protein soymilk particles
measured by DLS and DWS. For particle size measurements, samples measured with
DWS were undiluted, while those measured with DLS were highly diluted in phosphate
buffer (pH 8). -potential measurements were performed by DLS as well, and were
diluted in their respective stock-derived serums. Within a row, different superscripts
indicate significant differences for p<0.05.
4% soymilk 7% soymilk
DWS apparent particle radius (nm)
(undiluted)
462.8 ± 15.5a 2486.3 ± 576.0
b
DLS apparent particle radius (nm)
(highly diluted in phosphate buffer)
88.8 ± 0.79a 180.7 ± 30.0
b
Zeta-potential (mV) -19.9 ± 2.4a -14.1 ± 0.5
b

57
Table 3.3 summarizes the results, and compares the values of apparent size measured by
DLS with those of apparent particle size of undiluted soymilk samples measured by
diffusing wave spectroscopy (DWS). When the soymilk particles were measured
undiluted using DWS, they appeared larger than those measured after extensive dilution
in phosphate buffer (see DLS results). The discrepancy between the results of the two
measurements could arise from a number of reasons. DWS and DLS have different
weighting averages due to the nature of the scattering measurements. Furthermore, the
high dilution of the samples (~10,000 times) necessary in DLS measurements caused
changes in the mobility of the particles. It has yet to be established whether high dilution
causes disruption of the soymilk particles. Finally, hydrodynamic effects due to
concentration must be taken into account when dealing with concentrated samples (as
those measured by DWS). The theoretical model to correct for this effect is well-known,
but dependent on volume fraction. Unfortunately, there is no current knowledge of the
mass-to-volume ratio of soymilk particles, and this made the transformation of protein
weight into protein volume fraction not possible.
The particle size measured with both techniques showed statistically significant
differences depending on the water-to-bean ratio employed in the preparation of soymilk.
The DWS measurement of the undiluted 7% protein soymilk yielded an average particle
size of 2.5 m, in contrast to the 0.46 m for the 4% protein soymilk. It was clear that
protein concentration in the soymilk base had a significant impact on particle size, and
maybe stability, colloidal and processing behaviour of the soymilk particles.
The value of the -potential for the 4% protein soymilk was significantly higher
than that of the 7% protein soymilk (Table 3.3); however, this difference could be

58
partially attributed to the differences in the composition of the serum phase, with the 7%
serum having higher ions in solution and therefore higher charge dispersion.
Nevertheless, it is important to note that both potentials were close in value and in both
cases the particles were not sufficiently charged to impart full electrostatic stability
(Dickinson, 1992).
To elucidate any possible microstructural differences, SEM was carried out on the
soymilk samples containing 4 and 7% protein (Figure 3.3). Micrographs shown are
representative of 30 and 50 micrographs captured of 4 and 7% protein soymilk samples,
respectively. The self assembled monolayer method used to prepare the samples for
imaging ensured that only protein particles were covalently bound to the carbon planchet,
as a rinsing step was included to remove non-protein unbound material. In addition, this
method minimized possible artefacts due to surface denaturation, as it prevented direct
binding to a solid surface (Wadu-Mesthrige et al., 2000).
As seen in Figure 3.3, particles derived from different water-to-bean ratios appear
to have similar aggregate-like structures, which have no overall specific shape or size,
and clearly do not appear to be spherical. Although 4% protein soymilk showed large
aggregates similar to those observed in 7% protein soymilk, the 4% protein samples had a
higher presence of small, possibly non-aggregated particles attached to the planchets.
DLS results showed a high polydispersity index for both 4% and 7% protein soymilk,
also indicating that soymilk particle size distribution is not monomodal. Particles also
appeared to be much larger than the sizes reported by light scattering, for both 4 and 7%
protein soymilk samples. This was probably due to the fact that microscopy results are
weighed towards the larger, more visible particles.

59
Figure 3.3. Scanning electron microscopy images of 4% protein soymilk (A, B) and 7%
protein soymilk (C, D).

60
Cryo-TEM microscopy images of 4% protein soymilk samples are also shown in
Figure 3.4. Soymilk particles appear to be present as large aggregated structures, with an
almost ―chain-like‖ morphology. Some lipid globules are also visible as lighter shaded
circles of about 200 nm size, and they did not seem to be associated with particle
aggregates. The protein aggregates seemed to be about 30% larger when compared to
sizes obtained from DWS (Table 3.2).
In general, it was possible to conclude that although the composition of soymilk
particles (see SDS-PAGE and fluorescence measurements) may not be different between
particles of soymilk made from different water-to-protein ratios, their relative protein
content varied significantly; soymilk particles from 4% protein soymilk contained
significantly more protein. In addition, light scattering measurements showed significant
differences in particle sizes. The lower water-to-bean ratio produced larger particles than
the more dilute soymilk base. The serum composition of these same samples showed the
same type of species, namely minerals; however the 7% protein soymilk produced a
higher number of species, which may help explain the slightly lower magnitude of -
potential observed for that sample.
The effect of protein concentration on the colloidal properties of the soymilk base
is of major significance in food processing, as the aggregation state of the soymilk
particles will influence their stability and processing functionality. For this reason, to
better understand the colloidal behaviour of the soymilk particles prepared with different
water-to-bean ratio, further experiments were performed, where the different soymilk
bases (4, 5 and 7% protein soymilk) were studied after diluting them serially in their own
serum.

61
Figure 3.4. Cryogenic transmission electron microscopy images of 4% protein soymilk.
P: soymilk particle, I: ice crystals, L: lipids. Bar size 200 nm.

62
3.4.2. Effect of serial dilution on 4, 5, 7% protein soymilk
Due to the seemingly direct dependence between soymilk concentration and
particle size, serial dilutions of soymilk samples prepared at different initial protein
concentrations were studied, 4, 5 and 7% (w/v). It was hypothesized that soymilk
particles made from a different water-to-bean ratio would behave differently dynamically
when diluted, due to their apparent differences in size as observed by light scattering.
Figure 3.5 shows the relation between total solids and protein content of the three
soymilk bases, diluted in their own serum. All soymilk samples showed a linear relation
between the amount of protein and the total solid content. This is in agreement with
previous literature (Min et al., 2005; Malaki Nik et al., 2008). Furthermore, though the
slopes of all three curves were similar, the total solids of the 7% protein soymilk (for a
given protein content) were consistently higher than those of 4 and 5% protein soymilk.
This confirms earlier findings that particles in the 7% protein soymilk contain a lower
ratio of protein to total solids (78%) compared to the ones from 4% protein soymilk
(93%).
Figure 3.6 shows the values of refractive index as a function of protein content,
measured as a function of dilution from the three soymilk bases, containing 4%, 5% and
7% protein. The measured values of refractive index of the corresponding sera prepared
by ultrafiltration (free of protein) are also plotted in the figure (open circles, at 0%
protein). Samples of soymilk containing 4% and 5% protein showed a similar trend with
a linear increase of the index of refraction with increasing protein content.

63
Figure 3.5. Total solids content as a function of protein content of 4% protein soymilk
(filled circles), 5% protein soymilk (open triangles) and 7% protein soymilk (filled
squares) diluted in their respective serum prepared by ultrafiltration. Data points
represent single measurements of three replicates.
Protein content (g/mL)
0.01 0.02 0.03 0.04 0.05 0.06 0.07
Tota
l solid
s (
g/m
L)
0.02
0.04
0.06
0.08
0.10
0.12
0.14
64
Figure 3.6 Refractive index of 4% protein soymilk (filled circles), 5% protein soymilk
(open triangles) and 7% protein soymilk (filled squares) diluted in their stock-derived
serum. Data points represent single measurements of three replicates. Note the point at 0
g/mL protein, corresponding to the refractive index of the serum prepared by
ultrafiltration from the different soymilk samples.
Protein content (g/mL)
0.00 0.01 0.02 0.03 0.04 0.05 0.06 0.07
Re
fra
ctive
in
de
x
1.332
1.336
1.340
1.344
1.348
1.352
1.356

65
The refractive index values originating from the two soymilk bases at similar protein
content clearly overlapped, consistent with the notion that the amount of matter present in
the system drives the change in refractive index values. Also, and as reported in Table
3.1, the refractive index of the serum phase was close to that of water, indicating that the
change in the effective refractive index of soymilk was mainly caused by the dispersed
phase, and thus was proportional to the protein concentration in the soymilk.
Consistent with the results of total solids (Figure 3.5), the values of refractive
index for the dilutions of the 7% protein soymilk also lay well above those of the other
two soymilk samples, even in the overlap region where the protein concentration of the
soymilk samples was equal. Since the nature and origin of the particles was similar (see
above), and the refractive index of the serum itself (Table 3.1) could not account for such
difference, it is possible to hypothesize that the higher refractive index in the soymilk
base prepared with less water indicated the presence of denser particles (i.e. less
hydrated) than in the soymilk base prepared with 4 or 5% protein. It is also possible to
assume that the refractive index differences could be partly due to the different nature of
the particles as the protein-to-solids ratio in the 7% soymilk base samples was lower.
The changes in the optical properties of the soymilk particles as a function of
concentration were determined using DWS. Figure 3.7 shows the changes in turbidity (A)
and diffusion coefficient (B), for the 4, 5 and 7% protein soymilk, all diluted in their
respective sera. The behaviour of the turbidity parameter (1/l*) showed two fairly distinct
regions (Figure 3.7A).

66
Figure 3.7. (A) photon transport mean free path, 1/l*, and (B) diffusion coefficient of 4%
protein soymilk (filled circles), 5% protein soymilk (open triangles) and 7% protein
soymilk (filled squares) diluted in their stock-derived serum. Data points represent single
measurements of three replicates.
Protein content (g/mL)
0.02 0.04 0.06
Diffu
sio
n c
oe
ffic
ien
t (x
10
-13
m2
/s)
0
2
4
6
1/l*
(mm
-1)
0
2
4
6
8
10A
B

67
The soymilk particles in 4% and 5% protein soymilk yielded similar 1/l* values as a
function of dilution, while the 1/l* parameter for the 7% protein soymilk particles was
well above the others, and showed a different dependence with concentration (with a
higher slope). In general, the turbidity for the soymilk bases containing 4% and 5%
protein increased in value in the range between 0.03 mg/mL and 0.045 mg/mL protein
(this difference was statistically significant for p<0.05). The increase in the 1/l* value
reflects the fact that, as the system became more concentrated, more scattering events
occur in the same scattering volume resulting in shorter decorrelation lengths. While the
soymilk base samples with 4 and 5% protein showed the same behaviour as a function of
concentration of protein, the soymilk base prepared with 7% protein diverged noticeably.
It could be possible to calculate the expected behaviour of turbidity from theory for a
colloidal hard-sphere model (Weitz et al., 1993) and compare this to the bulk behaviour
of soymilk particles; however, this would require knowledge of the volume fraction
occupied by the particles which is not currently known.
Using DWS it was also possible to determine changes in the mobility of the
particles (diffusion coefficient) as a function of their protein concentration (Figure 3.7B).
Overall, the diffusion coefficient decreased with increasing protein concentration. In
agreement with the turbidity data, the soymilk particles in the 4 and 5% protein soymilk
base showed similar particle diffusion behaviour, while those in the 7% protein soymilk
base showed a rather dramatic decrease in the diffusion coefficient, both at the high
protein concentrations and even when diluted to the same protein content as the 4 and 5%
protein base samples. The soymilk particles prepared from the high protein (7%) base had
a much lower diffusion coefficient compared to the particles prepared from 4% and 5%

68
protein soymilk. This could be a product of the differences in protein content and hence
optical properties of the soymilk particles, as discussed earlier.
It is important to note at this time, that the correlation functions (or raw data) from
which these data were extracted showed free-diffusing motion of the particles. This
means the values shown are the true short-time self-diffusion coefficients for the particles
present in the various soymilk bases. However, the values of diffusion coefficient have
not been corrected for crowding effects, and, given the high protein contents of samples
investigated in this work, this might play an important role in determining differences in
self diffusion values. The dynamic behaviour of the soymilk particles could also be
compared to the Beenakker–Mazur (Beenakker and Mazur., 1983) calculations of the
theoretical, normalized self-diffusion coefficient for hard spheres (non-compressible,
uncharged and monodisperse); however these calculations necessitate knowledge of
volume fraction, and as explained above, no previous reports on the volume occupied by
a soymilk particle in soymilk are available in the literature.
The effect of protein concentration of the bulk viscosity of the different soymilk
bases can also give indications of the colloidal behaviour of the soymilk particles. Results
of viscosity measurements of diluted soymilk (Figure 3.8) show that, under steady flow
conditions, the viscosity increased with increasing concentration of the particles in
solution. This is expected, and is in agreement with previous work (Forster and Ferrier,
1979). Unlike the light scattering measurements, the changes of viscosity with protein
concentration were independent of the protein concentration of the original stock
solution, as all the results superimposed on one another. This is important, as it may

69
suggest a shear dependence of the colloidal state of the particles, as this was not the case
for quiescent light scattering measurements (see Figure 3.7).
Figure 3.8. Viscosity of soymilk samples measured at 100 s-1
for 4% protein soymilk
(filled circles), 5% protein soymilk (open triangles) and 7% protein soymilk (filled
squares) diluted in water. Data points represent the average of three independent
experiments, bars represent standard deviations.
Protein content (g/mL)
0.00 0.02 0.04 0.06 0.08
(
x 1
0-3
Pa s
)
0
4
8
12
16
20

70
The shape of the curve is reminiscent of those obtained for other colloidal systems, such
as for example, milk (Griffin et al., 1989). In the case of the dependence of viscosity with
concentration in milk, the semi-empirical model known as the Eilers model (Eilers, 1941)
is able to reproduce and predict the viscosity behaviour of fresh skim bovine milk as a
function of the volume fraction. However, knowledge of the volume occupied by the
particles would be necessary to apply any models to predict the behaviour of soymilk
particles and, as already mentioned, this is not known at the moment.
3.4.3. Comparison of experimental data with theoretical models
As mentioned above, the interpretation of the behaviour of the soymilk particles
in terms of theoretical models requires the conversion of mass-to-volume of the soymilk
protein particles. Such conversion is currently unknown and not available in literature.
For this reason, the factor (sometimes known as voluminosity) by which the particle mass
can be translated to volume, was derived from an evaluation of the experimental data
obtained from independent methods. This allowed for interpretation of the general bulk
property behaviour of soymilk particles in solution, and a comparison of this behaviour
with those of well-known colloidal systems.
In view of the different protein-to-solid content ratio of particles in the 7%
soymilk, as well as the different concentration dependence of refractive index, turbidity
and diffusivity, it was decided to focus on the data derived from 4% and 5% protein
soymilk alone.
The initial calculations were taken from the refractive index results shown in
Figure 3.6. It is known that the index of refraction of a dispersion can be written as a

71
relation between the refractive index of the solvent and of the solute, using a suitable
―mixture rule‖ as follows (Heller, 1965):
)()( 22exp
2
serumserumparticleparticle nnn [3.4]
where nexp is the experimentally-obtained index of refraction of the colloidal mixture,
nserum = 1.3352 and nparticle are the indices of refraction of the serum and soymilk particles
respectively, and serum and particle are their respective volume fractions. The volume
fraction of the particles is simply the concentration of protein (in mass/volume)
multiplied by a constant parameter (usually called ―voluminosity‖, V). Knowing all this,
Equation [3.4] can be re-written as:
)1()( 22exp
2
particleserumparticleparticle VCnVCnn
[3.5]
where Cparticle is the protein content of the solution (in g/mL) and V is the voluminosity of
the soymilk particles (in mL/g). The factor (1-V Cparticle) represents the space occupied by
the serum (space unoccupied by the particles) and it is, therefore, the volume fraction
corresponding to the serum phase.
Equation 3.4 has two unknown parameters (nparticle and the voluminosity,
parameter V). There are, therefore, infinite numbers of paired values that satisfy the
conditions given by this equation. However, for a given index of refraction of the
particles, there is one, and only one, possible associated volume fraction. This pair-
solution would be of critical importance for the calculations below.
There is a second possible theoretical model fit that can be performed on the
turbidity data which were collected by DWS. It is that shown in Equation [3.2] for the
1/l* results shown in Figure 3.7. To solve this equation, several input values are needed,

72
such as: the refractive index of the serum as well as the size, refractive index and volume
fraction of the particles. As clearly concluded above, the refractive index and volume
fraction of the particles are still unknown at this point; however, and most importantly,
they are now paired and unequivocally related by means of the fit to Equation [3.5].
Therefore, for a given paired value generated by this equation, the parameter V was
multiplied by the protein content to generate the volume fraction of the particles needed
for Equation 3.2, and the corresponding nparticle generated by the fit was also used as input
in the equation.
A theoretical curve for 1/l* was then generated for a colloidal hard-sphere model,
applying the Percus–Yevick closure relation (Hansen and McDonald., 1986) for the
calculation of the structure factor S(q) coupled with Mie calculations for the scattering
function F(q). The other experimental parameters used were nserum = 1.3352 (obtained
from the best-fit line of the curves shown in Figure 3.6) and particle size Rparticle = 0.425
m (obtained by averaging the first 25 points of Figure 3.7B and converting the diffusion
coefficients to radii by means of the Stokes-Einstein transformation). Numerous pairs
were tested using Equation 3.4 until the best fit to the values shown in Figure 3.7A was
obtained. The results of this fit are shown in Figure 3.9A (solid line), plotted as the 1/l*
parameter as a function of volume fraction of soymilk particles in solution. The data is
the same as those shown in Figure 3.7A (but plotted against volume fraction this time).
The best-fit parameters obtained were nparticle = 1.388 with a V value of 4.11 mL/g. The
lower and upper limits were calculated as nparticle = 1.383 and 1.392 and V = 4.55 and 3.81
mL/g, respectively (dotted lines).
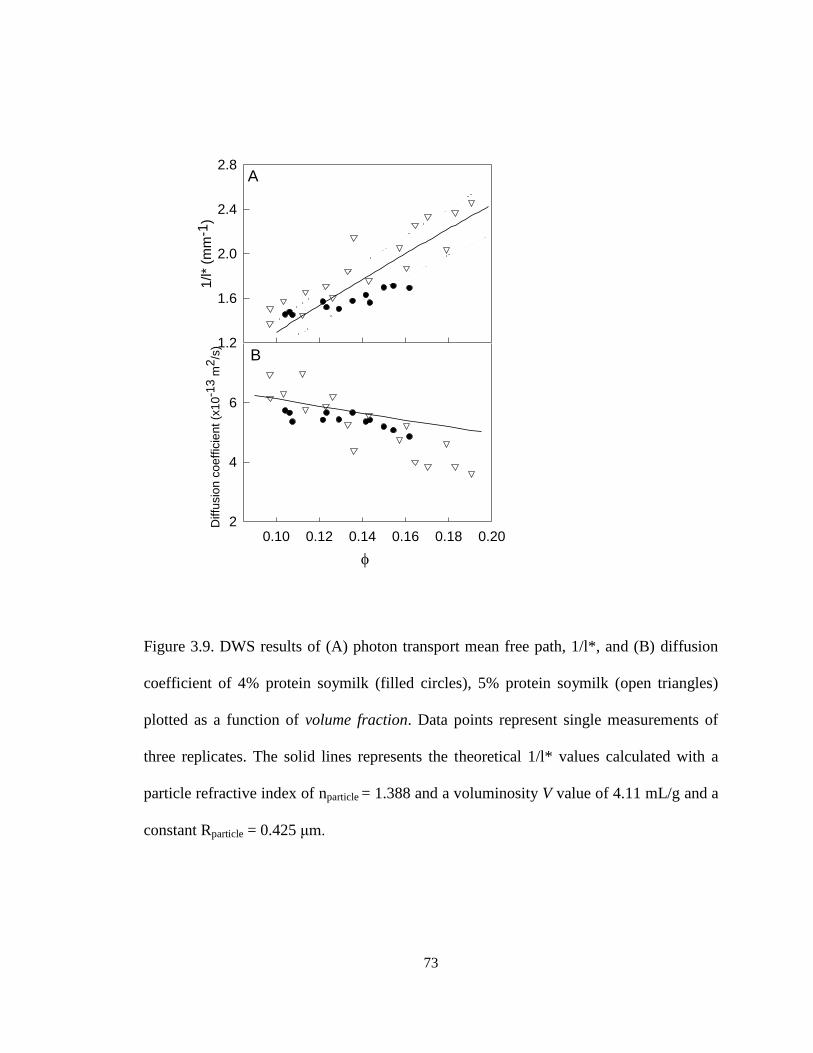
73
Figure 3.9. DWS results of (A) photon transport mean free path, 1/l*, and (B) diffusion
coefficient of 4% protein soymilk (filled circles), 5% protein soymilk (open triangles)
plotted as a function of volume fraction. Data points represent single measurements of
three replicates. The solid lines represents the theoretical 1/l* values calculated with a
particle refractive index of nparticle = 1.388 and a voluminosity V value of 4.11 mL/g and a
constant Rparticle = 0.425 μm.
1/l*
(mm
-1)
1.2
1.6
2.0
2.4
2.8A
0.10 0.12 0.14 0.16 0.18 0.20
Diffu
sio
n c
oe
ffic
ien
t (x
10-1
3 m
2/s
)
2
4
6
B

74
These results are extremely interesting on three accounts. First, by employing two
independent and different measuring methods (refractometry and DWS) it was possible
to find a set of solutions which satisfied both model systems. Secondly, soymilk particles
in bulk seem to follow the overall bulk behaviour of model, monodisperse spheres. The
fit seen in Figure 3.9A is relatively good considering the complexity of the soymilk and
the far-from-model system of soymilk particles, particularly considering a sphere-
equivalent value was used for size, knowing that soymilk particles are far from spherical
(as shown in the microscopy data). Thirdly, the values obtained for refractive index and
voluminosities of the particles are comparable to those of other well known colloidal
protein particles, for example, casein micelles in milk (RImicelle=1.39-1.40 and
voluminosity=3.5-4.5 mL/g) (Holt and Hukins, 1991; Alexander et al., 2002). It is known
that casein micelles are highly hydrated structures, while soy proteins are thought to be
globular and less hydrated. The microscopy data showed that soy particles indeed are not
spherical, and so the high degree of particle hydration could be partially attributed to the
sphere-equivalent assumption used in our calculations. Also noteworthy is the fact that all
the data obtained from the two different stock solutions, namely 4% and 5% soymilk,
could be fitted using a constant value of the radius.
Figure 3.9B shows the normalized diffusion coefficients (same data as Figure
3.7B) also plotted as a function of volume fraction. Superimposed is the normalized self-
diffusion coefficient for hard spheres of constant size, calculated using the Beenakker–
Mazur formulation (Beenakker and Mazur, 1983) which corrects for hydrodynamic
effects. The normalization was performed assuming that a chosen soymilk particle at
10% volume fraction followed the hard sphere model theory. From this graph it becomes

75
clear that, dynamically, the soymilk particles derived from the 4 and 5% protein base did
not follow the behaviour of perfect hard spheres above a volume fraction of about 15%,
since the experimental values deviated from theory. This behaviour tends to indicate that
at a given volume fraction, the diffusion coefficient measured by DWS was lower than
that of theory, suggesting that the particles ―dragged‖ more in solution (move more
slowly) at the higher volume fractions. It is not clear at this moment what the origin of
this deviation is, although the microscopy images shown in Figures 3.3 and 3.4 may
suggest that it could be due to the ―chain-like‖ morphology of the soymilk particles. The
diffusion of the soymilk particles could be mimicked using a sphere-equivalent radius
only in the very dilute region of the system. The values of diffusion coefficient of 7%
protein soymilk particles were much smaller than those for 4 and 5% protein soymilk (see
Figure 3.7 B), and hence deviated from theory even more.
Making use of the ability to fit experimental data as a function of volume fraction,
, the viscosity values shown in Figure 3.8 could also be compared to theory. As
mentioned before, the semi-empirical Eilers formulation (Eilers, 1941) was used.
2
1
25.11
c
[6]
where c is the close-packing for hard spheres and viscosity is The dotted line in
Figure 3.10 shows the theoretical curve generated using Equation 3.6.
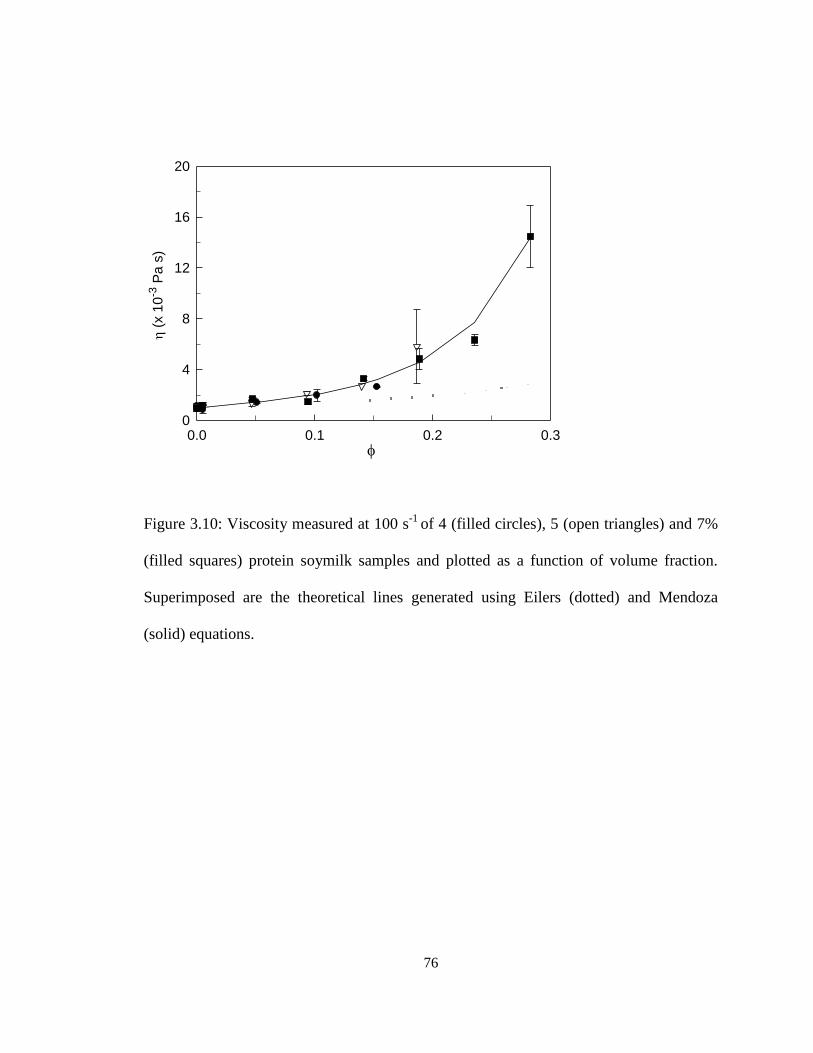
76
Figure 3.10: Viscosity measured at 100 s-1
of 4 (filled circles), 5 (open triangles) and 7%
(filled squares) protein soymilk samples and plotted as a function of volume fraction.
Superimposed are the theoretical lines generated using Eilers (dotted) and Mendoza
(solid) equations.
0.0 0.1 0.2 0.3
(
x 1
0-3
Pa
s)
0
4
8
12
16
20

77
The Eilers semi-empirical model, derived to accurately predict the viscosity behaviour of
perfect spheres in the low concentration regime was not able to reproduce the
experimentally obtained results. This was in contrast to results reported for milk systems,
where casein micelles can be assumed to behave as perfect hard spheres, and the Eilers
equation is a well established method to predict viscosity with volume fraction. However,
the Eiler’s semi-empirical equation might not be a realistic calculation of volume effects
which, as shown in Figure 3.9B, are very important in this system for volume fractions
above 15%.
Recently, a model was derived for the calculation of viscosities of concentrated
suspensions taking into account both hydrodynamic and excluded-volume effects. This
model extends the viscosity-concentration relation not only for spherical particles, but
also for other particle shapes (given they are not too elongated) (Mendoza and
Santamaria-Holek., 2009). The relation is shown in Equation 3.7:
][
11
co [3.7]
where o is the viscosity of the system at 0 shear, [] is the low-filling fraction intrinsic
viscosity of the system and c is the crowding factor defined as
c
cc
1 [3.8]
This factor takes into account the fact that the particles cannot occupy 100% of the
volume of the system due to geometrical restrictions. The value of the intrinsic viscosity
(a measure of the solute’s contribution to the viscosity of a solution) has been
theoretically determined for a large number of geometries (Mendoza and Santamaria-
78
Holek, 2009) and can have values ranging between 2.5 and 30 or more (a value of 2.5
was obtained by Einstein (Einstein, 1956) for spherical uncharged particles). The value of
c, on the other hand, has been calculated as ~0.65 for random close-packing of spheres,
but can also have different values depending on the geometry of the filling particles.
The solid line in Figure 3.10 shows the best-fit curve to the experimental values.
The resulting values for this fit were c = 0.58 and [] = 6.1. Similar calculations
performed for ellipsoids, which assume a length four times their width, yielded values of
c = 0.53 and [] = 5.3. It would be premature to conclude from this fit that soymilk
particles are shaped as such (ellipsoid), especially due to the polydispersity of particle
size and many-component nature of the system; however, obtaining such extremely
acceptable fits which yielded values similar to a model system, is highly reassuring. It is
important at this point to clarify that the parameters obtained in this fit, which are
relatively consistent with those of an ellipsoid, are not in conflict with those obtained for
a sphere-like system for the turbidity (Figure 3.9A). The viscosity models are
independent of size, and it is always possible to find a sphere-like radius for any given
geometrical shape.
The normalized dynamic electrophoretic mobility of soymilk particles collected
from electroacoustic spectroscopy measurement was also plotted as a function of the
newly derived volume fraction, along with the dynamic mobility of Ludox silica spheres,
in Figure 3.11.
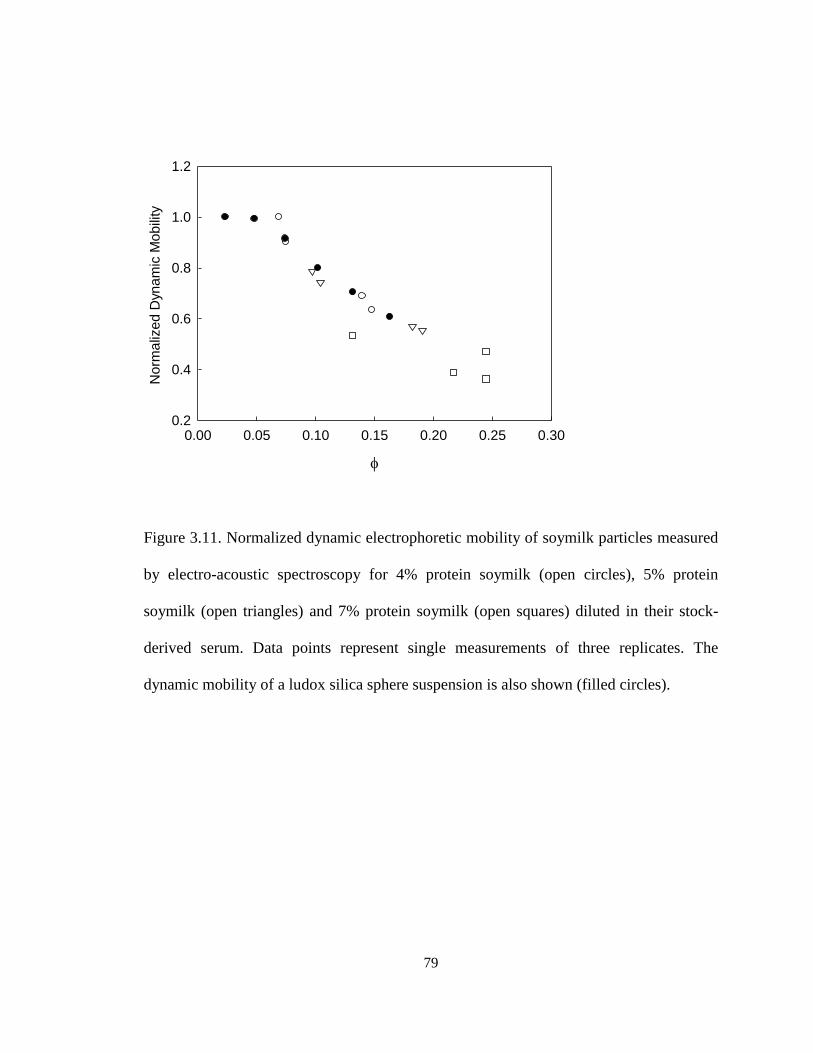
79
Figure 3.11. Normalized dynamic electrophoretic mobility of soymilk particles measured
by electro-acoustic spectroscopy for 4% protein soymilk (open circles), 5% protein
soymilk (open triangles) and 7% protein soymilk (open squares) diluted in their stock-
derived serum. Data points represent single measurements of three replicates. The
dynamic mobility of a ludox silica sphere suspension is also shown (filled circles).
0.00 0.05 0.10 0.15 0.20 0.25 0.30
Norm
aliz
ed D
ynam
ic M
obili
ty
0.2
0.4
0.6
0.8
1.0
1.2

80
Equation 3.3 relates the ultrasound CVI with the electrophoretic mobility via
density and surface conductivity (through F(Z)) of the particles. Unfortunately, these are
unknown parameters in soymilk but furthermore, the dependence (if any) between them
and volume fraction is also unknown. On the other hand, it is well known that silica
particles are a hard sphere model system of constant density and surface charge as a
function of concentration (Dukhin and Goetz, 2002). For this reason, the behaviour of the
soymilk mobility could be directly compared to the Ludox behaviour (albeit via a
normalization factor).
The normalized dynamic mobility as a function of volume fraction showed a
similar behaviour between the Ludox (hard spheres) silica particles and soymilk particles.
There was a decrease of electrophoretic mobility as a function of volume fraction. The
viscosity of the background of both systems (soymilk and Ludox silica sphere
suspension) was assumed to be equivalent to water. It is important to note that also in
this case, soymilk particles derived from 7% protein soymilk (open squares) showed a
different behaviour compared to 4 and 5% protein soymilk.
With the measurements carried out by electroacoustics (Figure 3.11), further
conclusions can be made on the soymilk particles. Given that the soymilk particles
showed a very similar behaviour to Ludox spheres, and that these standard particles have
constant density throughout the experimental volume fractions probed, it can be
concluded that the density was also constant for the soymilk colloids. These results are of
great importance, and have never been reported before. Furthermore, the data shown in
Figure 3.11 also suggest that the surface charge of the soymilk particles did not change as
a function of concentration. Unfortunately, the need to normalize for comparison did not

81
allow for the determination of an absolute density of the particles, thereby making it
impossible to corroborate the voluminosity value obtained from DWS. Nevertheless,
these results reinforce the validity of the particle voluminosity factor derived from this
study, since the dependence of dynamic mobility on volume fraction for the soymilk
particles matched that of the model systems (Ludox spheres).
3.5. Conclusions
Soymilk was prepared from different water-to-bean ratios to investigate how the
protein concentration of the soymilk base would affect various physical parameters of
soymilk particles and soymilk as a bulk. The composition of soymilk particles was
similar in subunit composition, but varied significantly in protein content. Fluorescence
spectroscopy measurements suggested that similar rearrangements of subunits occurred
in all soymilk particles, independently of the original protein concentration in the soymilk
base. When the optical characteristics of soymilk were investigated further by means of
DWS and refractometry, it was clear that both 4% and 5% protein soymilk samples
behaved similarly, while the 7% protein soymilk showed deviations which may be linked
to a lower hydration of the particles and difference in protein-to-solid content ratio. It
was therefore concluded that when using different ratios of water-to-bean, caution should
be used, as different soymilk particles could be obtained, with obvious consequences to
processing functionality of the soymilk base.
To interpret the data obtained from turbidity, size, viscosity measurements and
dynamic mobility of the soymilk samples as a function volume fraction and compare it to
theoretical models, it was necessary to calculate the voluminosity of soymilk particles.

82
This value (4.11 mL/g) was derived, for the first time, from independent experimental
data. The determination of such an important parameter made it possible to find a
satisfactory theoretical fit for the turbidity (1/l*) parameter and to obtain an index of
refraction of the soymilk particle of 1.388, for a sphere equivalent.
Taking into consideration the lack of homogeneity of the particle size distribution,
the deviation from sphericity and the presence of extraneous material in solution, it is
quite noteworthy that based on hard-sphere analogy only, it was possible to quantitatively
calculate the optical properties of the soymilk particles. Furthermore, the results showed
that soymilk particles create more hydrodynamic drag than those of a hard sphere system,
indication of the lack of the sphericity of the particles. These results were further
confirmed with the drastic increase in viscosity at volume fractions much smaller than
those predicted for hard spheres, as fitting parameters were closer to those of ellipsoids.
The dependence of dynamic mobility measured by electroacoustics with volume fraction
also lead to the conclusion that the density and surface charge of the soymilk particles
was constant up to 25% volume fractions, and gave further validity to the voluminosity
found by DWS.
The new information presented in this work opens the door for future
comparisons of experimentally-obtained results to various theoretical models.
83
Chapter 4:
Effect of concentration and temperature on the acid induced aggregation of
soymilk
4.1. Abstract
The molecular details of the aggregation of soy protein particles in soymilk during
acid-induced gelation using glucono-delta-lactone (GDL) were investigated. Soymilk
samples were prepared from different water-to-bean ratios and contained approximately
4% and 7% protein. The effects of protein concentration and incubation temperature on
soymilk gelation were observed using rheology and diffusing wave spectroscopy (DWS)
at two different GDL concentrations. During acidification, there was a small decrease in
electrostatic repulsion between particles due to decreasing pH, which was correlated with
the pH of particle aggregation determined by dynamic light scattering. Gelation of
soymilk occurred at about pH 5.8, and the rate of acidification was found to have no
effect on the gelation pH and gel stiffness. A detailed study of the soluble fraction during
the preceding stages of aggregation clearly demonstrated that glycinin components were
the first to destabilize during acidification, followed by the -conglycinin subunits. The
pH of gelation was not affected by protein concentration. On the other hand, decreasing
the incubation temperature from 30oC to 7
oC increased the pH of gelation and the
modulus (G’) measured by rheology, suggesting that hydrogen bonding likely plays a
major role in the formation of the gel structure in soymilk curd.
84
4.2. Introduction
Soybean curd (Tofu) products are one of the most important and popular foods in
East and South Eastern Asian countries, providing an important dietary source of protein
and lipids. It is essentially a protein gel made by addition of coagulant to heat-treated
soymilk. When the soy protein particles in soymilk aggregate, they trap water, lipids,
carbohydrates and other components found in soymilk (Poysa and Woodrow, 2002). The
resulting textural properties of soymilk gels are dependent on several factors, such as the
type and concentration of coagulant used, the soybean variety used, the protein profile,
soybean quality, soymilk total solids concentration as well as the soymilk processing
conditions (Poysa et al., 2006; Cai and Chang, 1998; 1999). Little is understood at the
molecular scale about particle interactions and the forces driving gel network formation.
A better understanding of the gelling behaviour of soymilk would allow for better process
design, more predictable production, better quality control, and ameliorated product
quality.
Soymilk is a colloidal suspension with a composition of about 3.6% protein, 2.9%
carbohydrate, 2.0% fat and 0.5% ash (Liu, 1997). The two main soy protein fractions
include glycinin and -conglycinin, which together account for over 70% of the total
protein. Glycinin is a heterogeneous hexamer with a molecular weight varying between
320-360 kDa depending on it subunit composition (Nielsen et al., 1989). Each subunit is
composed of an acidic and a basic polypeptide, linked together via disulfide and
hydrogen bonding (Badley et al., 1975). -conglycinin is a heterogeneous trimer with a
molecular weight around 180-210 kDa (Wolf, 1970; Maruyama et al., 2002). The isomers
85
of -conglycinin are a combination of ’ and subunits (Thanh and Shibasaki, 1976;
Maruyama et al., 2002).
Soymilk particles are formed during heat treatment of soymilk through initial
denaturation and dissociation of raw protein aggregates, and subsequent rearrangement
and association of subunits via predominantly electrostatic interactions, hydrophobic
interactions, hydrogen bonding, and some disulfide bridging (Lakshmanan et al., 2006;
Malaki Nik et al., 2008; Shimoyamada et al., 2008; Ren et al., 2009). After heating, over
half of the particles were reported to be >40 nm (Ono et al., 1991), while another
substantial fraction of proteins exists in soluble form, consisting mainly of the and ’
subunits of -conglycinin and the acidic polypeptide of glycinin (Ono et al., 1991; Guo et
al., 1997). The colloidal particles of soymilk contain all of the major soy protein subunits
(Malaki Nik et al., 2008; Ren et al., 2009), and are generally composed of > 80% protein,
depending on the ratio of water-to-bean used to prepare soymilk (Ringgenberg et al.,
2011, submitted). Previous work (see Chapter 3) has demonstrated that different water-
to-soybean ratios used to prepare soymilk produced soymilk particles that differ in some
aspects, namely protein-to-solid content ratio, apparent size, surface charge, refractive
index, and exhibit different dynamic behaviour over a certain volume fraction range
(Ringgenberg et al., 2011, submitted).
Soy protein gelation can be induced by heat alone, or by heat treatment followed
by acidification or addition of a coagulant. While the heat-induced gelation of soy protein
isolates and concentrates has received a considerable amount of attention (Nakamura et
al., 1985; Utsumi and Kinsella, 1985; Nakamura et al., 1986; Wang and Damodaran,
1991; Renkema et al., 2002; Renkema and van Vliet., 2002) much less is understood

86
about the mechanisms at play during heating, and acid or coagulant induced gelation of
soymilk particles. During the past two decades, glucono-delta-lactone (GDL) has been
increasingly used as a coagulant for tofu production, together with the traditionally used
magnesium chloride and calcium sulfate salts (Kohyama and Nishinari, 1993). Soymilk
gels produced with GDL are homogeneous and usually in the pH range of 5.0-5.5
(Kohyama and Nishinari, 1993).
The mechanism of acid induced gelation of soy proteins has been investigated by
several authors, for various soy protein isolates and purified glycinin and -conglycinin
fractions (Saio, 1969; Kohyama et al., 1995a; 1995b; Cai and Chang, 1999). However,
soymilk is a much more complex system and more variables are involved in its gelation
(Liu and Chang, 2004). Nevertheless, it has been proposed that the gel formation of
soymilk is similar to that of soy protein isolate suspensions, as the soy proteins are the
building blocks of the gel network (Ono et al., 1993; Guo and Ono, 2005). Soymilk
gelation has been described as a two-step process: 1) the denaturation of proteins by heat
and subsequent subunits rearrangements to form soluble complexes and 2) acid
neutralization of the negative charges of the denatured proteins causing a decrease in
electrostatic repulsion between protein complexes and subsequent aggregation via
hydrophobic interactions (Kohyama and Nishinari, 1993; Kohyama et al., 1995a; Guo
and Ono, 2005). Several authors suggested that the formation of a network in soymilk
gels results from hydrogen bonding, hydrophobic interaction and ion bridging
(Catsimpoolas and Meyer., 1970; Utsumi and Kinsella, 1985). Disulfide bonding does
not seem to play a critical role in the formation of acidic gels (Utsumi and Kinsella, 1985;
Kohyama et al., 1995a).

87
It is important to note that most of the work previously reported on acid-induced
gelation of soy protein isolate and soymilk is based on observation of textural changes of
the final product (Kohyama et al., 1995a; Kohyama et al., 1995b; Poysa and Woodrow,
2002; Tay and Perera, 2004; Poysa et al., 2006). However, a recent study using diffusing
wave spectroscopy showed that aggregation of soymilk particles during acidification is
sudden, and results from short-ranged interactions (Malaki Nik et al., 2011). A better
understanding of the gelation mechanism of soymilk particles is industrially relevant, as
it will allow for better process design, monitoring and quality control, and potentially
lead to the development of novel soy-based products.
In the present work, the mechanism of acid induced gelation of soymilk was
investigated by monitoring physico-chemical changes occurring preceding the point of
gelation and rheology and DWS techniques were used to observe the initial stages of the
aggregation and the formation of the protein network. Furthermore, the contribution of
hydrophobic interaction in particle aggregation and gel structure formation was
examined, by observing gelation at refrigeration temperature and comparing it gelation at
30ºC. The effect of preparing soymilk of different protein concentration on the gelation
properties was also investigated, as this was previously shown to have an effect on the
nature of the soymilk particles formed (Ringgenberg et al., 2011, submitted).

88
4.3. Materials and Methods
4.3.1. Soymilk preparation
Soymilk was prepared from soybean seeds of the Harovinton variety, which were
obtained from the Greenhouse and Processing Crops Research Centre of Agriculture and
Agri-Food Canada (Harrow, Ontario). MilliQ water (Milli-Q Integral Pure and Ultrapure
water systems, Billerica, MA, USA) was employed to prepare soymilk and solutions, and
reagents were purchased either from Sigma Aldrich (St Louis, MO, USA) or Fisher
Scientific (Mississauga, ON, Canada).
Soymilk was prepared as previously described (Malaki Nik et al., 2011), with
slight modifications. Soybean protein composition was 43.5%, determined by Grainspec
near infra-red spectroscopy (at the laboratories of Agriculture and Agri-Food Canada).
Different ratios of water-to-bean were used to prepare three stock batches of soymilk of
varying protein concentration; ratios of water to soybeans used (based on protein ratio):
22:1, and 12:1, producing 4 and 7% protein soymilk, respectively. Dry soybeans were
weighed and soaked in ultrapure water at room temperature, overnight (approximately 18
h). The soaked beans were then drained and rinsed several times, and reweighed to
determine the amount of water absorbed. The additional water to be added to the beans
was calculated by correcting for the amount of absorbed water (see Chapter 3, section
3.3.1.). Half of the additional water was added to the beans at room temperature (23oC),
and blended at high speed for 3.5 min (commercial blender, WARING, New Hartford,
CT, USA). The remaining water was heated to 60oC and then added to the slurry, which
was blended at high speed for an additional 30 s. A juice extractor (Juiceman,
professional series 211, Korea) was used to remove coarse material (okara, which is

89
mainly insoluble fibre) from the slurry, which was passed through the juice extractor a
second time. Fines were further removed by filtering the slurry through a cheese cloth.
Raw soymilk was then transferred to 20 mL test tubes and placed in a water bath set at
95oC. The tubes were removed after 7 min in the water bath, immediately placed in an ice
water bath, and cooled to room temperature. The heat treated soymilk was then
centrifuged at 8,000 g for 30 min at 20oC (Optima LE-80K Beckman Coulter, Brea, CA,
USA) to further remove large particles and residual fiber (Malaki Nik et al., 2011). The
soymilk was finally filtered through cellulose paper filters (25 m, Fisherbrand, Fisher
Sci.).
4.3.2. Acidification
Two different methods were employed to study the acid-induced changes in
soymilk.
To reach a particular value of pH, in the range from 6.6 to 5.8, soymilk samples
(60 mL) were acidified with various amounts of glucono--latcone GDL (Sigma–
Aldrich) and incubated in a water bath set at 30oC. The pH was recorded at 30 min
intervals, until the pH change was less than 0.02 pH units/30 min. The pH recorded at
equilibrium for the different amounts of GDL was plotted as a function of GDL
concentration for 4% and 7% proteins soymilk samples, independently. A least-squares
regression line was used to obtain the relation between GDL concentration and
equilibrium pH, and the relation was used to determine the amount of GDL needed to
reach a target pH. Soymilk samples were then incubated for 5 h at 30oC to reach pH
values ranging from 6.6. to 5.8, to be able to study the physico-chemical properties of the

90
soymilk particles at the various pH values preceding gelation. After incubation, size and
-potential of the soymilk particles was analyzed and the soymilk was centrifuged at
100,000 g for 30 min at 20oC (Type 70 Ti Rotor, Optima LE-80K Beckman Coulter,
Brea, CA, USA) to obtain a soluble fraction, which was then subjected to gel
electrophoresis (as described below.)
For gelation experiments, GDL was directly added to soymilk samples for
acidification, at concentrations of 1.6% and 0.8% w/v. Soymilk samples (60 mL) (4 and
7% protein) were incubated in a water bath set at 30°C for at least 30 min prior to
acidification to ensure temperature equilibrium. Samples were stirred for 30 s, after
which portions were divided for simultaneous experiments; acidification was followed as
a function of time, using rheology and DWS. In this case, the pH was also monitored
continuously using a pH meter (Accumet Research AR 15, Fisher Sci.).
4.3.3. Gel Electrophoresis
The supernatants of the acidified 4 and 7% protein soymilk samples prepared at
different pH were subjected to Sodium Dodecyl Sulfate-Polyacrylamide Gel
Electrophoresis (SDS-PAGE). The modified Lowry assay method (DC Protein Assay,
Bio-Rad, Hercules, CA, USA) was used to determine the protein content of the
supernatants. Extraction buffer and aliquots of supernatant were mixed and incubated at
room temperature for 1 h, after which electrophoresis buffer was added, bringing the final
extracted sample volume to 600 L, with a protein concentration of 0.286g/100 mL. The
extraction buffer consisted of 50 mM Tris-HCl, 5 M urea, 1% SDS, and 4% 2-
mercaptoethanol, pH 8.0, and the electrophoresis buffer contained 125 mM Tris-HCl, 5

91
M urea, 1% SDS, 20% glycerol, 4% 2-mercaptoethanol, and 1% bromophenol blue, pH
6.8). Extracted samples were heated at 95°C for 5 min and centrifuged at 6000 g for 10
min using an Eppendorf centrifuge (Brinkmann Instruments, Westbury, NY, USA). 6 L
of extracted samples were loaded into wells (10 L of the molecular weight standards)
into a 12.5% acrylamide running gel with a 4% stacking gel in Bio-Rad mini-protein
electrophoresis (Bio-Rad Laboratories, Hercules, CA, USA). A constant voltage of 175 V
was applied to the gels for 1 hour, after which they were immediately fixed for 30 min
using Coomassie blue R-250 stain solution (45% methanol, 10% acetic acid, and 0.10%
brilliant blue R-250 (Fisher Sci.)). Destaining was repeated twice with a destaining
solution for 1 h (45% methanol, 45% ultrapure water, and 10% acetic acid), after which
samples were stored in ultrapure water. Gels were scanned using a Gel Doc™
EZ Imager
scanner (Bio-Rad Laboratories, Hercules, CA, USA), and analysis of the protein bands
was done using image analysis software (Image-Lab, Version 3.0 build 11, Bio-Rad
Laboratories, Hercules, CA, USA). The main polypeptide subunits were identified for
each band, and the results are shown as densitometric area of each protein subunit
relative to the total area. All lanes were loaded with the same protein content (17 g
protein).
4.3.4. Light Scattering measurements
Dynamic light scattering (DLS) is a widely used method of light scattering used
to determine average particle size and -potential of particles. For size measurements,
acidified soymilk samples were diluted ~10,000 times in filtered phosphate buffer (pore
size 0.22 m Fisher Sci.) adjusted to the corresponding pH of the samples. The cuvettes

92
were pre-rinsed with filtered buffer prior to adding the sample to ensure no dust or other
particulates were present. The samples were then transferred to clean disposable zeta
cells (DTS1060, Malvern Instruments, Malvern, MA, USA) for ζ-potential
measurements. Both size and -potential measurements were performed with the
Zetasizer Nanoseries (Nano ZS, Malvern Inst.).
Changes occurring during acidification were instead monitored in situ, without
dilution, using diffusing wave spectroscopy (DWS). The inverse photon transport mean
free path or turbidity parameter (1/l*), and the diffusion coefficient (from which, under
free diffusing conditions, the particle radius can be obtained) were measured as a function
of time during acidification. The turbidity parameter 1/l* is dependent on several factors,
including the refractive index, shape and size of the scatterers, as well as the inter-particle
interactions within the system. Changes in the dynamics of the system can be observed
through changes in the diffusion coefficient obtained from the correlation functions
obtained. Hence, information about the preceding steps of gelation of a turbid system
such as soymilk can be obtained.
The DWS experiments were carried out as previously described (see Chapter 3,
section 3.3.7.). A water bath was used to maintain sample at the required temperatures
(30˚C and 7oC). The value for input parameters such as refractive index, and dynamic
viscosities were those obtained previously (see Chapter 2, section 3.4.1.) (n=1.334 for 4%
soymilk and 1.335 for 7% soymilk and =0.000798 kg/m s and 0.001428 kg/m s for
water at 30°C and 7oC).

93
4.3.5. Rheological measurements
Rheology measurements were carried out using a controlled-stress rheometer (AR
1000, TA instruments, New Castle, Canada). Time sweeps were conducted using a
conical concentric cylinder geometry (20 mL sample size, 5,920 μm fixed gap, 15 mm
radius, 42 mm cylinder immersed height) at a constant temperature of °C, controlled by
a water bath. Time sweeps consisted of a constant maximum strain of 1% and a
frequency of 0.1 Hz. Solvent traps were used to minimize sample evaporation during
measurements. Rheology Advance Data 257 Analysis version 5.0.38 software (TA
Instruments Ltd., 258 New Castle, MA, USA) was used to analyze experimental data.
The point of gelation was defined as the point when the G’ value became equal to the G‖
value.
4.3.6. Statistical analysis
All experiments were conducted at least in duplicate, with gelation experiments
repeated with four batches of soymilk, unless otherwise indicated. Statistical differences
were calculated with independent sample T-tests, to assess individually the effect of GDL
concentration (0.8% and 1.6% w/v) and the effect of soymilk protein concentration (4%
and 7%), on gelation parameters. The F-test was used to determine homogeneity of
variance, after which the two-sample T-tests were carried out assuming equal or unequal
variances, accordingly, using Microsoft Office Excel 2007 (Microsoft Corporation).
Differences are significant at a level of p<0.05.

94
4.4. Results and Discussion
4.4.1. Physicochemical changes of soymilk particles preceding gelation
Figure 4.1 shows the -potential (A) and hydrodynamic diameter (B) at various
pH values, after addition of different amounts of GDL. At pH > 6.0, both 4% and 7%
protein soymilk samples showed negatively charged particles with a relatively low -
potential. Indeed, -potential values of -10 mV are quite weak to consider electrostatic
repulsion as the main repulsive force preventing protein-protein aggregation. However,
although the overall particle charge is low, strong local electrostatic interactions can still
occur between particles as a result of uneven charge distribution on the particle surface;
the charge repulsion would impair particles from sticking together upon collision. The
overall negative charge can be attributed to cumulative charges of the individual proteins,
with subunits having different isoelectric points (Fukushima, 1991; Kohyama et al.,
1995a). At pH 5.9, there was a marked decrease in the absolute value of the -potential
charge for both soymilk samples. This is consistent with charge neutralization as the
proteins approach their isoelectric point.
The average particle diameter as determined by DLS is shown in Figure 4.1B.
Both 4% and 7% protein soymilk samples showed a similar trend. The apparent diameter
remained relatively constant until a pH of about 5.9 for 4% proteins soymilk, and about
6.0 for 7% protein soymilk, after which a sharp increase in diameter was observed. This
sharp increase in diameter indicated colloidal destabilization of the particles, and it
occurred slightly before the marked decrease in -potential values (Figure 4.1A).

95
Figure 4.1. -potential (A) and apparent diameter (B) measured by dynamic light
scattering of soymilk samples acidified with GDL. Individual measurements of three
replicates are shown, because of slight variations in the end pH; 4% protein soymilk
(empty circles) and 7% protein soymilk (filled triangles).
-p
ote
ntial (m
V)
-12
-8
-4
0
pH
5.65.86.06.26.46.66.8
Ap
pare
nt
Dia
mete
r (
m)
0.0
0.5
1.0
1.5
A
B

96
This may be explained by neutralization of local patches on the proteins or by a selected
group of proteins, allowing for the particles to get close to each other and aggregate
before a significant decrease in the overall charge of the system. Overall, particles in both
4 and 7% protein soymilk behaved similarly, suggesting a similar particle destabilization
mechanism, with the 7% soymilk showing a larger experimental error.
It can be concluded that charge neutralization allows particles to interact to a
higher extent at this pH, however, the forces which would be responsible for particles to
aggregate have yet to be fully determined. It has been previously suggested that
aggregation occurs via hydrophobic interaction after charge neutralization (Kohyama and
Nishinari, 1993; Kohyama et al., 1995a; Guo and Ono, 2005). For this reason, the
contribution of hydrophobic interaction in particle coagulation was further investigated in
this study, by observing the aggregation behaviour at two different incubation
temperatures, as discussed below.
Figure 4.2 shows the composition of the soluble fraction of soymilk acidified to
different pH values, from 6.6 to 5.8. The results are shown as ratio of the main protein
subunits remaining in the soluble fraction as a percentage of the total glycinin and -
conglycinin content combined. A similar trend was observed for both 4% and 7%
proteins soymilk, suggesting that particles destabilization behaved similarly during
acidification, as a function of protein concentration. The results clearly indicate that the
acidic and basic polypeptides of glycinin destabilized at higher pH values than the -
conglycinin subunits, as the fraction of glycinin subunits decreased with decreasing pH
(Figure 4.2). This was due to the differences in the isoelectric point between the subunits.

97
Figure 4.2. Densitometric analysis (as area % of total bands area) for polypeptides
present in the soluble fraction, analyzed by SDS-PAGE analysis, of 4% (A) and 7% (B)
protein soymilk samples. Experiments were conducted in two replicates, and standard
deviations are shown. Polypeptides identified include -conglycinin’s ’, ;
; and glycinin’s A3, acidic, ; basic, .

98
Initially, the supernatant contained all the protein subunits present originally in the
soymilk. The basic subunit of glycinin was no longer found in the soluble fraction below
pH of ~5.9, for both 4% and 7% protein soymilk. Similarly, the A3 fraction of glycinin
also was present in the soluble phase only at pH> 5.9. Together with the A3 and the basic
glycinin polypeptide, the subunit of -conglycinin also was no longer present in the
supernatant at pH <5.9. It has been previously suggested that the -subunits of -
conglycinin interact with the basic polypeptides of glycinin predominantly through
electrostatic interaction (Ono et al., 1991; Guo et al., 1997; Ren et al., 2009).
It is possible to hypothesize that these polypeptides are the first fractions to
destabilize during acidification. These results are in full agreement with previous reports
on soymilk gelation, where it was shown that soymilk particles containing a high ratio of
A3 would cause gel formation at a higher pH (Malaki Nik et al., 2011).
It has been previously established that during acid gelation of soymilk, protein
particles destabilize and form a network which is followed by incorporation of soluble
proteins consisting mainly of the and ’ subunits of -conglycinin and the acidic
polypeptide of glycinin (Ono et al., 1991; Guo et al., 1997). Protein incorporation occurs
as the pH of the system continues to drop and the charges are further neutralized (Ono et
al., 1993; Guo and Ono, 2005). The results shown in Figure 4.2 confirm these previous
findings, as the and ’ subunits of -conglycinin and the acidic subunits of glycinin
remained in the soluble fraction longer during acidification.
99
4.4.2. Aggregation behaviour of soymilk
The aggregation behaviour of soymilk particles was followed during acidification
with time, using two concentrations of GDL (0.8 and 1.6% w/v). Figure 4.3 shows the
changes in the G’ measured by rheology (A) and the DWS parameters radius (B) and 1/l*
(C). The average values of these parameters during gelation for 4 and 7% protein soymilk
are summarized in Table 4.1.
The effect of the acidification rate was investigated by comparing the gelation
behaviour of soymilk with 0.8 and 1.6% GDL (compare empty and filled symbols).
Overall (see Table 4.1) there were no statistical differences (at p<0.05) between the
gelation parameters with amount of GDL added.
Results of measurements conducted with 1.6% GDL were usually less
reproducible, most probably due to the rapidity of the acidification process. The gelation
point, both measured by rheology and DWS clearly showed no differences between
different concentrations of GDL, for both 4% and 7% protein soymilk samples (see Table
4.1). These results confirm findings from a previous study that the point of gelation of
soymilk using GDL was not affected by the rate of acidification (Malaki Nik et al.,
2011). The G’ and tan values at pH 5.6 were also not different when using different
GDL amount (Table 4.1), in contrast with what reported previously. It was indeed
suggested that the rate of acidification affected the final stiffness of the gel (Malaki Nik
et al., 2011); however, in the present study, a high final pH was chosen (pH 5.6) for
comparison.

100
Figure 4.3. Gelation behaviour of soymilk containing 0.8% (open symbols) or 1.6%
(filled symbols) GDL. A) Storage modulus (G’) obtained from rheology data; B)
apparent radius of particles and C) turbidity (1/l*) parameter obtained from diffusing
wave spectroscopy measurements of 4% protein soymilk (circles) and 7% protein
soymilk (triangles). Representative runs of four replicate experiments. For statistical
analysis see Table 4.1.
pH
5.25.45.65.86.06.26.4
1/l*
(mm
-1)
0
2
4
6
8
10
12
14
Appare
nt
radiu
s (
m)
0
5
10
15
20
G' (P
a)
0
100
200
300
400
500A
B
C

101
Table 4.1. Gelation parameters measured during acidification of soymilk for two different
concentrations of GDL and for 4 and 7% protein soymilk. Parameters include the gelation
pH (for tan= 1, where is phase angle), the G’ and tanvalues measured at pH 5.6
using rheology; the pH of aggregation (as determined graphically from the increase in
radius) and the pH corresponding to the 1/l* increase measured with DWS. Values are
averages of at least 4 replicates with their standard deviation. Within a column and GDL
concentration, different superscript letters indicate statistical differences with protein
concentration (p<0.05).
Soymilk
type
GDL
(%)
Gelation pH
(tan = 1)
Tan at
pH 5.6
G’ at pH
5.6 (Pa)
Radius change
(pH)
1/l* change
(pH)
4%
protein
0.8 5.76±0.02a 0.24±0.01
a 47±15
a 5.68±0.01
a 5.91±0.01
a
7%
protein
0.8 5.83±0.05b 0.23±0.01
a 144±77
b 5.7±0.04
a 5.81±0.05
b
4%
protein
1.6 5.82±0.13a 0.27±0.03
a 53±33
a 5.74±0.04
a 6.01±0.14
a
7%
protein
1.6 5.90±0.03a 0.25±0.01
a 216±26
b 5.80±0.03
a 5.89±0.04
a

102
The behaviour of the elastic modulus (G’) measured during acidification for the
two protein concentrations is shown in Figure 4.3A. The values remained constant until a
pH of about 5.9, when a sharp increase was noted (see Table 4.1, gelation point). The
point where tan (where is the phase angle) equal 1 is considered the sol-gel point.
Although results from the 0.8% GDL treatment showed very small statistical differences
in the pH of gelation between soymilk protein concentrations, none were observed for
1.6% GDL. A stiffer gel was formed at a higher protein concentration, due to the larger
number of linkages in 7% soymilk, confirming earlier reports (Guo and Ono, 2005). The
values of tan measured at pH 5.6 were not statistically different with protein
concentration, suggesting that the type of gel structure formed was similar, but with a
higher number of linkages within the network.
When looking at the values of apparent radius as measured by DWS (Figure 4.3B)
it was clear that samples containing a higher amount of protein showed a larger initial
apparent radius compared to the samples with 4% protein, as extensively discussed in the
previous chapter (Chapter 3). The changes of the apparent radius as a function of pH
showed complete agreement with rheological measurements. The size of the soybean
particles remained constant (Figure 4.3B) until a dramatic increase around pH 5.9-5.8,
which was defined as the point of aggregation of the soymilk particles (see Table 4.1).
This increase in radius was consistent with the fact that at a pH of around 5.7, the charge
on the soymilk particles was sufficiently diminished to allow aggregation, as shown in
Figure 4.1. It is important to note that the results obtained using DWS under concentrated
conditions were in full agreement with those shown in Figure 4.1 measured under
extensively diluted conditions, as well as with the gelation points measured by rheology.

103
This agreement would fully support the conclusion that the colloidal destabilization of a
portion of the protein particles initiated the formation of a gel network. Also in the case
of the apparent radius data, the pH of radius increase was not different between GDL
amounts or protein concentration. This further confirms observations from the rheology
data that protein concentration had no marked effect on the point of gelation.
The 1/l* parameter also showed constant values until an increase beginning
around pH 6.0 (Figure 4.3C), signifying the beginning of changes in particle spatial
arrangement. Again, no differences were observed in terms of the effect of GDL amounts
on the value of pH where an increase of the 1/l* parameter was noted (see Table 4.1). It
is important to note that these values were just slightly earlier than those of the radius
change and gelation point, indicating that overall the gelation occurred at this critical pH,
when the overall charges of the protein particles start to decrease and allow for
aggregation to occur. There were no changes in the spatial correlation of the particles
before this pH and the aggregation of the particles was sudden and a result of short-
ranged interaction, in agreement with what previously hypothesized (Malaki Nik et al.,
2011).
To better determine the importance of hydrophobic interactions during
aggregation of the soymilk particles at pH around 5.9, the acidification experiments were
carried out at different temperatures, as hydrophobic interactions weaken at low
temperatures (Israelachvili, 1991; Damodaran et al., 2008). The development of a
soymilk gel was followed using rheology and DWS, for 4% protein soymilk with 0.8%
GDL at 7oC, and compared to the data obtained from incubation at 30
oC. The results are
summarized in Figure 4.4 and Table 4.2.

104
Figure 4.4. Gelation behaviour of soymilk containing 4% protein and 0.8% GDL,
incubated at 30oC (open circles) and at 7
oC (filled circles). A) Storage modulus (G’)
obtained from rheology data; B) apparent radius and C) the turbidity (1/l*) parameter
obtained from diffusing wave spectroscopy. Representative runs of three replicate
samples are shown. For statistical analysis see Table 4.2.
pH
5.25.66.06.46.8
1/l*
(mm
-1)
0
2
4
6
Appare
nt ra
diu
s (
m)
0
10
20
30
40B
C
G' (P
a)
0
100
200
300A

105
Table 4.2. Gelation parameters measured during acidification of soymilk with 0.8% GDL
at 30oC and 7
oC. Parameters include the gelation pH (for tan = 1, where is phase
angle), the G’ and d tanvalues measured at pH 5.6 using rheology; the pH of
aggregation (as determined graphically from the increase in radius) and the pH
corresponding to the 1/l* increase measured with DWS. Values are averages of at least 3
replicates with their standard deviation. Within a column, different superscript letters
indicate statistical differences with protein concentration using a T-test (p<0.05).
Incubation
temp.
Gelation pH
(tan = 1)
G’ at pH 5.6
(Pa)
tan at
pH 5.6
Radius change
(pH)
1/l* increase
(pH)
7oC 5.90 ± 0.04
a 179.1 ± 45
a 0.24 ± 0.01
a 5.86 ± 0.04
a 6.03 ± 0.03
a
30oC 5.76 ± 0.02
b 47.3 ± 15
b 0.22 ± 0.01
b 5.68 ± 0.01
b 5.91 ± 0.01
b
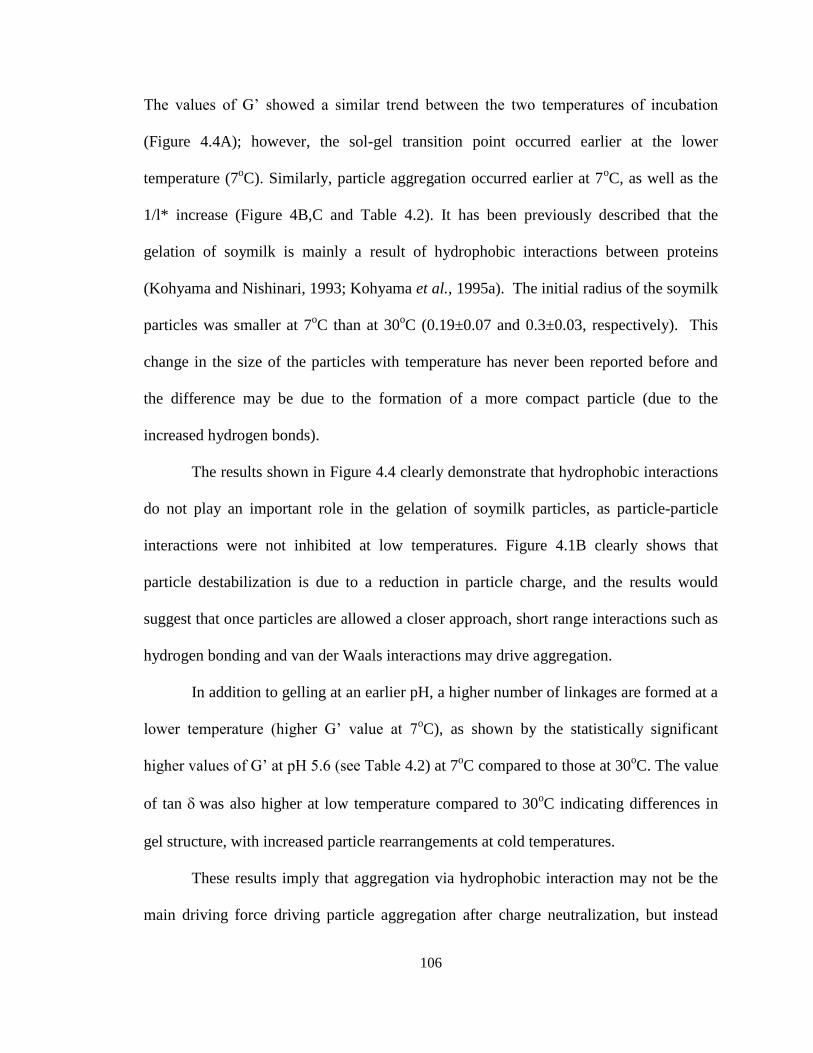
106
The values of G’ showed a similar trend between the two temperatures of incubation
(Figure 4.4A); however, the sol-gel transition point occurred earlier at the lower
temperature (7oC). Similarly, particle aggregation occurred earlier at 7
oC, as well as the
1/l* increase (Figure 4B,C and Table 4.2). It has been previously described that the
gelation of soymilk is mainly a result of hydrophobic interactions between proteins
(Kohyama and Nishinari, 1993; Kohyama et al., 1995a). The initial radius of the soymilk
particles was smaller at 7oC than at 30
oC (0.19±0.07 and 0.3±0.03, respectively). This
change in the size of the particles with temperature has never been reported before and
the difference may be due to the formation of a more compact particle (due to the
increased hydrogen bonds).
The results shown in Figure 4.4 clearly demonstrate that hydrophobic interactions
do not play an important role in the gelation of soymilk particles, as particle-particle
interactions were not inhibited at low temperatures. Figure 4.1B clearly shows that
particle destabilization is due to a reduction in particle charge, and the results would
suggest that once particles are allowed a closer approach, short range interactions such as
hydrogen bonding and van der Waals interactions may drive aggregation.
In addition to gelling at an earlier pH, a higher number of linkages are formed at a
lower temperature (higher G’ value at 7oC), as shown by the statistically significant
higher values of G’ at pH 5.6 (see Table 4.2) at 7oC compared to those at 30
oC. The value
of tan was also higher at low temperature compared to 30oC indicating differences in
gel structure, with increased particle rearrangements at cold temperatures.
These results imply that aggregation via hydrophobic interaction may not be the
main driving force driving particle aggregation after charge neutralization, but instead
107
hydrogen boding seems to be the likely force driving particle aggregation and the
gelation of soymilk.
4.5. Conclusions
Soymilk particles showed, overall, a relatively weak -potential charge, the
magnitude of which decreased at pH of about 5.8. Particle destabilization, observed as a
dramatic increase in particle diameter, seemed to occur somewhat earlier than the
decrease in charge noted at pH 5.8, suggesting that a fraction of the protein particles may
be driving the initial stages of aggregation. Analysis of the soluble fraction in the pH
range between 6.6 and 5.9 showed that the protein subunits first involved in gel network
formation included the basic subunit of glycinin and the subunit of -conglycinin,
while the and ’ subunits of -conglycinin and the acidic subunits of glycinin were left
in the supernatant approaching the pH of gelation.
The gelation behaviour was very similar for the two concentrations of soymilk
prepared, 4% and 7% protein soymilk, suggesting that protein concentration does not
have an effect on gelation properties of soymilk, such as the pH of aggregation and the
gelation pH. The protein concentration did, however, have an effect on the extent of gel
structure formed, as 7% protein soymilk produced stiffer gels. The gel type however was
not affected, shown by similar tan values.
Confirming a previous study (Malaki Nik et al., 2011), DWS results showed that
onset of gelation was sudden and a result of short-range interactions. Gelation of soymilk
was weakly dependent on gelation temperature, with an earlier gelation and much stiffer
bonds at 7ºC compared to 30ºC. This clearly demonstrated that the gelation of soymilk

108
particles occurs because of charge neutralization and short range interactions with
hydrogen bonds playing a major role in strengthening the network linkages.

109
Chapter 5.
General Conclusions
In the first study, soymilk of different protein concentrations was prepared from
different water-to-bean ratios, to investigate how this would affect various physical
characteristics of soymilk particles and the bulk properties of soymilk. Results suggested
that soymilk particles are formed through similar rearrangement of the various soy
protein subunits; however, particle size, charge and protein content are affected by the
water-to-bean ratio used to prepare soymilk. DWS and refractometry results showed that
soymilk of high protein concentration have different optical properties, which could be a
result of a different level of hydration and protein content of the particles. Although some
of the characteristics of soymilk particles prepared from different water-to-bean ratio are
similar, discrepancies were found, and hence caution must be made when preparing
soymilk of different concentration, as the processing functionality of the soymilk base
could be affected.
Research conducted in the first part of this thesis brought new advances in the
understanding of the colloidal behaviour of soymilk particles. Indeed, when studying the
behaviour of concentrated colloids such as soymilk, theoretical models can be a useful
tool to interpret data and give information about the colloidal particles; however the
volume fraction must be known and this important characteristic of soymilk particles has
never been reported in the literature. The particle voluminosity of 4.11 mL/g (from which
the volume fraction can be obtained) and refractive index of soymilk particles, 1.388,
were derived using a relation between the effective refractive index of soymilk and the
turbidity parameter determined experimentally using DWS. In other words, experimental

110
data from different physical techniques were employed to derive the value of volume
fraction. The values of voluminosity and refractive index were obtained from a hard-
sphere analog, and this is somewhat surprising, considering the nature of the sample (the
large particle size distribution and the obvious non-sphericity of the soymilk particles
shown by microscopy). The behaviour of soymilk can be approximated to that of a
colloidal hard sphere. However, the experimental results showed some deviation from
sphericity, and comparison of DWS and rheological data to theoretical models for hard
spheres suggested that the behaviour of soymilk particles can be was fitted to a sphere
equivalent, but better fits were obtained with parameters closer to those of ellipsoids.
Knowing the volume fraction of soymilk opens the door for future comparisons between
models and experimentally obtained data, providing a new way to characterize the
colloidal behaviour of soymilk.
As just mentioned, the soymilk protein concentration has some effect on the
physicochemical properties of soymilk particles and consequently could have an effect on
the gelation properties of soymilk. Characterization of particles leading up to the point of
gelation revealed that a particle charge decrease correlates well with the pH of particle
aggregation (pH 5.8) and indicated that a decrease in charge is a prerequisite for particle
aggregation. The protein composition of the soluble phase approaching the pH of
aggregation showed that glycinin components are the first to destabilize during
acidification, followed by -conglycinin subunits, as previously suggested. Results were
similar for soymilk samples varying in protein concentration (4% and 7% protein),
suggesting that soymilk protein concentration had no significant effect on the gelation
behaviour. The gel stiffness was higher in the more concentrated soymilk gel, as a result
111
of higher number of bonds, however the gel structures was not affected. The effect of the
rate of acidification had no effect on the gelation properties of soymilk. The effect of
decreasing the incubation temperature from 30oC to 7
oC revealed that particle
aggregation in soymilk may not be a result of hydrophobic interactions, but rather a result
of hydrogen bonding. These results are quite significant as the gelation of soy protein has
previously been thought to be a result of hydrophobic interactions, following a decrease
in electrostatic charge between particles. Knowing that soymilk protein concentration has
little effect on the gelation properties of soymilk gives important information for the
potential use of a concentrated soymilk base, as only the gel stiffness was affected, while
all other gelation properties were not affected. A better understanding of the forces
driving aggregation and the parameters that affect gelation properties provides useful
information for soymilk processors, allowing for better process design and quality control
monitoring during production. In addition, the use of soymilk as opposed to soy protein
isolates provides a more efficient and direct conversion of soybean to edible food
products.

112
6. References
Akintunde, T. T. Y. & Akintunde, B. O. (2002). Development of Models for Predicting
the Yield and Quality of Soymilk. The Journal of Food Technology in Africa, 7: 55-58.
Al-Bakkush, A. A. (2008). Improvement of functional properties of Soy protein. Ph. D.
Thesis, Heriot-Watt University, Edingburgh, UK.
Alexander, M., Rojas-Ochoa, L. F., Leser, M., & Schurtenberger, P. (2002). Structure,
dynamics, and optical properties of concentrated milk suspensions: an analogy to hard-
sphere liquids. Journal of Colloid and Interface Science, 253: 35-46.
Alting, A. C., de Jongh, H. H. J., Visschers, R. W., & Jan-Willem, F. A. (2002). Physical
and chemical interactions in cold gelation of food proteins. Journal of Agricultural and
Food Chemistry, 50: 4682-4689.
Anderson, R. L. (1992). Effect of steaming on soybean proteins and trypsin inhibitors.
Journal of the American Oil Chemists' Society, 62: 1170-1176.
Arakawa, T. & Timasheff, S. N. (1984). Mechanism of protein salting in and salting out
by divalent cation salts: balance between hydration and salt binding. Biochemistry, 23:
5912-5923.
Babajimopoulos, M., Damodaran, S., Rizvi, S. S. H., & Kinsella, J. E. (1983). Effects of
various anions on the rheological and gelling behavior of soy proteins: Thermodynamic
observations. Journal of Agricultural and Food Chemistry, 31: 1270-1275.

113
Badley, R. A., Atkinson, D., Hauser, H., Oldani, D., Green, J. P., & Stubbs, J. M. (1975).
The structure, physical and chemical properties of the soy bean protein glycinin.
Biochimica et Biophysica Acta - Protein Structure, 412: 214-228.
Beenakker, C. W. J. & Mazur, P. (1983). Self-diffusion of spheres in a concentrated
suspension. Physica A: Statistical and Theoretical Physics, 120: 388-410.
Bremer, L. G. B., Bijsterbosch, B. H., Walstra, P., & Van Vliet, T. (1993). Formation,
properties and fractal structure of particle gels. Adv. Colloid Interface Sci., 46: 117-128.
Brooks, J. R. & Morr, C. V. (1985). Current aspects of soy protein fractionation and
nomenclature. Journal of the American Oil Chemists' Society, 62: 1347-1354.
Cai, T. D. & Chang, K. C. (1998). Characteristics of production-scale tofu as affected by
soymilk coagulation method: propeller blade size, mixing time and coagulant
concentration. Food Research International, 31: 289-295.
Cai, T. & Chang, K. C. (1999). Processing effect on soybean storage proteins and their
relationship with tofu quality. Journal of Agricultural and Food Chemistry, 47: 720-727.
Catsimpoolas, N. & Meyer, E. W. (1970). Gelation Phenomena of Soybean Globulins. I.
Protein-Protein Interactions. Journal of the American Oil Chemists' Society, 68: 339-345.
Cruz, N., Capellas, M., Hernandez, M., Trujillo, A. J., Guamis, B., & Ferragut, V. (2007).
Ultra high pressure homogenization of soymilk: Microbiological, physicochemical and
microstructural characteristics. Food Research International, 40: 725-732.

114
Curtis, R. A., Prausnitz, J. M., & Blanch, H. W. (1998). Protein‐protein and protein‐salt
interactions in aqueous protein solutions containing concentrated electrolytes.
Biotechnology and Bioengineering, 57: 11-21.
Damodaran, S. & Kinsella, J. E. (1982). Effect of Conglycinin on the Thermal
Aggregation of Glycinin. Journal of Agricultural and Food Chemistry, 30: 812-817.
Damodaran, S., Parkin, K. L., & Fennema, O. R. (Eds.). (2008). Fennema's Food
Chemistry. Boca Raton: Taylor & Francis Group. p. 226-244.
Demetriades, K., Coupland, J. N., & McClements, D. J. (1997a). Physical properties of
whey protein stabilized emulsions as related to pH and NaCl. Journal of Food Science,
62: 342-347.
Demetriades, K., Coupland, J. N., & McClements, D. J. (1997b). Physicochemical
Properties of Whey Protein‐Stabilized Emulsions as affected by Heating and Ionic
Strength. Journal of Food Science, 62: 462-467.
Dickinson, E. (1992). Introduction to Food Colloids. 2nd
ed. Oxford, UK: Oxford
University Press. p. 94-184.
Dickinson, E. & McClements, D. J. (1995). Advances in Food Colloids. 1st ed. Glasgow:
Blackie Academic and Professional. p. 35-39.
Doi, E. (1993). Gels and gelling of globular proteins. Trends in Food Science and
Technology, 4, 1-5.
115
Dukhin, A. S. & Goetz, P. J. (2002). Ultrasound for characterizing colloids. Möbius, D.,
Miller, R. (Eds.). Amsterdam: Elsevier.
Eilers, V. H. (1941). Die Viskositat von Emulsionen hochviskoser Stofee als Funktion de
Konzentration. Kolloid-Zeitschrift, 97: 313-321.
Einstein, A. (1956). Investigations on the Theory of the Brownian Movement.: Dover
Pubns.
Evans, D. F. & Wennerstrom, H. (1994). The Colloidal Domain: Where Physics,
Chemistry, Biology and Technology Meet. New York, NY: VCH Publishers.
Fennema, O. (1977). Food Proteins. West Point, NY: AVI Publishing. p. 50.
Forster, L. L. & Ferrier, L. K. (1979). Viscometric characteristics of Whole Soybean
Milk. Journal of Food Science, 44: 583-585.
Fukushima, D. (1991). Recent progress of soybean protein foods: chemistry, technology,
and nutrition. Food Reviews International, 7: 323-351.
Gao, J., Bosco, D. A., Powers, E. T., & Kelly, J. W. (2009). Localized thermodynamic
coupling between hydrogen bonding and microenvironment polarity substantially
stabilizes proteins. Nature Structural & Molecular Biology, 16: 684-690.
German, B., Damodaran, S., & Kinsella, J. E. (1982). Thermal dissociation and
association behavior of soy proteins. Journal of Agricultural and Food Chemistry, 30:
807-811.

116
Griffin, M. C. A., Price, J. C., & Griffin, W. G. (1989). Variation of the Viscosity of a
Concentrated, Sterically Stabilized, Colloid: Effect of Ethanol on Casein Micelles of
Bovine Milk. Journal of Colloid and Interface Science, 128: 223-229.
Guo, S. T. & Ono, T. (2005). The Role of Composition and Content of Protein Particles
in Soymilk on Tofu Curding by Glucono‐δ‐lactone or Calcium Sulfate. Journal of Food
Science, 70: 258-262.
Guo, S. T., Ono, T., & Mikami, M. (1997). Interaction between protein and lipid in
soybean milk at elevated temperature. Journal of Agricultural and Food Chemistry, 45:
4601-4605.
Guo, S. T., Tsukamoto, C., Takahasi, K., Yagasaki, K., Nan, Q. X., & Ono, T. (2002).
Incorporation of soymilk lipid into soy protein coagulum by the addition of calcium
chloride. Journal of Food Science, 67: 3215-3219.
Hansen, J. & McDonald, I. (1986). Theory of Simple Liquids. London, UK: Academic
Press. p. 90-97.
Hashizume, K., Nakamura, N., & Watanabe, T. (1975). Influence of ionic strength on
conformation changes of soybean protein caused by heating; relationships of its
conformation changes to gel formation. Agricultural and Biological Chemistry, 39: 1139-
1147.
Heller, W. (1965). Remarks on Refractive Index Mixture Rules. The Journal of Chemical
Physics, 69: 1123-1129.

117
Holt, C. & Hukins, D. W. L. (1991). Structural analysis of the environment of calcium
ions in crystalline and amorphous calcium phosphates by X-ray absorption spectroscopy
and a hypothesis concerning the biological function of the casein micelle. International
Dairy Journal, 1: 151-165.
Holt, W. J. C. & Chan, D. Y. C. (1997). Pair interactions between heterogeneous spheres.
Langmuir, 13: 1577-1586.
Hou, H. J., Chang, K. C., & Shih, M. C. (1997). Yield and textural properties of soft tofu
as affected by coagulation method. Journal of Food Science, 62: 824-827.
Hunter, R. J. (1986). Foundations in Colloid Science. Oxford, UK: Oxford University
Press.
Israelachvili, N. J. (1991). Intermolecular and Surface Forces. London, UK: Academic
Press.
Iwuoha, C. I. & Umunnakwe, K. E. (1997). Chemical, physical and sensory
characteristics of soymilk as affected by processing method, temperature and duration of
storage. Food Chemistry, 59: 373-379.
Kang, J., Yasuki, M., & Tomohiko, M. (1991). Characterization of texture and
mechanical properties of heat-induced soy protein gels. Journal of the American Oil
Chemists Society, 68: 339-345.
Kennedy, A. R. (1995). The evidence for soybean products as cancer preventive agents.
Journal of Nutrition, 125: 733s-743s.
118
Kinsella, J. (1979). Functional properties of soy proteins. Journal of the American Oil
Chemists’ Society, 56: 242-258.
Kitamura, K. (1995). Genetic improvement of nutritional and food processing quality in
soybean. Japan Agricultural Research Quarterly, 29: 1-8.
Kohyama, K. & Nishinari, K. (1993). Rheological studies on the gelation process of
soybean 7 S and 11 S proteins in the presence of glucono-delta-lactone. Journal of
Agricultural and Food Chemistry, 41: 8-14.
Kohyama, K., Sano, Y., & Doi, E. (1995a). Rheological characteristics and gelation
mechanism of tofu (soybean curd). Journal of Agricultural and Food Chemistry, 43:
1808-1812.
Kohyama, K., Murata, M., Tani, F., & Sano Y., D., E. (1995b). Effects of protein
composition on gelation of mixtures containing soybean 7S and 11S globulins.
Bioscience, Biotechnology, and Biochemistry, 59: 240-245.
Koshiyama, I. (1983). Storage proteins of soybeans. In W. Gottschalk W. & Muller, H. P.
Seed Proteins. The Hague: Martinus Nijhoff Publishers. p. 428.
Koshiyama, I., Hamano, M., & Fukushima, D. (1981). A heat denaturation study of the
11S globulin in soybean seeds. Food Chemistry, 6: 309-322.
Kwok, K. C. & Niranjan, K. (1995). Review: effect of thermal processing on soymilk.
International Journal of Food Science & Technology, 30: 263-295.

119
Kwok, K. C., Liang, H. H., & Niranjan, K. (2002). Optimizing conditions for thermal
processes of soy milk. Journal of Agricultural and Food Chemistry, 50: 4834-4838.
Lakemond, C. M. M., de Jongh, H. H. J., Hessing, M., Gruppen, H., & Voragen, A. G. J.
(2000). Soy glycinin: influence of pH and ionic strength on solubility and molecular
structure at ambient temperatures. Journal of Agricultural and Food Chemistry, 48:
1985-1990.
Lakshmanan, R., De Lamballerie, M., & Jung, S. (2006). Effect of Soybean‐to‐Water
Ratio and pH on Pressurized Soymilk Properties. Journal of Food Science, 71: E384-
E391.
Lee, K. H., Ryu, H. S., & Rhee, K. C. (2003). Protein Solubility Characteristics of
Commercial Soy Protein Products. Journal of the American Oil Chemists' Society, 80:
85-90.
Lei, M. G. & Reeck, G. R. (1987). Two-dimensional electrophoretic analysis of the
proteins of isolated soybean protein bodies and of the glycosylation of soybean proteins.
Journal of Agricultural and Food Chemistry, 35: 296-300.
Liu, K. (1997). Soybeans: Chemistry, Technology, and Utilization. Chapter 4. I: Soymilk
& II: Tofu. New York: Chapman and Hall. p. 138-197.
Liu, Z. S. & Chang, S. K. C. (2004). Effect of soy milk characteristics and cooking
conditions on coagulant requirements for making filled tofu. Journal of Agricultural and
Food Chemistry, 52: 3405-3411.

120
Malaki Nik, A., Alexander, M., Poysa, V., Woodrow, L., & Corredig, M. (2011). Effect
of Soy Protein Subunit Composition on the Rheological Properties of Soymilk during
Acidification. Food Biophysics, 6: 26-36.
Malaki Nik, A., Tosh, S., Poysa, V., Woodrow, L., & Corredig, M. (2008).
Physicochemical characterization of soymilk after step-wise centrifugation. Food
Research International, 41: 286-294.
Malhotra, A. & Coupland, J. N. (2004). The effect of surfactants on the solubility, zeta
potential, and viscosity of soy protein isolates. Food Hydrocolloids, 18: 101-108.
Martin, A. H., Bos, M. A., & Van Vliet, T. (2002). Interfacial rheological properties and
conformational aspects of soy glycinin at the air/water interface. Food Hydrocolloids, 16:
63-71.
Martin, A. H., Goff, H. D., Smith, A., & Dalgleish, D. G. (2006). Immobilization of
casein micelles for probing their structure and interactions with polysaccharides using
scanning electron microscopy (SEM). Food Hydrocolloids, 20: 817-824.
Maruyama, N., Salleh, M. R. M., Takahashi, K., Yagasaki, K., Goto, H., Hontani, N.,
Nakagawa, S., & Utsumi, S. (2002). Structure-physicochemical function relationships of
soybean β-conglycinin heterotrimers. Journal of Agricultural and Food Chemistry, 50:
4323-4326.
Maruyama, N., Sato, R., Wada, Y., Matsumura, Y., Goto, H., Okuda, E., Nakagawa, S.,
& Utsumi, S. (1999). Structure-physicochemical function relationships of soybean β-
121
conglycinin constituent subunits. Journal of Agricultural and Food Chemistry, 47: 5278-
5284.
McClements, D. J. (2005). Food Emulsions. Boca Raton: CRC Press. p. 53-93.
Mendoza, C. I. & Santamaria-Holek, I. (2009). The rheology of hard sphere suspensions
at arbitrary volume fractions: An improved differential viscosity model. The Journal of
Chemical Physics, 130: 1-7.
Messina, M. (1995). Modem applications for an ancient bean: soybeans and the
prevention and treatment of chronic disease. Journal of Nutrition, 125: 567S-569S.
Messina, M. & Messina, V. (1991). Increasing use of soy foods and their potential role in
cancer prevention. Journal of American Dietetic Association, 676: 188-201.
Messina, M. J., Persky, V., Setchell, K. D. R., & and Barnes, S. (1994). Soy intake and
cancer risk: a review of the in vitro and in vivo data. Nutrition and Cancer, 21: 113-131.
Min, S., Yu, Y., & Martin, S. S. (2005). Effect of soybean varieties and growing
locations on the physical and chemical properties of soymilk and tofu. Journal of Food
Science, 70: C8-C21.
Monahan, F. J., McClements, D. J., & German, J. B. (1996). Disulfide‐mediated
Polymerization Reactions and Physical Properties of Heated WPI‐stabilized Emulsions.
Journal of Food Science, 61: 504-509.

122
Moro, A., Gatti, C., & Delorenzi, N. (2001). Hydrophobicity of whey protein
concentrates measured by fluorescence quenching and its relation with surface functional
properties. Journal of Agricultural and Food Chemistry, 49: 4784-4789.
Morr, C. (1979). Technical problems and opportunities in using vegetable proteins in
dairy products. Journal of the American Oil Chemists’ Society, 56: 383-385.
Mullin, W. J., Fregeau-Reid, J. A., Butler, M., Poysa, V., Woodrow, L., Jessop, D. B., &
Raymond, D. (2001). An interlaboratory test of a procedure to assess soybean quality for
soymilk and tofu production. Food Research International, 34: 669-677.
Munro, I. C., Harwood, M., Hlywka, J. J., Stephen, A. M., Doull, J., Flamm, W. G., &
Adlercreutz, H. (2003). Soy isoflavones: a safety review. Nutrition Reviews, 61: 1-33.
Murphy, P. A., Chen, H. P., Hauck, C. C., & Wilson, L. A. (1997). Soybean protein
composition and tofu quality. Food Technology, 51: 86-88.
Murphy, P. A. & Resurreccion, A. P. (1984). Varietal and environmental differences in
soybean glycinin and beta-conglycinin content. Journal of Agricultural and Food
Chemistry, 32: 911-915.
Nagano, T., Fukuda, Y., & Akasaka, T. (1996). Dynamic viscoelastic study on the
gelation properties of β-conglycinin-rich and glycinin-rich soybean protein isolates.
Journal of Agricultural and Food Chemistry, 44: 3484-3488.

123
Nakai, S. (1983). Structure-function relationships of food proteins: with an emphasis on
the importance of protein hydrophobicity. Journal of Agricultural and Food Chemistry,
31: 676-683.
Nakamura, T., Utsumi, S., & Mori, T. (1985). Effects of temperature on the different
stages in thermal gelling of glycinin. Journal of Agricultural and Food Chemistry, 33:
1201-1203.
Nakamura, T., Utsumi, S., & Mori, T. (1986). Interactions During Heat-induced Gelation
in a Mixed System of Soybean 7S and 11S Globulins (Food & Nutrition). Agricultural
and Biological Chemistry, 50: 2429-2435.
Nielsen, N. C. (1985). Structure of soy proteins. In Altschul, A. M. & Wilcke, H. L., New
Protein Foods. Orlando, FL: Academic Press. p. 27-64.
Nielsen, N. C., Dickinson, C. D., Cho, T. J., Thanh, V. H., Scallon, B. J., & Fischer, R. L.
(1989). Characterization of the glycinin gene family in soybean. Plant Cell, 13: 313-328.
O'Brien, R. W., Jones, A., & Rowlands, W. N. (2003). A new formula for the dynamic
mobility in a concentrated colloid. Colloids and Surfaces A: Physicochemical and
Engineering Aspects, 218: 89-101.
Ono, T. (2000). The mechanisms of curd formation from soybean milk to make a stable
lipid food. In: Proceedings of the 3rd International Soybean Processing and Utilization
Conference. Oct. 2000; Tsukuba, Japan. Tokyo, Japan: Kourin Publishing Co. P 51-52.
124
Ono, T., Choi, M. R., Ikeda, A., & Odagiri, S. (1991). Changes in the Composition and
Size Distribution of Soymilk Protein Particles by Heating (Food & Nutrition).
Agricultural and Biological Chemistry, 55: 2291-2297.
Ono, T., Katho, S., & Mothizuki, K. (1993). Influence of calcium and pH on protein
solubility in soybean milk. Japan Society for Bioscience, Biotechnology, and
Agrochemistry, 57: 24-28.
Ono, T., Takeda, M., & Shuntang, G. (1996). Interaction of protein particles with lipids
in soybean milk. Japan Society for Bioscience, Biotechnology, and Agrochemistry, 60:
1165-1169.
Petruccelli, S. & Anon, M. C. (1995). Soy protein isolate components and their
interactions. Journal of Agricultural and Food Chemistry, 43: 1762-1767.
Poysa, V. & Woodrow, L. (2002). Stability of soybean seed composition and its effect on
soymilk and tofu yield and quality. Food Research International, 35: 337-345.
Poysa, V., Woodrow, L., & Yu, K. (2006). Effect of soy protein subunit composition on
tofu quality. Food Research International, 39: 309-317.
Puppo, M. C. & Anon, M. C. (1998). Structural properties of heat-induced soy protein
gels as affected by ionic strength and pH. Journal of Agricultural and Food Chemistry,
46: 3583-3589.
Rackis, J. (1974). Biological and physiological factors in soybeans. Journal of the
American Oil Chemists’ Society, 51: 161-174.

125
Ren, C., Tang, L., Zhang, M., & Guo, S. (2009). Structural Characterization of Heat-
Induced Protein Particles in Soy Milk. Journal of Agricultural and Food Chemistry, 57:
1921-1926.
Renkema, J. M. S. (2001). Formation, structure and rheological properties of soy protein
gels. Ph.D. Thesis, Wageningen University. Wageningen, Netherlands.
Renkema, J. M. S., Gruppen, H., & Van Vliet, T. (2002). Influence of pH and ionic
strength on heat-induced formation and rheological properties of soy protein gels in
relation to denaturation and their protein compositions. Journal of Agricultural and Food
Chemistry, 50: 6064-6071.
Renkema, J. M. S. & van Vliet, T. (2002). Heat-induced gel formation by soy proteins at
neutral pH. Journal of Agricultural and Food Chemistry, 50: 1569-1573.
Saio, K. (1969). Food processing characteristics of soybean 11S and 7S proteins. Part I.
Effect of difference of protein components among soybean varieties on formation of tofu-
gel. Agricultural and Biological Chemistry, 33: 1301-1308.
Sato, K., Yamagishi, T., & Yamauchi, F. (1986). Quantitative analysis of soybean
proteins by densitometry on gel electrophoresis. Cereal Chemistry, 63: 493-496.
Setchell, K. (2001). Soy Isoflavones—Benefits and Risks from Nature’s Selective
Estrogen Receptor Modulators (SERMs). Asia Pacific Journal of Clinical Nutrition, 9:
13.
126
Shih, M. C., Hou, H. J., & Chang, K. C. (1997). Process optimization for soft tofu.
Journal of Food Science, 62: 833-837.
Shimoyamada, M., Tsushima, N., Tsuzuki, K., Asao, H., & Yamauchi, R. (2008). Effect
of heat treatment on dispersion stability of soymilk and heat denaturation of soymilk
protein. Food Science and Technology Research, 14: 32-38.
Sirtori, C. R., Even, R., & Lovati, M. R. (1993). Soybean diet and plasma cholesterol:
from therapy to molecular mechanisms. Annals of the New York Academy of Sciences,
676: 188-201.
Sivanandan, L., Toledo, R. T., & Singh, R. K. (2010). Rheological and Ultrastructural
Properties and Particle Size distribution of Soymilk as Affected by Processing Methods.
International Journal of Food Properties, 13: 580-598.
Skurray, G., Cunich, J., & Carter, O. (1980). The effect of different varieties of soybean
and calcium ion concentration on the quality of tofu. Food Chemistry, 6: 89-95.
Sorgentini, D. A., Wagner, J. R., & Anon, M. C. (1995). Effects of thermal treatment of
soy protein isolate on the characteristics and structure-function relationship of soluble
and insoluble fractions. Journal of Agricultural and Food Chemistry, 43: 2471-2479.
Staswick, P. E., Hermodson, M. A., & Nielsen, N. C. (1981). Identification of the acidic
and basic subunit complexes of glycinin. Journal of Biological Chemistry, 256: 8752.
Taha, F. S. & Mohamed, S. S. (2004). Effect of different denaturation methods on lipid-
protein complex formation. Lebensmittel-Wissenschaft Und-Technologie, 37: 99-104.

127
Takagi, S., Akashi, M., & Yasumatsu, K. (1979). Determination of hydrophobic region in
soybean globulin. Nippon Shokuhin Kogyo Gakkaishi, 26: 133-8.
Tay, S. L. & Perera, C. O. (2004). Physicochemical Properties of 7S and 11S Protein
Mixtures Coagulated by Glucono‐δ‐lactone. Journal of Food Science, 69: 139-143.
Tezuka, M., Ono, T., & Ito, T. (1995). Properties of soymilk prepared from soybeans of
different varieties. Japan Society for Bioscience, Biotechnology, and Agrochemistry, 42:
556-561.
Tezuka, M., Taira, H., Igarashi, Y., Yagasaki, K., & Ono, T. (2000). Properties of tofus
and soy milks prepared from soybeans having different subunits of glycinin. Journal of
Agricultural and Food Chemistry, 48: 1111-1117.
Thanh, V. H. & Shibasaki, K. (1976). Heterogeneity of beta-conglycinin. Biochimica Et
Biophysica Acta (BBA)-Protein Structure, 439: 326-338.
Thanh, V. H. & Shibasaki, K. (1977). Beta-conglycinin from soybean proteins. Isolation
and immunological and physicochemical properties of the monomeric forms. Biochimica
Et Biophysica Acta, 490: 370-384.
Toda, K., Chiba, K., & Ono, T. (2007). Effect of components extracted from okara on the
physicochemical properties of soymilk and tofu texture. Journal of Food Science, 72:
108-113.
128
Toda, K., Yagasaki, K., & Takahashi, K. (2008). Relationship between protein
composition and coagulation reactivity, particulate formation, and incorporation of lipids
in soymilk. Bioscience, Biotechnology, and Biochemistry, 72: 2824-2830.
Totosaus, A., Montejano, J. G., Salazar, J. A., & Guerrero, I. (2002). A review of
physical and chemical protein‐gel induction. International Journal of Food Science &
Technology, 37: 589-601.
Uricanu, V. I., Duits, M. H. G., & Mellema, J. (2004). Hierarchical networks of casein
proteins: An elasticity study based on atomic force microscopy. Langmuir, 20: 5079-
5090.
Utsumi, S., Damodaran, S., & Kinsella, J. E. (1984). Heat-induced interactions between
soybean proteins: preferential association of 11S basic subunits and. beta. subunits of 7S.
Journal of Agricultural and Food Chemistry, 32: 1406-1412.
Utsumi, S. & Kinsella, J. E. (1985a). Structure-function relationships in food proteins:
subunit interactions in heat-induced gelation of 7S, 11S, and soy isolate proteins. Journal
of Agricultural and Food Chemistry, 33: 297-303.
Utsumi, S. & Kinsella, J. E. (1985b). Structure-function relationships in food proteins:
subunit interactions in heat-induced gelation of 7S, 11S, and soy isolate proteins. Journal
of Agricultural and Food Chemistry, 33: 297-303.

129
Utsumi, S., Matsumura, Y., & Mori, T. (1997). Structure-function relationships of soy
proteins. In S. Damodaran & A. Paraf, Food Proteins and Their Applications. New York:
Marcel Dekker. p. 257-291
Vojdani, F. (1996). Solubility. In Hall, G. M., Methods of testing protein functionality
London: Chapman and Hall. p. 11-46.
Wadu-Mesthrige, K., Amro, N. A., & Liu, G. Y. (2000). Immobilization of proteins on
self-assembled monolayers. Scanning, 22: 380-388.
Wagner, J. R., Sorgentini, D. A., & Añón, M. C. (2000). Relation between Solubility and
Surface Hydrophobicity as an Indicator of Modifications during Preparation Processes of
Commercial and Laboratory-Prepared Soy Protein Isolates. Journal of Agricultural and
Food Chemistry, 48: 3159-3165.
Wang, C. H. & Damodaran, S. (1991). Thermal gelation of globular proteins: influence
of protein conformation on gel strength. Journal of Agricultural and Food Chemistry, 39:
433-438.
Weitz, D. A., Zhu, J. X., Durian, D. J., Gang, H., & Pine, D. J. (1993). Diffusing-wave
spectroscopy: the technique and some applications. Physica Scripta, 49: 610-621.
Wolf, W. J. (1969). Soybean protein nomenclature: a progress report. Cereal Science
Today, 3: 75-78.
Wolf, W. J. (1970). Soybean proteins: their functional, chemical, and physical properties.
Journal of Agricultural and Food Chemistry, 18: 969-970.

130
Wolf, W. J. & Briggs, D. R. (1959). Purification and characterization of the 11S
component of soybean proteins. Archives of Biochemistry and Biophysics, 85: 186-199.
Wolf, W. J., Babcock, G. E., & Smith, A. K. (1961). Ultracentrifugal differences in
soybean protein composition. Nature, 191: 1395-1396.
Yamagishi, T., Miyakawa, A., Noda, N., & Yamauchi, F. (1983). Isolation and
Electrophoretic Analysis of Heat-induced Products of Mixed Soybean 7S and 11S
Globulins.. Agricultural and Biological Chemistry, 47: 1229-1237.
Yamauchi, F., Kawase, M., Kanbe, M., & Shibazaki, K. (1975). Separation of the beta-
aspartamido-carbohydrate fractions from soybean 7S protein: Protein-carbohydrate
linkage. Agricultural and Biological Chemistry (Japan). 39: 873-878.
Yoshida, M., Kohyama, K., & Nishinari, K. (1992). Gelation properties of soymilk and
soybean 11S globulin from Japanese-grown soybeans. Bioscience, Biotechnology, and
Biochemistry, 56: 725-728.
Young, V. R. (1991). Soy protein in relation to human protein and amino acid nutrition.
Journal of American Dietetic Association, 91: 828-835.
Zhang, H., Takenaka, M., & Isobe, S. (2004). DSC and electrophoretic studies on
soymilk protein denaturation. Journal of Thermal Analysis and Calorimetry, 75: 719-726.
Zhang, H., Li, L., Tatsumi, E., & Isobe, S. (2005). High-pressure treatment effects on
proteins in soy milk. Lebensmittel-Wissenschaft Und-Technologie, 38: 7-14.