The Philippines Luzon Grid Transmission Project Associated with ...
15
The Philippines Luzon Grid Transmission Project Associated with Private Power Project External Evaluator: Toshiyuki Katagiri, Tomomi Ito (The Japan Economic Research Institute) Field Survey: November 2006, February 2007 1. Project Profile and Japan’s ODA Loan (対 ;サイト位 ) Project site San Jose Substation Map of project area Transmission line connecting the Batangas Power Plant to the existing grid 1.1 Background In the Philippines, few projects had been implemented to enhance power generation, transmission and substation facilities in the latter half of the 1980s. As a result, the country faced a serious power shortage which caused long and frequent power failures through the early 1990s. As a measure to increase power supply capacity, the government began to introduce private investment in the power sector in 1987 and enacted the Build-Operate-Transfer (BOT) Law in 1990, thus promoting a policy to encourage entry of the private sector. By 1995, as private companies entered into the power business in the Philippines one after another, power generation facilities as well as transmission and substation facilities rapidly increased. As of the end of 1995, 34% (3,400 MW) of the total installed power generation capacity of 9,700 MW was occupied by privately-owned or privately-operated businesses. Although the serious power shortage was solved due to the increase in the power generation facilities, power demand in the Luzon grid was expected to increase rapidly at an annual average rate of approximately 11% by 2005. Therefore, further development of power generation facilities and transmission and substation facilities was required. 1.2 Objective Dasmarinas Substation Tayabas Substation Project site 1
Transcript of The Philippines Luzon Grid Transmission Project Associated with ...
The Philippines Luzon Grid Transmission Project Associated with Private Power Project
External Evaluator: Toshiyuki Katagiri, Tomomi Ito
(The Japan Economic Research Institute) Field Survey: November 2006, February 2007
1. Project Profile and Japan’s ODA Loan
事業地 地図
(対象国全図;サイト位置)
Project site
San Jose Substation
Map of project area
Transmission line connecting the Batangas Power Plant to the existing grid
1.1 Background
In the Philippines, few projects had been implemented to enhance power generation, transmission and substation facilities in the latter half of the 1980s. As a result, the country faced a serious power shortage which caused long and frequent power failures through the early 1990s. As a measure to increase power supply capacity, the government began to introduce private investment in the power sector in 1987 and enacted the Build-Operate-Transfer (BOT) Law in 1990, thus promoting a policy to encourage entry of the private sector. By 1995, as private companies entered into the power business in the Philippines one after another, power generation facilities as well as transmission and substation facilities rapidly increased. As of the end of 1995, 34% (3,400 MW) of the total installed power generation capacity of 9,700 MW was occupied by privately-owned or privately-operated businesses. Although the serious power shortage was solved due to the increase in the power generation facilities, power demand in the Luzon grid was expected to increase rapidly at an annual average rate of approximately 11% by 2005. Therefore, further development of power generation facilities and transmission and substation facilities was required. 1.2 Objective
Dasmarinas Substation Tayabas Substation
Project site
1
The project objective was to construct and expand transmission lines and substation facilities connecting the two power plants, to be developed by the private sector in Luzon Island, and the existing grid with the aim of ensuring a stable power supply to the Luzon grid, thereby contributing to economic development of the island. 1.3 Borrower/Executing Agency National Power Corporation of the Philippines (guaranteed by the Government of the Republic of the Philippines)1
1.4 Outline of Loan Agreement Loan Amount / Loan Disbursed Amount 14,972 million yen / 9,261 million yen Exchange of Notes / Loan Agreement March 1997 / March 1997 Terms and Conditions -Interest Rate -Repayment Period (Grace Period) -Procurement
2.7% (2.3% for consulting services)
30 years (10 years) General untied
Final Disbursement Date July 2004 Main Contractors Sumitomo Electric Industries, Ltd.,
Schneider Electric Industries, S.A. (France), Siemens AG (Germany), Kalpataru Power Transmission Ltd. (India), China National Electric Wire and Cable Import and Export Corp. (China), Mitsui & Co., Ltd., etc.
Consultant Services NEWJEC Inc. / P. B. Power (UK) Feasibility Study (F/S), etc. 1995 National Power Corporation of the
Philippines
2. Evaluation Result 2.1 Relevance 2.1.1 Relevance at the time of appraisal
At the time of appraisal of this project, infrastructure development was listed among five priority areas in the Medium-Term Philippine Development Plan (1993–1998). The plan set objectives to encourage entry of the private sector into the energy industry and promote diversification of power sources in order to ensure a stable power supply at low
1 In the Philippines, division and privatization of the power sector has been underway since the Energy Power Industry Reform Act (EPIRA), which took effect in June 2001. Under this act, transfer of the assets and liabilities of the National Power Corporation (NPC) that had engaged in power generation and power transmission until then to the Power Sector Assets and Liabilities Management Corporation (PSALM) has been in progress since July 2001. The power transmission business is succeeded by TRANSCO (established in 2001 and starting operation independently in March 2003) which is affiliated with PSALM. Under EPIRA, TRANSCO held several bids for the concession contract (25 years) with private companies for the operation and management of the power transmission business. However, no private company has been selected yet.
2
cost. In the Power Development Plan (1996), along with the planned upgrading and expansion of power generation facilities that was necessary to meet increasing power demand, development of transmission lines of approximately 5,450 circuit-km (including 3,700 circuit-km in the Luzon grid) and substation facilities with a total capacity of 20,000 MVA for the main grids of 230 kV or more was scheduled to be completed by 2005. This project, which was to construct transmission lines connecting the power plants to be constructed by the private sector (the Batangas Gas Power Plant and the Casecnan Hydroelectric Power Plant) to the existing grids and related substation facilities, was consistent with the above-mentioned Medium-Term Philippine Development Plan and Power Development Plan and was considered relevant. 2.1.2 Relevance at the time of evaluation
The Medium-Term Philippine Development Plan (2004–2010) in effect as of the time of evaluation sets the objectives including the expansion of transmission facilities of the National Transmission Corporation (TRANSCO) and the achievement of self-supply of electricity for the sake of ensuring a stable power supply as well as promoting reform of the electric power sector. In the Transmission Development Plan (2005–2014), construction and installation of 3,875 circuit-km of transmission lines and substation facilities with a total capacity of 13,000 MVA are planned in Luzon. With the increase in power generation facilities located in Northern Luzon and Southern Luzon, it became particularly important to increase and enhance the capacity of transmitting and transforming electricity supplied to Metro Manila, the largest power-consuming area. This project was planned in order to connect the power plants utilizing domestic energy sources (natural gas and hydraulic power) to Metro Manila and therefore remains highly relevant at the time of evaluation. 2.2 Efficiency 2.2.1 Outputs
The project plan comprises the following two parts: (1) construction of a 500 kV transmission line connecting the Batangas Gas Power Plant to the existing grid and expansion of substation facilities (Tayabas, Dasmarinas, and San Jose substations) to raise the voltage of the existing transmission line from 230 kV to 500 kV in order to accommodate the increase in the transmission capacity; and (2) construction of a transmission line connecting the Casecnan Hydroelectric Power Plant to the existing grid and expansion of substation facilities (San Manuel Substation). All items were implemented almost as planned. The length of the constructed transmission line connecting to the Batangas Gas Power Plant was reduced from the planned 58 km to 53.8
3
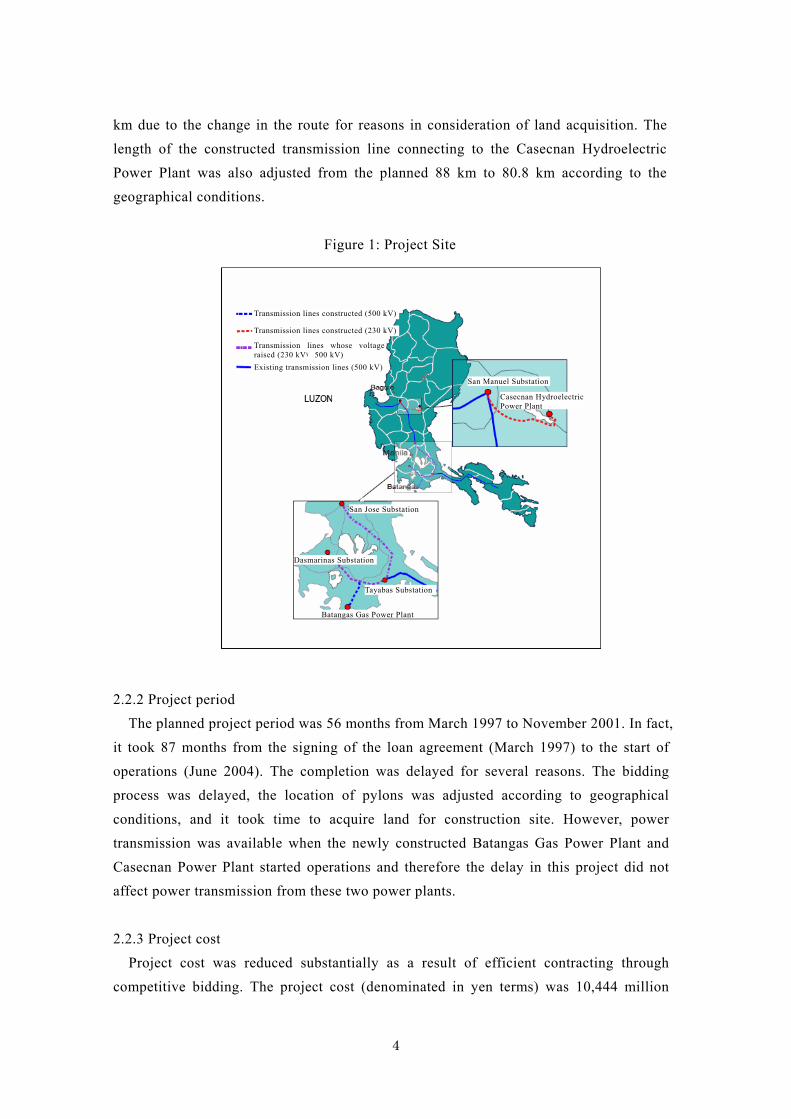
km due to the change in the route for reasons in consideration of land acquisition. The length of the constructed transmission line connecting to the Casecnan Hydroelectric Power Plant was also adjusted from the planned 88 km to 80.8 km according to the geographical conditions.
Figure 1: Project Site
B t
Tayabas Substation
Dasmarinas Substation
S n
San Manuel Substation
Existing transmission lines (500 kV)
Transmission lines whose voltage raised (230 kV→500 kV)
Transmission lines constructed (230 kV)
Transmission lines constructed (500 kV)
2.2.2 Project period
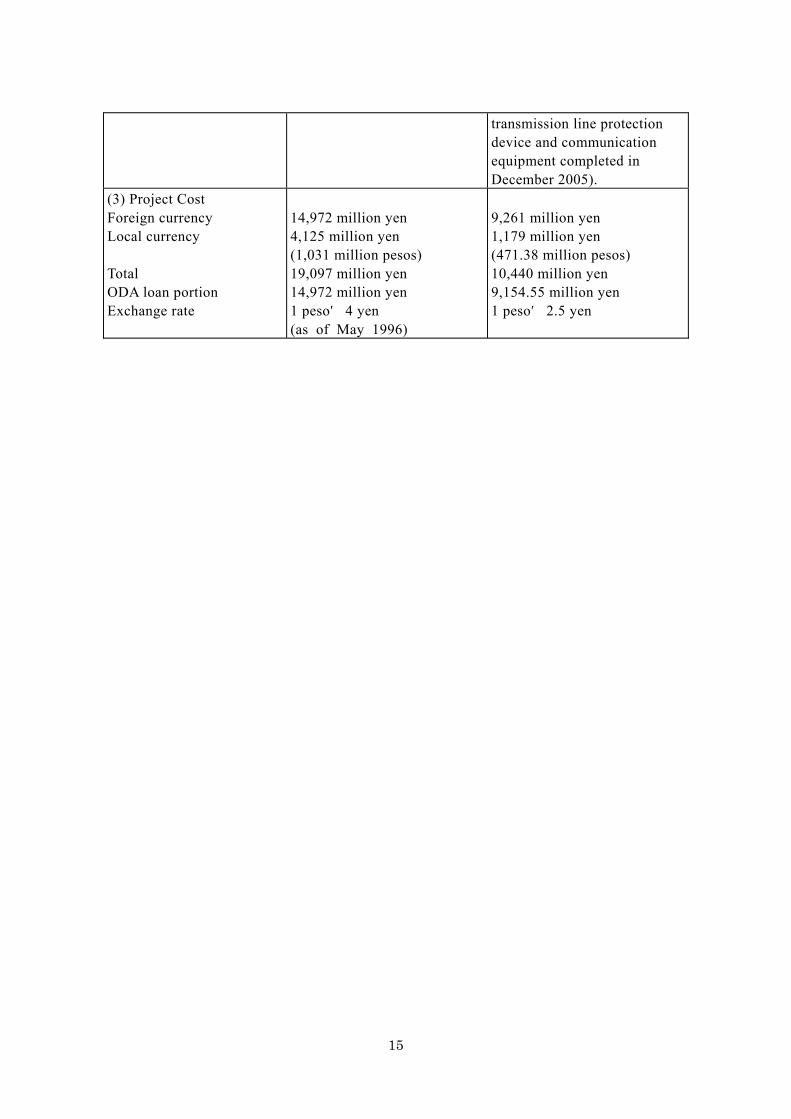
The planned project period was 56 months from March 1997it took 87 months from the signing of the loan agreement (Moperations (June 2004). The completion was delayed for sevprocess was delayed, the location of pylons was adjusted conditions, and it took time to acquire land for constructtransmission was available when the newly constructed BataCasecnan Power Plant started operations and therefore the deaffect power transmission from these two power plants. 2.2.3 Project cost
Project cost was reduced substantially as a result of effcompetitive bidding. The project cost (denominated in yen t
4
Casecnan HydroelectricPower Plant
an Jose Substatio
atangas Gas Power Plan
to November 2001. In fact, arch 1997) to the start of eral reasons. The bidding
according to geographical ion site. However, power ngas Gas Power Plant and lay in this project did not
icient contracting through erms) was 10,444 million
yen2, less than the initially estimated 19,097 million yen. 2.3 Effectiveness 2.3.1 Stable power supply to the Luzon grid 2.3.1.1 Power transmission from the Batangas Gas Power Plant
The transmission lines constructed in this project (Batangas Gas Power Plant – Tayabas Substation and Batangas Gas Power Plant – Dasmarinas Substation) were completed before the power plants started operations (September and October 2001, respectively) and have been transmitting electricity since the start of the operation of the Batangas Gas Power Plant (June 2002).
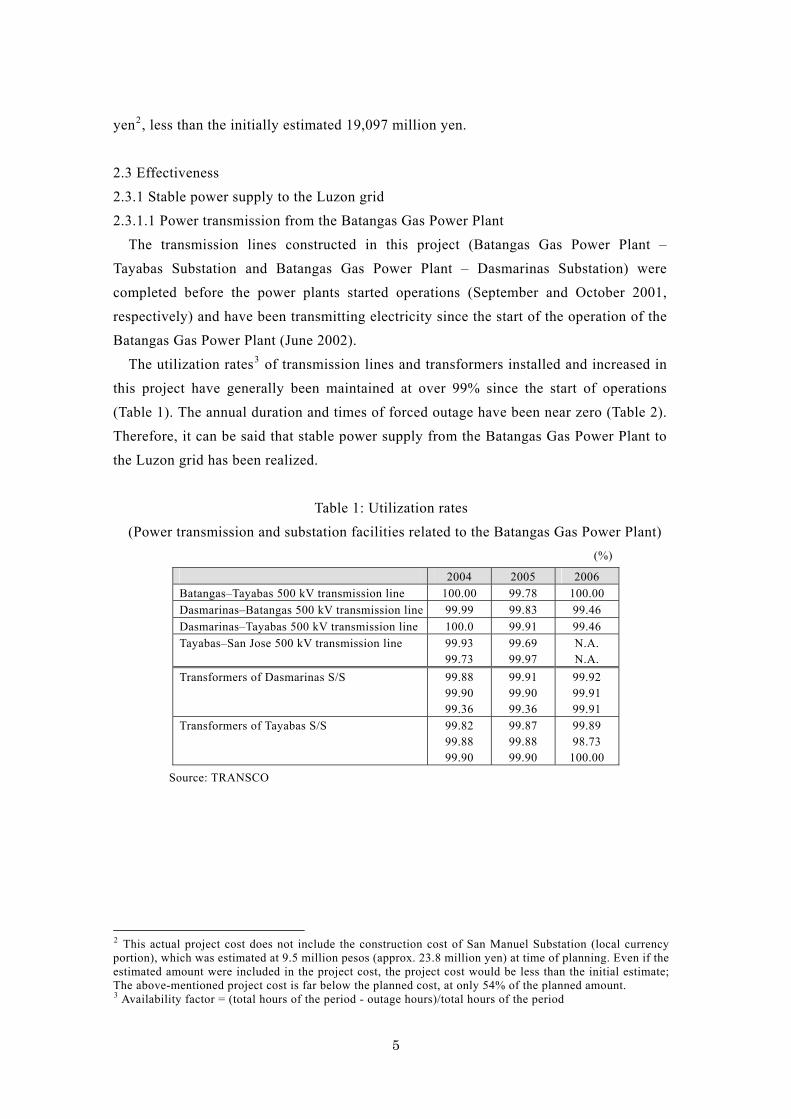
The utilization rates3 of transmission lines and transformers installed and increased in this project have generally been maintained at over 99% since the start of operations (Table 1). The annual duration and times of forced outage have been near zero (Table 2). Therefore, it can be said that stable power supply from the Batangas Gas Power Plant to the Luzon grid has been realized.
Table 1: Utilization rates (Power transmission and substation facilities related to the Batangas Gas Power Plant)
(%)
2004 2005 2006 Batangas–Tayabas 500 kV transmission line 100.00 99.78 100.00 Dasmarinas–Batangas 500 kV transmission line 99.99 99.83 99.46 Dasmarinas–Tayabas 500 kV transmission line 100.0 99.91 99.46 Tayabas–San Jose 500 kV transmission line 99.93
99.73 99.69 99.97
N.A. N.A.
Transformers of Dasmarinas S/S 99.88 99.90 99.36
99.91 99.90 99.36
99.92 99.91 99.91
Transformers of Tayabas S/S 99.82 99.88 99.90
99.87 99.88 99.90
99.89 98.73
100.00
Source: TRANSCO
2 This actual project cost does not include the construction cost of San Manuel Substation (local currency portion), which was estimated at 9.5 million pesos (approx. 23.8 million yen) at time of planning. Even if the estimated amount were included in the project cost, the project cost would be less than the initial estimate; The above-mentioned project cost is far below the planned cost, at only 54% of the planned amount. 3 Availability factor = (total hours of the period - outage hours)/total hours of the period
5
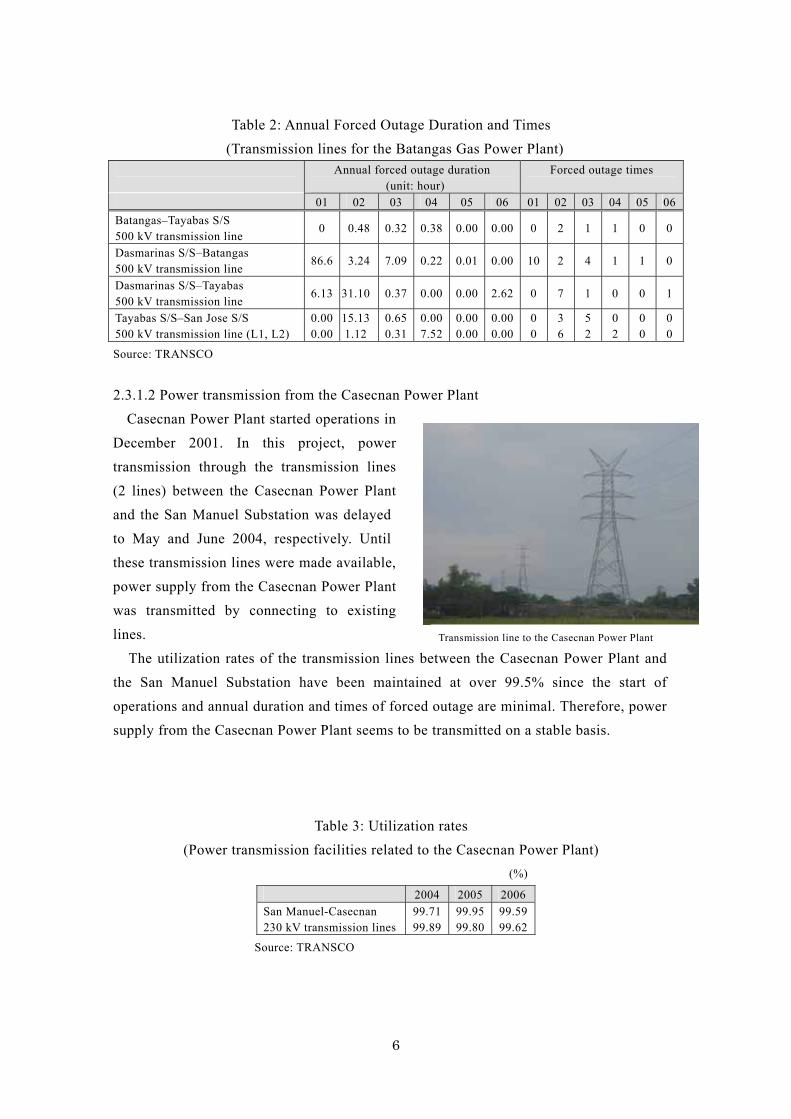
Table 2: Annual Forced Outage Duration and Times (Transmission lines for the Batangas Gas Power Plant)
Annual forced outage duration (unit: hour)
Forced outage times
01 02 03 04 05 06 01 02 03 04 05 06Batangas–Tayabas S/S 500 kV transmission line
0 0.48 0.32 0.38 0.00 0.00 0 2 1 1 0 0
Dasmarinas S/S–Batangas 500 kV transmission line
86.6 3.24 7.09 0.22 0.01 0.00 10 2 4 1 1 0
Dasmarinas S/S–Tayabas 500 kV transmission line
6.13 31.10 0.37 0.00 0.00 2.62 0 7 1 0 0 1
Tayabas S/S–San Jose S/S 500 kV transmission line (L1, L2)
0.000.00
15.131.12
0.650.31
0.007.52
0.000.00
0.000.00
00
3 6
5 2
0 2
0 0
00
Source: TRANSCO
2.3.1.2 Power transmission from the Casecnan Power Plant
Casecnan Power Plant started operations in December 2001. In this project, power transmission through the transmission lines (2 lines) between the Casecnan Power Plant and the San Manuel Substation was delayed to May and June 2004, respectively. Until these transmission lines were made available, power supply from the Casecnan Power Plant was transmitted by connecting to existing lines.
The utilization rates of the transmission lines between the Casecnan Power Plant and the San Manuel Substation have been maintained at over 99.5% since the start of operations and annual duration and times of forced outage are minimal. Therefore, power supply from the Casecnan Power Plant seems to be transmitted on a stable basis.
Transmission line to the Casecnan Power Plant
Table 3: Utilization rates (Power transmission facilities related to the Casecnan Power Plant)
(%)
2004 2005 2006San Manuel-Casecnan 230 kV transmission lines
99.7199.89
99.9599.80
99.5999.62
Source: TRANSCO
6
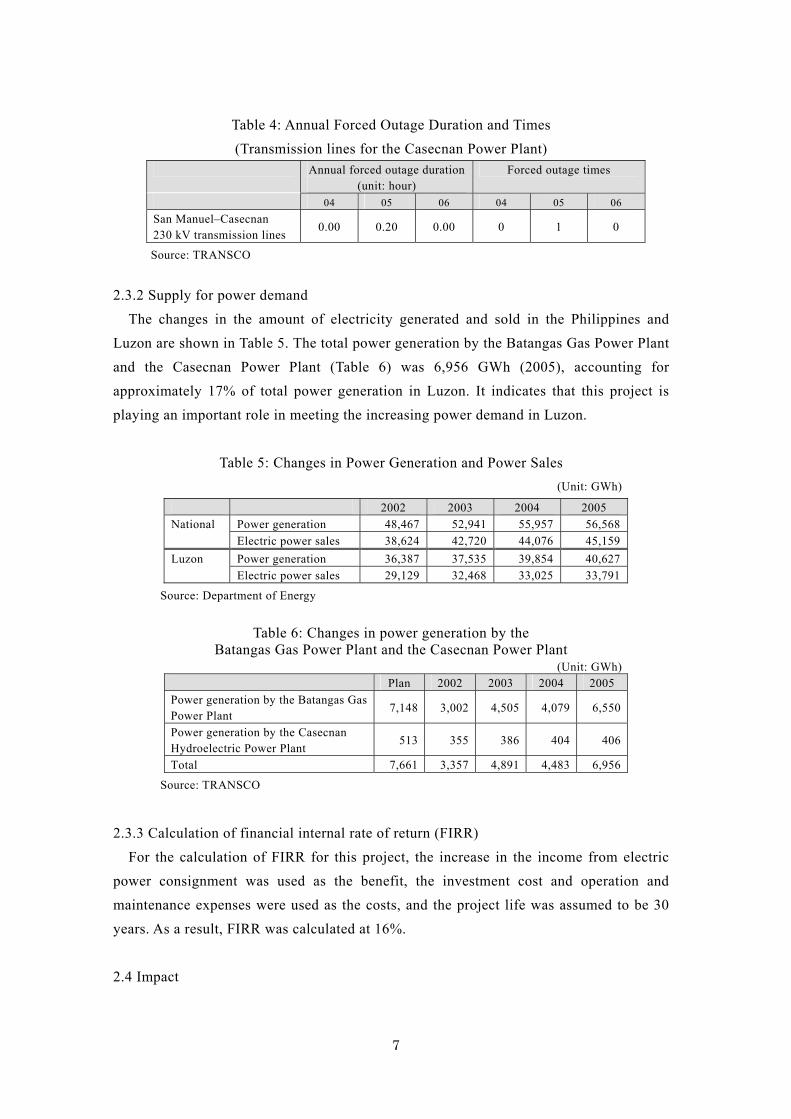
Table 4: Annual Forced Outage Duration and Times (Transmission lines for the Casecnan Power Plant)
Annual forced outage duration (unit: hour)
Forced outage times
04 05 06 04 05 06 San Manuel–Casecnan 230 kV transmission lines
0.00 0.20 0.00 0 1 0
Source: TRANSCO
2.3.2 Supply for power demand
The changes in the amount of electricity generated and sold in the Philippines and Luzon are shown in Table 5. The total power generation by the Batangas Gas Power Plant and the Casecnan Power Plant (Table 6) was 6,956 GWh (2005), accounting for approximately 17% of total power generation in Luzon. It indicates that this project is playing an important role in meeting the increasing power demand in Luzon.
Table 5: Changes in Power Generation and Power Sales (Unit: GWh)
2002 2003 2004 2005 Power generation 48,467 52,941 55,957 56,568 National Electric power sales 38,624 42,720 44,076 45,159 Power generation 36,387 37,535 39,854 40,627 Luzon Electric power sales 29,129 32,468 33,025 33,791
Source: Department of Energy
Table 6: Changes in power generation by the
Batangas Gas Power Plant and the Casecnan Power Plant (Unit: GWh)
Plan 2002 2003 2004 2005 Power generation by the Batangas Gas Power Plant
7,148 3,002 4,505 4,079 6,550
Power generation by the Casecnan Hydroelectric Power Plant
513 355 386 404 406
Total 7,661 3,357 4,891 4,483 6,956
Source: TRANSCO
2.3.3 Calculation of financial internal rate of return (FIRR)
For the calculation of FIRR for this project, the increase in the income from electric power consignment was used as the benefit, the investment cost and operation and maintenance expenses were used as the costs, and the project life was assumed to be 30 years. As a result, FIRR was calculated at 16%. 2.4 Impact
7
2.4.1 Increase in the transmission capacity of the Luzon grid In this project, along with the construction of transmission lines to connect new power
plants to existing grids, the transmission capacity of the existing grid was increased (by raising the voltage of the transmission lines between the Dasmarinas Substation and the Tayabas Substation, between the Tayabas Substation and the San Jose Substation and related substation facilities from 230 kV to 500 kV) in order to accommodate expected increase in the maximum power supply. As a result, the power transmission capacity to Metro Manila has increased as mentioned below. These works are considered to have contributed to the improvement of the stability of the Luzon grid. 2.4.1.1 Increase in the transmission capacity to Metro Manila
In Luzon, most power plants are located in the north and south of the island and the electric power generated in the power plants in these regions is sent to Metro Manila, the largest power-consuming area in the Philippines. According to the interview with power distributors in Manila, substations in Metro Manila, which are power delivery points of the Luzon grid, were overloaded before the project was implemented. After project completion, as a result of the increase in the transmission capacity of the Luzon grid around Metro Manila, it became possible for the substations in the northern and southern parts of Metro Manila to supply excess power to each other. Therefore, this project contributes to the prevention of overloading at substations and the stabilizing of power distribution in Metro Manila. 2.4.1.2 Improved stability of the grid
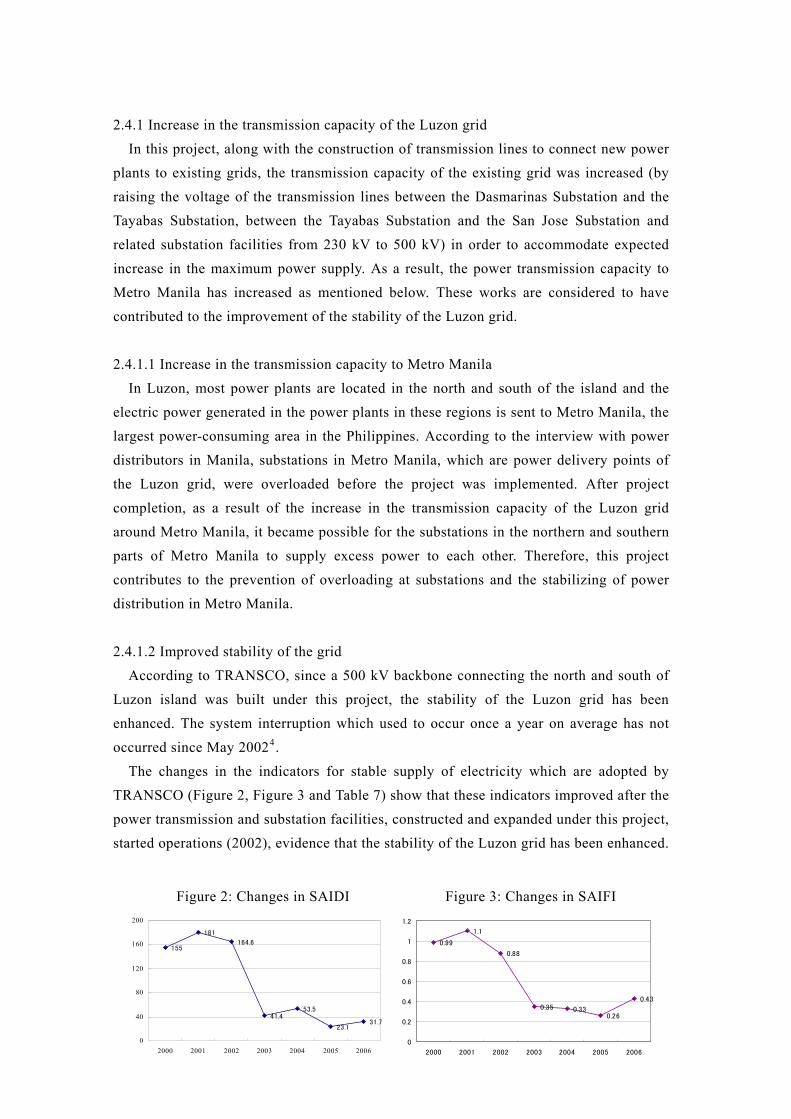
According to TRANSCO, since a 500 kV backbone connecting the north and south of Luzon island was built under this project, the stability of the Luzon grid has been enhanced. The system interruption which used to occur once a year on average has not occurred since May 20024.
The changes in the indicators for stable supply of electricity which are adopted by TRANSCO (Figure 2, Figure 3 and Table 7) show that these indicators improved after the power transmission and substation facilities, constructed and expanded under this project, started operations (2002), evidence that the stability of the Luzon grid has been enhanced.
4 Excluding
15
0
40
120
160
200
2000
F
80
8
those that were caused by typhoons.
図2 SAIDIの推移
5
181
164.6
41.453.5
23.131.7
2001 2002 2003 2004 2005 2006
0.9
0
0.2
0.4
0.6
0.8
1
1.2
2000
Figure 2: Changes in SAIDI
図3 SAIFIの推移9
1.1
0.88
0.35 0.330.26
0.43
2001 2002 2003 2004 2005 2006
igure 3: Changes in SAIFI
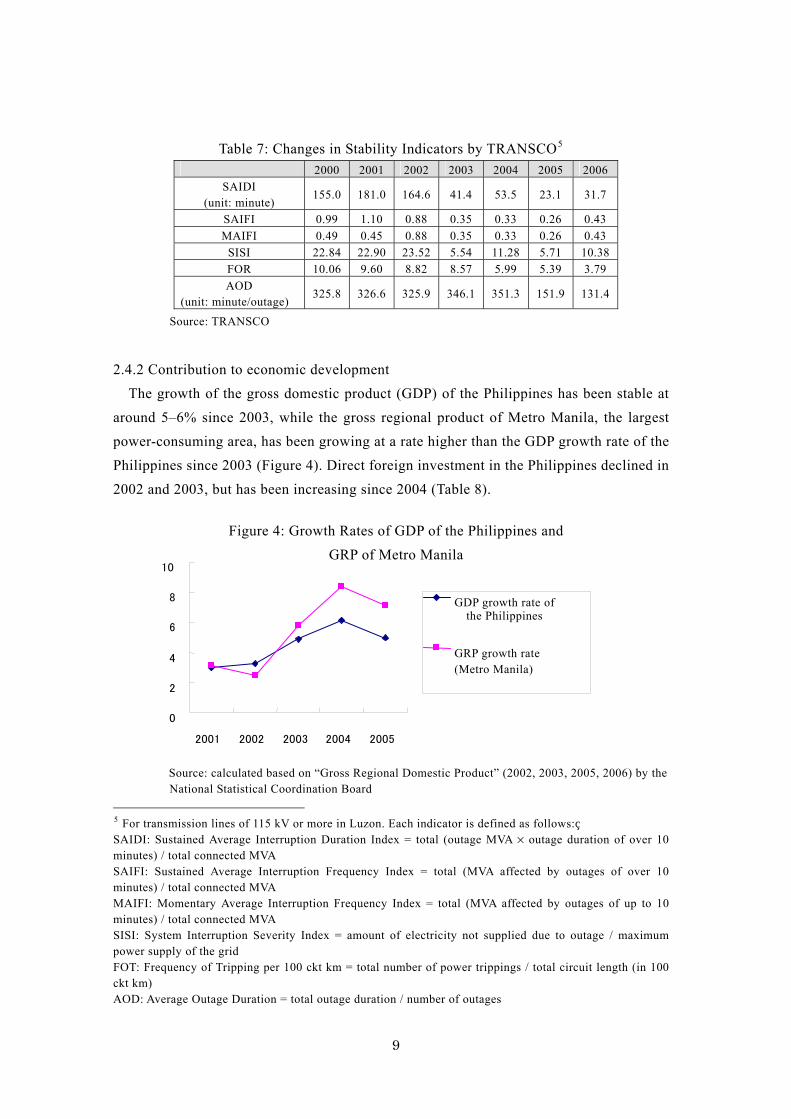
Table 7: Changes in Stability Indicators by TRANSCO5
2000 2001 2002 2003 2004 2005 2006 SAIDI
(unit: minute) 155.0 181.0 164.6 41.4 53.5 23.1 31.7
SAIFI 0.99 1.10 0.88 0.35 0.33 0.26 0.43 MAIFI 0.49 0.45 0.88 0.35 0.33 0.26 0.43
SISI 22.84 22.90 23.52 5.54 11.28 5.71 10.38 FOR 10.06 9.60 8.82 8.57 5.99 5.39 3.79 AOD
(unit: minute/outage) 325.8 326.6 325.9 346.1 351.3 151.9 131.4
Source: TRANSCO
2.4.2 Contribution to economic development
The growth of the gross domestic product (GDP) of the Philippines has been stable at around 5–6% since 2003, while the gross regional product of Metro Manila, the largest power-consuming area, has been growing at a rate higher than the GDP growth rate of the Philippines since 2003 (Figure 4). Direct foreign investment in the Philippines declined in 2002 and 2003, but has been increasing since 2004 (Table 8).
Figure 4: Growth Rates of GDP of the Philippines and GRP of Metro Manila
10
8 GDP growth rate of the Philippines
6
GRP growth rate 4 (Metro Manila)
2
0 2001 2002 2003 2004 2005
Source: calculated based on “Gross Regional Domestic Product” (2002, 2003, 2005, 2006) by the National Statistical Coordination Board
5 For transmission lines of 115 kV or more in Luzon. Each indicator is defined as follows: SAIDI: Sustained Average Interruption Duration Index = total (outage MVA × outage duration of over 10 minutes) / total connected MVA SAIFI: Sustained Average Interruption Frequency Index = total (MVA affected by outages of over 10 minutes) / total connected MVA MAIFI: Momentary Average Interruption Frequency Index = total (MVA affected by outages of up to 10 minutes) / total connected MVA SISI: System Interruption Severity Index = amount of electricity not supplied due to outage / maximum power supply of the grid FOT: Frequency of Tripping per 100 ckt km = total number of power trippings / total circuit length (in 100 ckt km) AOD: Average Outage Duration = total outage duration / number of outages
9
Table 8: Direct Foreign Investment in the Philippines (Unit: billion pesos)
2000 2001 2002 2003 2004 2005
207.89 193.76 99.18 63.79 192.95 231.23
Source: National Statistical Coordination Board, Board of Investment, Philippine Economic Zone Authority, Subic Bay Metropolitan Authority, and Clark Development Corporation
Comparing power consumption by user category in Luzon in 2000 before this project
was implemented and that in 2005 after project completion (Table 9), power consumption generally showed substantial increase. In order to assess the situation of the power supply and its effects on business operation, we interviewed companies and industrial complexes located in the outskirts of Metro Manila. Many of the interviewed acknowledged the general reduction in outage frequency and the time taken for outage recovery as well as the improvement in voltage fluctuations as compared with the situation before the project was implemented. Since this project is to supply electricity to the Luzon grid, it is difficult to identify direct power consumers or measure the direct contribution to the improvement in power supply. Considering that the power plants generating 10% of total power generation in Luzon are connected to the Luzon grid, it plays a significant role in power supply. Therefore, this project is believed to contribute to the improvement in the business environment by helping increase and stabilize the power supply in the Philippines (particularly in Luzon) and thereby support the recent economic growth of the country (particularly in Metro Manila). The number of beneficiaries of this project is estimated at approximately 13 million6 (population of Tokyo: 1.27 million).
Table 9: Changes in Power Consumption by User Category (Unit: GWh)
2000 2005
Growth Rate
Household 10,154 12,038 18.5% Commercial 8,339 10,495 25.8% Industrial 8,939 10,670 19.3% Others 485 589 21.4% Total 27,918 33,791 21.0%
Source: Department of Energy
6 Estimated by dividing the total power generation by the Batangas Gas Power Plant and the Casecnan Hydroelectric Power Plant in 2005 by per capita power consumption in the Philippines.
10
Table 10: Power Supply Share of the Project in the Total Power Generation in Luzon (%)
2002 2003 2004 2005 9.23 13.03 11.24 17.12
Source: calculated based on data from Department of Energy and TRANSCO
2.4.3 Others 2.4.3.1 Impact on the environment
Prior to the implementation of this project, an Environment Compliance Certificate (ECC) had been obtained and monitoring was conducted in compliance with the content of this ECC during and after the implementation. According to TRANSCO, the requirements of the ECC are satisfied and no specific problems have been reported. 2.4.3.2 Land acquisition and resident relocation
For the implementation of this project, necessary land acquisition was conducted. Monetary compensation was provided to 221 relocated households and 55 building owners for the construction of transmission lines for the Batangas Gas Power Plant and 85 relocated households and 19 building owners for the construction of transmission lines for the Casecnan Hydroelectric Power Plant. According to TRANSCO, procedures of land acquisition and compensation were carried out pursuant to the law. 2.5 Sustainability 2.5.1 Executing agency 2.5.1.1 Technical capacity
TRANSCO regularly conducts in-house technical training. Operation and maintenance of the facilities covered by this project are basically performed by experienced employees. Therefore, there seems to be no specific problem with operations and maintenance in the future. 2.5.1.2 Operation and maintenance system
Transfer of the assets and liabilities of the National Power Corporation (NPC) to the Power Sector Assets and Liabilities Management Corporation (PSALM) has been in progress since July 2001. The power transmission business is succeeded by TRANSCO (established in 2001 and starting operation independently in March 2003) which is affiliated with PSALM. Under EPIRA7, TRANSCO held several bids for the concession contract (25 years) with private companies for the operation and management of the
7 EPIRA stipulated that TRANSCO shall be privatized through (1) sale or (2) concession contract.
11
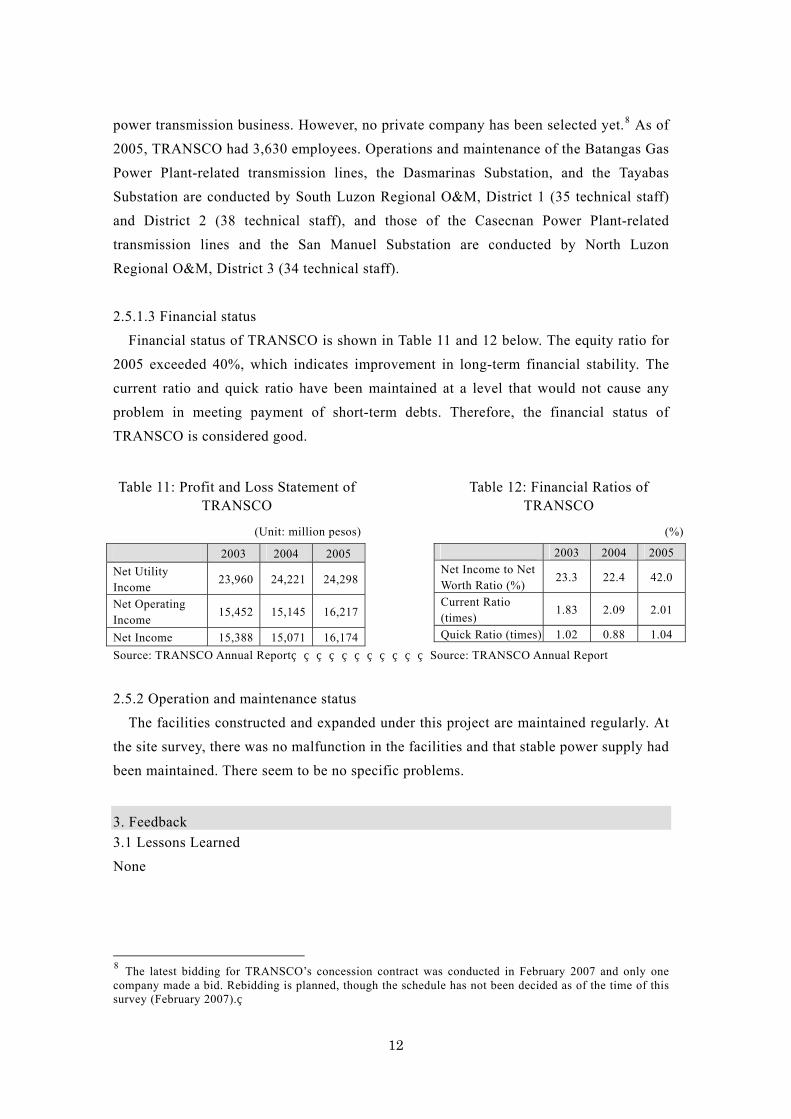
power transmission business. However, no private company has been selected yet.8 As of 2005, TRANSCO had 3,630 employees. Operations and maintenance of the Batangas Gas Power Plant-related transmission lines, the Dasmarinas Substation, and the Tayabas Substation are conducted by South Luzon Regional O&M, District 1 (35 technical staff) and District 2 (38 technical staff), and those of the Casecnan Power Plant-related transmission lines and the San Manuel Substation are conducted by North Luzon Regional O&M, District 3 (34 technical staff). 2.5.1.3 Financial status
Financial status of TRANSCO is shown in Table 11 and 12 below. The equity ratio for 2005 exceeded 40%, which indicates improvement in long-term financial stability. The current ratio and quick ratio have been maintained at a level that would not cause any problem in meeting payment of short-term debts. Therefore, the financial status of TRANSCO is considered good. Table 11: Profit and Loss Statement of
TRANSCO Table 12: Financial Ratios of
TRANSCO ((Unit: million pesos)
2003 2004 200Net Income to Net Worth Ratio (%)
23.3 22.4 42.
Current Ratio (times)
1.83 2.09 2.0
Quick Ratio (times) 1.02 0.88 1.0
2003 2004 2005 Net Utility Income
23,960 24,221 24,298
Net Operating Income
15,452 15,145 16,217
Net Income 15,388 15,071 16,174Source: TRANSCO Annual Report Source: TRANSCO Annual Report
2.5.2 Operation and maintenance status
The facilities constructed and expanded under this project are maintained regularly. Atthe site survey, there was no malfunction in the facilities and that stable power supply hadbeen maintained. There seem to be no specific problems.
3. Feedback 3.1 Lessons Learned None
8 The latest bidding for TRANSCO’s concession contract was conducted in February 2007 and only onecompany made a bid. Rebidding is planned, though the schedule has not been decided as of the time of thissurvey (February 2007).
12
%)
5
0
1
4

3.2 Recommendations None
13
Comparison of Original and Actual Scope Item Plan Actual
(1) Outputs Transmission lines for the Batangas Gas Power Plant Transmission lines for the Casecnan Hydroelectric Power Plant
1. Construction of 500 kV transmission lines (approx. 58 km) 2. Expansion of substation facilities (Tayabas, Dasmarinas, and San Jose Substations) 1. Construction of 230 kV transmission lines (approx. 88 km) 2. Expansion of substation facilities (San Manuel Substation)
Almost as planned (53.8 km) Almost as planned (transformers of Dasmarinas and Tayabas substations: 600 MVA × units → 200 MVA × 10 units) Almost as planned (80.8 km) As planned
(2) Project Period Transmission lines for the Batangas Gas Power Plant - Detailed design - Bidding procedure - Construction of
transmission and substation facilities
- Consultant services Transmission lines for the Casecnan Hydroelectric Power Plant - Detailed design - Bidding procedure - Construction of
transmission and substation facilities
Mar. 1997–Nov. 2001 (56 months) Dec. 1996–Jul. 1997 Aug. 1997–Apr.1998 May 1998–Nov. 2001 May 1997–Nov. 2001 Jan. 1996–Jan. 1997 Feb. 1997–Apr. 1998 Nov. 1997–Mar. 1999
Mar. 1997–Jun. 2004 (87 months) N/A Mar. 199–May 2000 Oct. 2000–Jul. 2002 Jul. 1999–Feb. 2003 N/A Jan. 1997–Nov. 1997 (procurement of materials equipment) N/A–Nov. 2004 (construction)Oct. 1998–May 2001 (manufacturing and delivery of materials and procurement) Jun. 1999–Dec. 2005 (construction of transmission and substation facilities; operation started in June 2004 and installation of the
14
transmission line protection device and communication equipment completed in December 2005).
(3) Project Cost Foreign currency Local currency Total ODA loan portion Exchange rate
14,972 million yen 4,125 million yen (1,031 million pesos) 19,097 million yen 14,972 million yen 1 peso=4 yen (as of May 1996)
9,261 million yen 1,179 million yen (471.38 million pesos) 10,440 million yen 9,154.55 million yen 1 peso=2.5 yen
15