The PGA TOUR's Data Collection System How it is used; · PDF fileThe PGA TOUR's Data...
21
The PGA TOUR's Data Collection System – How it is used; what has been learned ShotLink: Steve Evans SVP Information Systems
Transcript of The PGA TOUR's Data Collection System How it is used; · PDF fileThe PGA TOUR's Data...
The PGA TOUR's Data Collection System –
How it is used; what has been learned
ShotLink:
Steve Evans
SVP Information Systems

Introduction
• ShotLink Supports:
– 3 TOURs: PGA TOUR, Champions Tour,
Nationwide Tour
– 100 tournaments

Agenda
• Collecting Data: The ShotLink System
– How ShotLink works
– Our data set
• Distributing Data: How is it used?
– Fan Enhancements
• Analyzing Data: What have we learned?
– Enhanced Broadcast Statistics
– Improving Amateur Play
– New Stats to Measure Professional Play
• ShotLink Intelligence / Prize

The Vision:
• To turn data into information,
- information into knowledge,
- knowledge into entertainment
• “Every Shot, Every Player, Real Time”
Collecting Data: The ShotLink System

Volunteers
Walking Scorers
Volunteers
Laser Operators

• Tournament Results from 1916 – present *
• 1983 – 1992: Round statistics
• 1992 – 2001: Hole by hole statistics
• 2001 – 2002: Shot-level data **
• 2003 – present: Quality shot-level data ***
* 1916 – 1980 contains results that may be incomplete
** 2001 – 2002 Shot-level data at varying levels of quality (Ramp up period for ShotLink)
*** Shot-level data available for PGA TOUR only
A Summary of our Data Set – Across 3 Tours

• 9,000 Tournaments
• 4,000 Courses
• 28,000 Players
• 741,000 Results Records (1 per player per event)
• 1,000,000 Scorecards
• 18,000,000 Hole-level entries
• 21,000,000 Shot-level entries
• Highly structured data set
• Distance data accurate to +/- 2” on the green and +/- 1 yard on the fairway (on average)
A Summary of our Data Set – Across 3 Tours

Distributing Data: How is it Used?
25%31%T5thBirdie or Better Pct -< 125 yards
-.169-.316T3rdApproach < 125 yards (RTP Score)
29' 0"16' 9"6thApproaches < 125 yards (Rough)
87%93%6thGIR Percentage -< 125 yards
-.187-.500T2ndApproach 100-125 yards (RTP Score)
21' 10"16' 3"7thApproaches from 100-125 yards
79%100%T1stGIR Percentage -100-125 yards
18%33%T4thBirdie or Better Pct -125-150 yards
28' 5"16' 0"2ndApproaches from 125-150 yards
78%100%T1stGIR Percentage -125-150 yards
Field Avg.Winner StatWinner RankStat
Geoff Ogilvy vs. The 2009 Mercedes-Benz Championship Field
Inte
rnet

• Introduction of color LED Scoreboards
Distributing Data: Fan Enhancements

• Expansion of large format video walls
Distributing Data: Fan Enhancements

• Mobile Device Policy
Distributing Data: Fan Enhancements

Analyzing Data: What Have we Learned?
• Better broadcast statistics
• Compare amateur data to the professionals
• Introduction of new stats
– Strokes Gained - Putting
Ten years of ShotLink Data -
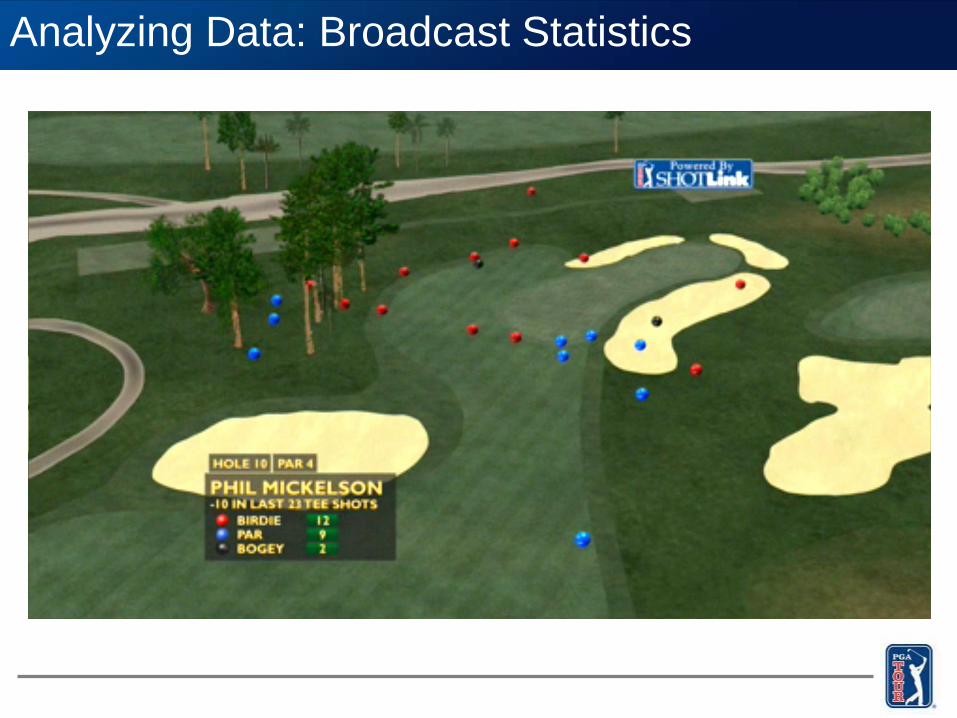
Analyzing Data: Broadcast Statistics

•• Short : 55%
• Made : 4%
• Long : 41%
30-Handicap20-Handicap
• Short : 44%
• Made : 6%
• Long : 50%
Dave Pelz Analysis of Amateur Play at the WAHC

0-Handicap
• Short : 44%
• Made : 10%
• Long : 46%
Dave Pelz Analysis of Amateur Play at the WAHC

TOUR Pro• Short : 15%
• Made : 15%
• Long : 70%
Dave Pelz Analysis of Amateur Play at the WAHC

Stroked Gained - Putting
• A result of our ShotLink Intelligence program
which is powered by CDW
• New stat in 2011
• Based on research from Columbia University
(Broadie) extended by MIT (Graves)
• First putting stat that values the distance of
the putt
• Which is better: A 2-putt from 8' or a 2-putt
from 33'?
– At 7' 8" a 2-putt loses ½ a stroke
– At 33' a 2-putt neither gains nor loses strokes

Strokes Gained - Putting
• If you miss two 8' putts, you lose 1 stroke
• Which means…
– You have to make two additional 8' putts… OR
– You have to make a 14' putt and a 5' putt… OR
– You have to make a 100' putt…
• 70% of PGA TOUR winners finish the event ranking in
the top 15. They average 1.25 strokes per round better
than the field in those victories
– Just to get back to even!

Introducing: The ShotLink Intelligence Prize

ShotLink Intelligence Prize
• Challenges Academics to find the best use of ShotLink Data
• Available to all ShotLink Intelligence Participants
• Details available at www.pgatour.com/ShotLinkIntelligence
• Papers Due November 1, 2012
• Best paper receives $25,000 technology gift for their
university
• Winner Announced no later than March 31, 2013
• Working with The Journal of Quantitative Analysis in Sports
(JQAS) regarding a special golf issue

These Guys Are Good