The Perverse Effects of Partial Employment Protection Reform: The … · 2016-06-17 · The...
42
1 The Perverse Effects of Partial Employment Protection Reform: The Case of French Older Workers Luc Behaghel*, Bruno Crépon** and Béatrice Sédillot*** French firms laying off workers aged 50 and above have to pay a tax to the unemployment insurance system, known as the Delalande tax. We evaluate the impact of this tax on layoffs as well as on hiring, taking advantage of several changes in the measure since its introduction in 1987. A legislative change in 1992 exempted firms from the tax for workers who were hired after age 50. Following this change, the transition rate from unemployment to employment increased significantly for workers over 50 compared to workers under 50. The difference is sizeable: between one third and one half of the initial transition rate. Evidence on the effect on layoffs is less clear cut. The impact is sizeable only for the most stringent tax schedule, after 1998. Keywords: Employment protection; older workers; layoff; hiring. JEL classification: J23; J63; J65. * Corresponding author. Paris School of Economics (lea, INRA) and Crest-INSEE – 48, bvd Jourdan – 75014 Paris ; [email protected] ** CREST-Insee ; [email protected] *** DARES ; [email protected] We are particularly grateful to David Blau, Pierre Cahuc, Thierry Magnac, Thomas Piketty, and two anonymous reviewers for helpful comments. We also thank participants to the 2006 EEA-ESEM meetings, seminar participants at CREST, Lunch Seminar Jourdan and at Insee Research Seminar. The usual disclaimer applies.
Transcript of The Perverse Effects of Partial Employment Protection Reform: The … · 2016-06-17 · The...

1
The Perverse Effects of Partial Employment Protection Reform: The Case of French Older Workers
Luc Behaghel*, Bruno Crépon** and Béatrice Sédillot***
French firms laying off workers aged 50 and above have to pay a tax to the unemployment insurance system, known as the Delalande tax. We evaluate the impact of this tax on layoffs as well as on hiring, taking advantage of several changes in the measure since its introduction in 1987.
A legislative change in 1992 exempted firms from the tax for workers who were hired after age 50. Following this change, the transition rate from unemployment to employment increased significantly for workers over 50 compared to workers under 50. The difference is sizeable: between one third and one half of the initial transition rate.
Evidence on the effect on layoffs is less clear cut. The impact is sizeable only for the most stringent tax schedule, after 1998.
Keywords: Employment protection; older workers; layoff; hiring. JEL classification: J23; J63; J65. * Corresponding author. Paris School of Economics (lea, INRA) and Crest-INSEE – 48, bvd Jourdan – 75014 Paris ; [email protected] ** CREST-Insee ; [email protected] *** DARES ; [email protected] We are particularly grateful to David Blau, Pierre Cahuc, Thierry Magnac, Thomas Piketty, and two anonymous reviewers for helpful comments. We also thank participants to the 2006 EEA-ESEM meetings, seminar participants at CREST, Lunch Seminar Jourdan and at Insee Research Seminar. The usual disclaimer applies.

2
1. Introduction
Confronted with persistently high unemployment rates, most countries in Continental Europe have reformed their employment protection over the past two decades. These reforms have however generally been partial, as governments developed exceptions to the main employment contract while leaving the latter largely untouched. A well-studied example is the development of fixed-duration contracts and its coexistence with indefinite duration contracts. Such partial employment protection reforms have unintended perverse effects. In the case of France, for instance, Blanchard and Landier (2002) and Cahuc and Postel-Vinay (2002) show how fixed-duration contracts increased the segmentation of the labor market.
In the case of fixed-duration contracts, segmentation occurs because firms and workers select one type of contract depending on their characteristics and their negotiation power; the law in itself does not make a distinction between workers based on such characteristics as age, gender, disability status or experience. In this paper, we study employment protection reform in a case where the law explicitly treats workers differently depending on their age. Specifically, we study the impact of the Delalande tax, a measure introduced in 1987 in France to discourage firms from laying off older workers.1 Firms have to pay a tax to the UI system each time they lay off a worker aged above 50.2 The amount of the tax is proportional to the worker’s gross wage at the time of layoff; it has varied over time but can be as high as twelve months of gross wages. Moreover, in 1992, a major reform occurs that exempts workers who are hired after the age of 50.
Studying the impact of the Delalande tax is interesting for two reasons. First, the tax provides a good illustration of the potential benefits and drawbacks of targeting employment protection on specific groups of workers. On the one hand, the benefits of having the firms internalize the cost of laying off older workers are likely to be high. Indeed, the probability that an unemployed older worker finds a job is very low in France. Jointly with high layoff rates and the widespread use of early retirement schemes, this explains the low employment rate of older workers in France: for male workers aged 55 to 59, it has fallen dramatically in the early eighties and stabilized below 60% since then. The social cost of this low employment rate is probably high, but firms do not seem to internalize it; they rather tend to view the early exit of older workers as a painless way to adjust their workforce (Behaghel and Gautié, forthcoming). The question is therefore whether the tax has been effective in modifying firms’ and workers’ behavior. On the other hand, standard theory predicts that firms will refrain from hiring heavily protected workers, as they expect higher total labor costs. This negative effect of employment protection on hiring may be particularly acute in the case of the Delalande tax.
1 Temporary layoffs do not exist as such in France. Throughout the rest of this paper, we use the word “layoff” for permanent layoffs. 2 The age threshold was 55 in 1987 but was lowered to 50 after 1992.

3
Indeed, firms may easily substitute younger (less protected) workers to older (more protected) ones. Moreover, as the Delalande tax is paid to the UI system, its negative effect cannot be undone by private transfer, as opposed to severance payments in Lazear’s (1990) argument. Overall, the Delalande tax appears as a case where the desired as well as the undesired effects of employment protection may both be particularly strong: it therefore appears as an interesting measure to study.
The second interest of the Delalande tax is that it has undergone several major legislative changes that provide useful sources of identification. Building on these changes, we are able to separately analyze the effects of the tax on the probability that a worker is hired or laid off.
The approach and the key results can be summarized as follows. We start by studying the adverse impact of the tax on hiring. We take advantage of a change that occurred in 1992 and exempts firms from the tax for workers hired after the age of 50, if they are laid off later on. If there was any adverse impact of the tax on unemployed workers aged above 50, it disappeared in 1992; it should therefore be evidenced ex post by an increase in the hiring rates for this particular age group. Indeed, we find that the chances of finding a job increased for unemployed workers aged just above 50 relative to those just below 50. The difference-in-difference estimate is sizeable (around one third or one half of the initial transition rates), pointing toward a large adverse effect of the tax on hiring. Then, we study the desired effect of the tax on layoffs. We use three changes in the tax schedule (in 1987, 1992 and 1998) to infer consequences on layoff rates, using workers in the unprotected age group (below 50) as a control group. Our results show that the tax reduced layoffs for older men; however, the estimates are imprecise and rather small, except for the most stringent tax schedule in 1998. Results for women are sensitive to the specification. We view the negative impact of the tax on the hiring rates of workers older than 50 as an example of ‘perverse effect’ of a partial reform: by targeting employment protection on a limited age group, the legislator has induced substitution from these workers toward younger ones. It is unclear whether the reduction in layoffs is sufficient to compensate for this unfavorable effect.
Our paper relates to a handful of recent papers that use variation in labor legislation across groups of workers in a given country as a way to provide micro evidence on the impact of employment protection. Acemoglu and Angrist (2001) look at the effect of the American with Disabilities Act: they find that it reduced the employment rate of the protected group, the disabled workers, most likely through lower hiring rates – but they do not find significant effects on layoffs. Autor, Donohue and Schwab (2002) find that employment of protected groups is ultimately reduced by the adoption of wrongful-discharge laws by various States in the U.S. In Colombia, Kugler (2004) finds that a reduction in dismissal costs increased separations and accessions for formal workers relative to informal workers, and more so in larger firms that were most likely to be affected by the reform. Kugler and Pica (2005) study the impact of a reform increasing unjust dismissal costs for firms below 15 employees in

4
Italy. They find that both accession and separation probabilities decreased in small relative to large firms. In Italy as well, Schivardi and Torrini (2004) study the impact of employment protection on the distribution of firm size. They find that more stringent employment protection for large firms has slightly reduced the propensity of firms to grow. Hernanz, Jimeno and Kugler (2003) study the age-specific employment protection in Spain. They analyze the 1997 reform that reduced dismissal costs and payroll taxes for workers under 30 and over 45. They find that, for men, permanent employment probabilities increased for the two age groups, as did transition rates between unemployment and employment. Effects on women are weaker. Last, Hakola and Uusitalo (2005) study the impact of the experience rating of unemployment pension benefits in Finland, using a reform that affected firms differently depending on their size. They find that layoffs are sensitive to the degree of experience rating; but they do not assess the adverse effect on hiring. Overall, we believe that our results add to the micro evidence on the two effects of employment protection on hiring and layoff, especially by providing unusually clear evidence on the effect on hiring, thanks to a unique natural experiment.
The paper proceeds as follows. Section 2 details the legislation of the Delalande tax and the sources of identification provided by the various legislative changes. Section 3 presents the data. Section 4 deals with the effect on hiring, and section 5 with the effect on layoffs. Section 6 concludes.
2. Overview of the Delalande tax: legislative changes and natural experiments
Since its introduction in 1987, the Delalande tax has been modified several times. However, its principle has remained unchanged. Firms laying off workers above a certain age threshold have to pay a tax (“la contribution Delalande”) to the UI system (Unédic). This tax is proportional to the gross wages of the worker. It is only due if the worker is employed under an indefinite term contract (CDI). Only the private sector is concerned (civil servants may not be laid off). From 1987 to 1992, the tax amounted to three months of gross wages for all workers aged 55 and above. From 1992 on, the amount of the tax depends on the age of the laid-off worker (starting at the age of 50) and, for some periods, on the size of the firm (table 1). Exemption rules also vary. These changes are sources of variation that help identify the effects of the tax. However, other major changes affecting the employment prospects of older workers occurred during this period. This section therefore reviews the main legislative changes in the Delalande tax to assess them as sources of identification.
The introduction of the tax (1987)
It is interesting to notice that the introduction of the Delalande tax occurred almost by surprise: it was voted as an amendment to a law on long-term unemployment, and the

5
government does not seem to have been involved in its elaboration – a member of Parliament, Delalande, proposed the amendment during the night when the vote took place. The amendment actually had two purposes: restore the financial balance of the UI system and counteract a recent and sharp increase in the number of layoffs of older workers. This increase was explained by a weakening of employment protection in 1986, with the suppression of the administrative authorization that used to be required for layoffs. The government used this administrative authorization as a way to induce firms to use early retirement schemes when dismissing older workers. Firms had to pay part of the cost of these schemes. After 1986, they rapidly turned to layoffs, which were less costly to them and still provided generous unemployment benefits to older workers. Hence, in part, the introduction of the Delalande tax is driven by a general change in the strictness of employment protection. As this change concerned all workers and was not due to changes in the employability of older workers around 1987, it is arguably exogenous with regard to the relative demand for older workers and can thus be considered as a good source of variation to study the impact of adjustment costs on that relative labor demand. One caveat applies, though: the surge in layoffs of older workers that preceded the introduction of the tax may have consequences on the relative evolution of layoff rates of older workers, compared with younger ones. Specifically, this surge may partly reveal an increasing trend in layoff rates of older workers; if that trend is neglected, the effect on layoffs of the Delalande tax may be underestimated. Conversely, if the surge in layoffs before 1987 was strictly accidental, perhaps only the most productive older workers remained in employment in 1987, thus leading to lower layoff rates after 1987: if this is not taken into account, the estimated effect of the Delalande tax would be biased upward.
To summarize, the introduction of the Delalande tax in 1987 presents some of the features of a natural experiment. It is driven by an economy-wide shock (a global change in employment protection) that is not directly related to the outcome of interest (the employment of older workers). However, two issues arise: trends in the relative demand for older workers as well as changes in unobserved heterogeneity may bias inference based on a comparison of the evolution of layoff rates across ages.
The 1992 changes
Two major changes occurred in 1992. First, the schedule of the tax was modified. Workers above 50 (instead of 55) are now liable for the tax, but the amount due in case of a layoff varies with age, from one to six months of gross wages. Overall, this is a substantial increase: the amount of the tax is multiplied by two for workers above 56. Figure 1 compares the cost of the Delalande tax to the mandatory severance payments that are also due (to the worker and

6
not to the UI system) in case of layoff.3 After the age of 55, the amount of the Delalande tax is clearly larger than the average mandatory severance payment. Second, the tax is now restricted to workers who were hired before the age of 50 or who had been unemployed for less than three months if they were hired after the age of 50.
The increase in the tax schedule in 1992 constitutes a complex source of variation. The political context had changed: the government implemented this increase as part of an effort to raise the employment rate of older workers4 and of a global move toward more stringent employment protection, reversing changes made by the 1986-1988 government. Second, the economic context was characterized by a slowdown of growth that was part of France’s most severe recession since World War II, in 1993. This particular context may have had consequences on the relative demand for older workers. Third, the variation in the tax schedule with age renders the incentives more complex. On the one hand, a higher tax level at a given age makes it more costly to lay the worker off. But, on the other hand, the fact that the tax increases with age gives firms the incentive to lay off a worker earlier than otherwise, so as to avoid liability for a higher layoff cost in the future. Intuitively, the effect of the 1992 schedule can therefore be decomposed into two parts: the higher the level of the tax, the lower the layoff rate; but the higher the age slope of the tax, the higher the layoff rate.5 This second effect – the effect of the slope of the schedule – also existed for workers just below 55 in the 1987 schedule: it is now smoothed and applies to protected workers as well as to workers entering the protected age.
The second change exempted firms from the tax for workers who were older than 50 at the time of hiring and had been unemployed for at least three months. This provides a unique setting to study the effect of employment protection on hiring. Indeed, it introduces a sharp discontinuity, at the age of 50: firms hiring unemployed workers above 50 will not be liable for the tax if they lay off these workers later on; but they will if they hire workers below 50 and fire them after they turn 50. In other words, after 1992, the adverse effect of employment protection applies to unemployed workers just below 50, but not to those just above 50. This discontinuity provides a simple source of identification: the effect of the tax on hiring can be estimated from differences in hiring rates above and below the 50-year threshold. To get a sense of the advantage of this natural experiment, it is helpful to compare it to the introduction of the tax in 1987. When the tax was introduced, the consequence was that all unemployed workers became more costly to hire, as the firm was facing the possibility of paying the
3 In France, mandatory severance payments depend on the tenure of the worker in his firm. This is taken into account in the computations of figure 1: we use the distribution of workers’ tenure to compute the average amount of severance payments. However, additional severance payments may be due depending on the industry; these are not taken into account here. For details on the cost of employment protection in France, see Abowd and Kramarz (2003). 4 Access to early-retirement schemes is slightly restricted on the same period. 5 This decomposition can be derived in a formal model of labor demand with adjustment costs (see Behaghel, Crépon and Sédillot, 2004). A key assumption is that there is no uncertainty, so that the schedule of the tax years ahead does not intervene.

7
Delalande tax if it were to lay the worker off after the age of 55. Only the degree to which the firm was likely to incur that cost varied according to the age of hiring (once discounted, the Delalande cost was probably negligible for workers hired below the age of 30, for instance). However, disentangling this (continuous) effect of age on the expected Delalande cost from the (continuous) impact of age on productive characteristics that determine hiring rates would be problematic. After 1992, a comparison of hiring rates just above and below the age of 50 is in principle enough to identify the effect of the tax, under the assumption that other age effects on hiring rates are continuous and thus negligible on very short age windows. As discussed in more details in section 4, this discontinuity approach identifies the relative effect of the tax on the two age groups rather than the effect on one of the groups. Indeed, the two groups are affected by the reform. One should not think of unemployed workers over 50 as a “control group” unaffected by the change. They are affected for two reasons: first, they used to be liable for the tax and they are not anymore after 1992 (their own labor cost decreases); second, they are indirectly impacted by the fact that the labor cost of workers under 50 increases, as it can induce substitution effects in their favor. The important point here, however, is that the two age groups are affected in opposite directions based on a discontinuous criterion: this is what we use for identification.
The 1998 change
In 1998, the major change was an increase in the schedule of the tax for firms with more than 50 workers. This rise in the tax was implemented in a context of rapidly growing employment that benefited all categories of workers, except older unemployed workers.
Other policies affecting older workers’ employment
The pension reform that was progressively implemented after 1993 introduced incentives for longer careers in the private sector. Pensions were calculated on the best 25 years salaries instead of the 10 best years, and the number of years of contributions required for a full pension was raised from 37.5 to 40. This reform affected all workers and in particular introduced no discontinuity between workers aged under and over 50.
Over the 1990s, other public policies were more specifically targeted on older workers and may have influenced their transition rate from unemployment to employment. From 1990 to 1995, the ‘Contrat de retour à l’emploi’ (CRE) provided financial incentives (monthly subsidy and exemption of employers social contributions) to recruit long-term unemployed in the private sector. The policy had an age-specific component: in 1992, the CRE was enlarged to almost all jobseekers aged over 50. The firms hiring long-term unemployed over 50 benefited from a permanent exemption of employers’ social contributions. This enlargement was almost concomitant to the change in the Delalande tax but did not restrict to indefinite duration contracts. In 1995, the ‘Contrat initiative emploi’ (CIE) replaced the CRE. From 1996, the

8
CIE also provided more financial incentives to firms recruiting long-term unemployed over 50 (exemption of employer social contribution up to retirement, higher level of monthly subsidy).
Given the specific provisions of CRE and CIE for jobseekers over 50, it is particularly important for our empirical analysis to disentangle the impact of the CRE-CIE policy from the impact of the Delalande tax. This is rendered possible by the fact that, although the two policies were reinforced in 1992, they were modified at different dates (1995 vs. 1998), and that the CRE and CIE targeted broader groups than the Delalande tax (all long term jobseekers were affected, not only those over 50). Their effects can thus be identified separately. Additionally, the CRE and CIE policies apply to workers under all types of contracts, whereas the Delalande tax only applies to workers under indefinite duration contracts.
To summarize, legislative changes in 1987, 1992 and 1998 provide various sources of identification to study the impact of the Delalande tax, by comparing the probability of layoff and hiring of different groups of workers at specific periods of time. However, the most convincing sources of variation to study the impact on layoffs are not as convincing to study the impact on hiring, and vice versa. In the next sections, we therefore choose to separately estimate these two effects, at the expense of providing a global assessment of the impact of the tax on employment. We start by briefly reviewing the data we use.
3. The data
We use the 1982 to 2002 waves of the French Labor Survey (Enquête Emploi). This is a rotating panel, with yearly interviews: members of a household are interviewed three years in a row, in March, and then leave the panel. We use the data at different time frequencies for studying hiring and layoffs. Concerning hiring, it is important to be able to precisely date the transition so as to use the age discontinuity at 50 and to be able to set apart workers who have been unemployed for less than 3 months, as they are not exempted from the tax. We therefore infer monthly transitions from the retrospective information on the date at which a new job started (if any). Concerning layoffs, we use yearly transition rates.
The advantage of using the Enquête Emploi is that it provides detailed information on individual characteristics that affect hiring and layoff. Information on the firm (firm size, industry) is also available. Particular attention is paid to the definition of the employment status. Indeed, only workers under indefinite duration contracts in the private sector are liable for the tax. Due to a change in the design of the Enquête Emploi, this status has to be inferred from several questions (see Behaghel et al., 2005).

9
We end up with two samples. The first sample of unemployed workers is used to study the effect of the Delalande tax on hiring; it includes all workers observed at two successive interviews and who were unemployed and aged between 45 and 54 at the first interview. Descriptive statistics are given in table A1. They show the low levels of education among older unemployed workers, and the large share of long-term unemployed.
The second sample is used to study the impact of the tax on layoffs; it includes all workers surveyed at two successive dates and who were employed under an indefinite-term contract and aged between 40 and 58 at the first interview. Table A2 displays descriptive statistics on that sample.
4. The effect on hiring
Empirical strategy
The identification of the effect on hiring uses the fact that the 1992 reform increases the tax schedule while exempting workers hired when they are more than 50 years old. As a consequence, the expected labor cost of a worker under increases, while the expected cost of a worker over 50 decreases.6 As the relative cost of workers under 50 increases compared to those over 50, standard labor demand theory predicts that the firm should substitute workers over 50 for workers under 50.
To test that prediction, the strict application of the regression discontinuity approach would imply estimating:
( ) ( )( ) ( )( )( )1992post εt,50hEεt,50hEεΔ≥
+−−=t
,
where h is a binary variable that denotes the occurrence of a hiring at date t, for a worker aged just below (or just above) 50, with ε being as close as possible to 0.
However, two considerations lead us to increase the age window (ε). First, the effects of the 1992 reform also vary with age within the under-50 and over-50 age categories. Consider the tax exemption: it concerns workers aged over 50, but among them, those aged 54-55 are the most impacted as they were the closest to being liable for the tax (remember that, before 1992, the tax started at age 55). Taking into account this discounting effect, we thus expect the highest increase in transition to employment for unemployed workers around 54-55 and the lowest for workers aged just above 50. The second part of the 1992 change is the increase in the tax. This concerns only unemployed workers below 50. Among them, due to the same
6 Note that, by contrast with severance payments whose effects can be undone by the side payments between the worker and the firm (Lazear, 1990), the tax is due to the unemployment insurance is therefore at least partly paid by the firm.

10
discounting reasoning, we expect the decrease in transition rates to be highest for those closest to the protected age, i.e. those just below 50. To clarify the two effects a bit more formally, take a very simple model with exogenous7 job destructions. All jobs generate a surplus p each year which is assumed to be independent of age. Jobs are destroyed at rate d, and all workers retire at age A. Time is discounted at rate ρ. If the job is destroyed before A, a tax f(a), varying with age a, has to be paid to the UI: this is the Delalande tax. In that setting, the expected surplus of a job can be written recursively as
))1()1()1(()( +×−+−+= afdaSdpaS ρ if a<A,
and S(A-1)=p. Changes in S(a) that result from the 1992 reforms can be expressed as a function of a, f, p, d, A and ρ. They are displayed in figure 2 for some values of the parameters (p=1 by normalization, A=60, d=.04, ρ=.85).8 The figure highlights the discontinuity at age 50. But it also shows the different ‘treatment doses’ received by different age groups: in particular, the ‘positive’ treatment received by workers aged above 50 is highest for those aged 54. In other words, we expect the highest contrast between workers aged 49 and workers aged 54, making it the most relevant groups for analysis. But, on the other hand, workers aged 50 are the most comparable to those aged 49. Overall, this is an argument for looking at various age windows, with due awareness that different age windows correspond to different parameters.
The second consideration that leads us not to strictly apply the regression discontinuity approach is the tradeoff between the comparability of the two groups and the precision of the estimates. Increasing the age window around 50 makes the two groups more heterogeneous, but it increases the sample size and makes the estimates more precise.
For these two reasons, our approach is to present results for three different age windows, of 1, 3 and 5 years above and below the age of 50.
To control for fixed differences between the two age groups, we first consider a simple difference-in-difference specification, where the effect on hiring is defined as:
( ) ( )( ) ( )( )( )[ ] ( )( ) ( )( )( )[ ]( ) ( ) .εΔεΔ
εt,50hEεt,50hEεt,50hEεt,50hE
prepost
19921992
−=
+−−−+−−=Δ<≥ tt
ε
However, we also introduce a set of variables x to control for different composition changes in the two age groups, and to reduce the variance of estimates. As our dataset follows unemployed workers for up to 24 months, we estimate a simple duration model. We specify a proportional hazard model with a flexible baseline hazard (step function). We also make a
7 As our focus is on hiring decisions, we do not need to model job destructions here in a detailed way. However, the argument goes through in the case of endogenous job destructions. 8 We choose a low value for ρ as a way to take into account quits. However, results are qualitatively unchanged for other values.

11
distinction for workers that have been unemployed for more than 3 months (who are concerned by the exemption, if they are older than 50) and those who have been unemployed for less, who are not exempted. This latter group may also react to the reform. For example, there may be an ‘entry effect’, whereby after 1992 hiring is delayed for unemployed workers aged more than 50 but with less than 3 months in unemployment, until they become eligible for the exemption. We therefore allow for a specific difference-in-difference effect for unemployed workers with less than 3 months unemployed. We end up with the following specification of the hazard rate:
( )( ) ( )( ) ( ) ( )( ) ( ) ( ) ( )( )( ) ( )( ) ( ) ( )( ) ( ) ( ) ( )( ) ⎥
⎥⎥⎥⎥
⎦
⎤
⎢⎢⎢⎢⎢
⎣
⎡
<<≥+<<+<≥+
≥<≥+≥<+≥≥+×=
)3(&50a&1992t1εc'
Δ3d & 50a1below50α'3d & 1992t1postα'
)3(&50a&1992t1εc
Δ3d & 50a1below50α3d & 1992t1postαxbexp)(a,x,d
d
ddt λθ
where d is time spent in unemployment, and λ(.) is the baseline hazard function. In this
specification, the parameter of interest is ( )εcΔ . The estimation is conducted by maximum of
likelihood. Given stock sampling, noting S(.) the survival function, di the duration at exit and di0 the duration when first observed, the contribution of individual i to the likelihood is
)()()(
0i
ii
dSdSdθ if the individual left for employment in the private sector under indefinite
duration contract, and )()(
0i
i
dSdS otherwise.9
Main results
Table 2 details the steps of the difference-in-difference estimation, without any control, to estimate ( )εΔ . Three alternative age windows are considered, and men and women are
analyzed separately. The upper part of the table displays transition rates from unemployment to employment under indefinite duration contracts, for workers aged above and below 50, before and after the 1992 reforms. Consider men for the narrowest age window: in tune with the regression discontinuity approach, transition rates are initially close, and statistically not different. Workers aged 49 tend to find a job slightly faster. But, as shown in the middle of the table, the difference reverses after 1992 (the difference falls from +.22 point of percentage to –.32 point of percentage). This reversal is summarized in the difference-in-difference estimate: the monthly transition rate of male unemployed workers aged 49 has decreased by
9 As an alternative to the duration model, we also estimate simpler specification of the difference-in-difference model with controls for composition effect (see table 5). The corresponding model is
( ) ( )( ) ( ) ( ) ( ) ( ) ( )( ).50a&1992t1εΔ50a1α1992t1α50a1 ,1992t1hE below50post0 <≥+<+≥+=<≥ α
12
.54 percentage points (with a standard error of .43 pp) compared to male unemployed workers aged 50.
The other columns give the results for broader age windows. In all cases, the relative change is the same: as expected from the theory, the transition rate has decreased for those below 50 compared to those above 50.10 The change is statistically significant in some cases, not in others. Of course, the wider the age range, the lower the standard errors, which tends to make the observed differences significant. But, on the other hand, if we look at point estimates, it seems that the highest relative change occurs for workers aged 47-49 compared to workers aged 50-52. As shown by figure 3, it is unfortunately not possible to go much further on estimating changes for narrowly defined age groups. Indeed, when one looks at changes in transition rates for one-year age groups, confidence intervals are very wide. It is therefore difficult to assess whether the pattern of changes in the expected job surplus (the ‘treatment doses’ of figure 2) is paralleled by the changes in transition rates. Giving credit to point estimates, the discontinuity at age 50 appears as expected for men. However, there is no clear age trend in the decrease of transition rates before 50 or in the increase after 50, as we would have expected from figure 2.
We now turn to the duration model. Table 3 displays our preferred specification for estimating the effect of the 1992 reforms. The coefficient of interest appears in bold characters. The econometric model allows for improvements in several dimensions. First, to track the theoretical predictions more precisely, the difference-in-difference analysis separates unemployed workers for less than 3 months and those for longer. Second, we allow for age effects within the two groups by introducing age indicators as controls, and for duration dependence in unemployment by specifying a flexible baseline hazard. Third, we control for composition changes in the following dimensions: level of schooling, number of children, size of the town of residence, time effects (seasonal – monthly indicators – or cyclical – year indicators). Fourth, we control for the possibility that the business cycle has different effects on different age groups, by introducing age-specific effects of the GDP growth rate. Last, we control for changes in employment policies that were sometimes differentiated across age groups. Indeed, subsidies to hiring were introduced in 1989-1990 for the long-term unemployed. They were particularly generous for workers above 50. They were modified several times, depending on the time the worker had been unemployed, her age and other individual characteristics (disability,…). It is therefore possible to introduce additional dummies that indicate three levels of subsidies across the period (no subsidy before 1989 and for the short-term unemployed afterwards; small subsidies for the long-term unemployed after 1990; large subsidies for specific groups after 1990, with changes in 1995). 10 Note that, as the age range widens, the hypothesis of initial similarity between the groups is statistically rejected (e.g., men aged 45 to 49 have a higher probability of being hired than men aged 50 to 54: +.52 pp, with a .16 pp standard error). Identification thus needs to rely on the difference-in-difference assumption that trends for the two groups are similar in the absence of reform.

13
The results on the parameters of interest confirm those of table 2, but they are more precise. The relative change in transition rate appears most clearly for the narrowest age range (49-50). For men, it is statistically significant. The point estimate (-.75) implies a sizeable effect: the reform has decreased the relative transition rate by as much as 53% (1-exp(-.75)). This relative effect encompasses an improvement for those above 50 and a deterioration for those below 50. For broader age ranges, the difference is smaller (the coefficient for men implies relative changes of -48% or –27%), but it is more precisely estimated, so that results remain statistically significant. The overall pattern is similar for women. However, the point estimates are smaller and the coefficients are (marginally) significant only for the intermediary age window. Though this may be due to sampling error – the coefficients for men and women are not statistically different – it may also reveal true differences. A conjecture is that transitions of unemployed women towards unemployment are more strongly conditioned by labor supply determinants, so that the transition rates are less sensitive to labor demand effects such as those of the Delalande tax.
We briefly review the effects on control variables. We are not able to uncover a specific change for persons who have been unemployed for less than 3 months: standard errors are too large, due to the limited sample sizes.11 The baseline hazard shows a decreasing pattern that is consistent with unemployment duration dependence or with the impact of unobserved heterogeneity. We do not find evidence that the different age groups are affected differently by the business cycle. This may simply be due to the fact that the age groups are quite close. A puzzling result concerns the impact of the employment subsidies, which is in some cases negative and significant. Before interpreting it as a stigma effect, it should be borne in mind that the identification of the effect rests on strong assumptions (stability of the labor demand with regard to workers with shorter or longer spells of unemployment). The number of children tends to reduce the transition probability for women only, in the wider age window.12 Last, the impact of education is limited and living in Paris tends to increase transition rates.
The visual inspection of figure 3 can be complemented by conducting the same estimation as in table 3, but comparing one-year age groups on the two sides of the 50 year-old threshold (e.g. 45 years old to 50 years old, 46 years old to 50 years old, etc). The resulting difference-in-difference estimates are displayed in appendix table A3. Given the treatment doses that result from the 1992 reform (figure 2), one would expect the estimates to grow as one moves downward (toward age 49) and toward the right (toward age 54). However, the estimates are very imprecise.
11 Workers unemployed for less than 3 months are rare as we had to sample in the stock. 12 Note that we are considering parents older than 45, with few young children.

14
Analysis of substitution effects The effect we have been analyzing so far can be interpreted generally as a substitution effect:
after the 1992 reform, firms prefer workers over 50 to workers under 50. However, this can
take two forms. First, given two identical candidates, one over 50 and the other under 50, the
firm prefers to hire the older one. Second, if a firm wants to hire a 49-year old worker, it may
convince him, perhaps with some side payment, to wait in order to hire him after his 50th
birthday.13 This second form of substitution – intertemporal substitution between hiring dates
– is particularly likely if there are matching frictions: if finding the right match is difficult for
firms, they will try to retain the worker and incur the cost of having him wait rather than
search for another worker. At the limit, no rational firm would hire a worker the day before
his 50th birthday.
The difference-in-difference estimates around the age of 50 capture these two effects. We do
two things to disentangle them.
First, we exclude workers in the 49-50 age range from the estimation. Indeed, it is unlikely
that a firm would have a worker wait for more than one year; and if he has waited, then it
should hire him in the next few months after his 50th birthday. As a consequence, the
difference-in-difference analysis on workers aged 51 and more vs. those aged 48 and less
should only capture substitution between different workers. The estimates are displayed on
table 4. Table 4 only differs from table 3 by the exclusion of the 49-50 age range. As
expected, this reduces the estimates (as one of the two substitution effects is removed) and
increases the standard errors (as the samples are smaller). Nevertheless, the effect remains
significant and strong when comparing male unemployed aged 48-49 to those aged 51-52:
there seems to be substitution between workers in that age range.
Second, we analyze the monthly hazard of finding a job (figure 4). The idea is that
intertemporal substitution between hiring dates has a distinctive implication: if some workers
are waiting at the gate of the firm with the promise of being hired as soon as they get 50 years
old, there should be a spike in hiring at the age of 50. More precisely, we should observe two
discontinuities in hiring rates: (i) a rise between age 49 year 11 months and age 50 (due to the
two substitution effects); (ii) a fall between age 50 and age 50 and 1 month (the mass of
workers having met the firm before they were 50 is hired at age 50, whereas at age 50 and 1
month, only those who have just met a firm can be hired). In practice, the limited sample size
13 We are indebted to one reviewer for stressing that point.

15
does not allow looking precisely at the two discontinuities. However, the point estimates are
consistent with a spike in hiring in the months that follow the age of 50.
To summarize, the two substitution effects seem at work, as expected.
Time analysis
The difference-in-difference analysis could theoretically be performed on a very short period before and after 1992, to reduce the risk of capturing the effects of other changes in the labor market. However, if we used too short periods, the sample of unemployed workers would be too small to precisely estimate transition rates. Until now, we have therefore used a very long time period, from 1982 to 2002. Besides providing sufficient samples of unemployed workers, this long period has the advantage of covering two business cycles, one before and the other after the reform. If the business cycle has some effects on the relative demand for workers just below and just above 50, these effects should cancel out over the period. However, it is important to check whether our estimates are robust to the choice of other periods.
Figure 5 shows the difficulty of precisely determining the timing of the changes with the data, given the limited sample sizes. It shows the difference in transition rates for two age groups (those aged 47-49 compared to those aged 50-52). This difference is more frequently positive before 1992, and more frequently negative after. But it fluctuates a lot and is imprecisely estimated (at the semester frequency). It is therefore clear that significant results can only be obtained by averaging transition rates over time, as was done in the previous estimations, so as to mitigate the impact of sampling error. How long need the period of analysis be? Table 5 estimates the same model as table 3, but on shorter periods. Each cell comes from a different estimation and contains the difference-in-difference estimate of interest. The different estimations correspond to the three age windows and to periods of estimation of various lengths: two years before and after the 1992 reform, four years before and after, etc. The shortest time window (1990-1994) leads to very imprecise estimations: although the point estimate is always of the expected sign, the coefficient is not statistically significant for any of the age windows. Statistically significant results are obtained for time windows of 8 and more years (4 before 1992, 4 after). They are qualitatively similar to those obtained in table 3, over 20 years of observation.
Overall, the time analysis shows that we cannot precisely date the change in the relative transition rates of unemployed workers above and below 50. However, in the absence of relevant data sources with large samples, this change can only be inferred by looking at about 4 years before and after the 1992 reforms.

16
Robustness checks
We performed a variety of robustness checks. First, we checked that results are not driven by the parameterization of the duration model. We estimated the difference-in-difference parameter in models where the dependent variable is the indicator variable of making a transition or not (from unemployment to employment under an indefinite term contract), assuming different functional forms for the probability of a transition (linear probability model, logit or probit). The results are available upon request; they are qualitatively the same as in table 3.
Second, we checked that results are qualitatively unchanged if we use yearly transition rates instead of monthly ones.14 The main results remain unchanged (they are available upon request).
Third, we checked whether the results are sensitive to the omission of some controls. This is unlikely to be the case, as any difference in fixed characteristics or any trend common to the two age groups is already controlled for by the difference-in-difference setup. Robustness checks showed that the results are not highly sensitive to the list of controls. In particular, removing the indicator variables for job subsidies or the indicator variables for workers unemployed for less than three months does not alter the results significantly (results available upon request).
The next two checks are of a different nature. They are attempts to test the identifying assumptions of the difference-in-difference analysis.
First, the Delalande tax only concerns workers hired under indefinite term contracts. Therefore, no significant difference-in-difference effect should appear for workers hired under fixed-term contracts. This is checked in table 6. The point estimates are small and their sign varies; none is statistically significant. This can be considered as an indirect test of the identification strategy. In particular, if one is worried that employment subsidies (or other policy changes with specific effects on older workers) have not been appropriately controlled for, these changes should have affected hiring under both types of contract.15 As this is not the case, our confidence increases that the estimates in table 3 identify the effect of the 1992 reform of the Delalande tax.
Last, one may remain worried that some unobserved shocks may have affected unemployed workers below and above 50 differently. In that case, our identification strategy would fail. It
14 Indeed, the advantage of yearly transition rates is that they may be more precisely measured, as they do not rely upon a retrospective question on the date at which a new job started. But the drawback is that, for workers aged between 49 and 50 at the beginning of the year, we do not know whether they were above or below the threshold at the time a transition occurred. 15 The employment subsidies introduced in 1989 applied to both fixed-term and indefinite duration contracts.

17
is not possible to test it directly, as it is not possible to disentangle the effect of shocks occurring in 1992 from the effect of the 1992 reform of the Delalande tax. However, we can check whether unobserved shocks (with different effects on workers aged above and below 50) are evidenced at other dates than 1992. This amounts to checking whether the difference-in-difference analysis, if it is conducted around other years than 1992, also leads to significant results. We re-estimate the model of table 3 over 8-year periods, with alternative turning points in 1986, 1988, 1990, 1994, 1996 or 1998. In other words, we check whether ‘placebo’ reforms have the same impact as the ‘true’ 1992 reform. Again, we focus on the difference-in-difference coefficient of interest, which should be statistically significant only in 1992. The estimates are displayed on figure 6, along with 95% confidence intervals. They are significant only in 1992, except for 1990, where significant results are found for men. This however may simply be due to the fact that the estimation periods for the true reform (1992) and for the 1990 placebo reform overlap: we had to take 8-year time windows in order to get sufficient sample sizes. Our conclusion is that, though this analysis cannot precisely date the change (1990 or 1992?), there is something specific to that period, leaving the Delalande 1992 reform as a likely explanation.
5. The effect on layoffs
Empirical strategy
The fundamental difficulty in identifying the effect of the Delalande tax from time-series variation is the strong counter-cyclicality of layoffs, as illustrated in figure 7. The time-series correlation between the tax rate and layoffs cannot be interpreted if one does not control for other sources of changes in layoff rates, including the business cycle (as shown on figure 8, the period analysis covers two cycles).
As described above, three changes in the tax schedule offer opportunities for identification of the effects of the tax. However, inference must account for other simultaneous changes. A natural way to control for cycles and possible trends in layoffs is to use younger workers, unaffected by the tax, as a control group. The corresponding econometric specification is:
( ) ( ) ( ) ( ) ( )∑∑==
Δ++=+=+=58
40
2001
19830 11,,
0
0a
ttitat
t acacaattxbtxasE δγαλ ,
where s is a dummy variable for layoff, x are control variables, ( )act and ( )actΔ are the level
and the slope of the tax at age a. Parameters tλ and aα capture the respective effects of the
business cycle and of the worker’s age on the probability of a layoff.
As discussed in the previous section, when the profile of the tax is not flat with age, the effect of the tax on layoffs has two components, which are captured by parameters γ (expected to be

18
negative) and δ (expected to be positive). An additional underlying assumption is that the effects of the two components of the tax (its level and its slope) on the probability of being laid off are linear.
However, using younger workers as a control group assumes that the relative demand for labor across ages is acyclical and has no trend. This may be a strong assumption as we are performing the analysis over a 20-year age range. We relax that assumption by allowing for age-specific trends and age-specific business cycle effects through interactions of age indicators with a time trend and interactions of age indicators with the GDP growth rate.
Moreover, it may be important to take into account the fact that the Delalande tax modifies the recruiting behavior of firms (through the effect on hiring). Firms are likely to become more selective when hiring workers close to the age of 50. If this selectivity is not captured by available controls, the distribution of unobserved heterogeneity will not be stable across periods. This can bias the estimates upward: increased retention would be attributed to the desired effect of the tax, instead of being attributed to the effect on hiring (via the higher selectivity of firms). One way to control for this selectivity is to introduce dummies to indicate hiring under the different tax schedules (there are three regimes: 1987-91, 1992-98 in large firms and 1992-2001 in small firms, and 1999-2001 in large firms).
The results are given in table 7. The first six columns display the results of a linear probability model with different sets of controls; the last column displays the results of a probit model. Overall, for men, the level and the slope of the tax schedule have the expected effect: a higher level of the tax deters firms from laying older workers off, whereas a higher slope tends to accelerate layoffs. However, the effect of the slope is not statistically significant. Comparing the various columns, it appears that controlling for individual characteristics of the workers matters. Estimates are substantially reduced when controlling for observed workers’ characteristics (in particular, tenure and education). Allowing for age-specific trends or business cycle effects does not make a large difference. The table shows the p-values of the tests for the existence of such effects. Age-specific business cycle effects are marginally significant; age-specific trends are not significant. In column 6, adding controls for the period of hiring further reduces the estimated impact of the Delalande tax; it remains however significant.
Similar to the results for hiring, results for women are not significant. This is less easily interpreted in terms of labor supply, as older women who have a job at the age of 50 are quite attached to the labor force.
A second puzzle is that results are sensitive to the specification: the impact of the Delalande schedule is no longer significant if we use a probit or logit model.
To get an idea of the order of magnitude implied by the estimates of the linear probability model, figure 9 displays the predicted layoff rates with and without the tax, based on point

19
estimates for men in column 6. The predicted impact is sizeable only for the last period in large firms.
6. Conclusion
Our results add micro evidence on the effects of employment protection on labor flows. The most striking result is the negative effect of the tax on the hiring probability of unemployed workers in the protected age group. The evidence comes from the natural experiment provided by the introduction of a new rule in 1992, exempting some of the workers previously protected. The findings are robust to various checks (variation in the age and time windows, in the frequency of observation – monthly or yearly, control for specific employment policies, for age-specific business cycle effects). This strong adverse effect is a key result: if employment protection is targeted only upon a category of workers with a strong unemployment risk, hiring discrimination against these workers is a real issue. This unintended effect of the reform is reminiscent of the perverse effects of another partial labor market reform in France: the introduction of fixed-duration contracts (Blanchard and Landier, 2002). However, it is noteworthy that this perverse effect has been at least partly corrected in 1992, when (unemployed) workers hired after 50 were exempted from the tax. Those workers do not suffer from the perverse effect on hiring anymore; but they do not benefit from the specific protection against layoffs either.
Paradoxically, the effect on layoffs, which is in theory more direct, is harder to detect. This
contrasts with other studies, in particular in Spain (Hernanz, Jimeno and Kugler, 2003) or in
Finland, where Hakola and Uusitalo (2005) find a robust negative effect of experience rating
on the layoff rate of older workers. Part of the explanation may be technical, as Hakola and
Uusitalo take advantage of a legislative change that is particularly favorable for evaluation.
The order of magnitude of their effects is similar to our estimates, though: in Finland, an
increase in the layoff cost by one year of wages yields a decrease in the layoff probability by
about 1 percentage point. The estimates we obtain for men in the last period may be consistent
with that order of magnitude; but they lack robustness and precision, despite the large
samples. These mixed results concerning the effect on layoff may reflect the fact that the
behavior of labor demand for older workers is specific in France, and that firms are more
sensitive to firing costs ex ante (at hiring) than ex post (at layoff). Indeed, our results would be
consistent with a model of employment protection where job destructions are exogenous. In
such a model, firms anticipate that they will have to lay off some workers, and therefore
decide ex ante to limit that risk, but they are not ex post able to avoid the layoffs.

20
This begs the question of why firms could substitute between age groups at hiring and could
less easily do so at layoff. The answer may have to do with the specific role of older workers
in workforce adjustment in French firms. Case studies and sociological works indeed show
the strong consensus in favour of the early exit of older workers whenever a bad shock occurs
(Guillemard, 2003; Behaghel and Gautié, forthcoming). The firms tend to internalize the fact
that older workers will benefit from early retirement schemes: in an effort to maintain their
good reputation as an employer, they choose to fire older workers rather than their younger
colleagues, even though the Delalande tax makes this policy costly.
To understand these results further, as well as to be able to provide a global evaluation of the tax, a complementary analysis would be to estimate a structural model of labor demand for different age groups. A first attempt is made in Behaghel (2007), but the model is calibrated rather than estimated. This is a promising avenue for further research.

21
References
Abowd J. et Kramarz F. (2003), The costs of hiring and separation, Labour Economics, vol. 10, n° 5, pp. 499-230.
Acemoglu D. and J. Angrist (2001). Consequences of Employment Protection? The Case of the American with Disabilities Act. Journal of Political Economy, 109(5).
Aubert P. (2003), Les quinquagénaires dans l’emploi salarié privé, Économie et Statistique, n° 368, pp. 65-94.
Autor D., J. Donohue and S. Schwab (2002), The Costs of Wrongful Discharge Laws, NBER Working Paper 9245, forthcoming, The Review of Economics and Statistics.
Behaghel L. (2007), La protection de l’emploi des travailleurs âgés en France : une étude de la contribution Delalande, forthcoming in Annales d’économie et de statistique.
Behaghel L., B. Crépon and B. Sédillot (2004), Contribution Delalande et flux sur le marché du travail, Économie et Statistique, n°372, pp. 61-88.
Behaghel L. and J. Gautié (forthcoming), From Internal to Transitional Labour Markets? Firms Restructuring and Early Retirement in France, in Anxo, D., C. Erhel & J.J. Schippers (Eds.) (forthcoming), Labour Market Transitions and Time Adjustment over the Life Course, Amsterdam: Dutch University Press.
Blanchard O. and A. Landier (2002), The Perverse Effects of Partial Labor Market Reform: Fixed Duration Contracts in France, Economic Journal, 112, F214-244.
Cahuc, P. and F. Postel-Vinay (2002), Temporary Jobs, Employment Protection and Labor Market Performance, Labour Economics, 9(1), 63-91.
Guillemard A.-M. (2003), L’âge de l’emploi, Armand Collin, Paris, 2003.
Hakola T. and R. Uusitalo (2005), Not So Voluntary Retirement Decisions? Evidence from a Pension Reform, Journal of Public Economics, 89(11) 2121-2136.
Hernanz, V., J. Jimeno and A. Kugler (2003) Employment Consequences of Restrictive Permanent Contracts: Evidence from Spanish Labour Market Reforms, CEPR Discussion Papers 3724.
Kugler A. (2004), The Effect of Job Security Regulations on the Labor Market Flexibility: Evidence from the Colombian Labor Market Reform, NBER Working Paper 10125.
Kugler A. and G. Pica (2005), Effects of Employment Protection on Worker and Job Flows: Evidence from the 1990 Italian Reform, CEPR Discussion Papers 5256.
Lazear E. (1990), Job Security Provisions and Employment, Quarterly Journal of Economics 105 (3), pp. 699–726.
Schivardi F. and R. Torrini (2004), Firm size distribution and employment protection legislation in Italy, Temi di discussione (Economic working papers) 504, Bank of Italy, Economic Research Department.

22
Table 1: Delalande tax schedule according to the age of the laid off worker (monthly gross wages)
Worker’s age
50 51 52 53 54 55 56-57 58 59 July 1987- June 1992 All firm sizes 3 3 3 3
More than 20 employees
1 1 2 2 4 5 6 6 6 July 1992- Dec. 1992 Less than 20
employees .5 .5 1 1 2 2.5 3 3 3
Jan. 1993- Dec 1998 All firm sizes 1 1 2 2 4 5 6 6 6
More than 50 employees
2 3 5 6 8 10 12 10 8
After January 1999 Less than 50 employees
1 1 2 2 4 5 6 6 6
Source: Legislative texts. Notes: For each age group, the table displays the tax due by the firm to the unemployment insurance system if it lays a worker off. The tax is a function of previous wages, and is stated in months of gross wages.

23
Table 2: Monthly transition rates from unemployment to employment under indefinite duration contracts
49-50 years old
47-52 years old
45-54 years old
49-50 years old
47-52 years old
45-54 years old
1.43 1.68 1.65 1.13 1.10 1.05(0.26) (0.17) (0.13) (0.21) (0.12) (0.09)1.21 1.25 1.13 0.88 0.78 0.66
(0.24) (0.13) (0.09) (0.19) (0.10) (0.07)0.93 1.20 1.27 0.93 0.78 0.96
(0.16) (0.10) (0.08) (0.15) (0.07) (0.06)1.25 1.32 1.08 0.99 0.88 0.73
(0.18) (0.11) (0.08) (0.15) (0.09) (0.06)
0.22 0.43 0.52 0.25 0.32 0.40(0.35) (0.21) (0.16) (0.29) (0.15) (0.11)-0.32 -0.11 0.19 -0.06 -0.10 0.22(0.25) (0.15) (0.11) (0.21) (0.11) (0.09)
-0.54 -0.55 -0.33 -0.31 -0.42 -0.17(0.43) (0.26) (0.19) (0.35) (0.19) (0.14)
# individuals 1 311 3 060 4 835 1 515 3 515 5 564# months of observation 11 609 36 081 60 779 13 635 41 958 71 343
Men Women
Difference in differences
Difference before July 1992
Before July 1992, <50 years old
Before July 1992, >50 years old
After July 1992, <50 years old
After July 1992, >50 years old
Difference after July 1992
Source: French Labor Force Survey (Enquête Emploi), 1982-2002. Note: Each column displays the successive steps of a difference-in-difference estimation. The variable of interest is the monthly transition rate from unemployment to employment under an indefinite term contract, in percentage points. Its mean is computed before and after 1992, among unemployed workers respectively younger and older than 50 (upper part of the table); the difference is then taken across age groups (middle part); last, the difference in differences is computed (bottom part). Standard errors (in parentheses) are robust to autocorrelation of the residuals (a same individual can be observed for up to 24 transitions). The different columns correspond to different samples (men or women for wider and narrower age groups).

24
Table 3: Effect of the 1992 reform on transition from unemployment to employment under indefinite duration contract
49-50 years old
47-52 years old
45-54 years old
49-50 years old
47-52 years old
45-54 years old
-0.40 -0.03 -0.02 0.07 0.09 0.21(0.53) (0.29) (0.25) (0.50) (0.34) (0.27)0.65 0.46 0.15 -0.55 0.53 0.58
(0.97) (0.54) (0.45) (1.20) (0.57) (0.42)-0.75* -0.66*** -0.31* -0.55 -0.38 -0.11(0.41) (0.22) (0.17) (0.41) (0.24) (0.19)-15.95 -1.52 -0.82 0.09 0.52 -0.15
(3 990.76) (1.13) (0.75) (2 340.26) (1.24) (0.93)2.09 0.45 0.14 -0.97 -12.92 -13.90
(1.42) (0.79) (0.70) (2 093.06) (450.59) (517.84)-1.76 0.18 0.07 -0.17 12.68 14.47
(4 457.35) (1.26) (0.86) (2 820.17) (450.59) (517.84)
Baseline hazard: unemployment duration (ref. 3-6 months)-0.23 0.42 0.42 -12.96 0.19 0.46(1.07) (0.54) (0.48) (1 832.47) (1.04) (0.74)-0.21 -0.22 -0.07 1.19* 0.20 -0.05(0.39) (0.20) (0.17) (0.64) (0.29) (0.21)-0.56 -0.42** -0.33* 1.04 -0.24 -0.33(0.42) (0.21) (0.18) (0.66) (0.31) (0.22)-0.27 -0.06 -0.09 0.82 -0.14 -0.46**(0.43) (0.22) (0.18) (0.68) (0.30) (0.22)-0.62 -0.51** -0.39** 1.46** -0.01 -0.37*(0.46) (0.24) (0.19) (0.67) (0.30) (0.22)-0.34 -0.52** -0.54*** 1.17* -0.30 -0.54**(0.44) (0.23) (0.19) (0.67) (0.30) (0.22)-1.42** -1.12*** -0.96*** 1.40* -0.29 -0.70***(0.61) (0.30) (0.23) (0.72) (0.34) (0.26)
-1.95*** -1.76*** -1.62*** -0.21 -1.36*** -1.47***(0.57) (0.30) (0.23) (0.77) (0.35) (0.26)
Main controls-0.71* -0.51** -0.33** -0.04 0.28 0.24(0.39) (0.20) (0.16) (0.43) (0.25) (0.18)-0.80 -0.70** -0.37* -0.53 0.16 0.28(0.53) (0.27) (0.21) (0.60) (0.32) (0.24)0.19 0.03 -0.02 0.06 0.08 -0.01
(0.16) (0.08) (0.06) (0.15) (0.09) (0.07)(See additional controls on the next pages)
Log-likelihood -305.59 -1123.05 -1839.24 -294.00 -946.12 -1617.78Number of subjects 1 311 3 060 4 835 1 515 3 515 5 564
Eligibility to employment subsidies (level 1)
Eligibility to employment subsidies (level 2)
(GDP growth) x (Age<50)
18-23 months
24-35 months
36-47 months
>48 months
0-3 months
6-8 months
9-11 months
12-17 months
(After) x (Age<50) x (unemployment duration>=3)
(After) x (unemployment duration<3)
(Age<50) x (unemp. duration<3)
(After) x (Age<50) x (unemployment duration<3)
(Age<50) x (unemp. duration>=3)
(After) x (unemployment duration>=3)
Men Women
Source: French Labor Force Survey (Enquête Emploi), 1982-2002. Notes: Duration model for transitions from unemployment to employment in the private sector under indefinite duration contract. Coefficients from a proportional hazard specification (see section 4). Standard errors in parentheses; * significant at 10%; ** significant at 5%; *** significant at 1%. The coefficient in bold estimates of the impact of the July 1992 reform. The different columns correspond to different samples (men or women for wider and narrower age groups). Controls for composition effects include the number of children below 18, the size of the town of residence, indicators for months and years, education and age (in years). The coefficients on the controls are listed on the next two pages.

25
Table 3 (continued) Education (reference: university degrees)
0.10 -0.68 -0.39 1.07 0.90 0.80(1.01) (0.50) (0.42) (1.11) (0.65) (0.51)1.05 -0.01 0.15 0.57 0.40 0.64
(0.81) (0.38) (0.33) (1.13) (0.66) (0.50)0.80 -0.26 0.26 0.96 1.03* 0.87*
(0.74) (0.31) (0.27) (1.05) (0.60) (0.46)-0.67 -1.04* -0.68 0.66 0.76 0.89*(1.23) (0.58) (0.46) (1.14) (0.64) (0.48)0.57 -0.05 0.28 0.64 0.76 0.72
(0.73) (0.29) (0.26) (1.04) (0.59) (0.46)2.59** 1.40** 1.23** 3.04** 1.92** 1.71**(1.08) (0.68) (0.57) (1.52) (0.95) (0.86)
Year indicators (reference: 1982)-0.08 0.94 0.33 -15.27 -0.86 -0.41
(4 058.90) (1.12) (0.84) (1 316.11) (0.92) (0.71)-0.21 -12.80 -0.36 -15.24 -13.65 -1.68
(4 093.37) (451.49) (0.92) (1 385.16) (462.83) (1.12)15.70 0.94 0.52 0.03 0.51 0.55
(3 198.72) (1.08) (0.78) (1.25) (0.70) (0.60)15.19 1.32 1.14 -0.14 -0.27 -0.12
(3 198.72) (1.06) (0.75) (1.25) (0.77) (0.65)16.61 1.34 1.10 -0.31 -0.31 -0.07
(3 198.72) (1.06) (0.75) (1.26) (0.77) (0.63)16.84 1.73 1.65** -0.29 -0.26 0.09
(3 198.72) (1.06) (0.74) (1.26) (0.75) (0.61)16.54 1.30 1.52** -14.72 -0.08 -0.31
(3 198.72) (1.08) (0.75) (1 086.05) (0.74) (0.65)15.74 0.78 0.89 -1.20 -0.94 -0.85
(3 198.72) (1.18) (0.81) (1.52) (0.87) (0.70)17.19 2.03* 1.31* -15.23 -0.78 -0.06
(3 198.72) (1.08) (0.79) (1 296.78) (0.88) (0.65)17.53 2.09* 1.28 -15.22 -0.64 0.40
(3 198.72) (1.11) (0.81) (1 367.01) (0.89) (0.63)34.58 2.95* 0.93 0.62 -0.15 0.75
(5 995.81) (1.55) (0.99) (2 538.27) (1.13) (0.84)33.94 3.15** 1.44 0.55 -0.45 0.45
(5 995.81) (1.52) (0.95) (2 538.27) (1.10) (0.81)34.57 3.14** 1.35 0.49 -0.56 0.57
(5 995.81) (1.53) (0.96) (2 538.27) (1.13) (0.82)33.77 3.35** 1.26 0.68 -0.22 0.83
(5 995.81) (1.53) (0.97) (2 538.27) (1.12) (0.83)34.05 3.49** 1.43 0.61 -0.23 0.76
(5 995.81) (1.51) (0.95) (2 538.27) (1.09) (0.80)35.00 3.68** 1.77* 0.87 -0.23 0.56
(5 995.81) (1.51) (0.95) (2 538.27) (1.09) (0.80)34.39 3.37** 1.37 0.13 -0.47 0.60
(5 995.81) (1.52) (0.95) (2 538.27) (1.09) (0.80)35.26 4.11*** 1.91** 0.12 -0.38 0.86
(5 995.81) (1.51) (0.95) (2 538.27) (1.09) (0.80)34.59 3.53** 1.20 -0.41 -0.56 0.84
(5 995.81) (1.52) (0.96) (2 538.27) (1.11) (0.80)34.75 3.59** 1.35 -15.96 -0.27 0.74
(5 995.81) (1.57) (1.01) (3 329.47) (1.17) (0.86)
Family structure0.03 -0.02 0.04 0.11 0.15* 0.02
(0.08) (0.05) (0.04) (0.16) (0.09) (0.07)
College dropout
High-school graduate
Vocational training
High-school dropout
No diploma
Unknown
1983
1984
1985
1986
1987
1988
1989
1990
1991
1992
1993
1994
1995
1996
1997
1998
1999
2000
2001
2002
# of children below 18 Notes: See previous page.
…/…

26
Table 3 (continued) Size of town of residence (reference: <2000 )
0.67** 0.20 -0.01 0.13 -0.23 -0.08(0.34) (0.20) (0.17) (0.43) (0.27) (0.19)0.75** 0.11 -0.01 0.17 0.23 -0.01(0.34) (0.20) (0.17) (0.41) (0.23) (0.19)0.30 -0.21 -0.16 -0.03 -0.33 -0.39*
(0.46) (0.24) (0.18) (0.46) (0.30) (0.22)-0.27 -0.15 -0.05 0.88*** 0.22 0.05(0.49) (0.21) (0.16) (0.31) (0.21) (0.17)-0.05 -0.46* -0.45** -0.24 -0.07 -0.28(0.46) (0.24) (0.19) (0.49) (0.24) (0.19)0.49 -0.19 -0.32** 0.00 -0.11 -0.23
(0.35) (0.20) (0.16) (0.39) (0.23) (0.18)0.21 -0.11 -0.17 0.04 0.06 -0.03
(0.26) (0.14) (0.11) (0.29) (0.16) (0.12)0.54* 0.16 0.17 0.66** 0.40** 0.34***(0.28) (0.14) (0.11) (0.28) (0.17) (0.13)
Calendar month (reference: January)0.31 -0.27 -0.31* 0.91* 0.18 -0.09
(0.38) (0.22) (0.18) (0.48) (0.24) (0.19)-0.01 -0.51** -0.39** 0.06 -0.40 -0.51**(0.42) (0.24) (0.19) (0.58) (0.29) (0.22)0.21 -0.07 0.08 1.04** 0.16 0.13
(0.37) (0.19) (0.15) (0.49) (0.24) (0.17)-1.09** -0.96*** -0.66*** 0.79 -0.19 -0.51**(0.49) (0.23) (0.18) (0.50) (0.26) (0.20)-0.57 -0.62*** -0.31* 0.68 -0.13 -0.22(0.44) (0.22) (0.17) (0.51) (0.26) (0.19)-1.08** -0.73*** -0.67*** -0.47 -0.42 -0.53***(0.51) (0.23) (0.18) (0.65) (0.28) (0.20)-0.61 -0.93*** -0.94*** -0.28 -0.94*** -1.09***(0.45) (0.24) (0.20) (0.61) (0.33) (0.24)-0.05 -0.20 -0.14 1.24*** 0.32 0.10(0.40) (0.20) (0.16) (0.47) (0.23) (0.18)0.35 -0.29 -0.23 0.28 -0.13 -0.42**
(0.37) (0.21) (0.17) (0.53) (0.26) (0.20)-2.53** -0.76*** -0.62*** 0.72 -0.19 -0.48**(1.04) (0.24) (0.19) (0.50) (0.27) (0.21)-0.85 -0.56** -0.44** 0.28 -0.35 -0.44**(0.54) (0.23) (0.19) (0.55) (0.28) (0.21)
Age indicators (reference: 50 year old)- - 0.15 - - 0.27*- - (0.17) - - (0.16)- - 0.37** - - 0.10- - (0.16) - - (0.16)- 0.31* 0.31* - -0.14 -0.16- (0.17) (0.17) - (0.17) (0.17)- 0.33** 0.33** - -0.09 -0.08- (0.16) (0.16) - (0.17) (0.17)- 0.10 0.10 - -0.13 -0.14- (0.15) (0.15) - (0.19) (0.19)- -0.10 -0.11 - -0.20 -0.20- (0.16) (0.16) - (0.19) (0.19)- - -0.32* - - -0.54**- - (0.17) - - (0.21)- - -0.51*** - - -0.55***- - (0.19) - - (0.21)
51
52
53
54
45
46
47
48
September
October
November
December
May
June
July
August
Paris
February
March
April
20,000 - 50,000
50,000 - 100,000
100,000 - 200,000
200,000 - 2m
2,000 - 5,000 habitants
5,000 - 10,000 habitants
10,000-20,000
Notes: see previous pages

27
Table 4: Effect of the 1992 reform on transition from unemployment to employment under indefinite duration contract
(excluding workers in the 49-50 age range)
48-49 vs. 51-52 years old
45-49 vs. 51-54 years old
48-49 vs. 51-52 years old
45-49 vs. 51-54 years old
0.24 0.17 0.16 0.34(0.31) (0.25) (0.41) (0.30)0.33 -0.03 0.99 0.82*
(0.65) (0.51) (0.67) (0.45)-0.63** -0.22 -0.32 -0.05(0.26) (0.19) (0.30) (0.22)-1.33 -0.59 0.50 -0.22(1.16) (0.77) (1.24) (0.93)-1.68 -1.45 -12.30 -13.04(1.31) (0.99) (456.43) (389.46)2.29 1.59 12.65 13.87
(1.61) (1.09) (456.43) (389.46)
Baseline hazard: unemployment duration (ref. 3-6 months)0.72 0.57 0.48 0.70
(0.63) (0.53) (1.05) (0.74)-0.22 -0.04 -0.15 -0.26(0.24) (0.18) (0.33) (0.22)-0.37 -0.29 -0.81** -0.60**(0.25) (0.19) (0.38) (0.24)0.01 -0.08 -0.48 -0.66***
(0.26) (0.20) (0.34) (0.23)-0.50* -0.39* -0.58* -0.75***(0.28) (0.21) (0.35) (0.24)-0.63** -0.63*** -0.88** -0.89***(0.27) (0.21) (0.35) (0.24)
-1.03*** -0.91*** -0.97** -1.14***(0.34) (0.25) (0.41) (0.28)
-1.72*** -1.61*** -1.77*** -1.72***(0.35) (0.26) (0.41) (0.28)
Main controls-0.40* -0.28 0.36 0.19(0.23) (0.17) (0.31) (0.21)-0.63** -0.29 0.41 0.38(0.32) (0.23) (0.39) (0.26)0.00 -0.03 0.08 -0.03
(0.09) (0.07) (0.12) (0.08)
Log-likelihood -775.93 -1522.29 -616.64 -1328.59Number of subjects 2 692 4 467 3 062 5 111
Eligibility to employment subsidies (level 1)
Eligibility to employment subsidies (level 2)
(GDP growth) x (Age<50)
18-23 months
24-35 months
36-47 months
>48 months
0-3 months
6-8 months
9-11 months
12-17 months
(After) x (Age<50) x (unemployment duration>=3)
(After) x (unemployment duration<3)
(Age<50) x (unemp. duration<3)
(After) x (Age<50) x (unemployment duration<3)
(Age<50) x (unemp. duration>=3)
(After) x (unemployment duration>=3)
Men Women
Source: French Labor Force Survey (Enquête Emploi), 1982-2002. Notes: Duration model for transitions from unemployment to employment in the private sector under indefinite duration contract. Coefficients from a proportional hazard specification (see section 4). Standard errors in parentheses; * significant at 10%; ** significant at 5%; *** significant at 1%. The coefficient in bold estimates of the impact of the July 1992 reform. The different columns correspond to different samples (men or women for wider and narrower age groups). Comparing to table 3, the only difference is that the 49-50 age range has been excluded. Controls for composition effects include the number of children below 18, the size of the town of residence, indicators for months and years, education and age (in years). The coefficients on the controls are listed on the next two pages.

28
Table 5: Robustness of the effect of the 1992 reform to changes in the period of observation
Period of observation 49-50 47-52 45-54 49-50 47-52 45-54-0.81 -0.68 -0.49 -3.38** -1.05 -1.05*(1.18) (0.56) (0.44) (1.70) (0.71) (0.54)
-0.93 -1.00*** -0.49* -1.68** -1.02** -0.54(0.72) (0.36) (0.29) (0.83) (0.44) (0.34)-0.78 -0.67** -0.29 -1.28** -0.52 -0.31(0.53) (0.28) (0.22) (0.59) (0.33) (0.26)-0.61 -0.51** -0.21 -0.73 -0.51* -0.18(0.44) (0.24) (0.19) (0.45) (0.27) (0.21)
1986-1998
1984-2000
Men Women
1990-1994
1988-1996
Source: French Labor Force Survey (Enquête Emploi), 1984-2000. Notes: Results from different duration models for transitions from unemployment to employment in the private sector under indefinite duration contract. Proportional hazard specification (see section 4). Standard errors in parentheses; * significant at 10%; ** significant at 5%; *** significant at 1%. The different cells display the same coefficient of interest as in table 3 (a difference-in-difference estimate of the impact of the July 1992 reform) for different observation periods (wider and narrower time windows around July 1992) and different samples (men or women for wider and narrower age groups). Controls for composition effects include the number of children below 18, the size of the town of residence, indicators for months and years, education and age (in years).

29
Table 6: Effect of the 1992 reform on transition from unemployment to employment under fixed-term contract
49-50 years old
47-52 years old
45-54 years old
49-50 years old
47-52 years old
45-54 years old
-0.10 0.12 0.33 -0.62 -0.36 -0.27(0.64) (0.41) (0.36) (0.85) (0.51) (0.41)-17.76 -1.58 0.11 -0.52 0.69 -0.12
(5 071.28) (1.09) (0.58) (2 538.27) (0.88) (0.59)-0.07 0.15 -0.14 0.50 -0.12 -0.12(0.54) (0.32) (0.24) (0.77) (0.40) (0.30)0.03 -0.16 -0.26 0.51 15.01 11.75
(16 054.66) (2 352.60) (1 454.72) (6 709.45) (2 079.55) (513.77)-17.99 -1.88 14.22 15.00 14.69 11.30
(11 801.04) (1 951.19) (1 013.10) (5 792.56) (2 079.55) (513.77)17.90 14.07 -0.35 -0.55 -14.45 -11.11
(17 471.42) (2 641.03) (1 454.72) (6 709.45) (2 079.55) (513.77)
Baseline hazard: unemployment duration (ref. 3-6 months)-15.71 -14.37 -13.82 -15.13 -14.02 -11.68
(8 127.02) (1 538.45) (1 013.10) (5 206.82) (2 079.55) (513.77)0.98 0.03 0.01 -2.01* -0.54 -0.75**
(1.11) (0.37) (0.29) (1.15) (0.48) (0.36)1.23 -0.17 -0.23 -0.42 -0.35 -0.20
(1.08) (0.37) (0.29) (0.68) (0.43) (0.30)1.33 0.06 -0.11 -0.85 -0.46 -0.59*
(1.12) (0.40) (0.31) (0.74) (0.45) (0.34)0.84 -0.23 -0.29 -0.85 -0.64 -0.70**
(1.15) (0.41) (0.32) (0.76) (0.46) (0.35)1.41 -0.29 -0.34 -0.85 -1.02** -0.94***
(1.12) (0.41) (0.31) (0.75) (0.47) (0.34)0.02 -0.94* -0.96** -0.90 -0.89 -0.83**
(1.29) (0.50) (0.37) (0.90) (0.54) (0.40)0.04 -1.18** -1.18*** -1.80** -1.25** -1.23***
(1.21) (0.47) (0.35) (0.89) (0.52) (0.39)
Main controls0.05 -0.07 -0.09 0.29 0.52 0.46*
(0.60) (0.31) (0.24) (0.66) (0.36) (0.27)-0.33 -0.26 -0.23 0.00 0.16 0.09(0.84) (0.43) (0.32) (0.89) (0.49) (0.36)-0.05 -0.16 -0.15* 0.07 0.18 0.15*(0.16) (0.10) (0.08) (0.19) (0.11) (0.09)
Log-likelihood -185.70 -647.58 -1111.89 -174.64 -595.47 -1048.81Number of subjects 1 311 3 060 4 835 1 515 3 515 5 564
(Age<50) x (unemp. duration>=3)
(After) x (unemployment duration>=3)
Men Women
(After) x (Age<50) x (unemployment duration>=3)
(After) x (unemployment duration<3)
(Age<50) x (unemp. duration<3)
(After) x (Age<50) x (unemployment duration<3)
0-3 months
6-8 months
9-11 months
12-17 months
18-23 months
24-35 months
36-47 months
>48 months
Eligibility to employment subsidies (level 1)
Eligibility to employment subsidies (level 2)
(GDP growth) x (Age<50)
Source: French Labor Force Survey (Enquête Emploi), 1982-2002. Notes: Unemployment duration model for transitions to employment in the private sector under fixed-term contract. Proportional hazard specification (see section 4). Standard errors in parentheses; * significant at 10%; ** significant at 5%; *** significant at 1%. The coefficient of interest, in bold, is a difference-in-difference estimate of the impact of the July 1992 reform (there should be little effect as fixed-term contracts were not directly concerned by the reform). The different columns correspond to different samples (men or women for wider and narrower age groups). Controls for composition effects include the number of children below 18, the size of the town of residence, indicators for months and years, education and age (in years).

30
Table 7: Impact of the Delalande tax on layoff probabilities
Probit(1) (2) (3) (4) (5) (6) (7)
Delalande tax level -0.361*** -0.129*** -0.129*** -0.129*** -0.124** -0.119** -0.027[0.050] [0.050] [0.050] [0.050] [0.050] [0.050] [0.034]
Delalande tax slope 0.176 0.21 0.196 0.209 0.181 0.185 0.002[0.142] [0.147] [0.148] [0.146] [0.150] [0.150] [0.085]
p-value age-specific cyclical effects 0.70 0.34 0.34 0.21p-value age-specific trends 0.12 0.06 0.05 0.06p-value hiring period effects 0.00
Delalande tax level -0.116 0.014 0.009 0.016 0.012 0.019 0.062[0.079] [0.079] [0.079] [0.079] [0.079] [0.080] [0.053]
Delalande tax slope 0.153 0.242 0.261 0.243 0.252 0.263 0.112[0.217] [0.233] [0.236] [0.234] [0.236] [0.236] [0.142]
p-value age-specific cyclical effects 0.11 0.21 0.21 0.14p-value age-specific trends 0.57 0.81 0.80 0.78p-value hiring period effects 0.02
Age effects YES YES YES YES YES YES YESYear effects YES YES YES YES YES YES YESIndividual controls NO YES YES YES YES YES YESAge x GDP growth interactions NO NO YES NO YES YES YESAge x time interactions NO NO NO YES YES YES YESHiring period indicators NO NO NO NO NO YES NO
Linear probability model
A. Men - N=95943
B. Women - N=55193
Source: Enquête Emploi, 1983-2001.
Note: Linear probability and probit models of layoff incidence. Individual controls include a cubic polynomial of tenure, three dummies for educational levels, wage and wage squares, indicator variables for the industry (10 industries), the worker’s occupation (3 categories), the plant size (4 categories), the region (7 regions), the size of the city (3 categories), the level and the slope of mandatory severance payments, and indicators for low tenure (less than 1 and 2 years). Hiring period indicators distinguish four situations: hiring without being eligible to the tax, hiring being eligible for the 1987-92 schedule, hiring being eligible for the 1992-98 schedule or the post 1998 schedule for small firms, hiring being eligible for the post 1998 schedule for large firms. The sample includes wage earners from the private sector, aged 40 and above.
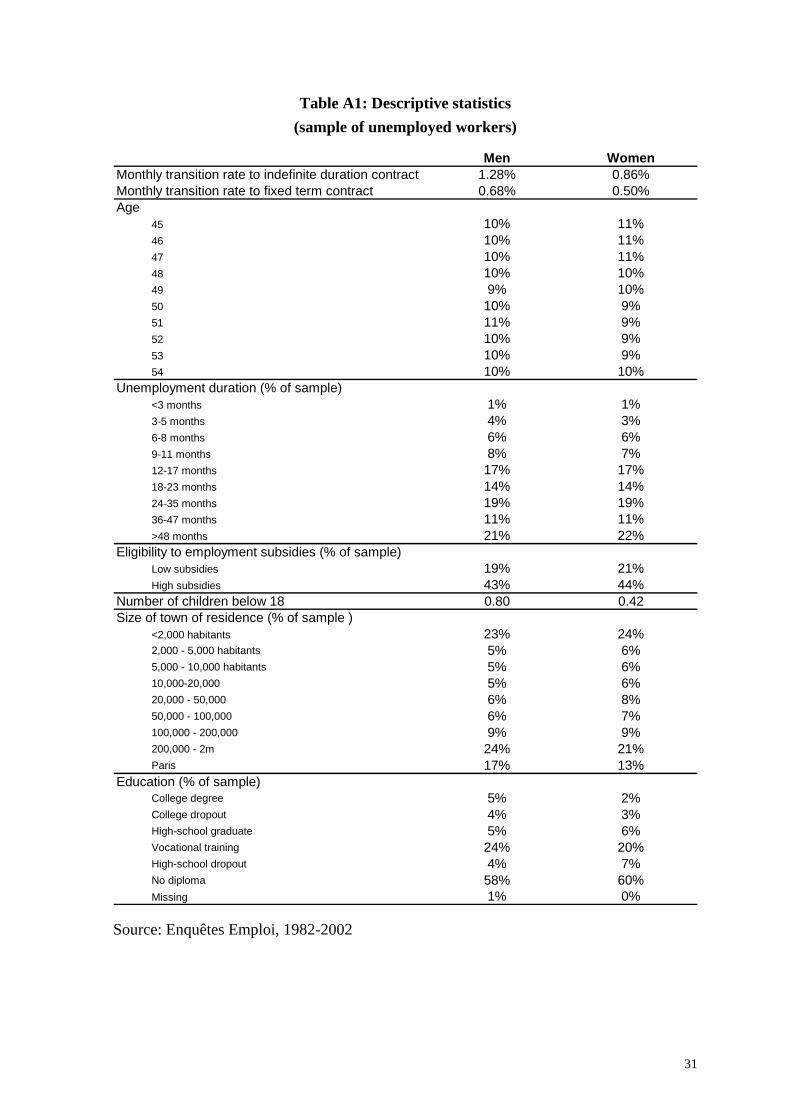
31
Table A1: Descriptive statistics (sample of unemployed workers)
Men WomenMonthly transition rate to indefinite duration contract 1.28% 0.86%Monthly transition rate to fixed term contract 0.68% 0.50%Age
45 10% 11%46 10% 11%47 10% 11%48 10% 10%49 9% 10%50 10% 9%51 11% 9%52 10% 9%53 10% 9%54 10% 10%
Unemployment duration (% of sample)<3 months 1% 1%3-5 months 4% 3%6-8 months 6% 6%9-11 months 8% 7%12-17 months 17% 17%18-23 months 14% 14%24-35 months 19% 19%36-47 months 11% 11%>48 months 21% 22%
Eligibility to employment subsidies (% of sample)Low subsidies 19% 21%High subsidies 43% 44%
Number of children below 18 0.80 0.42Size of town of residence (% of sample )
<2,000 habitants 23% 24%2,000 - 5,000 habitants 5% 6%5,000 - 10,000 habitants 5% 6%10,000-20,000 5% 6%20,000 - 50,000 6% 8%50,000 - 100,000 6% 7%100,000 - 200,000 9% 9%200,000 - 2m 24% 21%Paris 17% 13%
Education (% of sample)College degree 5% 2%College dropout 4% 3%High-school graduate 5% 6%Vocational training 24% 20%High-school dropout 4% 7%No diploma 58% 60%Missing 1% 0%
Source: Enquêtes Emploi, 1982-2002

32
Table A2: Descriptive statistics (sample of workers employed under indefinite-duration contracts)
Men Women Delalande schedule level 0,79 0,71Delalande schedule slope 0,21 0,20Other mandatory severance payment: level 2,42 2,02Other mandatory severance payment: slope 0,21 0,19Managers, technicians and engineers 41% 24%Clerks 6% 49%Skilled manual workers 41% 9%Unskilled manual workers 12% 18%No diploma 44% 46%High-school dropouts 36% 35%High-school graduates 9% 10%College and above 11% 9%Rural 27% 24%Urban (<200 thousand inhabitants) 37% 37%Urban (>200 thousand inhabitants) 19% 19%Urban (Paris area) 16% 19%Firm size: less than 20 35% 45%20 to 50 12% 10%50 to 500 24% 22%More than 500 29% 23%Sample size 95 943 55 193
Share or average
Source: Enquêtes Emploi, 1983-2001

33
Table A3: Difference-in-difference estimates by different degrees of treatment dosage
50 years old 51 years old 52 years old 53 years old 54 years old
-0.11 -0.05 -0.44 0.54 0.46(0.38) (0.36) (0.40) (0.41) (0.44)-0.39 -0.24 -0.59 0.15 0.14(0.37) (0.34) (0.37) (0.39) (0.42)-0.93** -0.78** -1.09*** -0.39 -0.43(0.39) (0.36) (0.39) (0.40) (0.44)-0.39 -0.19 -0.62 0.20 0.31(0.38) (0.35) (0.38) (0.40) (0.43)-0.75* -0.54 -0.90** -0.08 -0.07(0.41) (0.38) (0.41) (0.43) (0.46)
50 years old 51 years old 52 years old 53 years old 54 years old
-0.19 -0.31 0.22 0.37 -0.07(0.38) (0.40) (0.40) (0.44) (0.46)0.01 0.02 0.59 0.59 0.12
(0.41) (0.41) (0.42) (0.46) (0.48)-1.00** -1.03** -0.40 -0.37 -0.85*(0.43) (0.43) (0.44) (0.47) (0.50)-0.09 -0.27 0.42 0.44 -0.01(0.43) (0.43) (0.44) (0.48) (0.50)-0.55 -0.52 0.06 0.11 -0.50(0.41) (0.42) (0.42) (0.46) (0.48)
Panel A: Men
Panel B: Women
47 years old
48 years old
49 years old
Comparison group over 50
Comparison group over 50
Comparison group before 50
45 years old
46 years old
Comparison group before 50
45 years old
46 years old
47 years old
48 years old
49 years old
Notes: Results from an unemployment duration model for transitions to employment in the private sector under indefinite duration contract. Proportional hazard specification (see section 4). Standard errors in parentheses; * significant at 10%; ** significant at 5%; *** significant at 1%. The different cells display the same coefficient of interest as in table 3 (a difference-in-difference estimate of the impact of the July 1992 reform) for the same observation period but for different comparison groups. For instance, the top cell on the left (-0.11) indicates that unemployed workers aged 45 have seen a reduction in their probability of entering employment in the private sector compared to unemployed workers aged 50. Controls for composition effects include the number of children below 18, the size of the town of residence, indicators for months and years, education and age (in years).

34
Figure 1: Comparison of the Delalande costs with mandatory severance payments (in monthly gross wages).
Men 1992-1997
0
2
4
6
8
10
50 51 52 53 54 55 56 57 58 59
Mandatory severance payments Additional Delalande tax
Women 1992-1997
0
2
4
6
8
10
50 51 52 53 54 55 56 57 58 59
Mandatory severance payments Additional Delalande tax
Men 1998-2001
0
2
4
6
8
10
50 51 52 53 54 55 56 57 58 59
Mandatory severance payments Additional Delalande tax
Women 1998-2001
0
2
4
6
8
10
50 51 52 53 54 55 56 57 58 59
Mandatory severance payments Additional Delalande tax Source: Enquête Emploi, 1987-2001
Note : At each age, the bar displays the mandatory severance payments paid by the firm to the worker, plus the Delalande tax paid to the unemployment insurance system.
As mandatory severance payments depend on the seniority of the worker, and as the Delalande cost sometimes depend on the size of the firm and the age at hiring, average costs are computed for each age group using the distribution of seniority, firm size and age at hiring from the Enquête Emploi.
Women 1987-1991
0
2
4
6
8
10
50 51 52 53 54 55 56 57 58 59
Mandatory severance payments Additional Delalande tax
Men 1987-1991
0
2
4
6
8
10
50 51 52 53 54 55 56 57 58 59
Mandatory severance payments Additional Delalande tax

35
Figure 2: Simulation of the impact of the 1993 reform on job surplus
Variation in surplus at hiring due to 1992 legislative change (after minus before)
-0.50
-0.40
-0.30
-0.20
-0.10
0.00
0.10
0.20
0.30
0.40
0.50
40 41 42 43 44 45 46 47 48 49 50 51 52 53 54 55 56 57 58 59 60
Age at hiring (in years)
Year
s of
ann
ual s
urpl
us
Note: See text, section 4.

36
Figure 3: Change in monthly transition rates from unemployment to employment under indefinite duration contracts (after 1992 minus before 1992)
-.01
-.005
0.0
05.0
1
45 46 47 48 49 50 51 52 53 54Age group
Men
-.01
-.005
0.0
05.0
1
45 46 47 48 49 50 51 52 53 54Age group
WomenChange in transition rate to employment

37
Figure 4: Monthly transition rates from unemployment to employment under indefinite duration contracts after the 1992 reform (men)
0
.01
.02
.03
.04
.05
48 49 50 51 52Age
Transition rate after 1992 (men)

38
Figure 5: Evolution of the difference in transition rates from employment to employment under indefinite duration contracts, 47-49 minus 50-52 year old.
-.1-.0
50
.05
.1
1982 1984 1986 1988 1990 1992 1994 1996 1998 2000 2002Semester
Men
-.1-.0
50
.05
.1
1982 1984 1986 1988 1990 1992 1994 1996 1998 2000 2002Semester
WomenTransition rate of 47-49 vs 50-52 year old
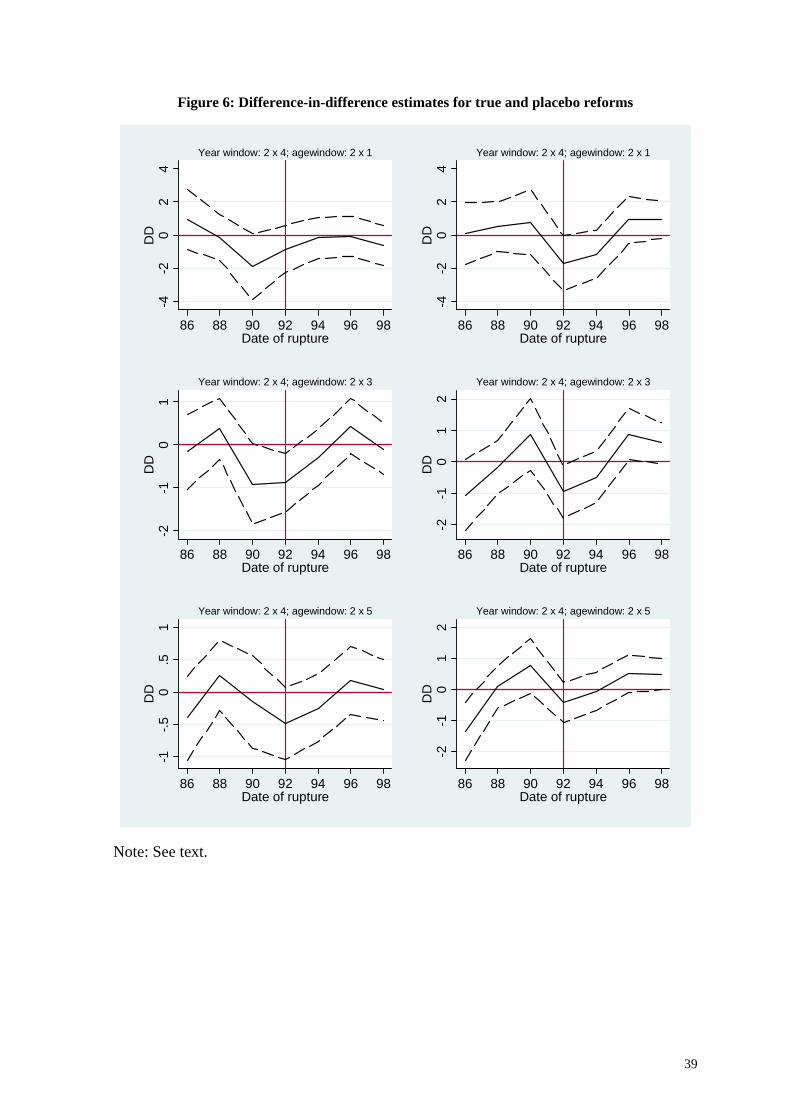
39
Figure 6: Difference-in-difference estimates for true and placebo reforms
-4-2
02
4D
D
86 88 90 92 94 96 98Date of rupture
Year window: 2 x 4; agewindow: 2 x 1
-4-2
02
4D
D
86 88 90 92 94 96 98Date of rupture
Year window: 2 x 4; agewindow: 2 x 1-2
-10
1D
D
86 88 90 92 94 96 98Date of rupture
Year window: 2 x 4; agewindow: 2 x 3
-2-1
01
2D
D
86 88 90 92 94 96 98Date of rupture
Year window: 2 x 4; agewindow: 2 x 3
-1-.5
0.5
1D
D
86 88 90 92 94 96 98Date of rupture
Year window: 2 x 4; agewindow: 2 x 5
-2-1
01
2D
D
86 88 90 92 94 96 98Date of rupture
Year window: 2 x 4; agewindow: 2 x 5
Note: See text.

40
Figure 7: Layoff rates according to age and to the period
.01
.02
.03
.04
.05
.06
Layo
ff ra
te
41 43 45 47 49 51 53 55 57Age
1983-86 1987-911992-98 1998-01
Source: Enquête Emploi, 1983-2001
Note: Layoff rates are computed from yearly transitions for each age group.

41
Figure 8: GDP growth rate
-20
24
6g
1980 1985 1990 1995 2000annee
GDP growth rate (%), 1982-2002
Source: National accounts (INSEE)

42
Figure 9: Predicted yearly layoff rates with and without the Delalande tax
0.0
2.0
4.0
6.0
8La
yoff
rate
41 43 45 47 49 51 53 55 57
1983-86
0.0
2.0
4.0
6.0
8
41 43 45 47 49 51 53 55 57
Without tax With tax
1987-91
0.0
2.0
4.0
6.0
8
41 43 45 47 49 51 53 55 57
Without tax With tax
1992-980
.02
.04
.06
.08
41 43 45 47 49 51 53 55 57
Without tax With tax
1999-01, large firms
Source: Enquête Emploi, 1983-2001
Note: For each period, the dashed line displays the predicted layoff rate without Delalande tax, and the full line displays the predicted layoff rate with the additional Delalande cost. Predictions are using estimates of column 6 in table 9, to which we apply the Delalande schedule. See note to table 9 for more details.