The Periodic Theory of Elements for World...
21
The Periodic Theory of Elements for World Population 1 Douglas R. White, Institute for Mathematical Behavioral Sciences, University of California, Irvine Artemy Malkov, Institute of Applied Mathematics, Russian Academy of Sciences Andrey Korotayev, Center for Civilizational and Regional Studies, Russian Academy of Sciences Draft 1.01 For submission to Structure and Dynamics with a shortened version for Science Abstract. Given that a power-law growth dynamic giving way as predicted by von Foerster et al. (1960) to a global demographic transition has been occurring since 1962, we examine the long- term time-series of conventional estimations of world population to see if one or more similar transitions occurred in the past. There is no scientific justification to reject the proposition of one or more very long earlier periods of stable quadratic growth rates that were higher than those observed for the period 1750-1958. These would have necessarily led to earlier singularities that would have produced earlier demographic transitions, like the one observed today. We reject one of the alternatives, that human evolution to date has been governed by a single trend of power- law growth that recently approached a singularity that predicts transition to slower growth. We find instead a coherent theory that connects variation in the connectivities of growing segments of the world population with (1) transition from early exponential growth, (2) quadratic growth in the early period of urban growth and associated trade and other connectivities, with a phase transition to lower growth associated with a power-law growth-reducing singularity, (3) population fluctuations after this first ‘collapse’ of sustained high-level growth, (4) settling in of steady lower growth rates from 1650-1962, again with a demographic phase transition to lower growth associated with a power-law growth-reducing singularity, and (5) a recent demographic transition for which the long-term trend characteristics are yet unknown, the possible trajectories of which are usefully informed by the historical record and mathematical modeling. We show that the power-law model is not simply one of estimating trends and noting changes in an ad hoc and atheoretical way. Rather, because these models imply a population dynamic close to singularity points, they constitute an explanation of phase shift that does not imply any particular set of mechanisms, only that there is a sufficiency of mechanisms, ones that may differ from region to region, to bring about phase shift prior to singularity. How this mechanism-independent explanation works is explicated. 1 The work of Malkov and Korotayev is supported by the Russian Foundation for Basic Research (04-06- 80225, 02-06-80219) and that of White by the EU grant # , Information Society as a Complex System.
Transcript of The Periodic Theory of Elements for World...

The Periodic Theory of Elements for World Population 1
Douglas R. White, Institute for Mathematical Behavioral Sciences, University of California, Irvine
Artemy Malkov, Institute of Applied Mathematics, Russian Academy of Sciences
Andrey Korotayev, Center for Civilizational and Regional Studies, Russian Academy of Sciences
Draft 1.01 For submission to Structure and Dynamics with a shortened version for Science
Abstract. Given that a power-law growth dynamic giving way as predicted by von Foerster et al.
(1960) to a global demographic transition has been occurring since 1962, we examine the long-
term time-series of conventional estimations of world population to see if one or more similar
transitions occurred in the past. There is no scientific justification to reject the proposition of one
or more very long earlier periods of stable quadratic growth rates that were higher than those
observed for the period 1750-1958. These would have necessarily led to earlier singularities that
would have produced earlier demographic transitions, like the one observed today. We reject one
of the alternatives, that human evolution to date has been governed by a single trend of power-
law growth that recently approached a singularity that predicts transition to slower growth. We
find instead a coherent theory that connects variation in the connectivities of growing segments of
the world population with (1) transition from early exponential growth, (2) quadratic growth in
the early period of urban growth and associated trade and other connectivities, with a phase
transition to lower growth associated with a power-law growth-reducing singularity, (3)
population fluctuations after this first ‘collapse’ of sustained high-level growth, (4) settling in of
steady lower growth rates from 1650-1962, again with a demographic phase transition to lower
growth associated with a power-law growth-reducing singularity, and (5) a recent demographic
transition for which the long-term trend characteristics are yet unknown, the possible trajectories
of which are usefully informed by the historical record and mathematical modeling. We show that
the power-law model is not simply one of estimating trends and noting changes in an ad hoc and
atheoretical way. Rather, because these models imply a population dynamic close to singularity
points, they constitute an explanation of phase shift that does not imply any particular set of
mechanisms, only that there is a sufficiency of mechanisms, ones that may differ from region to
region, to bring about phase shift prior to singularity. How this mechanism-independent
explanation works is explicated.
1 The work of Malkov and Korotayev is supported by the Russian Foundation for Basic Research (04-06-80225, 02-06-80219) and that of White by the EU grant # , Information Society as a Complex System.
World Population
1
In modeling the processes of human population growth, where we need to recognize
characteristics that are relevant to the construction of theory, such as the differentiation of inert
and interactive elements, a useful parallel might be the discovery of the intimate connections
between structure and dynamics implicit in Mendeleev’s construction of the periodic table of the
elements. Even without knowing the structure of atomic rings—or foreseeing that some elements
were inert because their electrons filled their outer ring—his significant step was in classifying
atomic elements, first, by their inert or active potentialities for bonding (culminating in column 8
for inert elements), and second, by their structural complexity (rows of the table, with row-
column position correlated with atomic weights).
In beginning to understand the connection between structure and dynamics in the social
sciences, we may be in a similar situation. We have glimmers of knowledge about population
structure in human evolution—and some reasonable inferences about network structure—but we
have more reliable data about the weights and numbers of elements, such as people and the
density of places, at various times, especially since the rise of urbanism in the 4th millennium
BCE (e.g., Kremer 1993, Chandler 1997, Modelski 2003). Like Mendeleev, we begin with the
inertial and dynamical properties of different kinds of growth.
Inertial Growth
Growth can be characterized as inert if population doubles at regular intervals. This trend is easy
to identify by plotting time on the X-axis and the log of population of the Y-axis and checking
whether the log trend is linear. If so, growth is exponential, and is approximated by the formula
dN/dt = aoN, ao being the constant that governs the slope of the regression line. Many species
exhibit variations of exponential growth.
The Dynamic of Quadratic Growth
In their characteristics of aggregate population growth, humans are unlike most other species.
Quadratic population growth, a trend described by dN/dt = N2/K, is well documented for long
periods of human evolution. Quadratic growth implies a dynamic: No process of time-dependent
power-law growth such as the quadratic can sustain itself indefinitely for the reason that
population doubling in power-law growth is a decreasing linear function of time. The acceleration
of doubling-time necessarily produces an instability, such that from any starting population N1 at
an initial time t1, power-law growth predicts an ‘infinite’ population at a finite date. No physical,
chemical or biological growth process can sustain power-law growth up to the mathematical
White, Malkov and Korotayev
2
singularity of a fixed time when its elements become infinite. There is no alternative, for a stable
power-law trend, other than for the trend to end well before the expiration date of the singularity.
Power-law growth, then, has a built-in dynamic, namely, that its expiration date is predictable
from the growth constant up to the time of transition. It implies, by definition, a predictable phase
transition dynamic.
Theory of Inert and Dynamic Growth
Exponential growth can also be said to be inert because, unlike power-law growth, it does not
possess an intrinsic dynamic. Thus, like Mendeleev, we can classify periods of world population
growth as inert when there is stable long-term exponential growth and dynamic when there is
stable long-term power-law growth. Each of these trends has well defined criteria for estimating
starting and ending dates in terms of fit to a straight line in an appropriate scatter plot of log
(population) with either log (time) or log (time to singularity). When neither of these growth
trends occurs, we define a period as intermediate. Eight of the nine possible transitions can occur
among the three types of periods, including those where change in the growth constants of the
first two types also constitutes a change of periodization but excluding a transition from one inert
period to another if only because we have defined as yet no growth constants to differentiate two
successive intermediate periods.
If humans were like most species we would observe relatively short periods of
exponential growth, or else continuously changing growth rates, for which in both cases a is
variable in the defining equation, dN/dt = aN. In some cases, as with predator/prey interactions,
variations in a are cyclic. That is not what we mean in our title by periodic, however. Whether
population dynamics are simple or complex often depends on the structure of interspecific or
intraspecific interactions as well as interactions with the larger environment.
Humans differ from most species in that world population estimates over the last one
million years show long periods of all three types of periods: inert, dynamic, and intermediate.
Every dynamic period (one of constant power-law growth) has as an intrinsic property that it
must give way to a new period prior to its expiration at the singularity predicted by its growth
constant. When this occurs, those transition times that fall within the time frames predicted by
singularities—but not the specific mechanisms that bring about the lowering of growth rates—can
be said to be explained by the power-law growth dynamic. Such explanations, that if power-law
growth continues into the time frame of its singularity, then a phase shift will occur, constitute
one of the most powerful types of scientific explanation because they follow as a necessary,
World Population
3
logico-mathematical derivation that holds for all power-law growth trends. The only case in
which a demographic transition at the end of a stable power-law growth period is not explained
by this dynamic is when it occurs before the date predicted by power-law dynamics.
The Making of Theory after a Predicted Doomsday
Most demographers, with the exception of Umpleby (1990), have failed to appreciate the
implications of power-law growth for research on human population. In their 1960 Science
article, Foerster, Mora, and Amiot found a least-squares fit to quadratic growth with an R2 =
0.9957 for a dense longitudinal time series from 1750 to 1958, the last date at which reliable
population data was available at the time of their writing. In explicating the consequences of
world population quadratic growth from 1750-1958, they used prediction methods that are in
common use by physicists in predicting phase shifts in power-law growth processes involved in a
variety of physical and biological phenomena. They showed how such growth implied a transition
to slower growth (or even more dramatic phase transitions) and then derived mathematically a
precise time frame within which a transition must occur, prior to what they called the unreachable
‘doomsday’ singularity of a continuing power-law trend. They estimated the doomsdate at 2027,
which put the predicted demographic transition date several generations earlier because human
populations cannot double in less than a human generation. Indeed, the predicted transition in
world population did occur, with observable lowerings of growth rates beginning in mid-1962.
It is hardly surprising that, ‘in fact,’ a demographic transition as predicted by von
Foerster et al. began to be noted after 1962. Social scientists tend to resist, however, what
physicists may know to be valid mathematical derivations, if only because most social scientists
are not trained in mathematical dynamics. Ironically, because the transition destroyed the
constancy of the trend, demographers tended to dismiss the previous power-law trend or its
relevance to demographic transition. They were more interested in the detailed mechanisms of the
shift.
Von Foerster may have added to the confusion by his tongue-in-check use of ‘doomsday’
to dramatize the policy considerations involved in the unavoidable demographic transition. In
doing so he made the avoidance of doomsday seem like a voluntary effort. The confusion here is
between mechanism and explanation, which is a crucial element in what we now understand—
after studying von Foerster’s work—to be a periodic theory of elements for world population.
The originality of our work in recognizing the existence of such a theory is to apply von
Foerster’s methods not simply to the latest period of (demonstrably) stable growth in world
White, Malkov and Korotayev
4
population, but to earlier periods, and to use his methods to periodize growth and relate the
characteristics of differentiated periods to structural characteristics that affect their differentiation.
Concepts of Explanation
Structure and dynamics allow characteristically different and complementary types of
explanation. The explanation for a phase shift in power-law growth is simply a matter of
mathematical definition, applying that definition to measure the existence of a trend, estimating
an outside limit for a phase shift given the trend, and observing the unavoidable shift as a
consequence of fit between the definition and the trend. This was a prediction that should never
have been in dispute because there was no way it could not be true. That does not entail that it
was not falsifiable, since the prediction from the mathematics could be empirically tested, and
such predictions do work, empirically, every time, for real physical, chemical or biological
species. A necessarily true from theory but empirically falsifiable and tested but unfalsified class
of predictions constitute, rather, a scientific explanation of the event class, independently of the
mechanisms by which such phase shifts occur. There are neither implications as to type of
mechanisms involved in the phase shift nor, beyond the predicted slowdown of growth, as to its
result, which might be catastrophe or extinction. Given von Foerster’s failure to effectively
communicate his findings as theory, we think it important to spell out the logic of the theory
itself.
Structural explanations are often complementary to dynamical ones. Description and
measurement of structures of interaction (network characteristics) can often help to identify the
interactive contexts in which different kinds of dynamics can or cannot come into play. Only
when some sizeable fraction of a population is interconnected, for example, it is possible to
conceive of a growth law such as dN/dt = N2/K where it is some proportion of connected pairs in
the population of N elements can have an effect on growth. Only when connectivity or
traversability through large chunks of a total population is possible can there be diffusion effects
that result from that connectivity. Adaptations learned in one part of a population can then diffuse
to others, provided that communication is possible. This cannot occur if the smaller groups do not
connect up to span and allow diffusion from local regions to large chunks of the total population.
Exponential growth, dN/dt = aN, can operate without this interactive component.
Goals and Hypotheses
Recognizing that von Foerster et al.’s model of world population growth is not widely
appreciated today, we take a radically different approach. To make a very different use of their

World Population
5
findings and to counter the objections to their work (e.g., Dorn 1962), we begin with a first
observation: a quadratic world population growth model cannot be validly rejected because it
makes correct predictions about dynamics. One would have to ask instead: what happens after
the demographic transition occurs, as predicted? Is there a transition period after which growth
settles once more into a stable but slower-growth power-law trajectory?
Our second observation is that rejection of a power-law model is not justified by the fact
that some countries or regions pass through demographic transitions earlier than others. The
model does not imply specific characteristics of the growth curves in distinct or regional
subsamples. While data aggregated from different samples will maintain a power law in the
aggregate if power laws hold within in comparable limits in the samples, an observed power-law
relationship in an aggregate does not imply power laws for the more localized sets of data that
were aggregated (Farmer 2004). Even if population growth region by region is exponential but is
power-law in the world aggregate, the explanatory power to estimate when a quadratic trend must
end at the world level even if the mechanisms of phase transition vary region by region. The
existence of the mechanisms of change must, in any case, be investigated at the local level and, to
the extent that they are everywhere operative, replicated in multiple regional studies.
From these two basic observations about power-law growth periods that necessarily
entail transitions to lower growth before their singularities are encountered, we deduce two
further possibilities. One concerns the demographic transition that is underway today: What
happens after the shift? Might not a new power-law growth period emerge later at a lower growth
rate? The second is that this possibility also exists in parallel for the past: Namely, there may have
been earlier periods of quadratic growth rate that would have necessarily led to earlier
singularities and earlier demographic transitions. If a power-law trend preceded a demographic
transition to slower growth in the historical past within the time frame predicted by a singularity,
this is sufficient explanation in itself, even if it does not predict the mechanism of change.
The second, historical, possibility impels us to look to population data concerning periods
prior to 1750 as to characteristic forms of growth and transitions between them. Here we can
make a further deduction: No demographic transition could have existed due to a singularity in a
quadratic growth trend prior to 1750 but with a lower growth rate than after 1750, because its
singularity would have to occur after 2027. This deduction helps to guide our search as to what to
look for in the historical data in terms of periods of inertial, dynamic, or intermediate forms of
growth. There is a certain preset ordering as to how the dynamical periods can be successively
structured. (It is impossible to have a low but stable quadratic growth period with a transition at

White, Malkov and Korotayev
6
singularity that precedes such a transition in a later period having higher quadratic growth. When
this situation occurs, it must be attributed to an intermediate period, which helps to descriptively
characterize periods of history by criteria other than local goodness-of-fit to a growth curve).
Thus we state two weak but plausible hypotheses:
Hypothesis 1: There exists in human history a possibility of a succession of long but
broken power-law trends, with downward growth breaks explained by singularities, and only the
upward breaks requiring further explanation.
Hypothesis 2: One candidate for an upward inflection from a long period of human
evolution with lower slope of power-law growth to one with a higher slope is a change in the
connectivities within and between subgroups in the population. This requires further explication.
Coalitions
We have now set the stage to begin with the questions posed by von Foerster et al. (1960:1292-
1293) concerning the productivity of elements of a population as regards the net rate of growth.
As we noted at the outset, quadratic population growth is atypical for most species. In the general
case, the growth rate is measured in change of N per unit time, dN/dt = aN, where the constant of
productivity— a —varies from generation to generation. For most species there is a typical
average, a0, around which such changes fluctuate. This describes exponential growth, dN/dt =
a0N, that is normalized for a constant a0, the average productivity of an individual element. When
individuals compete in a limited environment, the productive rate typically decreases with the
greater number N in competition. This situation would typically apply where sufficient
communication is lacking to enable resort to other than a competitive and nearly zero-sum
multiperson game. It may not apply, however, when the elements in a population “possess a
system of communication which enables them to form coalitions” and—von Foerster et al. go on
to say—“until all elements are so strongly linked that the population as a whole can be considered
from a game-theoretical point of view as a single person playing a two-person game with nature
as the opponent.”
Von Foerster et al. take this latter statement as an hypothesis that might explain the
unusual productivity of elements in human populations according to quadratic growth, dN/dt =
N2/K, where the dependency on N2 suggests a complete network of relationships, or a coalition
among all elements. The 1/K constant, however, can also factor in some fraction of a complete
network that is in communication. This is the interpretation that we prefer, separated into two
propositions.
World Population
7
(1) Power-law growth tends to kick in where cooperative communication comes into play in
such a way as to favorably modify the environment to support higher growth. This requires that
we re-express power-law growth, dN/dt = N2/K, in its integral transformation: Namely, that of a
population that grows toward singularity: N = K/(τ)k, where k is the power-law slope, tau or τ = t0
- t is time to singularity, t is calendrical time, and t0 is the calendrical singularity date at which
K/(t0 - t) = K/0, that is, where division by zero produces the dynamical instability. In log-log
form, log (N) = log (K) - k log (τ), where K is the population at t = t0 – 1 and log (t0 - t) is zero.
(2) The greater the connectivity of a population or network of populations, the greater
potential for a higher power-law slope for the ratio of log (N) and log (τ). This second
proposition would be consistent with the long period of recent world population history for which
the quadratic equation corresponds closely to the observed log-log linear trend line up to 1962,
and for which the recent world population transition, starting in 1962, is explained by the
singularity of this trend line in 2027.
In this context, we can restate our second hypothesis as a third proposition:
(3) The proper predictor for a phase shift from a long historical period with a lower power-
law slope to one with a higher power-law slope is a transformative increase in connectivity. This
proposition is qualitative, however, and needs to be tempered by the fact that slopes will vary
according to the location of singularities.
We can also restate our hypothesis 1 at this point as a fourth proposition:
(4) Human evolution consists of a succession of long but broken power-law trends in the
world population, with downward growth breaks explained by the singularities of the trends, and
the upward breaks by a transformative increase in connectivity.
These are the propositions that we want to explore in our experiment of looking back in
time for periods of power-law growth and phase transitions.
The Method of the Experiment
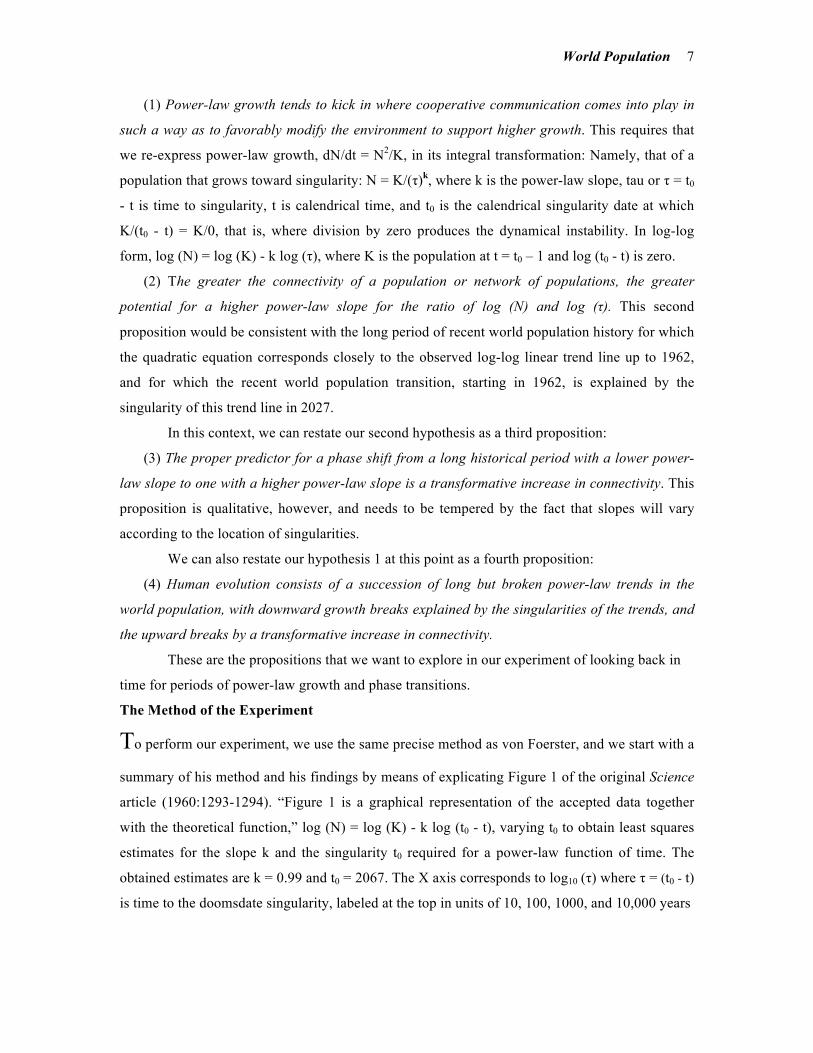
To perform our experiment, we use the same precise method as von Foerster, and we start with a
summary of his method and his findings by means of explicating Figure 1 of the original Science
article (1960:1293-1294). “Figure 1 is a graphical representation of the accepted data together
with the theoretical function,” log (N) = log (K) - k log (t0 - t), varying t0 to obtain least squares
estimates for the slope k and the singularity t0 required for a power-law function of time. The
obtained estimates are k = 0.99 and t0 = 2067. The X axis corresponds to log10 (τ) where τ = (t0 - t)
is time to the doomsdate singularity, labeled at the top in units of 10, 100, 1000, and 10,000 years
White, Malkov and Korotayev
8
away from doomsdate t0. The Y-axis values are log10 of world population. Between 1750 and
1958, these estimates vary from 687.4 million (108.837) to 2,918.2 million (10 9.465). The intercept
World Population
9
of the regression line on the Y axis, log (K), occurs on the vertical line corresponding to 100 (τ) =
0, one column further left than the axis shown for 10=101 years prior to t0, at τ = t0 - 1. The
population K at τ = 1 is simply the projection of the regression line onto a Y-axis at t0 - 1. The
bottom of the figure is labeled with calendrical dates, starting with 2017, corresponding to the
log10 (τ) values. Thus, the two parameters of this model, k and t0, and thus the values of τ, are
empirically estimated. We will omit consideration of population density, labeled on the left
vertical of the figure, which for our purposes is extraneous. If we replicate von Foerster’s method
with Kremer’s (1993) data, the slopes k = {.9797, .9613} are within two standard deviations as
estimated by von Foerster (±.1), the intercepts K = {11.26, 11.21} within half a deviation, and the
doomsdate is nearly identical. Further, if we use the two additional data points in Kremer’s data
to go back to 1650, we get identical results. The modern data, then, seem to be quite reliable.
[Artemy: I may have misunderstood K, which he gives as K = 17.9 (± 0.14), but my
explanation of K as an interpolation from the graph, gives K = 11.25. For the moment, I will stick
with my estimate.]
If we focus on the post-1960 data, not possessed by von Foerster, the 1960-2004 period is
also characterized by quadratic growth (R2 = 0.9929 for ten data points), but with no singularity
in sight for 1,000 years. In considering population policy, if power-law decline in dN/dt growth
rates (slope > 1) is occurring, the decline has a long tail that eventually produces a singularity.
Whether this type of slowdown in growth is occurring or an exponential decline is relevant to
policy because the former will not solve population explosion while the latter type of decline
soon drops to zero group. It is too soon to tell which type of process is occurring.
Sensitivity to Error in Data Fitting
Fitting longitudinal growth data to a power law by least squares is subject to several kinds of
estimation error. In varying the doomsdate to maximize the R2 of a log-log regression line, the R2
should be above .99, and even then, one must be careful that errors are not concentrated toward
one end of the line. We plot a wide range of potential doomsdates and corresponding values of
R2, and look for the asymptote as well as the maximum so as to take unreliability in measurement
into account. Such unreliability increases as we move back in time with population estimates
before 1700. One should be wary of using these methods for a regional population because of
interregional migration. As von Foerster et al. (1960) stated, “The use of estimates of the world
population rather than of populations of certain geographic regions eliminates to a certain extent
the influence of local fluctuations and migration. In the fit below for early period of urban
White, Malkov and Korotayev
10
growth, where rural areas were very thinly populated, and the city data has been very carefully
estimated, we get an R2 fit of 0.9955, which compares favorably with the von Foerster fit of .9957
for 1750-1958.
Results
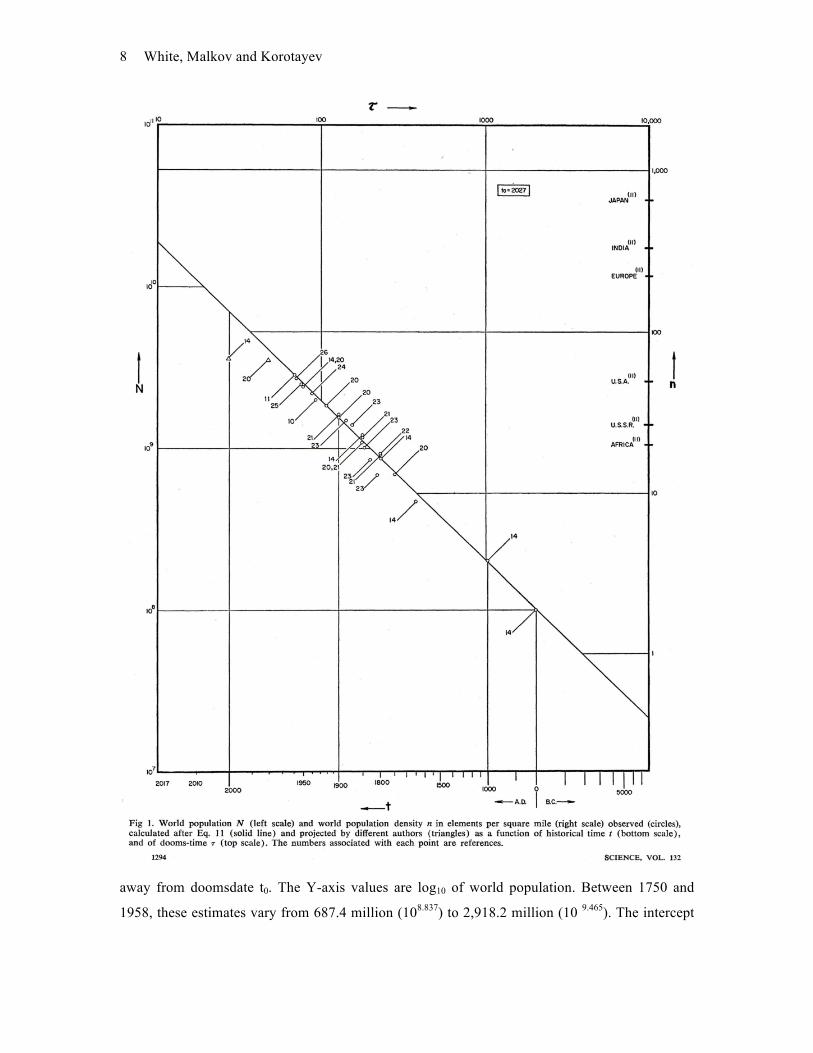
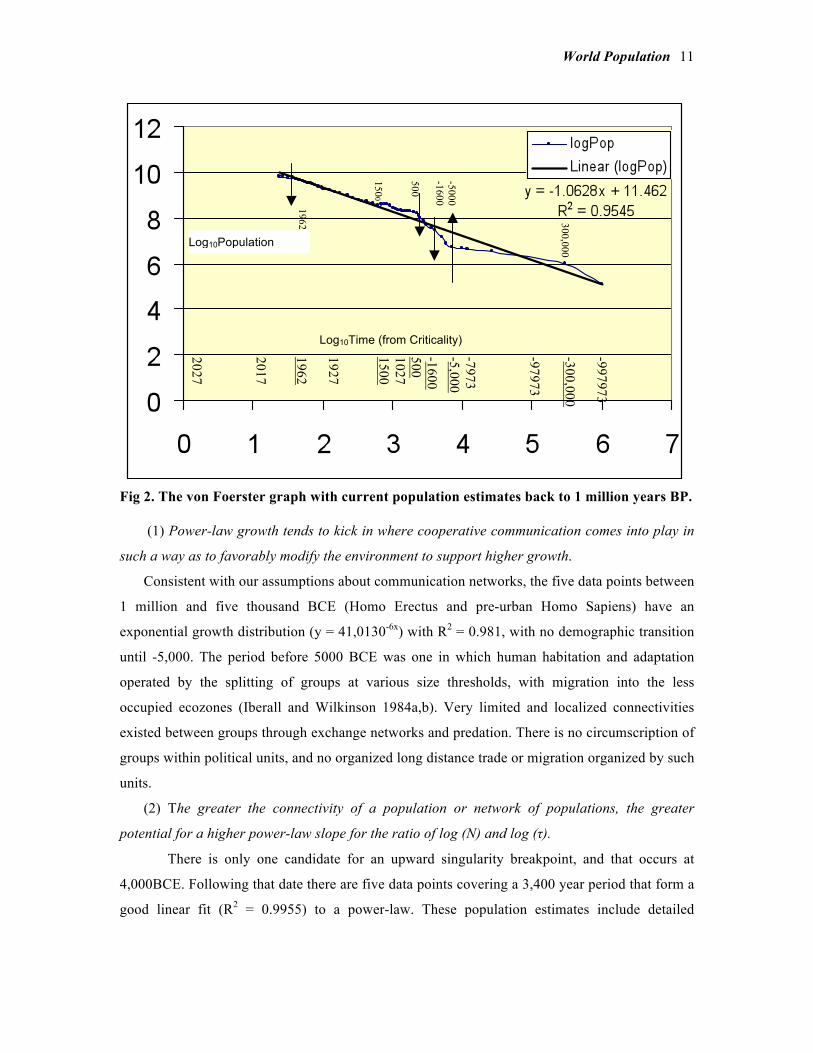
Figure 2 shows the first result of our historical experiment, extending the plot of Figure 1 for
population estimates back to 1 million BCE. Thus, as shown in Figure 2, we have on the Y-axis
the log10 of estimated world population, which varies from 125,000 at the earliest date to 6.3
million for 2003. The least squares regression line using t0 = 2027 is y = -1.0628x + 11.462 (R2 =
.9551), which is close to that of von Foerster, which is y = -.990x (± 0.009) + 11.25. The two
slopes differ by 6% and the constants by 2%. Whereas the Foerster k=.99 < 1 is one of increasing
growth rates, however, the long historical slope k > 1 is one of decreasing growth rates.
Estimating anew the t0 that maximizes R2 to give the best least squares regression, however, gives
t0 = 2053 and y = -1.139x + 11.746 with a maximum R2 = .9598. An R2 in the range of .95 to
.965, however, is not an adequate fit to a power-law growth model.
What we see instead in Figure 2 are massive discrepancies from the straight line for most
of the pre-modern period, from 1650 back. Our experiment is focused on these discrepancies. We
can immediately pinpoint where to look for the answer to our question about blowup regimes,
since there is only one temporal region with a slope that is (1) greater than that observed since
1500, (2) stable over half a dozen or more data points, and (3) of relatively long duration. This
period is indicated by the breakpoints labeled -500 and -5000 (BCE) on the figure. The abscissa
of Figure 2 thus carries two sets of dates as labels: those of 1, 10, 100, 1000, 10,000, 100,000 and
1,000,000 years prior to 2027, and the breakpoints of the years 1500, -500, -5000, and -300,000.
We can pinpoint the period between 500 BCE and 1500 CE as the only possible focus of our
question as to whether there might have existed (assuming these populations figures are
correlated within 1/10th of an order magnitude), a second doomsday in addition that of 2027.
Tests of Propositions.
Breakpoints of particular interest in Figure 2 are indicated by up or down arrows
intersecting the regression line, which occur at 1962, 1500, 500, -1500, -5,000 and -300,000.
These breakpoints are consistent with the propositions that follow about the possibility of a
division of periods of human evolution according to power-law growth breakpoints:
World Population
11
Fig 2. The von Foerster graph with current population estimates back to 1 million years BP.
(1) Power-law growth tends to kick in where cooperative communication comes into play in
such a way as to favorably modify the environment to support higher growth.
Consistent with our assumptions about communication networks, the five data points between
1 million and five thousand BCE (Homo Erectus and pre-urban Homo Sapiens) have an
exponential growth distribution (y = 41,0130-6x) with R2 = 0.981, with no demographic transition
until -5,000. The period before 5000 BCE was one in which human habitation and adaptation
operated by the splitting of groups at various size thresholds, with migration into the less
occupied ecozones (Iberall and Wilkinson 1984a,b). Very limited and localized connectivities
existed between groups through exchange networks and predation. There is no circumscription of
groups within political units, and no organized long distance trade or migration organized by such
units.
(2) The greater the connectivity of a population or network of populations, the greater
potential for a higher power-law slope for the ratio of log (N) and log (τ).
There is only one candidate for an upward singularity breakpoint, and that occurs at
4,000BCE. Following that date there are five data points covering a 3,400 year period that form a
good linear fit (R2 = 0.9955) to a power-law. These population estimates include detailed
-997973 -300,000 -97973 -7973 -5,000 -1600
500 1027 1500 1927 1962 2017 2027
300,000 -5000 -1600 500 150
0
1962
Log10Time (from Criticality)
Log10Population
White, Malkov and Korotayev
12
extrapolations from archaeological sites concerning city sizes compiled by Modelski (2003) and
Chandler (1987). The best-fit singularity occurs at 1390, although if we take 600 CE as the
singularity we still have R2 = 0.9955. The R2 starts to asymptote (.9939) at 410 CE, the time of
the collapse of the Roman Empire. A slight but temporary downward inflection begins at -1600,
but the main downward inflection begins between 400 and 500 CE, exactly on schedule for a
singularity that is still a bit off after 410. Thus, we have two “after doomsday” predictions
consistent with the von Foerster method of analysis.
(3) The proper predictor for a phase shift from a long historical period with a lower power-
law slope to one with a higher power-law slope is a transformative increase in connectivity.
The demographic transition that occurs at -4000 (BCE) is rather obviously related to
proto-urban connectivities and the growth of extensive trade networks (Algaze 2001, 2005, Haas
2005) in the proto-urban regions with networks extending to smaller settlements beyond. This is
well after habitable niches are filled on the earth surface, somewhere between 13,000-8,000 BCE,
when ethnicities develop as networks densify, and populations remix at higher densities (Iberall
and Wilkinson 1986). It is only once proto-urbanization appears circa 5000 BCE (Iberall and
White 1988) and networks of nearby proto-urban centers develop intensive trading networks
(Algaze 2001b) that form a network nucleus of urbanization, that connectivities dramatically
increase. After 3100 BCE, the city networks that develop begin to colonize. As they colonize they
maintain their trading networks, adding direct long-distance as well as locally intermediated
trade. The network connectivity at larger distances from the core networks of cities in the Old and
New World begin to amplify (Algaze 1993, 2001b), perhaps more so than at any other time in
human history. This is the period that we hypothesize to have the greatest connectivity and the
highest continuous growth rates in human history, as shown in Figure 2 and compared to other
periods in Table 3.
Thus, it is only with the rise of denser settlements linked by trade networks that:
(4) Human evolution consists of a succession of long but broken power-law trends in the
world population, with downward growth breaks explained by the singularities of the trends, and
the upward breaks by a transformative increase in connectivity.
The period of proliferating urban centers and networks ends with a first saturation of
urban-based trade networks into areas where production for such a network can be sustained.
Power-law population growth has a singularity circa 410, but well before that (at -1600) there has
been a short-lived temporary downward dip, setting forward a singularity date for resumption of

World Population
13
the same slope for growth. A world collapse of population and urban networks occurs at the time
predicted by singularity.
These propositions are constructed on the idea that variations in connectivity among
human settlements affect the dx/dy slopes calculated for our periods of study (see Table 3 in
White, Malkov and Korotayev 2005). Table 1 shows the predicted rank-order of these slopes, and
the hypothesis is qualitatively supported, with N=4 observations, but also a 2-tailed Spearman’s
correlation significance of p < .01).
Table 1: Effect of Variations in Connectivity with Changes in Slope (qualitatively sup-
ported, with N=4 observations the 2-tailed significance of Spearman’s correlation is p < .01)
Connectivity Type dx/dy population growth
Lowest: Radial Migration -0.43 Period D
World Religion -0.8106 Period B
World System -0.9402 Period A
Highest: Early Urbanization -2.9002 Period C
A related hypothesis is that the phase change in political enclosure of human settlements into
larger units affects the dx/dy in slopes calculated in Table 1. That is, it is not the diffusion of
urban settlements alone that increases connectivity in early urbanization and the spread of cities
but that a more radically increase in connectivity results from the emergence of the political
enclosure of multiple cities, or in some case, informal alliances of sets of cities into trading
blocks. In either case, the effect is to create trading blocks, and it is these blocks that augment
long-distance trade.
The best and perhaps the only reliable dataset on this issue is that constructed by
Taagapera (1997), who measures the effective number of polities enclosing politically enclosed
areas through time from 3000 BCE to the present. This is measured by taking the area of each
polity at each period in time, creating a vector of the percentage areas enclosed by each polity,
taking the geometric mean of the percentages and then dividing this mean into 100% to get the
effective number of polities (this is the same measure used to compare the effective of parties in
electoral systems across nations that have very different distributions of party size). The
Taagapera index for 3000 BCE to the present is shown in Figure 4. There are trends, cycles in the
detrended data, and breakpoints for historical phases in which consolidation occurs that is
significantly greater than expected from the cycles.
White, Malkov and Korotayev
14
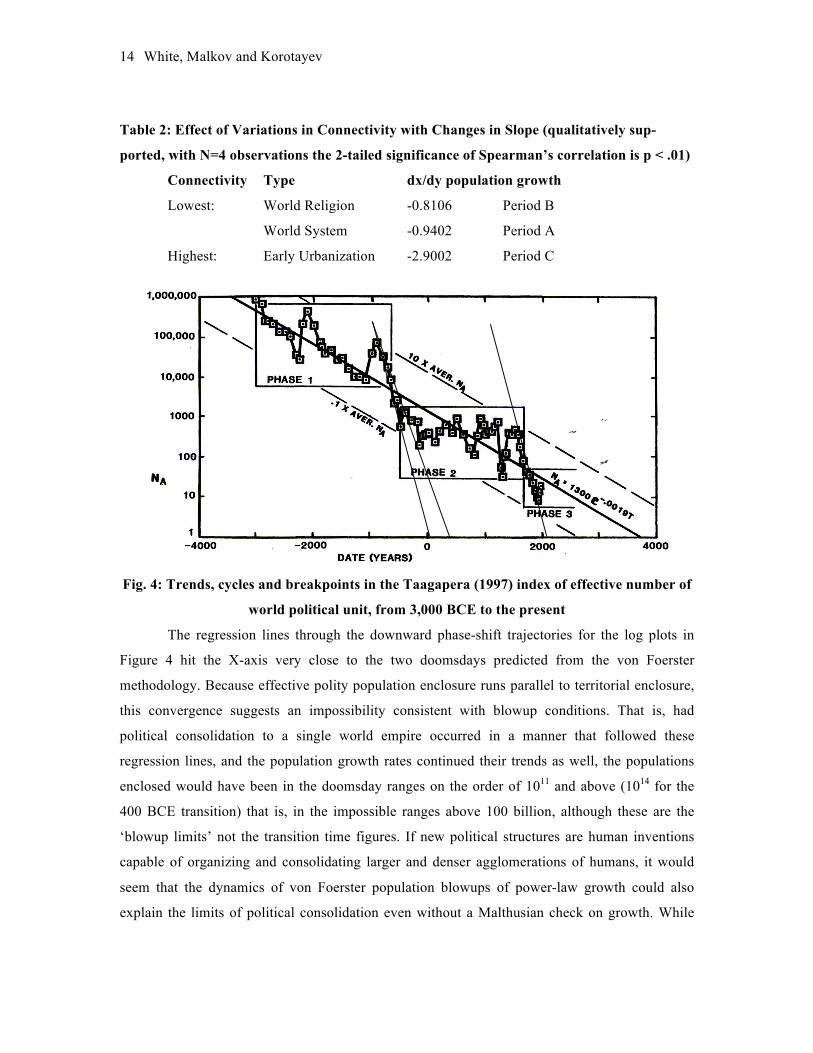
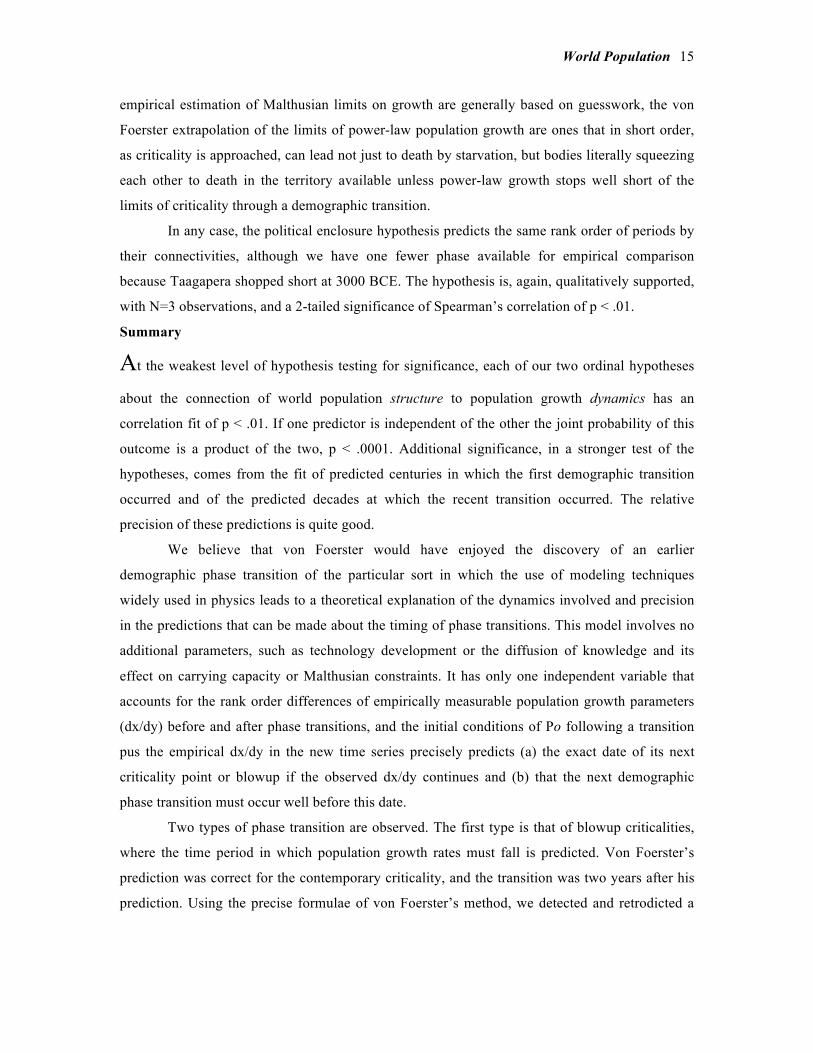
Table 2: Effect of Variations in Connectivity with Changes in Slope (qualitatively sup-
ported, with N=4 observations the 2-tailed significance of Spearman’s correlation is p < .01)
Connectivity Type dx/dy population growth
Lowest: World Religion -0.8106 Period B
World System -0.9402 Period A
Highest: Early Urbanization -2.9002 Period C
Fig. 4: Trends, cycles and breakpoints in the Taagapera (1997) index of effective number of
world political unit, from 3,000 BCE to the present
The regression lines through the downward phase-shift trajectories for the log plots in
Figure 4 hit the X-axis very close to the two doomsdays predicted from the von Foerster
methodology. Because effective polity population enclosure runs parallel to territorial enclosure,
this convergence suggests an impossibility consistent with blowup conditions. That is, had
political consolidation to a single world empire occurred in a manner that followed these
regression lines, and the population growth rates continued their trends as well, the populations
enclosed would have been in the doomsday ranges on the order of 1011 and above (1014 for the
400 BCE transition) that is, in the impossible ranges above 100 billion, although these are the
‘blowup limits’ not the transition time figures. If new political structures are human inventions
capable of organizing and consolidating larger and denser agglomerations of humans, it would
seem that the dynamics of von Foerster population blowups of power-law growth could also
explain the limits of political consolidation even without a Malthusian check on growth. While
World Population
15
empirical estimation of Malthusian limits on growth are generally based on guesswork, the von
Foerster extrapolation of the limits of power-law population growth are ones that in short order,
as criticality is approached, can lead not just to death by starvation, but bodies literally squeezing
each other to death in the territory available unless power-law growth stops well short of the
limits of criticality through a demographic transition.
In any case, the political enclosure hypothesis predicts the same rank order of periods by
their connectivities, although we have one fewer phase available for empirical comparison
because Taagapera shopped short at 3000 BCE. The hypothesis is, again, qualitatively supported,
with N=3 observations, and a 2-tailed significance of Spearman’s correlation of p < .01.
Summary
At the weakest level of hypothesis testing for significance, each of our two ordinal hypotheses
about the connection of world population structure to population growth dynamics has an
correlation fit of p < .01. If one predictor is independent of the other the joint probability of this
outcome is a product of the two, p < .0001. Additional significance, in a stronger test of the
hypotheses, comes from the fit of predicted centuries in which the first demographic transition
occurred and of the predicted decades at which the recent transition occurred. The relative
precision of these predictions is quite good.
We believe that von Foerster would have enjoyed the discovery of an earlier
demographic phase transition of the particular sort in which the use of modeling techniques
widely used in physics leads to a theoretical explanation of the dynamics involved and precision
in the predictions that can be made about the timing of phase transitions. This model involves no
additional parameters, such as technology development or the diffusion of knowledge and its
effect on carrying capacity or Malthusian constraints. It has only one independent variable that
accounts for the rank order differences of empirically measurable population growth parameters
(dx/dy) before and after phase transitions, and the initial conditions of Po following a transition
pus the empirical dx/dy in the new time series precisely predicts (a) the exact date of its next
criticality point or blowup if the observed dx/dy continues and (b) that the next demographic
phase transition must occur well before this date.
Two types of phase transition are observed. The first type is that of blowup criticalities,
where the time period in which population growth rates must fall is predicted. Von Foerster’s
prediction was correct for the contemporary criticality, and the transition was two years after his
prediction. Using the precise formulae of von Foerster’s method, we detected and retrodicted a
White, Malkov and Korotayev
16
second blowup critical that implied a phase transition beginning in about 400 BCE. As predicted,
a major demographic transition of this sort did begin in about 400BCE and continued to 200 CE
when growth leveled off for another two hundred years as the Roman Empire collapsed. The start
of this period of growth reduction occurred in the axial age of birth of great world religions. The
new economic, political and religions systems of that period at the end of the first age of urban
civilization had combined economic incentives for reducing populations with political and
religious injunctions that coupled to reduced population growth. We are now at the end of the
second such age of urban growth in which we must drastically alter the power-law rate of growth
that operated up to 1962. It remains to be seen how politics and religion will combine with
economic incentives and political penalties for fewer children or economic enmiseration and
political conflicts that raise mortality in the face of improved medical technology, and how world
religions and revitalization movements will factor into these changes.
The other type of change has been seen only once: that of a demographic transition to
heightened population growth rates, such as occurred in the town and urban revolution that began
circa 5000 BCE.
To conclude, we can select among our alternate initial propositions about power-law
growth. We find long historical segments, one of ca. 395,000 years, then of roughly 4,600 years,
and finally of ca. 2,500 years (with some large initial perturbations) in which there is fairly
uniform power-law growth (slow, very rapid, then intermediate), with two major transitions
between them and finally a recent transition to slower growth. These constant segments of power-
law growth might have comprised roughly as much as 97% of the last 300,000 years of human
evolution, but mostly in the pre-urban phase. In between these segments there are shorter periods,
sometimes as long as 600-800 years for slowdowns, followed by 1,000 years of large cyclical
fluctuations, before settling into relatively steady state with smaller fluctuations. Of the last 2,500
years of slowdown, roughly 75% has been marked by these instabilities. Still, it is power-law
growth that (1) characterizes the longest time segments and that (2) predicts where singularities
producing slowdown will occur. It is to be expected that the longish periods of deceleration will
not be characterized by power-law growth.
Finally, there has been only one major population growth rate upturn in the last 300,000
years, during the long 4,500 year period of primary urban growth of colonial spread associated
with the development of long distance trade and market systems. If a second such upturn should
occur, in some peoples’ minds, it will be that of an analogous colonization of space. If so, human
life on our planet will be sustainable in one of two ways only: one-way tickets to space, with
World Population
17
growth at the interplanetary periphery, or two-way tickets that engender the growth in
connectivities that were seen in the urban revolution, and that engender higher rates of growth.
These can be supported only with the stacking of life on our planet in ways that are then utterly
dependent on such a level of complexity, including interplanetary exchange, that robustness to
perturbation and collapse is nearly unthinkable. It is better, perhaps, to think closer to home,
especially since most of the perturbations of demographic evolution have operated in the face of
the precariousness of urban growth rates and during the last 2,500 years.
Given these results, however, there is a further problem for the future. There is no reason
to think that after the current world demographic transition, if zero growth does not occur, that the
slow growth will not take the same power-law form dN/dt = N2/C, only with a larger C. Although
such growth is slow, it too constitutes a blow-up regime, however long it is postponed.
References Algaze, Guillermo. 1993. The Uruk World System: The Dynamics of Expansion of Early
Mesopotamian Civilization. Chicago: University of Chicago Press. 2001a. “Initial Social Complexity in Southwestern Asia: The Mesopotamian Advantage.”
Current Anthropology 43: 199-233. 2001b. “The Prehistory of Imperialism: The Case of Uruk Period Mesopotamia.” M. Rothman,
ed. Uruk Mesopotamia and its Neighbors: Cross-Cultural Interactions in the Era of State Formation. Santa Fe: SAR Press. Pp. 27-83.
2005 (forthcoming). The Sumerian Takeoff. Structure and Dynamics 1(1). Chandler, T. 1987. Four Thousand Years of Urban Growth. Lewiston: St. Gavid’s. Dorn, H. F. 1962. “World Population Growth: An International Dilemma.” Science 135:283-290. Farmer, D. 2004. Haas, J. Nature Dec 23 http://www.nature.com/cgi-
taf/dynapage.taf?file=/nature/journal/vaop/ncurrent/index.html Story from BBC NEWS 2004/12/22 18:25:51 GMT: First Andes civilisation http://news.bbc.co.uk/go/pr/fr/-/2/hi/science/nature/4115421.stm
Iberall, A., S., and D. R. White. 1988. "Evidence for a Long Term Process Scale for Social Change in Modern Man Settled in Place via Agriculture and Engaged in Trade and War" GeoJournal 17(3):311- 338. Reprinted 1993 in Foundations …:65-128.
Iberall, A., S., and D. O. Wilkinson 1984a. "Human Sociogeophysics—Phase I: Explaining the Macroscopic Patterns of Man on Earth." GeoJournal 8(2):171-179. Reprinted 1993 in Foundations …:1-15.
——. 1984b. Human Sociogeophysics—Phase II: the Diffusion of Human Ethnicity by Remixing. GeoJournal 9(4): 387-391. Reprinted 1993 in Foundations …:16-23.
——. 1986. Human Sociogeophysics—Phase II (Continued): Criticality in the Diffusion of Ethnicity Produces Civil Society. GeoJournal 11(2): 153-158. Reprinted 1993 in Foundations …:24-33.
Iberall, A. S., D. O. Wilkinson, D. White. 1993. Foundations for Social and Biological Evolution: Progress Toward a Physical Theory of Civilization and of Speciation. Laguna Hills, CA: Cri-de-Coeur Press.
Kremer, M. 1993. Population Growth and Technological Change: One Million B.C. to 1990. The Quarterly Journal of Economics 108: 681–716.
Modelski, G. 2003. World Cities -3000 to 2000. Washington, D.C.: Faros 2000.

White, Malkov and Korotayev
18
Serrin, J. 1975. Is Doomsday on Target?" Science 189:4197. von Foerster, H. 1964. “Physics and Anthropology,” Current Anthropology 5:330- 331. von Foerster, H., P. M. Mora, and L. W. Amiot. 1960. "Doomsday: Friday, 13 November, A.D,
2026," Science 132:1291-1295. ——. 1961a. “Doomsday,” Science 133:936–946, ——. 1961b. "Population Density and Growth," Science 133:1932-1937. ——. 1962. “Projections versus Forecasts in Human Population Studies,” Science 136:173–174. ——. 1971. Interpersonal Relational Networks (Ed.), CIDOC Cuaderno No. 1014, Centro
Intercultural de Documentacion, Mexico, 139. Taagapera, R. 1997. “Expansion and Contraction Patterns of Large Polities: Context for Russia?”
International Studies Quarterly 41: 482-504. Umpleby, Stuart A. 1990. "The Scientific Revolution in Demography," Population and
Environment 11(3): 159-174. White, D. R., A. Malkov, A. Korotayev. 2005. Doomsday methods. Structure and
Dynamics. — (Cite Farmer 2004: page #). — too long for Science, but a version for an article in Structure and Dynamics might go a bit
more into the operational methods.
First Andes civilisation explored An ancient civilisation was flourishing in Peru over 5,000 years ago, making it the oldest known complex society in the Americas, Nature magazine has reported.
Archaeologists used radiocarbon dating to chart the rise and fall of the little known culture, which reigned over three valleys north of Lima.
The society, whose heyday ran from 3000 to 1800BC, built ceremonial pyramids and complex irrigation systems.
The find casts doubt on the idea that Andean civilisation began by the sea.
"The scale and sophistication of these sites is unheard of anywhere in the New World at this time," said Jonathan Haas, MacArthur Curator of Anthropology at the Field Museum, Chicago.
"The cultural pattern that emerged in this small area in the third millennium BC later established a foundation for 4,000 years of cultural florescence in other parts of the Andes."
Bleak valleys
The civilisation, which was characterized by stone pyramids, large ceremonial structures and agriculture, spread over three windy valleys in the Norte Chico region of Peru.

World Population
19
There were about 20 separate residential centers, which seemed to compete with each other to produce the most imposing architecture - some creating buildings as high as 26m (85ft).
They may even have had religion, the researchers believe.
"They probably did have organised religion," said co-author Winifred Creamer, a Northern Illinois University (NIU) anthropologist. "Objects have been yielded which do point to religion, like anthropomorphic figurines."
The ancient society had a close inter-dependent relationship with nearby coastal settlements, which were uncovered much earlier by archaeologists.
The people of the inland Norte Chico area grew cotton, which they traded with their coastal neighbors in exchange for fish. In turn, the coast dwellers used the cotton to make their fishing nets.
Evolving complexity
Archaeologists have long known about the settlements on the coast in Peru. They were simple fishing communities and academics thought they represented the first civilisation in South America.
But carbon dating proves the inland sites of Norte Chico were just as old as the coastal dwellings, forcing experts to reassess the idea that all early civilizations were based by the sea.
"In Norte Chico, the path of cultural evolution in the Andean region diverged from a relatively simple hunting and gathering society to a much more complex pattern of social and political organisation," said Alvaro Ruiz, of NIU.
"With this new information, we need to rethink our ideas about the economic, social and cultural development of the beginnings of civilisation in Peru and all of South America."
After 1800 BC, when the settlements were abandoned, it is likely that the Norte Chico people moved to other parts of Peru, taking their innovations and culture with them.
"One very likely scenario is that they took their irrigation further north and further south to areas that were more productive," said Professor Creamer.
"It is interesting that in the Casma valley, which is directly north, there are even bigger pyramids, and that was the next major cultural event."
Question of qualification

White, Malkov and Korotayev
20
Professor Creamer believes it is possible that other major Andean cultures, like the Chavin civilisation, which thrived about 3,000 years ago, may have descended from the Norte Chico people, or been culturally influenced by them.
However, there is still some discussion as to whether the Norte Chico society actually qualified as a "civilisation" itself.
Different anthropologists have different definitions of the word, and the Norte Chico people fell outside some of them.
"Some people would say they were not a civilisation," said Professor Creamer. "They had very few arts and crafts for example - they were pre-ceramic.
"And if civilisation needs urbanisation - well, we don't know if these sites qualify as urban centres yet."
Whatever the definition of civilisation, Professor Creamer and her team are just glad archaeologists discovered these historic sites before they got destroyed by modern agriculture.
"Peru has laws to protect sites like this one, but they don't always work," she said. "We are very lucky we got to explore these sites before they were buried under drip irrigation or chicken farms."
Story from BBC NEWS: http://news.bbc.co.uk/go/pr/fr/-/2/hi/science/nature/4115421.stm Published: 2004/12/22 18:25:51 GMT © BBC MMIV