THE PEBBLE STORY - Brookings Agrawal, Christian Catalini, Avi Goldfarb University of Toronto . THE...
56
CROWDFUNDING “Promoting Innovative Growth: Venture Capital, Early Stage Funding and IPOS” Brookings and Private Capital Research Institute The Brookings Institution Washington DC December 3, 2012 Ajay Agrawal, Christian Catalini, Avi Goldfarb University of Toronto
Transcript of THE PEBBLE STORY - Brookings Agrawal, Christian Catalini, Avi Goldfarb University of Toronto . THE...

CROWDFUNDING “Promoting Innovative Growth: Venture Capital, Early Stage Funding and IPOS” Brookings and Private Capital Research Institute The Brookings Institution Washington DC December 3, 2012 Ajay Agrawal, Christian Catalini, Avi Goldfarb University of Toronto

THE PEBBLE STORY

Pebble Watch • On April 11, 2012 Eric Migicovsky launched a
crowdfunding campaign to raise capital to produce his Pebble watch

Who is Eric Migicovsky? • From Vancouver, BC • University of Waterloo • Y Combinator, 2011 • Lives in Palo Alto, CA • Created inPulse (Blackberry compatible smartwatch)
• Founded Pebble

What is the Pebble Watch? • Can display messages from a
smartphone
• Monochrome e-paper display with backlight
• Vibrating motor
• Three axis accelerometer
• Communicate with Android or iOS device using Bluetooth 4.0
• Water resistant
• Apps downloadable from the phone

Why did Eric need capital? • Raised $375k from angel
investors • Tim Draper, DFJ • Paul Buchheit, YC
• Required capital ($100k) for: • Production tooling • Large component order • Global Bluetooth certification
• “Hardware is much harder to raise money for. We were hoping we could convince some people to our vision, but it didn’t work out.”
(LA Times, April 18, 2012)

Offering • $99 – 1 black Pebble (first 200) • $115 – 1 black Pebble • $125 – 1 color Pebble • $220 – 2 black Pebbles • $235 – “hacker special” (100 only)
• Early access to the SDK and a prototype; 1 color Pebble • $240- 2 color Pebbles • $550 – 5 color Pebbles • $1000 – 10 color Pebbles • $1250 – 10 color Pebbles, 1 custom watch face • $10,000 – 100 color Pebbles

What happened? • Launched campaign on April 11, 2012
• Target: $100,000 • $100k in 2 hours • $1m in 28hrs
• 37 days • Closed campaign on May 18, 2012
• $10,266,845 • 68,929 people • 85,000 watches (capped)

Buying from Inventors versus Retailers • Estimated shipping date: September 2012
• “DV => PV => MP • I’m heading to our factory in Dongguan, China on Saturday for
2 weeks of work on the Design Verification (DV) test build. After DV, we have one more test build scheduled in December called Production Verification (PV) before Pebble enters Mass Production (MP). As I mentioned in Update #17, our assembly line will be set up to manufacture 15,000 Pebbles per week. I know each one of you has a burning desire to see Pebble on their wrist, but I want to caution you that even after we begin MP it will still take us several weeks to manufacture all 85,000 Pebbles.” (Nov. 10, 2012)

Updates from the inventor • “We have confirmation from our primary
component supplier that the vast majority of our components have departed Arizona, flying towards Hong Kong and ultimately Dongguan, China. There are more than 110 electronic components inside each Pebble. It’s been a lot of fun finding 85,000 sets of everything!” (Oct 26, 2012)
• “While we’re not ready to start shipping out Pebbles yet, getting prepared to ship to 113 different countries has been quite a task. OK, just one of you lives in French Polynesia, but we care deeply about all our backers. That’s why we’ve been running extensive shipping tests to determine the best methods to use as we ship out 85,000 Pebbles. All the test shipments reached their destination. Outside of a postal strike in Uruguay, we found that our test shipments reached their destination even faster than we expected. We also learned some important lessons about all the different customs documentation requirements around the world.” (Nov 10, 2012)

WHY IS CROWDFUNDING INTERESTING?

Google search volume for “crowdfunding”
Sellaband launched (Aug ’06)
Kickstarter launched (Apr ‘09)
SEC chairman Mary Schapiro: the agency has been “discussing crowd-
funding and possible regulatory approaches” WSJ
(Apr ‘11)
President Obama signs the JOBS Act
(Apr ‘12)
Pebble Watch raises $10.2M
(May ‘12)
First draft of the JOBS Act
passes the US House (Nov ‘11)

Why is crowdfunding interesting? • Does crowdfunding influence the rate and direction of
inventive and entrepreneurial activity? • Does crowdfunding fund projects/companies that would not
otherwise be funded?
Different No Yes
More
No Perfect substitute
Same amount of capital, but allocated differently
Yes More early-stage risk capital for similar projects
More capital, different types of projects

Why might crowdfunding be different? • Different information
• E.g., “wisdom of crowds”, social platform, identity of investors
• Different preferences • Risk/return, non-pecuniary (e.g., participation, customer, fun)
• Different rules • Provision point mechanism • Formalize family and friends • Small investments

SIMILAR

Kickstarter Data • Every successful project (27,403) since
founding (June 2009) and October 2012 • $293M invested across 13 categories
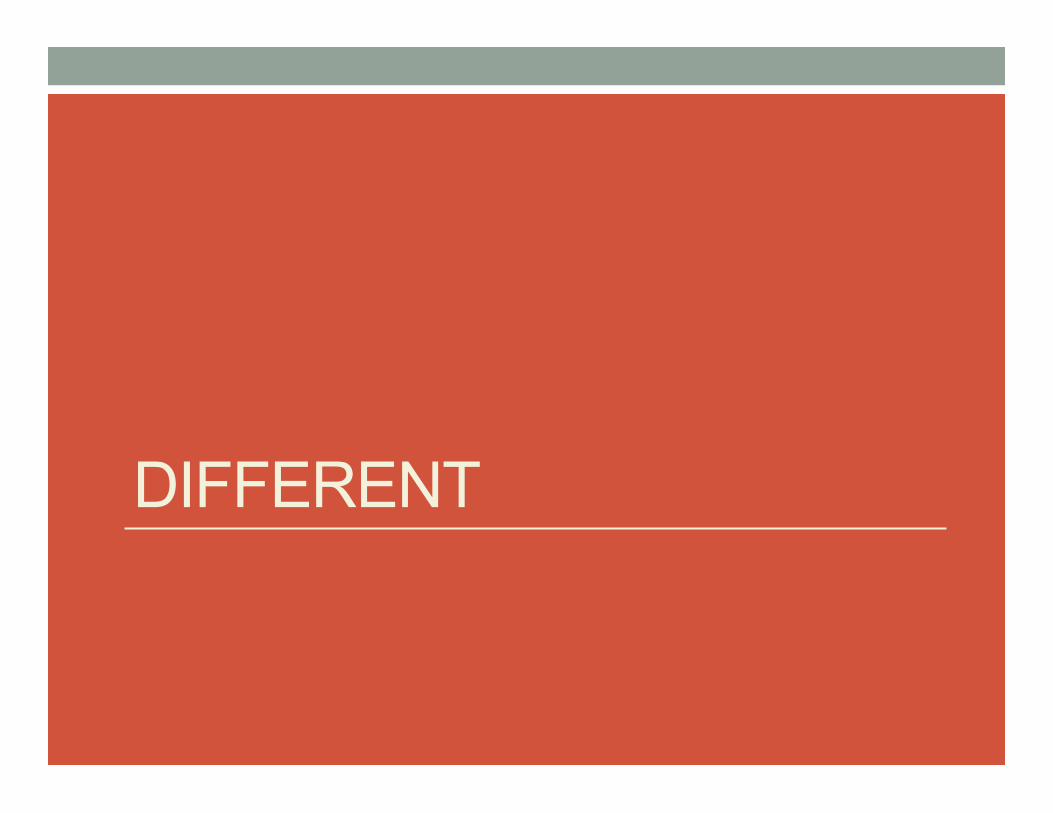
• Art, Comics, Dance, Design, Fashion, Film & Video, Food, Games, Music, Photography, Publishing, Technology, Theater

Kickstarter in context
$367M
$379M
$432M
$7M
Kickstarter
Kiva (lending)
Prosper.com (lending)
CrowdCube (equity)

Crowdfunding and NEA Grants Lo
g(C
row
dfun
ding
$ in
the
Arts
)
Log(NEA Grants 2009-2012)

Crowdfunding and VC Investment Lo
g(C
row
dfun
ding
$ T
ech,
Gam
es)
Log(VC Investments)

Crowdfunding and VC Investment Lo
g(C
row
dfun
ding
$ in
Tec
h)
Log(VC Investments)

Proxies for access to capital • Increase in the Home Price Index (HPI)
• Proxy for lower cost of capital through home-equity loan
• Issues • Although it may proxy for the overall strength of the local
macroeconomic environment • Use local employment as a control for the strength of the local
macroeconomic environment • Employment is unlikely to be an alternative source of capital in the
amounts typically raised through crowdfunding campaigns • The goal is to isolate access to capital from the overall local
macroeconomic conditions

Crowdfunding versus Alternative Sources of Capital (CBSA level) (1) (2) (3) (4)
Log(Funding) Any Project # of Projects
Funded # of Projects
Funded Funded OLS Logit OLS Poisson
Log(HPI) -6.3482**
(2.5766) Log(Employment) 9.8627
(6.0680) HPI -0.0372*** -0.2454*** -0.0137**
(0.0142) (0.0733) (0.0069) Employment 0.0274 1.2275*** -0.0040
(0.0178) (0.4659) (0.0032) Year=2010 1.9809*** 2.7600*** 0.8906* 2.2261***
(0.1570) (0.2250) (0.4987) (0.1356) Year=2011 4.4714*** 4.7317*** 0.7788 3.3735***
(0.2564) (0.2758) (1.0993) (0.2168) Year=2012 5.9530*** 5.6797*** 0.5089 3.8318***
(0.3039) (0.3063) (2.1059) (0.2123)
CBSA Fixed Effects YES YES YES YES
Observations 4,251 4,056 4,251 4,095 R-squared 0.383 0.246 Number of CBSAs 327 312 327 315 Robust standard errors in parentheses *** p<0.01, ** p<0.05, * p<0.1
HPI Effect by Project Size DV=Total Investment <=$499
$500 to $2,499
$2,500 to$4,999
$5,000 to $9,999
$10,000 to $26,999
$27,000 to$56,999
$57,000 to $126,999
$127,000 to $599,999
$600,000 to $1,199,999
>=$1,200,000
HPI -2.4005*** -92.5091*** -207.0096*** -373.5444*** -589.5059*** -400.9754** -425.1932*** -567.4525** -170.7676 -224.5510
(0.6466) (26.2426) (61.5455) (123.6972) (216.4052) (172.7653) (148.1878) (221.1345) (237.1007) (406.9716)
Employment 9.9484*** 446.7599*** 957.6884*** 1,905.6711** 3,539.0318** 2,253.5634** 1,818.7894** 2,794.5424** 1,082.0729 4,063.3649
(3.5844) (147.6663) (367.5152) (816.7403) (1,474.7732) (984.9162) (770.9469) (1,139.1648) (700.6425) (2,735.4838)
Year=2010 7.9763* 583.9591** 863.8577* 1,101.5037 943.6477 -1,102.2623* -1,781.0027** -2,057.2332** -87.4279 -1,000.6996
(4.8310) (277.2525) (489.3984) (721.9082) (1,004.8324) (659.9052) (716.0459) (964.4004) (1,390.6590) (1,993.1527)
Year=2011 18.6903* 1,044.6535** 758.1822 105.7279 -1,824.7374 -4,763.0398 -4,998.4713** -10,674.7330** -4,486.3477 -14,826.8818**
(11.2466) (434.4283) (960.2538) (1,905.0295) (3,308.4105) (3,271.8299) (2,293.5153) (4,278.0340) (3,691.0369) (7,107.4036)
Year=2012 12.9384 758.8654 348.8448 -278.7660 -2,414.8386 -2,303.2076 -2,156.9602 -194.5043 3,047.2505 2,948.9567
(17.6672) (682.2235) (1,676.7615) (3,686.1523) (6,827.5776) (4,512.7859) (3,397.6480) (5,853.1321) (4,199.0345) (7,607.4149)
CBSA Fixed Effects YES YES YES YES YES YES YES YES YES YES
Observations 4,251 4,251 4,251 4,251 4,251 4,251 4,251 4,251 4,251 4,251
R-squared 0.158 0.233 0.225 0.205 0.216 0.187 0.125 0.094 0.020 0.024
Number of CBSAs 327 327 327 327 327 327 327 327 327 327

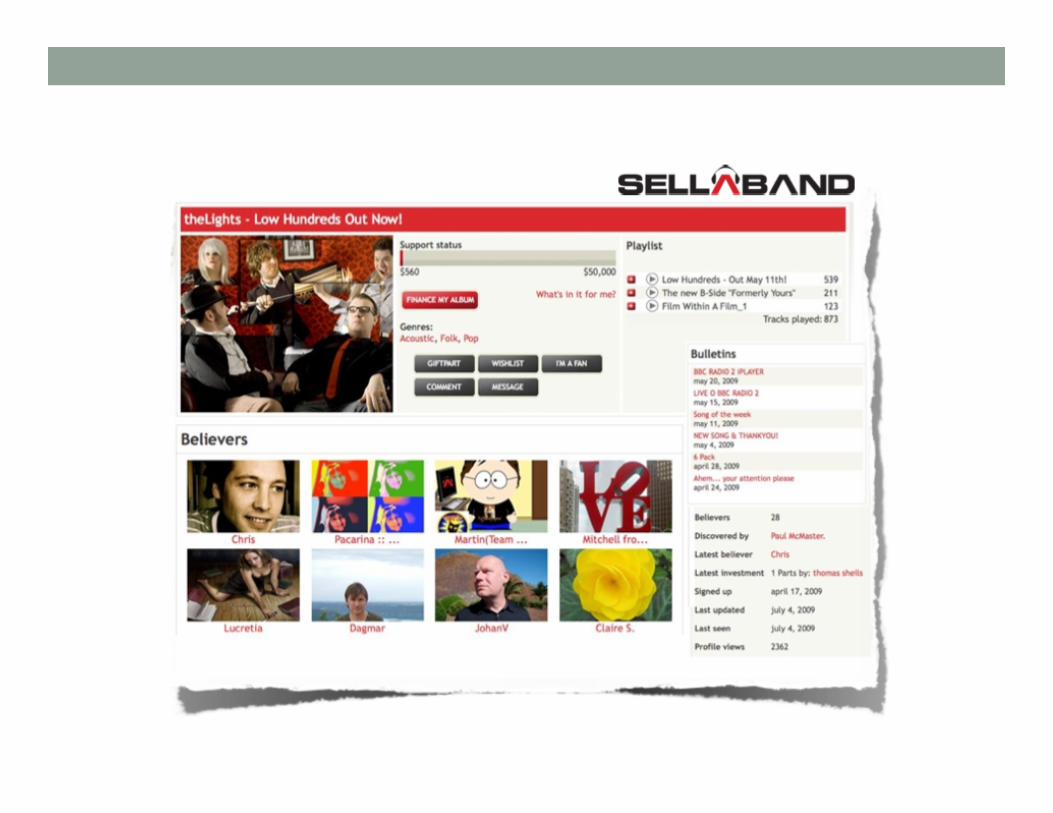
Sellaband
• Every investment (2006-2009) • 4712 artists (15,517 investors) • 34 raised $50k (8,149 investors) • Distance between artist and investor based on
addresses and postal codes • Artistic effort: song and video uploads, live shows
Data
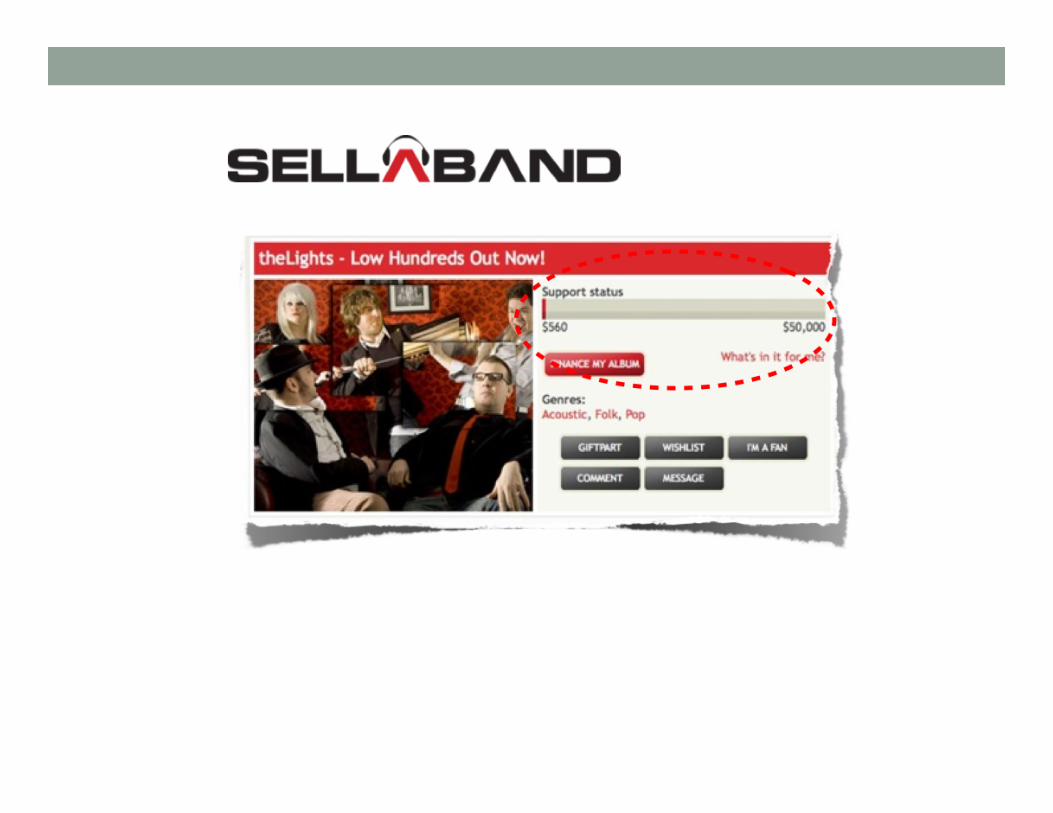
• Launched in 2006 in Amsterdam: “The granddaddy of crowdfunding”
• Investors can buy one or more shares in the artist’s future album at $10 each
• Investors see information about the artist: bios, demo songs, blog, $ raised to date...
• The goal is to reach 5000 shares ($50,000) • Revenues from albums are split between the
artists, the investors, and Sellaband

Distribution of capital is highly skewed • Top 2% of projects account for 80% of capital raised

Skewed distribution of capital at KS • Top 20% of projects (in terms of capital raised) account for
75% of total capital

Growth by State (thousands)

Growth by State ($ per Capita-Quarter)
DIFFERENT

Cumulative Capital Raised on KS

Mean Size of Projects

AGGREGATE STATISTICS OBFUSCATE VARIATION ACROSS SECTORS

Capital Raised by Sector (thousands)

Capital Raised by Sector (thousands)
Capital Raised by Sector (thousands)

Capital Raised by Sector (thousands)

Investment Size
< $50K $50K-$100K $100K-$500K $500K-$1M >$1M
Tota
l inv
estm
ent (
thou
sand
s)

Investment Size by Sector
Legend 1) Less than $50K 2) $50K to $100K 3) $100K to $500K 4) 500K to $1M 5) More than $1M
Tota
l inv
estm
ent (
thou
sand
s)

Top 3 States by Sector Art, Comics, Design, Publishing, Theater
Art, Dance, Design, Fashion, Film & Video, Music, Photography, Publishing, Tech, Theater
Art, Comics, Dance, Design, Fashion, Film & Video, Games, Music, Photography, Publishing, Tech, Theater
Comics, Film & Video, Games
Dance, Photography
Fashion
Food
Games
Music
Tech

MARKET SEGMENTATION FOR MULTIPLE ATTRIBUTES

Multiple Motivations (I) OCULUS Raised $2,437,429 ($250K goal) 9,522 backers
Amount Backers Total Reward$10 1009 $10,090 ThankYou$15 209 $3,135 LimitedEdi9onPoster$25 434 $10,850 T‐Shirt$35 179 $6,265 T‐ShirtandPoster$75 106 $7,950 SignedT‐ShirtandPoster$275 100 $27,500 Prototype,SDK$300 5640 $1,692,000 Prototype,SDK,Videogame$335 859 $287,765 Prototype,SDK,Videogame,T‐Shirt,Poster$500 66 $33,000 Prototype,SDK,Videogame,SignedT‐Shirt,SignedPoster$575 216 $124,200 2Prototype,SDK,Videogame,SignedT‐Shirt,SignedPoster$850 40 $34,000 3Prototype,SDK,Videogame,SignedT‐Shirt,SignedPoster$1,400 20 $28,000 5Prototype,SDK,Videogame,SignedT‐Shirt,SignedPoster$3,000 7 $21,000 10Prototype,SDK,Videogame,SignedT‐Shirt,SignedPoster$5,000 7 $35,000 1dayvisittoOculusand10Prototype,SDK,Videogame,SignedT‐Shirt,SignedPoster

Multiple Motivations (II) 9%
86%
3% 2%
Philanthropy
Pre-Selling
Merchandise
VIP Access
OCULUS Raised $2,437,429 9,522 backers

24%
18%
42%
16%
Philanthropy
VIP Access
Pre-Selling
Merchandise
OPERA KIDS Raised $33,412
427 backers

GEOGRAPHY

Geography • The average distance between an artist and an investors
is approximately 3,000 miles


Investment propensity increases with cumulative investment

Local DistantPropensity to invest 2.9% 0.8%
Average investment size $196 $74% total investment 13.5% 86.5%
Local versus Distant

Local and Distant Investors are Different

Local and Distant Investors are Similar, Controlling for F&F

More and different • The popular assumption is that there will be more equity
capital available to entrepreneurs, and that it will be at least somewhat different
• The portfolio of companies financed this way will reflect that crowdfunding disproportionately benefits the types of companies that: • benefit most from user/investors (B2C rather than B2B) • can most easily distinguish themselves from fraud in an online
setting (market for reputation) • are least harmed from publishing the types of information required
to support a crowdfunding campaign (disclosure)

THANK YOU