
The oxygen isotope signature of the apatite-iron oxide ore ...516278/FULLTEXT01.pdf · Oxygen...
35
Självständigt arbete Nr 19 Oxygen Isotope Signatures of the Apatite-Iron Oxide Ore at Grängesberg Franz Weis
Transcript of The oxygen isotope signature of the apatite-iron oxide ore ...516278/FULLTEXT01.pdf · Oxygen...

Självständigt arbete Nr 19
Oxygen Isotope Signatures of the Apatite-Iron Oxide Ore at Grängesberg
Franz Weis

1
Table of Contents
Abstract ................................................................................................................................................... 2
1. Introduction ........................................................................................................................................ 3
2. The local Geology of Grängesberg and the apatite-iron oxide ore ..................................................... 4
2.1 The Bergslagen district .................................................................................................................. 4
2.2 Local Geology ................................................................................................................................ 5
3. Oxygen isotopes .................................................................................................................................. 6
3.1 Oxygen Isotopes and the δ-value .................................................................................................. 6
3.2 Oxygen Isotope Fractionation ....................................................................................................... 6
3.3 Oxygen isotopes as geothermometer ........................................................................................... 8
3.4 Oxygen isotopes as tracers ............................................................................................................ 8
4. Formation of the Ore Deposits at Grängesberg .................................................................................. 9
4.1 Origin by Magmatic Processes ...................................................................................................... 9
4.1.1 Direct magmatic deposition ................................................................................................... 9
4.1.2 Ore Magma from Liquid Immiscibility .................................................................................... 9
4.2 Hydrothermal ore forming processes ......................................................................................... 11
4.2.1 Magmatic waters .................................................................................................................. 11
4.2.2 Hydrothermal fluids from meteoric and sea water .............................................................. 12
4.3 Other possible iron ore forming processes ................................................................................. 13
4.3.1 Hypothesis about the origin of apatite-iron oxide mineralization ....................................... 13
5. Expectations and assumptions .......................................................................................................... 14
5.1 Magmatic scenario ...................................................................................................................... 14
5.2 Hydrothermal scenarios .............................................................................................................. 14
6. Oxygen isotope signatures of the Grängesberg deposit ................................................................... 14
6.1 The samples from Grängesberg .................................................................................................. 15
6.1.1 Sample preparation .............................................................................................................. 15
6.2 Oxygen isotope data .................................................................................................................... 15
6.3 Analytical methods and calculations ........................................................................................... 18
6.3.1 Calculating δ18O-values for a possible ore forming magma ................................................ 18
6.3.2 Geothermometer calculations ............................................................................................. 18
6.4 Results ......................................................................................................................................... 18

2
6.4.1 Results for the Geothermometer Calculation ...................................................................... 19
6.4.2 Results for ore magma modelling ........................................................................................ 19
7. Discussion .......................................................................................................................................... 21
7.1 δ18O-Signatures across the Ore Body .......................................................................................... 21
7.2.1 Magma fractionation ............................................................................................................ 21
7.2.2 Geothermometry calculations .............................................................................................. 22
7.3 Comparing models and δ18O-results ........................................................................................... 22
7.4 Comparison to δ18O-values of other apatite iron oxide deposits ............................................... 24
7.5 A possible formation of a mixed ore body .................................................................................. 25
8. Conclusion ......................................................................................................................................... 27
Acknowledgements ............................................................................................................................... 28
References ............................................................................................................................................. 29
Abstract
The origin of apatite iron oxide ores, like the deposit at Grängesberg in the Bergslagen
mining district, has been a subject of much discussion through the years. Some support a
formation by hydrothermal fluids while others suggest that the ore is orthomagmatic, i.e.
formed directly from a magma as suggested for the iron ore deposits of El Laco in Chile or
the deposits in Kiruna, although also these two are still subjected to controversies. In 2009
sampling was done on drillcores through the Grängesberg ore. On these samples an oxygen
isotope study on magnetite, quartz and whole rock samples from both the ore and its host
rocks was conducted in order to obtain new knowledge about the ore forming processes.
The data allowed modeling to simulate a possible origin by different magmas or
hydrothermal fluids as well as a possible temperature of formation. In addition, the data set
was compared to published oxygen isotope analyses of the possible magmatic iron ores of
Kiruna and El Laco. The results of the Grängesberg analysis revealed that the ore in the area
seem to have an origin from both magmatic and hydrothermal sources.

3
Oxygen isotope signatures of the apatite-iron oxide ore at
Grängesberg
1. Introduction
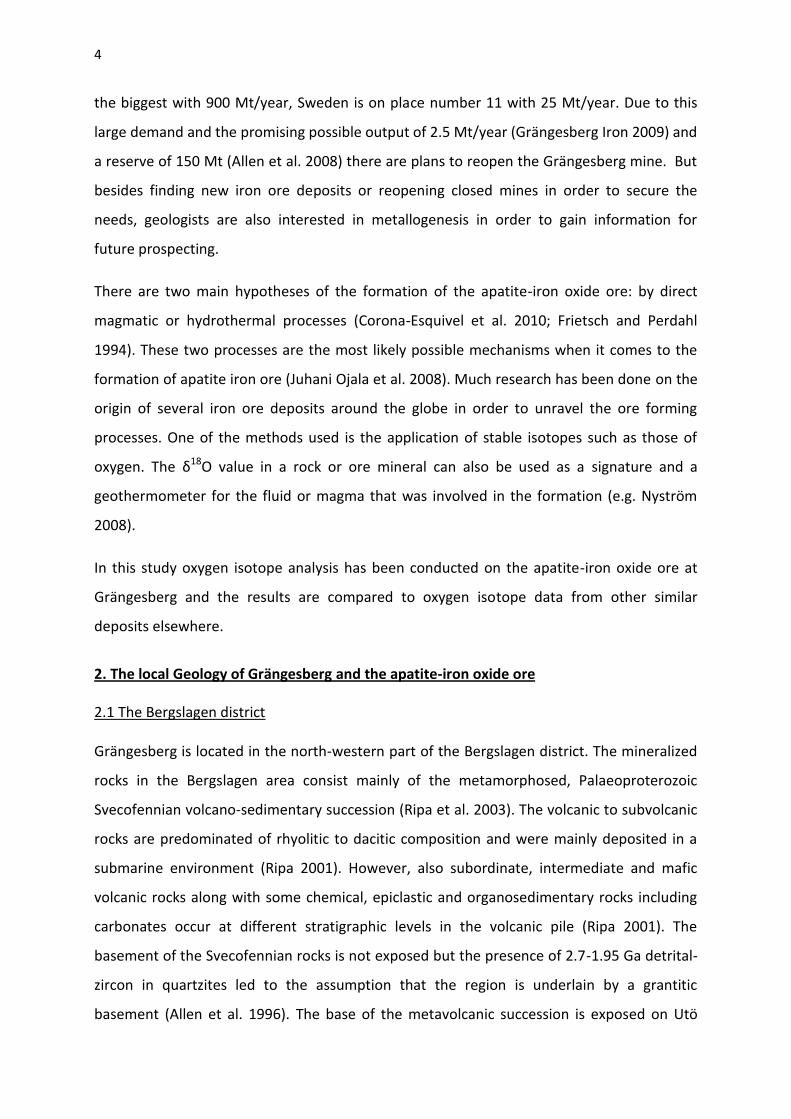
Grängesberg is located in south central Sweden in the Bergslagen mining district. The iron
oxide deposit at Grängesberg (Fig. 1) played a important role in Sweden’s mining history and
economy since the 1800s, as the mine was the second largest iron ore producer in the
country (Grängesberg Iron 2009) with a total production of 150 Mt between 1500 and 1989
(Allen et al. 2008). In addition, it is one of the few unique places with apatite-iron oxide ore,
and makes up 40 % of the known iron content in Bergslagen (Allen et al. 2008). The apatite-
iron oxide ore in the area has
an outstanding Fe content of
40-63 % (Allen et al. 2008).
However, falling iron ore
prices caused the closure of
the mine in 1989
(Grängesberg Iron 2009).
“Only iron can save us…”
This is what it says in the
poem “The cross of iron” by
the German poet and writer Maximilian von Schenkendorf. What was important to the
people of that time in the war against Napoleon, is equally important for us today. Iron is
still essential for our economy and daily life. A modern world without iron is unthinkable and
the demand for this highly valued element is still growing. Mining of iron began 1300 BC (de
Beer et al. 1998) and has developed since. In 1945 global production was 100 Mt per year,
increasing to 770 Mt in 1990 (de Beer et al. 1998) and in 2010 2400 Mt were produced
(USGS 2011). Already in the 1990s the iron ore industry made up 15 % of the total industrial
energy consumption worldwide and was thus the largest single sector with such a big
demand (de Beer et al. 1998). Among the 15 biggest producers worldwide, where China is
Fig. 1 The abandoned mine of Grängesberg. In the background the
open pit infilled with water can be seen (www.bulkforum.net).
4
the biggest with 900 Mt/year, Sweden is on place number 11 with 25 Mt/year. Due to this
large demand and the promising possible output of 2.5 Mt/year (Grängesberg Iron 2009) and
a reserve of 150 Mt (Allen et al. 2008) there are plans to reopen the Grängesberg mine. But
besides finding new iron ore deposits or reopening closed mines in order to secure the
needs, geologists are also interested in metallogenesis in order to gain information for
future prospecting.
There are two main hypotheses of the formation of the apatite-iron oxide ore: by direct
magmatic or hydrothermal processes (Corona-Esquivel et al. 2010; Frietsch and Perdahl
1994). These two processes are the most likely possible mechanisms when it comes to the
formation of apatite iron ore (Juhani Ojala et al. 2008). Much research has been done on the
origin of several iron ore deposits around the globe in order to unravel the ore forming
processes. One of the methods used is the application of stable isotopes such as those of
oxygen. The δ18O value in a rock or ore mineral can also be used as a signature and a
geothermometer for the fluid or magma that was involved in the formation (e.g. Nyström
2008).
In this study oxygen isotope analysis has been conducted on the apatite-iron oxide ore at
Grängesberg and the results are compared to oxygen isotope data from other similar
deposits elsewhere.
2. The local Geology of Grängesberg and the apatite-iron oxide ore
2.1 The Bergslagen district
Grängesberg is located in the north-western part of the Bergslagen district. The mineralized
rocks in the Bergslagen area consist mainly of the metamorphosed, Palaeoproterozoic
Svecofennian volcano-sedimentary succession (Ripa et al. 2003). The volcanic to subvolcanic
rocks are predominated of rhyolitic to dacitic composition and were mainly deposited in a
submarine environment (Ripa 2001). However, also subordinate, intermediate and mafic
volcanic rocks along with some chemical, epiclastic and organosedimentary rocks including
carbonates occur at different stratigraphic levels in the volcanic pile (Ripa 2001). The
basement of the Svecofennian rocks is not exposed but the presence of 2.7-1.95 Ga detrital-
zircon in quartzites led to the assumption that the region is underlain by a grantitic
basement (Allen et al. 1996). The base of the metavolcanic succession is exposed on Utö
5
island where a metasedimentary succession grades into the metavolcanic rocks (Allen et al.
1996). Large volumes of intrusive rocks were emplaced coeval with the volcanic activity (Ripa
et al. 2003; Wilson et al. 1984). The rocks were all formed, deformed and metamorphosed
during the Palaeoproterozoic Svekokarelian orogeny between 1.9 and 1.8 Ga (Stephens et al.
2009). In addition, the western part was also affected by the Sveconorwegian orogeny
between 1.0-0.9 Ga (Stephens et al. 2009). The deformation of the metavolcaninc and
metasedimentary rocks is predominantly expressed as steep, tight to isoclinal, doubly
plunging F1 synclines (Allen et al. 1996).
The geological setting which led to the formation of the rocks in the Bergslagen district has
been interpreted to be an extensional, back-arc basin inboard an active continental margin
region (Allen et al.1996). This interpretation is supported by the occurrence of quartz-rich
turbidites on Utö, quartz rich basement derived sandstones within the volcanic succession,
the abundance of rhyolite and the overall chemistry of the volcanic rocks (Allen et al. 1996).
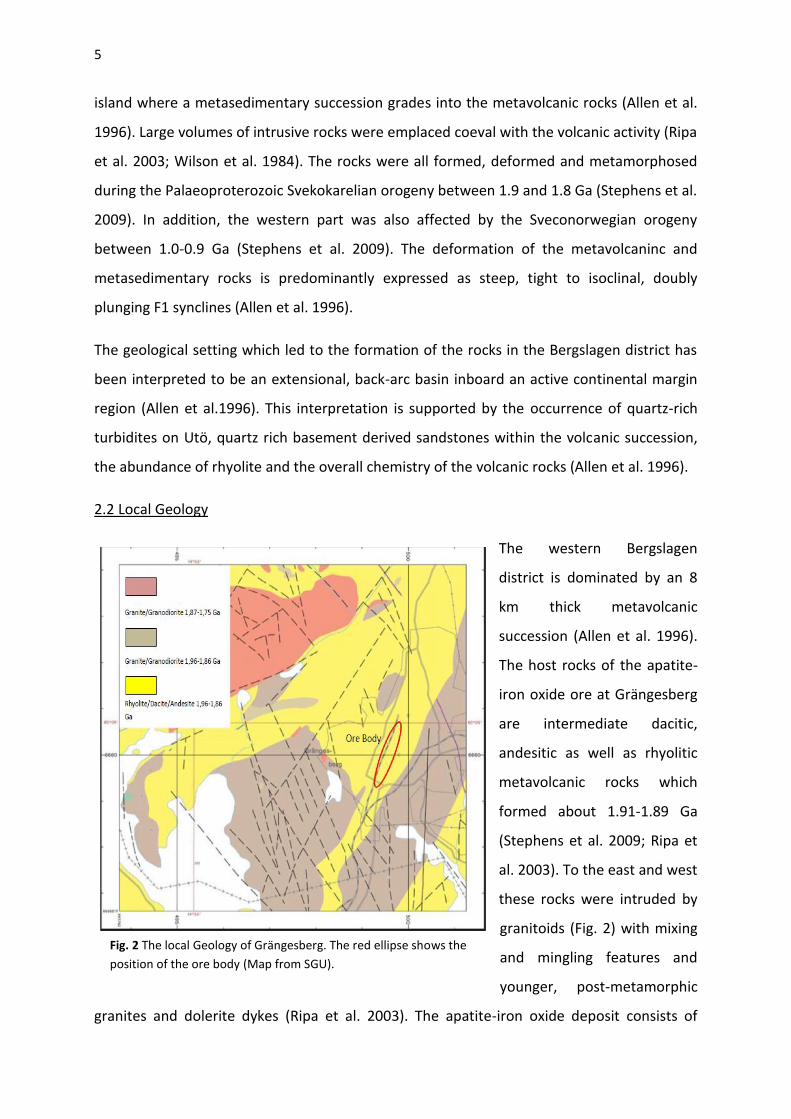
2.2 Local Geology
The western Bergslagen
district is dominated by an 8
km thick metavolcanic
succession (Allen et al. 1996).
The host rocks of the apatite-
iron oxide ore at Grängesberg
are intermediate dacitic,
andesitic as well as rhyolitic
metavolcanic rocks which
formed about 1.91-1.89 Ga
(Stephens et al. 2009; Ripa et
al. 2003). To the east and west
these rocks were intruded by
granitoids (Fig. 2) with mixing
and mingling features and
younger, post-metamorphic
granites and dolerite dykes (Ripa et al. 2003). The apatite-iron oxide deposit consists of
Fig. 2 The local Geology of Grängesberg. The red ellipse shows the
position of the ore body (Map from SGU).
6
magnetite and hematite and occurs in general as a steeply south-eastward dipping (70°-80°)
(Johansson 1910), lens-shaped body (Stephens et al.2009). The iron content ranges from 40-
63 % (Allan et al. 2008). The ore body can be followed for more than 900 m at the surface
and it has a range in width between 50 m and 100 m (Johansson 1910).
3. Oxygen isotopes
3.1 Oxygen Isotopes and the δ-value
Both radiogenic and stable isotopes are a very useful tool in geosciences. They are used for
age determination, estimating certain surface processes such as weathering and also for
tracing climate changes and for petrogenesis. Significant for the latter are the two stable
isotopes of oxygen, 16O and 18O. The heavier 18O isotope is also used as a tracer in order to
identify the source of a certain rock or mineralization as well as a geothermometer
(Rollinson 1993). The relative abundance of 18O is often presented as the δ18O-value given in
parts per mil (‰). The δ18O-value is given by:
F3.1 δ18O = x 1000
(Rollinson 1993, Mason et al. 1982).
The standard value here is the Standard Mean Ocean Water value (short SMOW) which has a
18O/16O = 2005.20 +/- 0.43 (Hoefs 1997) derived from a hypothetical water sample. There
are other standard values like the V-SMOW (Vienna-Standard Mean Ocean Water) or the
PDB (Pee Dee Belemnite) but the one most commonly used is the SMOW-value (Hoefs
1997). The delta value shows whether the analyzed sample is either enriched (positive value)
or depleted (negative value) in the heavier 18O relative to the standard (Rollinson 1993). The
degree of enrichment or depletion is a result of isotope fractionation processes.
3.2 Oxygen Isotope Fractionation
Isotope fractionation is defined by Hoefs (Hoefs 1997) as “the partitioning of isotopes
between two substances or phases of the same substance with different isotope ratios”. An
example would be the oxygen isotope exchange between quartz and magnetite:

7
2Si 16O2 + Fe3 18O4 = 2Si 18O2 + Fe3
16O4 (Rollinson 1993).
This is also valid for fractionation between a rock and a fluid. By this exchange one substance
can become enriched in the heavy isotope while the other remains depleted. The general
rule is that the preferential site for the lighter isotope is with the weaker bond (Rollinson
1993). For example the heavier isotope is preferentially bonded to elements with higher
ionic potential as they form stronger bonds. Thus quartz with the small, highly charged Si4+
ion will be enriched in 18O compared to magnetite with the larger, lower charged Fe2+ ion
(Rollinson 1993). Fractionation between two species is shown in the form of the
fractionation factor α which is given as
F3.2 α1-2 = where R is the 18O/16O in each species (Rollinson
1993, Mason et al.1982, Hoefs 1997, Javoy 1977). Furthermore it has been determined by
experiment that
F3.2.1 1000 ln α1-2 = A(106/T2) + B (Rollinson 1993, Hoefs 1997).
A and B are constants called the thermometric coefficients which have been determined
experimentally for particular mineral pairs (Javoy 1977) and T is the absolute temperature in
Kelvin. B is often found to be zero and some values for A are shown in Table 3.2.
Thus the equation above shows that the oxygen isotope fractionation is temperature
dependent. As the temperature increases the right side trends towards zero which means
that α trends towards one. This infers that the fractionation is less at higher temperatures.
Materials formed at lower temperature show larger variations in the δ18O values than do
high temperature igneous rocks (Mason et al. 1982). Beside temperature the fractionation is
marginally affected by the crystal structures and the content of ions of a species but is not
Table 3.2 Experimentally determined values for the thermometric coefficient A (Data after Chiba et al.
1989).
8
affected by pressure (Rollinson 1993). The impact of pressure on oxygen isotope
fractionation is less than 0.1 % for pressures less than 20 kb.
3.3 Oxygen isotopes as geothermometer
Using equation F3.2.1, oxygen isotopes can be used as a geothermometer if the 18O/16O-
ratios of the two species are known. However, it can also be linked to the δ-value, which is
more commonly used as follows:
1. δ1 - δ2 ≈ 1000ln α1-2 for δ < 10 ‰
2. α1-2 = for δ > 10 ‰ (Rollinson 1993).
By inserting these equations into equation F3.2.1, the δ18O values of two minerals in a rock
can be used to calculate the temperature at which the fractionation took place. This
provides for example information about the temperature conditions under which a rock or
mineral formed (Mason et al 1982).
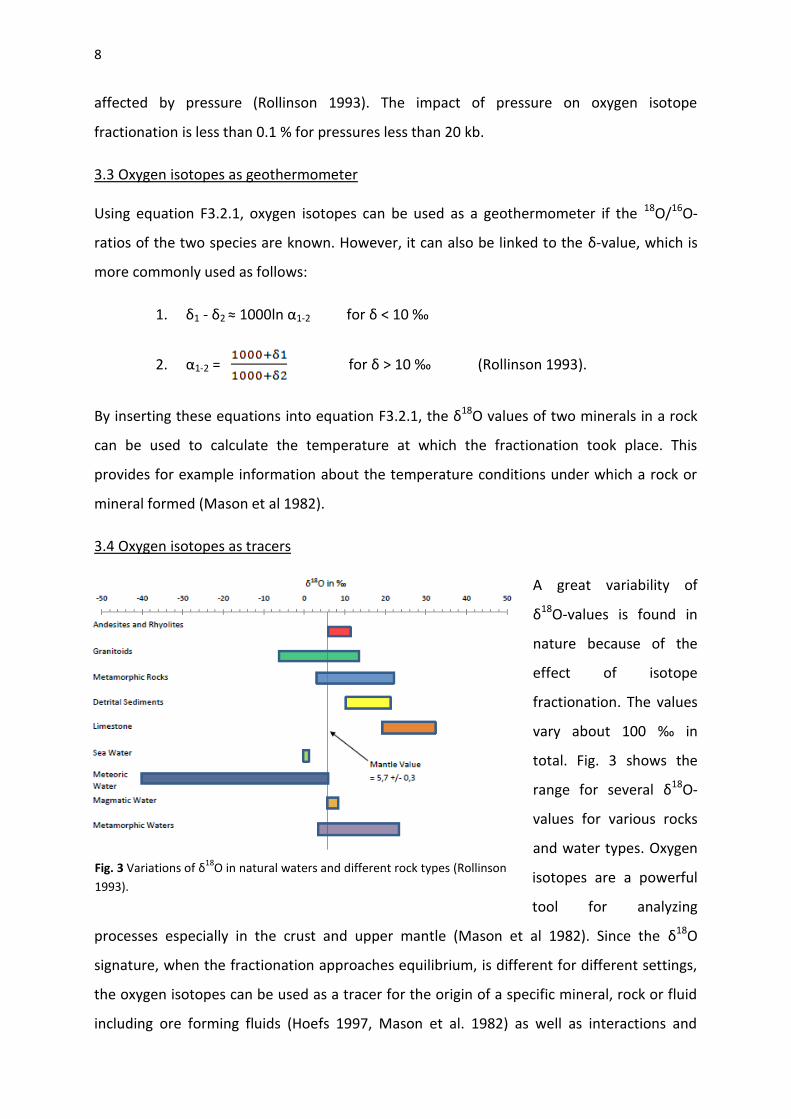
3.4 Oxygen isotopes as tracers
A great variability of
δ18O-values is found in
nature because of the
effect of isotope
fractionation. The values
vary about 100 ‰ in
total. Fig. 3 shows the
range for several δ18O-
values for various rocks
and water types. Oxygen
isotopes are a powerful
tool for analyzing
processes especially in the crust and upper mantle (Mason et al 1982). Since the δ18O
signature, when the fractionation approaches equilibrium, is different for different settings,
the oxygen isotopes can be used as a tracer for the origin of a specific mineral, rock or fluid
including ore forming fluids (Hoefs 1997, Mason et al. 1982) as well as interactions and
Fig. 3 Variations of δ18
O in natural waters and different rock types (Rollinson
1993).

9
mixing of different fluids. An example: Igneous rocks are usually enriched in the heavy
isotope and show a δ18O between 6 and 10. Meteoric waters on the other hand, are heavily
depleted and usually show δ18O-values of -5 to -10. If an igneous rock interacts with a
hydrothermal fluid derived from meteoric water, fractionation leads to depletion in the
heavy isotope by as much as 10 - 15 ‰ in the igneous rock (Taylor 1971). Thus, it is possible
to detect the influence of a hydrothermal fluid on a magmatic rock.
4. Formation of the Ore Deposits at Grängesberg
There are two main hypotheses for the formation of the apatite-iron oxide deposits: direct
magmatic and hydrothermal, which also could be applied to the mineralization in
Grängesberg. In Part 4 these two possibilities will be discussed and it will be shown how an
ore deposit could originate from either of these processes. The Information presented in the
following paragraphs is mainly based on Guilbert and Park (1986) if not stated otherwise.
4.1 Origin by Magmatic Processes
4.1.1 Direct magmatic deposition
Formation of iron oxide mineralizations by magmatic processes can occur by direct
deposition of an ore magma. An ore magma is any magma or magmatic fraction that can
solidify directly from a melt as a mineralization. In most cases the magma must be ultra-
basic i.e. enriched in mafic components. An iron oxide deposit could form in the simple way
of fractional crystallization and crystal settling caused by cooling. The first mineral crystals
that will separate out will be the ferromagnesian including magnetite along with chromite.
Their crystallization temperature range lies from 1500° down to 800° C. When the magnetite
crystals settle they may form a cumulate which then serves as an ore body (Park and
MacDiarmid 1964). However, orthomagmatic oxide deposits can also form due to magma or
liquid immiscibility.
4.1.2 Ore Magma from Liquid Immiscibility
Liquid immiscibility (Fig. 4) is another possible mechanism for ore formation (oxide magma
formation) and probably more common than direct deposition from a parent magma. This
term stands for the process when a given magma due to cooling or crystallization can no
longer exist in a stable state and thus splits into two melts with different compositions

10
(Roedder 1978). The composition
of the newly generated melts
depends on the composition of
the parent magma (Roedder
1978). If one considers cooling of
a basaltic magma that starts to
crystallize the first formed
silicates, that are less silicic than
the parental magma, the
composition of the evolved melt
will shift to be more felsic. Due to
this the amount of sulfur and
oxygen increases in the residual
melt, which will be considered as
a silicate melt enriched in those elements. Due to cooling or further enrichment the melt
may no longer be capable of keeping the elements in solution. At this point liquid
immiscibility occurs which leads to the generation of a separate oxygen or sulfur enriched
melt. Normally only one type of melt will be generated. Two melts may form at a rather late
stage of the magma evolution, but also in a very early stage if the magma is enriched in
oxygen or sulfur from the start. In this case two liquids are present in the magma chamber
and among them partition of certain elements occurs. In the case of separate oxygen melt
siderophile/oxyphile elements such as Cr, V, P, Ti and most important Fe would partition into
sulfur/oxide melt while other lithophile elements stay behind in the silicate liquid. In such a
way an iron and oxygen enriched melt would form, from which an iron oxide mineralization
could be generated.
The generated ore magmas can either erupt at the surface or solidify at depth to form an
intrusion. If a partly crystallized magma containing the ore fluids is exposed to differential
external stresses the ore magma may be separated from the crystal mush in the process
called filter pressing, in which a mat of crystals compacts under its own weight and expels
interstitial melt (Sisson and Bacon 1999). The ore bearing melt can thus intrude into the
surrounding country rock and form a magmatic injection deposit (Fig. 5). Ore bodies formed
from direct magmatic processes are rather common (Park and MacDiarmid 1964).
Fig. 4 The process of liquid immiscibility. As a basaltic magma
undergoes crystallization and differentiation, the silica rich melt
may separate into two liquids depending on the enrichment of
either oxygen or sulfur. The point of separation is shown by the
red dot (Diagram after Guilbert and Park 1986).

11
4.2 Hydrothermal ore forming processes
The formation of a mineralization by hydrothermal fluids involves the circulation of hot
water or more specified hot water solutions from which the ore minerals can precipitate
(Marshak 2008). Hydrothermal fluids can be of various origins. They may be the result of
magmatic processes, be meteoric water percolating at depth or of metamorphic origin
(Marshak 2008, Park et al 1964, Guilbert et al 1986). Metamorphic waters are however
rarely assumed to be responsible for ore formation and are thus not discussed further.
4.2.1 Magmatic waters
Hydrothermal fluids which are generated by magma are called juvenile waters or magmatic
waters. Magma always contains volatiles including H2O. Granitic to andesitic magmas
contain between 1 and 7 wt. % water (Clemens 1984), some even up to 15 wt. %. The water
content increases with differentiation of the magma, i.e. a more evolved magma has higher
water content. This is related to the ongoing differentiation and crystallization in the magma
chamber in which the lighter residual liquid and the volatiles accumulate at the top of the
chamber. These magmatic waters are essential in the transportation of metals like the
transition metals, alkali earths, halogens and other volatiles such as CO2. The metals are
carried in solution in the form of metal halogen complexes such as for example FeCl2. With
Fig.5 Ore formation by magmatic processes (Diagram after Guilbert).
Fig. 5 Ore formation by magmatic processes (Diagram after Guilbert and Park 1986).
12
ongoing differentiation the water content in the residual liquid increases and eventually
reaches a point at which the water separates from the magma. This was shown
experimentally and presented by Smith in 1948. However, this process requires certain
temperature and pressure conditions. If there is a rupture in the surrounding country rock
the magmatic water can be lost in a similar way as CO2 escapes from a bottle of sparkling
water when the cap is removed. The water pressure can also increase to a level exceeding
the lithostatic pressure causing an explosion-breccitaion. Another possible formation of
magmatic water bubbles is by exsolution. In this case the water cannot escape the magma
chamber. The escaping, metal-bearing water can intrude the country rock and form
mineralized fault veins or breccia columns. If the juvenile water reaches a sea-floor it will
result in a black smoker or as a thermal spring in a subaerial environment. The formation
and separation of magmatic waters is associated with temperatures of the range 500° - 300°
C.
4.2.2 Hydrothermal fluids from meteoric and sea water
Metal-bearing waters, mineralizers, can also be generated by the heating of meteoric water
or sea water. Water percolating downwards will be heated up due to the geothermal
gradient or by an igneous intrusion nearby (Chernicoff et al. 2002). For this, the country rock
must have a certain permeability. As the meteoric water assumes thermal equilibrium with
its surrounding it also moves towards chemical equilibrium. This means that as the
temperature of the water increases the amount of dissolved minerals from the surrounding
country rock will gradually increase (Park and MacDiarmid 1964; Guilbert and Park 1986). A
rock or even a magma in contact with the hydrothermal fluid are leached of ore-forming
elements like iron (Keays 1987, Lagerblad et al. 1985). In such a way a natural brine is
formed which may be enriched in iron. Iron rich rocks or magmas, i.e. mafic or ultra-mafic
rocks, will be more viable to enrich the fluid. From such a natural brine iron oxide can
precipitate if the fluid cools or there are pressure changes or if the acidity in the fluid drops
(Marshak 2008). Ore minerals precipitated from these types of hydrothermal fluids are often
found in cracks as vein deposits or along faults and bedding planes (Chernicoff 2002,
Lianxing et al. 1993). Repeated leaching and precipitation of already formed iron oxide
mineralizations will result in further enrichment and the generation of high grade ores (Ünlü
et al. 1995, Lianxing et al. 1993).

13
4.3 Other possible iron ore forming processes
Iron oxide mineralization can also be generated by sedimentary processes and occur as
placer deposits (Marshak 2008) or formed by metamorphic processes but these are not
considered for the apatite-iron oxide deposits. The previously described processes involve
much more detail than shown in Fig. 6 but it provides a brief overview of ore formation by
magmatic and hydrothermal fluids.
4.3.1 Hypothesis about the origin of apatite-iron oxide mineralization
Examples of iron oxide deposits that are interpreted to have originated from direct
magmatic processes are the magnetite-hematite deposit of El Laco in Chile (Park et al. 1964),
the apatite-iron oxide ore body of Kiruna in Sweden (Frietsch et al. 1994; Nyström 2008;
Park et al. 1964) and the La Perla iron oxide ash fall deposit in Mexico (Corona-Esquivel et al.
2010). But even these deposits are still under discussion like the one in Grängesberg. There
is the hydrothermal school proposed by Paràk (1975, 1984), Hitzman et al. (1992), Sheets
(1997), Rhodes and Oreskes (1994, 1999), Sillitoe and Burrows (2002) and there is the
magmatic school supported by Nystöm et al (2008), Frietsch (1978) and Geijer (1931, 1967).
However, uncontroversed hydrothermal iron oxide deposits are for example the Hamersley
iron ore in Western Australia (Barley et al. 1999) and the ore bodies in the Yangtze Valley
District in China (Lianxing et al. 1993).
Fig. 6 Summary of ore forming processes by magmatic and hydrothermal processes (Diagram after Guilbert
and Park 1986).
14
5. Expectations and assumptions
A few assumptions and expectations can be drawn for the Grängesberg apatite-iron oxide
ore related to whether the origin is magmatic or hydrothermal. These two scenarios are
discussed and assumptions are made for what the oxygen data of the mineralization are
expected to show in each case.
5.1 Magmatic scenario
Magmas of andesitic and intermediate composition have a δ18O-value between 5.7 and 10
‰ (Fig. 3). A mineralization formed by direct magmatic processes in these rocks would have
a similar δ18O-signature. The same would also account for juvenile waters, which fall into the
same range. An example for this would be the Olympic Dam deposit in Australia. The δ18O-
value of the iron oxides was found to be ~ 10 ‰ and thus the source from which it formed
was interpreted to be magmatic (Hunt 2005). However, the fractionation between the ore
minerals and the magma has to be taken into account and the δ18O-value of the ore mineral
will be lower than the magma. According to Sheppard (1969) a magnetite formed from a hot
magmatic aqueous fluid will have a δ18O-value about 5 ‰ lower than the fluid itself and
Taylor (1967) states that most igneous magnetites fall into a range of 1-4 ‰ when the
equilibrium with the magma is reached.
5.2 Hydrothermal scenarios
The δ18O-values for high-T hydrothermal fluids are below 5.7 ‰. This would be the case for a
hydrothermal fluid originating both from sea water and meteoric waters. Thus, ore deposits
that were derived from these fluids are expected to also have a hydrothermal signature and
should not lie in the magmatic range. Since the fractionation is temperature dependent, the
δ18O of a hydrothermal ore deposit should lie below the magmatic range for high-T and
above the magmatic range for low-T hydrothermal processes.
6. Oxygen isotope signatures of the Grängesberg deposit
Oxygen isotope analysis was carried out on both whole rock samples and mineral phases
from both the ore body and the host rocks of the apatite-iron oxide deposit at Grängesberg.
The analysis was carried out at Cape Town University, South Africa using a DeltaXP dual inlet
gas source mass spectrometer.

15
6.1 The samples from Grängesberg
The samples collected for the oxygen isotopes were selected from two drillcores (drillcore
690 and 717) that transect the ore body at the Export field. The samples include the ore and
meta-volcanic host rocks of andesitic, dacitic and rhyodacitic compositions. From these
oxygen isotope analyses for whole rock samples, quartz, magnetite and apatite were carried
out.
6.1.1 Sample preparation
The two drillcores were logged and sampled in 2009 by the Swedish Geological Survey (SGU).
The selected samples were prepared by Barbara Kern at Uppsala University. The rock
samples were crushed into small pieces using a hammer. After crushing the aggregated
samples were separated into different grain size fractions which were washed in distilled
water for 2 minutes and then dried in an oven. Picking of the different mineral grains was
done under a binocular microscope. About 400 mg of each mineral species were picked and
the crystals were chosen by their size and purity. The whole rock samples were crushed and
milled.
6.2 Oxygen isotope data
In total from the two drillcores 38 δ18O-values were obtained from whole rock, magnetite,
apatite and quartz. Of these analyses 28 are from drillcore 717 and 15 from 690. Tables 6.1
and 6.2 give a description of the samples and the obtained δ18O-values. Due to the mineral
composition of the rocks a full set of data was not possible to reach for all samples.

16
Table 6.1 The sample descriptions and δ18
O-values of the 717 drillcore.
Sample Description Whole Rock Quartz Magnetite Apatite
KES090048 Foliated, locally phyllosilicate rich volcanic rock 6.91 8.01
KES090052 Gneissic granite with magnetite crystals 9.08 3.47
KES090054 Foliated, veined, Bt-rich volcanic, partly sköl-like 7.05
KES090056 Grey,porphyritic volcanic rock with several mm large feldspar phenocrysts 6.93
KES090059 Feldspatic-porphyritic,light coloured, felsic to intermediate volcanic-subvolcanic rock 6.63
KES090061 Bt-Kl-banded volcanic to subvolcanic, partially altered rock 6.2
KES090065 Mt veinlets/bands in grey, banded volcanic rock 4.89 5.80 1.29
KES090071 Massive mt-ore section with almost no apatite or silicates 1.92
KES090073 Apatite-rich section, Mt-ore 1.34 5.50
KES090076 Massive He-ore, with some apatite and magnetite 3.4
KES090077 Mt-blastic He ore, apatite-bearing 0.18
KES090080 He-ore with magnetite blasts 1.56 1.08
KES090081 Alteration zone, phyllosilicate rich, contact to He-blastic Mt-ore 1.53
KES090083B Mt-banded volcanic rock 2.78
KES090086 Mt-banded grey, felsic to intermediate volcanic rock. Close to ore contact 1.69
KES090087 Fine grained, foliated, felsic-intermediate volcanic to subvolcanic rock with mt bands 7.09 5.95
KES090088 Densely, finely banded Mt-skarn-volcanic rock 5.64 3.44
KES090089 Foliated, fine grained, felsic-intermediate volcanic rock 7
KES090069 Massive Mt-ore, with spots of silicate minerals, no visible apatite 1.41 3.04

17
Sample Description Whole Rock Quartz Magnetite
KES090003 Slightly fsp porhyritic dark volcanic/subvolcanic 6.20 7.40
KES090004 Alteration zone, amph, bt, fsp, locally py-bearing 6.97
KES090007 Bt-veined, dark volcanic rock Locally sköl-like 5.20
KES090009 Apatite-rich banded ore 6.00 2.24
KES090014A Reddish porphyritic volcanic to subvolcanic rock 8.95
KES090039 Phyllosilikate rich alterd volcanic rock 3.82 3.69
KES090040 Phyllosilicate-veined volcanic rock, schlieren-like 5.47
KES090044 Mt-blastic intermediate to basic volcanic rock 6.10 -0.42
KES090045 Bt rich, schistose, intermediate to basic volcanic rock with some Mt blasts. 6.47
KES09008A Mt-ore, immediately near contact to host-rock 1.93
KES090037 Mt ore section, close to host rock contact. 1.38
Table 6.2 The sample descriptions and δ18
O-values of the 690 drillcore.
18
6.3 Analytical methods and calculations
The ore forming fluid leaves an oxygen isotope imprint on the ore minerals. However, it has
also been noticed that fractionation occurs between the solid and liquid phase. In order to
take this fractionation into account and to use the data for modeling a few different
calculations were carried out using the equations in chapter 3.
6.3.1 Calculating δ18O-values for a possible ore forming magma
The magnetite δ18O-values can be used to reconstruct a model for potential ore forming
magma. This can be done if the fractionation (1000lnα) between a magma type and a
mineral is known. If the δ18O-value of a specific mineral and the fractionation are known, a
theoretical δ18O-value for the potential ore forming magma can be obtained. In order to do
so the known values have to be inserted in δ1 - δ2 ≈ 1000ln α1-2 and the equation has to be
rearranged to solve the unknown. The fractionation values for magnetite for rhyolitic and
andesitic magma are -4.67 and -3.97 respectively (Zhao and Zheng 2002). The calculation for
a rhyolitic magma is:
-4.67 ‰ = δ18Omagnetite - δ18Otheoretical magma
In which the theoretical magma value is the unknown. With this equation a range of
potential δ18O-value for rhyolitic and andesitic magmas are obtained which can then be
analyzed and compared to the expected range of these magma types and the whole rock
values of the samples.
6.3.2 Geothermometer calculations
The equation F3.2.1 gives the temperature at the time of the fractionation. The calculation is
done for the samples where both magnetite and quartz data exists. The value for the
geothermometer coefficient A is taken from Chiba (1989).
6.4 Results
For the first set of calculations all the magnetite values were used in order to obtain models
for a possible ore magma. Overall, 16 possible values were obtained and are presented in
tables 6.4 and 6.5. A potential range of magma δ18O for rhyolites and andesites was
determined (Table 6.3) by the rule that the δ18O increases by 0.2 ‰ with every 5 wt. %
Table 6.2 The dataset for the 690 drillcore.
Table 6.2 The sample description and δ18
O of the 690 drillcore.
19
increase of the SiO2 content with respect to the mantle values. This gave the following
theoretical ranges:
Magma SiO2 Content Theoretical δ18O in ‰ Crustal Contamination (+2 ‰)
Andesite 52 % -63 % 6-6.22 6-8.22
Dacite 63 %-69 % 6.22-6.46 6.22-8.46
Rhyolite > 69 % >6.46 > 6.46
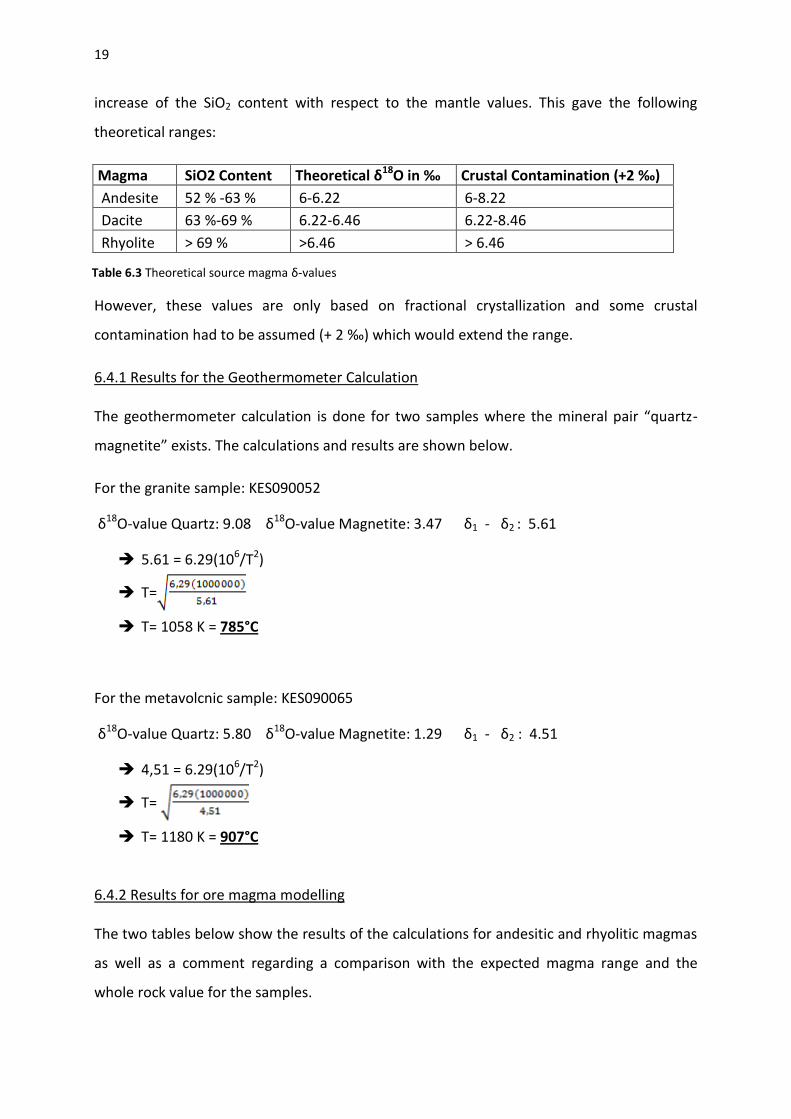
However, these values are only based on fractional crystallization and some crustal
contamination had to be assumed (+ 2 ‰) which would extend the range.
6.4.1 Results for the Geothermometer Calculation
The geothermometer calculation is done for two samples where the mineral pair “quartz-
magnetite” exists. The calculations and results are shown below.
For the granite sample: KES090052
δ18O-value Quartz: 9.08 δ18O-value Magnetite: 3.47 δ1 - δ2 : 5.61
5.61 = 6.29(106/T2)
T=
T= 1058 K = 785°C
For the metavolcnic sample: KES090065
δ18O-value Quartz: 5.80 δ18O-value Magnetite: 1.29 δ1 - δ2 : 4.51
4,51 = 6.29(106/T2)
T=
T= 1180 K = 907°C
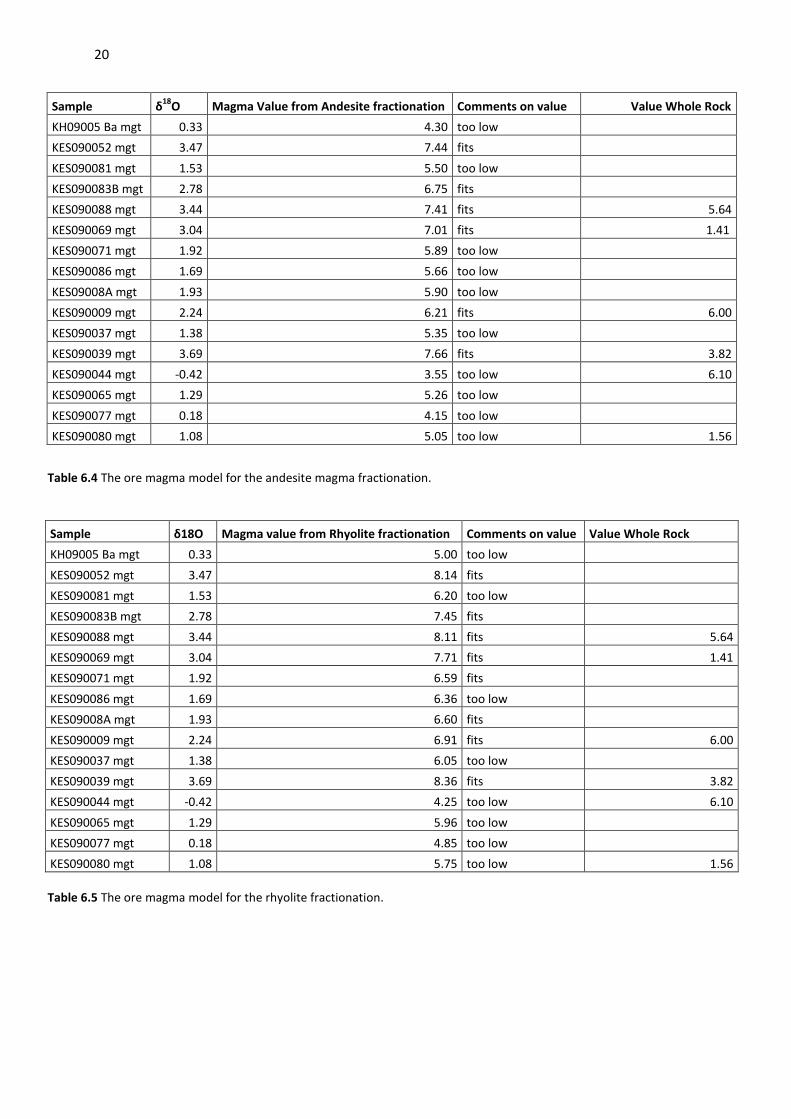
6.4.2 Results for ore magma modelling
The two tables below show the results of the calculations for andesitic and rhyolitic magmas
as well as a comment regarding a comparison with the expected magma range and the
whole rock value for the samples.
Table 6.3 Theoretical source magma δ-values
20
Sample δ18
O Magma Value from Andesite fractionation Comments on value Value Whole Rock
KH09005 Ba mgt 0.33 4.30 too low
KES090052 mgt 3.47 7.44 fits
KES090081 mgt 1.53 5.50 too low
KES090083B mgt 2.78 6.75 fits
KES090088 mgt 3.44 7.41 fits 5.64
KES090069 mgt 3.04 7.01 fits 1.41
KES090071 mgt 1.92 5.89 too low
KES090086 mgt 1.69 5.66 too low
KES09008A mgt 1.93 5.90 too low
KES090009 mgt 2.24 6.21 fits 6.00
KES090037 mgt 1.38 5.35 too low
KES090039 mgt 3.69 7.66 fits 3.82
KES090044 mgt -0.42 3.55 too low 6.10
KES090065 mgt 1.29 5.26 too low
KES090077 mgt 0.18 4.15 too low
KES090080 mgt 1.08 5.05 too low 1.56
Sample δ18O Magma value from Rhyolite fractionation Comments on value Value Whole Rock
KH09005 Ba mgt 0.33 5.00 too low
KES090052 mgt 3.47 8.14 fits
KES090081 mgt 1.53 6.20 too low
KES090083B mgt 2.78 7.45 fits
KES090088 mgt 3.44 8.11 fits 5.64
KES090069 mgt 3.04 7.71 fits 1.41
KES090071 mgt 1.92 6.59 fits
KES090086 mgt 1.69 6.36 too low
KES09008A mgt 1.93 6.60 fits
KES090009 mgt 2.24 6.91 fits 6.00
KES090037 mgt 1.38 6.05 too low
KES090039 mgt 3.69 8.36 fits 3.82
KES090044 mgt -0.42 4.25 too low 6.10
KES090065 mgt 1.29 5.96 too low
KES090077 mgt 0.18 4.85 too low
KES090080 mgt 1.08 5.75 too low 1.56
Table 6.4 The ore magma model for the andesite magma fractionation.
Table 6.5 The ore magma model for the rhyolite fractionation.
21
7. Discussion
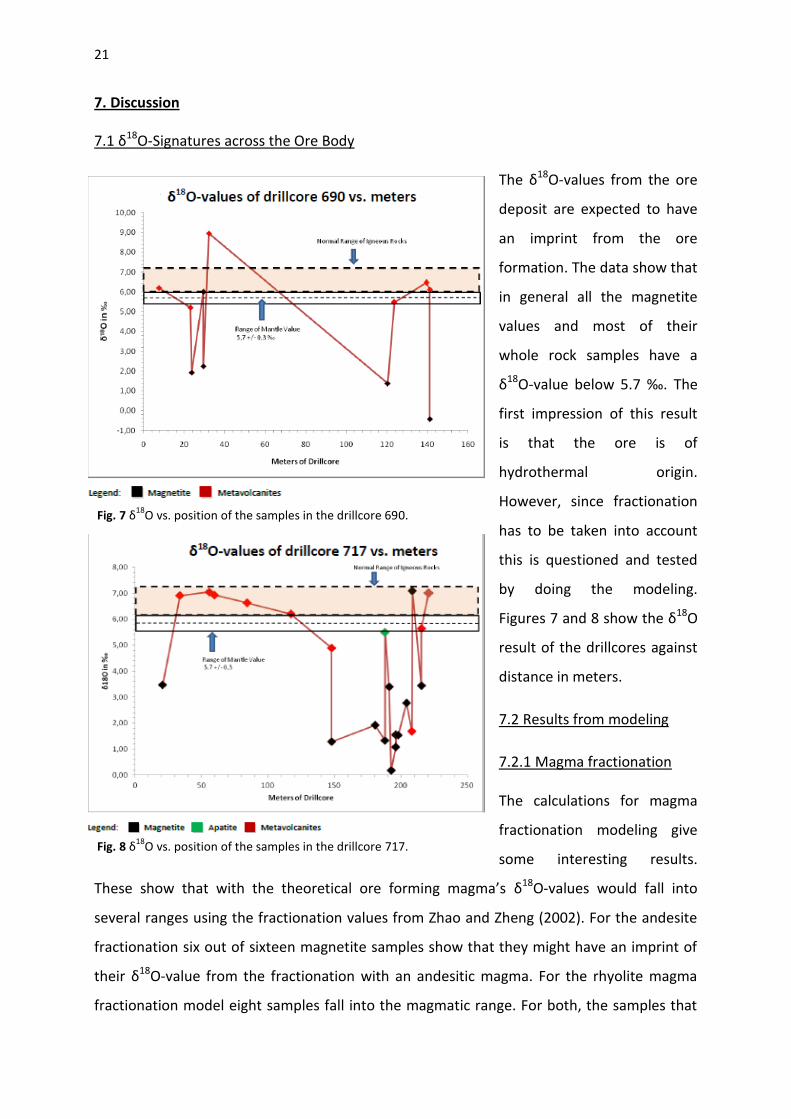
7.1 δ18O-Signatures across the Ore Body
The δ18O-values from the ore
deposit are expected to have
an imprint from the ore
formation. The data show that
in general all the magnetite
values and most of their
whole rock samples have a
δ18O-value below 5.7 ‰. The
first impression of this result
is that the ore is of
hydrothermal origin.
However, since fractionation
has to be taken into account
this is questioned and tested
by doing the modeling.
Figures 7 and 8 show the δ18O
result of the drillcores against
distance in meters.
7.2 Results from modeling
7.2.1 Magma fractionation
The calculations for magma
fractionation modeling give
some interesting results.
These show that with the theoretical ore forming magma’s δ18O-values would fall into
several ranges using the fractionation values from Zhao and Zheng (2002). For the andesite
fractionation six out of sixteen magnetite samples show that they might have an imprint of
their δ18O-value from the fractionation with an andesitic magma. For the rhyolite magma
fractionation model eight samples fall into the magmatic range. For both, the samples that
Fig. 8 δ18
O vs. position of the samples in the drillcore 717.
Fig. 7 δ18
O vs. position of the samples in the drillcore 690.

22
did not fall into the magma
fractionation model are
considered to have a
hydrothermal origin (Fig. 9).
7.2.2 Geothermometry calculations
The results from geothermometry calculations show expected magmatic temperatures for
the granite with T= 785°C and T= 907°C for the metavolcanic rock with magnetite veins. In
fact these temperatures would fit to a rhyolitic/granitic magma (temperature range 900° -
700° C).
7.3 Comparing models and δ18O-results
The results from the calculations and modeling are promising but they have to be compared
with the analytical data, particularly the whole rock samples. The theoretical magma values
have to be compared with the obtained analytical results and the calculated temperatures
have to be compared with the model. The dataset from the modeling includes six samples
that include δ18O-values from both magnetite and whole rock. Three of these samples fall
into the magmatic range (Tables 7.4 and 7.5).
Fig. 9 The source magma modeling result.
Sample Sample Description δ18
O
Magma Value from Andesite fractionation
Comments on value
Value Whole Rock
KES090088 mgt Magnetite Ore 3.44 7.41 fits 5.64
KES090009 mgt Apatite rich banded Ore 2.24 6.21 fits 6
KES090039 mgt Metavolcanite 3.69 7.66 fits 3.82
KES090044 mgt Metavolcanite -0.42 3.55 too low 6.1
KES090069 mgt Magnetite Ore 3.04 7.01 fits 1.41
KES090080 mgt Magnetite Ore 1.08 5.05 too low 1.56
Table 7.4 The comparison of δ18
O-values from whole rock to theoretical magma source for andesite
fractionation
23
Sample KES090088 (marked yellow in table 7.4) is from a laminated metavolcanic rock within
the ore and has magnetite that shows a theoretical magmatic origin. The whole rock value
also falls within the mantle value (5.7 +/- 0.3 ‰) which possible for andesitic or rhyolitic
magmas (Fig. 3). This leads to the assumption that the ore was generated by an ore magma.
If a slight hydrothermal alteration/overprint, which would lower the δ18O-value of the host
rock, is assumed, a perfect fit for the magmatic origin is gained. Sample KES090069 is from a
massive magnetite part of the ore and the modeling fits for a magmatic origin. The whole
rock value is however low. But again a hydrothermal overprint could be assumed, which may
affect the δ18O-value drastically.
On the other hand, sample KES090080 which is a magnetite ore with hematite blasts
(marked blue in table 7.4) seems to have originated from hydrothermal fluids. The magma
modeling clearly indicates this by showing a theoretical magma δ18O-value of 5.05 which is
too low for being magmatic. Also the whole rock δ18O-value of this sample is very low (1.56
‰) indicating a hydrothermal origin or overprint as suggested by the hematite content.
The three remaining samples are metavolcanic rocks and an ore sample (KES090009) and the
modeling for the latter, an apatite-rich banded ore, shows that the magnetite is supposed to
have formed from a magma also indicated by the whole rock value of 6 ‰. In KES090044, an
intermediate volcanic rock with magnetite blasts, the whole rock value shows a magmatic
value (6.1 ‰) but the magnetite is supposed to be of hydrothermal origin (-0.42 ‰). The
magnetite probably formed as a secondary mineral during hydrothermal alteration
associated with the volcanic activity. The whole rock value is just at the lower boundary of
the assumed andesite δ18O-range, so hydrothermal alteration can be assumed. KES090039, a
Sample Sample Description δ18
O
Magma value from Rhyolite fractionation
Comments on value
Value Whole Rock
KES090088 mgt Magnetite Ore 3.44 8.11 fits 5.64
KES090009 mgt Apatite rich banded Ore 2.24 6.91 fits 6
KES090039 mgt Metavolcanite 3.69 8.36 fits 3.82
KES090044 mgt Metavolcanite -0.42 4.25 too low 6.1
KES090069 mgt Magnetite Ore 3.04 7.71 fits 1.41
KES090080 mgt Magnetite Ore 1.08 5.75 too low 1.56
Table 7.5 The comparison of δ
18O-values from whole rock to theoretical magma source for rhyolite
fractionation

24
phyllosilicate altered volcanic rock, with a whole rock value of 3.82 ‰ again contains
magnetite that probably crystallized from a magma according to the model, and was thus
not affected by the later hydrothermal event altering the host rock.
Only for those six samples, described above and presented in Table 7.5, whole rock data is
available to be compared with the modeling. The origin of the other samples can only be
assumed by the calculations. Another possible magmatic ore sample is KES090083B, a
magnetite banded volcanic rock, with a magnetite δ18O-value of 2.78 ‰ and KES090071, an
apatite-banded magnetite ore, with 1.91 ‰ for the magnetite which however would only
work if it had its origin by a rhyolitic magma. The same holds for sample KES09008A, a
magnetite ore. Sample KES090077, a magnetite blastic hematite ore, and KES090037, a
magnetite ore, both in turn represent two more hydrothermally affected parts of the ore
body by theory with a δ18O-value of 0.18 ‰ and 1.38 ‰ respectively. The remaining samples
included in the modeling are magnetite bearing metavolcanic rocks. Again, the results
indicate that some may have formed directly from a magma or may be the result of later
stage hydrothermal alteration.
The two samples for which the fractionation temperature was calculated were KES090052, a
granite, and KES090065, a metavolcanic rock with magnetite veins. Both indicated a
fractionation occurring at magmatic temperatures. The oxygen isotope data from the granite
and the modeling showed that this magnetite has a magmatic origin. This fits with the
temperature of 785°C. The second sample, KES090065, is a metavolcanite and the
fractionation between the quartz and the magnetite occurred at around 907°C. This is a
magmatic temperature. On the other hand, the δ18O of the magnetite together with the
modeling indicate that this magnetite in the rock did not form from magma. A possibility
could be that the magnetite actually formed by a hydrothermal process, maybe a mineralizer
from the magma or by later hydrothermal overprint or the two minerals simply had not
reached equilibrium.
7.4 Comparison to δ18O-values of other apatite iron oxide deposits
The δ18O-result from the apatite-iron oxide deposit at Grängesberg can be compared with
the results from other similar ore deposits for which an oxygen isotope anaylsis is available.
Nyström et al. (2008) deals with the oxygen isotope analysis of the El Laco deposit in Chile
which they compare to the ore in Kiruna. Three diagrams show oxygen isotope values for
25
magnetite from Kiruna, El Laco and the Chilean Iron Belt. By comparing magmatic textured
magnetite in Nyström et al. (2008) to the values from Grängesberg it can be shown that the
values fall into the same range of δ18O-values. A special similarity can be observed with the
values from the El Laco deposit where the δ18O-value of magnetite falls into a range
between 2 – 4 ‰ which supports the interpretation and the modeling that the apatite-iron
oxide ore at Grängesberg, which falls into the same range, is also magmatic. However, there
is still the hydrothermal school for the El Laco deposit (Rhodes and Oreskes 1999).
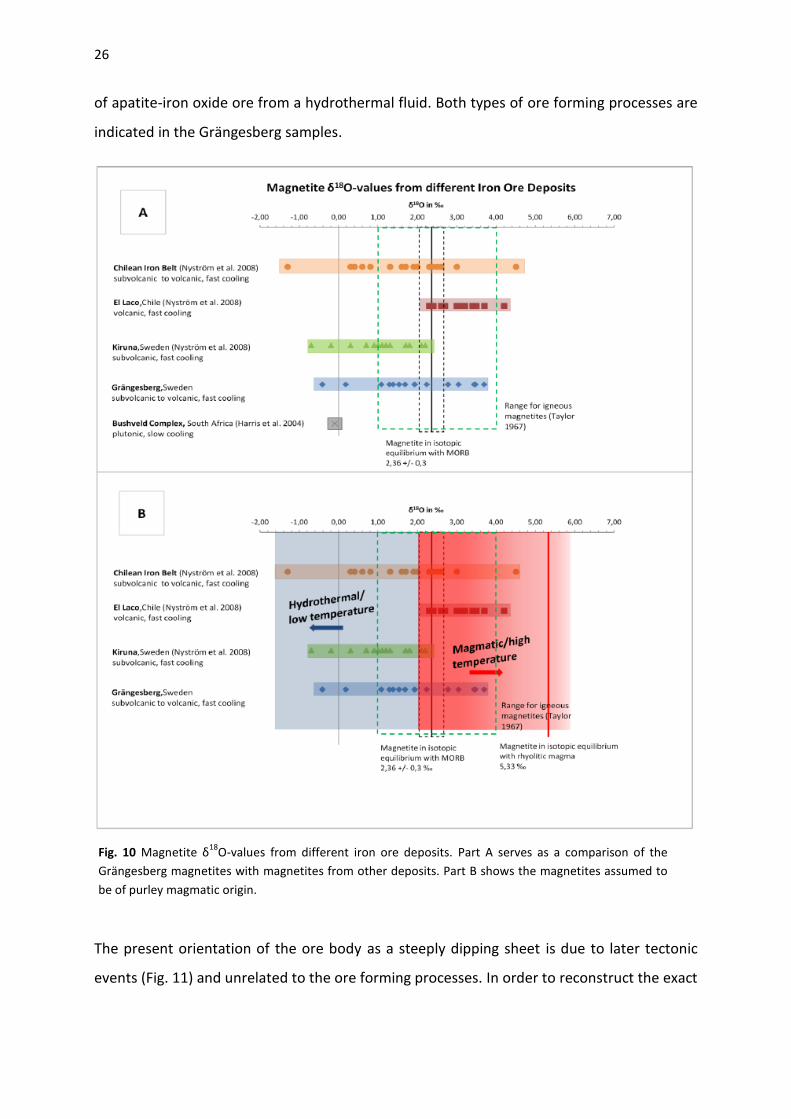
Fig. 10 shows several magnetite δ18O-values from several iron ore deposits whose formation
is under discussion. In part A of the diagram the similarities with the El Laco deposit clearly
stand out as well with the Chilean Iron Belt deposits. The lower boundary for magmatic
derived magnetites on the diagram was taken to be the magnetite that would have formed
and be in equilibrium with a MORB (5.7 ‰). The upper boundary was taken to be a
magnetite in equilibrium with a rhyolitic magma with a δ18O-value of 10 ‰. Data plotting in
between these values is considered to be of an orthomogmatic origin, meaning that it
crystallized purely from a magma (Fig. 10). Data plotting to the left of the diagram below the
lower limit of 5.7 ‰ is seen to have been overprinted by or originated from hydrothermal
processes including juvenile and/or magmatic waters. To determine the exact hydrothermal
processes that were involved in the magnetite formation is beyond the aim of this study. In
total a magmatic origin would account for six magnetite samples out of which four are from
the main ore. The remaining ten magnetite samples are of hydrothermal origin of which
seven are ore bodies. In order to obtain a bigger picture of which type, hydrothermal or
magmatic, is in majority more samples would have to be analyzed.
7.5 A possible formation of a mixed ore body
The formation of such an ore body with both magmatic and hydrothermal signatures can be
possible in a volcanic system in a subduction zone. A possible scenario is a volcano which
was fed by a magma enriched in oxides (may it be due to liquid immiscibility or
fractionation). This would lead to either an eruption of oxide lava forming a magmatic ore
body or to the mineralization of apatite-iron oxide ore at depth. Parts of the ore may have
originated from magmatic waters. Other hydrothermal processes are initiated by meteoric
or sea water percolating downwards into the country rock being heated by the magma. This
causes leaching of the country rocks and maybe some ore bodies and leads to mineralization
26
of apatite-iron oxide ore from a hydrothermal fluid. Both types of ore forming processes are
indicated in the Grängesberg samples.
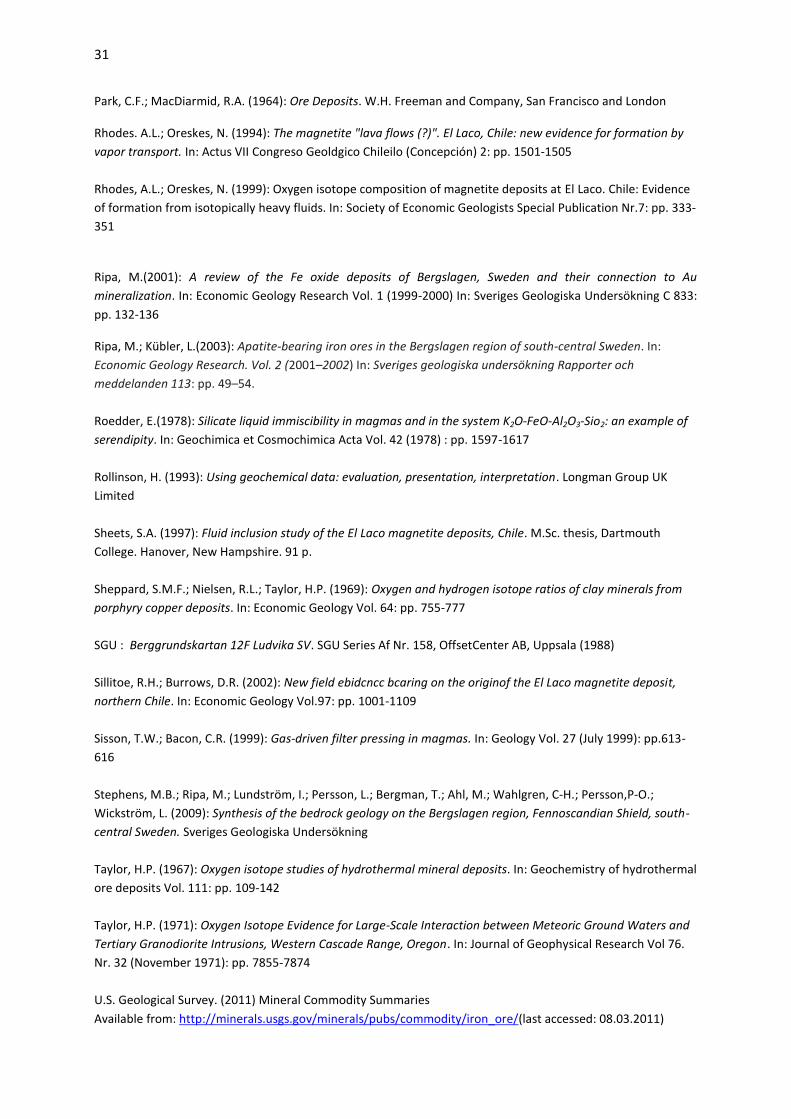
The present orientation of the ore body as a steeply dipping sheet is due to later tectonic
events (Fig. 11) and unrelated to the ore forming processes. In order to reconstruct the exact
Fig. 10 Magnetite δ18
O-values from different iron ore deposits. Part A serves as a comparison of the
Grängesberg magnetites with magnetites from other deposits. Part B shows the magnetites assumed to
be of purley magmatic origin.

27
formation of the ore body at Grängesberg more research would have to be done and would
involve more than just and oxygen isotope analysis.
8. Conclusion
The oxygen isotope analysis of the apatite-iron oxide ore at Grängesberg provided insight
about the origin of the ore. Over the years it has been a controversy whether the formation
was due to hydrothermal or purely magmatic processes (Johansson 1910, Magnusson 1938).
Evaluation of the δ18O-values of the Grängesberg samples provides that in fact both
processes have been involved. Modeling of a possible ore forming magma showed that
direct magmatic origin can be assigned to six out of the sixteen samples as they fall into the
magmatic window. This was also supported by the comparison of the magnetite δ18O-values
to those from other magmatic ore deposits where the values were in the same range. The
other ten Grängesberg samples fall into the hydrothermal field. The question what types of
hydrothermal processes were involved in the formation is out of the scope of this study and
would require more investigations. Also more sampling and oxygen isotope analysis would
be necessary to reveal which ore forming process formed the main ore body. An ore body of
a mixed hydrothermal and magmatic type would be possible in a subduction zone at an
active continental margin setting like the Bergslagen region in the Paleoproterozoic. Oxygen
isotope data in this study indicate a formation of the apatite-iron oxide ore at Grängesberg
not solemnly by hydrothermal or magmatic processes, but a mixture of both.
Fig. 11 A possible formation of a mixed apatite-iron oxide ore body. The present orientation is
due to tectonic events.

28
Acknowledgements
I want to thank my supervisors Dr. Karin Högdahl and Prof. Valentin R. Troll at Uppsala
University, who gave me the opportunity to work on this project, for all their help and
support. Also I want to thank Prof. Erik Jonsson from the Swedish Geological Survey (SGU;
Uppsala University), who did the drillcore logging and who provided the samples for the
project, Dr. Chris Harris from the University of Cape Town for carrying out the oxygen
isotope analysis and providing the data and Barbara Kern at the Technical University of Luleå
for the sample preparation.

29
References
Allen, R.L., Lundström, I., Ripa, M., Simeonov, A.; Christoffersson, H., 1996: Facies analysis of a 1.9 Ga,
continental margin, back-arc, felsic caldera province with diverse Zn-Pb-Ag-(Cu-Au) sulfide and Fe oxide
deposits, Bergslagen region, Sweden.In: Economic Geology Vol. 91 (1996): pp. 979–1008
Allen, R.; Ripa, M.; Jansson, N. (2008): Palaeoproterozoic volcanic- and limestonehosted Zn-Pb-Ag-(Cu-Au)
massive sulphide deposits and Fe oxide deposits in Bergslagen, Sweden. In: IGC Excursion Nr. 12 (August 2008):
pp. 16-21
Barley, M.E.; Pickard, A.L.; Hageman, S.G.; Folkert, S.L. (1999): Hydrothermal origin for the 2 billion year old
Mount Tom Price giant iron ore deposit, Hamersley Province, Western Australia. In: Mineralium Dposita Vol. 34
(1999): pp. 784-789
Chernicoff, S.; Fox, H. A.; Tanner, L. H. (2002): Earth: Geologic Principles and History. Houghton Mifflin
Company, Boston and New York
Chiba, H.; Chacko, T.; Clayton, Robert N.; Goldsmith, J. R. (1989): Oxygen isotope fractionations involving
diopside, forsterite, magnetite, and calcite: Application to geothermometry. In: Geochimica et Cosmochimica
Acta Vol. 53 (1989): pp. 2985-2995
Clemens, J.D. (1984): Water contents of silicic to intermediate Magmas. In:Lithos Vol. 17 (1984): pp. 273-287
Corona-Esquivel, R.; Martínez-Hernández, E.; Henríquez, F.; Nyström, J. O.; Tritlla, J. (2010): Palynologic
evidence for iron-oxide ash fall at La Perla, an Oligocene Kiruna-type iron ore deposit in northern Mexico. In:
GFF Vol. 132 (September - December 2010): pp. 173-181
De Beer, Jeroen ; Worrel, Ernst; Blok Kornelis (1998): Future Technologies for Energy efficient Iron and Steel
Making. In: Annual Review of Energy and the Environment Vol. 23 (November 1998): pp. 123-205
Frietsch, R. (1978): On the magmatic origin of iron ores of the Kiruna type. In: Economic Geology Vol.73:
pp. 478-485
Frietsch, R.; Perdahl, J. A.(1994): Rare earth elements in Apatite and Magnetite in Kiruna-type iron ores and
some other iron ore types. In: Ore Geology Reviews Vol. 9 (1995): pp. 489-510
Geijer, P. (1931): The iron ores of the Kiruna type. Sveriges Geologiska Undersökning C367: pp. 1-39
Geijer, P. (1967): Internal features of the apatite-bearing magnetite ores. Sveriges Geologiska Undersökning
C624: pp. 1-32
Guilbert, J. M.; Park, C.F.(1986): The Geology of Ore Deposits. W.H. Freeman and Company, New York
Grängesberg Iron (2009: Re-opening of Grängesberg mine based on 80+ Mt of NI43-101 Fe resources. In: Press
Release 22 October 2009
Available from: http://www.grangesberg.com/press/docs/GIAB_pressrelease091022ENG.pdf
(last accessed: 11.03.2011)

30
Harris, C.; Pronost, J.J.M.; Ashwal, L.D.; Cawthorn, R.G. (2004): Oxygen and Hydrogen Isotope Stratigraphy of
the Rustenburg Layered Suite, Bushveld Complex: Constraints on Crustal Contamination. In: Journal of Petrology
Vol. 43 Nr. 3 (2005): pp. 579-601
Hitzman, M.W.; Oreskes N.; Einaudi M.T. (1992): Geological characteristics and tectonic setting of Proterozoic
iron oxide (CU-U-Au-REE) deposits. In: Precambrian Research Vol.58: pp. 241-287
Hoefs, J. (1997): Stable Isotope Geochemistry. Pringer-Verlag, Berlin Heidelberg New York
http://www.bulkforum.com/publish_files/FK050429-KJ-Gr_nges_118235h.jpg (last accessed: 06.10.2011)
Hunt, J. P. (2005): Geological Characteristics of Iron Oxide-Copper-Gold (IOCG) Type Mineralisation in the
Western Bushveld Complex. Master Thesis, University of the Witwatersrand
Javoy, M. (1977): Stable Isotopes and Geothermometry. In: Journal of the Geological Society Vol.133 (1977): pp.
609-636
Johansson, H. (1910): Die eisenerzführende Formation in der Gegend von Grängesberg. In: Geologiska
Föreningens i Stockholm Förhandlingar Vol.32, Issue 2 (February 1910): pp.239-410
Juhani Ojala, V.; Iljina, M. (2008): Metallogeny and tectonic evolution of the Northern Fenoscandian Shield. In:
IGC Excursion Nr. 15 (August 2008): pp. 25-27
Keays, R. R. (1987): Principles of mobilization (dissolution) of metals in mafic and ultramafic rocks — The role of
immiscible magmatic sulphides in the generation of hydrothermal gold and volcanogenic massive sulphide
deposits. In: Ore Geology Reviews Vol.2 (1987): pp. 47-63
Lagerblad, B.; Gorbatschev, R. (1985): Hydrothermal alteration as a control of regional geochemistry
and ore formation in the central Baltic Shield. In: Geologische Rundschau Vol. 74 (1985): pp. 33-49
Lianxing, G.; Huichu, R.(1993): Hydrothermal Mobilization and Enrichment of Iron in the Iron Deposits
of the Middle—Lower Yangtze Valley District. In: Chinese Journal of Geochemistry Vol. 12 Nr. 3
(1993): pp. 228-238
Magnusson, N. H. (1938): Neue Untersuchungen innerhalb des Grängesbergfeldes .In: SGU ser. C, Nr. 401
(1938)
Marshak, S. (2008): Earth –Portrait of a Planet. W.W.Norton & Company, New York and London
Mason, B.; Moore, Carleton B. (1982): Principles of Geochemistry Fourth Edition. John Wiley & Sons
Nyström, J.O. ; Billström, K. ; Henríquez, F.; Fallick, A.E.; Naslund, H.R.(2008): Oxygen isotope composition of
magnetite in iron ores of the Kiruna type in Chile and Sweden. In: GFF Vol.130, Issue 4: pp. 177-188
Paràk, T. (1975): Kiruna iron ores are not "intrusive-magmatic ores of the Kirunatype". In: Economic Geology
Vol.70: pp. 1242-1258.
Paràk, T. (1981): On the magmatic origin of iron ores of the Kirunatype – a discussion. In: Economic Geology
Vol. 79: pp. 1945-1949
31
Park, C.F.; MacDiarmid, R.A. (1964): Ore Deposits. W.H. Freeman and Company, San Francisco and London
Rhodes. A.L.; Oreskes, N. (1994): The magnetite "lava flows (?)". El Laco, Chile: new evidence for formation by
vapor transport. In: Actus VII Congreso Geoldgico Chileilo (Concepción) 2: pp. 1501-1505
Rhodes, A.L.; Oreskes, N. (1999): Oxygen isotope composition of magnetite deposits at El Laco. Chile: Evidence
of formation from isotopically heavy fluids. In: Society of Economic Geologists Special Publication Nr.7: pp. 333-
351
Ripa, M.(2001): A review of the Fe oxide deposits of Bergslagen, Sweden and their connection to Au
mineralization. In: Economic Geology Research Vol. 1 (1999-2000) In: Sveriges Geologiska Undersökning C 833:
pp. 132-136
Ripa, M.; Kübler, L.(2003): Apatite-bearing iron ores in the Bergslagen region of south-central Sweden. In:
Economic Geology Research. Vol. 2 (2001–2002) In: Sveriges geologiska undersökning Rapporter och
meddelanden 113: pp. 49–54.
Roedder, E.(1978): Silicate liquid immiscibility in magmas and in the system K2O-FeO-Al2O3-Sio2: an example of
serendipity. In: Geochimica et Cosmochimica Acta Vol. 42 (1978) : pp. 1597-1617
Rollinson, H. (1993): Using geochemical data: evaluation, presentation, interpretation. Longman Group UK
Limited
Sheets, S.A. (1997): Fluid inclusion study of the El Laco magnetite deposits, Chile. M.Sc. thesis, Dartmouth
College. Hanover, New Hampshire. 91 p.
Sheppard, S.M.F.; Nielsen, R.L.; Taylor, H.P. (1969): Oxygen and hydrogen isotope ratios of clay minerals from
porphyry copper deposits. In: Economic Geology Vol. 64: pp. 755-777
SGU : Berggrundskartan 12F Ludvika SV. SGU Series Af Nr. 158, OffsetCenter AB, Uppsala (1988)
Sillitoe, R.H.; Burrows, D.R. (2002): New field ebidcncc bcaring on the originof the El Laco magnetite deposit,
northern Chile. In: Economic Geology Vol.97: pp. 1001-1109
Sisson, T.W.; Bacon, C.R. (1999): Gas-driven filter pressing in magmas. In: Geology Vol. 27 (July 1999): pp.613-
616
Stephens, M.B.; Ripa, M.; Lundström, I.; Persson, L.; Bergman, T.; Ahl, M.; Wahlgren, C-H.; Persson,P-O.;
Wickström, L. (2009): Synthesis of the bedrock geology on the Bergslagen region, Fennoscandian Shield, south-
central Sweden. Sveriges Geologiska Undersökning
Taylor, H.P. (1967): Oxygen isotope studies of hydrothermal mineral deposits. In: Geochemistry of hydrothermal
ore deposits Vol. 111: pp. 109-142
Taylor, H.P. (1971): Oxygen Isotope Evidence for Large-Scale Interaction between Meteoric Ground Waters and
Tertiary Granodiorite Intrusions, Western Cascade Range, Oregon. In: Journal of Geophysical Research Vol 76.
Nr. 32 (November 1971): pp. 7855-7874
U.S. Geological Survey. (2011) Mineral Commodity Summaries
Available from: http://minerals.usgs.gov/minerals/pubs/commodity/iron_ore/(last accessed: 08.03.2011)

32
Ünlü, T.; Stendal, H.; Makovicky, E.; Saiyli, S.(1995): Genesis of the Divrigiİ Iron Ore Deposit, Sivas, Central
Anatolia, Turkey-An ore microscopy study. In: Mineral Resources Exploration Bulletin Vol. 117 (1995): pp. 17-28
Wilson, M.R.; Hamilton, P.J.; Fallick, A.E. ; Aftalion, M.; Michard, A. (1984): Granites and early Proterozoic
crustal evolution in Sweden: evidence from Sm-Nd, U-Pb and O isotope systematic. In: earth and Planetary
Science Letters Nr. 72 (1985): pp.376-388
Zhao, Z.-F.; Zheng, Y.-F. (2002): Calculation of Oxygen Isotope Fractionation in Magmatic Rocks. In: Chemical
Geology Nr. 193 (2003): pp. 59-80

33


![Oxygen Transport Measured by Isotope Tracing through Solid ... · oxygen transport pathways under electrochemical polarization in solid oxide fuel cell (SOFC) cathode materials[1,2,3,4],](https://static.fdocuments.net/doc/165x107/5e3b6abdd9c90010f5530afa/oxygen-transport-measured-by-isotope-tracing-through-solid-oxygen-transport.jpg)