THE OWNERSHIP AND CONTROL OF AUSTRALIAN ENERGY …
14
THE OWNERSHIP AND CONTROL OF AUSTRALIAN ENERGY RESOURCES GREG CROUGH Australian energy resources are comprised primarily of black coal, oil and natural gas, and the as yet undeveloped uranium deposits. The intention of this paper is to provide details of the ownership and control of these major resources and also information relating to production, reserves and domestic consumption. It is not meant to be a highly analytical paper; instead it seeks simply to illustrate some of the main trends in the control of these resources in recent years. Probably the main point to note about the ownership and control of the majority of Australian industries and resources is that it is very concentrated. A few firms account for a large proportion of the output, and also that there is a significant degree of foreign ownership and control. This means that when the issue of the so-called 'energy crisis' is raised, it must always be remembered that a very small number of large, and increasingly transnational, corporations control the major energy resources of Australia and the world. BLACK COAL Australia is the eighth largest black coal producing nation, but accounts for only 3 percent of the worldfs production. As an exporter, however, Australia ranks third after the united States and Poland, and black coal is now Australia's major earner of foreign exchange. Production. Total production of black coal in 1976-77 was 75,678,000 tonnes, of which 40,399,000 tonnes (or 53 percent) was mined from underground sources. 1 New South Wales is the largest producing state, accounting for 59 per- cent of production. The main growth in the last decade, however, has been in Queensland which now produces 35 percent of the national output. 2 Rapid growth in Queensland has been based on the development of large-scale, comparatively low-cost open-cut mines, which have been highly profitable for the companies concerned. Reserves. Total in situ black coal reserves are estimated at 228.6 billion --- tonnes, of which 34.7 billion tonnes are known reserves and 193.9 billion are inferred. New South Wales possesses reserves of 16.2 billion tonnes (47 percent) and Queensland 15.8 billion tonnes (46 percent). 3 Domestic Consumption. Since the mid-1950's, petroleum products have become directly competitive with black coal in many areas, notably in manufacturing indus- try, transport and domestic heating. In the period 1953-76, the share of coal (including brown coal) in total consurrq;>tion of primary energy· fe-II from 66 percent to 39 percent, while the share .of petroleum products rose from 27 percent to 45 percent. 4 The domestic consumption of black coal has become confined to supplying the needs of electricity generation and the iron and steel industry, as Table I indicates. 25
Transcript of THE OWNERSHIP AND CONTROL OF AUSTRALIAN ENERGY …
THE OWNERSHIP AND CONTROL OF AUSTRALIAN ENERGY RESOURCES
GREG CROUGH
Australian energy resources are comprised primarily of black coal, oil and natural gas, and the as yet undeveloped uranium deposits. The intention of this paper is to provide details of the ownership and control of these major resources and also information relating to production, reserves and domestic consumption. It is not meant to be a highly analytical paper; instead it seeks simply to illustrate some of the main trends in the control of these resources in recent years.
Probably the main point to note about the ownership and control of the majority of Australian industries and resources is that it is very concentrated. A few firms account for a large proportion of the output, and also that there is a significant degree of foreign ownership and control. This means that when the issue of the so-called 'energy crisis' is raised, it must always be remembered that a very small number of large, and increasingly transnational, corporations control the major energy resources of Australia and the world.
BLACK COAL
Australia is the eighth largest black coal producing nation, but accounts for only 3 percent of the worldfs production. As an exporter, however, Australia ranks third after the united States and Poland, and black coal is now Australia's major earner of foreign exchange.
Production. Total production of black coal in 1976-77 was 75,678,000 tonnes, of which 40,399,000 tonnes (or 53 percent) was mined from underground sources. 1 New South Wales is the largest producing state, accounting for 59 percent of production. The main growth in the last decade, however, has been in Queensland which now produces 35 percent of the national output. 2 Rapid growth in Queensland has been based on the development of large-scale, comparatively low-cost open-cut mines, which have been highly profitable for the companies concerned.
Reserves. Total in situ black coal reserves are estimated at 228.6 billion ---tonnes, of which 34.7 billion tonnes are known reserves and 193.9 billion are inferred. New South Wales possesses reserves of 16.2 billion tonnes (47 percent) and Queensland 15.8 billion tonnes (46 percent). 3
Domestic Consumption. Since the mid-1950's, petroleum products have become directly competitive with black coal in many areas, notably in manufacturing industry, transport and domestic heating. In the period 1953-76, the share of coal (including brown coal) in total consurrq;>tion of primary energy· fe-II from 66 percent to 39 percent, while the share .of petroleum products rose from 27 percent to 45 percent. 4 The domestic consumption of black coal has become ~ncreasingly confined to supplying the needs of electricity generation and the iron and steel industry, as Table I indicates.
25
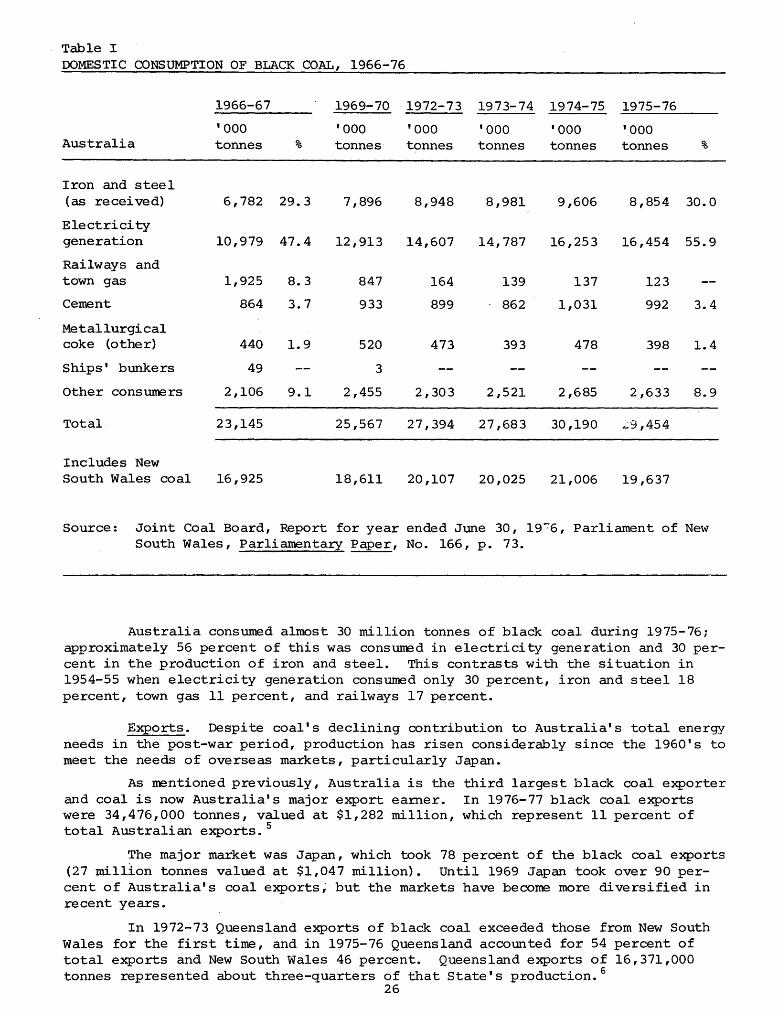
Table I DOMESTIC CONSUMPTION OF BLACK COAL, 1966-76
Australia
Iron and steel (as received)
E Ie ctri ci ty generation
Railways and town gas
Cement
Metallurgical coke (other)
Ships' bunkers
Other consumers
Total
Includes New South Wales coal
1966-67
'000 tonnes %
6,782 29.3
10,979 47.4
1,925
864
440
49
2,106
23,145
16,925
8.3
3.7
1.9
9.1
1969-70 1972-73 1973-74 1974-75 1975-76
'000 '000 '000 '000 '000 tonnes
7,896
12,913
847
933
520
3
2,455
25,567
18,611
tonnes
8,948
14,607
164
899
473
2,303
27,394
20,107
tonnes
8,981
14,787
139
862
393
2,521
27,683
20,025
tonnes
9,606
16,253
137
1,031
478
2,685
30,190
21,006
tonnes %
8,854 30.0
16,454 55.9
123
992
398
2,633
~9,454
19,637
3.4
1.4
8.9
Source: Joint Coal Board, Report for year ended June 30, 19~6, Parliament of New South Wales, Parliamentary Paper, No. 166, p. 73.
Australia consumed almost 30 million tonnes of black coal during 1975-76; approximately 56 percent of this was consumed in electricity generation and 30 percent in the production of iron and steel. This contrasts with the situation in 1954-55 when electricity generation consumed only 30 percent, iron and steel 18 percent, town gas 11 percent, and railways 17 percent.
Exports. Despite coal's declining contribution to Australia's total energy needs in the post-war period, production has risen considerably since the 1960's to meet the needs of overseas markets, particularly Japan.
As nentioned previously, Australia is the third largest black coal exporter and coal is now Australia's major export earner. In 1976-77 black coal exports were 34,476,000 tonnes, valued at $1,282 million, which represent 11 percent of total Australian exports. 5
The major market was Japan, which took 78 percent of the black coal exports (27 million tonnes valued at $1,047 million). until 1969 Japan took over 90 percent of Australia's coal exports; but the markets have become more diversified in recent years.
In 1972-73 Queensland exports of black coal exceeded those from New South Wales for the first time, and in 1975-76 Queensland accounted for 54 percent of total exports and New South Wales 46 percent. Queensland exports of 16,371,000 tonnes represented about three-quarters of that state's production. 6
26

Ownership. OWnership of Australian black coal is very concentrated and a considerable number of foreign companies now have sizable operations.
For Australia as a whole, foreign ownership was estimated to be 62 percent in 1974-75. 7 In 1972, 30 percent of coal produced in New South Wales was accounted for b~ foreign controlled companies, while the figure for Queensland was 65 percent. The Joint Coa~ Board estimated that organisations with some foreign equity controlled 73 percent of Queensland's known recoverable reserves of black coal in 1972, including 93 percent of the coking coal. 9
The list below contains the names of the major companies involved in coal production, the names of their principal shareholders, production (1975-76), and share of the total State's production.
New South Wales
1. Austen and Butta Ltd. Shareholders: Shell Co. of Australia Ltd. (UK/Netherlands, 37.2 perc~nt) ,
Mitsubishi Chemical Industries Ltd. (Japan, 3.8 percent), Marubeni Iada Co. Ltd. (Japan, 3.8 percent)
Production: 1,9l6,000tonnes (4.7 percent)
2. Bellambi Coal Company Ltd. Parent: . Consolidated Gold Fields Australia Ltd. (UK) Production: 1,037,000 tonnes (2.6 percent)
3. Clutha Development Pty. Ltd. Shareholders: D.K. Ludwig o!ganisation (US, 50 percent) ,
British Petroleum Co. of Australia Ltd. (UK, 50 percent) Production: 7,877,000 tonnes (19.4 percent)
4. Coal and Allied Industries Ltd. Shareholders: Conzinc Riotinto of Australia Ltd. (UK, 13. 8 percent) ,
Howard Srni~ Ltd. (Australia, 45.5 percent) Production: 3,557,000 tonnes (8.8 percent)
5. Kembla Coal and Coke Pty. Ltd. Shareholders: Conzinc Riotinto of Australia Ltd. (UK, 50 percent) ,
North Broken Hill Holdings Ltd. (30 percent) , BH South Ltd. (20 percent)
Production: 1,523,000 tonnes (3.8 percent)
6. Broken Hill Proprietary Co. Ltd. Production: 2,390,000 tonnes (5.9 percent)
7. Australian Iron and Steel Pty. Ltd. Parent: BHP Co. Ltd. Production: 4,035,000 tonnes (9.9 percent)
8. State Electricity Co~ssion Production: 9,489,000 tonnes (23.4 percent)
Queensland
9. Central Queensland Coal Associates Participants: Utah Development Co. (US, 76.25 percent) ;
Production:
Mitsubishi Development Co. Pty. Ltd. (Japan, 12 percent) , utah Mining Australia Ltd. (4 percent) , AMP Society ( 7. 75 percent) 13,423,907 (52 percei7t)
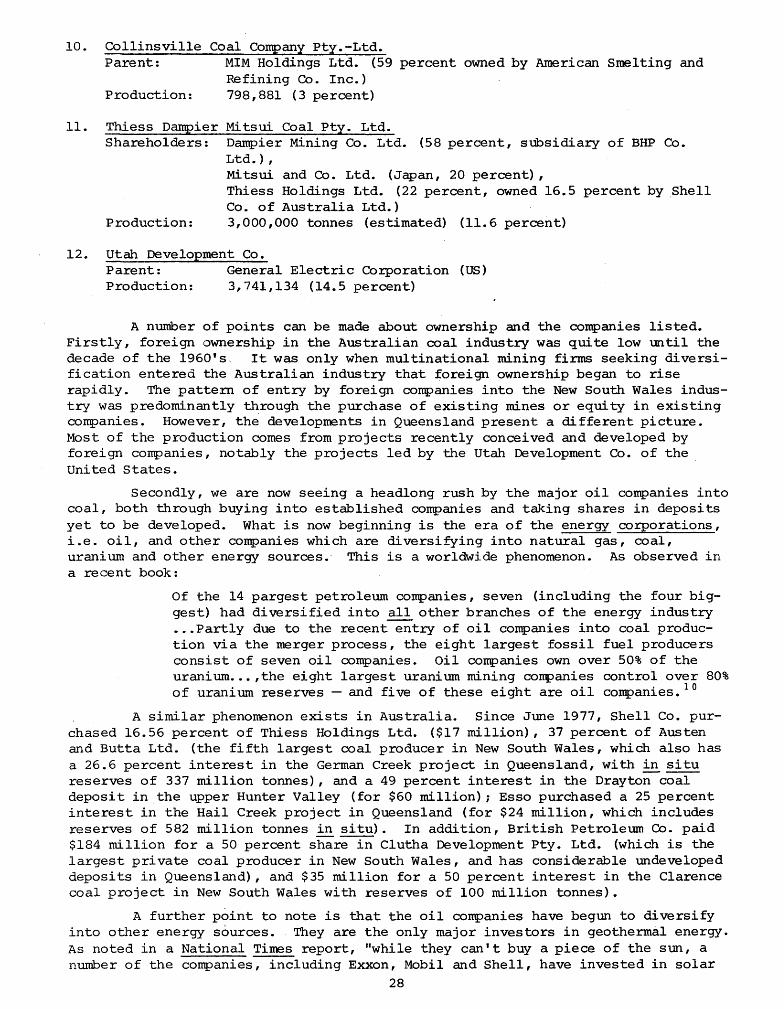
10. Collinsville Coal Company Pty. -Ltd. Parent: MIM Holdings Ltd. (59 percent owned by American Smelting and
Refining Co. Inc.) Production: 798,881 (3 percent)
11. Thiess Dampier Mitsui Coal Pty. Ltd. Shareholders: Dampier Mining Co. Ltd. (58 percent, subsidiary of BHP Co.
Ltd.) I
Mitsui and Co. Ltd. (Japan, 20 percent) , Thiess Holdings Ltd. (22 percent, owned 16.5 percent by Shell Co. of Australia Ltd.)
Production: 3,000,000 tonnes (estimated) (11.6 percent)
12. utah Development Co. Parent: Production:
General Electric Corporation (US) 3,741,134 (14.5 percent)
A number of points can be made about ownership and the companies listed. Firstly I foreign ownership in the Australian coal industry was quite low lmtil the decade of the 1960' s·. It was only when multinational mining firms seeking di versification entered the Australian industry that foreign ownership began to rise rapidly. The pattern of entry by foreign companies into the New South Wales industry was predominantly through the purchase of existing mines or equity in existing companies. However, the developments in Queensland present a different picture. Most of the production comes from projects recently conceived and developed by foreign companies, notably the projects led by the Utah Development Co. of the Uni ted States.
Secondly, we are now seeing a headlong rush by the major oil companies into coal, both through buying into established companies and taking shares in deposits yet to be developed. What is now beginning is the era of the energy cO!porations, i.e. oil, and other companies which are diversifying into natural gas, coal, urani urn and other energy sources.· This is a worldwide phenomenon. As observed in a recent book:
Of the 14 pargest petroleum companies, seven (including the four biggest) had diversified into all other branches of the energy industry •.. Partly due to the recent entry of oil companies into coal production via the merger process, the eight largest fossil fuel producers consist of seven oil companies. Oil companies own over 50% of the uranium ..• ,the eight largest uranium mining companies control over 80% of uranium reserves - and five of these eight are oil companies. 10
A similar phenomenon exists in Australia. Since June 1977, Shell Co. purchased 16.56 percent of Thiess Holdings Ltd. ($17 million), 37 percent of Austen and Butta Ltd. (the fifth largest coal producer in New South Wales, which also has a 26.6 percent interest in the German Creek project in Queensland, with in situ reserves of 337 million tonnes), and a 49 percent interest in the Drayton coal deposit in the upper Hunter Valley (for $60 million) ; Esso purchased a 25 percent interest in the Hail Creek project in Queensland (for $24 million, which includes reserves of 582 million tonnes in situ). In addition, British Petroleum Co. paid $184 million for a 50 percent share in Clutha Development Pty. Ltd. (which is the largest private coal producer in New South Wales, and has considerable undeveloped deposits in Queensland), and $35 million for a 50 percent interest in the Clarence coal project in New South W~les with reserves of 100 million tonnes).
A further point to note is that the oil companies have begun to diversify into other energy sources. They are the only major investors in geothermal energy. As noted in a National Times report, "while they can' t buy a piece of the sun, a number of the companies, including Exxon, Mobil and Shell, have invested in solar
28
energy research. Mobil has conunitted $30 million to solar research and Shell $6~ 6-million". 11 They are the leading companies in extracting a petroleum-like fuel from tar sands.
But it is not just the oil companies which have been moving into. coal. The most obvious is the recent takeover by Conzinc Riotinto of Australia (the largest mining group and second largest company in Australia) and Howard Smith, of Coal and Allied Industries Ltd. (a $50 million bid for the fourth largest coal producer in New South Wales, which has the rights to part of the Warkworth coal deposits, estimated at over 500 million tonnes). CRA is already a very diversified organisation with interests in iron ore (Hamersley Holdings Ltd.), copper (Bougainville Copper Ltd.), bauxite and aluminium (Comalco Ltd.), uranium (Mary Kathleen Uranium Ltd.), smelting of non-ferrous metals (Australian Mining and Smelting Ltd.), and coal (Kembla Coal and Coke Pty. Ltd. and Blair Athol Coal Pty. Ltd.).
Even more dramatic was the merger/takeover between utah Development Co. and General Electric in early 1977, which has been described as the largest merger in United States' history. General Electric is the sixth largest corporation in the world (ranked by sales), employs over 400,000 people, and is the world's largest manufacturer of light bulbs and electrical appliances. 12 General Electric is truly an energy corporation, being involved in producing the energy and the products that so extravagantly use it.
It is interesting to note" that the Japanese steel mills, Australia's largest coal customers, have indicated considerable concern about the increasing foreign ownership of Australian coal. The Japanese do not like the prospect of having to deal with aggressive multinational companies like CRA and the oil comr panies. As the Australian Financial Review noted:
Now both Australia and Japan are being taught a lesson on capitalism by the Americans (utah and Esso) and the British and Dutch (BP and Shell) • The present rush to buy Australian coal reserves is just one indication of the fact that New South Wales and Queensland coal reserves are being pin-pointed as among the world's most significant fuel sources ••• The sense behind the recent rush into steaming coal prospects by multinationals is emphasised by the potential held out for steaming coal in liquefaction projects. 13
However, it is not only foreign corporations which have been moving into· coal. Broken Hill Proprietary Co. Ltd., Australia's steel producer, is already a horizontally diversified company, and has been involved in the rush into coal (and other mineral resources). It recently purchased a 58 percent interest in the Thiess Dampier Mitsui Coal Pty. Ltd. project from the Peabody Coal Co. of the united States, and the company also has extensive interests in deposits in Queensland and New South Wales. The projects will be almost exclusively "export oriented: a peculiar situation for a steel producer to export coal to its main competitors, the Japanese steel mills, particularly when its domestic steel operations have suffered setbacks in recent years. (In fact, BHP's gross group profit over the year ended May 31, 1977, was $524 million, of which $188 million came fro~ its steel operations, $112 million from mining, and $185 million from petroleum. After deductions of various items, net profit was $71 million, including a loss of $53 million on steel.)
One general point to be noted about the development of these conglomerates is the growth of ever greater and more concentrated power through various forms of cross-stibsidisation. Barnet and"Muller, in their important book Global Reach, observe that the essential strategy of the managerial revolution in industry is
the use of power and resources developed in one 'profit centre' to start or expand another~ When the system becomes global, the parent company can shift profits through transfer pricing, 'profit-loan
29
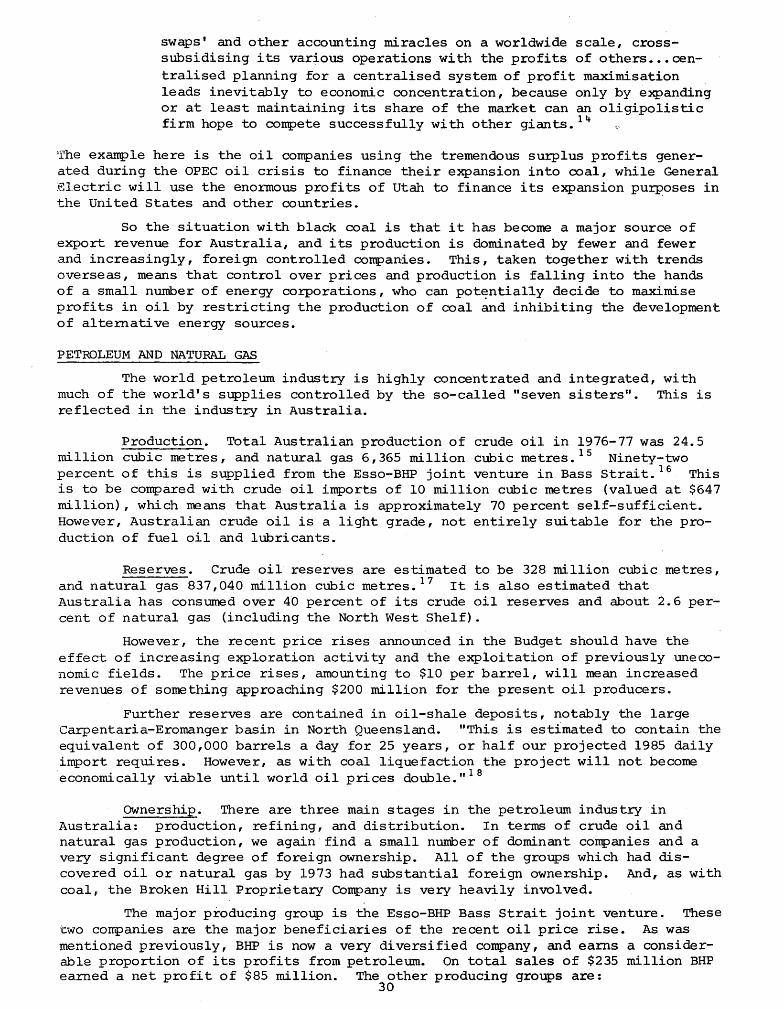
swaps' and other accounting Ddracles on a worldwide scale, crosssubsidising its various operations with the profits of others ••• centralised planning for a centralised system of profit maxiDdsation leads inevitably to economic concentration, because only by expanding or at least maintaining its share of the market can an oligipolistic firm hope to compete successfully with other giants.l~
'fhe example here is the oil companies using the tremendous surplus profits generated during the OPEC oil crisis to finance their expansion into coal, while General :electric will use the enormous profits of utah to finance its expansion purvoses in the United states and other countries.
So the situation with black coal is that it has become a major source of export revenue for Australia, and its production is dominated by fewer and fewer and increasingly, foreign controlled companies. This, taken together with trends overseas, means that control over prices and production is falling into the hands of a small number of energy corporations, who can potE7ntially decide to maximise profits in oil by restricting the production of coal and inhibiting the development of al ternati ve energy sources.
PETROLEUM AND NATURAL GAS
The world petroleum industry is highly concentrated and integrated, wi th much of the world's supplies controlled by the so-called "seven sisters". This is reflected in the industry in Australia.
Production. Total Australian production of crude oil in 1976-77 was 24.5 million cubic metres, and natural gas 6,365 million cubic metres. IS Ninety-two percent of this is supplied from the Esso-BHP joint venture in Bass Strait. 16 This is to be compared with crude oil imports of 10 million cubic metres {valued at $647 million}, which means that Australia is approximately 70 percent self-sufficient. However, Australian crude oil is a light grade, not entirely suitable for the production of fuel oil and lubricants.
Reserves. Crude oil reserves are estimated to be 328 million cubic metres, and natural gas 837,040 million cubic metres. 17 It is also estimated that Australia has consumed over 40 percent of its crude oil reserves and about 2.6 percent of natural gas (including the North West Shelf).
However, the recent price rises announced in the Budget should have the effect of increasing exploration acti vi ty and the exploitation of previouslyuneconomic fields. The price rises, amounting to $10 per barrel, will mean increased revenues of something approaching $200 million for the present oil producers.
Further reserves are contained in oil-shale deposits, notably the large Carpentaria-Erornanger basin in North Queensland. "This is estimated to contain the equivalent of 300,000 barrels a day for 25 years, or half our projected 1985 daily import requires. However, as with coal liquefaction the project will not become "economically viable until world oil prices double." 18
OWnership. There are three main stages in the petroleum industry in Australia: production, refining, and distribution. In terms of crude oil and natural gas production, we again" find a small number of dominant companies and a very significant degree of foreign ownership. All of the groups which had discovered oil or natural gas by 1973 had substantial foreign ownership. And, as with coal, the Broken Hill Proprietary Company is very heavily involved.
The major producing group is the Esso-BHP Bass Strait joint venture. These two companies are the major beneficiaries of the recent oil price rise. As was mentioned previously, BHP is now a very diversified company, and earns a considerable proportion of its profits from petroleum. On total sales of $235 million BHP earned a net profit of $85 million. The other producing groups are:
30
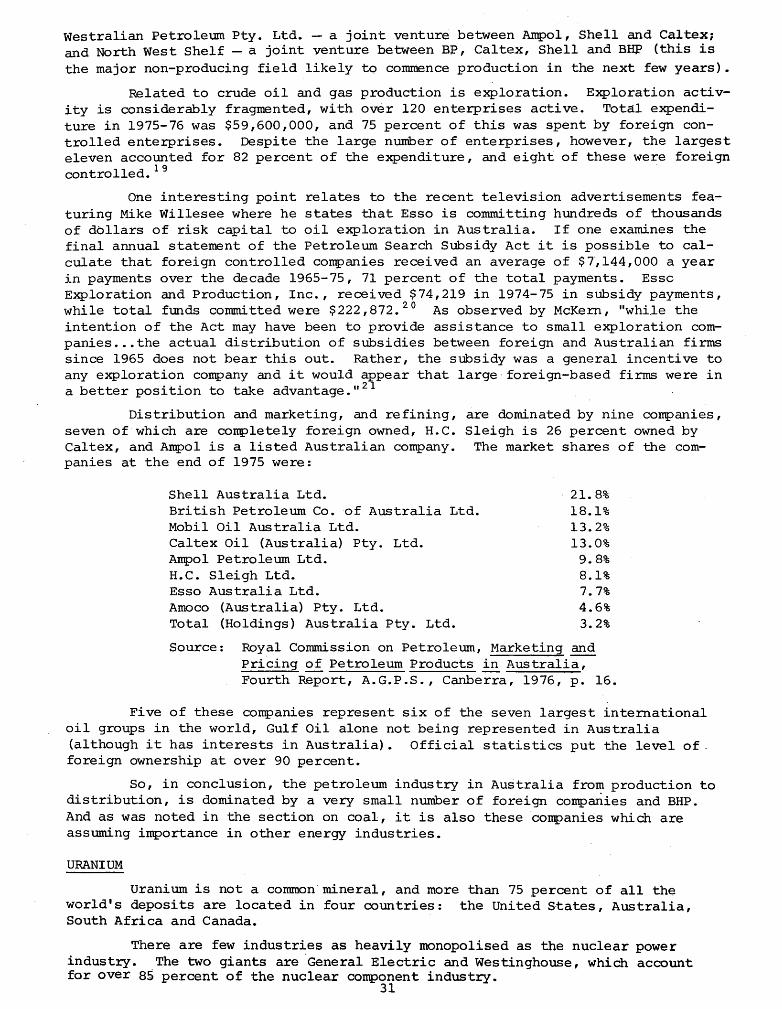
westralian Petroleum Pty. Ltd. - a joint venture between Ampol, Shell and Caltex; and North West Shelf - a joint venture between Bl?, Caltex, Shell and BHJ? (this is the major non-producing field likely to commence production in the next few years).
Related to crude oil and gas production is exploration. Exploration activity is considerably fragmented, with over 120 enterprises active. Tot~l expenditure in 1975-76 was $59,600,000, and 75 percent of this was spent by foreign controlled enterprises. Despite the large number of enterprises, however, the largest eleven accounted for 82 percent of the expenditure, and eight of these were foreign controlled. 19
One interesting point relates to the recent television advertisements featuring Mike Willesee where he states that Esso is co~tting hundreds of thousands of dollars of risk capital to oil exploration in Australia. If one examines the final annual statement of the Petroleum Search Subsidy Act it is possible to calculate that foreign controlled companies received an average of $ 7,144,000 a year in payments over the decade 1965-75, 71 percent of the total payments. Esse Exploration and Production, Inc., received $ 74,219 in 1974-75 in subsidy payment.s, while total funds committed were $222,872. 20 As observed by McKern, "whi.1e the intention of the Act may have been to provide assistance to small exploration companies ... the actual distribution of subsidies between foreign and Australian firms since 1965 does not bear this out. Rather, the subsidy was a general incentive to any exploration company and it would appear that large· foreign-based firms were in a better position to take advantage." 2 1
Distribution and marketing, and refining, are dominated by nine companies, seven of which are completely foreign owned, H.C. Sleigh is 26 percent owned by Caltex, and Ampol is a listed Australian company. The market shares of the companies at the end of 1975 were:
Shell Australia Ltd. British Petroleum Co. of Australia Ltd. Mobil Oil Australia Ltd. Caltex Oil (Australia) Pty. Ltd. Ampol Petroleum Ltd. H.C. Sleigh Ltd. Esso Australia Ltd. Amoco (Australia) Pty. Ltd. Total (Holdings) Australia Pty. Ltd.
21.8% 18.1% 13.2% 13.0%
9.8% 8.1% 7.7% 4.6% 3.2%
Source: Royal Commission on Petroleum, Marketing and Pricing of Petroleum Products in Australia, Fourth Report, A.G.P.S., Canberra, 1976, p. 16.
Five of these companies represent six of the seven largest international oil groups in the world, Gulf Oil alone not being represented in Australia (although it has interests in Australia). Official statistics put the level of. foreign ownership at over 90 percent.
So, in conclusion, the petroleum industry in Australia from production to distribution, is dominated by a very small number of foreign companies and BHP. And as was noted in the section on coal, it is also these companies which are assuming importance in other energy industries.
URANIUM
Uranium is not a common' mineral, and more than 75 percent of all the world's deposits are located in four countries: the United S·tates, Australia, South Africa and Canada.
There are few industries as heavily monopolised as the nuclear power industry. The two giants are 'General Electric and Westinghouse, which account for over 8§ percent of the nuclear component industry.
31
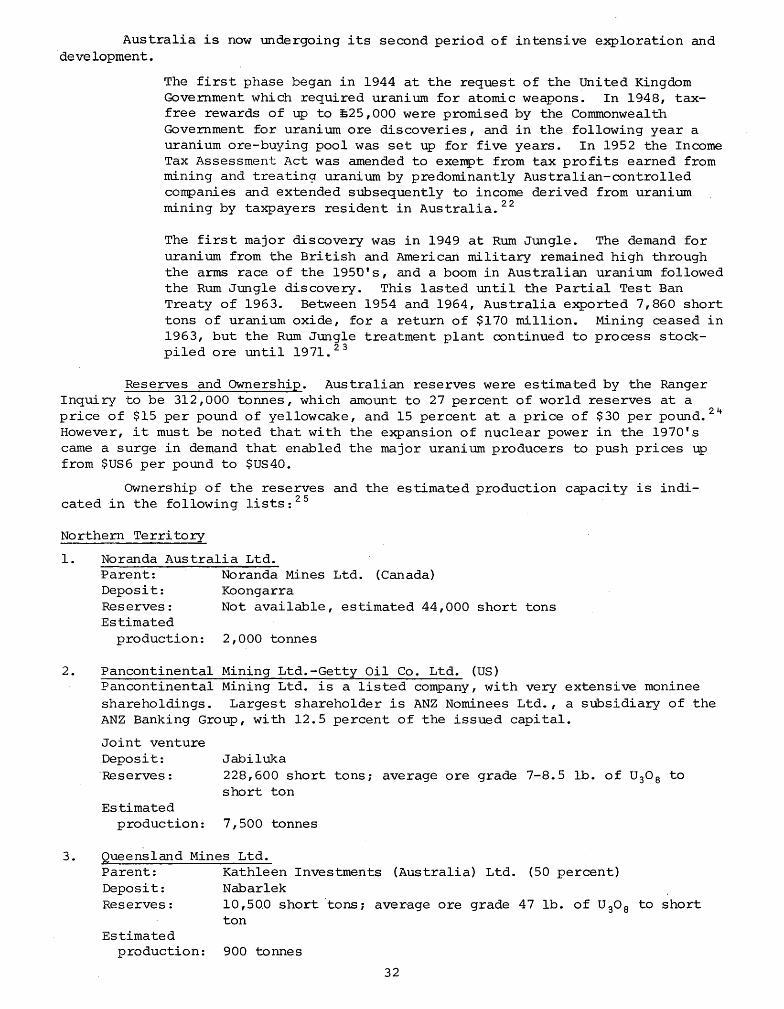
Australia is now undergoing its second period of intensive exploration and . deve lopment.
The first phase began in 1944 at the request of the United Kingdom Government which required uranium for atomic weapons. In 1948, taxfree rewards of up to E25,DDD were promised by the Commonwealth Government for uranium ore discoveries, and in the following year a uranium ore-buying pool was set up for five years. In 1952 the Income Tax Assessment Act was amended to exempt from tax profits earned from mining and treating uranium by predominantly Australian-controlled companies and extended subsequently to income derived from uranium mining by taxpayers resident in Australia. 22
The first major discovery was in 1949 at Rum Jungle. The demand for uranium from the British and American military remained high through the arms race of the 1950's, and a boom in Australian uranium followed the Rum Jungle discovery. This lasted until the Partial Test Ban Treaty of 1963. Between 1954 and 1964, Australia exported 7,860. short tons of uranium oxide, for a return of $170. million. Mining ceased in 1963, but the Rum Jungle treatment plant continued to process stockpiled ore until 1971. 23
Reserves and OWnership. Australian reserves were estimated by the Ranger Inquiry -to be 312,0.0.0. tonnes, which amount to 27 percent of world reserves at a price of $15 per pound of yellowcake, and 15 percent at a price of $30. per pound. 24
However, it must be noted that with the expansion of nuclear power in the 197D's came a surge in demand that enabled the major uranium producers to push prices up from $US6 per pound to $US4D.
OWnership of the reserves and the estimated production capacity is indicatedin the following lists: 25
Northern Territory
1. Noranda Australia Ltd. Parent: Deposit: Reserves: Estimated
production:
Noranda Mines Ltd. (Canada) Koongarra Not available, estimated 44,0.0.0. short tons
2,0.0.0. tonnes
2. Pancontinental Mining Ltd.-Getty Oil Co. Ltd. (US) Pancontinental Mining Ltd. is a listed company, with very extensive moninee shareholdings. Largest shareholder is ANZ Nominees Ltd., a subsidiary of the ANZ Banking Group, with 12.5 percent of the issued capital.
Joint venture Deposit: Jabiluka 'Reserves: 228,60.0. short tons; average ore grade 7-8.5 lb. of U30 S to
short ton Estimated
production: 7,50.0. tonnes
3. Queensland Mines Ltd. Parent: Deposit: Reserves:
Estimated
Kathleen Investments (Australia) Ltd. (50. percent) Nabarlek 10. ,50.0. short tons ; aver-age ore grade 47 lb. of U 30S to short ton
production: 90.0. tonnes
32
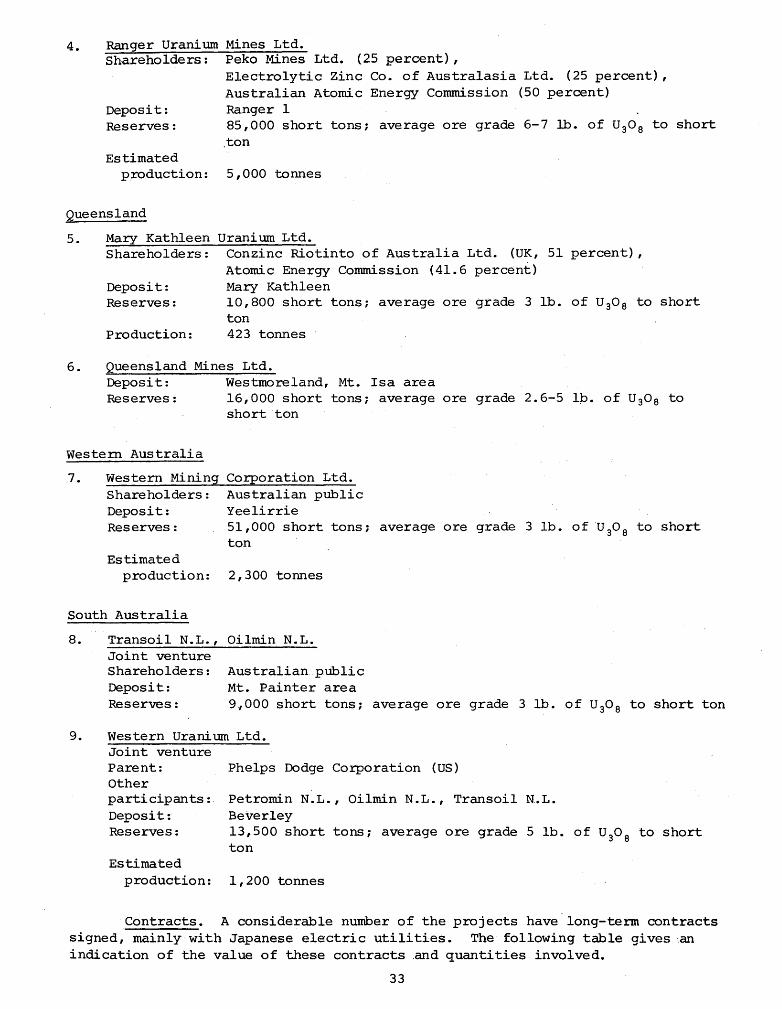
4. Ranger Uranium Mines Ltd. Shareholders: Peko Mines Ltd. (25 percent),
Electrolytic Zinc Co. of Australasia Ltd. (25 percent) , Australian Atomic Energy Commission (50 percent)
Deposit: Ranger 1 Reserves: 85,000 short tons; average ore grade 6-7 lb. of U30 8 to short
ton Estimated
production: 5,000 tonnes
Queensland
5. Mary Kathleen Uranium Ltd. Shareholders: Conzinc Riotinto of Australia Ltd. (UK, 51 percent),
Atomic Energy Commission (41.6 percent) Deposi t: Mary Kathleen Reserves: 10,800 short tons; average ore grade 3 lb. of U 308 to short
ton Production: 423 tonnes
6. Queensland Mines Ltd. Deposit: Westmoreland, Mt. Isa area Reserves: 16,000 short tons; average ore grade 2.6-5 lb. of U30 8 to
short ton
Western Australia
7. Western Mining COrporation Ltd. Shareholders: Australian public Deposi t: Yeelirrie Reserves: 51,000 short tons; average ore grade 3 lb. of U 308 to short
ton Estimated
production: 2,300 tonnes
South Australia
8. Transoil N.L., Oilmin N.L. Joint venture Shareholders: Deposit: Reserves:
Australian.public Mt. Painter area 9.,000 short tons; average ore grade 3 lb. of U30 8 to short ton
9. Western Uranium Ltd. Joint venture Parent: Other participants: Deposit: Reserves:
Estimated
Phelps Dodge Corporation (US)
Petromin N.L., Oilmin N.L., Transoil N.L. Beverley 13,500 short tons; average ore grade 5 lb. of U
30
8 to short
ton
production: 1,200 tonnes
Contracts. A considerable number of the projects have long-term contracts signed, mainly with Japanese electric utilities. The following table gives an indication of the value of these contracts .and quantities involved.
33
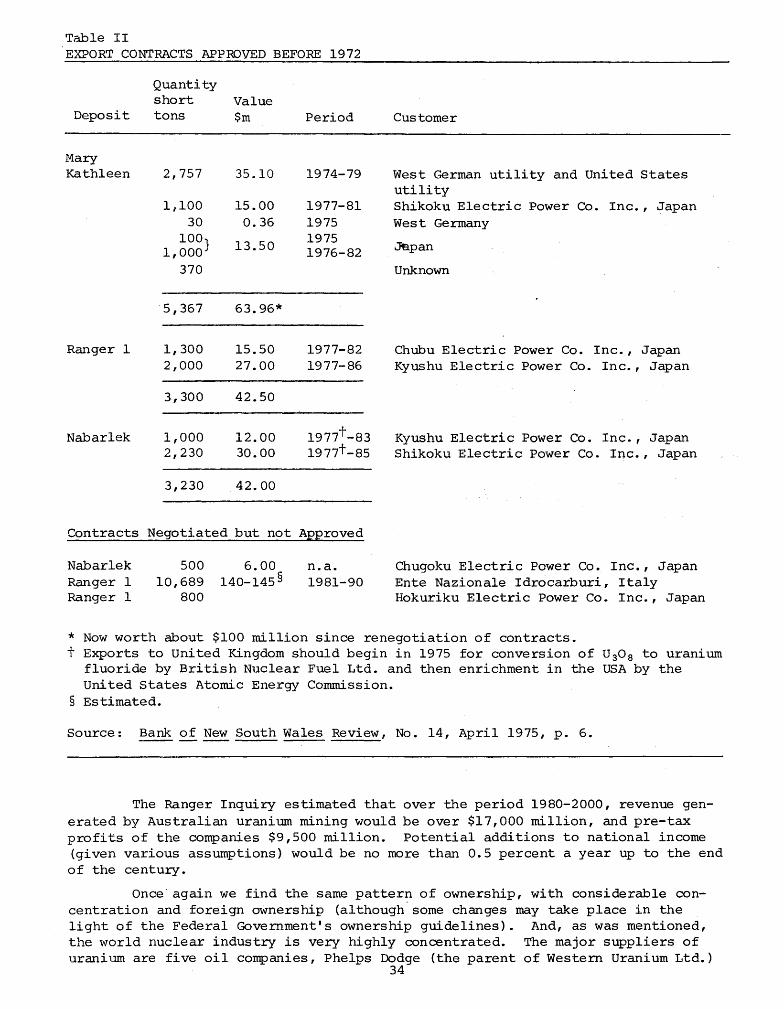
Table II EXPORT CONTRACTS APPROVED BEFORE 1972
Deposit
Mary Kathleen
Ranger 1
Nabar1ek
Quantity short tons
2,757
1,100 30
100 1,000}
370
5,367
1,300 2,000
3,300
1,000 2,230
3,230
Value $m
35.10
15.00 0.36
13.50
63.96*
15.50 27.00
42.50
12.00 30.00
42.00
Period
1974-79
1977-81 1975 1975 1976-82
1977-82 1977-86
1977t -83 1977t -85
Contracts Negotiated but not Approved
Nabarlek Ranger 1 Ranger 1
500 10,689
800
6.00 l40-l45§
n.a. 1981-90
Customer
West German utility and united States utility Shikoku Electric Power Co. Inc., Japan West Germany
J9pan
Unknown
Chubu Electric Power Co. Inc., Japan Kyushu Electric Power Co. Inc. , Japan
Kyushu Electric Power Co. Inc., Japan Shikoku Electric Power Co. Inc., Japan
Chugoku Electric Power Co. Inc., Japan Ente Nazionale Idrocarburi, Italy Hokuriku Electric Power Co. Inc., Japan
* Now worth about $100 million since renegotiation of contracts. t Exports to United Kingdom should begin in 1975 for conversion of U30 a to uranium
fluoride by British Nuclear Fuel Ltd. and then enrichment in the USA by the United states Atomic Energy Co~ssion.
§ Estimated.
Source: Bank of New South Wales Review, No. 14, April 1975, p. 6.
The Ranger Inquiry estimated that over the period 1980-2000, revenue generated by Australian uranium mining would be over $17,000 million, and pre-tax profits of the companies $9,500 million. Potential additions to national income (given various assumptions) would be no more than 0.5 percent a year up to the end of the century.
Once· again we find the same pattern of ownership, with considerable concentration and foreign ownership (although· some changes may take place in the light of the Federal Government's ownership guidelines). And, as was mentioned, the world nuclear industry is very highly concentrated. The major suppliers of uranium are five oil companies, Phelps Dodge (the parent of Western Uranium Ltd.)
34
, , '
and utah International Inc. (the immediate parent of the coal producer Utah Development Co~) • The oil companies moved into uranium in the 1960' s and by 1970 owned 25 ,percent of' uranium milling capacity and 50 percent of known reserves.
CONCLUSION'
A number of stands can now be d~awn together to assess the implications of the foregoing discussion of the ownership and control of Australian energy resources.
(1) For black coal, petroleum and uranium the ownership is very concentrated, implying that a few companies are in dominant positions to control production and pricing. What we are seeing in Australian industry at the present time is the growth of the conglomerate: corporations with a diverse range of interests in different industries. Small companies are continually being driven out or taken over, and in most industries a large proportion of the output is controlled by less than ten companies. Of particular note here are Broken Hill Proprietary Co. Ltd. and Conzinc Riotinto of Australia Ltd., the largest and second largest companies in Australia.
(2) OWnership -is increasingly involving foreign companies, so that more and more decisions about resource development are being taken in the light of profit maximising considerations of the large transnational corporations. To give an example of the economic consequences of this, one can cite the example of Utah Development Co. For the year ended October 31, 1976, Utah earned a profit before tax of $241 million and after tax $137 million. It paid a dividend of $91 million to the parent company. In the first nine months of 1977 it exported $130 million in dividends, even though its net earnings were only $116 million. 2 ~ This is a very considerable drain on the Australian balance of payments, and the funds are being paid to one of the largest corporations in the world for' expansion purposes.
Further, the takeover of energy resources by the oil companies will mean that decisions about volumes of production ,of particular energy resources will be taken in the light of maximising ~he prices of other resources; notably the production of black coal could be used as a lever to force up the price of crUde oil, and vice versa.
(3) The role of the state becomes crucially important, and in particular the state governments. A recent writer noted that very severe political problems could face Australia in coming years, wi th conflicts between federal' and state governments.
Because the states control mineral resources, ' and 'because mineral resources are now so important to the Australian economy, the state level of government has acquired'vitally important functions and responsibili ties ... Under the impact of mineral resource development, a gradual shift of wealth, popUlation and economic and political power is taking place iIi the' direction 0"£ Queensland and Western Australia, the states which control most of Australia's mineral reserves and which are also the states most dependent on mining. Since local attachments and hostility to the federal government have always been stronger in these remote states than in the two large states, and since these traditional sentiments are now reinforced by economic self-interest, the outlying hinterland states can be expected to exert their growing influence in favour ,of decentralisation. 27
It is likely ,that the external iinkages of these states with the transnational corporations and international finance sources will grow much stronger, at the expense of their links with the rest of Australia (particularly as manufacturing industry in the southern states slides further and further into crisis).
35
(4) Australian energy resources will create considerable wealth in terms of balance of payments revenue, particularly black coal and uranium. However, this will be counterbalanced by profit and dividend outflows by foreign companies and payments for imported equipment. Employment generation will be relatively insignificant in terms of the present level of unemployment (the whole mining industry employs only 68,000 people, 23,000 of whom are involved in coal mining) 28, and will be even less if a large proportion of the mining equipment is imported.
(5) Finally, it is increasingly likely that alternative energy sources will also be taken over by the same big companies, and will be developed only as profit maximisation dictates. As long as technology is developed inside corporations like General Electric, and as long as companies like these continue to produce enormous quantities of energy-consuming oommodities,then the possibility of successful exploitation of non-nuclear non-fossil fuel resources is limited.
Notes
DEPARTMENT OF ECONOMICS UNIVERSITY OF SYDNEY
1Australian Bureau of Statistics, Minerals and Mineral Products, September 1977, Catalogue No. 8404.0.
, 2 "Black ,Coal - The Resurgence of an Industry", Bank of New South Wales Review, No. ~O, December 1976~ p. 4.
3Bank of New South Wales Review, ~. cit., p. 3. Estimates are also in Australian Mineral Industry Quarterly Review, Bureau of Mineral Resources, Geology and Geophysics, Vol. 29, Nos. 3 and 4, p. 87.
ItJoint Coal Board, Report for year ended June 30, 1976, Parliament of New South Wales, Parliamentary Paper ,No,. 166, p. 136.
5Australian Bureau of Statistics, Exports, June 1977, Catalogue No. 5404.0.
6Joint Coal Board, Ope cit., p. 87.
7Australian Bureau of Statistics, Foreign Ownership and Control of the Mining Industry, 1974-75, Catalogue No. 5317.0.
e-R•B• McKern, Multinational Enterprise and Natural Resources, McGraw-Hill, Sydney, 1976, p. 69.
9Joint Coal Board, Submission to Senate Select Committee on Foreign Ownership and Control, Official Hansard Report, August 1, 1973, p. 63.
lOR. Nader, J. Abbotts, The Menace of Atomic Energy, Outback Press, Melbourne, 1977, p. 268.
,llA• Horin, "When the ,Oil Runs Out, Exxon Will Go On", National Times, June 20-25, 1977, p. 30.
12For an excellent analysis of General Electric, see J. Woodmansee, et al., The World of ~ Giant Corporation, North County Press, Washington; 1975, 84 PP., See also R. Haupt, "Is What's Good for General Electric Good for Australia?", and "General Electric Goes for Growth", in Australian Financial Review, March 30 and 31, 1977.
13M• Byrnes, "Japanese,HitBig'Australian Coal Takeovers", Australian Financial Review, August 22, 1977.
11tR• Barnet, R. Muller, Global Reach, Simon and Schuster, New York, ,1974, pp. 255-256.
36
15Australian Bureau of Statistics, Minerals and Mineral Products, September 1977, catalogue No. 8404.0.
16Bureau of Mineral Resources, Ope cit., p. 68.
17Ibid., p. 87.
18J . Edwards, P. Freeman, "The Great Australian Energy Mirage", National Times, August 22-27, 1977, p. 18.
19Australian Bureau of Statistics, Foreign Control in Mineral Exploration, 1975-76, Catalogue No. 5323.0.
20petroleum Search Subsidy Act, Sixteenth Annual Statement for Year 1974-75, Commonwealth Parliamentary Paper, No. 31, 1976, pp. 3-4. The scheme was terminated in 1974 by the Labor Government.
21 R•B• McKern, Ope cit., p. 112.
22"Australia - A Quarry for Uranium Hunters?", Bank of New South Wales Review, No. 14, April 1975, pp. 3-4.
23 K. Rowley, "Nuclear Madness", Intervention, No.9, October 1977, p. 9.
24Ranger Uranium Environmental Inquiry, First Report, October 1976, Commonwealth Parliamentary Paper, No. 309, 1976, p. 61.
25Estimated production figures from A.J. Grey, "Australian Uranium -Will It Ever Become Available", Queensland Government Mining Journal, August 1976, quoted in Australian Mines Handbook, National Miner, 1976-77, p. 62.
26"Overseas-OWned Firms" Export of Funds", Parliamentary Debates, House of Representatives, November I, 1977, p. 2599.
27G. Stevenson, Mineral Resources and Australian Federalism, Research Monograph No. 17, Centre for Research on Federal Financial Relations, Australian National University, 1976, pp. 86-87.
28This is to be compared with manufacturing industry which employs over 1,200,000.
Theory Of Capital Reproduction And Accumulation Shinzaburo Koshimura, Professor of Economics and President Em
ritus, Yokohama National University. Edited by Jesse Schwartz
"Professor Koshimura had provided us with an ingenious and thorough formulization of Marx's economics."
-David Laibman, (Brooklyn College), Journal of Economic Literature.
modern linear algebra, the text is not difficult and contains useful numerical examples."' . -David Evans, (University of Sussex),
Economic Journal
"The central concerns of the book are to "An understanding of the inner physiol-introduce modern mathematics into the ogy of capitalism, of the cycle of ex-discussion of Marx's law of value and its change, production, circulation and ac-relation to reproduction schemes, to cumulation is cruciaL .. Koshimura's elaborate the treatment of the transfor- book is probably one of the best accessi-mation problem under expanded repro- ble treatments of that part of Marxist duction and to incorporate the treatment theory." of monopoly explicitly into the reproduc- -Jack Barbalet (University of Adelaide), tion schemes. For the student versed in Arena Journal
170 pages. $9.95 paperback. Add postage: Canada - $.45. Elsewhere - $.80 per book surface mail. Make all cheques or' money orders (Canadian currency please) payable to DPG Publishing Co.
Send order with payment to: DPG Publishing Co. 97 Victoria St. N. Kitchener, Ontario Canada
37

Copyright of Full Text rests with the original copyright owner and, except as permitted under the Copyright Act 1968, copying this copyright material is prohibited without the permission of the owner or its exclusive licensee or agent or by way of a license from Copyright Agency Limited. For information about such licences contact Copyright Agency Limited on (02) 93947600 (ph) or (02) 93947601 (fax)