THE OUTLOOK FOR WORLD GRAIN AND OILSEED … · Web viewTitle THE OUTLOOK FOR WORLD GRAIN AND...
44
* Presentation to National Grain and Oils Information Center Beijing, China, July 2, 2007 Gerald A. Bange Chairperson, World Agricultural Outlook Board Office of the Chief Economist, United States Department of Agriculture THE SITUATION AND OUTLOOK FOR WORLD CORN, SOYBEAN, AND COTTON MARKETS* Introduction Let me begin by thanking the National Grain and Oils Information Center for inviting me to speak at this important meeting. As many of you know, I have had the good fortune to visit China many times since 1983, 8 times to be exact. My work with China has been a highlight of my 37 years with the United States Department of Agriculture (USDA). As chairman of the World Agricultural Outlook Board (WAOB), I am responsible for overseeing the coordination, review, and clearance of all commodity forecasts released by USDA. As you know, USDA forecasts are the primary source of information used by world commodity markets. The World Agricultural Supply and Demand Estimates (WASDE) report, for which I am responsible, is released monthly by USDA according to a published schedule. It is the Board’s responsibility to * USDA’s current 2007/08 supply and demand forecasts in metric units for corn, soybeans, and cotton for China, the United States, and the world are shown in Appendix A, Tables 1, 2, and 3, respectively. Source: World Agricultural Supply and Demand Estimates report, June 12, 2007. Figures 1-28 are presented in Appendix B.
-
Upload
trinhduong -
Category
Documents
-
view
215 -
download
1
Transcript of THE OUTLOOK FOR WORLD GRAIN AND OILSEED … · Web viewTitle THE OUTLOOK FOR WORLD GRAIN AND...

*Presentation to National Grain and Oils Information CenterBeijing, China, July 2, 2007
Gerald A. BangeChairperson, World Agricultural Outlook Board
Office of the Chief Economist, United States Department of Agriculture
THE SITUATION AND OUTLOOK FOR WORLD CORN, SOYBEAN, AND COTTON MARKETS*
Introduction
Let me begin by thanking the National Grain and Oils Information Center for inviting me to speak at this important meeting. As many of you know, I have had the good fortune to visit China many times since 1983, 8 times to be exact. My work with China has been a highlight of my 37 years with the United States Department of Agriculture (USDA).
As chairman of the World Agricultural Outlook Board (WAOB), I am responsible for overseeing the coordination, review, and clearance of all commodity forecasts released by USDA. As you know, USDA forecasts are the primary source of information used by world commodity markets. The World Agricultural Supply and Demand Estimates (WASDE) report, for which I am responsible, is released monthly by USDA according to a published schedule. It is the Board’s responsibility to ensure that USDA estimates and forecasts are unbiased, based on sound information, and released in a timely manner.
When I spoke here 3 years ago, biofuels were just beginning to have a significant impact on agricultural markets. Since that time, in response to sharply higher petroleum prices, the use of corn and soybeans for ethanol and biodiesel production, respectively, has grown dramatically (Figure 1). Today, I will present USDA’s views regarding the outlook for world grain, soybean, and cotton markets in light of these recent developments.
Developing Economies Lead Agriculture Growth
Prospects for world economic growth look very good. The world economy is expected to grow 3 to 4 percent annually for the foreseeable future (Figure 2.). The European Union, Japan, and the United States are all expected to grow at an annual rate of 2 to 3 percent through 2010. Economic growth in developing countries is projected even stronger and is expected to range between 4 and 9 percent annually for the same period. Argentina
* USDA’s current 2007/08 supply and demand forecasts in metric units for corn, soybeans, and cotton for China, the United States, and the world are shown in Appendix A, Tables 1, 2, and 3, respectively. Source: World Agricultural Supply and Demand Estimates report, June 12, 2007. Figures 1-28 are presented in Appendix B.
and countries in Latin America are projected at the low end while China and other Asian countries are projected at the high end of this forecast. If correct, this is good news for agriculture. While consumers in high-income nations spend less than 10 cents of each additional dollar they earn on food, consumers in developing countries increase food purchases by 30 to 40 cents for each additional dollar they earn. Clearly, developing economies will be the dominant force underlying the growth in world agricultural production and trade. World commodity markets cannot be discussed without addressing China’s remarkable economic growth which has boosted the demand for many products. With annual growth rates of 10 percent or more in recent years, China has been the world’s fastest growing large economy. This trend is expected to continue for the foreseeable future, albeit at a slightly slower growth rate. China’s imports of raw materials and agricultural products have increased dramatically. Thus, China’s booming economy is contributing to stronger world prices for major commodities, such as crude oil (Figure 3) and building materials. At the same time, China is using much of the world’s shipping capacity, which has boosted ocean freight rates to record levels in recent months.
World Corn Market Outlook Transformed by Ethanol
Corn based ethanol is expected to be the primary biofuel in the United States for the next several years. Despite expected increases in corn production in the United States and abroad, there is no doubt that the demand for corn to produce ethanol in the United States will drive U.S. and world commodity prices higher. With prospects for much stronger prices, U.S. corn producers, this past spring, indicated intentions to plant 90.5 million acres (36.6 million hectares) to corn, the largest corn area since 1944, and 16 percent more than 2006/07 (Figure 4).
Assuming this year’s intended acreage is realized and summer weather supports a national average trend yield around 150 bushels per acre, 2007 production is expected to increase about 2 billion bushels from 2006’s production of 10.5 billion (267.6 million metric tons) (Figure 5). At 12.5 billion bushels (316.5 mmt), this year’s production would far exceed 2004’s record of 11.8 billion bushels (299.9 mmt). Supplies for 2007/08 would be a record 13.5 billion bushels (342.0 mmt), up 950 million bushels (24.1 mmt) from 2006/07 and 225 million (5.7 mmt) higher than the previous record in 2005/06.
Yet, despite expected area, yield, and production gains in the United States, year-end U.S. corn stocks will remain relatively tight at less than 1 billion bushels (25.1 mmt). Thus, corn prices are expected to rise to record levels in 2007/08 and remain strong for the foreseeable future. This is because U.S. corn use is expected to increase rapidly as the demand for corn for ethanol production grows.
2

Ethanol Corn Use Expands Rapidly
The U.S. Congress has mandated that U.S. gasoline consumption must include 7.5 billion gallons of renewable fuel by calendar year 2012. However, the current pace of plant construction and expansion indicates that ethanol production capacity will exceed 7.5 billion gallons early in the 2007/08 marketing year, 5 years faster than required by the mandate (Figure 6). Corn use for ethanol is being driven by profitability in the ethanol sector which has contributed to the unprecedented expansion in ethanol production capacity.
As of today, U.S. ethanol production capacity is about 6.2 billion gallons annually. Plants under construction and plant expansions will add an additional 6.4 billion gallons capacity during the next 18 to 24 months, bringing annual production capacity to 12.6 billion gallons (Figure 7). U.S. corn use in 2007/08 will be dominated by growth in domestic use as corn based ethanol production grows at a record pace. Total corn use, including exports, is expected to increase 8 percent in 2007/08. Thus, total use will approximately match total production (Figure 8.). Domestic corn use is expected to increase by 12 percent in 2007/08. Higher corn use for ethanol will more than offset reductions in corn feeding and exports during this period.
Corn ethanol use is projected at 2.15 billion bushels (54.6 mmt) for the 2006/07 marketing year, the equivalent of 5.8 billion gallons of ethanol. Corn use for ethanol is projected at 3.4 billion bushels (86.4 mmt) for 2007/08, an increase of 58 percent from 2006/07, and the equivalent of 9.3 billion gallons of ethanol.
Corn use for ethanol is expected to continue its rapid expansion through 2010 when ethanol production reaches about 7.5 percent of total U.S. blended motor gasoline consumption (Figure 9). At this point, restrictions on the ability of the U.S. automobile fleet to use higher ethanol blends limits ethanol demand growth to a rate consistent with growth in gasoline use.
Corn Ending Stocks Remain Relatively Tight and Prices Strong
As growth in corn demand for ethanol production slows and yield gains boost production, ending stocks will once again grow at modest rates. However, during the next several years, projections for U.S. corn supplies and use indicate a relatively tight stocks situation will continue. Ending stocks are expected to increase very modestly in 2007/08, rising just 1 percent despite the large expected increase in production.
The tight stocks situation is expected to keep upward pressure on corn prices during the next few years. The season-average farm price is projected to rise to $3.40 per bushel ($134/mt) in 2007/08, up $0.35 ($14/mt) from 2006/07 (Figure 10.). Farm prices are expected to remain at or above the mid $3-per-bushel level over the next several years as

demand for biofuels support corn prices long-term even with substantial expansion in corn production.
Some Users Priced Out of Corn Market
Domestic corn feeding is expected to decline modestly over the next few years as ethanol production expands at a rapid pace (Figure 11). The decline will be partly offset by more wheat feeding and increased feeding of distillers’ grains, a co-product of ethanol production. Growth in dairy, livestock, and poultry production is expected to be limited as these sectors adjust to higher feed costs. However, after a few years, dairy and meat production are expected to increase more rapidly in response to increased product prices.
In the near term, the biggest decline in U.S. corn use is expected in exports as ethanol producers outbid some foreign buyers for available supplies. U.S. corn exports are expected to decline 8 percent in 2007/08 and fall again in 2008/09 as tighter supplies and higher prices limit demand for U.S. corn (Figure 12). Record crops in South America are also expected to increase competition for U.S. exports during this period.
U.S. Corn Exports to Begin Recovery in 2010/11
U.S. exports will begin to rise again in 2010/11, much as with domestic corn feeding, as the growth in corn use for ethanol production slows and yield gains boost supplies at a rate faster than demand growth. This will allow stocks to build slightly and prices to ease modestly setting the stage for resumed growth in corn exports and feeding at the beginning of the next decade.
World Coarse Grain Production Responds to Strong Demand and Higher Prices
The impact of higher prices is not limited to corn. Grain producers around the world are responding to higher price prospects. USDA currently projects 2007/08 global wheat production at 610 million tons, up 3 percent from 2006/07. However, despite the expected increase in production and slightly lower projected world consumption for 2007/08, lower beginning stocks and a small expected increase in exports will leave world ending stocks down 8 percent from 2006/07, the lowest level in 30 years.
World coarse grain production is also expected to rise in 2007/08 as producers respond globally to higher prices, especially for corn. USDA projects 2007/08 global coarse grain production at a record 1.1 billion tons, up 8 percent from 2006/07 with rising corn production in the United States accounting for much of this increase. Corn production is also expected to rise to record levels in Argentina and Brazil. Despite higher world coarse grain output, lower beginning stocks and rising consumption are expected to reduce world stocks 3 percent in 2007/08. Global coarse grain ending stocks are expected to fall to their lowest level since 1976/77.
4

Remarkable Growth in China’s Corn Output
USDA currently projects China’s combined wheat and coarse grains output for 2007/08 nearly unchanged from 2006/07. China’s wheat production, at 100 million tons, is projected down 3 percent while coarse grain production, at 154 million tons, is projected up 2 percent. As in the United States, China’s coarse grain production is driven by expanding corn production. USDA projects China’s 2007/08 corn output at 146 million tons, up 2 percent from the current year as China’s farmers also respond to increased demand and higher prices.
Increases in China’s corn production have been extraordinary in recent years as crop area and yields have both risen. Based on USDA’s current estimates and 2007/08 forecast, China’s corn output will average around 140 million tons per year for the period 2004/05 through 2007/08. This compares to 114 million tons per year for the prior 4-year period. Thus, in just 4 years, China added, on average, 25 million tons per year or a total of 100 million tons to this country’s available corn supplies, a remarkable achievement made possible, in part, by favorable weather.
China to Become Net Corn Importer
USDA projects that China’s domestic corn use will increase 3 percent in 2007/08, outpacing the rise in production (Figure 13). Increased domestic use has been driven by strong growth in industrial corn use with feed use growing at a somewhat slower pace. China’s corn exports have become relatively stable in the past 2 years while stocks have been drawn down. As a result, USDA expects that China will become a net importer within the next 5 years as domestic feeding and industrial corn use continue to grow and stocks continue to decline. The long-expected shift of China from corn exporter to importer status has been forestalled by China’s remarkable production gains. Given the unpredictability of weather, this may or may not continue.
Record World Soybean Production in 2006/07
Global soybean production reached a record 235 million tons in 2006/07, up almost 15 million tons from the previous record set in 2004/05. Production increases were reported in most of the major producing countries. Planted area in Brazil declined for the second consecutive year as producers reacted to financial difficulties, previous droughts, higher input costs, and relatively low prices at planting time. In Argentina, increased planted area partially offset area reductions in Brazil. This in combination with excellent weather in Brazil, Argentina, and Paraguay, resulted in a record South American soybean crop. South American soybean production increased 10 percent, or 10 million tons. In the United States, higher planted area and good yields also produced a record crop of 87 million tons. While planted area in China was down slightly, good yields produced a crop just slightly below the prior year.
Global Soybean Production to Decline in 2007/08
As with corn, the world oilseeds outlook for 2007/08 and beyond will be strongly influenced by the expanding use of agricultural commodities as a source of energy. This year, both corn and soybean prices have risen sharply. In the United States, the rapid rise in the use of corn to produce ethanol has caused corn prices to increase relatively more, leading to an unprecedented shift in planted acres from soybeans to corn. This past spring, U.S soybean producers indicated plans to reduce planted area by 11 percent, or 8.4 million acres (Figure 14). In addition, the expanded use of biodiesel around the world, especially in Europe and the United States, is having a dramatic impact on global vegetable oil markets. As a result, soybean and other vegetable prices have risen sharply.
Led by a projected 14 percent (12 million ton) decrease in U.S. soybean production, global soybean production is projected to decline 4.3 percent in 2007/08. With the exception of the drought year in 2003/04, this is the first year-to-year decline in more than a decade (Figure 15). This decline will more than offset modest gains for cottonseed, rapeseed, and sunflowerseed. Soybean planted area is expected to increase slightly in Brazil as higher prices partly offset grower concerns about unfavorable exchange rates. Production for Brazil likely will increase modestly based on higher planted area and trend yields. Argentine soybean area and production also is expected to increase slightly, despite strong corn prices.
World Soybean Trade in Transition
Since 2001, world trade has increased 37 percent and imports by China, the world’s leading soybean importer, have accounted for all of the increase including offsetting a small decline in the rest of the world. In only 6 years, China’s soybean imports have increased by 24 million tons, reflecting a sharp growth in protein meal consumption. China now accounts for almost one-half of global soybean imports (Figure 16).
Despite a relatively good soybean crop, China is expected to import a record 30 million tons this marketing year, as protein and vegetable oil demand continues to grow. How will the world continue to satisfy this growing demand (Figure 17)? Brazil and Argentina are expected to provide the answer. Since 2001, Brazil and Argentina combined have increased output of soybeans by 47 percent to a projected 108 million tons for 2007/08. Each country will have added about 17 million tons of production over that time period. Without the expansion in South America that coincided with the expansion in world soybean imports, especially in China, prices would have risen even more sharply and growth in consumption would have been much less.
China Soybean Imports to Continue Rising
Global protein meal consumption is expected to increase almost 4 percent in 2007/08, led by gains for soybean meal consumption. Once again, China will lead the growth with an expected 9 percent increase in soybean meal consumption. Although this figure may

seem high, lower production of other oilseeds will shift the burden to soybean meal to meet a projected 4 percent increase in total protein consumption in 2007/08.
For China, slightly lower planted soybean area (due to increases for corn) and average yields are expected to result in a 0.6 million ton decline in production in 2007/08 to 15.6 million tons. With total oilseed production projected down 2 percent, China’s imports are expected to rise once again to meet expanding vegetable oil and protein needs. China is expected to import a record 34.5 million tons of soybeans in the 2007/08 marketing year. Continuing the trend of recent years, China will account for 78 percent of the projected increase in world soybean trade, and its dependence on foreign sources for soybeans will approach 70 percent (Figure 18).
Industrial Use of Vegetable Oil Rising
Global vegetable oil consumption will increase about 4 percent this year. Much of the increase reflects higher industrial use in the European Union (EU) where growth has exceeded 10 percent in each of the past 3 years (Figure 19). Bio-diesel consumption in the EU is projected to reach 7 percent of global vegetable oil production in 2007/08. The phenomenal growth in EU vegetable oil consumption is playing a major role in pushing global vegetable oil prices to higher levels. The U.S. biodiesel market is also growing rapidly, increasing from virtually nothing just 5 years ago, to consuming a projected 17 percent of domestic soybean oil production in 2007/08 (Figure 20).
In addition, China’s per capita consumption of vegetable oil has increased as incomes have risen, and this trend is expected to continue. Overall, China’s vegetable oil consumption will grow about 4 percent this year and account for about 17 percent of the global increase. However, the increased consumption will come at a higher cost as industrialized countries like the EU and the United States expand their use of vegetable oils for industrial purposes. With China depending on foreign sources for about 90 percent of its vegetable oil supply (Figure 21), expanding industrial use of vegetable oils around the world will significantly impact the price that China and other importing countries must pay. A clear indication of this impact is that soybean oil prices have risen nearly 60 percent in the past 18 months despite record U.S. soybean oil stocks (Figures 22 and 23). This year the average U.S. soybean price will rise 11 percent from 2005/06 and likely increase another 13 percent in 2007/08. The impact of growing bioenergy use on crop prices is clearly dramatic.
Global Vegetable Oil Prices to Continue Rising
Global vegetable oil consumption is projected to increase 4 percent in 2007/08. This will be led by soybean and palm oils. China and EU are leading the growth, but for different reasons. Growth in China is due to increased use for human consumption while the EU increase is primarily due to increased biodiesel use. As global industrial use of vegetable oil rises to meet energy demands, vegetable oil price patterns will continue to reflect diesel and petroleum prices.
7

Now, as global energy markets consume an increasing share of crops, South America, especially Brazil, is expected to respond by cultivating additional cropland to meet the growing global demand for vegetable oil and protein. Continued strong commodity prices will be required to stimulate expanded production. Clearly, such prices are likely given the expanding role of bio-energy in the agricultural sector.
World and U.S. Cotton Markets Dependent on Demand by China
The U.S. and world cotton outlook for 2007/08 is driven to a large extent by China’s import demand. In recent years, world cotton consumption has increased sharply due to strong world economic growth and competitive cotton prices relative to synthetic fibers. In addition, the liberalization of quotas on textile trade which came to fruition in January 2005 under the World Trade Organization’s (WTO) Agreement on Textiles and Clothing (ATC) benefited countries whose textile exports had previously been restricted – especially China, India, and Pakistan.
World cotton production has kept pace with consumption growth, as better technology, especially the use of genetically engineered seeds, has raised yields and lowered production costs in several countries, notably China, India, and the United States, which are the world’s three largest cotton producers. At the same time, the persistence of high world supplies relative to use has held world cotton prices relatively flat, in contrast to the recent higher prices for corn, other grains, and oilseeds.
China is the world’s largest producer, consumer, and importer of cotton. Prospects for China’s imports – which have ranged from a low of 1.4 million tons to a high of 4.2 million tons during the past four seasons – dominate the world cotton outlook. China’s import demand is an especially important factor in the U.S. cotton outlook because the United States is the world’s largest cotton exporter and roughly half may be shipped to China.
Higher Corn Prices Reduce 2007 U.S. Cotton Planted Area and Production USDA’s March survey of cotton planting intentions showed prospective area down about 20 percent from last year. This would be the lowest U.S. cotton planted area since 1989. As with soybeans, the impact of renewable fuels and sharply higher corn prices are largely responsible for the year-to-year reduction in cotton area (Figure 24). Assuming normal weather conditions, U.S. production is forecast at 4.1 million tons, down 13 percent from the 2006 crop.
U.S. Cotton Supplies Up Despite Lower Production
Despite lower production, U.S. cotton supplies are likely to rise in 2007/08 due to much higher beginning stocks. U.S. stocks accumulated during 2006/07 due to declines in both domestic mill use and exports. The resulting stocks of about 2.1 million tons constitute the largest U.S. stock level in more than 40 years
8

U.S. Export Situation and Outlook
Domestic consumption of cotton in the United States has declined sharply in recent years with the loss of most of its domestic apparel industry to foreign countries. Currently, nearly all of the cotton spun in the United States is shipped to Mexico, Central America, or the Caribbean region in the form of yarn or other intermediate products for final processing. With domestic use now accounting for one-fourth or less of total U.S. cotton disappearance, the U.S. cotton outlook is highly dependent on the export market.
In 2006/07, U.S. exports have dropped sharply from the previous year largely because of reduced imports by China. While China’s supply-demand situation is uncertain, it appears that imports this season have been lower because of: (1) larger-than-average stocks which accumulated during the 2005/06 marketing year; and (2) government polices which have placed stricter controls on cotton imports in order to encourage the use of domestically produced cotton.
It also should be noted that the United States has lost market share this marketing year in China due to: (1) the emergence of exportable surpluses in India (Figure 25); and (2) the termination of the Step 2 Program. Large crops produced in India for 2004 through 2006 generated significantly larger exportable supplies, and India became a major source of Chinese imports in 2006/07. Also, the U.S. Step 2 Program was eliminated last August in compliance with the WTO ruling in the case brought by Brazil. With the loss of Step 2 payments, U.S. cotton was not competitive with Indian and some other world cotton growths until late in the season.
For 2007/08, China’s cotton production is projected to be about the same as last season’s 6.7 million tons. With stable production and consumption expected to rise 8 percent, China’s import requirements are forecast to rise nearly 45 percent, reaching 3.7 million tons.
Production increases in countries other than the United States and China will raise production slightly, offsetting the projected decrease in the U.S. crop. However, stocks in these countries are being drawn down in the 2006/07 season. Thus, exportable supplies outside the United States are not expected to increase. In the U.S., however, large beginning stocks will give the U.S. an early-season supply advantage. Therefore, U.S. cotton exports are projected to rise nearly one-third, to 3.8 million tons in 2007/08 due to a combination of strong foreign import demand, especially here in China, and large U.S. exportable supplies (Figure 26).
How Does WAOB Do Its Job?
The conference organizers asked for a brief description of how the World Agricultural Outlook Board develops the global supply and demand information it publishes. The Board is a unit of USDA’s Office of the Chief Economist. WAOB’s primary mission is to coordinate, review, and approve USDA’s monthly WASDE report. The WASDE report provides USDA’s comprehensive forecasts of supply and demand for
9

major U.S. and foreign crops and U.S. livestock. It is WAOB’s responsibility to assure that USDA’s analysis is accurate, timely, and objective; and promptly delivered to farmers and ranchers, policy makers, and the public. The monthly WASDE report sets the official numbers for more than 100 other USDA outlook-oriented reports released each year by the Economic Research Service and the Foreign Agricultural Service.
Preparation of the WASDE report is a department-wide effort involving hundreds of USDA analysts. Figure 27 illustrates the organizational structure of USDA’s situation and outlook program. The Secretary of Agriculture authorized the Chairman of the World Agricultural Outlook Board to establish Interagency Commodity Estimates Committees (ICECs) for the purpose of bringing together analysts from key agencies to develop the U.S. government’s official supply and demand estimates for major agricultural crops. The Board accomplishes this by building a consensus among participating agencies with respect to any given estimate or forecast. It is important to note that this process must be free of specific agency agenda or political biases.
The flow of information through USDA’s economic information system is shown in Figure 28. To bring all relevant information together on a monthly basis, the Board chairs the ICECs that are comprised of representatives from several key USDA agencies. There are separate ICECs for wheat, rice, feed grains, oilseeds, cotton, sugar, meat animals, poultry, and dairy. These committees compile and interpret information from USDA and other domestic and foreign official sources to produce the monthly WASDE report.
The ICECs rely on attaché reports provided by the Foreign Agricultural Service (FAS); economic analysis provided by the Economic Research Service (ERS); market information provided by the Agricultural Marketing Service (AMS); domestic crop, livestock, and stocks estimates provided by the National Agricultural Statistics Service (NASS); domestic policy analysis provided by the Farm Service Agency (FSA); and weather analysis provided by the Joint Agricultural Weather Facility.
The primary information sources used by the ICECs include attaché reports, official country reports, travel reports, economic analyses, remote sensing, and weather analyses. It should be noted that continuous global weather monitoring is critical to assessing prospects for crop and livestock production and prices. WAOB manages the Joint Agricultural Weather Facility (JAWF) which is staffed by meteorologists from the National Oceanic and Atmospheric Administration of the U.S. Department of Commerce and agricultural meteorologists from USDA. JAWF monitors the weather and assesses its likely impact on crops around the world. JAWF meteorologists review current reports daily from nearly 8,000 weather stations worldwide, weather satellites, and other sources to provide an early warning of conditions affecting agricultural production around the globe.
The WASDE report is prepared in secured, “lock-up” conditions to assure its integrity and prevent premature release of market sensitive information. Once analysts enter the secured area, they are unable to communicate with the outside world. Doors and
10

windows are shut and locked, and all means of communication out of the facility are blocked until the report is released at 8:30 a.m. Eastern Time, about 2 hours before major U.S. commodity markets open.
The World Board relies on the latest computer-based techniques to gather, analyze, and deliver forecasts rapidly to the public. At the scheduled release time, reports are issued electronically, making them immediately and freely available to anyone in the world who has access to the Internet.
Concluding Remarks
World commodity markets thrive on information and transparency for efficient decision-making and pricing. As world trade has expanded, and producers and consumers in the United States and China have become increasingly dependent on developments in foreign countries, this has become even more important.
Three years ago when you gave me the privilege of participating in this important conference, I encouraged the government of China to publish grain, oilseed, and cotton stocks estimates similar to those published by the government of the United States. USDA applauds the progress China has made in recent years in making more commodity information available to world markets. However, world markets need even more information from China.
At present, China does not have an organization comparable to the World Agricultural Outlook Board. Thus, China has no agency which is responsible for assembling China’s official commodity supply and demand information in one place. Thus, supply and demand numbers are released by various organizations in China in piecemeal fashion and may not balance. This, in turn, creates uncertainty in world markets. Without a clearance mechanism in the United States such as the World Agricultural Outlook Board, we too would have a similar problem.
From my perspective, it would seem more appropriate for the rest of the world to have the benefit of official balance sheets produced by China rather than relying solely on market speculation prepared by foreign analysts. Not only would improved information benefit the rest of the world, it also would benefit China’s agricultural sector and consumers. On the one hand, improved market information and natural market forces would help reduce burdensome commodity surpluses in China that result in low market prices and high government costs. On the other hand, improved information and natural market forces would help avoid critical shortages in China that alarm consumers and result in inflationary price pressures. In short, more commodity information from China would lead to better business decisions and greater price stability both here and worldwide.
Again, I wish to thank you for giving me the honor of speaking here again.
11

Appendix A
Table 1. Corn supply and use for China, United States, and the World
Item 2003/2004 2004/2005 2005/20062006/2007 estimate
2007/2008 projection
ChinaMillion hectares
Area harvested 24.07 25.45 26.36 27.00 27.60Tons per hectare
Yield 4.81 5.12 5.29 5.30 5.29Million tons
Beginning Stocks 64.97 44.85 36.56 35.26 30.86Production 115.83 130.29 139.37 143.00 146.00Imports 0.00 0.00 0.06 0.10 0.10Total Supply 180.81 175.14 175.98 178.36 176.96
Feed Use 97.00 98.00 101.00 103.00 105.00FSI Use 31.40 33.00 36.00 40.00 43.00Domestic use 128.40 131.00 137.00 143.00 148.00Exports 7.55 7.59 3.73 4.50 3.00Total Use 135.95 138.59 140.73 147.50 151.00
Ending Stocks 44.85 36.56 35.26 30.86 25.96Percent
Stocks/Use Ratio 32.99 26.38 25.05 20.92 17.19
United StatesMillion hectares
Area harvested 28.71 29.80 30.40 28.59 33.56Tons per hectare
Yield 8.93 10.06 9.29 9.36 9.43Million tons
Beginning Stocks 27.60 24.34 53.70 49.97 25.07Production 256.28 299.91 282.31 267.60 316.50Imports 0.36 0.28 0.23 0.25 0.38Total Supply 284.24 324.53 336.24 317.82 341.95
Feed Use 147.20 156.43 156.00 148.60 144.79FSI Use 64.45 68.22 75.73 89.54 121.67Domestic use 211.64 224.65 231.72 238.14 266.46Exports 48.26 46.18 54.55 54.61 50.17Total Use 259.90 270.83 286.27 292.75 316.63
Ending Stocks 24.34 53.70 49.97 25.07 25.33Percent
Stocks/Use Ratio 9.36 19.83 17.46 8.56 8.00
12

Appendix A
Table 1. Corn supply and use for China, United States, and the World -- Continued
Item 2003/2004 2004/2005 2005/20062006/2007 estimate
2007/2008 projection
WorldMillion hectares
Area harvested 142.03 144.92 145.60 148.48 158.69Tons per hectare
Yield 4.41 4.93 4.78 4.71 4.84Million tons
Beginning Stocks 125.59 103.89 130.67 122.42 94.68Production 627.03 714.49 695.94 699.32 767.96Imports 76.38 76.60 79.24 83.25 82.33Total Supply 828.99 894.98 905.85 904.99 944.97
Feed Use 444.96 472.95 475.72 475.98 484.13FSI Use 202.87 213.72 226.46 247.41 285.92Domestic use 647.83 686.67 702.19 723.39 770.05Exports 77.28 77.64 81.24 86.93 83.11Total Use 725.10 764.31 783.42 810.32 853.16
Ending Stocks 103.89 130.67 122.42 94.68 91.80Percent
Stocks/Use Ratio 14.33 17.10 15.63 11.68 10.76
13
Appendix A
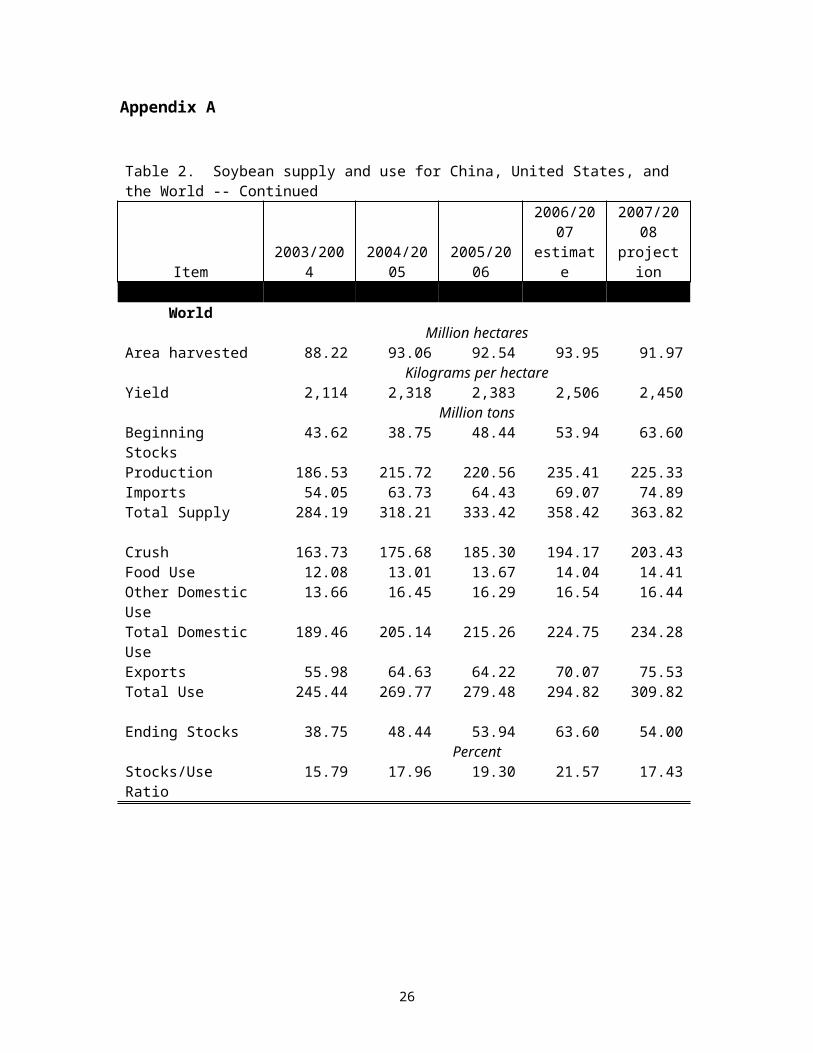
Table 2. Soybean supply and use for China, United States, and the World
Item 2003/2004 2004/2005 2005/20062006/2007 estimate
2007/2008 projection
ChinaMillion hectares
Area harvested 9.31 9.59 9.59 9.30 8.80Kilograms per hectare
Yield 1,653 1,814 1,705 1,742 1,773Million tons
Beginning Stocks 4.47 2.10 4.70 4.47 3.43Production 15.39 17.40 16.35 16.20 15.60Imports 16.93 25.80 28.32 30.00 34.50Total Supply 36.79 45.30 49.37 50.67 53.53
Crush 25.44 30.36 34.50 36.70 39.70Food Use 7.21 8.00 8.30 8.45 8.55Other Domestic Use 1.73 1.85 1.74 1.70 1.75Total Domestic Use 34.38 40.21 44.54 46.85 50.00Exports 0.32 0.39 0.35 0.39 0.45Total Use 34.69 40.60 44.89 47.24 50.45
Ending Stocks 2.10 4.70 4.47 3.43 3.08Percent
Stocks/Use Ratio 6.05 11.58 9.96 7.27 6.11
United StatesMillion hectares
Area harvested 29.33 29.93 28.83 30.19 26.75Kilograms per hectare
Yield 2,277 2,840 2,891 2,874 2,793Million tons
Beginning Stocks 4.85 3.06 6.96 12.23 16.59Production 66.78 85.01 83.37 86.77 74.71Imports 0.15 0.15 0.09 0.11 0.11Total Supply 71.78 88.22 90.42 99.11 91.41
Crush 41.63 46.16 47.32 48.17 48.72Food Use 0.00 0.00 0.00 0.00 0.00Other Domestic Use 2.96 5.24 5.09 4.95 4.60Total Domestic Use 44.60 51.40 52.41 53.12 53.31Exports 24.13 29.86 25.78 29.39 29.39Total Use 68.72 81.26 78.19 82.52 82.71
Ending Stocks 3.06 6.96 12.23 16.59 8.70Percent
Stocks/Use Ratio 4.45 8.56 15.64 20.11 10.52
14
Appendix A
Table 2. Soybean supply and use for China, United States, and the World -- Continued
Item 2003/2004 2004/2005 2005/20062006/2007 estimate
2007/2008 projection
WorldMillion hectares
Area harvested 88.22 93.06 92.54 93.95 91.97Kilograms per hectare
Yield 2,114 2,318 2,383 2,506 2,450Million tons
Beginning Stocks 43.62 38.75 48.44 53.94 63.60Production 186.53 215.72 220.56 235.41 225.33Imports 54.05 63.73 64.43 69.07 74.89Total Supply 284.19 318.21 333.42 358.42 363.82
Crush 163.73 175.68 185.30 194.17 203.43Food Use 12.08 13.01 13.67 14.04 14.41Other Domestic Use 13.66 16.45 16.29 16.54 16.44Total Domestic Use 189.46 205.14 215.26 224.75 234.28Exports 55.98 64.63 64.22 70.07 75.53Total Use 245.44 269.77 279.48 294.82 309.82
Ending Stocks 38.75 48.44 53.94 63.60 54.00Percent
Stocks/Use Ratio 15.79 17.96 19.30 21.57 17.43
15

Appendix A
Table 3. Cotton supply and use for China, United States, and the World
Item 2003/2004 2004/2005 2005/20062006/2007 estimate
2007/2008 projection
ChinaMillion hectares
Area harvested 5.11 5.69 5.06 5.40 5.50Kilograms per hectare
Yield 950 1,110 1,127 1,246 1,227Million tons
Beginning Stocks 3.27 3.26 2.84 3.70 3.18Production 4.86 6.31 5.70 6.73 6.75Imports 1.92 1.39 4.20 2.56 3.70Total Supply 10.04 10.96 12.75 12.99 13.63
Domestic Use 6.97 8.38 9.80 10.89 11.76Loss -0.22 -0.27 -0.76 -1.09 -1.31Exports 0.04 0.01 0.01 0.02 0.01Total Use 6.79 8.12 9.04 9.81 10.46
Ending Stocks 3.26 2.84 3.70 3.18 3.16Percent
Stocks/Use Ratio 47.98 35.04 40.95 32.36 30.25
United StatesMillion hectares
Area harvested 4.86 5.28 5.59 5.15 4.45Kilograms per hectare
Yield 818 958 931 912 919Million tons
Beginning Stocks 1.17 0.75 1.20 1.32 2.13Production 3.97 5.06 5.20 4.70 4.09Imports 0.01 0.01 0.01 0.00 0.00Total Supply 5.16 5.82 6.40 6.02 6.23
Domestic Use 1.36 1.46 1.28 1.07 0.96Loss 0.05 0.02 -0.12 -0.01 0.00Exports 3.00 3.14 3.93 2.83 3.81Total Use 4.41 4.62 5.09 3.89 4.77
Ending Stocks 0.75 1.20 1.32 2.13 1.46Percent
Stocks/Use Ratio 17.05 25.88 25.90 54.89 30.57
16
Appendix A
Table 3. Cotton supply and use for China, United States, and the World -- continued
Item 2003/2004 2004/2005 2005/20062006/2007 estimate
2007/2008 projection
WorldMillion hectares
Area harvested 32.13 35.49 34.42 34.22 34.03Kilograms per hectare
Yield 646 737 723 743 741Million tons
Beginning Stocks 9.88 9.64 12.00 12.33 12.28Production 20.76 26.15 24.89 25.41 25.23Imports 7.41 7.28 9.59 8.23 9.17Total Supply 38.04 43.06 46.48 45.97 46.68
Domestic Use 21.34 23.70 25.29 26.68 27.74Loss -0.17 -0.24 -0.86 -1.06 -1.27Exports 7.23 7.61 9.71 8.08 9.05Total Use 28.41 31.07 34.14 33.69 35.52
Ending Stocks 9.64 12.00 12.33 12.28 11.15Percent
Stocks/Use Ratio 33.93 38.61 36.12 36.44 31.40
17
Appendix B
EMBED PowerPoint.Slide.8
1
45
50
55
60
65
70
75
2005 2007 2009 2011 2013 2015
$/Barrel
Oil Prices, Refinery Acquisition Price
Source: USDA Long-term Agricultural Projections to 2016, February 2007, http://www.usda.gov/oce/commodity/ag_baseline.htm.
Fig. 1. Oil prices, refinery acquisition price.
2
0
1
2
3
4
5
1990 1993 1996 1999 2002 2005 2008 2011 2014 2017
Percent
Source: USDA Long-term Agricultural Projections to 2016, February 2007, http://www.usda.gov/oce/commodity/ag_baseline.htm.
World Growth in Real Gross Domestic Product
Fig. 2. World real growth in gross domestic product.
Appendix B
3
China Oil Consumption and Oil Prices
2.0
3.0
4.0
5.0
6.0
7.0
8.0
2000 2001 2002 2003 2004 2005 2006 200715
25
35
45
55
65
75
China consumptionOil prices (West Texas Intermediate)
Million barrels per day Dollars per barrel
Source: Haver Analytics
Fig. 3. China oil consumption and oil prices.
4
65
70
75
80
85
90
95
1995 1997 1999 2001 2003 2005 2007F
Mil. acres
Note: 2007 planted area based on early season farmer intentions reported in Prospective Plantings, March 30,2007.
U.S. Corn Planted Area1995 through 2007F
Fig. 4. U.S. corn planted area.

Appendix B
5
6
7
8
9
10
11
12
13
14
1995 1997 1999 2001 2003 2005 2007F
Bil. bushels
Note: 2007 production is projected based on the World Agricultural Supply and Demand Estimates, June 11, 2007.
U.S. Corn Production1995 through 2007F
Fig. 5. U.S. corn production, 1995-2007.
6
U.S. Ethanol Refineries
Fig. 6. U.S. ethanol refineries.

Appendix B
7
U.S. Ethanol Production CapacityAnnual Capacity by Month
0
2
4
6
8
10
12
14
Sep-06 Mar-07 Sep-07 Mar-08 Sep-08
Bil. Gallons
5.0
7.3
12.4
Fig. 7. U.S. ethanol production capacity, annual capacity by month.
8
7
8
9
10
11
12
13
14
1995/96 1997/98 1999/00 2001/02 2003/04 2005/06 2007/08F
Bil. bushels
Production Total use
Note: 2006/07 and 2007/08 supplies and uses are projected based on the World Agricultural Supply and Demand Estimates, June 11, 2007.
U.S. Corn Production and Total Use1995/96 through 2007/08F
Fig. 8. U.S. corn production and total use, 1995/96 - 2007/08.

Appendix B
9
0.0
0.5
1.0
1.5
2.0
2.5
3.0
3.5
4.0
4.5
5.0
1980/81 1985/86 1990/91 1995/96 2000/01 2005/06 2010/11F 2015/16F
Bil. bushels
0
5
10
15
20
25
30
35Percent
Ethanol corn use
Ethanol share of corn use
Note: 2006/07 through 2015/16 are projected based on the World Agricultural Supply and Demand Estimates, June 11, 2007, and the USDA Agricultural Projections to 2016, February 2007 .
U.S. Corn Used in Ethanol Production1995/96 through 2007/08F
Fig. 9. U.S. corn used in ethanol production, 1995/96 - 2007/08.
10
0.0
0.5
1.0
1.5
2.0
2.5
1995/96 1997/98 1999/00 2001/02 2003/04 2005/06 2007/08F
Bil. bushels
0.00
0.50
1.00
1.50
2.00
2.50
3.00
3.50
4.00$/bushel
Ending stocks
Average Farm Price
Note: 2006/07 and 2007/08 ending stocks and prices are projected based on the World Agricultural Supply and Demand Estimates, June 11, 2007.
U.S. Corn Ending Stocks and Farm Price1995/96 through 2007/08F
Fig. 10. U.S. corn ending stocks and farm price, 1995/96 - 2007/08.

Appendix B
11
0
2
4
6
8
10
12
1995/96 1997/98 1999/00 2001/02 2003/04 2005/06 2007/08F
Bil. bushelsOther food, seed, and industrial
Ethanol
Feed and residual
Note: 2006/07 and 2007/08 uses are projected based on the World Agricultural Supply and Demand Estimates, June 11, 2007.
U.S. Domestic Corn Use1995/96 through 2007/08F
Fig. 11. U.S. domestic corn use, 1995/96 - 2007/08.
12
1.00
1.25
1.50
1.75
2.00
2.25
2.50
1995/96 1997/98 1999/00 2001/02 2003/04 2005/06 2007/08F
Bil. bushels
Note: 2006/07 and 2007/08 exports are projected based on the World Agricultural Supply and Demand Estimates, June 11, 2007.
U.S. Corn Exports1995/96 through 2007/08F
Fig. 12. U.S. corn exports, 1995/96 - 2007/08.

Appendix B
13
80
90
100
110
120
130
140
150
160
1995 1997 1999 2001 2003 2005 2007F
Mil. Metric Tons
Production Consumption
Note: 2007/08 production is projected based on the World Agricultural Supply and Demand Estimates, June 11, 2007.
China Corn Production and Consumption1995 through 2007F
Fig. 13. China corn production and consumption, 1995 - 2007.
14
55
60
65
70
75
80
85
90
95
1991 1992 1993 1994 1995 1996 1997 1998 1999 2000 2001 2002 2003 2004 2005 2006 2007 2008 2009 2010
Mil. acres
Corn
Soybeans
Note: 2007 planted areas are projected based on the Prospective Plantings report, March 30, 2007, from 2008-10 from USDA Long-term Agricultural Projections to 2016
U.S. Planted Area, Corn and Soybeans1991 through 2010
Fig. 14. U.S. planted area, corn and soybeans, 1991 - 2010.

Appendix B
15
0
50
100
150
200
250
1991 1992 1993 1994 1995 1996 1997 1998 1999 2000 2001 2002 2003 2004 2005 2006 2007 2008 2009 2010
Mil. tons
Argentina
Brazil
U.S.
Soybean Production Trends1991 through 2010F
Note: 2007 production is projected based on the World Agricultural Supply and Demand Estimates, June 11, 2007, from 2008-10 from USDA Long-term Agricultural Projections to 2016
Fig. 15. Soybean production trends, 1991 - 2010.
16
0
10
20
30
40
50
60
70
80
1991 1992 1993 1994 1995 1996 1997 1998 1999 2000 2001 2002 2003 2004 2005 2006 2007
Mil. tons
China
Rest of World
Note: 2006/07 and 2007/08 are projected based on the World Agricultural Supply and Demand Estimates, June 11, 2007.
China and Global Soybean Imports1991 through 2007F
Fig. 16. China and global soybean imports, 1991 - 2007.
Appendix B
17
0
5
10
15
20
25
30
1995 1996 1997 1998 1999 2000 2001 2002 2003 2004 2005 2006
Mil. tons
OtherArgentinaBrazilU.S.
China Soybean Imports by Source1991 through 2006
Fig. 17. China soybean imports by source, 1991 - 2006.
18
China Soybean Import Dependence Expected to Increase
0
10
20
30
40
50
60
70
80
90
1991 1993 1995 1997 1999 2001 2003 2005 2007 2009 2011 2013 20150
10
20
30
40
50
60
70
80
Imports
Production
Import Dependence
Million Tons Percent
Fig. 18. China soybean import dependence expected to increase.

Appendix B
19
0
1
2
3
4
5
6
7
8
9
10
2001 2002 2003 2004 2005 2006 2007
Mil. tons
Other OilPalm OilSoybean OilRapeseed Oil
EU Industrial Use of Vegetable Oil2001 through 2007
7% of global vegetable oil production
Note: 2007 is projected based on the World Agricultural Supply and Demand Estimates, June 11, 2007.
Fig. 19. EU industrial use of vegetable oil, 2001 - 2007.
20
U.S. Biodeisel Production2000/01 through 2010/11F
0
100
200
300
400
500
600
700
800
2000/01 2002/03 2004/05 2006/07 2008/09 2010/11
Mil. gallons
0
5
10
15
20
25Percent
Biodiesel production
Share of soyoil production
Note: 2007 is projected based on the World Agricultural Supply and Demand Estimates, June 11, 2007, from 2008-10 from USDA Long-term Agricultural Projections to 2016
Fig. 20. U.S. biodeisel production, 2000/01 - 2010/11.

Appendix B
21
China Soybean Oil Consumption1991 through 2016
0
2
4
6
8
10
12
14
16
18
1991 1993 1995 1997 1999 2001 2003 2005 2007 2009 2011 2013 2015
Mil. gallons
0
10
20
30
40
50
60
70
80
90
100Percent
ConsumptionImport share (oil + beans)
Note: 2007 is projected based on the World Agricultural Supply and Demand Estimates, June 11, 2007, from 2008-10 from USDA Long-term Agricultural Projections to 2016
Fig. 21. China soybean oil consumption, 1991 - 2016.
22
22
24
26
28
30
32
34
36
38
Jan-06
Feb-06
Mar-06
Apr-06
May-06
Jun-06
Jul-06
Aug-06
Sep-06
Oct-06
Nov-06
Dec-06
Jan-07
Feb-07
Mar-07
Apr-07
May-07
Jun-07
Cents per pound
Soybean Oil Futures PricesDecember 2007 contract
Fig. 22. Soybean oil futures prices, December 2007 contract.

Appendix B
23
Record U.S. Soybean Oil Stocks
0.00
0.25
0.50
0.75
1.00
1.25
1.50
1991 1992 1993 1994 1995 1996 1997 1998 1999 2000 2001 2002 2003 2004 2005 2006 2007
Million tonsSoybean oil stocks reach new record
Note: 2007 is projected based on the World Agricultural Supply and Demand Estimates, June 11, 2007.
Fig. 23. Record U.S. soybean oil stocks.
24
U.S. Cotton Planted Area and Production 2003 – 2007F
Note: 2007 is projected based on the World Agricultural Supply and Demand Estimates, June 11, 2007.
0
1
2
3
4
5
6
7
2003 2004 2005 2006 2007F
Area
Production
Million hectares and million tons
Fig. 24. U.S. cotton planted area and production, 2003 - 2007.

Appendix B
25
India Cotton Production and Exportable Supply2003 – 2007F
Note: 2007 is projected based on the World Agricultural Supply and Demand Estimates, June 11, 2007. Exportable supply is total supply minus domestic consumption.
0
1
2
3
4
5
6
2003/04 2004/05 2005/06 2006/07 2007/08 proj.
Production Exportable supply
Million tons
Fig. 25. India cotton production and exportable supply, 2003 - 2007.
26
China Cotton Imports and U.S. Exports2003 – 2007F
Note: 2007 is projected based on the World Agricultural Supply and Demand Estimates, June 11, 2007. Exportable supply is total supply minus domestic consumption.
0
1
1
2
2
3
3
4
4
5
2003/04 2004/05 2005/06 2006/07 2007/08 proj.
China Imports U.S. exports
Million tons
Fig. 26. China cotton imports and U.S. exports, 2003 - 2007.

Appendix B
27
Interagency Agricultural Projections Coordinator
Chief Economist
Secretary/Deputy Secretary
USDA Situation and Outlook Organizational Structure
WAOB Chairperson
Chief Meteorologist/Joint Agricultural Weather Facility
Grains OilseedsLivestock Fibers Specialty Crops
Interagency Commodity Estimates CommitteesChaired by WAOB Senior Analysts
Fig. 27. USDA situation and outlook organizational structure.
28
USDA’s Economic Information System
Farm Service Agency
Joint Agricultural
Weather Facility
Foreign Agricultural
Service
Economic Research Service
National Agricultural
Statistics Service
ERS Situation and Outlook
Reports
Weekly Weatherand
Crop Bulletin
World Agricultural
Outlook BoardDomestic
Production and Stocks Estimates
World Agricultural Supply and
Demand EstimatesFAS
Commodity Circulars
Long-term Baseline
Projections
Fig. 28. USDA’s economic information system.