The Other Environmental Regulators - Good Jobs First
24
MARCH 2021 The Other Environmental Regulators How States Unevenly Enforce Pollution Laws
Transcript of The Other Environmental Regulators - Good Jobs First

M A R C H 2 0 2 1
The Other Environmental
Regulators How States Unevenly
Enforce Pollution Laws
Philip Mattera and Anthony Kay Baggaley
March 2021Corporate Research Project of Good Jobs First
Washington DC wwwcorp-researchorg wwwgoodjobsfirstorg
copyCopyright 2021 by Good Jobs First
The Other Environmental
Regulators How States Unevenly
Enforce Pollution Laws
TABLE OF CONTENTS
Executive Summary 2
Introduction The Evolution of Environmental Federalism 4
Findings 6
State Caseloads 7
State Penalty Totals 10
Trends Over Time 10
Violation Categories 11
Largest Cases 12
Largest Parent Penalty Totals 13
Parents with Far-Flung Violations 14
Foreign Parents 14
Parent Industry Totals 15
Conclusion and Policy Recommendations 16
Methodology 17
Appendix Case Totals for Environmental Agencies and State Attorneys General 18
Endnotes 21
THE OTHER ENVIRONMENTAL REGULATORS HOW STATES UNEVENLY ENFORCE POLLUTION LAWS 1goodjobsfirstorg
EXECUT IVE SUMMARY
Over the past two decades state regulatory agencies and attorneys general have brought more than 50000 enforcement actions against private sector entities for violations of clean air clean water and other environmental laws--collecting more than $20 billion in fines settlements and other payments Enforcement activity diverges widely from one state to another with some surprises
Texas which has a reputation for being anti-regulation has reported far more environmental penalty cases than any other state Mississippi is first in total penalty dollars mainly because of a single settlement with BP stemming from the 2010 Deepwater Horizon disaster in the Gulf of Mexico
These are among the findings from a compilation of state environmental data by the Corporate Research Project of Good Jobs First from agency websites and some 90 open records requests This is the first time such data has been compiled and published online the 52000 records come from a total of 104 state agencies and attorney general offices
Along with this report the data is being incorporated into our Violation Tracker database which has included cases from the US Environmental Protection Agency and other federal agencies since its first iteration in 2015 The addition of the new data is meant to highlight the fact that environmental enforcement is a responsibility shared by federal and state agencies
Compiling cases since January 1 2000 with penalties of $5000 or more that could be accessed through agency websites or open records requests we find that
bull Nineteen states have handled 1000 or more cases since 2000 led by Texas (9509) Pennsylvania (4294) California (3571) New Jersey (3002) Florida (2432) and Kentucky (2091) By contrast fewer than 100 cases could be found for Arkansas Kansas Nevada and Oklahoma
bull Mississippi ranks first in total environmental penalties at $15 billion It is followed by California ($11 billion) New Jersey ($993 million) North Carolina ($959 million) Minnesota ($895 million) and Texas ($810 million)
bull More than half of the $21 billion collected by the states came via lawsuits brought by groups of attorneys general targeting individual large corporations such as BP Volkswagen and American Electric Power
bull The oil and gas industry accounts for far more in penalties that any other sector of the economy with $82 billion in fines and
THE OTHER ENVIRONMENTAL REGULATORS HOW STATES UNEVENLY ENFORCE POLLUTION LAWS 2goodjobsfirstorg
settlements since 2000 Utilities and other power generation firms rank second among industries with a total of $6 billion The motor vehicles sector comes in third with $12 billion
bull The industry amounts reflect the result massive penalty totals for various mega-corporations in those sectors The most penalized company is BP at $66 billion followed by American Electric Power ($47 billion) Volkswagen ($1 billion) and Duke Energy ($895 million)
bull The worst repeat offender is Exxon Mobil with 272 cases more than that of any other parent company It is followed by pipeline company Energy Transfer (172) chemical producer LyondellBasell Industries (168) coal company James C Justice Companies (155) petroleum producer Valero Energy (152) and the diversified Koch Industries (150)
bull Exxon Mobil has paid penalties in 24 different states as has Berkshire Hathaway through its numerous subsidiaries They are surpassed only by the waste management company Clean Harbors Inc which has paid penalties in 37 states
Congress long ago decided that states should share in the responsibility of enforcing laws such as the Clean Air Act and the Clean Water Act Under that arrangement variations in enforcement caseloads and penalty totals should reflect only the relative level and nature of business activity in the various states Instead it now appears that some states are not taking their enforcement responsibilities seriously
Evaluating relative state performance is made more difficult by the utter lack of consistency in the ways the states report on their enforcement activity Numerous states do not provide comprehensive case data on their agency websites Most of these did provide the information in response to our open records requests but two state agencies failed to provide either form of disclosure the Kansas Department of Health and Environment and the Oklahoma Department of Environmental Quality
We recommend that states be required to employ a standard form of online disclosure Absent that transparency should be provided by the EPA
THE OTHER ENVIRONMENTAL REGULATORS HOW STATES UNEVENLY ENFORCE POLLUTION LAWS 3goodjobsfirstorg
INTRODUCT ION THE EVOLUT ION OF ENV IRONMENTAL FEDERAL ISM
In nearly all debates over environmental regulation the entity that tends to be the center of attention is the federal governmentrsquos Environmental Protection Agency Frequently overlooked is the fact that the countryrsquos enforcement system is actually divided between the EPA and the states This shared responsibility which in the academic literature is known as environmental federalism dates back decades and has at times been a source of tension between levels of government1
Prior to the late 1940s the federal government played a limited role in protecting the environment There was a long tradition of federal involvement in the protection of public lands and the creation of the National Park System but the regulation of pollutionmdashto the extent that such oversight existedmdashwas assumed to be the province of local and state governments
Federal involvement started to emerge with the passage of the Federal Water Pollution Act of 1948 though it was limited to doing research and providing grants to state water programs The assumption that states would take the lead was also incorporated in 1955 legislation that authorized federal research on air pollution
By the 1960s there was growing concern at the federal level that states were not doing enough That decade saw the passage of a series of laws such as the Water Quality Act of 1965 and the Air Quality Act of 1967 that began to set federal standards for state enforcement activities
The federal government assumed a much more significant role with the creation of the EPA in 1970 Congress then passed a series of lawsmdashincluding the Clean Air Act the Clean Water Act and the Toxic Substances Control Actmdashin which the new agency was given primary responsibility for meeting the anti-pollution goals but allowed it to delegate enforcement authority to state agencies
Currently 44 states have been given implementation authority for all three major enforcement areas air water and hazardous waste The six other states and the District of Columbia have authority in two of the three areas2
THE OTHER ENVIRONMENTAL REGULATORS HOW STATES UNEVENLY ENFORCE POLLUTION LAWS 4goodjobsfirstorg
The enforcement authority of the states is not exclusive EPA headquarters and the agencyrsquos ten regional offices can and do bring enforcement actions themselves
These overlapping responsibilities have often been a source of tension between the EPA and state agencies Those at the federal level often complain about lax and inconsistent efforts by the states For example a 2011 report by the EPArsquos Office of Inspector General concluded that ldquostate enforcement programs frequently do not meet national goals and states do not always take necessary enforcement actionshellipAs a result EPArsquos enforcement program cannot assure equal and sufficient protection of human health and the environment to all US citizens or consistent enforcement of regulated entitiesrdquo3
States have their own complaints Some maintain that the EPArsquos policies are too rigid and have sought more flexibility in how they carry out their enforcement activities Others such as California have often argued that federal standards are not strict enough and have pushed more aggressive policies
In 1993 states agencies created the non-partisan Environmental Council of the States to defend their interests in dealings with the EPA including the State Review Framework through which the performance of the agencies is periodically evaluated4
The relationship between the EPA and the states is complicated by changes in federal administrations During the Trump years the EPA shifted its emphasis from enforcement (penalizing parties found to be in violation) to compliance (helping those parties avoid violations) The pendulum is expected to swing back under President Biden
The purpose of the current report is to examine the relative performance of the states with regard to their enforcement activitiesmdashspecifically their caseloads and the penalties they collect This analysis is based on what we believe to be the first comprehensive collection of case information from all 50 states and the District of Columbia
THE OTHER ENVIRONMENTAL REGULATORS HOW STATES UNEVENLY ENFORCE POLLUTION LAWS 5goodjobsfirstorg
F IND INGS
Over the past two decades state regulatory agencies and attorneys general have brought more than 50000 successful enforcement actions against private sector entities for violations of clean air clean water and other environmental laws Looking at cases with penalties of $5000 or more the states have collected about $21 billion in fines settlements and other payments
These figures come from a compilation of individual case details produced by the Corporate Research Project of Good Jobs First for our Violation Tracker database The information is taken from the websites of the enforcement agencies themselves or when it was not available online via open records requests submitted to the agencies See the Methodology section below for more on our data collection effort
Each state has an entity with a name such as Department of Environmental Quality or Department of Environmental Conservation Some have an additional agency covering a particular sector such as the Illinois Office of Mines and Minerals or the Colorado Oil amp Gas Conservation Commission California has five agencies -- the California Air Resources Board California Water Boards California Department of Toxic Substances Control California Department of Pesticide Regulation
and CalRecycle ndash under the umbrella of the California Environmental Protection Agency We collected data from a total of 65 environmental agencies that oversee private sector activity and that penalize companies for violations (see the Appendix for a full list)
State attorneys general are also involved in environmental enforcement to varying degrees Some participate only in major multistate lawsuits such as those brought against Volkswagen for emissions cheating Others also bring environmental cases on their own often on behalf of state agencies We collected details on a total of 1404 successful cases announced by AGs5 Combining the state agencies and the AGs that have brought cases on their own brings the number of enforcement entities whose cases are included in this report to 104
THE OTHER ENVIRONMENTAL REGULATORS HOW STATES UNEVENLY ENFORCE POLLUTION LAWS 6goodjobsfirstorg
State Caseloads
Looking only at actions with a fine or settlement of $5000 or more ndash the minimum for inclusion in Violation Tracker and this study ndash we see that state governments vary enormously in the extent to which they engage in environmental enforcement6
As shown in Table 1 four states ndash Arkansas Kansas Oklahoma and Nevada -- have handled fewer than 100 disclosed environmental cases since the beginning of 2000 while 19 states have handled 1000 or more during the same period
The median number of cases per state is 500 while the average jumps to 1022 largely because of the enormous volume handled by Texas Without Texas the state average is 853
The Lone Star Statersquos 9000-plus caseload comes from both the Texas Commission on Environmental Quality and the Railroad Commission of Texas The latter despite its name no longer regulates railroads and instead oversees activities such as petroleum pipelines and surface mining
The Railroad Commission has a reputation for being too cozy with the oil and gas industry but it still engages in basic enforcement imposing more than 2000 penalties over the past two decades7 The TCEQ has also been criticized for enforcement deficiencies but it manages to bring a large volume of cases8
By contrast we were able to document fewer than one dozen cases handled by the Department of Environmental Quality in the neighboring state of Oklahoma These came mostly from secondary sources we consulted
after finding that the agency posts almost no enforcement details online and it denied our open records request for a list of cases Oklahomarsquos less-than-aggressive approach to environmental enforcement came to national attention in December 2016 when Donald Trump chose the statersquos attorney general Scott Pruitt as his first director of the EPA Pruitt had repeatedly sued the agency to try to block initiatives on issues such as climate change
Differences in state caseloads are to be expected given variations in state population size and the number of business entities Yet the divergences go far beyond that The state with the most identified cases Texas comes in at more than 800 times that of Oklahoma the state with the fewest The population of Texas is only seven times that of Oklahoma9 The number of firms in Texas is six times the number in Oklahoma10
The ten states with the most cases handled a total of 31583 enforcement actions which is 39 times the total of the ten states with the fewest By contrast the total number of businesses in the ten states with the most firms is only 15 times the total in the ten states with the fewest
These numbers suggest that some states are simply more inclined to bring actions than others they have stronger cultures of enforcement The disposition toward enforcement does not necessarily correspond to the usual left-right divisions Among the states with the highest enforcement activity are both red Texas and Florida and blue California and New Jersey Those with the lowest levels of enforcement are mainly conservative but they also include liberal-trending Nevada
THE OTHER ENVIRONMENTAL REGULATORS HOW STATES UNEVENLY ENFORCE POLLUTION LAWS 7goodjobsfirstorg
Table 1 Penalty Data Since 2000 by State Ranked by Total Cases
Rank State Cases Penalty Total
1 Texas 9509 $809621213
2 Pennsylvania 4294 $343258501
3 California 3571 $1127704103
4 New Jersey 3002 $992964687
5 Florida 2432 $48177876
6 Kentucky 2091 $47974667
7 Tennessee 1844 $71350048
8 Indiana 1731 $57943682
9 Colorado 1613 $196792203
10 North Carolina 1496 $959207753
11 Oregon 1477 $39697609
12 South Carolina 1379 $24984579
13 Massachusetts 1372 $476902677
14 Georgia 1346 $23704492
15 Illinois 1279 $150716130
16 Alabama 1226 $52921660
17 Minnesota 1172 $895443551
18 Ohio 1148 $192955971
19 Virginia 1078 $84894067
20 Louisiana 733 $77494765
21 Washington 697 $136174555
22 Connecticut 647 $75941832
23 Arkansas 607 $11019649
24 Maryland 586 $65712408
25 New York 548 $121835750
26 Rhode Island 500 $26059007
Rank State Cases Penalty Total
27 Iowa 454 $48558761
28 Wyoming 422 $43300053
29 Mississippi 371 $1513691105
30 Wisconsin 333 $34161459
31 Michigan 318 $223121727
32 West Virginia 288 $18811573
33 Maine 279 $9260448
34 New Hampshire 271 $286166772
35 New Mexico 238 $130680865
36 Arizona 212 $169101653
37 Vermont 208 $35231119
38 Idaho 162 $3489720
39 Montana 152 $197904699
40 Missouri 149 $378846239
41 Utah 135 $14777109
42 District of Columbia 123 $58002778
43 Delaware 121 $18773649
44 Nebraska 111 $4883706
45 South Dakota 106 $2340551
46 Hawaii 101 $19516484
47 North Dakota 100 $37084401
48 Nevada 65 $3566738
49 Alaska 43 $11333055
50 Kansas 16 $602440
51 Oklahoma 11 $11849757
THE OTHER ENVIRONMENTAL REGULATORS HOW STATES UNEVENLY ENFORCE POLLUTION LAWS 8goodjobsfirstorg
Table 2 Penalty Data Since 2000 by State Ranked by Total Penalties
Rank State Penalty Total Cases
1 Mississippi $1513691105 371
2 California $1127704103 3571
3 New Jersey $992964687 3002
4 North Carolina $959207753 1496
5 Minnesota $895443551 1172
6 Texas $809621213 9509
7 Massachusetts $476902677 1372
8 Missouri $378846239 149
9 Pennsylvania $343258501 4294
10 New Hampshire $286166772 271
11 Michigan $223121727 318
12 Montana $197904699 152
13 Colorado $196792203 1613
14 Ohio $192955971 1148
15 Arizona $169101653 212
16 Illinois $150716130 1279
17 Washington $136174555 697
18 New Mexico $130680865 238
19 New York $121835750 548
20 Virginia $84894067 1078
21 Louisiana $77494765 733
22 Connecticut $75941832 647
23 Tennessee $71350048 1844
24 Maryland $65712408 586
25 District of Columbia $58002778 123
26 Indiana $57943682 1731
Rank State Penalty Total Cases
27 Alabama $52921660 1226
28 Iowa $48558761 454
29 Florida $48177876 2432
30 Kentucky $47974667 2091
31 Wyoming $43300053 422
32 Oregon $39697609 1477
33 North Dakota $37084401 100
34 Vermont $35231119 208
35 Wisconsin $34161459 333
36 Rhode Island $26059007 500
37 South Carolina $24984579 1379
38 Georgia $23704492 1346
39 Hawaii $19516484 101
40 West Virginia $18811573 288
41 Delaware $18773649 121
42 Utah $14777109 135
43 Oklahoma $11849757 11
44 Alaska $11333055 43
45 Arkansas $11019649 607
46 Maine $9260448 279
47 Nebraska $4883706 111
48 Nevada $3566738 65
49 Idaho $3489720 162
50 South Dakota $2340551 106
51 Kansas $602440 16
Note Does not include 72 multistate AG cases with total penalties of $112 billion
THE OTHER ENVIRONMENTAL REGULATORS HOW STATES UNEVENLY ENFORCE POLLUTION LAWS 9goodjobsfirstorg
State Penalty Totals
There is also a great deal of variation in the amounts collected by states in environmental fines and settlements It is worth noting that more than half of the $21 billion in penalties collected by states over the past two decades came from just 72 cases the multistate attorney general actions brought against large corporations such as BP Volkswagen and American Electric Power
Shares of the remaining $10 billion in penalties range from less than $1 million in the case of Kansas to more than $1 billion each for California and Mississippi California reached that total both through its heavy caseload of more than 3500 and large individual cases such as one in which it collected $119 million from Southern California Gas Company in connection with a major natural gas well leak
Mississippirsquos $15 billion penalty total higher than that of any other state is overwhelmingly derived from a single settlement with BP stemming from the 2010 Deepwater Horizon disaster in the Gulf of Mexico11
As shown in Table 2 six states collected less than $10 million each while 19 collected more than $100 million apiece The median penalty total is about $58 million while the average is raised to $204 million by the especially high sums in Mississippi and California as well as those in New Jersey North Carolina Minnesota and Texas
States also diverge in the amount they collect in individual cases especially those handled by the administrative agencies Average penalties above our threshold range from less than $20000 in Georgia South Carolina Arkansas and Florida to more than $2 million in Mississippi and Missouri The typical (median) state penalty average is $112000
Trends Over Time
The aggregate caseload of state environmental regulators has remained remarkably steady during the past two decades As shown in Table 3 the number of enforcement actions carried out across the country has been in a range from around 2000 to 3000 from 2002 to 2020
There has been more variation in the annual penalty dollar totals Since 2000 those totals have been as low as $161 million and in most years have been in a range from $180 million to $500 million but in three years penalties surpassed $1 billion In each case this was largely the result of one or two mega-cases In 2007 it was a $47 billion multistate settlement with American Electric Power12 In 2015 it was the result of two settlements with BP adding up to $64 billion13 In 2018 it was an $850 million settlement between Minnesota and 3M14
THE OTHER ENVIRONMENTAL REGULATORS HOW STATES UNEVENLY ENFORCE POLLUTION LAWS 10goodjobsfirstorg
Violation Categories
State environmental agencies engage in enforcement actions of numerous types These include common categories such as air water and hazardous waste cases as well as less frequent violations such as those involving x-ray equipment
Wherever possible we sought to obtain agency case lists that included category information but that information was not always readily available Of the 52000 entries we assembled we were able to obtain these designations for about 32000 cases
As shown in Table 4 air pollution accounts for the largest share of the known cases followed
by water pollution and hazardous waste When it comes to penalty amounts air pollution still leads with 38 percent of the total Yet it is closely followed by spills and accidents which account for 33 percent That is largely because the spill category includes the two massive settlements reached with BP for the Deepwater Horizon disaster
The spill cases have an average penalty of $32 million far above that of any other category (Leaving out those BP settlements the average drops to $2 million) Next are the air pollution cases whose average of more than $786000 reflects the fact that the category includes many actions against large power plants and industrial facilities
0
500
1000
1500
2000
2500
3000
3500
0
$1B
$2B
$3B
$4B
$5B
$6B
$7B
2000 2001 2002 2003 2004 2005 2006 2007 2008 2009 2010 2011 2012 2013 2014 2015 2016 2017 2018 2019 2020
Cases Penalty Total includes BP settlements
Table 3 Penalty Totals by Year
Year Cases Penalty Total
2000 1592 $268700948
2001 1822 $183964292
2002 2026 $168687295
2003 2071 $852546311
2004 2011 $161092514
2005 2388 $306806987
2006 2655 $187190859
2007 2649 $5074612605
2008 3018 $476760890
2009 2860 $270028240
2010 2963 $249627433
Year Cases Penalty Total
2011 2888 $277076980
2012 2582 $219919051
2013 2696 $878780162
2014 2706 $434046779
2015 2529 $6933214918
2016 2793 $969067065
2017 2389 $459290337
2018 2465 $1492624839
2019 2712 $347676979
2020 2282 $448695319
THE OTHER ENVIRONMENTAL REGULATORS HOW STATES UNEVENLY ENFORCE POLLUTION LAWS 11goodjobsfirstorg
Table 4 Violations By Category
Violation TypeCases
Percent of Total Penalty Total
Percent of Total Average Penalty
air pollution 10131 32 $7697670037 37 $786464
hazardous waste including asbestos and lead paint
4805 15 $1926465042 9 $400929
pesticides 840 3 $54199896 lt1 $64524
radiation 112 lt1 $3265530 lt1 $29157
solid waste including landfills 1688 5 $134252661 lt1 $79534
spills and accidents 218 lt1 $6909053874 33 $31692908
storage tanks 2065 6 $228466618 1 $110638
water pollution including erosion and sediment cases
6649 21 $2776703396 13 $417612
miscellaneous 5564 17 $945472620 5 $169927
Largest Cases
Among the more than 50000 successful enforcement actions we identified the average penalty is about $413000 There are 37 with penalties of $50 million or more 115 with penalties of $10 million or more and over 500 in excess of $1 million
As shown in Table 5 four of the ten largest penaltiesmdashincluding the $49 billion
Deepwater Horizon settlement with BP that tops the listmdashcome from multistate AG lawsuits Another five are single-state AG cases The largest penalty collected by a regulatory agency is the $306 million resolution of a case brought by the Texas Commission on Environmental Quality against Bell Point Refining in 2003
Table 5 Ten Largest State Environmental Penalties Since 2000
Agency Year Company Penalty
Multistate Attorneys General Case 2015 BP $4900000000
Multistate Attorneys General Case 2007 American Electric Power $4675000000
Mississippi Attorney General 2015 BP $1500000000
North Carolina Attorney General 2021 Duke Energy $855000000
Minnesota Attorney General 2018 3M $850000000
Multistate Attorneys General Case 2016 Volkswagen $570000000
Massachusetts Attorney General 2013 AVX Corp $366250000
Multistate Attorneys General Case 2003 Archer Daniels Midland Company $350900000
Texas Commission on Environmental Quality 2003 Bell Point Refining LLC $306640000
New Hampshire Attorney General 2013 ExxonMobil $236000000
THE OTHER ENVIRONMENTAL REGULATORS HOW STATES UNEVENLY ENFORCE POLLUTION LAWS 12goodjobsfirstorg
Largest Parent Penalty Totals
One of the benefits of a long-term 50-state analysis is to reveal the extent of corporate environmental recidivism We enhance that capability through the parent-subsidiary matching system used for our Violation Tracker database It enables us to see which ultimate corporate parents have the most violations and the largest penalty totals
Exxon Mobilrsquos case total at 272 is higher than that of any other parent company making it the worst repeat offender As shown in Table 6 it is followed by pipeline company Energy Transfer (172) chemical producer LyondellBasell Industries (168) coal producer James C Justice Companies (155) petroleum producer Valero Energy (152) and the diversified Koch Industries (150)
As shown in Table 7 there are three companies with totals of $1 billion or more and 18 in excess of $100 million Firms such as American Electric Power Volkswagen and 3M show up high on the list largely by virtue of one or two of the mega-cases cited above But others such as BP and Exxon Mobil have both mega-cases and many smaller penalties
Table 6 Parent Companies with the Most Environmental Penalty Cases Since 2000
Parent Cases Penalty Total
Exxon Mobil 272 $576704877
Energy Transfer 172 $174100800
LyondellBasell Industries 168 $14718276
James C Justice Companies
155 $3799784
Valero Energy 152 $113282980
Koch Industries 150 $23291837
Royal Dutch Shell 143 $182376574
Chevron 142 $60358051
Clean Harbors Inc 138 $8007378
HeidelbergCement 137 $89419475
Table 7 Parent Companies with the Largest State Environmental Penalty Totals Since 2000
Parent Penalty Total Cases
BP $6566084678 98
American Electric Power $4687889714 14
Volkswagen $1000039969 13
Duke Energy $895563688 49
3M Company $850515979 20
Exxon Mobil $576704877 272
Kyocera $366267499 3
Archer Daniels Midland $356754561 31
Grupo Mexico $262076802 12
Occidental Petroleum $214284294 128
THE OTHER ENVIRONMENTAL REGULATORS HOW STATES UNEVENLY ENFORCE POLLUTION LAWS 13goodjobsfirstorg
Parents with Far-Flung Violations
Just as the penalty totals of some parents are spread out over many cases some cover a variety of locations in different parts of the country There are 62 parents with penalties in ten or more states As shown in Table 8 there are ten parents with penalties from 20 or more states led by the waste management company Clean Harbors Inc at 37
Table 8 Parent Companies with Penalties in 20 or More States
Parent Penalty Total Cases States
Clean Harbors Inc $8007378 138 37
Exxon Mobil $576704877 272 24
Berkshire Hathaway $34072571 125 24
Kinder Morgan $23621575 132 22
Republic Services $104024966 94 22
Chevron $60358051 142 21
Waste Management $19556428 126 21
BP $6566084678 98 21
Marathon Petroleum $64332640 98 21
Koch Industries $23291837 150 20
Foreign Parents
There has long been discussion of the employment practices of foreign-based corporations operating in the United States Their environmental performance also raises questions Seventy-five foreign parents have accumulated more than $1 million each for state environmental violations
Table 9 shows the dozen companies with totals of $50 million or more
Well-known foreign lawbreakers BP and Volkswagen top the list but large penalty totals have also been accumulated by less familiar parents such as Kyocera and Grupo Mexico
Table 9 Foreign Parents with $50 Million or More in State Environmental Penalties
Parent Penalty total Cases States HQ Country
BP $6566084678 98 21 United Kingdom
Volkswagen $1000039969 13 5 Germany
Kyocera $366267499 3 3 Japan
Grupo Mexico $262076802 12 3 Mexico
Royal Dutch Shell $182376574 143 19 Netherlands
Bayer $147953188 23 11 Germany
Repsol $130123074 7 2 Spain
Robert Bosch $99790553 9 4 Germany
HeidelbergCement $89419475 137 14 Germany
Stellantis (parent of Fiat Chrysler) $79196375 7 3 Netherlands
Enbridge $77739244 36 9 Canada
WH Group $66658554 19 9 China
THE OTHER ENVIRONMENTAL REGULATORS HOW STATES UNEVENLY ENFORCE POLLUTION LAWS 14goodjobsfirstorg
Parent Industry Totals
Given the company names cited most frequently above it comes as no surprise to see that the parent industry with the highest penalty total is oil and gas with more than $8 billion in fines and settlements The utilities and power generation sector comes in at more than $6 billion in penalties while the total for motor vehicles is almost $12 billion Table 10 shows the totals for industries with $100 million or more
Table 10 Parent Industries with $100 Million or More in Penalties
Industry Penalty Total
oil and gas $8204573823
utilities and power generation $6022175733
motor vehicles $1187485000
miscellaneous manufacturing $886680998
agribusiness $376271652
electrical and electronic equipment $374179310
chemicals $344208793
mining and minerals $334651970
pipelines $293255398
diversified $223753203
building materials $182806739
waste management and environmental services
$151416499
automotive parts $123406435
telecommunications $113081728
food products $106118561
THE OTHER ENVIRONMENTAL REGULATORS HOW STATES UNEVENLY ENFORCE POLLUTION LAWS 15goodjobsfirstorg
CONCLUS ION AND POL ICY RECOMMENDAT IONS
As long as federalism remains a central feature of governance in the United States there are going to be differences in state policies and procedures When it comes to environmental enforcement however Congress decided decades ago that the federal government should set national standards while delegating some implementation authority to the states
Under that arrangement variations in enforcement caseloads and penalty totals should reflect only the relative level and nature of business activity in the various states Instead it now appears that some states are not taking their enforcement responsibilities seriously
It is unclear whether the EPArsquos State Review Framework is doing enough to address deficiencies in some parts of the country Now that the federal agency is once again operating as part of an administration that takes enforcement seriously it should do more to press the laggard states to improve their performance
Along with the enforcement procedures themselves there should be an overhaul of the systems by which states share data with the public To begin with every state should be required to provide the information on its website Ideally there should be a standardized format for that data presentation Currently the states that post enforcement information do so in many different ways Some have modern user-friendly search tools while others employ antiquated and cumbersome sites that seem designed to discourage users
In theory the state data could be incorporated into the EPArsquos Enforcement and Compliance History Online (ECHO) case search website That database contains some information on cases in which a state took the lead but the information does not cover all programs is missing key information such as state penalty amounts and is not up to date15 There are also gaps in the state data included in the full ECHO dataset downloads16
Whether it comes about by improving and standardizing the state websites or by expanding the EPArsquos ECHO tool the public deserves a way to obtain clear and complete data on environmental enforcement activity throughout the country
THE OTHER ENVIRONMENTAL REGULATORS HOW STATES UNEVENLY ENFORCE POLLUTION LAWS 16goodjobsfirstorg
METHODOLOGY
This report is based on case details for more than 50000 state environmental enforcement actions resolved from January 1 2000 through February 2021
The information was obtained from the agencies themselves These included the primary environmental enforcement agencies in each state as well as additional agencies for specific sectors such as mining or petroleum We also collected information on environmental cases brought by individual state attorneys general or by groups of AGs All the agencies and AGs are listed in the Appendix
With those agencies that post the data on their websites we downloaded or scraped the data and put it in a standard format for inclusion in our Violation Tracker database When the information was not easily retrievable ndash because it was contained in a large number of individual case documents ndash we submitted open records requests for the data in spreadsheet form We also submitted such requests to the agencies that posted no enforcement information on their sites
Some agencies required us to submit separate requests to different divisionsmdashair water hazardous waste etc As a result we ended up submitting about 90 requests in total
Most agencies provided at least some of the information we requested though some were unable to provide data going back as far as 2000 We sought to fill in the missing years by searching in the Nexis news archive which includes some archival press releases from state agencies as well as secondary sources
There were just two agencies that do not post enforcement data in any form and that turned down our records requests the Kansas Department of Health and Environment and the Oklahoma Department of Environmental Quality The reason given for the denial in both cases was that state law does not require an agency to create a list of cases since that would supposedly constitute a new rather than an existing record For both states we searched the Nexis news archive and found small numbers of cases
All the data we obtained through downloads scraping and public records requests was processed using the usual method we apply for Violation Tracker We included all cases with a monetary penalty of $5000 or more except for those in which the party paying the penalty was an individual or a government entity
All the entries were run through Good Jobs Firstrsquos proprietary parent-subsidiary matching system as we do for all Violation Tracker entries This system a combination of machine-generated suggested matches and human verification identifies which of the entities named in the individual case announcements are owned by any corporations in our universe of more than 3000 parents These include large publicly traded and privately held for-profit companies (including private equity companies and their portfolio holdings) as well as major non-profits Parent-subsidiary linkages are based on current rather than historical relationships
The research for this report was completed in late February 2021
THE OTHER ENVIRONMENTAL REGULATORS HOW STATES UNEVENLY ENFORCE POLLUTION LAWS 17goodjobsfirstorg
APPENDIX CASE TOTALS FOR ENV IRONMENTAL AGENC IES AND STATE ATTORNEYS GENERAL
Note Does not include state attorneys general involved only in multistate environmental cases Agency names link to online enforcement data sources Cases include those announced from January 2000 through February 2021 with penalties of $5000 or more
Agency or Attorney General Cases Penalty Total
Alabama Attorney General 2 $23300000
Alabama Department of Environmental Management 1224 $29621660
Alaska Attorney General 15 $8009023
Alaska Department of Environmental Conservation 14 $2401032
Alaska Oil and Gas Conservation Commission 14 $923000
Arizona Attorney General 36 $44171711
Arizona Department of Environmental Quality 175 $123049942
Arkansas Attorney General 1 $1880000
Arkansas Division of Environmental Quality 607 $11019649
California Air Resources Board 2004 $249028541
California Attorney General 150 $698166112
California Department of Pesticide Regulation 819 $31351393
California Department of Toxic Substances Control 418 $59418403
California State Water Resources Control Board 105 $82526249
CalRecycle 75 $7213405
Colorado Attorney General 14 $107750235
Colorado Department of Public Health amp Environment 1213 $36417519
Colorado Division of Reclamation Mining amp Safety 31 $417225
Colorado Oil amp Gas Conservation Commission 355 $52207225
Connecticut Attorney General 26 $23990510
Connecticut Department of Energy amp Environmental Protection 620 $51891122
Delaware Attorney General 1 $60200
Delaware Department of Natural Resources and Environmental Control 121 $18773649
District of Columbia Attorney General 5 $55825000
District of Columbia Department of Energy amp Environment 118 $2177778
Florida Department of Environmental Protection 2432 $48177876
Georgia Environmental Protection Division 1346 $23704492
Hawaii Attorney General 1 $15400000
THE OTHER ENVIRONMENTAL REGULATORS HOW STATES UNEVENLY ENFORCE POLLUTION LAWS 18goodjobsfirstorg
Agency or Attorney General Cases Penalty Total
Hawaii Environmental Management Division (no online case information) 100 $4116484
Idaho Department of Environmental Quality (no online case information) 162 $3489720
Illinois Attorney General 155 $73021586
Illinois Environmental Protection Agency 1117 $77075079
Illinois Office of Mines and Minerals (no online case information) 4 $32950
Indiana Attorney General 5 $16355979
Indiana Department of Environmental Management 1726 $41587703
Iowa Attorney General 79 $43234570
Iowa Department of Natural Resources 375 $5324191
Kansas Department of Health and Environment (no online case information) 16 $602440
Kentucky Attorney General 3 $586515
Kentucky Department for Environmental Protection (no online case information) 2091 $47974667
Louisiana Department of Environmental Quality 733 $77494765
Maine Department of Environmental Protection 279 $9260448
Maryland Attorney General 21 $41377751
Maryland Department of the Environment 565 $24334657
Massachusetts Attorney General 187 $453148982
Massachusetts Executive Office of Energy and Environmental Affairs 1185 $23753695
Michigan Attorney General 17 $206811313
Michigan Department of Environmental Quality 301 $16310414
Minnesota Attorney General 3 $850325000
Minnesota Pollution Control Agency 1169 $45118551
Mississippi Attorney General 1 $1500000000
Mississippi Department of Environmental Quality 370 $13691105
Missouri Attorney General 55 $375887668
Missouri Department of Natural Resources 94 $2958571
Montana Attorney General 4 $190770000
Montana Department of Environmental Quality 148 $7134699
Nebraska Attorney General 14 $2295700
Nebraska Department of Environmental Quality 97 $2588006
Nevada Division of Environmental Protection 65 $3566738
New Hampshire Attorney General 66 $282376089
New Hampshire Department of Environmental Services 205 $3790683
New Jersey Attorney General 15 $783770000
New Jersey Department of Environmental Protection 2986 $140194687
New Mexico Attorney General 5 $7075000
New Mexico Department of Energy Minerals and Natural Resources (no online case information) 10 $219945
New Mexico Environment Department 223 $123385920
New York Attorney General 68 $99774168
New York Department of Environmental Conservation 480 $22061582
THE OTHER ENVIRONMENTAL REGULATORS HOW STATES UNEVENLY ENFORCE POLLUTION LAWS 19goodjobsfirstorg
Agency or Attorney General Cases Penalty Total
North Carolina Attorney General 5 $931251194
North Carolina Department of Environmental Quality 1491 $27956559
North Dakota Attorney General 2 $31175000
North Dakota Department of Health-Environmental Section (no online case information) 98 $5909401
Ohio Attorney General 39 $51346806
Ohio Department of Natural Resources (no online case information) 40 $909200
Ohio Environmental Protection Agency 1069 $140699965
Oklahoma Attorney General 1 $8500000
Oklahoma Department of Environmental Quality (no online case information) 10 $3349757
Oregon Attorney General 3 $1224059
Oregon Department of Environmental Quality 1474 $38473550
Pennsylvania Attorney General 6 $1489502
Pennsylvania Department of Environmental Protection 4288 $341768999
Rhode Island Attorney General 2 $10875000
Rhode Island Department of Environmental Management 498 $15184007
South Carolina Department of Health and Environmental Control 1379 $24984579
South Dakota Department of Environment amp Natural Resources (no online case information) 106 $2340551
Tennessee Department of Environment amp Conservation 1844 $71350048
Texas Attorney General 8 $96810000
Texas Commission on Environmental Quality 7443 $673811684
Texas Railroad Commission 2058 $38999529
Utah Department of Environmental Quality 135 $14777109
Vermont Attorney General 41 $32483154
Vermont Department of Environmental Conservation 69 $1274256
Vermont Natural Resources Board 98 $1473709
Virginia Attorney General 5 $6529500
Virginia Department of Environmental Quality 836 $73478536
Virginia Department of Mines Minerals and Energy (no online case information) 237 $4886031
Washington Attorney General 4 $95827500
Washington Department of Ecology 693 $40347055
West Virginia Attorney General 1 $550000
West Virginia Department of Environmental Protection 285 $18194073
West Virginia Surface Mine Board 2 $67500
Wisconsin Attorney General 265 $29120290
Wisconsin Department of Natural Resources (no online case information) 68 $5041169
Wyoming Department of Environmental Quality 422 $43300053
THE OTHER ENVIRONMENTAL REGULATORS HOW STATES UNEVENLY ENFORCE POLLUTION LAWS 20goodjobsfirstorg
ENDNOTES
1 The following section draws from William R Lowry The Dimensions of Federalism State Governments and Pollution Control Policies (Durham Duke University Press 1992) and Robert V Percival ldquoEnvironmental Federalism Historical Roots and Contemporary Modelsrdquo Maryland Law Review vo 54 no4 (1995)
2 All states have authority with regard to the Clean Air Act The states that do not have authority with regard to the Clean Water Act are Idaho Massachusetts New Hampshire and New Mexico as well as the District of Columbia Those that do not have authority with regard to hazardous waste are Alaska and Iowa See httpswwwepagovcompliancestate-review-framework
3 US Environmental Protection Agency Office of Inspector General EPA Must Improve Oversight of State Enforcement (Report No 12-P-0113 December 9 2011) p6
4 httpswwwepagovcompliancestate-review-framework
5 Most of the AG case information was collected during the preparation of Bipartisan Corporate Crime Fighting by the States (Good Jobs First September 2019) That information has been updated for this report
6 The penalty amounts also include the cost of mandated upgrades in pollution control equipment or supplementary environmental projects in the community if they are specified in the enforcement order
7 On the coziness see for example Naveena Sadasivam ldquoAfter Eight-Year Battle Over Reforming the Railroad Commission Oil and Gas Industry Winsrdquo Texas Observer May 16 2017
8 See for example Amal Ahmed ldquoIllegal Air Pollution is Skyrocketing in Texas But State Regulators are Ignoring Complaintsrdquo Texas Observer November 5 2020
9 State population figures were taken from Census Bureau data at httpswwwcensusgovsearch-resultshtmlsearchType=webampcssp=SERPampq=state20population
10 State firm numbers were taken from the Statistics of US Business data series at httpswwwcensusgovprograms-surveyssusbdatacustom-tabulationshtml
11 httpsviolationtrackergoodjobsfirstorgviolation-trackerms-bp
12 httpsviolationtrackergoodjobsfirstorgviolation-tracker-american-electric-power-1
13 httpsviolationtrackergoodjobsfirstorgviolation-tracker-bp-2
httpsviolationtrackergoodjobsfirstorgviolation-trackerms-bp
14 httpsviolationtrackergoodjobsfirstorgviolation-trackermn-3m-1
15 httpsechoepagovfacilitiesenforcement-case-search
16 httpsechoepagovtoolsdata-downloadsicis-fec-download-summary
THE OTHER ENVIRONMENTAL REGULATORS HOW STATES UNEVENLY ENFORCE POLLUTION LAWS 21goodjobsfirstorg
good jobs f i rs t org
1380 Monroe St NWPMB 405
Washington DC 20010202-232-1616
- Executive Summary
- Introduction The Evolution of Environmental Federalism
- Findings
-
- State Caseloads
- State Penalty Totals
- Trends Over Time
- Violation Categories
- Largest Cases
- Largest Parent Penalty Totals
- Parents with Far-Flung Violations
- Foreign Parents
- Parent Industry Totals
-
- Conclusion and Policy Recommendations
- Methodology
- Appendix Case Totals for Environmental Agencies and State Attorneys General
- Endnotes
-
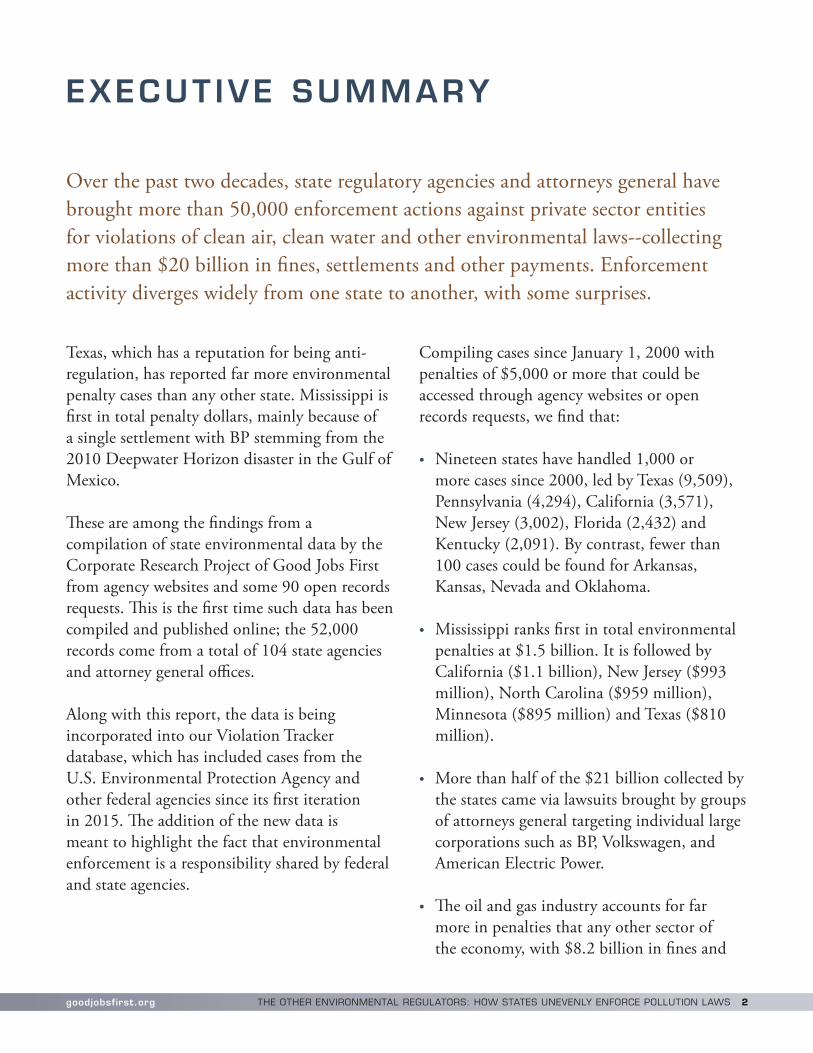
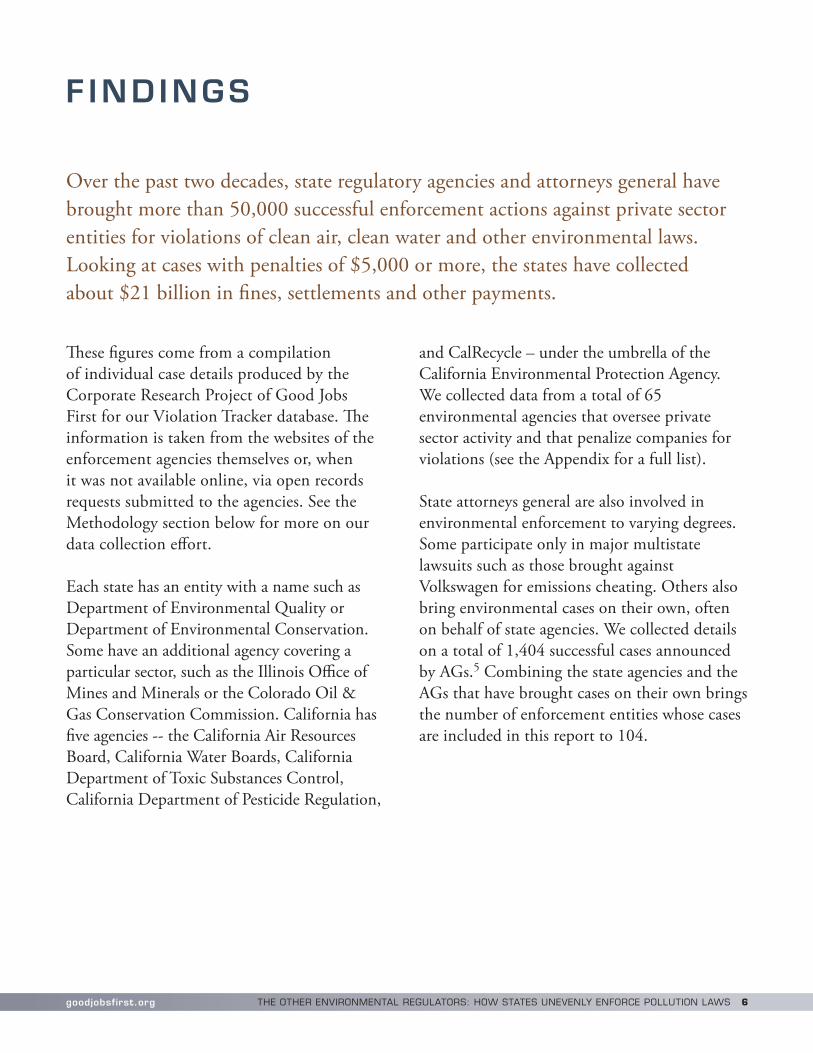
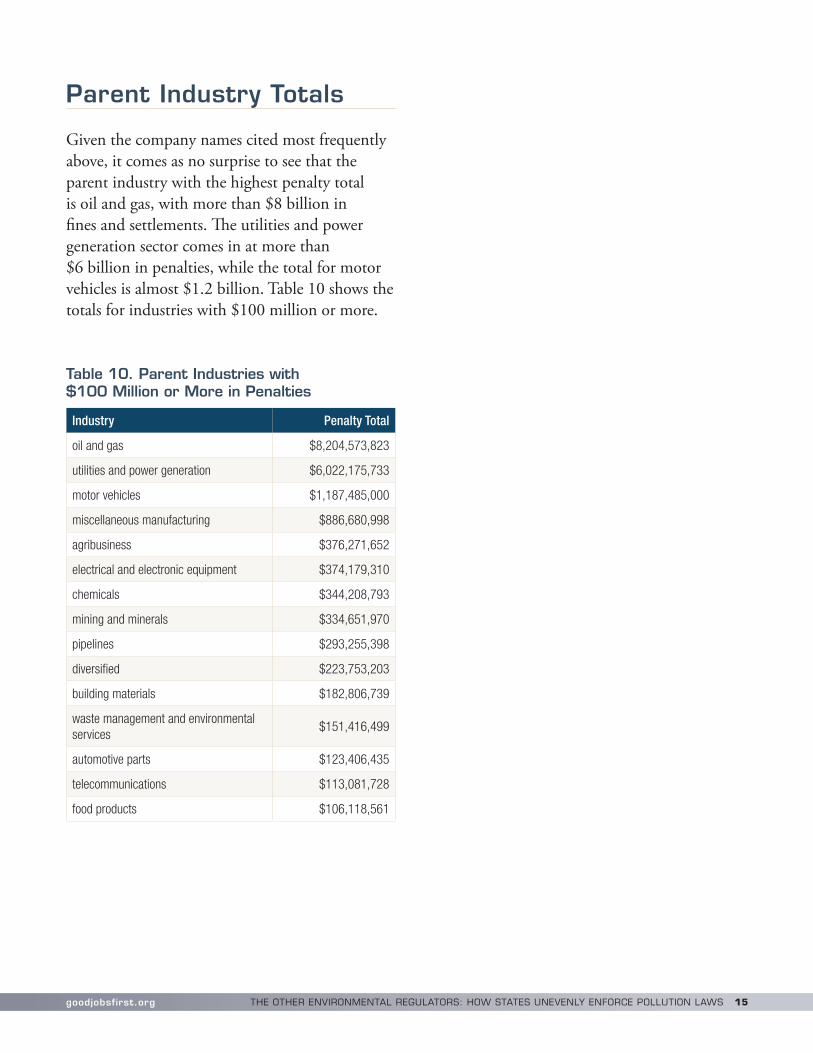

Agency or Attorney General Cases Penalty Total
North Carolina Attorney General 5 $931251194
North Carolina Department of Environmental Quality 1491 $27956559
North Dakota Attorney General 2 $31175000
North Dakota Department of Health-Environmental Section (no online case information) 98 $5909401
Ohio Attorney General 39 $51346806
Ohio Department of Natural Resources (no online case information) 40 $909200
Ohio Environmental Protection Agency 1069 $140699965
Oklahoma Attorney General 1 $8500000
Oklahoma Department of Environmental Quality (no online case information) 10 $3349757
Oregon Attorney General 3 $1224059
Oregon Department of Environmental Quality 1474 $38473550
Pennsylvania Attorney General 6 $1489502
Pennsylvania Department of Environmental Protection 4288 $341768999
Rhode Island Attorney General 2 $10875000
Rhode Island Department of Environmental Management 498 $15184007
South Carolina Department of Health and Environmental Control 1379 $24984579
South Dakota Department of Environment amp Natural Resources (no online case information) 106 $2340551
Tennessee Department of Environment amp Conservation 1844 $71350048
Texas Attorney General 8 $96810000
Texas Commission on Environmental Quality 7443 $673811684
Texas Railroad Commission 2058 $38999529
Utah Department of Environmental Quality 135 $14777109
Vermont Attorney General 41 $32483154
Vermont Department of Environmental Conservation 69 $1274256
Vermont Natural Resources Board 98 $1473709
Virginia Attorney General 5 $6529500
Virginia Department of Environmental Quality 836 $73478536
Virginia Department of Mines Minerals and Energy (no online case information) 237 $4886031
Washington Attorney General 4 $95827500
Washington Department of Ecology 693 $40347055
West Virginia Attorney General 1 $550000
West Virginia Department of Environmental Protection 285 $18194073
West Virginia Surface Mine Board 2 $67500
Wisconsin Attorney General 265 $29120290
Wisconsin Department of Natural Resources (no online case information) 68 $5041169
Wyoming Department of Environmental Quality 422 $43300053
THE OTHER ENVIRONMENTAL REGULATORS HOW STATES UNEVENLY ENFORCE POLLUTION LAWS 20goodjobsfirstorg
ENDNOTES
1 The following section draws from William R Lowry The Dimensions of Federalism State Governments and Pollution Control Policies (Durham Duke University Press 1992) and Robert V Percival ldquoEnvironmental Federalism Historical Roots and Contemporary Modelsrdquo Maryland Law Review vo 54 no4 (1995)
2 All states have authority with regard to the Clean Air Act The states that do not have authority with regard to the Clean Water Act are Idaho Massachusetts New Hampshire and New Mexico as well as the District of Columbia Those that do not have authority with regard to hazardous waste are Alaska and Iowa See httpswwwepagovcompliancestate-review-framework
3 US Environmental Protection Agency Office of Inspector General EPA Must Improve Oversight of State Enforcement (Report No 12-P-0113 December 9 2011) p6
4 httpswwwepagovcompliancestate-review-framework
5 Most of the AG case information was collected during the preparation of Bipartisan Corporate Crime Fighting by the States (Good Jobs First September 2019) That information has been updated for this report
6 The penalty amounts also include the cost of mandated upgrades in pollution control equipment or supplementary environmental projects in the community if they are specified in the enforcement order
7 On the coziness see for example Naveena Sadasivam ldquoAfter Eight-Year Battle Over Reforming the Railroad Commission Oil and Gas Industry Winsrdquo Texas Observer May 16 2017
8 See for example Amal Ahmed ldquoIllegal Air Pollution is Skyrocketing in Texas But State Regulators are Ignoring Complaintsrdquo Texas Observer November 5 2020
9 State population figures were taken from Census Bureau data at httpswwwcensusgovsearch-resultshtmlsearchType=webampcssp=SERPampq=state20population
10 State firm numbers were taken from the Statistics of US Business data series at httpswwwcensusgovprograms-surveyssusbdatacustom-tabulationshtml
11 httpsviolationtrackergoodjobsfirstorgviolation-trackerms-bp
12 httpsviolationtrackergoodjobsfirstorgviolation-tracker-american-electric-power-1
13 httpsviolationtrackergoodjobsfirstorgviolation-tracker-bp-2
httpsviolationtrackergoodjobsfirstorgviolation-trackerms-bp
14 httpsviolationtrackergoodjobsfirstorgviolation-trackermn-3m-1
15 httpsechoepagovfacilitiesenforcement-case-search
16 httpsechoepagovtoolsdata-downloadsicis-fec-download-summary
THE OTHER ENVIRONMENTAL REGULATORS HOW STATES UNEVENLY ENFORCE POLLUTION LAWS 21goodjobsfirstorg
good jobs f i rs t org
1380 Monroe St NWPMB 405
Washington DC 20010202-232-1616
- Executive Summary
- Introduction The Evolution of Environmental Federalism
- Findings
-
- State Caseloads
- State Penalty Totals
- Trends Over Time
- Violation Categories
- Largest Cases
- Largest Parent Penalty Totals
- Parents with Far-Flung Violations
- Foreign Parents
- Parent Industry Totals
-
- Conclusion and Policy Recommendations
- Methodology
- Appendix Case Totals for Environmental Agencies and State Attorneys General
- Endnotes
-