THE OIL & SERVICES CONFERENCE™ 14€¦ · · 2016-03-08the oil & services conference™ 14...
51
www.theoilandservicesconference.com SAN FRANCISCO, MARCH 9, 2016 THE OIL & SERVICES CONFERENCE™ 14 NETHERLAND, SEWELL & ASSOCIATES, INC. WORLDWIDE PETROLEUM CONSULTANTS Conference Global
Transcript of THE OIL & SERVICES CONFERENCE™ 14€¦ · · 2016-03-08the oil & services conference™ 14...

NETHERLAND, SEWELL& ASSOCIATES, INC.
WORLDWIDE PETROLEUM CONSULTANTS
NETHERLAND, SEWELL& ASSOCIATES, INC.
WORLDWIDE PETROLEUM CONSULTANTS
www.theoilandservicesconference.comSAN FRANCISCO, MARCH 9, 2016
THE OIL & SERVICES CONFERENCE™ 14
NETHERLAND, SEWELL& ASSOCIATES, INC.
WORLDWIDE PETROLEUM CONSULTANTS
Conference
Global

Branding
Portfolio Valuation
Proprietary Data
Benchmarking Analysis
Media
Corporate Marketing
Oil & Gas 360®
Activist Consulting
Advertising
Analyst Days
Annual Reports
Conference Calls
Corporate Strategy
Data Products
Digital Marketing
Financial Analysis
Intelligent Targeting
Investor Relations
Maps
Media Training
Network Television
Non-Deal Road Shows
OilService Marketing
Presentations
Press Releases
Print Media
Social Media
Technical Illustrations
Trade Publications
Web Design(303) 296-8834 | www.enercominc.com
Consulting

JUNE
201
4
USD 3,000,000,000
Senior Unsecured Revolving Credit Facility
Joint Lead Arranger,Joint Bookrunner &
Co-Documentation Agent
TRANSOCEAN INC. USA
FEBR
UARY
201
5
USD 300,000,0007.5% Senior
Unsecured NotesDue 2023
Joint Bookrunner
WESTERN REFINING LOGISTICS, LP
APRI
L 20
15
USD 650,000,000
6.250% Senior NotesDue 2023
Joint Bookrunner
CARRIZO OIL & GAS
AUGU
ST 2
014
USD 2,500,000,000
Senior Secured Revolving Credit Facility
Joint Lead Arranger, Joint Bookmanager &
Co-Documentation Agent
PBF HOLDING COMPANY LLC USA
energy financingsolutions
for the Americas
Choose a bank internationally recognized for global energy finance.
Our sector specialists draw on unrivalled expertise for financing value-creating corporate finance projects, and participating in the development of the real economy. Across all continents, we take an active role in the sustainable development of today’s economy.
www.ca-cib.com
Energy Group 1100 Louisiana, Suite 4750,
Houston TX 77002 Tel.: 713-890-8600
Créd
it Ag
ricol
e Co
rpor
ate
and
Inve
stm
ent B
ank
is a
utho
rised
by
the
Auto
rité
de C
ontrô
le P
rude
ntie
l et d
e Ré
solu
tion
(ACP
R) a
nd s
uper
vise
d by
the
Euro
pean
Cen
tral B
ank
(ECB
), th
e AC
PR a
nd th
e Au
torit
é de
s M
arch
és F
inan
cier
s (A
MF)
in F
ranc
e an
d su
bjec
t to
limite
d re
gula
tion
by th
e Fi
nanc
ial C
ondu
ct A
utho
rity
and
the
Prud
entia
l Re
gula
tion
Auth
ority
. Det
ails
abo
ut th
e ex
tent
of o
ur re
gula
tion
by th
e Fi
nanc
ial C
ondu
ct A
utho
rity
and
the
Prud
entia
l Reg
ulat
ion
Auth
ority
are
ava
ilabl
e fro
m u
s on
requ
est.
MAR
CH 2
015
USD 850,000,000
Senior Secured First Lien Term Loan B
Co-Lead Arranger &Joint Bookrunner
ENERGY TRANSFER EQUITY, L.P.
MAR
CH 2
015
USD 300,000,000
8.125% Senior NotesDue 2023
Joint Bookrunner
ENDEAVOR ENERGY RESOURCES LP
DECE
MBE
R 20
14
USD 4,000,000,000
Senior Unsecured Revolving Credit Facility
Co-Documentation Agent
CHESAPEAKE ENERGY CORPORATIONUSA
APRI
L 20
15
USD 225,000,000
7.875% Senior Notes due 2021 add-on
Joint Bookrunner
KOSMOS ENERGY LTD.
FEBR
UARY
201
5
USD 70,000,000
Senior Secured RBL Revolving Credit Facility
Sole Lead Arranger,Sole Bookrunner &
Administrative Agent
SK PLYMOUTH, LLC
MAR
CH 2
015
USD 750,000,000
5.625% Senior Notes due 2023
Joint Bookrunner
ANTERO RESOURCES CORP
JANU
ARY
2015
USD 350,000,0003.300% Senior Unsecured
Notes Due 2018
Joint Bookrunner
SOUTHWESTERN ENERGY CO.
USD 1,000,000,0004.950% Senior Unsecured
Notes Due 2025
USD 850,000,0004.050% Senior Unsecured
Notes Due 2022
NOVE
MBE
R 20
15
USD 500,000,000
7.00% Senior NotesDue 2023
Joint BookrunningManager
PBF HOLDING COMPANY LLC & PBF FINANCE CORPORATION
OCTO
BER
2015
USD 499,000,000
Non-Recourse Monetization of a Receivable
Sole Arranger & Lender
RELIANCE HOLDING USA INC.
NOVE
MBE
R 20
15
USD 350,000,000
5-year RevolvingCredit Facility
Joint Lead Arranger, Joint Bookrunner
& Syndication Agent
ARCHROCK
NOVE
MBE
R 20
15
Joint Lead Arranger,Joint Bookrunner
& Syndication Agent
EXTERRAN ENERGY SOLUTIONS LP.
USD 680,000,0005-year Revolving
Credit FacilityUSD 245,000,000
2-Year Term Loan


www.preng.com
35YEARS
HOUSTON LONDON
O U R 7 0 0 C U R R E N T A N D PA S T C L I E N T SM A D E T H I S P O S S I B L E
T H A N K Y O U!

Hein has been delivering targeted value to energy companies for
over three decades. As one of the nation’s leading public accounting
firms serving the energy industry, Hein works with companies
to promote growth and improve operations.
For more information, visit www.heincpa.com or contact:
Focus and Precision.With keen focus, we’ve been helping our clients in the energy industry hit the mark for over 30 years.
Charles Grube, Partner
713.850.9814
Joe Blice, Head of O&G
972.458.2296
Patrick Hanley, Partner
303.298.9600

Bridging the Gap Between Operators & Oilfield ServicesPLS provides informative reports, premium databases, market access, transactional work, buy-side assistance and capital sourcing for the oilfield service sector.
PLS professionals have critical industry insight, key relationships, extensive deal experience, market knowledge and solid deal flow in the oilfield service sector.
• Core Reports & Regional Reports• Proprietary Databases• Advisory & Consulting Services• Transactional Services
To see how PLS can help your oil service company, call Chris George at 713-600-0129 or email [email protected]
Visit: www.plsx.com/oilfieldservices
“Opportunity is a reflection of information.”
Information. Transactions. Advisory.
Call Now For More Info
713-600-0129

WUNDERLICH As a leading full-service middle market investment bank, Wunderlich combines the senior-level attention and focus only a boutique can offer with resources and experience of larger investment banks. Our bankers are dedicated to building trusted relationships with our clients, before and beyond transactions.
Energy Investment Banking | Acquisitions & Divestitures
Tom Schaefer Managing Director
713-403-2112 [email protected]
Lenny Bianco Vice President 713-403-3975
Wunderlich Contacts
Kevin Andrews Managing Director
713-403-3975 [email protected]
The Energy Investment Banking Group provides a full range of strategic advisory and underwriting services to clients across the oilfield services and equipment, upstream, midstream and utilities and power sectors of the energy industry. We focus on small to mid-capitalized public companies as well as private companies within the energy sector, and our team has participated in transactions raising over $17 billion in capital since 2012. The strategic advisory services provided to our public and private energy clients include mergers, acquisitions & divestitures, leveraged buy-outs and fairness opinions. Additionally, the Energy Investment Banking Group offers capital raising advisory services for common and preferred equity offerings, mezzanine financings, high yield debt, and convertible securities.
Our primary areas of focus include:
Oilfield Services and Equipment
Exploration & Production
Upstream Master Limited Partnerships
Midstream Master Limited Partnerships
Infrastructure Services
Utilities and Power Generation
WUNDERLICH As a leading full-‐service middle market investment bank, Wunderlich combines the senior-‐level aBenCon and focus only a bouCque can offer with resources and experience of larger investment banks. Our bankers are dedicated to building trusted relaConships with our clients, before and beyond transacCons.
Energy Investment Banking | Acquisi6ons & Dives6tures
Tom Schaefer Managing Director
713-‐403-‐2112 [email protected]
Lenny Bianco Vice President 713-‐403-‐3975
Wunderlich Contacts
Kevin Andrews Managing Director
713-‐403-‐3979 [email protected]
The Energy Investment Banking Group provides a full range of strategic advisory and underwriCng services to clients across the oilfield services and equipment, upstream, midstream and uCliCes and power sectors of the energy industry. We focus on small to mid-‐capitalized public companies as well as private companies within the energy sector, and our team has parCcipated in transacCons raising over $17 billion in capital since 2012. The strategic advisory services provided to our public and private energy clients include mergers, acquisiCons & divesCtures, leveraged buy-‐outs and fairness opinions. AddiConally, the Energy Investment Banking Group offers capital raising advisory services for common and preferred equity offerings, mezzanine financings, high yield debt, and converCble securiCes.
Our primary areas of focus include:
Ø Oilfield Services and Equipment
Ø Explora7on & Produc7on
Ø Upstream Master Limited Partnerships
Ø Midstream Master Limited Partnerships
Ø Infrastructure Services
Ø U7li7es and Power Genera7on

Need an ally in the energy sector? Tap into this resource
Energy is a precious commodity, so working with the right financial professionals is
paramount. Our knowledge of the energy sector runs deep, whether your priority is
upstream, midstream or downstream. Collectively, we have more than 100 years of industry
experience in our energy group, including a technical team for value-added insight.
Look to Fifth Third Bank for lending, commodity & interest rate hedging, foreign exchange,
equipment financing/leasing, debt capital markets, syndication capabilities, purchasing
card, treasury management, trust & escrow services.
To Tap inTo our wealTh of knowledge,
please conTacT
Richard C. Butler, Senior Vice President
713.401.6101 or [email protected]
We look forward to working with you
in your energy sector pursuits.
www.53.com/commercial Lending is subject to credit review and approval. Deposit and credit products provided by Fifth Third Bank. Member FDIC.

Kelton GlasscockSenior Vice PresidentHead of Energy AmericasTel: [email protected]
Byron CooleySenior Vice PresidentTel: [email protected]
Rob DupreeSenior Vice President Tel: [email protected]
DNB Bank - Energy Americas333 Clay Street, Suite 3950, Houston, TX 77002
www.dnb.no
BANKING AND FINANCING
TAILORED FOR THE ENERGY INDUSTRY

www.gmpsecurities.com
Navigating Through ChangeGMP’s leadership position across all aspects of the small- to mid-cap segments of the Canadian capital markets has consistently been defined by our superior execution capabilities and the depth and breadth of our client relationships.
In the United States, we have continued to expand our global commodities footprint to include coverage of the exploration and production and oil service sectors and remain committed to providing our clients with world-class research, sales and trading, corporate finance and advisory services.
To learn more about GMP’s North American energy platform, please contact:
GMP Securities, L.P.: Toronto | Calgary | MontrealGMP Securities, LLC: New York | Houston | Dallas | Stamford | Miami
GMP Securities L.P. (GMP Securities) is a member of the Toronto, Montreal and TSX Venture stock exchanges, the Investment Industry Regulatory Organization of Canada (IIROC) and the Canadian Investor Protection Fund (CIPF). Griffiths McBurney Corp. and GMP Securities, LLC are registered as broker dealers in the United States and are members of the Financial Industry Regulatory Authority (FINRA) and the Securities Investor Protection Corporation (SIPC).
CANADA
GMP Securities, L.P.525 – 8th Avenue SWSuite 4800Calgary, AB T2P 1G1Phone: 403.543.3030
Kevin OverstromManaging Director, Vice [email protected]
Robyn Hemminger Managing [email protected]
UNITED STATES
GMP Securities, LLC717 Texas Avenue Suite 3000Houston, Texas 77002Phone: 832.844.1800
Christian Gibson Managing [email protected]
Sameer ParasnisManaging [email protected]

THE OIL & GASCONFERENCE®
Save the Date:
August 14-18, 2016Denver, Colorado
www.theoilandgasconference.com

WWW.OILANDGAS360.COM
From the experts at EnerCom, Inc.
Contact Bevo Beaven at (303) 296-8834 for advertising, interviews, profiles or more information.
• E&P, Oil Service, Midstream and MLP’s• Exclusive C-Level Interviews and Webcasts• Feature Articles and Exclusive Content • Financial Metrics and Analytics • Industry Earnings Calendar • In-Depth Company Profiles• 125,000+ Monthly Page Views• Targeted Advertising
ROBUST MEDIA FOR A GLOBAL, OIL SAVVY AUDIENCE Our Audience has $3.2 Trillion in Managed Energy Assets
THE SINGLE SOURCE FOR OIL & GAS FINANCIAL NEWS AND ANALYSIS
EXCLUSIVE INTERVIEWS TRUSTED NEWS OUTLET CLOSING BELL REPORT
As an approved news source for Google and Bloomberg, O&G 360® content is used to populate Google searches and post company news. O&G 360® is an approved media distributor for PRNewswire, MarketWired, and Businesswire, the top energy news circuits.
O&G 360®’s “Closing Bell Report” Email is delivered after market close every weekday to 26,000+ oil & gas industry professionals, institutional investors, high net worth investors, corporate finance professionals, securities dealers and research analysts.
www.oilandgas360.com/subscribe
• EnerCom Conference Interviews• Straight Answers from U.S. Governors• CEO Interviews
Tell your company’s story directly to worldwide investors in our Q&A interview format as an audio or video presentation.
1 2
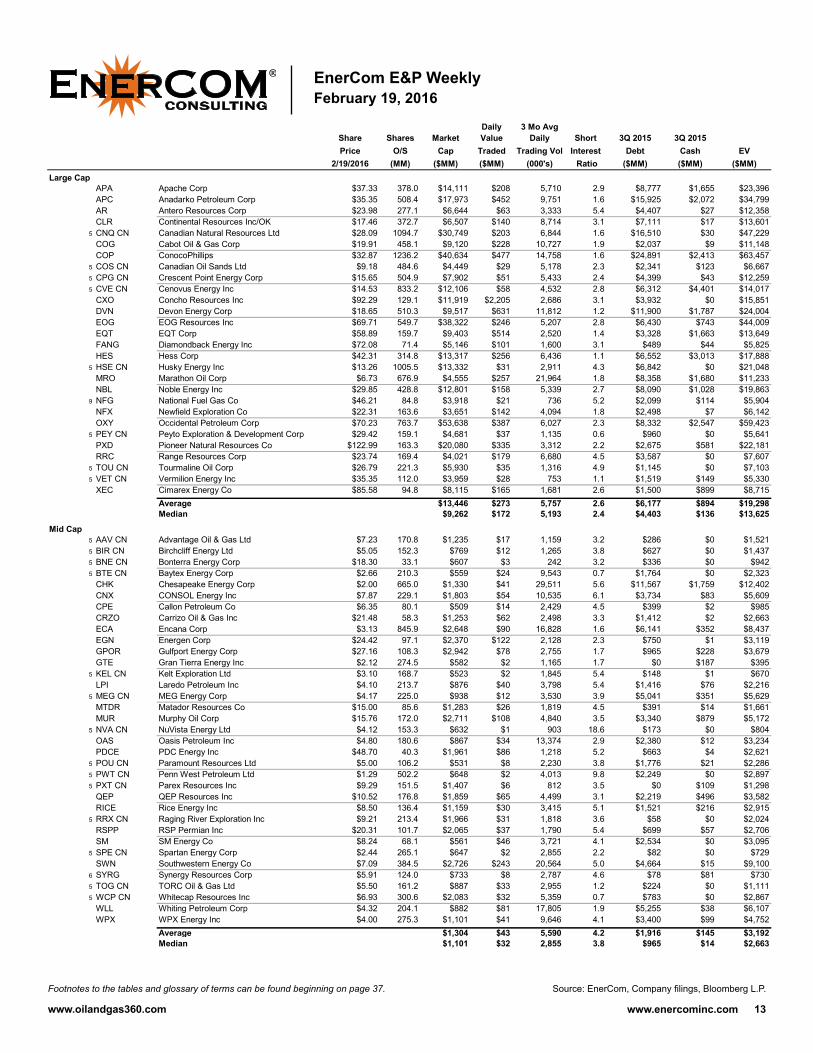
Daily 3 Mo AvgShare Shares Market Value Daily Short 3Q 2015 3Q 2015Price O/S Cap Traded Trading Vol Interest Debt Cash EV
2/19/2016 (MM) ($MM) ($MM) (000's) Ratio ($MM) ($MM) ($MM)Large Cap
APA Apache Corp $37.33 378.0 $14,111 $208 5,710 2.9 $8,777 $1,655 $23,396APC Anadarko Petroleum Corp $35.35 508.4 $17,973 $452 9,751 1.6 $15,925 $2,072 $34,799AR Antero Resources Corp $23.98 277.1 $6,644 $63 3,333 5.4 $4,407 $27 $12,358CLR Continental Resources Inc/OK $17.46 372.7 $6,507 $140 8,714 3.1 $7,111 $17 $13,601
5 CNQ CN Canadian Natural Resources Ltd $28.09 1094.7 $30,749 $203 6,844 1.6 $16,510 $30 $47,229COG Cabot Oil & Gas Corp $19.91 458.1 $9,120 $228 10,727 1.9 $2,037 $9 $11,148COP ConocoPhillips $32.87 1236.2 $40,634 $477 14,758 1.6 $24,891 $2,413 $63,457
5 COS CN Canadian Oil Sands Ltd $9.18 484.6 $4,449 $29 5,178 2.3 $2,341 $123 $6,6675 CPG CN Crescent Point Energy Corp $15.65 504.9 $7,902 $51 5,433 2.4 $4,399 $43 $12,2595 CVE CN Cenovus Energy Inc $14.53 833.2 $12,106 $58 4,532 2.8 $6,312 $4,401 $14,017
CXO Concho Resources Inc $92.29 129.1 $11,919 $2,205 2,686 3.1 $3,932 $0 $15,851DVN Devon Energy Corp $18.65 510.3 $9,517 $631 11,812 1.2 $11,900 $1,787 $24,004EOG EOG Resources Inc $69.71 549.7 $38,322 $246 5,207 2.8 $6,430 $743 $44,009EQT EQT Corp $58.89 159.7 $9,403 $514 2,520 1.4 $3,328 $1,663 $13,649FANG Diamondback Energy Inc $72.08 71.4 $5,146 $101 1,600 3.1 $489 $44 $5,825HES Hess Corp $42.31 314.8 $13,317 $256 6,436 1.1 $6,552 $3,013 $17,888
5 HSE CN Husky Energy Inc $13.26 1005.5 $13,332 $31 2,911 4.3 $6,842 $0 $21,048MRO Marathon Oil Corp $6.73 676.9 $4,555 $257 21,964 1.8 $8,358 $1,680 $11,233NBL Noble Energy Inc $29.85 428.8 $12,801 $158 5,339 2.7 $8,090 $1,028 $19,863
9 NFG National Fuel Gas Co $46.21 84.8 $3,918 $21 736 5.2 $2,099 $114 $5,904NFX Newfield Exploration Co $22.31 163.6 $3,651 $142 4,094 1.8 $2,498 $7 $6,142OXY Occidental Petroleum Corp $70.23 763.7 $53,638 $387 6,027 2.3 $8,332 $2,547 $59,423
5 PEY CN Peyto Exploration & Development Corp $29.42 159.1 $4,681 $37 1,135 0.6 $960 $0 $5,641PXD Pioneer Natural Resources Co $122.99 163.3 $20,080 $335 3,312 2.2 $2,675 $581 $22,181RRC Range Resources Corp $23.74 169.4 $4,021 $179 6,680 4.5 $3,587 $0 $7,607
5 TOU CN Tourmaline Oil Corp $26.79 221.3 $5,930 $35 1,316 4.9 $1,145 $0 $7,1035 VET CN Vermilion Energy Inc $35.35 112.0 $3,959 $28 753 1.1 $1,519 $149 $5,330
XEC Cimarex Energy Co $85.58 94.8 $8,115 $165 1,681 2.6 $1,500 $899 $8,715Average $13,446 $273 5,757 2.6 $6,177 $894 $19,298Median $9,262 $172 5,193 2.4 $4,403 $136 $13,625
Mid Cap5 AAV CN Advantage Oil & Gas Ltd $7.23 170.8 $1,235 $17 1,159 3.2 $286 $0 $1,5215 BIR CN Birchcliff Energy Ltd $5.05 152.3 $769 $12 1,265 3.8 $627 $0 $1,4375 BNE CN Bonterra Energy Corp $18.30 33.1 $607 $3 242 3.2 $336 $0 $9425 BTE CN Baytex Energy Corp $2.66 210.3 $559 $24 9,543 0.7 $1,764 $0 $2,323
CHK Chesapeake Energy Corp $2.00 665.0 $1,330 $41 29,511 5.6 $11,567 $1,759 $12,402CNX CONSOL Energy Inc $7.87 229.1 $1,803 $54 10,535 6.1 $3,734 $83 $5,609CPE Callon Petroleum Co $6.35 80.1 $509 $14 2,429 4.5 $399 $2 $985CRZO Carrizo Oil & Gas Inc $21.48 58.3 $1,253 $62 2,498 3.3 $1,412 $2 $2,663ECA Encana Corp $3.13 845.9 $2,648 $90 16,828 1.6 $6,141 $352 $8,437EGN Energen Corp $24.42 97.1 $2,370 $122 2,128 2.3 $750 $1 $3,119GPOR Gulfport Energy Corp $27.16 108.3 $2,942 $78 2,755 1.7 $965 $228 $3,679GTE Gran Tierra Energy Inc $2.12 274.5 $582 $2 1,165 1.7 $0 $187 $395
5 KEL CN Kelt Exploration Ltd $3.10 168.7 $523 $2 1,845 5.4 $148 $1 $670LPI Laredo Petroleum Inc $4.10 213.7 $876 $40 3,798 5.4 $1,416 $76 $2,216
5 MEG CN MEG Energy Corp $4.17 225.0 $938 $12 3,530 3.9 $5,041 $351 $5,629MTDR Matador Resources Co $15.00 85.6 $1,283 $26 1,819 4.5 $391 $14 $1,661MUR Murphy Oil Corp $15.76 172.0 $2,711 $108 4,840 3.5 $3,340 $879 $5,172
5 NVA CN NuVista Energy Ltd $4.12 153.3 $632 $1 903 18.6 $173 $0 $804OAS Oasis Petroleum Inc $4.80 180.6 $867 $34 13,374 2.9 $2,380 $12 $3,234PDCE PDC Energy Inc $48.70 40.3 $1,961 $86 1,218 5.2 $663 $4 $2,621
5 POU CN Paramount Resources Ltd $5.00 106.2 $531 $8 2,230 3.8 $1,776 $21 $2,2865 PWT CN Penn West Petroleum Ltd $1.29 502.2 $648 $2 4,013 9.8 $2,249 $0 $2,8975 PXT CN Parex Resources Inc $9.29 151.5 $1,407 $6 812 3.5 $0 $109 $1,298
QEP QEP Resources Inc $10.52 176.8 $1,859 $65 4,499 3.1 $2,219 $496 $3,582RICE Rice Energy Inc $8.50 136.4 $1,159 $30 3,415 5.1 $1,521 $216 $2,915
5 RRX CN Raging River Exploration Inc $9.21 213.4 $1,966 $31 1,818 3.6 $58 $0 $2,024RSPP RSP Permian Inc $20.31 101.7 $2,065 $37 1,790 5.4 $699 $57 $2,706SM SM Energy Co $8.24 68.1 $561 $46 3,721 4.1 $2,534 $0 $3,095
5 SPE CN Spartan Energy Corp $2.44 265.1 $647 $2 2,855 2.2 $82 $0 $729SWN Southwestern Energy Co $7.09 384.5 $2,726 $243 20,564 5.0 $4,664 $15 $9,100
6 SYRG Synergy Resources Corp $5.91 124.0 $733 $8 2,787 4.6 $78 $81 $7305 TOG CN TORC Oil & Gas Ltd $5.50 161.2 $887 $33 2,955 1.2 $224 $0 $1,1115 WCP CN Whitecap Resources Inc $6.93 300.6 $2,083 $32 5,359 0.7 $783 $0 $2,867
WLL Whiting Petroleum Corp $4.32 204.1 $882 $81 17,805 1.9 $5,255 $38 $6,107WPX WPX Energy Inc $4.00 275.3 $1,101 $41 9,646 4.1 $3,400 $99 $4,752
Average $1,304 $43 5,590 4.2 $1,916 $145 $3,192Median $1,101 $32 2,855 3.8 $965 $14 $2,663
13
Source: EnerCom, Company filings, Bloomberg L.P.Footnotes to the tables and glossary of terms can be found beginning on page 37.
EnerCom E&P WeeklyFebruary 19, 2016

14
1 2
Daily 3 Mo AvgShare Shares Market Value Daily Short 3Q 2015 3Q 2015Price O/S Cap Traded Trading Vol Interest Debt Cash EV
2/19/2016 (MM) ($MM) ($MM) (000's) Ratio ($MM) ($MM) ($MM)
Small CapBBEP BreitBurn Energy Partners LP $0.56 211.9 $119 $1 2,631 5.8 $3,044 $12 $3,698BBG Bill Barrett Corp $2.73 50.0 $136 $3 1,835 7.7 $804 $93 $848
5 BNP CN Bonavista Energy Corp $1.88 214.0 $402 $2 1,714 2.2 $1,246 $0 $1,6485 BXE CN Bellatrix Exploration Ltd $1.51 192.0 $290 $2 1,418 8.0 $672 $0 $9625 CR CN Crew Energy Inc $3.06 141.1 $432 $4 1,429 8.8 $214 $0 $646
CRC California Resources Corp $0.32 387.5 $124 $9 11,386 4.3 $6,420 $4 $6,540CWEI Clayton Williams Energy Inc $10.60 12.2 $129 $3 265 6.7 $750 $9 $870
5 DEE CN Delphi Energy Corp $0.74 155.5 $115 $0 278 24.4 $122 $2 $235DNR Denbury Resources Inc $1.01 355.5 $359 $17 12,667 5.0 $3,357 $12 $3,704ECR Eclipse Resources Corp $0.70 222.7 $156 $0 796 18.2 $539 $228 $467EPE EP Energy Corp $1.92 248.0 $476 $12 2,278 8.5 $4,931 $28 $5,379
8 EPM Evolution Petroleum Corp $4.24 32.9 $139 $1 83 12.1 $0 $16 $131ERN Erin Energy Corp $2.07 211.6 $438 $0 111 33.1 $231 $4 $665
5 GXO CN Granite Oil Corp $7.38 30.4 $224 $0 125 10.5 $45 $0 $269LINE Linn Energy LLC $0.47 355.0 $168 $2 4,521 1.7 $9,528 $345 $9,352MCF Contango Oil & Gas Co $5.44 19.4 $106 $0 149 7.9 $115 $0 $220NOG Northern Oil and Gas Inc $2.69 63.0 $169 $3 1,479 16.0 $868 $7 $1,030PGH Pengrowth Energy Corp $0.72 543.0 $392 $0 1,146 4.7 $2,069 $0 $2,461
9 PHX Panhandle Oil and Gas Inc $14.39 16.6 $239 $1 59 8.4 $65 $1 $3035 PNE CN Pine Cliff Energy Ltd $0.80 305.5 $244 $0 610 0.1 $44 $0 $2885 PPY CN Painted Pony Petroleum Ltd $3.87 100.0 $387 $3 1,522 3.2 $46 $0 $4335 PXX CN BlackPearl Resources Inc $0.55 335.6 $185 $0 393 19.1 $97 $5 $2775 RMP CN RMP Energy Inc $1.38 126.5 $175 $1 1,258 1.7 $131 $0 $305
SGY Stone Energy Corp $2.07 57.1 $118 $10 3,496 4.7 $1,052 $74 $1,096SN Sanchez Energy Corp $2.81 61.9 $174 $3 2,209 6.8 $1,747 $197 $1,992
5 TET CN Trilogy Energy Corp $2.99 105.3 $315 $2 864 1.4 $650 $0 $9655 TVE CN Tamarack Valley Energy Ltd $3.16 100.0 $316 $1 465 0.6 $94 $0 $410
UNT Unit Corp $5.95 50.4 $300 $9 1,233 5.2 $912 $1 $1,211WTI W&T Offshore Inc $1.56 76.0 $119 $2 1,284 11.8 $1,473 $7 $1,584XCO EXCO Resources Inc $0.94 282.1 $265 $2 3,754 11.4 $1,545 $21 $1,789
Average $240 $3 2,049 8.7 $1,427 $36 $1,659Median $204 $2 1,271 7.2 $711 $4 $916
Micro CapANFC Black Ridge Oil and Gas Inc $0.06 48.0 $3 $0 39 0.9 $57 $0 $60AREX Approach Resources Inc $0.76 40.5 $31 $0 644 15.5 $516 $0 $546AXAS Abraxas Petroleum Corp $0.93 106.3 $99 $1 978 11.4 $127 $0 $226
5 BBI CN Blackbird Energy Inc $0.15 357.9 $52 $0 606 0.0 $0 $21 $31BCEI Bonanza Creek Energy Inc $1.58 49.8 $79 $3 3,003 6.6 $876 $25 $929
5 CKE CN Chinook Energy Inc $0.43 215.3 $93 $0 163 0.1 $0 $46 $465 CLC CN Connacher Oil and Gas Ltd $0.20 28.3 $6 $0 46 0.0 $252 $73 $1855 CQE CN Cequence Energy Ltd $0.34 211.0 $72 $0 351 0.0 $58 $22 $108
CRK Comstock Resources Inc $1.04 47.7 $50 $2 1,476 7.0 $1,297 $164 $1,183EGY VAALCO Energy Inc $1.10 58.4 $64 $1 262 4.7 $15 $41 $39EOX Emerald Oil Inc $0.73 8.7 $6 $0 193 14.0 $311 $5 $312
8 EXXI Energy XXI Ltd $0.47 95.5 $45 $1 2,130 9.4 $4,013 $491 $3,766GST Gastar Exploration Inc $0.98 78.9 $77 $0 829 26.8 $397 $10 $619HK Halcon Resources Corp $0.43 121.0 $52 $0 1,844 8.1 $3,111 $6 $3,313JONE Jones Energy Inc $1.37 30.5 $42 $0 300 4.6 $837 $23 $1,393LGCY Legacy Reserves LP $0.84 69.5 $58 $0 567 10.3 $1,452 $2 $1,746
5 LRE CN Long Run Exploration Ltd $0.37 193.5 $72 $0 1,559 0.7 $665 $0 $7365 LTS CN Lightstream Resources Ltd $0.35 198.3 $69 $0 706 2.9 $1,554 $0 $1,6235 MEI CN Manitok Energy Inc $0.13 161.1 $21 $0 175 8.1 $80 $0 $1015 MQL CN Marquee Energy Ltd $0.32 123.2 $39 $0 109 NA $53 $0 $925 PMT CN Perpetual Energy Inc $0.05 1047.7 $47 $0 2,240 0.3 $375 $0 $422
PQ PetroQuest Energy Inc $0.49 70.2 $35 $0 423 14.2 $350 $159 $2265 RE CN Rock Energy Inc $1.06 47.5 $50 $0 196 0.2 $61 $0 $112
REN Resolute Energy Corp $0.49 77.5 $38 $0 298 23.7 $716 $1 $753REXX Rex Energy Corp $0.56 55.7 $31 $1 2,611 11.0 $745 $3 $934
5 SOG CN Strategic Oil & Gas Ltd $0.12 542.3 $62 $0 190 0.1 $52 $2 $112SPP Sanchez Production Partners LP $14.00 3.0 $43 $0 25 2.9 $106 $9 $156
5 TBE CN Twin Butte Energy Ltd $0.07 354.1 $23 $0 2,955 1.0 $210 $0 $2337 TPLM Triangle Petroleum Corp $0.38 75.7 $28 $0 652 18.5 $815 $36 $8075 TVL CN Traverse Energy Ltd $0.32 71.9 $23 $0 42 0.0 $0 $3 $20
UPL Ultra Petroleum Corp $0.20 153.3 $30 $10 7,470 3.8 $3,408 $26 $3,413USEG US Energy Corp Wyoming $0.39 28.4 $11 $0 178 0.6 $6 $4 $13WRES Warren Resources Inc $0.11 85.2 $9 $0 919 2.3 $449 $10 $449
5 YGR CN Yangarra Resources Ltd $0.59 67.7 $40 $0 72 0.0 $56 $0 $965 YO CN Yoho Resources Inc $0.22 61.2 $13 NA 69 NA $29 $0 $42
YUMA Yuma Energy Inc $0.21 71.7 $15 $0 114 0.3 $30 $5 $515 ZAR CN Zargon Oil & Gas Ltd $0.41 30.4 $12 $0 144 7.0 $52 $0 $64ZAR CN
Average $42 $1 935 6.2 $625 $32 $675Median $40 $0 351 3.8 $252 $4 $226
Source: EnerCom, Company filings, Bloomberg L.P.Footnotes to the tables and glossary of terms can be found beginning on page 37.
EnerCom E&P WeeklyFebruary 19, 2016
1 2
Daily 3 Mo AvgShare Shares Market Value Daily Short 3Q 2015 3Q 2015Price O/S Cap Traded Trading Vol Interest Debt Cash EV
2/19/2016 (MM) ($MM) ($MM) (000's) Ratio ($MM) ($MM) ($MM)
Small CapBBEP BreitBurn Energy Partners LP $0.56 211.9 $119 $1 2,631 5.8 $3,044 $12 $3,698BBG Bill Barrett Corp $2.73 50.0 $136 $3 1,835 7.7 $804 $93 $848
5 BNP CN Bonavista Energy Corp $1.88 214.0 $402 $2 1,714 2.2 $1,246 $0 $1,6485 BXE CN Bellatrix Exploration Ltd $1.51 192.0 $290 $2 1,418 8.0 $672 $0 $9625 CR CN Crew Energy Inc $3.06 141.1 $432 $4 1,429 8.8 $214 $0 $646
CRC California Resources Corp $0.32 387.5 $124 $9 11,386 4.3 $6,420 $4 $6,540CWEI Clayton Williams Energy Inc $10.60 12.2 $129 $3 265 6.7 $750 $9 $870
5 DEE CN Delphi Energy Corp $0.74 155.5 $115 $0 278 24.4 $122 $2 $235DNR Denbury Resources Inc $1.01 355.5 $359 $17 12,667 5.0 $3,357 $12 $3,704ECR Eclipse Resources Corp $0.70 222.7 $156 $0 796 18.2 $539 $228 $467EPE EP Energy Corp $1.92 248.0 $476 $12 2,278 8.5 $4,931 $28 $5,379
8 EPM Evolution Petroleum Corp $4.24 32.9 $139 $1 83 12.1 $0 $16 $131ERN Erin Energy Corp $2.07 211.6 $438 $0 111 33.1 $231 $4 $665
5 GXO CN Granite Oil Corp $7.38 30.4 $224 $0 125 10.5 $45 $0 $269LINE Linn Energy LLC $0.47 355.0 $168 $2 4,521 1.7 $9,528 $345 $9,352MCF Contango Oil & Gas Co $5.44 19.4 $106 $0 149 7.9 $115 $0 $220NOG Northern Oil and Gas Inc $2.69 63.0 $169 $3 1,479 16.0 $868 $7 $1,030PGH Pengrowth Energy Corp $0.72 543.0 $392 $0 1,146 4.7 $2,069 $0 $2,461
9 PHX Panhandle Oil and Gas Inc $14.39 16.6 $239 $1 59 8.4 $65 $1 $3035 PNE CN Pine Cliff Energy Ltd $0.80 305.5 $244 $0 610 0.1 $44 $0 $2885 PPY CN Painted Pony Petroleum Ltd $3.87 100.0 $387 $3 1,522 3.2 $46 $0 $4335 PXX CN BlackPearl Resources Inc $0.55 335.6 $185 $0 393 19.1 $97 $5 $2775 RMP CN RMP Energy Inc $1.38 126.5 $175 $1 1,258 1.7 $131 $0 $305
SGY Stone Energy Corp $2.07 57.1 $118 $10 3,496 4.7 $1,052 $74 $1,096SN Sanchez Energy Corp $2.81 61.9 $174 $3 2,209 6.8 $1,747 $197 $1,992
5 TET CN Trilogy Energy Corp $2.99 105.3 $315 $2 864 1.4 $650 $0 $9655 TVE CN Tamarack Valley Energy Ltd $3.16 100.0 $316 $1 465 0.6 $94 $0 $410
UNT Unit Corp $5.95 50.4 $300 $9 1,233 5.2 $912 $1 $1,211WTI W&T Offshore Inc $1.56 76.0 $119 $2 1,284 11.8 $1,473 $7 $1,584XCO EXCO Resources Inc $0.94 282.1 $265 $2 3,754 11.4 $1,545 $21 $1,789
Average $240 $3 2,049 8.7 $1,427 $36 $1,659Median $204 $2 1,271 7.2 $711 $4 $916
Micro CapANFC Black Ridge Oil and Gas Inc $0.06 48.0 $3 $0 39 0.9 $57 $0 $60AREX Approach Resources Inc $0.76 40.5 $31 $0 644 15.5 $516 $0 $546AXAS Abraxas Petroleum Corp $0.93 106.3 $99 $1 978 11.4 $127 $0 $226
5 BBI CN Blackbird Energy Inc $0.15 357.9 $52 $0 606 0.0 $0 $21 $31BCEI Bonanza Creek Energy Inc $1.58 49.8 $79 $3 3,003 6.6 $876 $25 $929
5 CKE CN Chinook Energy Inc $0.43 215.3 $93 $0 163 0.1 $0 $46 $465 CLC CN Connacher Oil and Gas Ltd $0.20 28.3 $6 $0 46 0.0 $252 $73 $1855 CQE CN Cequence Energy Ltd $0.34 211.0 $72 $0 351 0.0 $58 $22 $108
CRK Comstock Resources Inc $1.04 47.7 $50 $2 1,476 7.0 $1,297 $164 $1,183EGY VAALCO Energy Inc $1.10 58.4 $64 $1 262 4.7 $15 $41 $39EOX Emerald Oil Inc $0.73 8.7 $6 $0 193 14.0 $311 $5 $312
8 EXXI Energy XXI Ltd $0.47 95.5 $45 $1 2,130 9.4 $4,013 $491 $3,766GST Gastar Exploration Inc $0.98 78.9 $77 $0 829 26.8 $397 $10 $619HK Halcon Resources Corp $0.43 121.0 $52 $0 1,844 8.1 $3,111 $6 $3,313JONE Jones Energy Inc $1.37 30.5 $42 $0 300 4.6 $837 $23 $1,393LGCY Legacy Reserves LP $0.84 69.5 $58 $0 567 10.3 $1,452 $2 $1,746
5 LRE CN Long Run Exploration Ltd $0.37 193.5 $72 $0 1,559 0.7 $665 $0 $7365 LTS CN Lightstream Resources Ltd $0.35 198.3 $69 $0 706 2.9 $1,554 $0 $1,6235 MEI CN Manitok Energy Inc $0.13 161.1 $21 $0 175 8.1 $80 $0 $1015 MQL CN Marquee Energy Ltd $0.32 123.2 $39 $0 109 NA $53 $0 $925 PMT CN Perpetual Energy Inc $0.05 1047.7 $47 $0 2,240 0.3 $375 $0 $422
PQ PetroQuest Energy Inc $0.49 70.2 $35 $0 423 14.2 $350 $159 $2265 RE CN Rock Energy Inc $1.06 47.5 $50 $0 196 0.2 $61 $0 $112
REN Resolute Energy Corp $0.49 77.5 $38 $0 298 23.7 $716 $1 $753REXX Rex Energy Corp $0.56 55.7 $31 $1 2,611 11.0 $745 $3 $934
5 SOG CN Strategic Oil & Gas Ltd $0.12 542.3 $62 $0 190 0.1 $52 $2 $112SPP Sanchez Production Partners LP $14.00 3.0 $43 $0 25 2.9 $106 $9 $156
5 TBE CN Twin Butte Energy Ltd $0.07 354.1 $23 $0 2,955 1.0 $210 $0 $2337 TPLM Triangle Petroleum Corp $0.38 75.7 $28 $0 652 18.5 $815 $36 $8075 TVL CN Traverse Energy Ltd $0.32 71.9 $23 $0 42 0.0 $0 $3 $20
UPL Ultra Petroleum Corp $0.20 153.3 $30 $10 7,470 3.8 $3,408 $26 $3,413USEG US Energy Corp Wyoming $0.39 28.4 $11 $0 178 0.6 $6 $4 $13WRES Warren Resources Inc $0.11 85.2 $9 $0 919 2.3 $449 $10 $449
5 YGR CN Yangarra Resources Ltd $0.59 67.7 $40 $0 72 0.0 $56 $0 $965 YO CN Yoho Resources Inc $0.22 61.2 $13 NA 69 NA $29 $0 $42
YUMA Yuma Energy Inc $0.21 71.7 $15 $0 114 0.3 $30 $5 $515 ZAR CN Zargon Oil & Gas Ltd $0.41 30.4 $12 $0 144 7.0 $52 $0 $64ZAR CN
Average $42 $1 935 6.2 $625 $32 $675Median $40 $0 351 3.8 $252 $4 $226
1 2
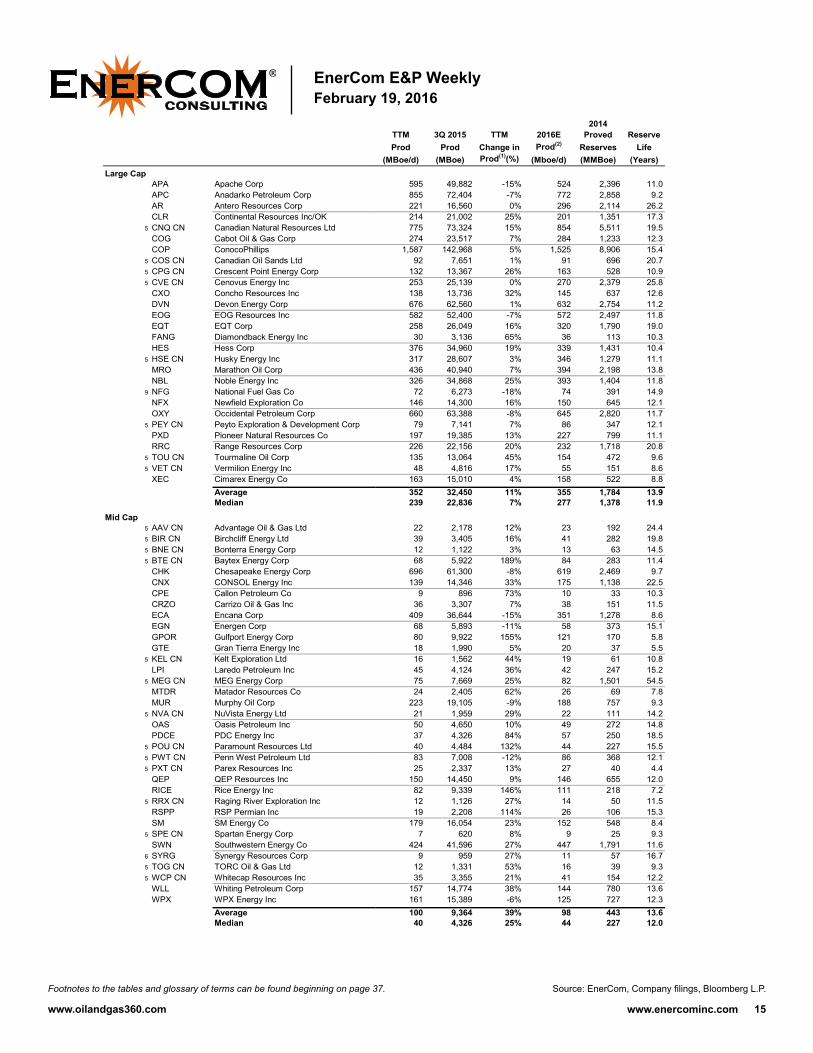
Large CapAPA Apache CorpAPC Anadarko Petroleum CorpAR Antero Resources CorpCLR Continental Resources Inc/OK
5 CNQ CN Canadian Natural Resources LtdCOG Cabot Oil & Gas CorpCOP ConocoPhillips
5 COS CN Canadian Oil Sands Ltd5 CPG CN Crescent Point Energy Corp5 CVE CN Cenovus Energy Inc
CXO Concho Resources IncDVN Devon Energy CorpEOG EOG Resources IncEQT EQT CorpFANG Diamondback Energy IncHES Hess Corp
5 HSE CN Husky Energy IncMRO Marathon Oil CorpNBL Noble Energy Inc
9 NFG National Fuel Gas CoNFX Newfield Exploration CoOXY Occidental Petroleum Corp
5 PEY CN Peyto Exploration & Development CorpPXD Pioneer Natural Resources CoRRC Range Resources Corp
5 TOU CN Tourmaline Oil Corp5 VET CN Vermilion Energy Inc
XEC Cimarex Energy CoAverageMedian
Mid Cap5 AAV CN Advantage Oil & Gas Ltd5 BIR CN Birchcliff Energy Ltd5 BNE CN Bonterra Energy Corp5 BTE CN Baytex Energy Corp
CHK Chesapeake Energy CorpCNX CONSOL Energy IncCPE Callon Petroleum CoCRZO Carrizo Oil & Gas IncECA Encana CorpEGN Energen CorpGPOR Gulfport Energy CorpGTE Gran Tierra Energy Inc
5 KEL CN Kelt Exploration LtdLPI Laredo Petroleum Inc
5 MEG CN MEG Energy CorpMTDR Matador Resources CoMUR Murphy Oil Corp
5 NVA CN NuVista Energy LtdOAS Oasis Petroleum IncPDCE PDC Energy Inc
5 POU CN Paramount Resources Ltd5 PWT CN Penn West Petroleum Ltd5 PXT CN Parex Resources Inc
QEP QEP Resources IncRICE Rice Energy Inc
5 RRX CN Raging River Exploration IncRSPP RSP Permian IncSM SM Energy Co
5 SPE CN Spartan Energy CorpSWN Southwestern Energy Co
6 SYRG Synergy Resources Corp5 TOG CN TORC Oil & Gas Ltd5 WCP CN Whitecap Resources Inc
WLL Whiting Petroleum CorpWPX WPX Energy Inc
AverageMedian
2014TTM 3Q 2015 TTM 2016E Proved ReserveProd Prod Change in Prod(2) Reserves Life
(MBoe/d) (MBoe) Prod(1)(%) (Mboe/d) (MMBoe) (Years)
595 49,882 -15% 524 2,396 11.0855 72,404 -7% 772 2,858 9.2221 16,560 0% 296 2,114 26.2214 21,002 25% 201 1,351 17.3775 73,324 15% 854 5,511 19.5274 23,517 7% 284 1,233 12.3
1,587 142,968 5% 1,525 8,906 15.492 7,651 1% 91 696 20.7
132 13,367 26% 163 528 10.9253 25,139 0% 270 2,379 25.8138 13,736 32% 145 637 12.6676 62,560 1% 632 2,754 11.2582 52,400 -7% 572 2,497 11.8258 26,049 16% 320 1,790 19.030 3,136 65% 36 113 10.3
376 34,960 19% 339 1,431 10.4317 28,607 3% 346 1,279 11.1436 40,940 7% 394 2,198 13.8326 34,868 25% 393 1,404 11.872 6,273 -18% 74 391 14.9
146 14,300 16% 150 645 12.1660 63,388 -8% 645 2,820 11.779 7,141 7% 86 347 12.1
197 19,385 13% 227 799 11.1226 22,156 20% 232 1,718 20.8135 13,064 45% 154 472 9.648 4,816 17% 55 151 8.6
163 15,010 4% 158 522 8.8352 32,450 11% 355 1,784 13.9239 22,836 7% 277 1,378 11.9
22 2,178 12% 23 192 24.439 3,405 16% 41 282 19.812 1,122 3% 13 63 14.568 5,922 189% 84 283 11.4
696 61,300 -8% 619 2,469 9.7139 14,346 33% 175 1,138 22.5
9 896 73% 10 33 10.336 3,307 7% 38 151 11.5
409 36,644 -15% 351 1,278 8.668 5,893 -11% 58 373 15.180 9,922 155% 121 170 5.818 1,990 5% 20 37 5.516 1,562 44% 19 61 10.845 4,124 36% 42 247 15.275 7,669 25% 82 1,501 54.524 2,405 62% 26 69 7.8
223 19,105 -9% 188 757 9.321 1,959 29% 22 111 14.250 4,650 10% 49 272 14.837 4,326 84% 57 250 18.540 4,484 132% 44 227 15.583 7,008 -12% 86 368 12.125 2,337 13% 27 40 4.4
150 14,450 9% 146 655 12.082 9,339 146% 111 218 7.212 1,126 27% 14 50 11.519 2,208 114% 26 106 15.3
179 16,054 23% 152 548 8.47 620 8% 9 25 9.3
424 41,596 27% 447 1,791 11.69 959 27% 11 57 16.7
12 1,331 53% 16 39 9.335 3,355 21% 41 154 12.2
157 14,774 38% 144 780 13.6161 15,389 -6% 125 727 12.3100 9,364 39% 98 443 13.640 4,326 25% 44 227 12.0
15
Source: EnerCom, Company filings, Bloomberg L.P.Footnotes to the tables and glossary of terms can be found beginning on page 37.
EnerCom E&P WeeklyFebruary 19, 2016

16
1 2
Large CapSmall CapBBEP BreitBurn Energy Partners LPBBG Bill Barrett Corp
5 BNP CN Bonavista Energy Corp5 BXE CN Bellatrix Exploration Ltd5 CR CN Crew Energy Inc
CRC California Resources CorpCWEI Clayton Williams Energy Inc
5 DEE CN Delphi Energy CorpDNR Denbury Resources IncECR Eclipse Resources CorpEPE EP Energy Corp
8 EPM Evolution Petroleum CorpERN Erin Energy Corp
5 GXO CN Granite Oil CorpLINE Linn Energy LLCMCF Contango Oil & Gas CoNOG Northern Oil and Gas IncPGH Pengrowth Energy Corp
9 PHX Panhandle Oil and Gas Inc5 PNE CN Pine Cliff Energy Ltd5 PPY CN Painted Pony Petroleum Ltd5 PXX CN BlackPearl Resources Inc5 RMP CN RMP Energy Inc
SGY Stone Energy CorpSN Sanchez Energy Corp
5 TET CN Trilogy Energy Corp5 TVE CN Tamarack Valley Energy Ltd
UNT Unit CorpWTI W&T Offshore IncXCO EXCO Resources Inc
AverageMedian
Micro CapANFC Black Ridge Oil and Gas IncAREX Approach Resources IncAXAS Abraxas Petroleum Corp
5 BBI CN Blackbird Energy IncBCEI Bonanza Creek Energy Inc
5 CKE CN Chinook Energy Inc5 CLC CN Connacher Oil and Gas Ltd5 CQE CN Cequence Energy Ltd
CRK Comstock Resources IncEGY VAALCO Energy IncEOX Emerald Oil Inc
8 EXXI Energy XXI LtdGST Gastar Exploration IncHK Halcon Resources CorpJONE Jones Energy IncLGCY Legacy Reserves LP
5 LRE CN Long Run Exploration Ltd5 LTS CN Lightstream Resources Ltd5 MEI CN Manitok Energy Inc5 MQL CN Marquee Energy Ltd5 PMT CN Perpetual Energy Inc
PQ PetroQuest Energy Inc5 RE CN Rock Energy Inc
REN Resolute Energy CorpREXX Rex Energy Corp
5 SOG CN Strategic Oil & Gas LtdSPP Sanchez Production Partners LP
5 TBE CN Twin Butte Energy Ltd7 TPLM Triangle Petroleum Corp5 TVL CN Traverse Energy Ltd
UPL Ultra Petroleum CorpUSEG US Energy Corp WyomingWRES Warren Resources Inc
5 YGR CN Yangarra Resources Ltd5 YO CN Yoho Resources Inc
YUMA Yuma Energy Inc5 ZAR CN Zargon Oil & Gas LtdZAR CN
AverageMedian
2014TTM 3Q 2015 TTM 2016E Proved ReserveProd Prod Change in Prod(2) Reserves Life
(MBoe/d) (MBoe) Prod(1)(%) (Mboe/d) (MMBoe) (Years)
52 4,980 46% 55 315 16.517 1,699 -36% 18 122 19.473 6,602 9% 79 276 10.436 3,408 20% 41 161 12.116 1,381 -11% 19 107 17.8
162 14,536 -1% 160 768 12.916 1,433 0% 16 75 12.59 657 -12% 9 43 12.6
74 6,570 -3% 67 438 16.329 3,453 163% 38 59 5.5
105 10,533 13% 99 622 16.22 156 278% NA 12 22.02 571 202% NA 9 15.97 233 -74% 7 35 14.3
207 18,369 -4% 199 1,217 16.116 1,393 -11% 15 46 7.717 1,458 -4% 16 101 16.464 6,214 13% 60 310 13.36 537 -15% NA 30 13.1
11 1,064 89% 13 26 6.415 1,391 10% 16 123 22.77 557 -21% 8 66 26.5
10 847 -11% 12 26 6.844 3,662 1% 34 153 9.449 4,862 37% 52 135 7.529 2,166 -25% 28 96 9.27 714 55% 8 17 6.7
55 5,053 10% 50 179 8.948 4,302 0% 47 120 6.958 5,217 -5% 57 211 10.041 3,801 24% 45 197 13.123 1,932 0% 34 113 12.8
1 99 41% NA 5 13.415 1,525 17% 15 146 26.16 552 -15% 6 42 18.90 0 -91% 1 1 87.9
28 2,664 14% 28 90 8.96 430 -25% 6 18 7.9
13 1,272 3% NA 219 44.59 795 2% 10 57 16.8
29 2,881 5% 30 103 9.75 406 80% 5 8 5.15 523 49% 5 26 14.8
59 5,419 1% 56 183 8.513 1,249 39% 14 102 21.643 3,748 -6% 41 189 12.125 2,324 3% 25 115 12.635 3,786 28% 47 139 10.832 2,819 0% 33 104 8.829 2,487 -18% 31 103 9.63 292 16% 4 6 4.85 381 -7% 5 13 7.6
18 1,579 1% 20 56 8.518 1,239 -36% 16 66 10.34 339 7% 4 9 6.0
13 1,144 -2% 14 74 15.433 2,979 15% 33 223 18.83 165 -29% 2 7 7.84 367 -3% NA 17 11.3
16 1,318 -14% 17 36 6.214 1,259 12% 13 59 11.61 85 -1% 1 1 3.7
131 12,562 21% 129 895 18.71 81 -43% NA 5 13.3
16 1,460 173% NA 71 12.42 197 -25% 2 20 22.22 161 24% 1 17 27.72 166 2% NA 20 30.64 352 -21% 5 14 9.5
17 1,597 6% 20 88 15.813 1,144 2% 14 56 11.6
Source: EnerCom, Company filings, Bloomberg L.P.Footnotes to the tables and glossary of terms can be found beginning on page 37.
EnerCom E&P WeeklyFebruary 19, 2016

1 2
Large CapSmall CapBBEP BreitBurn Energy Partners LPBBG Bill Barrett Corp
5 BNP CN Bonavista Energy Corp5 BXE CN Bellatrix Exploration Ltd5 CR CN Crew Energy Inc
CRC California Resources CorpCWEI Clayton Williams Energy Inc
5 DEE CN Delphi Energy CorpDNR Denbury Resources IncECR Eclipse Resources CorpEPE EP Energy Corp
8 EPM Evolution Petroleum CorpERN Erin Energy Corp
5 GXO CN Granite Oil CorpLINE Linn Energy LLCMCF Contango Oil & Gas CoNOG Northern Oil and Gas IncPGH Pengrowth Energy Corp
9 PHX Panhandle Oil and Gas Inc5 PNE CN Pine Cliff Energy Ltd5 PPY CN Painted Pony Petroleum Ltd5 PXX CN BlackPearl Resources Inc5 RMP CN RMP Energy Inc
SGY Stone Energy CorpSN Sanchez Energy Corp
5 TET CN Trilogy Energy Corp5 TVE CN Tamarack Valley Energy Ltd
UNT Unit CorpWTI W&T Offshore IncXCO EXCO Resources Inc
AverageMedian
Micro CapANFC Black Ridge Oil and Gas IncAREX Approach Resources IncAXAS Abraxas Petroleum Corp
5 BBI CN Blackbird Energy IncBCEI Bonanza Creek Energy Inc
5 CKE CN Chinook Energy Inc5 CLC CN Connacher Oil and Gas Ltd5 CQE CN Cequence Energy Ltd
CRK Comstock Resources IncEGY VAALCO Energy IncEOX Emerald Oil Inc
8 EXXI Energy XXI LtdGST Gastar Exploration IncHK Halcon Resources CorpJONE Jones Energy IncLGCY Legacy Reserves LP
5 LRE CN Long Run Exploration Ltd5 LTS CN Lightstream Resources Ltd5 MEI CN Manitok Energy Inc5 MQL CN Marquee Energy Ltd5 PMT CN Perpetual Energy Inc
PQ PetroQuest Energy Inc5 RE CN Rock Energy Inc
REN Resolute Energy CorpREXX Rex Energy Corp
5 SOG CN Strategic Oil & Gas LtdSPP Sanchez Production Partners LP
5 TBE CN Twin Butte Energy Ltd7 TPLM Triangle Petroleum Corp5 TVL CN Traverse Energy Ltd
UPL Ultra Petroleum CorpUSEG US Energy Corp WyomingWRES Warren Resources Inc
5 YGR CN Yangarra Resources Ltd5 YO CN Yoho Resources Inc
YUMA Yuma Energy Inc5 ZAR CN Zargon Oil & Gas LtdZAR CN
AverageMedian
2014TTM 3Q 2015 TTM 2016E Proved ReserveProd Prod Change in Prod(2) Reserves Life
(MBoe/d) (MBoe) Prod(1)(%) (Mboe/d) (MMBoe) (Years)
52 4,980 46% 55 315 16.517 1,699 -36% 18 122 19.473 6,602 9% 79 276 10.436 3,408 20% 41 161 12.116 1,381 -11% 19 107 17.8
162 14,536 -1% 160 768 12.916 1,433 0% 16 75 12.59 657 -12% 9 43 12.6
74 6,570 -3% 67 438 16.329 3,453 163% 38 59 5.5
105 10,533 13% 99 622 16.22 156 278% NA 12 22.02 571 202% NA 9 15.97 233 -74% 7 35 14.3
207 18,369 -4% 199 1,217 16.116 1,393 -11% 15 46 7.717 1,458 -4% 16 101 16.464 6,214 13% 60 310 13.36 537 -15% NA 30 13.1
11 1,064 89% 13 26 6.415 1,391 10% 16 123 22.77 557 -21% 8 66 26.5
10 847 -11% 12 26 6.844 3,662 1% 34 153 9.449 4,862 37% 52 135 7.529 2,166 -25% 28 96 9.27 714 55% 8 17 6.7
55 5,053 10% 50 179 8.948 4,302 0% 47 120 6.958 5,217 -5% 57 211 10.041 3,801 24% 45 197 13.123 1,932 0% 34 113 12.8
1 99 41% NA 5 13.415 1,525 17% 15 146 26.16 552 -15% 6 42 18.90 0 -91% 1 1 87.9
28 2,664 14% 28 90 8.96 430 -25% 6 18 7.9
13 1,272 3% NA 219 44.59 795 2% 10 57 16.8
29 2,881 5% 30 103 9.75 406 80% 5 8 5.15 523 49% 5 26 14.8
59 5,419 1% 56 183 8.513 1,249 39% 14 102 21.643 3,748 -6% 41 189 12.125 2,324 3% 25 115 12.635 3,786 28% 47 139 10.832 2,819 0% 33 104 8.829 2,487 -18% 31 103 9.63 292 16% 4 6 4.85 381 -7% 5 13 7.6
18 1,579 1% 20 56 8.518 1,239 -36% 16 66 10.34 339 7% 4 9 6.0
13 1,144 -2% 14 74 15.433 2,979 15% 33 223 18.83 165 -29% 2 7 7.84 367 -3% NA 17 11.3
16 1,318 -14% 17 36 6.214 1,259 12% 13 59 11.61 85 -1% 1 1 3.7
131 12,562 21% 129 895 18.71 81 -43% NA 5 13.3
16 1,460 173% NA 71 12.42 197 -25% 2 20 22.22 161 24% 1 17 27.72 166 2% NA 20 30.64 352 -21% 5 14 9.5
17 1,597 6% 20 88 15.813 1,144 2% 14 56 11.6
1 2
Large CapAPA Apache CorpAPC Anadarko Petroleum CorpAR Antero Resources CorpCLR Continental Resources Inc/OK
5 CNQ CN Canadian Natural Resources LtdCOG Cabot Oil & Gas CorpCOP ConocoPhillips
5 COS CN Canadian Oil Sands Ltd5 CPG CN Crescent Point Energy Corp5 CVE CN Cenovus Energy Inc
CXO Concho Resources IncDVN Devon Energy CorpEOG EOG Resources IncEQT EQT CorpFANG Diamondback Energy IncHES Hess Corp
5 HSE CN Husky Energy IncMRO Marathon Oil CorpNBL Noble Energy Inc
9 NFG National Fuel Gas CoNFX Newfield Exploration CoOXY Occidental Petroleum Corp
5 PEY CN Peyto Exploration & Development CorpPXD Pioneer Natural Resources CoRRC Range Resources Corp
5 TOU CN Tourmaline Oil Corp5 VET CN Vermilion Energy Inc
XEC Cimarex Energy CoAverageMedian
Mid Cap5 AAV CN Advantage Oil & Gas Ltd5 BIR CN Birchcliff Energy Ltd5 BNE CN Bonterra Energy Corp5 BTE CN Baytex Energy Corp
CHK Chesapeake Energy CorpCNX CONSOL Energy IncCPE Callon Petroleum CoCRZO Carrizo Oil & Gas IncECA Encana CorpEGN Energen CorpGPOR Gulfport Energy CorpGTE Gran Tierra Energy Inc
5 KEL CN Kelt Exploration LtdLPI Laredo Petroleum Inc
5 MEG CN MEG Energy CorpMTDR Matador Resources CoMUR Murphy Oil Corp
5 NVA CN NuVista Energy LtdOAS Oasis Petroleum IncPDCE PDC Energy Inc
5 POU CN Paramount Resources Ltd5 PWT CN Penn West Petroleum Ltd5 PXT CN Parex Resources Inc
QEP QEP Resources IncRICE Rice Energy Inc
5 RRX CN Raging River Exploration IncRSPP RSP Permian IncSM SM Energy Co
5 SPE CN Spartan Energy CorpSWN Southwestern Energy Co
6 SYRG Synergy Resources Corp5 TOG CN TORC Oil & Gas Ltd5 WCP CN Whitecap Resources Inc
WLL Whiting Petroleum CorpWPX WPX Energy Inc
AverageMedian
TTM TTMNatural Asset CapEx EBITDA
PUD Gas Intensity 9/30/2015 9/30/2015(%) (%) (%) ($MM) ($MM)
31% 43% 225% $8,417 $4,95931% 51% NA $7,080 $2,30870% 83% 31% $2,960 $1,15763% 36% 41% $3,992 $2,65133% 18% 74% $5,803 $7,16439% 96% 47% $1,335 $98637% 38% 149% $12,269 $8,1080% 0% NA $482 $597
39% 7% 65% $1,996 $2,04675% 6% 55% $2,074 $3,78141% 42% 85% $3,032 $1,52025% 47% 136% $6,941 $5,67746% 36% 78% $6,177 $5,26355% 91% 35% $2,745 $1,21441% 16% 71% $978 $37647% 22% 207% $4,950 $2,77037% 35% -5382% $3,798 $3,63533% 20% 113% $4,469 $1,50437% 69% 107% $3,805 $2,08135% 91% 123% $1,018 $85148% 42% 123% $1,978 $1,32929% 24% 91% $5,597 $15,33542% 87% 44% $611 $61219% 35% 543% $2,857 $2,35048% 67% 45% $1,240 $97058% 85% 51% $1,872 $1,15034% 41% 84% $727 $59523% 53% 100% $1,322 $96640% 46% -102% $3,590 $2,92738% 41% 81% $2,909 $1,783
73% 96% 38% $263 $13560% 89% 51% $328 $21047% 29% 27% $70 $13655% 18% 56% $932 $75725% 72% 395% $4,952 $3,50953% 93% 42% $1,214 $1,47845% 22% 134% $222 $10757% 24% 57% $831 $45733% 72% 399% $2,812 $2,06229% 32% 150% $1,319 $74455% 70% 139% $1,673 $53421% 0% 807% NA $15153% 65% 85% $226 $6857% 43% 91% $890 $55486% 0% 53% $574 $41655% 65% 91% $542 $23437% 38% 109% $2,848 $1,86161% 69% 49% $310 $5646% 13% 82% $1,142 $82970% 36% 42% $667 $38074% 52% 137% $684 $14929% 27% 37% $618 $48143% 0% 72% $185 $18644% 59% 215% $1,392 $1,04151% 100% 101% $1,248 $33062% 3% 30% $264 $18161% 14% 103% $811 $25548% 45% 67% $2,011 $1,19536% 4% 29% $95 $6245% 91% 83% $7,602 $1,98973% 51% 12% $284 $8234% 18% 15% $94 $13639% 24% 45% $500 $70347% 11% 103% $2,984 -$1,12938% 72% 146% $1,372 $1,01250% 43% 117% $1,234 $61048% 38% 82% $747 $380
17
Source: EnerCom, Company filings, Bloomberg L.P.Footnotes to the tables and glossary of terms can be found beginning on page 37.
EnerCom E&P WeeklyFebruary 19, 2016

18
1 2
Large CapSmall CapBBEP BreitBurn Energy Partners LPBBG Bill Barrett Corp
5 BNP CN Bonavista Energy Corp5 BXE CN Bellatrix Exploration Ltd5 CR CN Crew Energy Inc
CRC California Resources CorpCWEI Clayton Williams Energy Inc
5 DEE CN Delphi Energy CorpDNR Denbury Resources IncECR Eclipse Resources CorpEPE EP Energy Corp
8 EPM Evolution Petroleum CorpERN Erin Energy Corp
5 GXO CN Granite Oil CorpLINE Linn Energy LLCMCF Contango Oil & Gas CoNOG Northern Oil and Gas IncPGH Pengrowth Energy Corp
9 PHX Panhandle Oil and Gas Inc5 PNE CN Pine Cliff Energy Ltd5 PPY CN Painted Pony Petroleum Ltd5 PXX CN BlackPearl Resources Inc5 RMP CN RMP Energy Inc
SGY Stone Energy CorpSN Sanchez Energy Corp
5 TET CN Trilogy Energy Corp5 TVE CN Tamarack Valley Energy Ltd
UNT Unit CorpWTI W&T Offshore IncXCO EXCO Resources Inc
AverageMedian
Micro CapANFC Black Ridge Oil and Gas IncAREX Approach Resources IncAXAS Abraxas Petroleum Corp
5 BBI CN Blackbird Energy IncBCEI Bonanza Creek Energy Inc
5 CKE CN Chinook Energy Inc5 CLC CN Connacher Oil and Gas Ltd5 CQE CN Cequence Energy Ltd
CRK Comstock Resources IncEGY VAALCO Energy IncEOX Emerald Oil Inc
8 EXXI Energy XXI LtdGST Gastar Exploration IncHK Halcon Resources CorpJONE Jones Energy IncLGCY Legacy Reserves LP
5 LRE CN Long Run Exploration Ltd5 LTS CN Lightstream Resources Ltd5 MEI CN Manitok Energy Inc5 MQL CN Marquee Energy Ltd5 PMT CN Perpetual Energy Inc
PQ PetroQuest Energy Inc5 RE CN Rock Energy Inc
REN Resolute Energy CorpREXX Rex Energy Corp
5 SOG CN Strategic Oil & Gas LtdSPP Sanchez Production Partners LP
5 TBE CN Twin Butte Energy Ltd7 TPLM Triangle Petroleum Corp5 TVL CN Traverse Energy Ltd
UPL Ultra Petroleum CorpUSEG US Energy Corp WyomingWRES Warren Resources Inc
5 YGR CN Yangarra Resources Ltd5 YO CN Yoho Resources Inc
YUMA Yuma Energy Inc5 ZAR CN Zargon Oil & Gas LtdZAR CN
AverageMedian
TTM TTMNatural Asset CapEx EBITDA
PUD Gas Intensity 9/30/2015 9/30/2015(%) (%) (%) ($MM) ($MM)
23% 37% 124% $763 $47966% 21% 74% $414 $19537% 66% 64% $500 $54953% 68% 67% $409 $20366% 75% 30% $321 $14728% 17% 224% $774 $97344% 17% 119% $266 $12853% 71% 67% $58 $4723% 17% 42% $727 $1,11845% 72% 343% $651 $7162% 33% 48% $1,691 $1,54941% 0% 24% $12 $14
100% 0% NA $152 -$8850% 26% 46% $110 $25720% 58% 88% $842 $2,08124% 65% 454% $104 $6449% 12% 57% $365 $28736% 32% 80% $425 $52540% 67% 55% $31 $463% 96% 91% $8 $29
74% 90% 70% $235 $2584% 0% 32% $125 $5242% 63% 88% $147 $10549% 54% 112% $595 $31252% 26% 94% $836 $26617% 63% 103% $116 $20632% 42% 117% $97 $6424% 60% 72% $785 $46328% 35% 287% $366 $29253% 91% 223% $369 $25544% 46% 114% $410 $35743% 48% 80% $366 $205
62% 10% 39% $25 $1959% 34% 59% $245 $12658% 22% 61% $108 $470% 54% NA $28 -$9
48% 35% 202% $573 $26111% 69% 531% $47 $4091% 0% -142% $23 -$4858% 85% 84% $105 $4032% 80% NA $365 $2459% 3% 973% $96 -$743% 13% 87% $264 $2232% 25% NA $512 $55771% 47% 61% $180 $7159% 9% 131% $890 $68248% 42% 240% $413 $2579% 50% 638% $606 $228
42% 58% 77% $144 $21033% 23% 152% $218 $36425% 47% 98% $47 -$229% 50% 65% $61 $2857% 91% 120% $101 $18940% 78% 124% $118 $9340% 4% 99% $82 $3244% 8% 220% $112 $10856% 63% 175% $287 $8532% 25% 3866% $72 $1225% 90% NA $2 $1127% 23% 61% $104 $20539% 11% 45% $374 $16814% 41% 126% $15 $1554% 90% 118% $1,441 $70656% 11% 102% $9 -$341% 76% 190% $69 $5269% 54% 29% $48 $2468% 65% 144% $35 $582% 30% NA $19 $06% 12% 64% $29 $57
44% 41% 276% $213 $12643% 41% 110% $104 $47
Source: EnerCom, Company filings, Bloomberg L.P.Footnotes to the tables and glossary of terms can be found beginning on page 37.
EnerCom E&P WeeklyFebruary 19, 2016

1 2
Large CapSmall CapBBEP BreitBurn Energy Partners LPBBG Bill Barrett Corp
5 BNP CN Bonavista Energy Corp5 BXE CN Bellatrix Exploration Ltd5 CR CN Crew Energy Inc
CRC California Resources CorpCWEI Clayton Williams Energy Inc
5 DEE CN Delphi Energy CorpDNR Denbury Resources IncECR Eclipse Resources CorpEPE EP Energy Corp
8 EPM Evolution Petroleum CorpERN Erin Energy Corp
5 GXO CN Granite Oil CorpLINE Linn Energy LLCMCF Contango Oil & Gas CoNOG Northern Oil and Gas IncPGH Pengrowth Energy Corp
9 PHX Panhandle Oil and Gas Inc5 PNE CN Pine Cliff Energy Ltd5 PPY CN Painted Pony Petroleum Ltd5 PXX CN BlackPearl Resources Inc5 RMP CN RMP Energy Inc
SGY Stone Energy CorpSN Sanchez Energy Corp
5 TET CN Trilogy Energy Corp5 TVE CN Tamarack Valley Energy Ltd
UNT Unit CorpWTI W&T Offshore IncXCO EXCO Resources Inc
AverageMedian
Micro CapANFC Black Ridge Oil and Gas IncAREX Approach Resources IncAXAS Abraxas Petroleum Corp
5 BBI CN Blackbird Energy IncBCEI Bonanza Creek Energy Inc
5 CKE CN Chinook Energy Inc5 CLC CN Connacher Oil and Gas Ltd5 CQE CN Cequence Energy Ltd
CRK Comstock Resources IncEGY VAALCO Energy IncEOX Emerald Oil Inc
8 EXXI Energy XXI LtdGST Gastar Exploration IncHK Halcon Resources CorpJONE Jones Energy IncLGCY Legacy Reserves LP
5 LRE CN Long Run Exploration Ltd5 LTS CN Lightstream Resources Ltd5 MEI CN Manitok Energy Inc5 MQL CN Marquee Energy Ltd5 PMT CN Perpetual Energy Inc
PQ PetroQuest Energy Inc5 RE CN Rock Energy Inc
REN Resolute Energy CorpREXX Rex Energy Corp
5 SOG CN Strategic Oil & Gas LtdSPP Sanchez Production Partners LP
5 TBE CN Twin Butte Energy Ltd7 TPLM Triangle Petroleum Corp5 TVL CN Traverse Energy Ltd
UPL Ultra Petroleum CorpUSEG US Energy Corp WyomingWRES Warren Resources Inc
5 YGR CN Yangarra Resources Ltd5 YO CN Yoho Resources Inc
YUMA Yuma Energy Inc5 ZAR CN Zargon Oil & Gas LtdZAR CN
AverageMedian
TTM TTMNatural Asset CapEx EBITDA
PUD Gas Intensity 9/30/2015 9/30/2015(%) (%) (%) ($MM) ($MM)
23% 37% 124% $763 $47966% 21% 74% $414 $19537% 66% 64% $500 $54953% 68% 67% $409 $20366% 75% 30% $321 $14728% 17% 224% $774 $97344% 17% 119% $266 $12853% 71% 67% $58 $4723% 17% 42% $727 $1,11845% 72% 343% $651 $7162% 33% 48% $1,691 $1,54941% 0% 24% $12 $14
100% 0% NA $152 -$8850% 26% 46% $110 $25720% 58% 88% $842 $2,08124% 65% 454% $104 $6449% 12% 57% $365 $28736% 32% 80% $425 $52540% 67% 55% $31 $463% 96% 91% $8 $29
74% 90% 70% $235 $2584% 0% 32% $125 $5242% 63% 88% $147 $10549% 54% 112% $595 $31252% 26% 94% $836 $26617% 63% 103% $116 $20632% 42% 117% $97 $6424% 60% 72% $785 $46328% 35% 287% $366 $29253% 91% 223% $369 $25544% 46% 114% $410 $35743% 48% 80% $366 $205
62% 10% 39% $25 $1959% 34% 59% $245 $12658% 22% 61% $108 $470% 54% NA $28 -$9
48% 35% 202% $573 $26111% 69% 531% $47 $4091% 0% -142% $23 -$4858% 85% 84% $105 $4032% 80% NA $365 $2459% 3% 973% $96 -$743% 13% 87% $264 $2232% 25% NA $512 $55771% 47% 61% $180 $7159% 9% 131% $890 $68248% 42% 240% $413 $2579% 50% 638% $606 $228
42% 58% 77% $144 $21033% 23% 152% $218 $36425% 47% 98% $47 -$229% 50% 65% $61 $2857% 91% 120% $101 $18940% 78% 124% $118 $9340% 4% 99% $82 $3244% 8% 220% $112 $10856% 63% 175% $287 $8532% 25% 3866% $72 $1225% 90% NA $2 $1127% 23% 61% $104 $20539% 11% 45% $374 $16814% 41% 126% $15 $1554% 90% 118% $1,441 $70656% 11% 102% $9 -$341% 76% 190% $69 $5269% 54% 29% $48 $2468% 65% 144% $35 $582% 30% NA $19 $06% 12% 64% $29 $57
44% 41% 276% $213 $12643% 41% 110% $104 $47
1 2
Large CapAPA Apache CorpAPC Anadarko Petroleum CorpAR Antero Resources CorpCLR Continental Resources Inc/OK
5 CNQ CN Canadian Natural Resources LtdCOG Cabot Oil & Gas CorpCOP ConocoPhillips
5 COS CN Canadian Oil Sands Ltd5 CPG CN Crescent Point Energy Corp5 CVE CN Cenovus Energy Inc
CXO Concho Resources IncDVN Devon Energy CorpEOG EOG Resources IncEQT EQT CorpFANG Diamondback Energy IncHES Hess Corp
5 HSE CN Husky Energy IncMRO Marathon Oil CorpNBL Noble Energy Inc
9 NFG National Fuel Gas CoNFX Newfield Exploration CoOXY Occidental Petroleum Corp
5 PEY CN Peyto Exploration & Development CorpPXD Pioneer Natural Resources CoRRC Range Resources Corp
5 TOU CN Tourmaline Oil Corp5 VET CN Vermilion Energy Inc
XEC Cimarex Energy CoAverageMedian
Mid Cap5 AAV CN Advantage Oil & Gas Ltd5 BIR CN Birchcliff Energy Ltd5 BNE CN Bonterra Energy Corp5 BTE CN Baytex Energy Corp
CHK Chesapeake Energy CorpCNX CONSOL Energy IncCPE Callon Petroleum CoCRZO Carrizo Oil & Gas IncECA Encana CorpEGN Energen CorpGPOR Gulfport Energy CorpGTE Gran Tierra Energy Inc
5 KEL CN Kelt Exploration LtdLPI Laredo Petroleum Inc
5 MEG CN MEG Energy CorpMTDR Matador Resources CoMUR Murphy Oil Corp
5 NVA CN NuVista Energy LtdOAS Oasis Petroleum IncPDCE PDC Energy Inc
5 POU CN Paramount Resources Ltd5 PWT CN Penn West Petroleum Ltd5 PXT CN Parex Resources Inc
QEP QEP Resources IncRICE Rice Energy Inc
5 RRX CN Raging River Exploration IncRSPP RSP Permian IncSM SM Energy Co
5 SPE CN Spartan Energy CorpSWN Southwestern Energy Co
6 SYRG Synergy Resources Corp5 TOG CN TORC Oil & Gas Ltd5 WCP CN Whitecap Resources Inc
WLL Whiting Petroleum CorpWPX WPX Energy Inc
AverageMedian
ECI Value Drivers3-Yr F&D TTM TTM 3-Year
Costs OPEX & GA Capital Prod Debt / P/CFPS($/Boe) ($/Boe) Efficiency Repl Mkt Cap 2016E(3)
$37.32 $14.17 61% 115% 62% 4.5x$16.12 $13.84 46% 162% 89% 6.3x$3.96 $12.09 362% 1635% 66% 6.5x
$13.06 $10.23 260% 673% 109% 3.9x$16.82 $27.28 150% 188% 54% 5.5x$4.10 $6.85 240% 475% 22% 17.0x
$21.56 $17.55 65% 153% 61% 6.7xNA $59.21 NA NA 53% 16.4x
$27.89 $20.76 152% 290% 56% 3.9x$11.97 $38.38 342% 258% 52% 12.4x$19.38 $15.35 155% 374% 33% 8.6x$29.06 $14.31 79% 120% 125% 5.5x$18.66 $14.97 133% 201% 17% 9.9x$4.35 $4.82 296% 599% 35% 9.1x
$28.51 $14.39 120% 894% 10% 19.7x$36.39 $30.48 55% 140% 49% 8.3x$30.26 $20.31 104% 133% 51% 4.0x$16.74 $17.24 56% 200% 183% 3.2x$21.22 $11.46 82% 210% 63% 6.5x$6.56 $10.19 493% 350% 54% 4.8x
$27.89 $15.22 90% 149% 68% 3.1x$19.84 $19.94 321% 169% 16% 13.0x$9.03 $3.37 236% 286% 21% 8.4x
$102.29 $16.83 32% 45% 13% 14.2x$4.40 $8.08 268% 653% 89% 5.6x$8.42 $7.95 278% 495% 19% 6.9x
$24.42 $22.08 139% 217% 38% 7.8x$15.59 $11.53 104% 258% 18% 15.2x$21.33 $17.10 175% 350% 55% 8.5x$18.66 $14.68 139% 217% 52% 6.8x
$6.14 $3.48 279% 360% 23% 10.0x$6.47 $8.96 228% 529% 81% 5.2x$7.99 $15.78 392% 400% 55% 5.4x
$19.14 $21.60 159% 363% 315% 1.0x$29.31 $6.17 47% 115% 870% 0.8x$4.07 $11.87 718% 693% 207% 3.5x
$31.68 $19.41 106% 539% 78% 4.9x$17.74 $14.19 196% 462% 113% 3.0x$85.81 $16.09 16% 41% 232% 1.8x$31.47 $17.79 96% 164% 32% 8.8x$17.09 $5.69 107% 800% 33% 8.6x
$153.97 $25.28 15% 131% 0% 5.8x$11.92 $18.23 100% 1113% 28% 8.3x$19.40 $14.92 175% 449% 162% 3.3x$5.96 $59.21 253% 1752% 537% -7.5x
$26.40 $16.12 100% 371% 30% 6.0x$23.70 $14.47 97% 230% 123% 2.8x$7.17 $17.44 99% 461% 27% 5.0x
$21.36 $19.70 211% 642% 275% 1.1x$9.91 $11.60 284% 690% 34% 4.6x
$10.15 $13.53 100% 934% 334% 5.2x$3.31 $26.30 480% 96% 347% 3.1x
$21.96 $35.84 94% 291% 0% 10.7x$23.41 $16.11 81% 187% 119% 1.9x$9.61 $8.95 114% 831% 131% 3.4x
$11.94 $15.94 348% 924% 3% 11.0x$28.70 $14.80 128% 968% 34% 7.7x$12.02 $13.81 152% 358% 452% 0.6x$9.37 $26.83 247% 821% 13% 10.6x$9.58 $6.33 134% 351% 171% 1.9x
$10.68 $16.41 227% 957% 11% 10.3x$6.02 $23.67 536% 665% 25% 6.0x
$19.66 $15.83 283% 656% 38% 4.1x$19.16 $17.10 NA 562% 596% 0.8x$20.85 $13.34 82% 87% 309% 1.3x$21.52 $17.22 197% 543% 167% 4.6x$17.09 $15.94 143% 462% 81% 4.6x
19
Source: EnerCom, Company filings, Bloomberg L.P.Footnotes to the tables and glossary of terms can be found beginning on page 37.
EnerCom E&P WeeklyFebruary 19, 2016

20
ECI Value Driver Quartile ChartsLarge Cap
ECI Value Driver Quartile ChartsMid Cap
175%
0%
100%
200%
300%
400%
500%
600%
TTM Capital Efficiency
$17.10
$0.00
$10.00
$20.00
$30.00
$40.00
$50.00
$60.00
$70.00
TTM OPEX & GA
$21.33
$0.00
$20.00
$40.00
$60.00
$80.00
$100.00
$120.00
3-Year F&D
350%
0%200%400%600%800%
1000%1200%1400%1600%1800%
3-Year Production Replacement
55%
0%20%40%60%80%
100%120%140%160%180%200%
Debt/Mkt Cap
8.5x
0.0x
5.0x
10.0x
15.0x
20.0x
25.0x
P/CFPS 2016E
197%
0%
100%
200%
300%
400%
500%
600%
700%
800%
TTM Capital Efficiency
$17.22
$0.00
$10.00
$20.00
$30.00
$40.00
$50.00
$60.00
$70.00
TTM OPEX & GA
$21.52
$0.00$20.00$40.00$60.00$80.00
$100.00$120.00$140.00$160.00$180.00
3-Year F&D
543%
0%200%400%600%800%
1000%1200%1400%1600%1800%2000%
3-Year Production Replacement
167%
0%100%200%300%400%500%600%700%800%900%
1000%
Debt/Mkt Cap
4.6x
0.0x2.0x4.0x6.0x8.0x
10.0x12.0x14.0x16.0x18.0x20.0x
P/CFPS 2016E
1st Quartile2nd Quartile3rd Quartile
4th QuartileAverage
Source: EnerCom, Company filings, Bloomberg L.P.Footnotes to the tables and glossary of terms can be found beginning on page 37.
EnerCom E&P WeeklyFebruary 19, 2016

ECI Value Driver Quartile ChartsLarge Cap
ECI Value Driver Quartile ChartsMid Cap
175%
0%
100%
200%
300%
400%
500%
600%
TTM Capital Efficiency
$17.10
$0.00
$10.00
$20.00
$30.00
$40.00
$50.00
$60.00
$70.00
TTM OPEX & GA
$21.33
$0.00
$20.00
$40.00
$60.00
$80.00
$100.00
$120.00
3-Year F&D
350%
0%200%400%600%800%
1000%1200%1400%1600%1800%
3-Year Production Replacement
55%
0%20%40%60%80%
100%120%140%160%180%200%
Debt/Mkt Cap
8.5x
0.0x
5.0x
10.0x
15.0x
20.0x
25.0x
P/CFPS 2016E
197%
0%
100%
200%
300%
400%
500%
600%
700%
800%
TTM Capital Efficiency
$17.22
$0.00
$10.00
$20.00
$30.00
$40.00
$50.00
$60.00
$70.00
TTM OPEX & GA
$21.52
$0.00$20.00$40.00$60.00$80.00
$100.00$120.00$140.00$160.00$180.00
3-Year F&D
543%
0%200%400%600%800%
1000%1200%1400%1600%1800%2000%
3-Year Production Replacement
167%
0%100%200%300%400%500%600%700%800%900%
1000%
Debt/Mkt Cap
4.6x
0.0x2.0x4.0x6.0x8.0x
10.0x12.0x14.0x16.0x18.0x20.0x
P/CFPS 2016E
1st Quartile2nd Quartile3rd Quartile
4th QuartileAverage
1 2
Large CapSmall CapBBEP BreitBurn Energy Partners LPBBG Bill Barrett Corp
5 BNP CN Bonavista Energy Corp5 BXE CN Bellatrix Exploration Ltd5 CR CN Crew Energy Inc
CRC California Resources CorpCWEI Clayton Williams Energy Inc
5 DEE CN Delphi Energy CorpDNR Denbury Resources IncECR Eclipse Resources CorpEPE EP Energy Corp
8 EPM Evolution Petroleum CorpERN Erin Energy Corp
5 GXO CN Granite Oil CorpLINE Linn Energy LLCMCF Contango Oil & Gas CoNOG Northern Oil and Gas IncPGH Pengrowth Energy Corp
9 PHX Panhandle Oil and Gas Inc5 PNE CN Pine Cliff Energy Ltd5 PPY CN Painted Pony Petroleum Ltd5 PXX CN BlackPearl Resources Inc5 RMP CN RMP Energy Inc
SGY Stone Energy CorpSN Sanchez Energy Corp
5 TET CN Trilogy Energy Corp5 TVE CN Tamarack Valley Energy Ltd
UNT Unit CorpWTI W&T Offshore IncXCO EXCO Resources Inc
AverageMedian
Micro CapANFC Black Ridge Oil and Gas IncAREX Approach Resources IncAXAS Abraxas Petroleum Corp
5 BBI CN Blackbird Energy IncBCEI Bonanza Creek Energy Inc
5 CKE CN Chinook Energy Inc5 CLC CN Connacher Oil and Gas Ltd5 CQE CN Cequence Energy Ltd
CRK Comstock Resources IncEGY VAALCO Energy IncEOX Emerald Oil Inc
8 EXXI Energy XXI LtdGST Gastar Exploration IncHK Halcon Resources CorpJONE Jones Energy IncLGCY Legacy Reserves LP
5 LRE CN Long Run Exploration Ltd5 LTS CN Lightstream Resources Ltd5 MEI CN Manitok Energy Inc5 MQL CN Marquee Energy Ltd5 PMT CN Perpetual Energy Inc
PQ PetroQuest Energy Inc5 RE CN Rock Energy Inc
REN Resolute Energy CorpREXX Rex Energy Corp
5 SOG CN Strategic Oil & Gas LtdSPP Sanchez Production Partners LP
5 TBE CN Twin Butte Energy Ltd7 TPLM Triangle Petroleum Corp5 TVL CN Traverse Energy Ltd
UPL Ultra Petroleum CorpUSEG US Energy Corp WyomingWRES Warren Resources Inc
5 YGR CN Yangarra Resources Ltd5 YO CN Yoho Resources Inc
YUMA Yuma Energy Inc5 ZAR CN Zargon Oil & Gas LtdZAR CN
AverageMedian
ECI Value Drivers3-Yr F&D TTM TTM 3-Year
Costs OPEX & GA Capital Prod Debt / P/CFPS($/Boe) ($/Boe) Efficiency Repl Mkt Cap 2016E(3)
$25.49 $29.67 98% 592% 2566% 0.4x$23.18 $18.30 133% 207% 590% 0.6x$9.57 $10.99 216% 183% 310% 1.1x$7.64 $13.46 200% 542% 232% 2.8x$4.95 $16.13 494% 381% 50% 5.3x
$33.63 $26.31 49% 123% 5161% 0.2x$20.06 $20.15 106% 345% 581% 2.0x$9.27 $15.52 148% 314% 106% 3.0x
$25.78 $30.50 161% 226% 935% 1.6x$30.86 $13.46 21% 1360% 345% 2.6x$16.46 $14.76 245% 257% 1036% 0.6x$7.15 $31.24 343% 268% 0% 12.8x
$215.48 $161.16 NA 156% 53% NA$18.01 $17.24 579% 437% 20% 4.1x$15.18 $19.35 181% 615% 5668% 0.2x$39.88 $11.91 27% 117% 109% 1.9x$22.28 $16.53 210% 485% 512% 0.7x$18.32 $23.08 124% 242% 528% 0.8x$10.92 $8.74 184% 236% 27% NA$7.51 $11.62 95% 624% 18% 8.3x$6.04 $11.89 76% 999% 12% 12.1x$7.64 $32.12 271% 593% 53% 3.9x
$26.95 $13.36 104% 208% 75% 1.9x$18.55 $16.94 104% 229% 890% 0.4x$19.57 $12.87 76% 927% 1004% 0.7x$16.99 $14.72 117% 185% 207% 3.5x$27.29 $18.84 91% 459% 30% 4.9x$19.31 $11.05 119% 251% 304% 0.8x$36.29 $18.46 46% 108% 1243% 0.8x$13.87 $11.26 88% 187% 584% 1.9x$25.14 $22.39 162% 395% 775% 2.9x$18.43 $16.33 119% 263% 307% 1.9x
$15.77 $22.12 299% 1254% 2177% NA$12.15 $13.30 186% 693% 1676% 0.3x$10.36 $20.77 202% 653% 129% 2.4x$12.98 $314.52 NA 1712% 0% -36.3x$27.44 $17.41 94% 363% 1114% 0.4x$31.06 $25.62 56% 79% 0% 10.8x$3.63 $60.50 NA 416% 4562% NA$9.67 $13.65 120% 373% 80% 2.8x
NA $11.15 NA NA 2614% 1.4x$36.19 $31.25 NA 144% 23% 3.1x$29.08 $32.05 43% 1339% 4895% 0.2x$40.05 $26.05 65% 251% 8945% -0.4x$7.55 $10.09 198% 1048% 513% 2.4x
$34.96 $20.81 125% 782% 5961% 0.2x$25.63 $9.86 110% 267% 2003% 0.4x$16.98 $20.30 104% 440% 2487% 0.7x$12.76 $17.31 140% 421% 929% 0.5x$38.04 $19.35 89% 123% 2239% 0.4x$26.07 $25.13 NA 226% 384% 0.3x$10.58 $24.20 157% 483% 133% 1.9x$4.24 $16.86 670% 245% 795% 15.0x
$14.72 $10.42 98% 236% 1008% 1.4x$21.89 $22.25 101% 210% 122% 1.6x$39.20 $30.00 57% 246% 1887% 0.5x$6.26 $12.71 114% 946% 2380% 0.9x
$43.19 $34.96 31% 228% 83% 11.5xNA $32.64 NA NA 248% NA
$20.39 $26.62 172% 183% 914% 0.1x$17.73 $29.90 187% 984% 2869% 0.3x$32.53 $18.23 123% 283% 0% 3.6x$14.70 $8.37 100% 186% 11214% 0.2x$22.83 $41.18 NA 275% 55% NA$10.55 $12.35 85% 716% 4967% NA$8.32 $12.02 316% 795% 141% 1.7x$9.30 $17.86 80% 461% 216% 3.7x$4.77 $43.22 NA 1096% 201% NA
$14.91 $32.29 259% 84% 418% 0.5x$19.61 $30.74 151% 521% 1848% 1.0x$15.77 $20.81 114% 373% 914% 0.7x
21
Source: EnerCom, Company filings, Bloomberg L.P.Footnotes to the tables and glossary of terms can be found beginning on page 37.
EnerCom E&P WeeklyFebruary 19, 2016

22
0 3 4 7 8 9 38 39.0 11 12 13
ECI Value Driver Quartile ChartsSmall Cap
ECI Value Driver Quartile ChartsMicro Cap
162%
0%
100%
200%
300%
400%
500%
600%
700%
TTM Capital Efficiency
$22.39
$0.00$20.00$40.00$60.00$80.00
$100.00$120.00$140.00$160.00$180.00
TTM OPEX & GA
$25.14
$0.00
$50.00
$100.00
$150.00
$200.00
$250.00
3-Year F&D
395%
0%
200%
400%
600%
800%
1000%
1200%
1400%
1600%
3-Year Production Replacement
775%
0%
1000%
2000%
3000%
4000%
5000%
6000%
Debt/Mkt Cap
2.9x
0.0x
2.0x
4.0x
6.0x
8.0x
10.0x
12.0x
14.0x
P/CFPS 2016E
151%
0%
100%
200%
300%
400%
500%
600%
700%
800%
TTM Capital Efficiency
$30.74$0.00
$50.00
$100.00
$150.00
$200.00
$250.00
$300.00
$350.00
TTM OPEX & GA
$19.61
$0.00$5.00
$10.00$15.00$20.00$25.00$30.00$35.00$40.00$45.00$50.00
3-Year F&D
521%
0%200%400%600%800%
1000%1200%1400%1600%1800%
3-Year Production Replacement
1848%
0%
2000%
4000%
6000%
8000%
10000%
12000%
Debt/Mkt Cap
1.0x0.0x
2.0x
4.0x
6.0x
8.0x
10.0x
12.0x
14.0x
16.0x
P/CFPS 2016E
1st Quartile2nd Quartile3rd Quartile
4th QuartileAverage
Source: EnerCom, Company filings, Bloomberg L.P.Footnotes to the tables and glossary of terms can be found beginning on page 37.
EnerCom E&P WeeklyFebruary 19, 2016

0 3 4 7 8 9 38 39.0 11 12 13
ECI Value Driver Quartile ChartsSmall Cap
ECI Value Driver Quartile ChartsMicro Cap
162%
0%
100%
200%
300%
400%
500%
600%
700%
TTM Capital Efficiency
$22.39
$0.00$20.00$40.00$60.00$80.00
$100.00$120.00$140.00$160.00$180.00
TTM OPEX & GA
$25.14
$0.00
$50.00
$100.00
$150.00
$200.00
$250.00
3-Year F&D
395%
0%
200%
400%
600%
800%
1000%
1200%
1400%
1600%
3-Year Production Replacement
775%
0%
1000%
2000%
3000%
4000%
5000%
6000%
Debt/Mkt Cap
2.9x
0.0x
2.0x
4.0x
6.0x
8.0x
10.0x
12.0x
14.0x
P/CFPS 2016E
151%
0%
100%
200%
300%
400%
500%
600%
700%
800%
TTM Capital Efficiency
$30.74$0.00
$50.00
$100.00
$150.00
$200.00
$250.00
$300.00
$350.00
TTM OPEX & GA
$19.61
$0.00$5.00
$10.00$15.00$20.00$25.00$30.00$35.00$40.00$45.00$50.00
3-Year F&D
521%
0%200%400%600%800%
1000%1200%1400%1600%1800%
3-Year Production Replacement
1848%
0%
2000%
4000%
6000%
8000%
10000%
12000%
Debt/Mkt Cap
1.0x0.0x
2.0x
4.0x
6.0x
8.0x
10.0x
12.0x
14.0x
16.0x
P/CFPS 2016E
1st Quartile2nd Quartile3rd Quartile
4th QuartileAverage
1 2
Large CapAPA Apache CorpAPC Anadarko Petroleum CorpAR Antero Resources CorpCLR Continental Resources Inc/OK
5 CNQ CN Canadian Natural Resources LtdCOG Cabot Oil & Gas CorpCOP ConocoPhillips
5 COS CN Canadian Oil Sands Ltd5 CPG CN Crescent Point Energy Corp5 CVE CN Cenovus Energy Inc
CXO Concho Resources IncDVN Devon Energy CorpEOG EOG Resources IncEQT EQT CorpFANG Diamondback Energy IncHES Hess Corp
5 HSE CN Husky Energy IncMRO Marathon Oil CorpNBL Noble Energy Inc
9 NFG National Fuel Gas CoNFX Newfield Exploration CoOXY Occidental Petroleum Corp
5 PEY CN Peyto Exploration & Development CorpPXD Pioneer Natural Resources CoRRC Range Resources Corp
5 TOU CN Tourmaline Oil Corp5 VET CN Vermilion Energy Inc
XEC Cimarex Energy CoAverageMedian
Mid Cap5 AAV CN Advantage Oil & Gas Ltd5 BIR CN Birchcliff Energy Ltd5 BNE CN Bonterra Energy Corp5 BTE CN Baytex Energy Corp
CHK Chesapeake Energy CorpCNX CONSOL Energy IncCPE Callon Petroleum CoCRZO Carrizo Oil & Gas IncECA Encana CorpEGN Energen CorpGPOR Gulfport Energy CorpGTE Gran Tierra Energy Inc
5 KEL CN Kelt Exploration LtdLPI Laredo Petroleum Inc
5 MEG CN MEG Energy CorpMTDR Matador Resources CoMUR Murphy Oil Corp
5 NVA CN NuVista Energy LtdOAS Oasis Petroleum IncPDCE PDC Energy Inc
5 POU CN Paramount Resources Ltd5 PWT CN Penn West Petroleum Ltd5 PXT CN Parex Resources Inc
QEP QEP Resources IncRICE Rice Energy Inc
5 RRX CN Raging River Exploration IncRSPP RSP Permian IncSM SM Energy Co
5 SPE CN Spartan Energy CorpSWN Southwestern Energy Co
6 SYRG Synergy Resources Corp5 TOG CN TORC Oil & Gas Ltd5 WCP CN Whitecap Resources Inc
WLL Whiting Petroleum CorpWPX WPX Energy Inc
AverageMedian
TTM TTM EV / EV /EBITDA / Cash Margin/ 2014 TTM
Boe Mcfe(4) Reserves Prod Performance($/Boe) ($/Mcfe) ($/ Mcfe) ($/Mcfe/d) Week 1Q'16 YTD
$22.83 $22.71 $9.76 $39,314 2% -16% -16%$7.40 $14.52 $12.18 $40,704 -7% -27% -27%
$14.32 $5.28 $5.85 $55,812 -8% 10% 10%$34.01 $23.07 $10.07 $63,685 -10% -24% -24%$25.31 $19.98 $8.57 $60,906 1% -7% -7%$9.85 $6.80 $9.04 $40,660 1% 13% 13%
$14.00 $41.54 $7.13 $39,983 0% -30% -30%$17.75 $14.71 $9.58 $72,329 6% 11% 11%$42.31 $30.50 $23.21 $92,526 8% -3% -3%$40.96 $13.63 $5.89 $55,428 0% -17% -17%$30.09 $21.37 $24.88 $114,513 6% -1% -1%$23.02 $9.23 $8.72 $35,532 -14% -42% -42%$24.77 $20.17 $17.62 $75,582 3% -2% -2%$12.87 $8.21 $7.63 $52,819 0% 13% 13%$34.19 $25.68 $51.62 $193,510 4% 8% 8%$20.17 $23.27 $12.50 $47,542 5% -13% -13%$31.45 $25.43 $16.46 $66,463 9% -7% -7%$9.45 $18.14 $5.11 $25,751 -10% -47% -47%
$17.47 $13.92 $14.15 $60,860 4% -9% -9%$32.38 $12.55 $15.11 $81,949 4% 8% 8%$24.97 $13.62 $9.52 $42,122 -8% -31% -31%$63.69 $49.47 $21.07 $90,085 5% 4% 4%$21.30 $17.61 $16.24 $71,671 0% 18% 18%$32.63 $14.32 $27.74 $112,423 7% -2% -2%$11.77 $3.97 $4.43 $33,668 -13% -4% -4%$23.41 $13.01 $15.05 $52,763 5% 20% 20%$33.88 $32.13 $35.18 $110,819 5% -6% -6%$16.28 $15.66 $16.69 $53,609 1% -4% -4%$24.73 $18.95 $15.04 $67,251 0% -7% -7%$23.22 $16.64 $12.34 $58,336 2% -4% -4%
$17.14 $12.63 $7.92 $70,557 -4% 3% 3%$14.75 $12.70 $5.09 $36,796 -9% 25% 25%$31.33 $29.32 $15.01 $79,390 14% 6% 6%$30.45 $18.24 $8.20 $34,103 7% -41% -41%$13.80 $12.90 $5.02 $17,808 26% -56% -56%$29.20 $2.60 $4.93 $40,443 1% 0% 0%$33.53 $18.70 $30.00 $112,261 1% -24% -24%$34.69 $19.06 $17.63 $73,781 -8% -27% -27%$13.83 $10.05 $6.60 $20,650 -12% -39% -39%$30.08 $16.12 $8.37 $46,030 7% -40% -40%$18.22 $19.58 $21.62 $45,822 -5% 11% 11%$22.66 $22.93 $10.66 $21,591 -1% -2% -2%$11.94 $12.01 $10.97 $43,086 1% -27% -27%$34.02 $10.85 $8.96 $49,652 -24% -49% -49%$15.09 $7.79 $3.75 $74,564 13% -48% -48%$26.47 $17.81 $24.18 $68,460 2% -24% -24%$22.88 $26.87 $6.84 $23,207 -6% -30% -30%$7.11 $11.62 $7.25 $37,518 1% 1% 1%
$45.10 $17.52 $11.89 $64,241 6% -35% -35%$28.11 $11.74 $10.48 $70,765 3% -9% -9%$10.18 $6.60 $10.08 $57,029 12% -18% -18%$15.87 $10.59 $7.87 $34,890 13% 10% 10%$20.67 $22.26 $32.79 $52,649 3% -9% -9%$19.01 $9.43 $5.47 $23,869 -1% -21% -21%$10.98 $5.44 $13.39 $35,390 -12% -22% -22%$41.58 $41.02 $40.54 $169,681 5% 10% 10%$36.77 $21.25 $25.43 $142,404 4% -17% -17%$18.26 $11.26 $5.65 $17,265 -18% -58% -58%$23.16 $28.48 $29.09 $99,149 3% 3% 3%$12.86 $8.25 $5.08 $21,471 -21% 0% 0%$24.24 $15.44 $12.88 $78,407 6% -31% -31%$32.28 $26.74 $28.41 $96,427 5% 7% 7%$55.71 $27.07 $18.59 $82,930 9% -24% -24%
($19.67) $18.64 $7.83 $38,842 -4% -54% -54%$17.20 $4.45 $6.54 $29,474 -9% -30% -30%$22.84 $16.23 $13.57 $57,446 0% -19% -19%$22.66 $15.44 $10.08 $46,030 1% -22% -22%
Stock
23
Source: EnerCom, Company filings, Bloomberg L.P.Footnotes to the tables and glossary of terms can be found beginning on page 37.
EnerCom E&P WeeklyFebruary 19, 2016

24
1 2
Large CapSmall CapBBEP BreitBurn Energy Partners LPBBG Bill Barrett Corp
5 BNP CN Bonavista Energy Corp5 BXE CN Bellatrix Exploration Ltd5 CR CN Crew Energy Inc
CRC California Resources CorpCWEI Clayton Williams Energy Inc
5 DEE CN Delphi Energy CorpDNR Denbury Resources IncECR Eclipse Resources CorpEPE EP Energy Corp
8 EPM Evolution Petroleum CorpERN Erin Energy Corp
5 GXO CN Granite Oil CorpLINE Linn Energy LLCMCF Contango Oil & Gas CoNOG Northern Oil and Gas IncPGH Pengrowth Energy Corp
9 PHX Panhandle Oil and Gas Inc5 PNE CN Pine Cliff Energy Ltd5 PPY CN Painted Pony Petroleum Ltd5 PXX CN BlackPearl Resources Inc5 RMP CN RMP Energy Inc
SGY Stone Energy CorpSN Sanchez Energy Corp
5 TET CN Trilogy Energy Corp5 TVE CN Tamarack Valley Energy Ltd
UNT Unit CorpWTI W&T Offshore IncXCO EXCO Resources Inc
AverageMedian
Micro CapANFC Black Ridge Oil and Gas IncAREX Approach Resources IncAXAS Abraxas Petroleum Corp
5 BBI CN Blackbird Energy IncBCEI Bonanza Creek Energy Inc
5 CKE CN Chinook Energy Inc5 CLC CN Connacher Oil and Gas Ltd5 CQE CN Cequence Energy Ltd
CRK Comstock Resources IncEGY VAALCO Energy IncEOX Emerald Oil Inc
8 EXXI Energy XXI LtdGST Gastar Exploration IncHK Halcon Resources CorpJONE Jones Energy IncLGCY Legacy Reserves LP
5 LRE CN Long Run Exploration Ltd5 LTS CN Lightstream Resources Ltd5 MEI CN Manitok Energy Inc5 MQL CN Marquee Energy Ltd5 PMT CN Perpetual Energy Inc
PQ PetroQuest Energy Inc5 RE CN Rock Energy Inc
REN Resolute Energy CorpREXX Rex Energy Corp
5 SOG CN Strategic Oil & Gas LtdSPP Sanchez Production Partners LP
5 TBE CN Twin Butte Energy Ltd7 TPLM Triangle Petroleum Corp5 TVL CN Traverse Energy Ltd
UPL Ultra Petroleum CorpUSEG US Energy Corp WyomingWRES Warren Resources Inc
5 YGR CN Yangarra Resources Ltd5 YO CN Yoho Resources Inc
YUMA Yuma Energy Inc5 ZAR CN Zargon Oil & Gas LtdZAR CN
AverageMedian
TTM TTM EV / EV /EBITDA / Cash Margin/ 2014 TTM
Boe Mcfe(4) Reserves Prod Performance($/Boe) ($/Mcfe) ($/ Mcfe) ($/Mcfe/d) Week 1Q'16 YTD
Stock
$25.01 ($2.81) $11.73 $70,520 4% -16% -16%$30.88 $7.33 $6.93 $49,051 -11% -31% -31%$20.63 $7.39 $5.98 $22,611 4% 3% 3%$15.28 $8.63 $5.99 $26,375 6% -9% -9%$24.47 $10.09 $6.06 $39,358 1% -24% -24%$16.41 $11.18 $8.52 $40,256 -43% -86% -86%$21.35 $15.14 $11.53 $52,828 -12% -64% -64%$13.74 $7.70 $5.47 $25,189 4% -17% -17%$41.62 $17.00 $8.46 $50,338 -10% -50% -50%$6.59 $2.15 $7.87 $15,843 -1% -62% -62%
$40.31 $13.38 $8.65 $51,095 -19% -56% -56%$24.55 $24.58 $10.53 $84,348 -5% -12% -12%
($153.85) ($137.63) $73.51 $425,306 0% -35% -35%$104.33 $32.01 $7.60 $39,766 -4% -9% -9%$27.50 $1.10 $7.68 $45,107 24% -63% -63%$10.76 $11.98 $4.80 $13,482 -6% -15% -15%$46.69 $16.67 $10.22 $61,104 -10% -30% -30%$22.63 $8.74 $7.95 $38,735 -4% -2% -2%$20.14 $11.57 $10.10 $48,324 -1% -11% -11%$7.09 $6.57 $11.04 $25,628 -2% -14% -14%$4.60 $6.03 $3.53 $29,200 4% 11% 11%
$20.71 $9.33 $4.19 $40,457 0% -29% -29%$28.01 $24.87 $11.92 $29,765 -1% -10% -10%$19.34 $17.34 $7.19 $24,756 -14% -52% -52%$14.90 $10.35 $14.79 $40,680 -2% -35% -35%$19.80 $14.84 $10.10 $33,830 3% -18% -18%$24.96 $19.10 $23.95 $58,524 -4% 6% 6%$23.03 $11.15 $6.76 $21,994 -15% -51% -51%$16.67 $10.54 $13.21 $33,018 -4% -32% -32%$12.13 $2.38 $8.49 $31,107 3% -24% -24%$18.34 $6.62 $11.16 $52,287 -4% -28% -28%$20.67 $10.44 $8.48 $39,562 -2% -24% -24%
$47.13 $5.54 $11.21 $54,800 -23% 10% 10%$22.60 $11.12 $3.73 $35,634 -18% -59% -59%$20.89 $16.63 $5.33 $36,712 6% -12% -12%
N/A N/A $41.96 N/A 12% -3% -3%$25.89 $13.95 $10.38 $33,663 -21% -70% -70%$17.44 $4.96 $2.58 $7,412 5% -26% -26%($9.84) ($19.07) $0.84 $13,676 18% 44% 44%$11.65 $7.58 $1.89 $11,591 1% 13% 13%$2.21 $9.04 $11.44 $40,341 -8% -44% -44%
($4.24) $20.02 $4.54 $8,500 4% -31% -31%$12.64 $5.69 $11.86 $64,137 22% -35% -35%$25.87 $2.23 $20.53 $63,865 0% -53% -53%$14.96 $4.49 $6.06 $47,849 -2% -25% -25%$43.63 $8.33 $17.52 $77,416 -4% -66% -66%$28.14 $8.98 $12.08 $55,566 -1% -64% -64%$17.67 $3.12 $12.56 $49,416 -17% -52% -52%$17.88 $9.48 $7.11 $22,894 6% 3% 3%$33.85 $15.79 $15.77 $55,158 11% 35% 35%($1.50) $9.01 $17.80 $31,052 4% -13% -13%$16.60 $9.70 $7.17 $20,001 2% -17% -17%$28.42 ($6.58) $7.47 $23,182 0% -10% -10%$14.37 $6.42 $3.42 $12,792 1% -1% -1%$22.02 $22.73 $12.89 $28,025 0% -27% -27%$22.46 ($0.69) $10.15 $57,066 -1% -44% -44%$7.15 $0.79 $4.19 $28,708 -11% -47% -47%
$13.36 $4.80 $15.55 $44,378 -12% 64% 64%$7.72 $4.09 $9.35 $38,704 1% -2% -2%
$35.13 $16.61 $6.44 $14,605 8% -28% -28%$33.14 $4.49 $13.70 $57,919 -7% -51% -51%$39.99 $22.21 $14.73 $19,814 0% -20% -20%$14.76 $8.36 $3.81 $26,046 -67% -92% -92%($7.78) ($2.71) $2.81 $13,651 -10% 138% 138%$9.00 $3.24 $6.29 $28,453 -1% -49% -49%
$26.25 $16.43 $4.83 $39,056 20% 7% 7%$7.45 $6.25 $2.54 $25,615 10% -8% -8%
($0.45) $6.01 $2.57 $28,689 -16% 11% 11%$38.66 $11.71 $4.61 $15,940 2% -53% -53%$18.20 $7.52 $9.40 $34,231 -2% -18% -18%$17.56 $7.00 $7.17 $29,880 0% -25% -25%
Source: EnerCom, Company filings, Bloomberg L.P.Footnotes to the tables and glossary of terms can be found beginning on page 37.
EnerCom E&P WeeklyFebruary 19, 2016

1 2
Large CapSmall CapBBEP BreitBurn Energy Partners LPBBG Bill Barrett Corp
5 BNP CN Bonavista Energy Corp5 BXE CN Bellatrix Exploration Ltd5 CR CN Crew Energy Inc
CRC California Resources CorpCWEI Clayton Williams Energy Inc
5 DEE CN Delphi Energy CorpDNR Denbury Resources IncECR Eclipse Resources CorpEPE EP Energy Corp
8 EPM Evolution Petroleum CorpERN Erin Energy Corp
5 GXO CN Granite Oil CorpLINE Linn Energy LLCMCF Contango Oil & Gas CoNOG Northern Oil and Gas IncPGH Pengrowth Energy Corp
9 PHX Panhandle Oil and Gas Inc5 PNE CN Pine Cliff Energy Ltd5 PPY CN Painted Pony Petroleum Ltd5 PXX CN BlackPearl Resources Inc5 RMP CN RMP Energy Inc
SGY Stone Energy CorpSN Sanchez Energy Corp
5 TET CN Trilogy Energy Corp5 TVE CN Tamarack Valley Energy Ltd
UNT Unit CorpWTI W&T Offshore IncXCO EXCO Resources Inc
AverageMedian
Micro CapANFC Black Ridge Oil and Gas IncAREX Approach Resources IncAXAS Abraxas Petroleum Corp
5 BBI CN Blackbird Energy IncBCEI Bonanza Creek Energy Inc
5 CKE CN Chinook Energy Inc5 CLC CN Connacher Oil and Gas Ltd5 CQE CN Cequence Energy Ltd
CRK Comstock Resources IncEGY VAALCO Energy IncEOX Emerald Oil Inc
8 EXXI Energy XXI LtdGST Gastar Exploration IncHK Halcon Resources CorpJONE Jones Energy IncLGCY Legacy Reserves LP
5 LRE CN Long Run Exploration Ltd5 LTS CN Lightstream Resources Ltd5 MEI CN Manitok Energy Inc5 MQL CN Marquee Energy Ltd5 PMT CN Perpetual Energy Inc
PQ PetroQuest Energy Inc5 RE CN Rock Energy Inc
REN Resolute Energy CorpREXX Rex Energy Corp
5 SOG CN Strategic Oil & Gas LtdSPP Sanchez Production Partners LP
5 TBE CN Twin Butte Energy Ltd7 TPLM Triangle Petroleum Corp5 TVL CN Traverse Energy Ltd
UPL Ultra Petroleum CorpUSEG US Energy Corp WyomingWRES Warren Resources Inc
5 YGR CN Yangarra Resources Ltd5 YO CN Yoho Resources Inc
YUMA Yuma Energy Inc5 ZAR CN Zargon Oil & Gas LtdZAR CN
AverageMedian
TTM TTM EV / EV /EBITDA / Cash Margin/ 2014 TTM
Boe Mcfe(4) Reserves Prod Performance($/Boe) ($/Mcfe) ($/ Mcfe) ($/Mcfe/d) Week 1Q'16 YTD
Stock
$25.01 ($2.81) $11.73 $70,520 4% -16% -16%$30.88 $7.33 $6.93 $49,051 -11% -31% -31%$20.63 $7.39 $5.98 $22,611 4% 3% 3%$15.28 $8.63 $5.99 $26,375 6% -9% -9%$24.47 $10.09 $6.06 $39,358 1% -24% -24%$16.41 $11.18 $8.52 $40,256 -43% -86% -86%$21.35 $15.14 $11.53 $52,828 -12% -64% -64%$13.74 $7.70 $5.47 $25,189 4% -17% -17%$41.62 $17.00 $8.46 $50,338 -10% -50% -50%$6.59 $2.15 $7.87 $15,843 -1% -62% -62%
$40.31 $13.38 $8.65 $51,095 -19% -56% -56%$24.55 $24.58 $10.53 $84,348 -5% -12% -12%
($153.85) ($137.63) $73.51 $425,306 0% -35% -35%$104.33 $32.01 $7.60 $39,766 -4% -9% -9%$27.50 $1.10 $7.68 $45,107 24% -63% -63%$10.76 $11.98 $4.80 $13,482 -6% -15% -15%$46.69 $16.67 $10.22 $61,104 -10% -30% -30%$22.63 $8.74 $7.95 $38,735 -4% -2% -2%$20.14 $11.57 $10.10 $48,324 -1% -11% -11%$7.09 $6.57 $11.04 $25,628 -2% -14% -14%$4.60 $6.03 $3.53 $29,200 4% 11% 11%
$20.71 $9.33 $4.19 $40,457 0% -29% -29%$28.01 $24.87 $11.92 $29,765 -1% -10% -10%$19.34 $17.34 $7.19 $24,756 -14% -52% -52%$14.90 $10.35 $14.79 $40,680 -2% -35% -35%$19.80 $14.84 $10.10 $33,830 3% -18% -18%$24.96 $19.10 $23.95 $58,524 -4% 6% 6%$23.03 $11.15 $6.76 $21,994 -15% -51% -51%$16.67 $10.54 $13.21 $33,018 -4% -32% -32%$12.13 $2.38 $8.49 $31,107 3% -24% -24%$18.34 $6.62 $11.16 $52,287 -4% -28% -28%$20.67 $10.44 $8.48 $39,562 -2% -24% -24%
$47.13 $5.54 $11.21 $54,800 -23% 10% 10%$22.60 $11.12 $3.73 $35,634 -18% -59% -59%$20.89 $16.63 $5.33 $36,712 6% -12% -12%
N/A N/A $41.96 N/A 12% -3% -3%$25.89 $13.95 $10.38 $33,663 -21% -70% -70%$17.44 $4.96 $2.58 $7,412 5% -26% -26%($9.84) ($19.07) $0.84 $13,676 18% 44% 44%$11.65 $7.58 $1.89 $11,591 1% 13% 13%$2.21 $9.04 $11.44 $40,341 -8% -44% -44%
($4.24) $20.02 $4.54 $8,500 4% -31% -31%$12.64 $5.69 $11.86 $64,137 22% -35% -35%$25.87 $2.23 $20.53 $63,865 0% -53% -53%$14.96 $4.49 $6.06 $47,849 -2% -25% -25%$43.63 $8.33 $17.52 $77,416 -4% -66% -66%$28.14 $8.98 $12.08 $55,566 -1% -64% -64%$17.67 $3.12 $12.56 $49,416 -17% -52% -52%$17.88 $9.48 $7.11 $22,894 6% 3% 3%$33.85 $15.79 $15.77 $55,158 11% 35% 35%($1.50) $9.01 $17.80 $31,052 4% -13% -13%$16.60 $9.70 $7.17 $20,001 2% -17% -17%$28.42 ($6.58) $7.47 $23,182 0% -10% -10%$14.37 $6.42 $3.42 $12,792 1% -1% -1%$22.02 $22.73 $12.89 $28,025 0% -27% -27%$22.46 ($0.69) $10.15 $57,066 -1% -44% -44%$7.15 $0.79 $4.19 $28,708 -11% -47% -47%
$13.36 $4.80 $15.55 $44,378 -12% 64% 64%$7.72 $4.09 $9.35 $38,704 1% -2% -2%
$35.13 $16.61 $6.44 $14,605 8% -28% -28%$33.14 $4.49 $13.70 $57,919 -7% -51% -51%$39.99 $22.21 $14.73 $19,814 0% -20% -20%$14.76 $8.36 $3.81 $26,046 -67% -92% -92%($7.78) ($2.71) $2.81 $13,651 -10% 138% 138%$9.00 $3.24 $6.29 $28,453 -1% -49% -49%
$26.25 $16.43 $4.83 $39,056 20% 7% 7%$7.45 $6.25 $2.54 $25,615 10% -8% -8%
($0.45) $6.01 $2.57 $28,689 -16% 11% 11%$38.66 $11.71 $4.61 $15,940 2% -53% -53%$18.20 $7.52 $9.40 $34,231 -2% -18% -18%$17.56 $7.00 $7.17 $29,880 0% -25% -25%
0 3 4 7 8 9 38 39.0 11
-1.7%
-10.7%
-4.2%
-27.5%
-8.2%
-42.1%
-5.1%
-25.3%
-45.0%
-40.0%
-35.0%
-30.0%
-25.0%
-20.0%
-15.0%
-10.0%
-5.0%
0.0%Week YTD
%C
hang
e
Stock Performance By Market Cap
Large Cap Mid Cap Small Cap Micro Cap
1.5%
-40.0%
-3.4%
-32.3%
2.2%
-23.8%
-4.6%
-30.8%
-45.0%
-40.0%
-35.0%
-30.0%
-25.0%
-20.0%
-15.0%
-10.0%
-5.0%
0.0%
5.0%5 Day YTD
%C
hang
e
Stock Performance By Region
Bakken Midcon/Ark-La-Tex Diversified GOM
2.8%
-8.7%
-2.2%
-13.9%
-16.0%
-14.0%
-12.0%
-10.0%
-8.0%
-6.0%
-4.0%
-2.0%
0.0%
2.0%
4.0%Week YTD
%C
hang
e
Performance of Oil and Gas Indexes
XOI XNG
25
Source: EnerCom, Company filings, Bloomberg L.P.Footnotes to the tables and glossary of terms can be found beginning on page 37.
EnerCom E&P WeeklyFebruary 19, 2016

26
Daily 3 Mo AvgShare Shares Value Daily Short 3Q 2015 3Q 2015Price O/S Mkt Cap Traded Trading Vol Interest Cash Debt EV
Segment 2/19/2016 (MM) ($MM) ($MM) (000's) Ratio ($MM) ($MM) ($MM)Large Cap
BHI * Baker Hughes Inc Services $42.14 437.9 $18,451 $108 3,836 1.9 $2,324 $4,041 $20,252CAM * Cameron International Corp Equipment $66.33 191.6 $12,709 $124 2,454 0.9 $1,775 $2,826 $14,596CBI Chicago Bridge & Iron Co NV Construction $33.20 104.9 $3,482 $46 1,687 5.1 $424 $2,519 $5,738CLB * Core Laboratories NV Services $107.29 42.4 $4,547 $97 749 9.4 $22 $431 $4,960DO * Diamond Offshore Drilling Inc Offshore Drilling $19.62 137.2 $2,691 $61 2,588 6.4 $119 $2,281 $4,853DRQ Dril-Quip Inc Equipment $52.38 38.4 $2,009 $36 510 3.7 $397 $0 $1,612FI Frank's International NV Services $13.19 155.1 $2,046 $4 466 10.6 $507 $0 $1,781FLR * Fluor Corp Construction $45.38 138.9 $6,304 $190 1,783 5.0 $1,950 $993 $5,463FTI * FMC Technologies Inc Equipment $25.17 226.9 $5,711 $106 4,252 1.7 $916 $1,156 $5,970HAL * Halliburton Co Services $31.37 858.3 $26,926 $286 12,960 2.9 $10,077 $15,346 $32,228HP * Helmerich & Payne Inc Land Drilling $51.58 108.0 $5,571 $88 2,650 7.5 $848 $532 $5,255KEX * Kirby Corp Services $54.48 53.8 $2,931 $34 899 6.2 $6 $779 $3,715NOV * National Oilwell Varco Inc Equipment $29.30 375.8 $11,011 $112 6,738 4.5 $2,080 $3,930 $12,938OII * Oceaneering International Inc Services $28.11 97.9 $2,751 $66 1,787 2.4 $385 $796 $3,161PTEN * Patterson-UTI Energy Inc Land Drilling $15.00 147.2 $2,208 $72 5,023 3.5 $113 $855 $2,949PWR Quanta Services Inc Services $18.68 152.9 $2,856 $54 3,486 1.8 $49 $351 $3,172RES RPC Inc Services $12.90 217.0 $2,799 $30 2,319 5.3 $8 $20 $2,811RIG * Transocean Ltd Offshore Drilling $8.33 364.1 $3,033 $125 11,482 10.6 $2,339 $8,490 $9,502SLB * Schlumberger Ltd Services $72.87 1,253.2 $91,323 $604 10,180 4.5 $2,793 $18,999 $107,801
5,6 SPM IM Saipem SpA Services $0.33 10,149.9 $3,357 $42 47,944 NA $1,429 $7,001 $8,9874 TKPPY Technip SA Services $10.93 476.1 $5,204 $0 129 0.0 $3,802 $2,501 $3,920
TS Tenaris SA Services $20.84 590.3 $12,301 $62 2,911 1.3 $498 $999 $12,957WFT * Weatherford International Ltd Equipment $6.20 779.5 $4,833 $90 14,852 2.7 $467 $7,461 $11,888
Average $10,220 $106 6,160 4.5 $1,449 $3,579 $12,457Median $4,547 $72 2,650 4.1 $507 $1,156 $5,463
Mid CapCKH SEACOR Holdings Inc Offshore Supply $45.20 17.4 $784 $8 155 13.3 $457 $961 $1,403
3 ESI CN Ensign Energy Services Inc Land Drilling $5.29 153.1 $810 $2 584 3.6 $44 $797 $1,563ESV Ensco PLC Offshore Drilling $8.22 235.5 $1,936 $58 7,304 2.5 $240 $5,903 $7,609FET Forum Energy Technologies Inc Services $9.39 90.4 $849 $13 1,347 5.5 $76 $403 $1,176KBR KBR Inc Construction $12.19 144.3 $1,759 $18 1,410 2.9 $768 $66 $1,049MDR * McDermott International Inc Construction $2.43 239.0 $581 $5 3,498 11.0 $665 $844 $820MTZ MasTec Inc Construction $14.39 79.9 $1,150 $9 1,082 6.6 $7 $1,177 $2,324NBR Nabors Industries Ltd Land Drilling $6.88 283.5 $1,950 $59 8,346 1.9 $251 $3,747 $5,455NE * Noble Corp plc Offshore Drilling $7.58 243.2 $1,843 $56 8,365 4.6 $512 $4,489 $6,543OIS * Oil States International Inc Equipment $24.38 51.4 $1,254 $42 1,180 2.1 $36 $129 $1,347
3 PD CN * Precision Drilling Corp Land Drilling $4.34 292.9 $1,271 $12 3,600 1.5 $445 $2,181 $3,007PGSVY * Petroleum Geo-Services ASA Services $2.40 239.6 $575 $0 2 1.1 $82 $1,125 $1,618
3 PSI CN Pason Systems Inc Seismic $16.68 84.1 $1,402 $5 317 12.0 $198 $0 $1,204RDC Rowan Cos Plc Offshore Drilling $11.45 124.8 $1,429 $36 3,796 3.2 $290 $2,807 $3,945
3 SES CN Secure Energy Services Inc Services $6.75 137.7 $930 $3 960 4.6 $3 $275 $1,202SLCA US Silica Holdings Inc Services $16.86 53.4 $900 $28 1,763 8.0 $254 $495 $1,141SPN Superior Energy Services Inc Services $9.13 150.7 $1,376 $30 3,662 2.3 $534 $1,643 $2,485SUBCY Subsea 7 SA Services $5.88 327.4 $1,924 $0 59 1.8 $657 $553 $1,782THR * Thermon Group Holdings Inc Services $16.82 32.2 $542 $4 200 6.4 $79 $103 $570
6 VK FP * Vallourec SA Services $4.07 135.7 $553 $17 3,682 NA $631 $2,150 $2,464Average $1,191 $20 2,566 5.0 $311 $1,492 $2,435Median $1,202 $12 1,379 3.6 $253 $903 $1,590
Source: EnerCom, Company filings, Bloomberg L.P.Footnotes to the tables and glossary of terms can be found beginning on page 37.
EnerCom OilService WeeklyFebruary 19, 2016

Daily 3 Mo AvgShare Shares Value Daily Short 3Q 2015 3Q 2015Price O/S Mkt Cap Traded Trading Vol Interest Cash Debt EV
Segment 2/19/2016 (MM) ($MM) ($MM) (000's) Ratio ($MM) ($MM) ($MM)
Small CapATW * Atwood Oceanics Inc Offshore Drilling $6.63 64.8 $429 $25 4,469 4.2 $116 $1,608 $1,922BRS * Bristow Group Inc Offshore Supply $14.07 35.0 $492 $9 853 2.6 $132 $1,223 $1,591
3 CFW CN * Calfrac Well Services Ltd Services $1.24 115.6 $143 $1 957 2.8 $124 $944 $9604 CGG CGG SA Seismic $0.65 708.3 $460 $0 61 1.9 $335 $2,873 $3,043
CJES * C&J Energy Services Ltd Services $2.20 120.4 $265 $1 2,211 9.7 $26 $1,156 $1,395CRR CARBO Ceramics Inc Services $18.15 23.3 $423 $6 668 8.0 $91 $88 $420FTK * Flotek Industries Inc Equipment $6.89 53.6 $369 $3 1,015 14.9 $2 $51 $418GEOS * Geospace Technologies Corp Equipment $9.18 13.3 $122 $1 222 17.3 $17 $0 $105GIFI Gulf Island Fabrication Inc Offshore Supply $9.06 14.6 $132 $0 69 3.3 $45 $0 $87HCLP Hi-Crush Partners LP Services $4.20 37.0 $155 $1 324 2.7 $5 $252 $404HLX Helix Energy Solutions Group Inc Services $2.82 106.1 $299 $4 1,253 3.1 $469 $776 $607HOS Hornbeck Offshore Services Inc Offshore Supply $6.53 35.8 $234 $13 1,250 7.7 $303 $1,081 $1,012
7 LAYN Layne Christensen Co Services $5.77 19.8 $114 $1 189 21.4 $70 $163 $207NR * Newpark Resources Inc Services $3.54 84.1 $298 $2 930 4.5 $107 $179 $369PKD Parker Drilling Co Land Drilling $1.20 123.2 $148 $1 689 4.3 $105 $585 $633POWL * Powell Industries Inc Services $26.19 11.4 $297 $1 80 2.5 $59 $2 $241
3 PSD CN Pulse Seismic Inc Seismic $2.46 56.3 $138 $0 44 146.3 $1 $1 $1393 SVY CN Savanna Energy Services Corp Services $1.23 90.3 $111 $0 185 4.9 $18 $309 $4193 TCW CN Trican Well Service Ltd Services $1.52 148.9 $226 $1 2,132 0.6 $76 $759 $9093 TDG CN Trinidad Drilling Ltd Land Drilling $1.68 222.1 $373 $1 1,027 3.1 $25 $680 $1,029
TDW * Tidewater Inc Offshore Supply $5.10 47.0 $240 $7 1,822 4.3 $48 $1,452 $1,649TESO Tesco Corp Services $6.51 39.0 $254 $1 293 8.9 $57 $0 $197TTI TETRA Technologies Inc Services $5.15 80.2 $413 $3 929 1.2 $25 $919 $1,679
3 XDC CN Xtreme Drilling & Coil Services Corp Land Drilling $1.44 83.1 $120 $0 99 0.2 $17 $110 $213Average $261 $3 907 11.7 $95 $634 $819Median $247 $1 771 4.2 $58 $447 $513
Micro CapAETI American Electric Technologies Inc Services $2.41 8.3 $20 $0 30 1.3 $9 $5 $21BAS * Basic Energy Services Inc Services $1.86 42.2 $78 $1 1,667 19.0 $47 $887 $919DWSN Dawson Geophysical Co Seismic $3.21 21.6 $69 $0 53 1.9 $39 $12 $42EMES Emerge Energy Services LP Services $3.80 24.1 $92 $1 502 2.7 $6 $273 $359ENSV Enservco Corp Services $0.40 38.1 $15 $0 77 2.7 $1 $20 $34FES Forbes Energy Services Ltd Services $0.27 22.2 $6 $0 59 3.1 $85 $303 $238GLF Gulfmark Offshore Inc Offshore Supply $3.06 25.7 $79 $1 506 12.6 $31 $524 $571GRH GreenHunter Resources Inc Services $0.10 42.3 $4 $0 147 0.2 $0 $20 $73ICD Independence Contract Drilling Inc Land Drilling $3.87 24.4 $94 $0 57 18.9 $5 $60 $150IO * ION Geophysical Corp Services $3.31 10.6 $35 $0 72 5.6 $85 $186 $136KEG Key Energy Services Inc Services $0.23 157.6 $37 $1 1,698 12.8 $199 $965 $803
3 LII CN Logan International Inc Services $1.43 33.7 $48 NA 2 0.5 $1 $52 $99PES * Pioneer Energy Services Corp Land Drilling $1.18 64.5 $76 $1 1,041 4.1 $14 $395 $457
3 PHX CN PHX Energy Services Corp Services $1.49 41.6 $62 $0 71 12.5 $3 $70 $129SAEX SAExploration Holdings Inc Seismic $1.69 17.4 $29 $0 6 22.5 $17 $141 $157SDPI Superior Drilling Products Inc Equipment $1.67 17.4 $29 $0 106 0.1 $2 $21 $48
3 SDY CN Strad Energy Services Ltd Services $1.77 37.3 $66 $0 83 0.1 $0 $25 $91SSE Seventy Seven Energy Inc Equipment $0.46 59.3 $27 $0 760 8.2 $156 $1,595 $1,466WG Willbros Group Inc Construction $1.42 62.1 $88 $0 222 6.6 $48 $216 $256
Average $50 $0 377 7.1 $39 $304 $318Median $48 $0 83 4.1 $14 $141 $150
27
Source: EnerCom, Company filings, Bloomberg L.P.Footnotes to the tables and glossary of terms can be found beginning on page 37.
EnerCom OilService WeeklyFebruary 19, 2016

28
SegmentLarge Cap
BHI * Baker Hughes Inc ServicesCAM * Cameron International Corp EquipmentCBI Chicago Bridge & Iron Co NV ConstructionCLB * Core Laboratories NV ServicesDO * Diamond Offshore Drilling Inc Offshore DrillingDRQ Dril-Quip Inc EquipmentFI Frank's International NV ServicesFLR * Fluor Corp ConstructionFTI * FMC Technologies Inc EquipmentHAL * Halliburton Co ServicesHP * Helmerich & Payne Inc Land DrillingKEX * Kirby Corp ServicesNOV * National Oilwell Varco Inc EquipmentOII * Oceaneering International Inc ServicesPTEN * Patterson-UTI Energy Inc Land DrillingPWR Quanta Services Inc ServicesRES RPC Inc ServicesRIG * Transocean Ltd Offshore DrillingSLB * Schlumberger Ltd Services
5,6 SPM IM Saipem SpA Services4 TKPPY Technip SA Services
TS Tenaris SA ServicesWFT * Weatherford International Ltd Equipment
AverageMedian
Mid CapCKH SEACOR Holdings Inc Offshore Supply
3 ESI CN Ensign Energy Services Inc Land DrillingESV Ensco PLC Offshore DrillingFET Forum Energy Technologies Inc ServicesKBR KBR Inc ConstructionMDR * McDermott International Inc ConstructionMTZ MasTec Inc ConstructionNBR Nabors Industries Ltd Land DrillingNE * Noble Corp plc Offshore DrillingOIS * Oil States International Inc Equipment
3 PD CN * Precision Drilling Corp Land DrillingPGSVY * Petroleum Geo-Services ASA Services
3 PSI CN Pason Systems Inc SeismicRDC Rowan Cos Plc Offshore Drilling
3 SES CN Secure Energy Services Inc ServicesSLCA US Silica Holdings Inc ServicesSPN Superior Energy Services Inc ServicesSUBCY Subsea 7 SA ServicesTHR * Thermon Group Holdings Inc Services
6 VK FP * Vallourec SA ServicesAverageMedian
TTM TTM TTMEBITDA EBITDA Net Inc
Days Sales 9/30/2015 9/30/2014 9/30/2015Outstanding ($MM) ($MM) ($MM) ROA(1)
100.1 $1,469 $4,673 -$1,967 6%57.3 $1,571 $1,577 $501 14%41.1 $1,267 $1,104 -$288 13%78.5 $211 $373 $115 34%65.6 $1,067 $1,029 -$274 15%
128.1 $298 $294 $203 21%99.2 $344 $393 $106 20%26.9 $1,135 $1,409 $412 15%
104.7 $911 $1,359 $393 14%99.5 $4,156 $7,223 -$671 11%77.9 $826 $1,663 $235 12%60.2 $579 $657 $227 14%90.8 $2,397 $4,333 -$769 9%82.9 $651 $858 $231 19%85.2 $748 $1,002 -$294 16%84.1 $612 $670 $383 11%98.3 $303 $566 $16 24%86.5 $3,457 -$254 $791 13%
102.6 $9,527 $11,813 $2,072 14%77.8 $360 $1,396 -$1,286 2%NA $1,129 $1,010 $23 7%
65.1 $1,138 $2,752 $129 7%92.8 $1,633 $1,876 -$1,985 11%82.1 $1,556 $2,077 -$74 14%84.7 $1,067 $1,104 $115 14%
62.3 $171 $272 $28 5%76.1 $365 $499 -$94 10%66.7 $1,883 $1,664 -$2,575 11%65.4 $200 $304 $90 9%55.9 $102 $92 -$1,080 3%20.9 $310 $121 -$18 9%99.7 $312 $415 $20 10%92.8 $1,266 $1,746 -$1,100 13%58.1 $1,656 $1,161 $511 13%
116.2 $197 NA $29 12%106.7 $494 $674 -$363 10%71.8 $596 $703 -$528 20%87.1 $181 $214 $33 33%84.3 $1,004 $606 -$358 12%41.6 $131 $185 -$87 9%52.0 $157 $197 $60 14%78.0 $668 $858 -$1,551 13%NA $1,339 $1,330 -$563 16%
77.1 $65 $83 $30 14%81.1 -$29 -$350 -$865 0%73.4 $553 $567 -$419 12%76.1 $311 $415 -$90 12%
Source: EnerCom, Company filings, Bloomberg L.P.Footnotes to the tables and glossary of terms can be found beginning on page 37.
EnerCom OilService WeeklyFebruary 19, 2016

SegmentLarge Cap
BHI * Baker Hughes Inc ServicesCAM * Cameron International Corp EquipmentCBI Chicago Bridge & Iron Co NV ConstructionCLB * Core Laboratories NV ServicesDO * Diamond Offshore Drilling Inc Offshore DrillingDRQ Dril-Quip Inc EquipmentFI Frank's International NV ServicesFLR * Fluor Corp ConstructionFTI * FMC Technologies Inc EquipmentHAL * Halliburton Co ServicesHP * Helmerich & Payne Inc Land DrillingKEX * Kirby Corp ServicesNOV * National Oilwell Varco Inc EquipmentOII * Oceaneering International Inc ServicesPTEN * Patterson-UTI Energy Inc Land DrillingPWR Quanta Services Inc ServicesRES RPC Inc ServicesRIG * Transocean Ltd Offshore DrillingSLB * Schlumberger Ltd Services
5,6 SPM IM Saipem SpA Services4 TKPPY Technip SA Services
TS Tenaris SA ServicesWFT * Weatherford International Ltd Equipment
AverageMedian
Mid CapCKH SEACOR Holdings Inc Offshore Supply
3 ESI CN Ensign Energy Services Inc Land DrillingESV Ensco PLC Offshore DrillingFET Forum Energy Technologies Inc ServicesKBR KBR Inc ConstructionMDR * McDermott International Inc ConstructionMTZ MasTec Inc ConstructionNBR Nabors Industries Ltd Land DrillingNE * Noble Corp plc Offshore DrillingOIS * Oil States International Inc Equipment
3 PD CN * Precision Drilling Corp Land DrillingPGSVY * Petroleum Geo-Services ASA Services
3 PSI CN Pason Systems Inc SeismicRDC Rowan Cos Plc Offshore Drilling
3 SES CN Secure Energy Services Inc ServicesSLCA US Silica Holdings Inc ServicesSPN Superior Energy Services Inc ServicesSUBCY Subsea 7 SA ServicesTHR * Thermon Group Holdings Inc Services
6 VK FP * Vallourec SA ServicesAverageMedian
TTM TTM TTMEBITDA EBITDA Net Inc
Days Sales 9/30/2015 9/30/2014 9/30/2015Outstanding ($MM) ($MM) ($MM) ROA(1)
100.1 $1,469 $4,673 -$1,967 6%57.3 $1,571 $1,577 $501 14%41.1 $1,267 $1,104 -$288 13%78.5 $211 $373 $115 34%65.6 $1,067 $1,029 -$274 15%
128.1 $298 $294 $203 21%99.2 $344 $393 $106 20%26.9 $1,135 $1,409 $412 15%
104.7 $911 $1,359 $393 14%99.5 $4,156 $7,223 -$671 11%77.9 $826 $1,663 $235 12%60.2 $579 $657 $227 14%90.8 $2,397 $4,333 -$769 9%82.9 $651 $858 $231 19%85.2 $748 $1,002 -$294 16%84.1 $612 $670 $383 11%98.3 $303 $566 $16 24%86.5 $3,457 -$254 $791 13%
102.6 $9,527 $11,813 $2,072 14%77.8 $360 $1,396 -$1,286 2%NA $1,129 $1,010 $23 7%
65.1 $1,138 $2,752 $129 7%92.8 $1,633 $1,876 -$1,985 11%82.1 $1,556 $2,077 -$74 14%84.7 $1,067 $1,104 $115 14%
62.3 $171 $272 $28 5%76.1 $365 $499 -$94 10%66.7 $1,883 $1,664 -$2,575 11%65.4 $200 $304 $90 9%55.9 $102 $92 -$1,080 3%20.9 $310 $121 -$18 9%99.7 $312 $415 $20 10%92.8 $1,266 $1,746 -$1,100 13%58.1 $1,656 $1,161 $511 13%
116.2 $197 NA $29 12%106.7 $494 $674 -$363 10%71.8 $596 $703 -$528 20%87.1 $181 $214 $33 33%84.3 $1,004 $606 -$358 12%41.6 $131 $185 -$87 9%52.0 $157 $197 $60 14%78.0 $668 $858 -$1,551 13%NA $1,339 $1,330 -$563 16%
77.1 $65 $83 $30 14%81.1 -$29 -$350 -$865 0%73.4 $553 $567 -$419 12%76.1 $311 $415 -$90 12%
SegmentLarge CapSmall Cap
ATW * Atwood Oceanics Inc Offshore DrillingBRS * Bristow Group Inc Offshore Supply
3 CFW CN * Calfrac Well Services Ltd Services4 CGG CGG SA Seismic
CJES * C&J Energy Services Ltd ServicesCRR CARBO Ceramics Inc ServicesFTK * Flotek Industries Inc EquipmentGEOS * Geospace Technologies Corp EquipmentGIFI Gulf Island Fabrication Inc Offshore SupplyHCLP Hi-Crush Partners LP ServicesHLX Helix Energy Solutions Group Inc ServicesHOS Hornbeck Offshore Services Inc Offshore Supply
7 LAYN Layne Christensen Co ServicesNR * Newpark Resources Inc ServicesPKD Parker Drilling Co Land DrillingPOWL * Powell Industries Inc Services
3 PSD CN Pulse Seismic Inc Seismic3 SVY CN Savanna Energy Services Corp Services3 TCW CN Trican Well Service Ltd Services3 TDG CN Trinidad Drilling Ltd Land Drilling
TDW * Tidewater Inc Offshore SupplyTESO Tesco Corp ServicesTTI TETRA Technologies Inc Services
3 XDC CN Xtreme Drilling & Coil Services Corp Land DrillingAverageMedian
Micro CapAETI American Electric Technologies Inc ServicesBAS * Basic Energy Services Inc ServicesDWSN Dawson Geophysical Co SeismicEMES Emerge Energy Services LP ServicesENSV Enservco Corp ServicesFES Forbes Energy Services Ltd ServicesGLF Gulfmark Offshore Inc Offshore SupplyGRH GreenHunter Resources Inc ServicesICD Independence Contract Drilling Inc Land DrillingIO * ION Geophysical Corp ServicesKEG Key Energy Services Inc Services
3 LII CN Logan International Inc ServicesPES * Pioneer Energy Services Corp Land Drilling
3 PHX CN PHX Energy Services Corp ServicesSAEX SAExploration Holdings Inc SeismicSDPI Superior Drilling Products Inc Equipment
3 SDY CN Strad Energy Services Ltd ServicesSSE Seventy Seven Energy Inc EquipmentWG Willbros Group Inc Construction
AverageMedian
TTM TTM TTMEBITDA EBITDA Net Inc
Days Sales 9/30/2015 9/30/2014 9/30/2015Outstanding ($MM) ($MM) ($MM) ROA(1)
62.7 $755 $572 $425 16%52.6 $254 $268 -$32 8%90.7 $41 $345 -$222 2%NA $2,391 $922 -$1,861 43%NA $32 NA -$873 1%
80.8 $17 $161 -$59 2%69.8 $19 $99 -$13 5%61.3 -$35 $26 -$38 -12%57.1 $21 $45 -$11 6%51.5 $107 $128 $55 26%63.7 $173 $414 $35 6%70.4 $243 $285 $89 8%50.3 -$2 $9 -$51 0%
141.5 $22 $173 -$91 3%110.8 $188 $264 -$52 13%59.1 $40 $29 $9 9%
119.8 $18 $25 -$5 31%68.2 $132 $103 -$241 12%
NA $77 $180 -$516 4%99.5 $202 $244 -$90 8%91.6 $260 $171 -$87 6%
102.6 $42 $97 -$57 8%67.2 $246 $77 -$130 13%67.1 $67 $75 -$49 13%78.0 $221 $205 -$161 10%68.2 $72 $161 -$51 8%
62.7 -$1 $0 -$1 -2%79.1 $24 $276 -$242 2%41.3 $3 $16 -$27 1%19.1 $75 $110 $25 18%26.1 $10 $9 $2 22%73.6 $39 $74 -$31 9%84.8 $77 $195 -$191 5%57.6 -$1 -$2 -$7 -4%58.1 $22 NA -$27 7%
130.7 -$26 -$26 -$25 -6%77.6 $25 $68 -$818 2%
101.4 $6 $44 -$23 2%62.0 $109 $207 -$155 13%88.4 $48 $66 -$37 15%89.5 $41 $44 -$16 23%70.4 $0 $5 -$5 1%90.9 $33 $52 -$16 17%84.0 $227 $335 -$170 11%
NA -$15 $64 -$82 -3%72.1 $37 $85 -$97 7%75.6 $24 $58 -$27 5%
29
Source: EnerCom, Company filings, Bloomberg L.P.Footnotes to the tables and glossary of terms can be found beginning on page 37.
EnerCom OilService WeeklyFebruary 19, 2016

30
SegmentLarge Cap
BHI * Baker Hughes Inc ServicesCAM * Cameron International Corp EquipmentCBI Chicago Bridge & Iron Co NV ConstructionCLB * Core Laboratories NV ServicesDO * Diamond Offshore Drilling Inc Offshore DrillingDRQ Dril-Quip Inc EquipmentFI Frank's International NV ServicesFLR * Fluor Corp ConstructionFTI * FMC Technologies Inc EquipmentHAL * Halliburton Co ServicesHP * Helmerich & Payne Inc Land DrillingKEX * Kirby Corp ServicesNOV * National Oilwell Varco Inc EquipmentOII * Oceaneering International Inc ServicesPTEN * Patterson-UTI Energy Inc Land DrillingPWR Quanta Services Inc ServicesRES RPC Inc ServicesRIG * Transocean Ltd Offshore DrillingSLB * Schlumberger Ltd Services
5,6 SPM IM Saipem SpA Services4 TKPPY Technip SA Services
TS Tenaris SA ServicesWFT * Weatherford International Ltd Equipment
AverageMedian
Mid CapCKH SEACOR Holdings Inc Offshore Supply
3 ESI CN Ensign Energy Services Inc Land DrillingESV Ensco PLC Offshore DrillingFET Forum Energy Technologies Inc ServicesKBR KBR Inc ConstructionMDR * McDermott International Inc ConstructionMTZ MasTec Inc ConstructionNBR Nabors Industries Ltd Land DrillingNE * Noble Corp plc Offshore DrillingOIS * Oil States International Inc Equipment
3 PD CN * Precision Drilling Corp Land DrillingPGSVY * Petroleum Geo-Services ASA Services
3 PSI CN Pason Systems Inc SeismicRDC Rowan Cos Plc Offshore Drilling
3 SES CN Secure Energy Services Inc ServicesSLCA US Silica Holdings Inc ServicesSPN Superior Energy Services Inc ServicesSUBCY Subsea 7 SA ServicesTHR * Thermon Group Holdings Inc Services
6 VK FP * Vallourec SA ServicesAverageMedian
Op Debt/ P/CFPSROIC(1) ROPPE(1) Profit % MktCap ROE(1) 2016E(2)
8% 22% -15% 22% 9% 11.9x24% 91% 6% 22% 29% 14.4x29% 210% -1% 72% 57% 13.7x55% 147% 20% 9% N/A 23.9x17% 17% -12% 85% 26% 3.5x32% 102% 30% 0% 23% 9.3x36% 53% 21% 0% 23% 10.6x53% 127% 4% 16% 36% 8.4x33% 66% 9% 20% 36% 7.5x20% 38% -1% 57% 27% 8.9x18% 15% 15% 10% 17% 5.0x19% 21% 18% 27% 25% 6.7x13% 77% -3% 36% 15% 6.6x33% 51% 12% 29% 41% 5.4x23% 19% -22% 39% 29% 3.1x17% 54% 5% 12% 19% 9.3x30% 40% 2% 1% 31% 10.9x16% 17% 19% 280% 23% 1.1x18% 71% 8% 21% 27% 10.5x4% 3% -105% 209% 11% -5.9x
36% 18% 3% 48% 26% 8.5x9% 21% 6% 8% 9% 13.3x
14% 29% -16% 154% 37% 6.5x24% 57% 0% 51% 26% 8.4x20% 40% 5% 22% 26% 8.5x
9% 11% 7% 123% 12% NA13% 11% -3% 98% 17% 2.4x13% 14% -40% 305% 21% 1.2x11% 102% 9% 47% 14% 5.6x38% 52% -11% 4% 10% 18.1x18% 19% 3% 145% 20% 6.2x14% 53% 2% 102% 30% 3.7x16% 17% -14% 192% 28% 2.5x15% 14% 27% 244% 22% 1.3x15% 31% 5% 10% 16% 5.4x13% 13% -30% 172% 23% 3.1x24% 43% -45% 196% 41% 1.1x61% 86% 25% 0% 37% 16.4x14% 13% -13% 196% 22% 1.8x11% 15% -2% 30% 14% 9.5x25% 28% 11% 55% 40% 16.8x19% 28% -45% 119% 27% 2.7x24% 28% -11% 29% 23% 2.4x21% 163% 15% 19% 23% 9.0x-1% -1% -22% 389% -1% 45.3x19% 37% -7% 124% 22% 8.1x15% 24% -2% 111% 22% 3.7x
ECI Value Drivers
Source: EnerCom, Company filings, Bloomberg L.P.Footnotes to the tables and glossary of terms can be found beginning on page 37.
EnerCom OilService WeeklyFebruary 19, 2016

SegmentLarge Cap
BHI * Baker Hughes Inc ServicesCAM * Cameron International Corp EquipmentCBI Chicago Bridge & Iron Co NV ConstructionCLB * Core Laboratories NV ServicesDO * Diamond Offshore Drilling Inc Offshore DrillingDRQ Dril-Quip Inc EquipmentFI Frank's International NV ServicesFLR * Fluor Corp ConstructionFTI * FMC Technologies Inc EquipmentHAL * Halliburton Co ServicesHP * Helmerich & Payne Inc Land DrillingKEX * Kirby Corp ServicesNOV * National Oilwell Varco Inc EquipmentOII * Oceaneering International Inc ServicesPTEN * Patterson-UTI Energy Inc Land DrillingPWR Quanta Services Inc ServicesRES RPC Inc ServicesRIG * Transocean Ltd Offshore DrillingSLB * Schlumberger Ltd Services
5,6 SPM IM Saipem SpA Services4 TKPPY Technip SA Services
TS Tenaris SA ServicesWFT * Weatherford International Ltd Equipment
AverageMedian
Mid CapCKH SEACOR Holdings Inc Offshore Supply
3 ESI CN Ensign Energy Services Inc Land DrillingESV Ensco PLC Offshore DrillingFET Forum Energy Technologies Inc ServicesKBR KBR Inc ConstructionMDR * McDermott International Inc ConstructionMTZ MasTec Inc ConstructionNBR Nabors Industries Ltd Land DrillingNE * Noble Corp plc Offshore DrillingOIS * Oil States International Inc Equipment
3 PD CN * Precision Drilling Corp Land DrillingPGSVY * Petroleum Geo-Services ASA Services
3 PSI CN Pason Systems Inc SeismicRDC Rowan Cos Plc Offshore Drilling
3 SES CN Secure Energy Services Inc ServicesSLCA US Silica Holdings Inc ServicesSPN Superior Energy Services Inc ServicesSUBCY Subsea 7 SA ServicesTHR * Thermon Group Holdings Inc Services
6 VK FP * Vallourec SA ServicesAverageMedian
Op Debt/ P/CFPSROIC(1) ROPPE(1) Profit % MktCap ROE(1) 2016E(2)
8% 22% -15% 22% 9% 11.9x24% 91% 6% 22% 29% 14.4x29% 210% -1% 72% 57% 13.7x55% 147% 20% 9% N/A 23.9x17% 17% -12% 85% 26% 3.5x32% 102% 30% 0% 23% 9.3x36% 53% 21% 0% 23% 10.6x53% 127% 4% 16% 36% 8.4x33% 66% 9% 20% 36% 7.5x20% 38% -1% 57% 27% 8.9x18% 15% 15% 10% 17% 5.0x19% 21% 18% 27% 25% 6.7x13% 77% -3% 36% 15% 6.6x33% 51% 12% 29% 41% 5.4x23% 19% -22% 39% 29% 3.1x17% 54% 5% 12% 19% 9.3x30% 40% 2% 1% 31% 10.9x16% 17% 19% 280% 23% 1.1x18% 71% 8% 21% 27% 10.5x4% 3% -105% 209% 11% -5.9x
36% 18% 3% 48% 26% 8.5x9% 21% 6% 8% 9% 13.3x
14% 29% -16% 154% 37% 6.5x24% 57% 0% 51% 26% 8.4x20% 40% 5% 22% 26% 8.5x
9% 11% 7% 123% 12% NA13% 11% -3% 98% 17% 2.4x13% 14% -40% 305% 21% 1.2x11% 102% 9% 47% 14% 5.6x38% 52% -11% 4% 10% 18.1x18% 19% 3% 145% 20% 6.2x14% 53% 2% 102% 30% 3.7x16% 17% -14% 192% 28% 2.5x15% 14% 27% 244% 22% 1.3x15% 31% 5% 10% 16% 5.4x13% 13% -30% 172% 23% 3.1x24% 43% -45% 196% 41% 1.1x61% 86% 25% 0% 37% 16.4x14% 13% -13% 196% 22% 1.8x11% 15% -2% 30% 14% 9.5x25% 28% 11% 55% 40% 16.8x19% 28% -45% 119% 27% 2.7x24% 28% -11% 29% 23% 2.4x21% 163% 15% 19% 23% 9.0x-1% -1% -22% 389% -1% 45.3x19% 37% -7% 124% 22% 8.1x15% 24% -2% 111% 22% 3.7x
ECI Value Drivers
53 2 47 4 3 5 52 50 51.0 6 7 9
ECI Value Driver Quartile ChartsLarge Cap
ECI Value Driver Quartile ChartsMid Cap
24%
0%
10%
20%
30%
40%
50%
60%
ROIC
57%
0%
50%
100%
150%
200%
250%
ROPPE
0%
-150%
-100%
-50%
0%
50%
100%
150%
Op Profit %
51%
0%
50%
100%
150%
200%
250%
300%
Debt/Mkt Cap
26%
0%
10%
20%
30%
40%
50%
60%
ROE
8.4x
0.0x
5.0x
10.0x
15.0x
20.0x
25.0x
30.0x
35.0x
P/CFPS 2016E
19%
0%
10%
20%
30%
40%
50%
60%
70%
ROIC
37%
0%20%40%60%80%
100%120%140%160%180%
ROPPE
-7%
-60%
-40%
-20%
0%
20%
40%
60%
80%
Op Profit %
124%
0%50%
100%150%200%250%300%350%400%450%
Debt/Mkt Cap
22%
0%5%
10%15%20%25%30%35%40%45%
ROE
8.1x
0.0x5.0x
10.0x15.0x20.0x25.0x30.0x35.0x40.0x45.0x50.0x
P/CFPS 2016E
1st Quartile
2nd Quartile
3rd Quartile
4th QuartileAverage
31
Source: EnerCom, Company filings, Bloomberg L.P.Footnotes to the tables and glossary of terms can be found beginning on page 37.
EnerCom OilService WeeklyFebruary 19, 2016
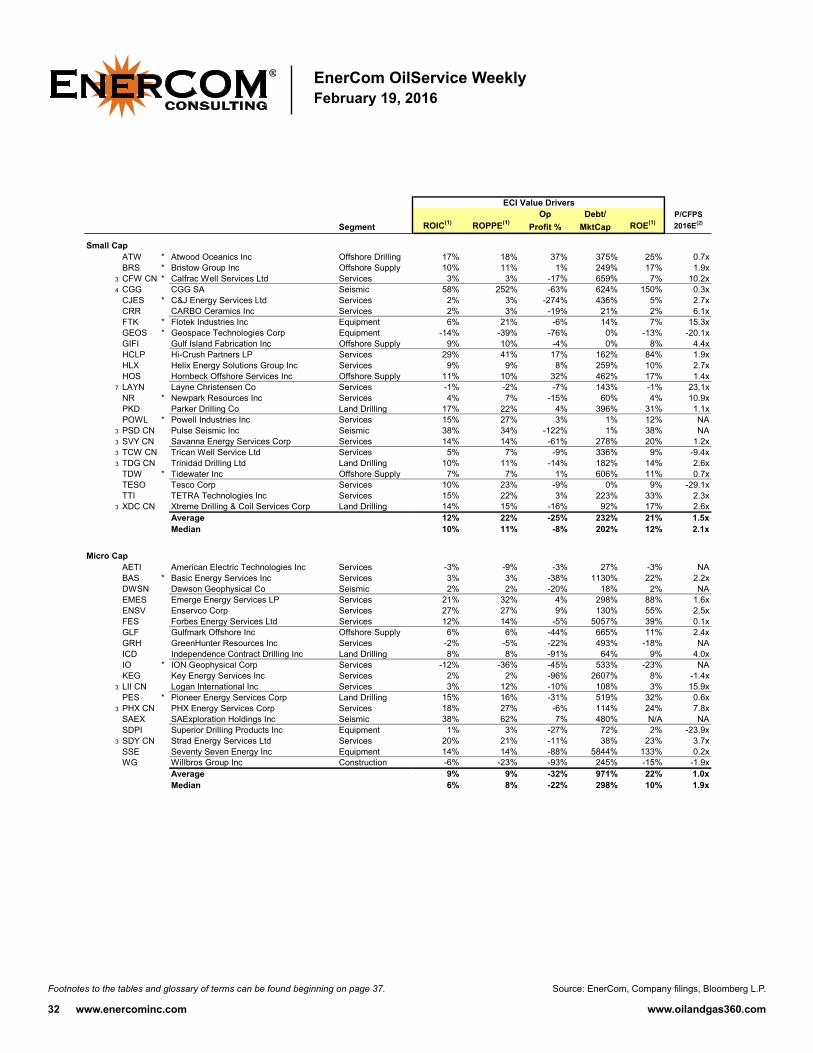
32
SegmentLarge CapSmall Cap
ATW * Atwood Oceanics Inc Offshore DrillingBRS * Bristow Group Inc Offshore Supply
3 CFW CN * Calfrac Well Services Ltd Services4 CGG CGG SA Seismic
CJES * C&J Energy Services Ltd ServicesCRR CARBO Ceramics Inc ServicesFTK * Flotek Industries Inc EquipmentGEOS * Geospace Technologies Corp EquipmentGIFI Gulf Island Fabrication Inc Offshore SupplyHCLP Hi-Crush Partners LP ServicesHLX Helix Energy Solutions Group Inc ServicesHOS Hornbeck Offshore Services Inc Offshore Supply
7 LAYN Layne Christensen Co ServicesNR * Newpark Resources Inc ServicesPKD Parker Drilling Co Land DrillingPOWL * Powell Industries Inc Services
3 PSD CN Pulse Seismic Inc Seismic3 SVY CN Savanna Energy Services Corp Services3 TCW CN Trican Well Service Ltd Services3 TDG CN Trinidad Drilling Ltd Land Drilling
TDW * Tidewater Inc Offshore SupplyTESO Tesco Corp ServicesTTI TETRA Technologies Inc Services
3 XDC CN Xtreme Drilling & Coil Services Corp Land DrillingAverageMedian
Micro CapAETI American Electric Technologies Inc ServicesBAS * Basic Energy Services Inc ServicesDWSN Dawson Geophysical Co SeismicEMES Emerge Energy Services LP ServicesENSV Enservco Corp ServicesFES Forbes Energy Services Ltd ServicesGLF Gulfmark Offshore Inc Offshore SupplyGRH GreenHunter Resources Inc ServicesICD Independence Contract Drilling Inc Land DrillingIO * ION Geophysical Corp ServicesKEG Key Energy Services Inc Services
3 LII CN Logan International Inc ServicesPES * Pioneer Energy Services Corp Land Drilling
3 PHX CN PHX Energy Services Corp ServicesSAEX SAExploration Holdings Inc SeismicSDPI Superior Drilling Products Inc Equipment
3 SDY CN Strad Energy Services Ltd ServicesSSE Seventy Seven Energy Inc EquipmentWG Willbros Group Inc Construction
AverageMedian
Op Debt/ P/CFPSROIC(1) ROPPE(1) Profit % MktCap ROE(1) 2016E(2)
ECI Value Drivers
17% 18% 37% 375% 25% 0.7x10% 11% 1% 249% 17% 1.9x3% 3% -17% 659% 7% 10.2x
58% 252% -63% 624% 150% 0.3x2% 3% -274% 436% 5% 2.7x2% 3% -19% 21% 2% 6.1x6% 21% -6% 14% 7% 15.3x
-14% -39% -76% 0% -13% -20.1x9% 10% -4% 0% 8% 4.4x
29% 41% 17% 162% 84% 1.9x9% 9% 8% 259% 10% 2.7x
11% 10% 32% 462% 17% 1.4x-1% -2% -7% 143% -1% 23.1x4% 7% -15% 60% 4% 10.9x
17% 22% 4% 396% 31% 1.1x15% 27% 3% 1% 12% NA38% 34% -122% 1% 38% NA14% 14% -61% 278% 20% 1.2x5% 7% -9% 336% 9% -9.4x
10% 11% -14% 182% 14% 2.6x7% 7% 1% 606% 11% 0.7x
10% 23% -9% 0% 9% -29.1x15% 22% 3% 223% 33% 2.3x14% 15% -16% 92% 17% 2.6x12% 22% -25% 232% 21% 1.5x10% 11% -8% 202% 12% 2.1x
-3% -9% -3% 27% -3% NA3% 3% -38% 1130% 22% 2.2x2% 2% -20% 18% 2% NA
21% 32% 4% 298% 88% 1.6x27% 27% 9% 130% 55% 2.5x12% 14% -5% 5057% 39% 0.1x6% 6% -44% 665% 11% 2.4x
-2% -5% -22% 493% -18% NA8% 8% -91% 64% 9% 4.0x
-12% -36% -45% 533% -23% NA2% 2% -96% 2607% 8% -1.4x3% 12% -10% 108% 3% 15.9x
15% 16% -31% 519% 32% 0.6x18% 27% -6% 114% 24% 7.8x38% 62% 7% 480% N/A NA1% 3% -27% 72% 2% -23.9x
20% 21% -11% 38% 23% 3.7x14% 14% -88% 5844% 133% 0.2x-6% -23% -93% 245% -15% -1.9x9% 9% -32% 971% 22% 1.0x6% 8% -22% 298% 10% 1.9x
Source: EnerCom, Company filings, Bloomberg L.P.Footnotes to the tables and glossary of terms can be found beginning on page 37.
EnerCom OilService WeeklyFebruary 19, 2016

SegmentLarge CapSmall Cap
ATW * Atwood Oceanics Inc Offshore DrillingBRS * Bristow Group Inc Offshore Supply
3 CFW CN * Calfrac Well Services Ltd Services4 CGG CGG SA Seismic
CJES * C&J Energy Services Ltd ServicesCRR CARBO Ceramics Inc ServicesFTK * Flotek Industries Inc EquipmentGEOS * Geospace Technologies Corp EquipmentGIFI Gulf Island Fabrication Inc Offshore SupplyHCLP Hi-Crush Partners LP ServicesHLX Helix Energy Solutions Group Inc ServicesHOS Hornbeck Offshore Services Inc Offshore Supply
7 LAYN Layne Christensen Co ServicesNR * Newpark Resources Inc ServicesPKD Parker Drilling Co Land DrillingPOWL * Powell Industries Inc Services
3 PSD CN Pulse Seismic Inc Seismic3 SVY CN Savanna Energy Services Corp Services3 TCW CN Trican Well Service Ltd Services3 TDG CN Trinidad Drilling Ltd Land Drilling
TDW * Tidewater Inc Offshore SupplyTESO Tesco Corp ServicesTTI TETRA Technologies Inc Services
3 XDC CN Xtreme Drilling & Coil Services Corp Land DrillingAverageMedian
Micro CapAETI American Electric Technologies Inc ServicesBAS * Basic Energy Services Inc ServicesDWSN Dawson Geophysical Co SeismicEMES Emerge Energy Services LP ServicesENSV Enservco Corp ServicesFES Forbes Energy Services Ltd ServicesGLF Gulfmark Offshore Inc Offshore SupplyGRH GreenHunter Resources Inc ServicesICD Independence Contract Drilling Inc Land DrillingIO * ION Geophysical Corp ServicesKEG Key Energy Services Inc Services
3 LII CN Logan International Inc ServicesPES * Pioneer Energy Services Corp Land Drilling
3 PHX CN PHX Energy Services Corp ServicesSAEX SAExploration Holdings Inc SeismicSDPI Superior Drilling Products Inc Equipment
3 SDY CN Strad Energy Services Ltd ServicesSSE Seventy Seven Energy Inc EquipmentWG Willbros Group Inc Construction
AverageMedian
Op Debt/ P/CFPSROIC(1) ROPPE(1) Profit % MktCap ROE(1) 2016E(2)
ECI Value Drivers
17% 18% 37% 375% 25% 0.7x10% 11% 1% 249% 17% 1.9x3% 3% -17% 659% 7% 10.2x
58% 252% -63% 624% 150% 0.3x2% 3% -274% 436% 5% 2.7x2% 3% -19% 21% 2% 6.1x6% 21% -6% 14% 7% 15.3x
-14% -39% -76% 0% -13% -20.1x9% 10% -4% 0% 8% 4.4x
29% 41% 17% 162% 84% 1.9x9% 9% 8% 259% 10% 2.7x
11% 10% 32% 462% 17% 1.4x-1% -2% -7% 143% -1% 23.1x4% 7% -15% 60% 4% 10.9x
17% 22% 4% 396% 31% 1.1x15% 27% 3% 1% 12% NA38% 34% -122% 1% 38% NA14% 14% -61% 278% 20% 1.2x5% 7% -9% 336% 9% -9.4x
10% 11% -14% 182% 14% 2.6x7% 7% 1% 606% 11% 0.7x
10% 23% -9% 0% 9% -29.1x15% 22% 3% 223% 33% 2.3x14% 15% -16% 92% 17% 2.6x12% 22% -25% 232% 21% 1.5x10% 11% -8% 202% 12% 2.1x
-3% -9% -3% 27% -3% NA3% 3% -38% 1130% 22% 2.2x2% 2% -20% 18% 2% NA
21% 32% 4% 298% 88% 1.6x27% 27% 9% 130% 55% 2.5x12% 14% -5% 5057% 39% 0.1x6% 6% -44% 665% 11% 2.4x
-2% -5% -22% 493% -18% NA8% 8% -91% 64% 9% 4.0x
-12% -36% -45% 533% -23% NA2% 2% -96% 2607% 8% -1.4x3% 12% -10% 108% 3% 15.9x
15% 16% -31% 519% 32% 0.6x18% 27% -6% 114% 24% 7.8x38% 62% 7% 480% N/A NA1% 3% -27% 72% 2% -23.9x
20% 21% -11% 38% 23% 3.7x14% 14% -88% 5844% 133% 0.2x-6% -23% -93% 245% -15% -1.9x9% 9% -32% 971% 22% 1.0x6% 8% -22% 298% 10% 1.9x
53 2 47 4 3 5 52 50 51.0 6 7 9
ECI Value Driver Quartile ChartsSmall Cap
ECI Value Driver Quartile ChartsMicro Cap
9%
-60%-40%-20%
0%20%40%60%80%
100%120%
ROPPE
-32%
-60%
-40%
-20%
0%
20%
40%
60%
Op Profit %
12%
0%
10%
20%
30%
40%
50%
60%
70%
80%
ROIC
22%0%
20%40%60%80%
100%120%140%160%180%200%
ROPPE
-25%
-400%-300%-200%-100%
0%100%200%300%400%
Op Profit %
232%
0%
100%
200%
300%
400%
500%
600%
700%
Debt/Mkt Cap
21%
0%20%40%60%80%
100%120%140%160%180%
ROE
1.5x0.0x
10.0x
20.0x
30.0x
40.0x
50.0x
60.0x
P/CFPS 2016E
9%
-20%
-10%
0%
10%
20%
30%
40%
50%
ROIC
971%
0%
1000%
2000%
3000%
4000%
5000%
6000%
7000%
Debt/Mkt Cap
22%
-30%
-10%
10%
30%
50%
70%
90%
ROE1.0x0.0x
5.0x10.0x15.0x20.0x25.0x30.0x35.0x40.0x45.0x
P/CFPS 2016E
1st Quartile
2nd Quartile3rd Quartile
4th QuartileAverage
33
Source: EnerCom, Company filings, Bloomberg L.P.Footnotes to the tables and glossary of terms can be found beginning on page 37.
EnerCom OilService WeeklyFebruary 19, 2016

34
SegmentLarge Cap
BHI * Baker Hughes Inc ServicesCAM * Cameron International Corp EquipmentCBI Chicago Bridge & Iron Co NV ConstructionCLB * Core Laboratories NV ServicesDO * Diamond Offshore Drilling Inc Offshore DrillingDRQ Dril-Quip Inc EquipmentFI Frank's International NV ServicesFLR * Fluor Corp ConstructionFTI * FMC Technologies Inc EquipmentHAL * Halliburton Co ServicesHP * Helmerich & Payne Inc Land DrillingKEX * Kirby Corp ServicesNOV * National Oilwell Varco Inc EquipmentOII * Oceaneering International Inc ServicesPTEN * Patterson-UTI Energy Inc Land DrillingPWR Quanta Services Inc ServicesRES RPC Inc ServicesRIG * Transocean Ltd Offshore DrillingSLB * Schlumberger Ltd Services
5,6 SPM IM Saipem SpA Services4 TKPPY Technip SA Services
TS Tenaris SA ServicesWFT * Weatherford International Ltd Equipment
AverageMedian
Mid CapCKH SEACOR Holdings Inc Offshore Supply
3 ESI CN Ensign Energy Services Inc Land DrillingESV Ensco PLC Offshore DrillingFET Forum Energy Technologies Inc ServicesKBR KBR Inc ConstructionMDR * McDermott International Inc ConstructionMTZ MasTec Inc ConstructionNBR Nabors Industries Ltd Land DrillingNE * Noble Corp plc Offshore DrillingOIS * Oil States International Inc Equipment
3 PD CN * Precision Drilling Corp Land DrillingPGSVY * Petroleum Geo-Services ASA Services
3 PSI CN Pason Systems Inc SeismicRDC Rowan Cos Plc Offshore Drilling
3 SES CN Secure Energy Services Inc ServicesSLCA US Silica Holdings Inc ServicesSPN Superior Energy Services Inc ServicesSUBCY Subsea 7 SA ServicesTHR * Thermon Group Holdings Inc Services
6 VK FP * Vallourec SA ServicesAverageMedian
TTMEBITDA Unlevered EV/ Book Value Capital Margin% FCF/Shr EBITDA per Share Intensity Week Q1'16 YTD
9% $1.15 13.8 x $37.30 66% 6% -9% -9%18% $6.71 9.3 x $23.82 18% 3% 5% 5%10% $10.83 4.5 x $19.87 10% 2% -15% -15%26% $4.44 23.5 x N/A 11% 8% -1% -1%44% $1.72 4.5 x $29.99 78% 16% -7% -7%33% $7.03 5.4 x $34.31 9% 3% -12% -12%32% $1.33 5.2 x $7.90 40% -3% -21% -21%6% $6.44 4.8 x $21.56 21% 4% -4% -4%
14% $2.91 6.6 x $11.07 28% 9% -13% -13%18% $2.30 7.8 x $18.06 53% 8% -8% -8%32% -$0.49 6.4 x $44.72 106% 9% -4% -4%27% $5.10 6.4 x $42.23 53% 1% 4% 4%16% $5.17 5.4 x $43.60 19% 6% -13% -13%21% $4.61 4.9 x $16.13 31% 4% -25% -25%40% $0.03 3.9 x $17.40 99% 14% -1% -1%
8% $2.36 5.2 x $20.38 41% 6% -8% -8%19% $0.07 9.3 x $4.55 95% 0% 8% 8%47% $4.00 2.7 x $39.83 58% -6% -33% -33%27% $5.68 11.3 x $28.37 25% 4% 4% 4%3% -$0.05 25.0 x $0.94 234% 10% -96% -96%9% $1.71 3.5 x NA 28% -2% -13% -13%
14% -$0.13 11.4 x NA 106% 0% -12% -12%17% $1.22 7.3 x $5.53 42% -4% -26% -26%21% $3.22 8.2 x $23.38 55% 4% -13% -13%18% $2.36 6.4 x $20.97 41% 4% -9% -9%
15% -$6.07 8.2 x $76.97 161% 6% -14% -14%21% $0.37 4.3 x $14.02 84% -2% -28% -28%43% $0.49 4.0 x $38.26 94% -2% -47% -47%15% $1.75 5.9 x $15.83 21% 10% -25% -25%2% $0.60 10.3 x $6.81 15% 2% -28% -28%
10% $0.87 2.6 x $6.22 33% 2% -27% -27%7% $2.79 7.4 x $12.78 29% 9% -17% -17%
26% $0.23 4.3 x $15.88 95% 15% -19% -19%49% $4.89 4.0 x $27.69 28% 3% -28% -28%18% $1.60 6.8 x $24.64 58% 5% -11% -11%32% $0.12 6.1 x $7.24 93% 10% -21% -21%62% $1.80 2.7 x NA 27% -1% -40% -40%50% $1.18 6.6 x $5.92 45% 3% -14% -14%47% -$2.09 3.9 x $37.22 126% -2% -32% -32%8% -$0.42 9.2 x $6.65 145% 8% -19% -19%
21% $1.47 7.3 x $7.45 50% 5% -10% -10%20% $0.83 3.7 x $16.27 81% 3% -32% -32%26% $1.73 1.3 x NA 58% 1% -16% -16%23% $0.67 8.7 x $8.70 67% 2% -1% -1%-1% -$2.44 NA $20.26 NA 14% -53% -53%25% $0.52 5.7 x $19.38 69% 5% -24% -24%21% $0.75 5.9 x $14.92 58% 3% -23% -23%
StockPerformance
Source: EnerCom, Company filings, Bloomberg L.P.Footnotes to the tables and glossary of terms can be found beginning on page 37.
EnerCom OilService WeeklyFebruary 19, 2016

SegmentLarge Cap
BHI * Baker Hughes Inc ServicesCAM * Cameron International Corp EquipmentCBI Chicago Bridge & Iron Co NV ConstructionCLB * Core Laboratories NV ServicesDO * Diamond Offshore Drilling Inc Offshore DrillingDRQ Dril-Quip Inc EquipmentFI Frank's International NV ServicesFLR * Fluor Corp ConstructionFTI * FMC Technologies Inc EquipmentHAL * Halliburton Co ServicesHP * Helmerich & Payne Inc Land DrillingKEX * Kirby Corp ServicesNOV * National Oilwell Varco Inc EquipmentOII * Oceaneering International Inc ServicesPTEN * Patterson-UTI Energy Inc Land DrillingPWR Quanta Services Inc ServicesRES RPC Inc ServicesRIG * Transocean Ltd Offshore DrillingSLB * Schlumberger Ltd Services
5,6 SPM IM Saipem SpA Services4 TKPPY Technip SA Services
TS Tenaris SA ServicesWFT * Weatherford International Ltd Equipment
AverageMedian
Mid CapCKH SEACOR Holdings Inc Offshore Supply
3 ESI CN Ensign Energy Services Inc Land DrillingESV Ensco PLC Offshore DrillingFET Forum Energy Technologies Inc ServicesKBR KBR Inc ConstructionMDR * McDermott International Inc ConstructionMTZ MasTec Inc ConstructionNBR Nabors Industries Ltd Land DrillingNE * Noble Corp plc Offshore DrillingOIS * Oil States International Inc Equipment
3 PD CN * Precision Drilling Corp Land DrillingPGSVY * Petroleum Geo-Services ASA Services
3 PSI CN Pason Systems Inc SeismicRDC Rowan Cos Plc Offshore Drilling
3 SES CN Secure Energy Services Inc ServicesSLCA US Silica Holdings Inc ServicesSPN Superior Energy Services Inc ServicesSUBCY Subsea 7 SA ServicesTHR * Thermon Group Holdings Inc Services
6 VK FP * Vallourec SA ServicesAverageMedian
TTMEBITDA Unlevered EV/ Book Value Capital Margin% FCF/Shr EBITDA per Share Intensity Week Q1'16 YTD
9% $1.15 13.8 x $37.30 66% 6% -9% -9%18% $6.71 9.3 x $23.82 18% 3% 5% 5%10% $10.83 4.5 x $19.87 10% 2% -15% -15%26% $4.44 23.5 x N/A 11% 8% -1% -1%44% $1.72 4.5 x $29.99 78% 16% -7% -7%33% $7.03 5.4 x $34.31 9% 3% -12% -12%32% $1.33 5.2 x $7.90 40% -3% -21% -21%6% $6.44 4.8 x $21.56 21% 4% -4% -4%
14% $2.91 6.6 x $11.07 28% 9% -13% -13%18% $2.30 7.8 x $18.06 53% 8% -8% -8%32% -$0.49 6.4 x $44.72 106% 9% -4% -4%27% $5.10 6.4 x $42.23 53% 1% 4% 4%16% $5.17 5.4 x $43.60 19% 6% -13% -13%21% $4.61 4.9 x $16.13 31% 4% -25% -25%40% $0.03 3.9 x $17.40 99% 14% -1% -1%
8% $2.36 5.2 x $20.38 41% 6% -8% -8%19% $0.07 9.3 x $4.55 95% 0% 8% 8%47% $4.00 2.7 x $39.83 58% -6% -33% -33%27% $5.68 11.3 x $28.37 25% 4% 4% 4%3% -$0.05 25.0 x $0.94 234% 10% -96% -96%9% $1.71 3.5 x NA 28% -2% -13% -13%
14% -$0.13 11.4 x NA 106% 0% -12% -12%17% $1.22 7.3 x $5.53 42% -4% -26% -26%21% $3.22 8.2 x $23.38 55% 4% -13% -13%18% $2.36 6.4 x $20.97 41% 4% -9% -9%
15% -$6.07 8.2 x $76.97 161% 6% -14% -14%21% $0.37 4.3 x $14.02 84% -2% -28% -28%43% $0.49 4.0 x $38.26 94% -2% -47% -47%15% $1.75 5.9 x $15.83 21% 10% -25% -25%2% $0.60 10.3 x $6.81 15% 2% -28% -28%
10% $0.87 2.6 x $6.22 33% 2% -27% -27%7% $2.79 7.4 x $12.78 29% 9% -17% -17%
26% $0.23 4.3 x $15.88 95% 15% -19% -19%49% $4.89 4.0 x $27.69 28% 3% -28% -28%18% $1.60 6.8 x $24.64 58% 5% -11% -11%32% $0.12 6.1 x $7.24 93% 10% -21% -21%62% $1.80 2.7 x NA 27% -1% -40% -40%50% $1.18 6.6 x $5.92 45% 3% -14% -14%47% -$2.09 3.9 x $37.22 126% -2% -32% -32%8% -$0.42 9.2 x $6.65 145% 8% -19% -19%
21% $1.47 7.3 x $7.45 50% 5% -10% -10%20% $0.83 3.7 x $16.27 81% 3% -32% -32%26% $1.73 1.3 x NA 58% 1% -16% -16%23% $0.67 8.7 x $8.70 67% 2% -1% -1%-1% -$2.44 NA $20.26 NA 14% -53% -53%25% $0.52 5.7 x $19.38 69% 5% -24% -24%21% $0.75 5.9 x $14.92 58% 3% -23% -23%
StockPerformance
SegmentLarge CapSmall Cap
ATW * Atwood Oceanics Inc Offshore DrillingBRS * Bristow Group Inc Offshore Supply
3 CFW CN * Calfrac Well Services Ltd Services4 CGG CGG SA Seismic
CJES * C&J Energy Services Ltd ServicesCRR CARBO Ceramics Inc ServicesFTK * Flotek Industries Inc EquipmentGEOS * Geospace Technologies Corp EquipmentGIFI Gulf Island Fabrication Inc Offshore SupplyHCLP Hi-Crush Partners LP ServicesHLX Helix Energy Solutions Group Inc ServicesHOS Hornbeck Offshore Services Inc Offshore Supply
7 LAYN Layne Christensen Co ServicesNR * Newpark Resources Inc ServicesPKD Parker Drilling Co Land DrillingPOWL * Powell Industries Inc Services
3 PSD CN Pulse Seismic Inc Seismic3 SVY CN Savanna Energy Services Corp Services3 TCW CN Trican Well Service Ltd Services3 TDG CN Trinidad Drilling Ltd Land Drilling
TDW * Tidewater Inc Offshore SupplyTESO Tesco Corp ServicesTTI TETRA Technologies Inc Services
3 XDC CN Xtreme Drilling & Coil Services Corp Land DrillingAverageMedian
Micro CapAETI American Electric Technologies Inc ServicesBAS * Basic Energy Services Inc ServicesDWSN Dawson Geophysical Co SeismicEMES Emerge Energy Services LP ServicesENSV Enservco Corp ServicesFES Forbes Energy Services Ltd ServicesGLF Gulfmark Offshore Inc Offshore SupplyGRH GreenHunter Resources Inc ServicesICD Independence Contract Drilling Inc Land DrillingIO * ION Geophysical Corp ServicesKEG Key Energy Services Inc Services
3 LII CN Logan International Inc ServicesPES * Pioneer Energy Services Corp Land Drilling
3 PHX CN PHX Energy Services Corp ServicesSAEX SAExploration Holdings Inc SeismicSDPI Superior Drilling Products Inc Equipment
3 SDY CN Strad Energy Services Ltd ServicesSSE Seventy Seven Energy Inc EquipmentWG Willbros Group Inc Construction
AverageMedian
TTMEBITDA Unlevered EV/ Book Value Capital Margin% FCF/Shr EBITDA per Share Intensity Week Q1'16 YTD
StockPerformance
56% $4.90 2.5 x $46.07 58% 18% -35% -35%14% -$5.48 6.3 x $43.84 175% 10% -46% -46%3% -$1.03 23.3 x $5.43 390% 5% -46% -46%
99% $3.16 1.3 x NA 7% -4% -77% -77%8% -$1.12 43.9 x $5.25 523% 16% -54% -54%4% -$2.77 24.4 x $30.14 475% 19% 6% 6%6% -$0.02 21.7 x $5.49 106% 10% -40% -40%
-46% -$3.09 NA $20.80 NA -11% -35% -35%6% $1.03 4.1 x $18.74 29% 2% -13% -13%
27% $1.11 3.8 x $3.40 62% -3% -29% -29%23% -$2.26 3.5 x $15.77 239% 7% -46% -46%44% -$1.73 4.2 x $40.34 126% 12% -34% -34%0% -$1.25 NA $6.80 NA 14% -9% 10%3% -$0.56 16.5 x $6.19 311% -2% -33% -33%
23% $0.72 3.4 x $4.92 53% 8% -34% -34%6% $2.07 6.0 x $26.72 41% 0% 1% 1%
74% $0.24 7.8 x $0.82 22% 12% 11% 11%24% -$0.02 3.2 x $7.10 101% 12% 0% 0%4% $0.23 11.8 x $5.69 55% 3% 138% 138%
29% $0.07 5.1 x $6.47 93% 11% -21% -21%23% -$0.54 6.4 x $50.46 110% 9% -27% -27%11% $0.61 4.7 x $11.65 42% 11% -10% -10%21% $1.28 6.8 x $4.76 58% 5% -32% -32%27% $0.46 3.2 x $4.65 42% -3% -16% -16%20% -$0.17 9.7 x $16.15 142% 7% -20% -19%17% $0.02 5.6 x $6.80 77% 9% -30% -30%
-1% -$0.18 NA $2.57 NA -1% 15% 15%3% -$0.71 38.6 x $2.52 226% 6% -31% -31%2% -$0.09 12.9 x $9.96 159% 9% -7% -7%9% $1.32 4.8 x $3.50 57% 9% -18% -18%
21% -$0.12 3.4 x $0.49 146% 0% -26% -26%13% $0.51 6.0 x $3.95 71% 8% -7% -7%23% $1.15 7.4 x $28.33 62% 0% -34% -34%-7% -$0.21 NA N/A NA -5% -9% -9%25% -$2.59 6.8 x $9.71 388% 12% -23% -23%
-12% -$4.30 NA $10.46 NA 11% -56% -56%2% -$0.43 32.5 x $1.86 374% 11% -51% -51%5% $0.02 17.7 x $5.06 87% -1% -5% -5%
20% -$0.78 4.2 x $5.31 146% 0% -46% -46%13% $0.45 2.7 x $4.86 62% 23% -37% -37%14% $1.30 3.9 x N/A 44% 3% -17% -17%3% -$0.19 101.7 x $1.45 801% -2% 65% 65%
22% $0.39 2.8 x $3.74 56% -1% 9% 9%16% -$1.17 6.5 x $2.99 131% 59% -56% -56%-1% -$0.34 NA $1.58 NA 8% -47% -47%9% -$0.31 16.8 x $5.78 187% 8% -20% -20%9% -$0.18 6.5 x $3.74 131% 6% -23% -23%
35
Source: EnerCom, Company filings, Bloomberg L.P.Footnotes to the tables and glossary of terms can be found beginning on page 37.
EnerCom OilService WeeklyFebruary 19, 2016
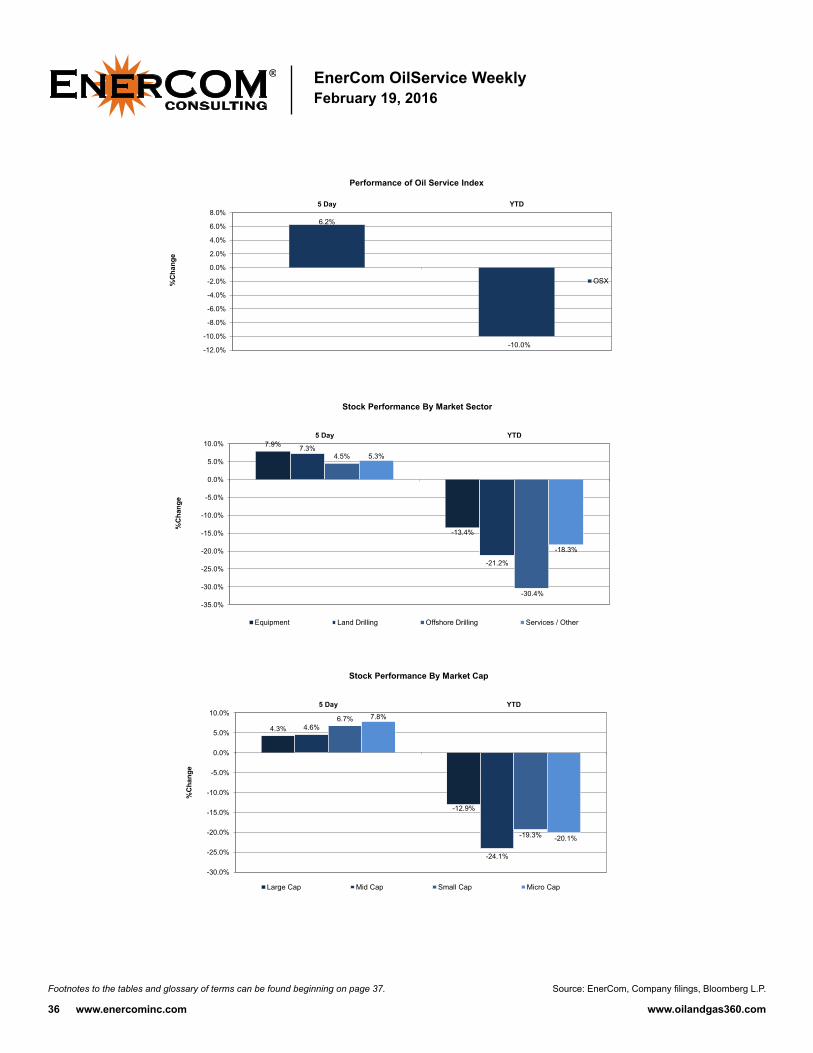
36
6.2%
-10.0%-12.0%
-10.0%
-8.0%
-6.0%
-4.0%
-2.0%
0.0%
2.0%
4.0%
6.0%
8.0%5 Day YTD
%C
hang
ePerformance of Oil Service Index
OSX
7.9%
-13.4%
7.3%
-21.2%
4.5%
-30.4%
5.3%
-18.3%
-35.0%
-30.0%
-25.0%
-20.0%
-15.0%
-10.0%
-5.0%
0.0%
5.0%
10.0%5 Day YTD
%C
hang
e
Stock Performance By Market Sector
Equipment Land Drilling Offshore Drilling Services / Other
4.3%
-12.9%
4.6%
-24.1%
6.7%
-19.3%
7.8%
-20.1%
-30.0%
-25.0%
-20.0%
-15.0%
-10.0%
-5.0%
0.0%
5.0%
10.0%5 Day YTD
%C
hang
e
Stock Performance By Market Cap
Large Cap Mid Cap Small Cap Micro Cap
Source: EnerCom, Company filings, Bloomberg L.P.Footnotes to the tables and glossary of terms can be found beginning on page 37.
EnerCom OilService WeeklyFebruary 19, 2016

Footnotes
General Values are in currency as reported by the company. Exchange Rates: 1 CAD = 0.74 USD; 1 AUD = 0.72 USD as of 2/19/2016. E&P Weekly (1) Change in Quarterly Production form 9/30/2014 to 9/30/2015, does not include adjustments for acquisitions or divestitures. (2) Bloomberg Best estimate. Companies with no reported Bloomberg Best estimate are marked "NA." (3) Current price / Bloomberg Best estimate. Companies with no reported Bloomberg Best estimate are marked "NA." (4) TTM oil and gas sales less LOE, production taxes, G&A and net interest, all divided by TTM production as of Q3 2015. (5) In Canadian Dollars. Production replacement and 3-year F&D costs based on gross reserves with forecast prices. (6) Reserves data as of 8/31/2015. TTM Data as of 11/30/15. (7) Reserves data as of 1/31/2015, quarterly data as of 10/31/2015. (8) Reserve data as of 6/30/2015. (9) Reserve data as of 9/30/2015.
37

38
OilService Weekly * Financial Data as of 12/31/2015 (1) Returns metrics are calculated using EBITDA. (2) Current price / Bloomberg Best estimate. Companies with no reported Bloomberg Best estimate are marked "NA". (3) In Canadian Dollars. (4) Trading data in USD, financial data in Euros including EV. (5) Financial statement data reported on semi-annual basis as of 6/30/2015. (6) Trading and financial data in Euros. (7) Balance Sheet, TTM data and returns as of 10/31/15.
Glossary of Terms General EBITDA: Calculated as operating income plus DD&A and impairment expense. Enterprise Value (EV): The sum of market capitalization, debt, preferred equity and minority interest, less cash. Short Interest Ratio: Number of days of average daily trading volume needed to cover the short interest in a given stock. TTM: Trailing twelve months as of 9/30/15 unless otherwise noted. E&P Weekly 3-Yr F&D: Costs incurred in oil and gas activities excluding abandonment costs, divided by the sum of extensions, discoveries, revisions and purchases of proved reserves over a three-year period. The measurement period in this report is 2012-2014. 3-Yr Production Replacement: Percentage of production replaced through extensions, discoveries, revisions and purchases of proved reserves over a three-year period. The measurement period in this report is 2012-2014. Asset Intensity: An indicator of an E&P company’s future growth potential. Calculated as trailing twelve month production multiplied by 3-Year F&D cost all divided by trailing twelve month cash flow from operations. Capital Efficiency: A metric that approximates cash flow generated for each investment dollar. Calculated as (trailing twelve month EBITDA / trailing twelve month production)/ 3-Year F&D cost per Mcfe. EV/2014 Reserves: Enterprise value divided by proved reserves. A valuation metric that assigns a market-based valuation per unit of SEC proved reserves. EV/TTM Production: Enterprise value divided by trailing twelve month production per day. A metric that assigns a market-based valuation per flowing unit of production.
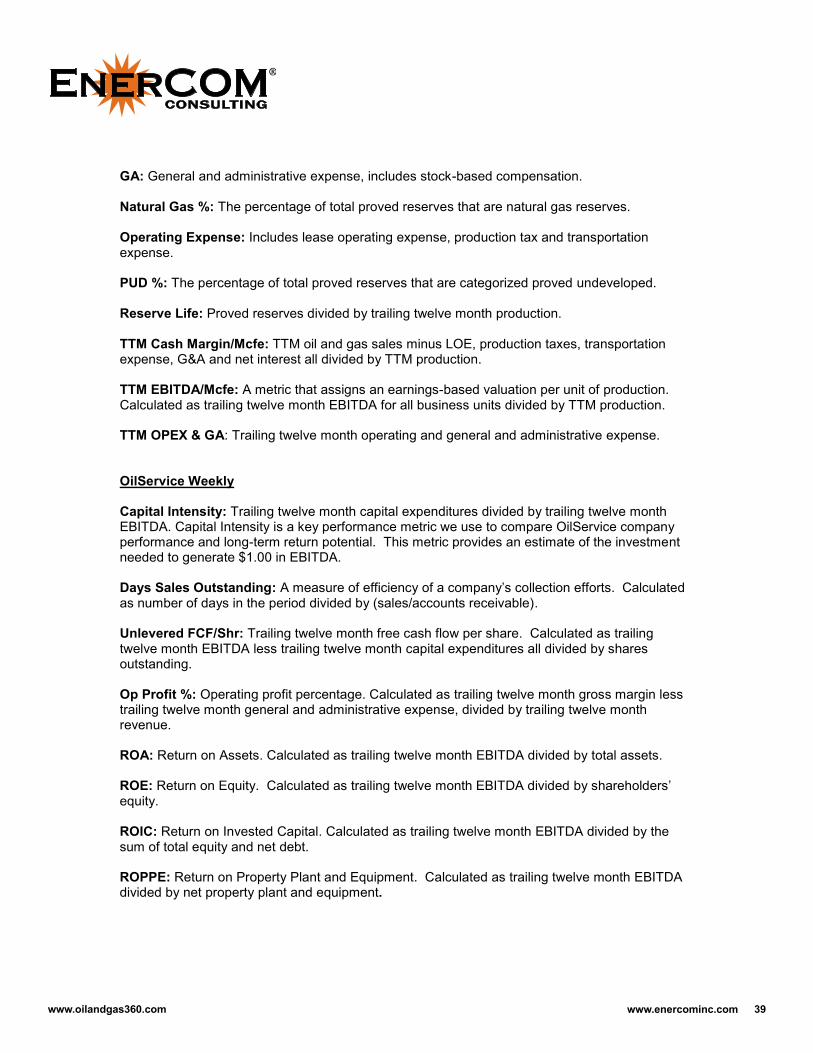
GA: General and administrative expense, includes stock-based compensation. Natural Gas %: The percentage of total proved reserves that are natural gas reserves. Operating Expense: Includes lease operating expense, production tax and transportation expense. PUD %: The percentage of total proved reserves that are categorized proved undeveloped. Reserve Life: Proved reserves divided by trailing twelve month production. TTM Cash Margin/Mcfe: TTM oil and gas sales minus LOE, production taxes, transportation expense, G&A and net interest all divided by TTM production. TTM EBITDA/Mcfe: A metric that assigns an earnings-based valuation per unit of production. Calculated as trailing twelve month EBITDA for all business units divided by TTM production. TTM OPEX & GA: Trailing twelve month operating and general and administrative expense. OilService Weekly Capital Intensity: Trailing twelve month capital expenditures divided by trailing twelve month EBITDA. Capital Intensity is a key performance metric we use to compare OilService company performance and long-term return potential. This metric provides an estimate of the investment needed to generate $1.00 in EBITDA. Days Sales Outstanding: A measure of efficiency of a company’s collection efforts. Calculated as number of days in the period divided by (sales/accounts receivable). Unlevered FCF/Shr: Trailing twelve month free cash flow per share. Calculated as trailing twelve month EBITDA less trailing twelve month capital expenditures all divided by shares outstanding. Op Profit %: Operating profit percentage. Calculated as trailing twelve month gross margin less trailing twelve month general and administrative expense, divided by trailing twelve month revenue. ROA: Return on Assets. Calculated as trailing twelve month EBITDA divided by total assets. ROE: Return on Equity. Calculated as trailing twelve month EBITDA divided by shareholders’ equity. ROIC: Return on Invested Capital. Calculated as trailing twelve month EBITDA divided by the sum of total equity and net debt. ROPPE: Return on Property Plant and Equipment. Calculated as trailing twelve month EBITDA divided by net property plant and equipment.
39

WWW.OILANDGAS360.COM
From the experts at EnerCom, Inc.
Contact Bevo Beaven at (303) 296-8834 for advertising, interviews, profiles or more information.
• E&P, Oil Service, Midstream and MLP’s• Exclusive C-Level Interviews and Webcasts• Feature Articles and Exclusive Content • Financial Metrics and Analytics • Industry Earnings Calendar • In-Depth Company Profiles• 125,000+ Monthly Page Views• Targeted Advertising
ROBUST MEDIA FOR A GLOBAL, OIL SAVVY AUDIENCE Our Audience has $3.2 Trillion in Managed Energy Assets
THE SINGLE SOURCE FOR OIL & GAS FINANCIAL NEWS AND ANALYSIS
EXCLUSIVE INTERVIEWS TRUSTED NEWS OUTLET CLOSING BELL REPORT
As an approved news source for Google and Bloomberg, O&G 360® content is used to populate Google searches and post company news. O&G 360® is an approved media distributor for PRNewswire, MarketWired, and Businesswire, the top energy news circuits.
O&G 360®’s “Closing Bell Report” Email is delivered after market close every weekday to 26,000+ oil & gas industry professionals, institutional investors, high net worth investors, corporate finance professionals, securities dealers and research analysts.
www.oilandgas360.com/subscribe
• EnerCom Conference Interviews• Straight Answers from U.S. Governors• CEO Interviews
Tell your company’s story directly to worldwide investors in our Q&A interview format as an audio or video presentation.

41
Sour
ce: E
nerC
om, C
ompa
ny fi
lings
, Blo
ombe
rg L
.P.,
as o
f Feb
ruar
y, 20
16
Blac
kbird
Ene
rgy
Inc
Dom
icile
: Van
couv
er, B
CTi
cker
: BBI
CN
Exch
ange
: Ven
ture
Sect
or: O
il &
Gas
Pro
duce
rsFl
oat:
357.
92 M
MM
kt C
ap: $
46.5
3 M
M
Fina
ncia
l Det
ails
2009
2010
2011
2012
2013
2014
Dec
15Ap
r 14
Jul 1
4O
ct 1
4Ja
n 15
Apr 1
5Ju
l 15
Oct
15
EPS
($)
-0.0
2-0
.01
-0.0
1-0
.08
-0.0
4-0
.02
-46%
EPS
($)
0.00
-0.0
1-0
.01
0.01
0.00
-0.0
1-0
.01
CF/S
HR ($
)-0
.01
-0.0
1-0
.01
-0.0
10.
00-0
.01
DIVI
DEND
N/A
CF/S
HR ($
)0.
000.
000.
000.
000.
000.
000.
00PR
ETAX
MAR
GIN
----
---3
081%
-477
%-1
117%
WAC
C25
%-4
07%
---2
699%
549%
-402
3%--
-374
33%
RETU
RN O
N EQ
UITY
---1
6%-1
1%-4
0%-2
5%-2
8%BE
TA2.
24RE
TURN
ON
EQUI
TY-2
4%-2
8%-1
5%-6
%-7
%-1
2%-7
%SA
LES
% C
HANG
E--
----
--45
4%-6
8%AL
PHA
1.47
SALE
S %
CHA
NGE
-9%
---6
7%-3
5%-8
1%--
-88%
SALE
S (M
IL$)
----
0.00
0.15
0.84
0.27
SALE
S (M
IL$)
0.14
--0.
080.
140.
03--
0.01
Trad
ing
and
Capi
tal S
truc
ture
Qua
rter
ly A
naly
st E
stim
ates
AVG
DAIL
Y VO
LUM
E--
--44
K51
K25
5K48
KM
OM
ENTU
M--
----
----
--YE
ARRA
TE O
F CH
ANGE
----
----
-50.
0059
.26
2013
RELA
TIVE
STR
ENGT
H--
----
----
--20
14W
ILLI
AMS'
%R
----
----
----
2015
MAC
D0.
000.
000.
010.
010.
000.
0120
16
YEAR
2013
2014
2015
2016
YEAR
2013
2014
2015
2016
Ow
ners
hip
Dec
14De
c 15
Chan
ge%
OF
SHAR
ES H
ELD
0%21
%44
367%
% O
F FL
OAT
HEL
D0%
25%
N/A
# O
F HO
LDER
S1
430
0%#
OF
BUYE
RS0
0N/
A#
OF
SELL
ERS
01
N/A
# O
F NE
W B
UYER
S0
1N/
A#
OF
SELL
OFF
S0
1N/
A
De
c 14
Dec
15Ch
ange
% O
F SH
ARES
HEL
D19
%13
%-3
6%%
CHA
NGE
IN H
OLD
INGS
(6 M
O)
3%2%
-39%
# O
F HO
LDER
S9
1233
%
1GM
T CA
PITA
L CO
RP2
VERT
EX O
NE A
SSET
MAN
AGEM
ENT
INC
3CA
MPB
ELL
SEAN
4BR
AUN
GART
H5
DENN
EY D
ARRE
LL6
MAC
DONA
LD W
ILLI
AM L
7SC
HMIT
Z RO
N A
8AL
LEN
RALP
H9
NOAK
ES D
ON
10AH
RENS
BUR
TON
JOEL
1,43
7,00
0
1,
335,
631
1,21
3,50
0
700,
000
37
4,45
0
4,14
5,02
6
-0.0
1N/
AN/
AN/
A
Top
10 H
olde
rs (S
hare
s Hel
d)39
,656
,300
36
,200
,000
26
,484
,138
8,26
5,98
1
Institution InsideEstimates
Q1
Q2
Q3
Q4
-0.0
1-0
.01
-0.0
1-0
.02
-0.0
1-0
.01
0.01
0.00
-0.0
1-0
.01
-0.0
10.
00
BLO
OM
BERG
BES
T ES
TIM
ATES
- EP
S
0.19
-0.2
1-0
.86
-0.5
10.
16-1
.93
-1.9
8-1
.15
-3.6
7N/
AN/
AN/
AN/
A
0.21
0.14
0.40
Estimates
Q1
Q2
Q3
Q4
0.01
N/A
N/A
N/A
BLO
OM
BERG
BES
T ES
TIM
ATES
- EB
ITDA
-0.0
1-0
.32
-0.2
9
0.08
0.14
0.03
N/A
Trading Data
BLO
OM
BERG
BES
T ES
TIM
ATES
- RE
VENU
E
Estimates
Q1
Q2
Q3
Q4
0.13
0.16
0.15
0.40
0.23
Blac
kbird
Ene
rgy
Inc
Blac
kbird
Ene
rgy,
Inc.
is a
n oi
l and
gas
exp
lora
tion
com
pany
. Th
e Co
mpa
ny is
focu
sed
on th
e liq
uids
-ric
h M
ontn
ey fa
irway
at E
lmw
orth
, nea
r Gra
nde
Prai
rie, A
lber
ta. B
lack
bird
hol
ds a
100
% w
orki
ng in
tere
st in
75
sect
ions
of h
ighl
y pr
ospe
ctiv
e M
ontn
ey ri
ghts
.
Annual
Corporate
NET
DEBT
TO
CAP
ITAL
Quarter
PRET
AX M
ARGI
N
0500
1000
1500
2000
2500
0
0.1
0.2
0.3
0.4
0.5
0.6
CLO
SE P
RICE
200D
MAV
G50
D M
AVG
SPX
Stock Price
SPX

42
Sour
ce: E
nerC
om, C
ompa
ny fi
lings
, Blo
ombe
rg L
.P.,
as o
f Feb
ruar
y, 20
16
Core
Lab
orat
orie
sDo
mic
ile: A
mst
erda
m, N
ethe
rland
sTi
cker
: CLB
Exch
ange
: New
Yor
kSe
ctor
: Oil
Equi
pmen
t, Se
rvic
es &
Dist
ribut
ion
Floa
t: 42
.38
MM
Mkt
Cap
: $44
34.2
7 M
M
Fina
ncia
l Det
ails
2010
2011
2012
2013
2014
2015
Dec 1
5Ju
n 14
Sep
14De
c 14
Mar
15
Jun
15Se
p 15
Dec 1
5EP
S ($
)3.
233.
994.
585.
315.
802.
6910
0%EP
S ($
)1.
431.
511.
510.
720.
810.
790.
36CF
/SHR
($)
4.59
4.41
5.02
6.52
6.84
5.13
DIVI
DEND
0.55
CF/S
HR ($
)1.
471.
692.
241.
841.
091.
021.
16PR
ETAX
MAR
GIN
26%
26%
29%
30%
31%
19%
WAC
C10
%30
%31
%31
%19
%22
%22
%11
%RE
TURN
ON
EQUI
TY51
%81
%11
9%13
9%20
5%--
BETA
1.06
RETU
RN O
N EQ
UITY
161%
186%
205%
249%
311%
----
SALE
S %
CHA
NGE
14%
14%
8%9%
1%-2
7%AL
PHA
-0.4
6SA
LES
% C
HANG
E2%
1%1%
-19%
-24%
-29%
-34%
SALE
S (M
IL$)
794.
6590
7.65
981.
0810
73.5
110
85.2
279
7.52
SALE
S (M
IL$)
267.
5627
6.14
278.
6221
3.64
203.
8919
7.27
182.
72
Trad
ing
and
Capi
tal S
truc
ture
Qua
rter
ly A
naly
st E
stim
ates
AVG
DAIL
Y VO
LUM
E69
7K73
6K55
6K34
1K34
4K29
4KM
OM
ENTU
M73
.36
100.
1410
1.39
182.
3310
7.44
88.8
2YE
ARRA
TE O
F CH
ANGE
119.
8882
.73
265.
2222
3.32
35.1
4-4
.57
2013
RELA
TIVE
STR
ENGT
H76
.11
79.6
077
.33
85.2
764
.30
61.6
220
14W
ILLI
AMS'
%R
-3.4
6-5
.48
-24.
34-4
.62
-46.
38-5
1.72
2015
MAC
D14
.65
19.6
422
.96
31.8
132
.75
32.1
820
16
YEAR
2013
2014
2015
2016
YEAR
2013
2014
2015
2016
Ow
ners
hip
Dec 1
4De
c 15
Chan
ge%
OF
SHAR
ES H
ELD
125%
128%
2%%
OF
FLO
AT H
ELD
127%
130%
2%#
OF
HOLD
ERS
538
603
12%
# O
F BU
YERS
187
214
14%
# O
F SE
LLER
S15
616
88%
# O
F NE
W B
UYER
S80
79-1
%#
OF
SELL
OFF
S68
65-4
%
De
c 14
Dec 1
5Ch
ange
% O
F SH
ARES
HEL
D2%
2%-2
%%
CHA
NGE
IN H
OLD
INGS
(6 M
O)
1%0%
-79%
# O
F HO
LDER
S14
13-7
%
1CL
EARB
RIDG
E IN
VEST
MEN
TS L
LC2
VANG
UARD
GRO
UP3
WCM
INVE
STM
ENT
MAN
AGEM
ENT
4EA
RNES
T PA
RTNE
RS LL
C5
WED
GEW
OOD
PAR
TNER
S6
CAPI
TAL G
ROUP
CO
MPA
NIES
INC
7JA
CKSO
N SQ
UARE
PAR
TNER
S LL
C8
KAYN
E AN
DERS
ON R
UDNI
CK IN
V M
GMT
9BL
ACKR
OCK
10BA
NK O
F AM
ERIC
A CO
RPO
RATI
ON
1,64
9,21
5
1,
540,
586
1,40
6,46
3
1,
293,
314
1,22
2,56
0
1,
934,
688
0.42
1 E
0.41
2 E
0.46
7 E
0.50
5 E
Top
10 H
olde
rs (S
hare
s Hel
d)5,
202,
369
3,38
4,50
2
3,
188,
453
2,49
5,30
4
Institution InsideEstimates
Q1
Q2
Q3
Q4
1.22
1.30
1.36
1.42
1.51
0.72
0.81
0.79
0.36
1.36
1.43
1.51
BLO
OM
BERG
BES
T ES
TIM
ATES
- EP
S
94.6
589
.46
90.4
595
.97
97.3
549
.28
54.8
253
.73
30.6
934
.886
E35
.357
E38
.943
E41
.2 E
267.
5627
6.14
278.
62
Estimates
Q1
Q2
Q3
Q4
163.
714
E16
0.71
4 E
164.
857
E16
9.28
6 E
BLO
OM
BERG
BES
T ES
TIM
ATES
- EB
ITDA
85.0
687
.83
91.3
5
213.
6420
3.89
197.
2718
2.72
Trading Data
BLO
OM
BERG
BES
T ES
TIM
ATES
- RE
VENU
E
Estimates
Q1
Q2
Q3
Q4
260.
9326
3.14
273.
1627
6.28
262.
90
Core
Labo
rato
ries
Core
Labo
rato
ries p
rovi
des r
eser
voir
desc
riptio
n, p
rodu
ctio
n en
hanc
emen
t, an
d re
serv
oir m
anag
emen
t ser
vice
s. Th
e Co
mpa
ny's
cust
omer
s inc
lude
maj
or, n
atio
nal,
and
inde
pend
ent o
il an
d ga
s pro
duce
rs. C
ore
also
man
ufac
ture
s and
sells
pe
trol
eum
rese
rvoi
r roc
k an
d flu
id a
naly
sis in
stru
men
tatio
n an
d ot
her i
nteg
rate
d sy
stem
s.
Annual
Corporate
NET
DEBT
TO
CAP
ITAL
Quarter
PRET
AX M
ARGI
N
0500
1000
1500
2000
2500
050100
150
200
250
CLO
SE P
RICE
200D
MAV
G50
D M
AVG
SPX
Stock Price
SPX
Evol
utio
n Pe
trol
eum
Cor
pDo
mic
ile: H
oust
on, T
XTi
cker
: EPM
Exch
ange
: NYS
E M
KT L
LCSe
ctor
: Oil
& G
as P
rodu
cers
Floa
t: 32
.88
MM
Mkt
Cap
: $13
8.43
MM
Fina
ncia
l Det
ails
2010
2011
2012
2013
2014
2015
Dec
15Ju
n 14
Sep
14De
c 14
Mar
15
Jun
15Se
p 15
Dec
15EP
S ($
)-0
.09
-0.0
10.
160.
210.
090.
13-4
1%EP
S ($
)0.
040.
030.
030.
020.
050.
090.
02CF
/SHR
($)
0.09
0.11
0.37
0.42
0.26
0.32
DIVI
DEND
0.05
CF/S
HR ($
)0.
080.
020.
120.
060.
110.
070.
07PR
ETAX
MAR
GIN
-71%
3%49
%50
%31
%30
%W
ACC
11%
55%
46%
28%
17%
35%
59%
18%
RETU
RN O
N EQ
UITY
-8%
-1%
11%
13%
8%11
%BE
TA1.
08RE
TURN
ON
EQUI
TY8%
8%10
%10
%11
%12
%12
%SA
LES
% C
HANG
E-1
8%50
%13
9%19
%-1
7%58
%AL
PHA
-0.9
9SA
LES
% C
HANG
E-2
0%-1
4%75
%63
%11
0%10
6%-1
4%SA
LES
(MIL
$)5.
027.
5317
.96
21.3
517
.67
27.8
4SA
LES
(MIL
$)4.
314.
007.
717.
069.
068.
256.
62
Trad
ing
and
Capi
tal S
truc
ture
Qua
rter
ly A
naly
st E
stim
ates
AVG
DAIL
Y VO
LUM
E35
K32
K38
K94
K75
K81
KM
OM
ENTU
M-2
994.
99-1
117.
90-3
91.6
68.
116.
202.
84YE
ARRA
TE O
F CH
ANGE
72.7
613
3.55
36.7
231
9.62
118.
56-7
.18
2013
RELA
TIVE
STR
ENGT
H1.
181.
231.
271.
351.
351.
3520
14W
ILLI
AMS'
%R
-99.
92-9
9.83
-99.
73-9
9.64
-99.
04-9
8.39
2015
MAC
D-9
92.6
2-9
53.3
2-9
11.5
6-8
68.2
5-8
24.4
2-7
81.0
320
16
YEAR
2013
2014
2015
2016
YEAR
2013
2014
2015
2016
Ow
ners
hip
Dec
14De
c 15
Chan
ge%
OF
SHAR
ES H
ELD
83%
84%
1%%
OF
FLO
AT H
ELD
121%
93%
-23%
# O
F HO
LDER
S12
512
1-3
%#
OF
BUYE
RS37
370%
# O
F SE
LLER
S42
35-1
7%#
OF
NEW
BUY
ERS
1312
-8%
# O
F SE
LLO
FFS
1213
8%
De
c 14
Dec
15Ch
ange
% O
F SH
ARES
HEL
D28
%11
%-6
2%%
CHA
NGE
IN H
OLD
INGS
(6 M
O)
2%7%
230%
# O
F HO
LDER
S12
8-3
3%
1JV
L AD
VISO
RS L
LC2
ADVI
SORY
RES
EARC
H IN
CORP
ORA
TED
3RI
VER
ROAD
ASS
ET M
ANAG
EMEN
T LL
C4
BLAC
KRO
CK5
HERL
IN R
OBE
RT S
6BE
LRID
GE E
NERG
Y AD
VISO
RS F
UND
7AR
ROW
POIN
T AS
SET
MAN
AGEM
ENT
LLC
8TH
OM
SON
HORS
TMAN
N &
BRY
ANT
INC
9FE
NIM
ORE
ASS
ET M
ANAG
EMEN
T IN
C10
NANT
AHAL
A CA
PITA
L MAN
AGEM
ENT
1,30
0,87
9
1,
204,
112
1,05
5,26
3
954,
155
92
7,78
4
1,69
1,38
1
0.09
0.02
0.03
8 E
0.02
E
Top
10 H
olde
rs (S
hare
s Hel
d)4,
089,
848
3,21
3,08
0
2,
503,
780
1,91
5,66
5
Institution InsideEstimates
Q1
Q2
Q3
Q4
0.04
0.06
0.08
0.03
0.04
0.03
0.03
0.02
0.05
0.05
-0.0
20.
02
BLO
OM
BERG
BES
T ES
TIM
ATES
- EP
S
2.73
2.28
0.18
1.68
2.66
2.23
3.09
2.40
4.54
3.94
1.03
3.37
7 E
2.28
7 E
4.39
4.34
4.31
Estimates
Q1
Q2
Q3
Q4
8.25
6.62
6.85
7 E
5.67
E
BLO
OM
BERG
BES
T ES
TIM
ATES
- EB
ITDA
2.24
3.39
3.69
4.00
7.71
7.06
9.06
Trading Data
BLO
OM
BERG
BES
T ES
TIM
ATES
- RE
VENU
E
Estimates
Q1
Q2
Q3
Q4
4.29
5.65
6.01
5.40
4.63
Evol
utio
n Pe
trol
eum
Cor
p
Evol
utio
n Pe
trol
eum
Cor
p is
a pe
trol
eum
com
pany
eng
aged
prim
arily
in th
e de
velo
pmen
t of p
rope
rtie
s for
the
prod
uctio
n of
crud
e oi
l and
nat
ural
gas
ons
hore
in th
e Un
ited
Stat
es a
nd in
reco
very
of b
ypas
sed
oil a
nd n
atur
al g
as th
roug
h ou
r pa
tent
ed a
rtifi
cial
lift
tech
nolo
gy.
Annual
Corporate
NET
DEBT
TO
CAP
ITAL
Quarter
PRET
AX M
ARGI
N
0500
1000
1500
2000
2500
0246810121416CL
OSE
PRI
CE20
0D M
AVG
50D
MAV
GSP
X
Stock Price
SPX

43
Sour
ce: E
nerC
om, C
ompa
ny fi
lings
, Blo
ombe
rg L
.P.,
as o
f Feb
ruar
y, 20
16
Evol
utio
n Pe
trol
eum
Cor
pDo
mic
ile: H
oust
on, T
XTi
cker
: EPM
Exch
ange
: NYS
E M
KT L
LCSe
ctor
: Oil
& G
as P
rodu
cers
Floa
t: 32
.88
MM
Mkt
Cap
: $13
8.43
MM
Fina
ncia
l Det
ails
2010
2011
2012
2013
2014
2015
Dec
15Ju
n 14
Sep
14De
c 14
Mar
15
Jun
15Se
p 15
Dec
15EP
S ($
)-0
.09
-0.0
10.
160.
210.
090.
13-4
1%EP
S ($
)0.
040.
030.
030.
020.
050.
090.
02CF
/SHR
($)
0.09
0.11
0.37
0.42
0.26
0.32
DIVI
DEND
0.05
CF/S
HR ($
)0.
080.
020.
120.
060.
110.
070.
07PR
ETAX
MAR
GIN
-71%
3%49
%50
%31
%30
%W
ACC
11%
55%
46%
28%
17%
35%
59%
18%
RETU
RN O
N EQ
UITY
-8%
-1%
11%
13%
8%11
%BE
TA1.
08RE
TURN
ON
EQUI
TY8%
8%10
%10
%11
%12
%12
%SA
LES
% C
HANG
E-1
8%50
%13
9%19
%-1
7%58
%AL
PHA
-0.9
9SA
LES
% C
HANG
E-2
0%-1
4%75
%63
%11
0%10
6%-1
4%SA
LES
(MIL
$)5.
027.
5317
.96
21.3
517
.67
27.8
4SA
LES
(MIL
$)4.
314.
007.
717.
069.
068.
256.
62
Trad
ing
and
Capi
tal S
truc
ture
Qua
rter
ly A
naly
st E
stim
ates
AVG
DAIL
Y VO
LUM
E35
K32
K38
K94
K75
K81
KM
OM
ENTU
M-2
994.
99-1
117.
90-3
91.6
68.
116.
202.
84YE
ARRA
TE O
F CH
ANGE
72.7
613
3.55
36.7
231
9.62
118.
56-7
.18
2013
RELA
TIVE
STR
ENGT
H1.
181.
231.
271.
351.
351.
3520
14W
ILLI
AMS'
%R
-99.
92-9
9.83
-99.
73-9
9.64
-99.
04-9
8.39
2015
MAC
D-9
92.6
2-9
53.3
2-9
11.5
6-8
68.2
5-8
24.4
2-7
81.0
320
16
YEAR
2013
2014
2015
2016
YEAR
2013
2014
2015
2016
Ow
ners
hip
Dec
14De
c 15
Chan
ge%
OF
SHAR
ES H
ELD
83%
84%
1%%
OF
FLO
AT H
ELD
121%
93%
-23%
# O
F HO
LDER
S12
512
1-3
%#
OF
BUYE
RS37
370%
# O
F SE
LLER
S42
35-1
7%#
OF
NEW
BUY
ERS
1312
-8%
# O
F SE
LLO
FFS
1213
8%
De
c 14
Dec
15Ch
ange
% O
F SH
ARES
HEL
D28
%11
%-6
2%%
CHA
NGE
IN H
OLD
INGS
(6 M
O)
2%7%
230%
# O
F HO
LDER
S12
8-3
3%
1JV
L AD
VISO
RS L
LC2
ADVI
SORY
RES
EARC
H IN
CORP
ORA
TED
3RI
VER
ROAD
ASS
ET M
ANAG
EMEN
T LL
C4
BLAC
KRO
CK5
HERL
IN R
OBE
RT S
6BE
LRID
GE E
NERG
Y AD
VISO
RS F
UND
7AR
ROW
POIN
T AS
SET
MAN
AGEM
ENT
LLC
8TH
OM
SON
HORS
TMAN
N &
BRY
ANT
INC
9FE
NIM
ORE
ASS
ET M
ANAG
EMEN
T IN
C10
NANT
AHAL
A CA
PITA
L MAN
AGEM
ENT
1,30
0,87
9
1,
204,
112
1,05
5,26
3
954,
155
92
7,78
4
1,69
1,38
1
0.09
0.02
0.03
8 E
0.02
E
Top
10 H
olde
rs (S
hare
s Hel
d)4,
089,
848
3,21
3,08
0
2,
503,
780
1,91
5,66
5
Institution InsideEstimates
Q1
Q2
Q3
Q4
0.04
0.06
0.08
0.03
0.04
0.03
0.03
0.02
0.05
0.05
-0.0
20.
02
BLO
OM
BERG
BES
T ES
TIM
ATES
- EP
S
2.73
2.28
0.18
1.68
2.66
2.23
3.09
2.40
4.54
3.94
1.03
3.37
7 E
2.28
7 E
4.39
4.34
4.31
Estimates
Q1
Q2
Q3
Q4
8.25
6.62
6.85
7 E
5.67
E
BLO
OM
BERG
BES
T ES
TIM
ATES
- EB
ITDA
2.24
3.39
3.69
4.00
7.71
7.06
9.06
Trading Data
BLO
OM
BERG
BES
T ES
TIM
ATES
- RE
VENU
E
Estimates
Q1
Q2
Q3
Q4
4.29
5.65
6.01
5.40
4.63
Evol
utio
n Pe
trol
eum
Cor
p
Evol
utio
n Pe
trol
eum
Cor
p is
a pe
trol
eum
com
pany
eng
aged
prim
arily
in th
e de
velo
pmen
t of p
rope
rtie
s for
the
prod
uctio
n of
crud
e oi
l and
nat
ural
gas
ons
hore
in th
e Un
ited
Stat
es a
nd in
reco
very
of b
ypas
sed
oil a
nd n
atur
al g
as th
roug
h ou
r pa
tent
ed a
rtifi
cial
lift
tech
nolo
gy.
Annual
Corporate
NET
DEBT
TO
CAP
ITAL
Quarter
PRET
AX M
ARGI
N
0500
1000
1500
2000
2500
0246810121416CL
OSE
PRI
CE20
0D M
AVG
50D
MAV
GSP
X
Stock Price
SPX
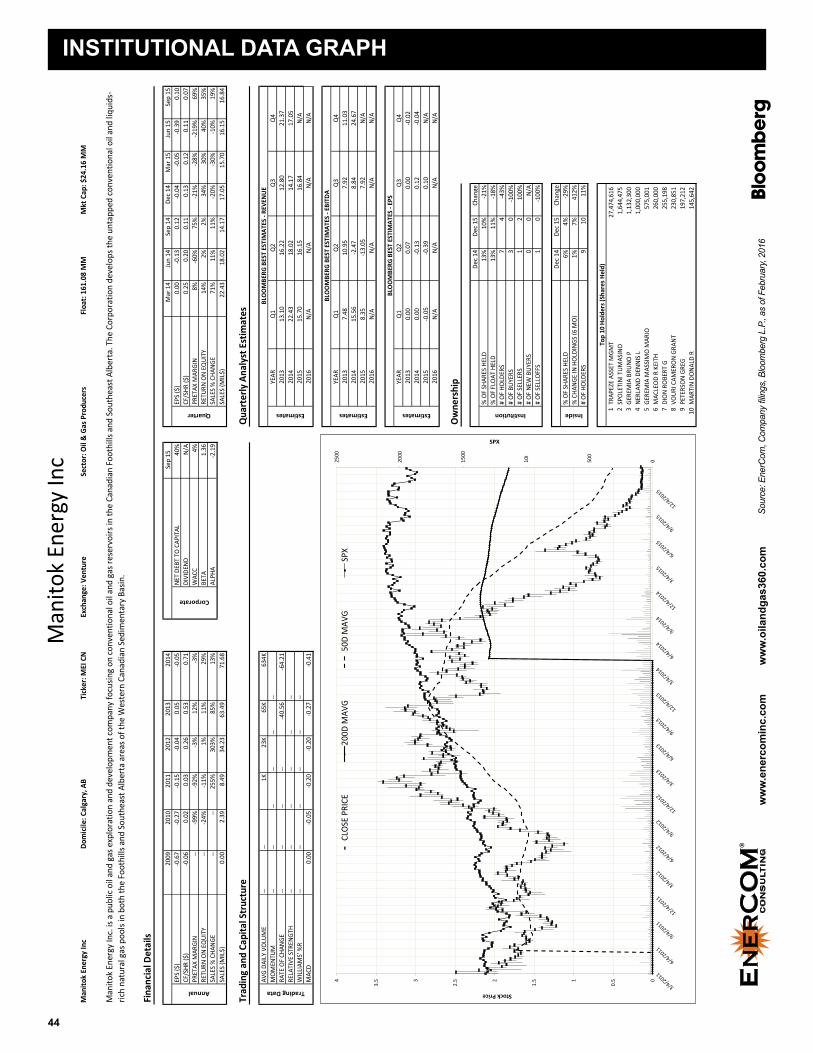
44
Sour
ce: E
nerC
om, C
ompa
ny fi
lings
, Blo
ombe
rg L
.P.,
as o
f Feb
ruar
y, 20
16
Man
itok
Ener
gy In
cDo
mic
ile: C
alga
ry, A
BTi
cker
: MEI
CN
Exch
ange
: Ven
ture
Sect
or: O
il &
Gas
Pro
duce
rsFl
oat:
161.
08 M
MM
kt C
ap: $
24.1
6 M
M
Fina
ncia
l Det
ails
2009
2010
2011
2012
2013
2014
Sep
15M
ar 1
4Ju
n 14
Sep
14De
c 14
Mar
15
Jun
15Se
p 15
EPS
($)
-0.6
7-0
.27
-0.1
5-0
.04
0.05
-0.0
540
%EP
S ($
)0.
00-0
.13
0.12
-0.0
4-0
.05
-0.3
90.
10CF
/SHR
($)
-0.0
60.
020.
030.
260.
530.
71DI
VIDE
NDN/
ACF
/SHR
($)
0.25
0.20
0.11
0.13
0.12
0.11
0.07
PRET
AX M
ARGI
N--
-99%
-92%
-3%
12%
-3%
WAC
C4%
8%-6
0%75
%-2
1%-2
8%-2
19%
69%
RETU
RN O
N EQ
UITY
---2
4%-1
1%1%
11%
29%
BETA
1.36
RETU
RN O
N EQ
UITY
14%
2%2%
34%
30%
40%
35%
SALE
S %
CHA
NGE
----
255%
303%
85%
13%
ALPH
A-2
.19
SALE
S %
CHA
NGE
71%
11%
11%
-20%
-30%
-10%
19%
SALE
S (M
IL$)
0.00
2.39
8.49
34.2
363
.49
71.6
8SA
LES
(MIL
$)22
.43
18.0
214
.17
17.0
515
.70
16.1
516
.84
Trad
ing
and
Capi
tal S
truc
ture
Qua
rter
ly A
naly
st E
stim
ates
AVG
DAIL
Y VO
LUM
E--
--1K
23K
65K
634K
MO
MEN
TUM
----
----
----
YEAR
RATE
OF
CHAN
GE--
----
---4
0.56
-64.
2120
13RE
LATI
VE S
TREN
GTH
----
----
----
2014
WIL
LIAM
S' %
R--
----
----
--20
15M
ACD
0.00
-0.0
5-0
.20
-0.2
0-0
.27
-0.4
120
16
YEAR
2013
2014
2015
2016
YEAR
2013
2014
2015
2016
Ow
ners
hip
Dec 1
4De
c 15
Chan
ge%
OF
SHAR
ES H
ELD
13%
10%
-21%
% O
F FL
OAT
HEL
D13
%11
%-1
8%#
OF
HOLD
ERS
74
-43%
# O
F BU
YERS
30
-100
%#
OF
SELL
ERS
12
100%
# O
F NE
W B
UYER
S0
0N/
A#
OF
SELL
OFF
S1
0-1
00%
De
c 14
Dec 1
5Ch
ange
% O
F SH
ARES
HEL
D6%
4%-2
9%%
CHA
NGE
IN H
OLD
INGS
(6 M
O)
1%7%
412%
# O
F HO
LDER
S9
1011
%
1TR
APEZ
E AS
SET
MGM
T2
SPO
LETI
NI T
UMAS
INO
3GE
REM
IA B
RUNO
P4
NERL
AND
DENN
IS L
5GE
REM
IA M
ASSI
MO
MAR
IO6
MAC
LEO
D R
KEIT
H7
DIO
N RO
BERT
G8
VOUR
I CAM
ERO
N GR
ANT
9PE
TERS
ON G
REG
10M
ARTI
N DO
NALD
R
260,
000
25
5,19
8
230,
851
19
7,21
2
145,
642
Top
10 H
olde
rs (S
hare
s Hel
d)27
,474
,616
1,64
4,47
5
1,
132,
300
1,00
0,00
0
575,
001
N/A
N/A
N/A
N/A
Institution Inside
0.00
-0.1
30.
12-0
.04
-0.0
5-0
.39
0.10
N/A
BLO
OM
BERG
BES
T ES
TIM
ATES
- EP
S
Estimates
Q1
Q2
Q3
Q4
0.00
0.07
0.00
-0.0
2
8.35
-13.
057.
92N/
AN/
AN/
AN/
AN/
A
7.48
10.9
57.
9211
.03
15.5
6-2
.47
8.84
24.6
7
N/A
N/A
N/A
N/A
BLO
OM
BERG
BES
T ES
TIM
ATES
- EB
ITDA
Estimates
Q1
Q2
Q3
Q4
21.3
722
.43
18.0
214
.17
17.0
515
.70
16.1
516
.84
N/A
Trading Data
BLO
OM
BERG
BES
T ES
TIM
ATES
- RE
VENU
E
Estimates
Q1
Q2
Q3
Q4
13.1
016
.22
12.8
0
Man
itok
Ener
gy In
c
Man
itok
Ener
gy In
c. is
a p
ublic
oil
and
gas e
xplo
ratio
n an
d de
velo
pmen
t com
pany
focu
sing
on co
nven
tiona
l oil
and
gas r
eser
voirs
in th
e Ca
nadi
an F
ooth
ills a
nd S
outh
east
Alb
erta
. The
Cor
pora
tion
deve
lops
the
unta
pped
conv
entio
nal o
il an
d liq
uids
-ric
h na
tura
l gas
poo
ls in
bot
h th
e Fo
othi
lls a
nd S
outh
east
Alb
erta
are
as o
f the
Wes
tern
Can
adia
n Se
dim
enta
ry B
asin
.
Annual
Corporate
NET
DEBT
TO
CAP
ITAL
Quarter
PRET
AX M
ARGI
N
0500
1000
1500
2000
2500
0
0.51
1.52
2.53
3.54
CLO
SE P
RICE
200D
MAV
G50
D M
AVG
SPX
Stock Price
SPX
Panh
andl
e O
il an
d Ga
s Inc
Dom
icile
: Okl
ahom
a Ci
ty, O
KTi
cker
: PHX
Exch
ange
: New
Yor
kSe
ctor
: Oil
& G
as P
rodu
cers
Floa
t: 16
.58
MM
Mkt
Cap
: $25
4.31
MM
Fina
ncia
l Det
ails
2010
2011
2012
2013
2014
2015
Dec 1
5Ju
n 14
Sep
14De
c 14
Mar
15
Jun
15Se
p 15
Dec 1
5EP
S ($
)0.
680.
510.
440.
841.
490.
5634
%EP
S ($
)0.
310.
550.
610.
04-0
.04
-0.0
5-0
.17
CF/S
HR ($
)1.
671.
741.
522.
243.
152.
76DI
VIDE
ND0.
04CF
/SHR
($)
0.89
0.98
0.92
0.76
0.59
0.50
0.46
PRET
AX M
ARGI
N34
%25
%22
%34
%44
%25
%W
ACC
12%
39%
57%
76%
5%-4
%-8
%-4
5%RE
TURN
ON
EQUI
TY12
%14
%10
%15
%73
%3%
BETA
1.46
RETU
RN O
N EQ
UITY
24%
24%
22%
15%
10%
3%-1
%SA
LES
% C
HANG
E18
%-3
%5%
27%
35%
-32%
ALPH
A-0
.04
SALE
S %
CHA
NGE
27%
28%
5%-4
0%-3
3%-5
3%-4
1%SA
LES
(MIL
$)47
.40
45.9
648
.43
61.5
683
.27
56.5
4SA
LES
(MIL
$)19
.67
23.8
019
.55
12.6
913
.11
11.2
011
.48
Trad
ing
and
Capi
tal S
truc
ture
Qua
rter
ly A
naly
st E
stim
ates
AVG
DAIL
Y VO
LUM
E21
K68
K35
K24
K21
K13
KM
OM
ENTU
M10
.22
11.0
612
.96
11.0
824
.52
4.91
YEAR
RATE
OF
CHAN
GE37
.17
14.8
67.
1332
.40
141.
8013
.92
2013
RELA
TIVE
STR
ENGT
H73
.90
76.3
977
.81
72.8
985
.70
59.3
820
14W
ILLI
AMS'
%R
-39.
56-3
0.04
-24.
09-3
0.50
-13.
92-5
5.40
2015
MAC
D3.
013.
273.
533.
604.
864.
7020
16
YEAR
2013
2014
2015
2016
YEAR
2013
2014
2015
2016
Ow
ners
hip
Dec 1
4De
c 15
Chan
ge%
OF
SHAR
ES H
ELD
43%
50%
18%
% O
F FL
OAT
HEL
D42
%50
%19
%#
OF
HOLD
ERS
123
123
0%#
OF
BUYE
RS37
5241
%#
OF
SELL
ERS
4521
-53%
# O
F NE
W B
UYER
S19
13-3
2%#
OF
SELL
OFF
S17
170%
De
c 14
Dec 1
5Ch
ange
% O
F SH
ARES
HEL
D6%
5%-1
5%%
CHA
NGE
IN H
OLD
INGS
(6 M
O)
-2%
10%
-513
%#
OF
HOLD
ERS
1110
-9%
1TR
IGRA
N IN
VEST
MEN
TS IN
C2
BLAC
KRO
CK3
T RO
WE
PRIC
E AS
SOCI
ATES
4RO
BOTT
I RO
BERT
5DI
MEN
SION
AL F
UND
ADVI
SORS
LP
6VA
NGUA
RD G
ROUP
INC
7DI
SCIP
LINE
D GR
OW
TH IN
VEST
ORS
LLC
8CO
FFM
AN M
ICHA
EL C
9CA
LIFO
RNIA
PUB
LIC
EMP
- CAL
PERS
10ST
ATE
STRE
ET C
ORP
494,
278
33
8,28
7
305,
172
25
1,30
0
231,
406
54
7,06
3
-0.1
7N/
AN/
AN/
A
Top
10 H
olde
rs (S
hare
s Hel
d)1,
447,
392
1,02
3,51
2
930,
760
80
3,25
1
Institution InsideEstimates
Q1
Q2
Q3
Q4
0.13
0.06
0.31
0.34
0.55
0.61
0.04
-0.0
4-0
.05
0.30
0.34
0.31
BLO
OM
BERG
BES
T ES
TIM
ATES
- EP
S
13.7
612
.74
14.7
614
.24
16.2
59.
974.
866.
973.
392.
17N/
AN/
AN/
A
21.1
319
.67
23.8
0
Estimates
Q1
Q2
Q3
Q4
11.4
8N/
AN/
AN/
A
BLO
OM
BERG
BES
T ES
TIM
ATES
- EB
ITDA
7.37
9.89
10.2
8
19.5
512
.69
13.1
111
.20
Trading Data
BLO
OM
BERG
BES
T ES
TIM
ATES
- RE
VENU
E
Estimates
Q1
Q2
Q3
Q4
13.0
914
.45
15.4
918
.52
18.6
7
Panh
andl
e O
il an
d Ga
s Inc
Panh
andl
e O
il &
Gas
, Inc
. exp
lore
s for
and
dev
elop
s oil
and
gas p
rope
rtie
s, an
d pr
oduc
es a
nd se
lls o
il an
d na
tura
l gas
. Th
e Co
mpa
ny's
oil a
nd g
as h
oldi
ngs a
re lo
cate
d pr
imar
ily in
the
sout
h-ce
ntra
l and
wes
tern
Uni
ted
Stat
es.
Annual
Corporate
NET
DEBT
TO
CAP
ITAL
Quarter
PRET
AX M
ARGI
N
0500
1000
1500
2000
2500
0510152025303540CL
OSE
PRI
CE20
0D M
AVG
50D
MAV
GSP
X
Stock Price
SPX

45
Sour
ce: E
nerC
om, C
ompa
ny fi
lings
, Blo
ombe
rg L
.P.,
as o
f Feb
ruar
y, 20
16
Panh
andl
e O
il an
d Ga
s Inc
Dom
icile
: Okl
ahom
a Ci
ty, O
KTi
cker
: PHX
Exch
ange
: New
Yor
kSe
ctor
: Oil
& G
as P
rodu
cers
Floa
t: 16
.58
MM
Mkt
Cap
: $25
4.31
MM
Fina
ncia
l Det
ails
2010
2011
2012
2013
2014
2015
Dec 1
5Ju
n 14
Sep
14De
c 14
Mar
15
Jun
15Se
p 15
Dec 1
5EP
S ($
)0.
680.
510.
440.
841.
490.
5634
%EP
S ($
)0.
310.
550.
610.
04-0
.04
-0.0
5-0
.17
CF/S
HR ($
)1.
671.
741.
522.
243.
152.
76DI
VIDE
ND0.
04CF
/SHR
($)
0.89
0.98
0.92
0.76
0.59
0.50
0.46
PRET
AX M
ARGI
N34
%25
%22
%34
%44
%25
%W
ACC
12%
39%
57%
76%
5%-4
%-8
%-4
5%RE
TURN
ON
EQUI
TY12
%14
%10
%15
%73
%3%
BETA
1.46
RETU
RN O
N EQ
UITY
24%
24%
22%
15%
10%
3%-1
%SA
LES
% C
HANG
E18
%-3
%5%
27%
35%
-32%
ALPH
A-0
.04
SALE
S %
CHA
NGE
27%
28%
5%-4
0%-3
3%-5
3%-4
1%SA
LES
(MIL
$)47
.40
45.9
648
.43
61.5
683
.27
56.5
4SA
LES
(MIL
$)19
.67
23.8
019
.55
12.6
913
.11
11.2
011
.48
Trad
ing
and
Capi
tal S
truc
ture
Qua
rter
ly A
naly
st E
stim
ates
AVG
DAIL
Y VO
LUM
E21
K68
K35
K24
K21
K13
KM
OM
ENTU
M10
.22
11.0
612
.96
11.0
824
.52
4.91
YEAR
RATE
OF
CHAN
GE37
.17
14.8
67.
1332
.40
141.
8013
.92
2013
RELA
TIVE
STR
ENGT
H73
.90
76.3
977
.81
72.8
985
.70
59.3
820
14W
ILLI
AMS'
%R
-39.
56-3
0.04
-24.
09-3
0.50
-13.
92-5
5.40
2015
MAC
D3.
013.
273.
533.
604.
864.
7020
16
YEAR
2013
2014
2015
2016
YEAR
2013
2014
2015
2016
Ow
ners
hip
Dec 1
4De
c 15
Chan
ge%
OF
SHAR
ES H
ELD
43%
50%
18%
% O
F FL
OAT
HEL
D42
%50
%19
%#
OF
HOLD
ERS
123
123
0%#
OF
BUYE
RS37
5241
%#
OF
SELL
ERS
4521
-53%
# O
F NE
W B
UYER
S19
13-3
2%#
OF
SELL
OFF
S17
170%
De
c 14
Dec 1
5Ch
ange
% O
F SH
ARES
HEL
D6%
5%-1
5%%
CHA
NGE
IN H
OLD
INGS
(6 M
O)
-2%
10%
-513
%#
OF
HOLD
ERS
1110
-9%
1TR
IGRA
N IN
VEST
MEN
TS IN
C2
BLAC
KRO
CK3
T RO
WE
PRIC
E AS
SOCI
ATES
4RO
BOTT
I RO
BERT
5DI
MEN
SION
AL F
UND
ADVI
SORS
LP
6VA
NGUA
RD G
ROUP
INC
7DI
SCIP
LINE
D GR
OW
TH IN
VEST
ORS
LLC
8CO
FFM
AN M
ICHA
EL C
9CA
LIFO
RNIA
PUB
LIC
EMP
- CAL
PERS
10ST
ATE
STRE
ET C
ORP
494,
278
33
8,28
7
305,
172
25
1,30
0
231,
406
54
7,06
3
-0.1
7N/
AN/
AN/
A
Top
10 H
olde
rs (S
hare
s Hel
d)1,
447,
392
1,02
3,51
2
930,
760
80
3,25
1
Institution InsideEstimates
Q1
Q2
Q3
Q4
0.13
0.06
0.31
0.34
0.55
0.61
0.04
-0.0
4-0
.05
0.30
0.34
0.31
BLO
OM
BERG
BES
T ES
TIM
ATES
- EP
S
13.7
612
.74
14.7
614
.24
16.2
59.
974.
866.
973.
392.
17N/
AN/
AN/
A
21.1
319
.67
23.8
0
Estimates
Q1
Q2
Q3
Q4
11.4
8N/
AN/
AN/
A
BLO
OM
BERG
BES
T ES
TIM
ATES
- EB
ITDA
7.37
9.89
10.2
8
19.5
512
.69
13.1
111
.20
Trading Data
BLO
OM
BERG
BES
T ES
TIM
ATES
- RE
VENU
E
Estimates
Q1
Q2
Q3
Q4
13.0
914
.45
15.4
918
.52
18.6
7
Panh
andl
e O
il an
d Ga
s Inc
Panh
andl
e O
il &
Gas
, Inc
. exp
lore
s for
and
dev
elop
s oil
and
gas p
rope
rtie
s, an
d pr
oduc
es a
nd se
lls o
il an
d na
tura
l gas
. Th
e Co
mpa
ny's
oil a
nd g
as h
oldi
ngs a
re lo
cate
d pr
imar
ily in
the
sout
h-ce
ntra
l and
wes
tern
Uni
ted
Stat
es.
Annual
Corporate
NET
DEBT
TO
CAP
ITAL
Quarter
PRET
AX M
ARGI
N
0500
1000
1500
2000
2500
0510152025303540CL
OSE
PRI
CE20
0D M
AVG
50D
MAV
GSP
X
Stock Price
SPX

46
Sour
ce: E
nerC
om, C
ompa
ny fi
lings
, Blo
ombe
rg L
.P.,
as o
f Feb
ruar
y, 20
16
Petr
oQue
st E
nerg
y In
cDo
mic
ile: L
afay
ette
, LA
Tick
er: P
QEx
chan
ge: N
ew Y
ork
Sect
or: O
il &
Gas
Pro
duce
rsFl
oat:
70.2
4 M
MM
kt C
ap: $
31.6
8 M
M
Fina
ncia
l Det
ails
2009
2010
2011
2012
2013
2014
Dec 1
5M
ar 1
4Ju
n 14
Sep
14De
c 14
Mar
15
Jun
15Se
p 15
EPS
($)
-1.7
20.
670.
08-2
.20
0.14
0.39
72%
EPS
($)
0.15
0.15
0.07
0.03
-1.8
9-0
.94
-0.8
0CF
/SHR
($)
2.20
2.14
1.92
1.42
0.95
2.78
DIVI
DEND
N/A
CF/S
HR ($
)0.
710.
900.
360.
810.
36-0
.27
0.28
PRET
AX M
ARGI
N-4
8%27
%5%
-92%
8%13
%W
ACC
6%19
%18
%10
%1%
-364
%-1
78%
-188
%RE
TURN
ON
EQUI
TY3%
22%
12%
0%12
%22
%BE
TA1.
71RE
TURN
ON
EQUI
TY19
%22
%23
%22
%-5
6%--
--SA
LES
% C
HANG
E-3
0%-1
8%-1
0%-1
2%29
%23
%AL
PHA
-1.6
9SA
LES
% C
HANG
E67
%59
%2%
-10%
-44%
-46%
-52%
SALE
S (M
IL$)
218.
8717
9.26
160.
7014
1.59
182.
8022
5.02
SALE
S (M
IL$)
59.9
760
.58
56.4
947
.99
33.4
532
.55
26.8
7
Trad
ing
and
Capi
tal S
truc
ture
Qua
rter
ly A
naly
st E
stim
ates
AVG
DAIL
Y VO
LUM
E71
2K71
1K1,
202K
609K
956K
336K
MO
MEN
TUM
4.16
2.59
-2.3
9-1
.90
-0.0
6-2
.11
YEAR
RATE
OF
CHAN
GE-2
5.97
-40.
89-5
3.85
-26.
78-2
9.53
-50.
3320
13RE
LATI
VE S
TREN
GTH
53.8
256
.38
54.2
350
.54
49.1
747
.88
2014
WIL
LIAM
S' %
R-8
0.02
-75.
16-7
8.39
-84.
12-8
7.01
-89.
0420
15M
ACD
1.66
1.60
1.46
1.21
0.94
0.68
2016
YEAR
2013
2014
2015
2016
YEAR
2013
2014
2015
2016
Ow
ners
hip
Dec 1
4De
c 15
Chan
ge%
OF
SHAR
ES H
ELD
67%
59%
-12%
% O
F FL
OAT
HEL
D77
%66
%-1
4%#
OF
HOLD
ERS
195
106
-46%
# O
F BU
YERS
6719
-72%
# O
F SE
LLER
S67
37-4
5%#
OF
NEW
BUY
ERS
2212
-45%
# O
F SE
LLO
FFS
2863
125%
De
c 14
Dec 1
5Ch
ange
% O
F SH
ARES
HEL
D13
%11
%-1
4%%
CHA
NGE
IN H
OLD
INGS
(6 M
O)
-4%
2%-1
42%
# O
F HO
LDER
S15
11-2
7%
1SE
GALL
BRY
ANT
& H
AMIL
L2
GOOD
SON
CHAR
LES
T3
KENN
EDY
CAPI
TAL M
ANAG
EMEN
T4
CENT
RAL S
QUA
RE M
ANAG
EMEN
T LL
C5
COLU
MBI
A M
ANAG
EMEN
T IN
VEST
MEN
T6
VANG
UARD
GRO
UP7
OPP
ENHE
IMER
& C
O IN
C8
BLAC
KRO
CK9
DIM
ENSI
ONAL
FUN
D AD
VISO
RS L
P10
RUCK
S IV
WIL
LIAM
W
2,08
7,16
1
2,
082,
111
1,78
6,75
1
1,
589,
926
1,36
8,67
9
2,
490,
903
-0.1
76 E
-0.1
65 E
-0.1
64 E
-0.1
41 E
Top
10 H
olde
rs (S
hare
s Hel
d)4,
616,
416
3,27
8,46
3
3,
095,
345
3,01
5,71
6
Institution InsideEstimates
Q1
Q2
Q3
Q4
0.04
0.06
0.01
0.04
0.03
-1.8
9-0
.94
-0.8
0-0
.146
E0.
150.
150.
07
BLO
OM
BERG
BES
T ES
TIM
ATES
- EP
S
33.5
839
.20
39.7
534
.72
31.0
1-9
3.52
-30.
90-2
8.49
10.2
03 E
6.48
1 E
7.25
5 E
8.61
3 E
10.6
8 E
60.5
856
.49
47.9
9
Estimates
Q1
Q2
Q3
Q4
19.3
8 E
19.5
8 E
21.2
6 E
23.3
8 E
BLO
OM
BERG
BES
T ES
TIM
ATES
- EB
ITDA
20.1
821
.08
32.0
0
33.4
532
.55
26.8
723
.783
E
Trading Data
BLO
OM
BERG
BES
T ES
TIM
ATES
- RE
VENU
E
Estimates
Q1
Q2
Q3
Q4
35.9
838
.08
55.5
853
.17
59.9
7
Petr
oQue
st E
nerg
y In
c
Petr
oQue
st E
nerg
y, In
c. is
an
inde
pend
ent e
nerg
y co
mpa
ny e
ngag
ed in
the
expl
orat
ion,
dev
elop
men
t, ac
quisi
tion
and
prod
uctio
n of
oil
and
natu
ral g
as re
serv
es in
Tex
as, O
klah
oma,
Loui
siana
and
the
shal
low
wat
ers o
f the
Gul
f of M
exic
o.
Annual
Corporate
NET
DEBT
TO
CAP
ITAL
Quarter
PRET
AX M
ARGI
N
0500
1000
1500
2000
2500
024681012CL
OSE
PRI
CE20
0D M
AVG
50D
MAV
GSP
X
Stock Price
SPX
Reso
lute
Ene
rgy
Corp
Dom
icile
: Den
ver,
COTi
cker
: REN
Exch
ange
: New
Yor
kSe
ctor
: Oil
& G
as P
rodu
cers
Floa
t: 77
.50
MM
Mkt
Cap
: $38
.28
MM
Fina
ncia
l Det
ails
2009
2010
2011
2012
2013
2014
Dec 1
5M
ar 1
4Ju
n 14
Sep
14De
c 14
Mar
15
Jun
15Se
p 15
EPS
($)
-0.9
30.
120.
530.
30-1
.67
-0.3
059
%EP
S ($
)-0
.05
-0.2
20.
20-0
.23
-2.8
0-3
.46
-2.4
4CF
/SHR
($)
-0.2
61.
171.
751.
291.
951.
94DI
VIDE
NDN/
ACF
/SHR
($)
0.85
-0.0
10.
910.
200.
410.
130.
41PR
ETAX
MAR
GIN
-166
%5%
23%
13%
-57%
-8%
WAC
C4%
-5%
-28%
28%
-27%
-353
%-3
90%
-300
%RE
TURN
ON
EQUI
TY-3
%3%
4%0%
-1%
-4%
BETA
2.65
RETU
RN O
N EQ
UITY
-1%
-2%
-1%
-4%
-6%
-40%
--SA
LES
% C
HANG
E--
321%
25%
14%
33%
3%AL
PHA
-1.7
7SA
LES
% C
HANG
E20
%-1
%18
%-1
6%-2
4%-1
8%-2
3%SA
LES
(MIL
$)39
.22
165.
1220
6.11
235.
3531
3.97
324.
38SA
LES
(MIL
$)86
.13
81.1
679
.09
78.0
165
.32
66.3
861
.00
Trad
ing
and
Capi
tal S
truc
ture
Qua
rter
ly A
naly
st E
stim
ates
AVG
DAIL
Y VO
LUM
E10
1K42
8K24
7K89
0K54
0K23
6KM
OM
ENTU
M--
----
----
--YE
ARRA
TE O
F CH
ANGE
----
17.5
2-1
1.15
-21.
61-9
1.06
2013
RELA
TIVE
STR
ENGT
H--
----
----
--20
14W
ILLI
AMS'
%R
----
----
----
2015
MAC
D0.
180.
590.
580.
350.
24-0
.46
2016
YEAR
2013
2014
2015
2016
YEAR
2013
2014
2015
2016
Ow
ners
hip
Dec 1
4De
c 15
Chan
ge%
OF
SHAR
ES H
ELD
100%
54%
-46%
% O
F FL
OAT
HEL
D11
1%65
%-4
1%#
OF
HOLD
ERS
158
68-5
7%#
OF
BUYE
RS49
13-7
3%#
OF
SELL
ERS
5734
-40%
# O
F NE
W B
UYER
S16
5-6
9%#
OF
SELL
OFF
S25
3332
%
De
c 14
Dec 1
5Ch
ange
% O
F SH
ARES
HEL
D6%
8%25
%%
CHA
NGE
IN H
OLD
INGS
(6 M
O)
-1%
16%
-158
4%#
OF
HOLD
ERS
1313
0%
1SP
O A
DVIS
ORY
CO
RP2
GOFF
JOHN
C3
SAGE
VIEW
CAP
ITAL
LP
4VA
NGUA
RD G
ROUP
5SU
TTO
N NI
CHO
LAS
J6
BLAC
KRO
CK7
JPM
ORG
AN C
HASE
& C
O8
CAST
LETO
N IN
VEST
MEN
T M
ANAG
EMEN
T9
CALI
FORN
IA P
UBLI
C EM
P - C
ALPE
RS10
RR A
DVIS
ORS
LLC
2,10
2,16
1
1,
938,
671
1,71
7,14
8
1,
595,
200
1,32
2,00
0
2,
215,
426
-0.0
52 E
-0.0
5 E
-0.0
47 E
-0.0
5 E
Top
10 H
olde
rs (S
hare
s Hel
d)14
,754
,356
6,17
9,32
5
5,
076,
011
2,37
2,02
9
Institution InsideEstimates
Q1
Q2
Q3
Q4
-0.0
50.
14-0
.04
-1.7
2-0
.23
-2.8
0-3
.46
-2.4
4-0
.04
E-0
.05
-0.2
20.
20
BLO
OM
BERG
BES
T ES
TIM
ATES
- EP
S
-141
.83
38.2
331
.25
30.6
9-8
5.68
-188
.23
-177
.31
-170
.58
28.7
17 E
25.3
75 E
25.2
75 E
25.7
75 E
25.5
75 E
81.1
679
.09
78.0
1
Estimates
Q1
Q2
Q3
Q4
46.4
5 E
47.0
25 E
48.0
75 E
49.0
5 E
BLO
OM
BERG
BES
T ES
TIM
ATES
- EB
ITDA
28.0
036
.64
23.8
5
65.3
266
.38
61.0
056
.3 E
Trading Data
BLO
OM
BERG
BES
T ES
TIM
ATES
- RE
VENU
E
Estimates
Q1
Q2
Q3
Q4
72.0
182
.23
67.2
492
.49
86.1
3
Reso
lute
Ene
rgy
Corp
Reso
lute
Ene
rgy
is en
gage
d in
the
acqu
isitio
n, d
evel
opm
ent a
nd p
rodu
ctio
n of
ons
hore
dom
estic
hyd
roca
rbon
s, pr
inci
pally
crud
e oi
l. Re
solu
te’s
prod
ucin
g as
sets
are
Ane
th F
ield
in th
e Pa
rado
x Ba
sin o
f Uta
h an
d in
the
Perm
ian
Basin
of W
est T
exas
.
Annual
Corporate
NET
DEBT
TO
CAP
ITAL
Quarter
PRET
AX M
ARGI
N
0500
1000
1500
2000
2500
02468101214161820CL
OSE
PRI
CE20
0D M
AVG
50D
MAV
GSP
X
Stock Price
SPX

47
Sour
ce: E
nerC
om, C
ompa
ny fi
lings
, Blo
ombe
rg L
.P.,
as o
f Feb
ruar
y, 20
16
Reso
lute
Ene
rgy
Corp
Dom
icile
: Den
ver,
COTi
cker
: REN
Exch
ange
: New
Yor
kSe
ctor
: Oil
& G
as P
rodu
cers
Floa
t: 77
.50
MM
Mkt
Cap
: $38
.28
MM
Fina
ncia
l Det
ails
2009
2010
2011
2012
2013
2014
Dec 1
5M
ar 1
4Ju
n 14
Sep
14De
c 14
Mar
15
Jun
15Se
p 15
EPS
($)
-0.9
30.
120.
530.
30-1
.67
-0.3
059
%EP
S ($
)-0
.05
-0.2
20.
20-0
.23
-2.8
0-3
.46
-2.4
4CF
/SHR
($)
-0.2
61.
171.
751.
291.
951.
94DI
VIDE
NDN/
ACF
/SHR
($)
0.85
-0.0
10.
910.
200.
410.
130.
41PR
ETAX
MAR
GIN
-166
%5%
23%
13%
-57%
-8%
WAC
C4%
-5%
-28%
28%
-27%
-353
%-3
90%
-300
%RE
TURN
ON
EQUI
TY-3
%3%
4%0%
-1%
-4%
BETA
2.65
RETU
RN O
N EQ
UITY
-1%
-2%
-1%
-4%
-6%
-40%
--SA
LES
% C
HANG
E--
321%
25%
14%
33%
3%AL
PHA
-1.7
7SA
LES
% C
HANG
E20
%-1
%18
%-1
6%-2
4%-1
8%-2
3%SA
LES
(MIL
$)39
.22
165.
1220
6.11
235.
3531
3.97
324.
38SA
LES
(MIL
$)86
.13
81.1
679
.09
78.0
165
.32
66.3
861
.00
Trad
ing
and
Capi
tal S
truc
ture
Qua
rter
ly A
naly
st E
stim
ates
AVG
DAIL
Y VO
LUM
E10
1K42
8K24
7K89
0K54
0K23
6KM
OM
ENTU
M--
----
----
--YE
ARRA
TE O
F CH
ANGE
----
17.5
2-1
1.15
-21.
61-9
1.06
2013
RELA
TIVE
STR
ENGT
H--
----
----
--20
14W
ILLI
AMS'
%R
----
----
----
2015
MAC
D0.
180.
590.
580.
350.
24-0
.46
2016
YEAR
2013
2014
2015
2016
YEAR
2013
2014
2015
2016
Ow
ners
hip
Dec 1
4De
c 15
Chan
ge%
OF
SHAR
ES H
ELD
100%
54%
-46%
% O
F FL
OAT
HEL
D11
1%65
%-4
1%#
OF
HOLD
ERS
158
68-5
7%#
OF
BUYE
RS49
13-7
3%#
OF
SELL
ERS
5734
-40%
# O
F NE
W B
UYER
S16
5-6
9%#
OF
SELL
OFF
S25
3332
%
De
c 14
Dec 1
5Ch
ange
% O
F SH
ARES
HEL
D6%
8%25
%%
CHA
NGE
IN H
OLD
INGS
(6 M
O)
-1%
16%
-158
4%#
OF
HOLD
ERS
1313
0%
1SP
O A
DVIS
ORY
CO
RP2
GOFF
JOHN
C3
SAGE
VIEW
CAP
ITAL
LP
4VA
NGUA
RD G
ROUP
5SU
TTO
N NI
CHO
LAS
J6
BLAC
KRO
CK7
JPM
ORG
AN C
HASE
& C
O8
CAST
LETO
N IN
VEST
MEN
T M
ANAG
EMEN
T9
CALI
FORN
IA P
UBLI
C EM
P - C
ALPE
RS10
RR A
DVIS
ORS
LLC
2,10
2,16
1
1,
938,
671
1,71
7,14
8
1,
595,
200
1,32
2,00
0
2,
215,
426
-0.0
52 E
-0.0
5 E
-0.0
47 E
-0.0
5 E
Top
10 H
olde
rs (S
hare
s Hel
d)14
,754
,356
6,17
9,32
5
5,
076,
011
2,37
2,02
9
Institution InsideEstimates
Q1
Q2
Q3
Q4
-0.0
50.
14-0
.04
-1.7
2-0
.23
-2.8
0-3
.46
-2.4
4-0
.04
E-0
.05
-0.2
20.
20
BLO
OM
BERG
BES
T ES
TIM
ATES
- EP
S
-141
.83
38.2
331
.25
30.6
9-8
5.68
-188
.23
-177
.31
-170
.58
28.7
17 E
25.3
75 E
25.2
75 E
25.7
75 E
25.5
75 E
81.1
679
.09
78.0
1
Estimates
Q1
Q2
Q3
Q4
46.4
5 E
47.0
25 E
48.0
75 E
49.0
5 E
BLO
OM
BERG
BES
T ES
TIM
ATES
- EB
ITDA
28.0
036
.64
23.8
5
65.3
266
.38
61.0
056
.3 E
Trading Data
BLO
OM
BERG
BES
T ES
TIM
ATES
- RE
VENU
E
Estimates
Q1
Q2
Q3
Q4
72.0
182
.23
67.2
492
.49
86.1
3
Reso
lute
Ene
rgy
Corp
Reso
lute
Ene
rgy
is en
gage
d in
the
acqu
isitio
n, d
evel
opm
ent a
nd p
rodu
ctio
n of
ons
hore
dom
estic
hyd
roca
rbon
s, pr
inci
pally
crud
e oi
l. Re
solu
te’s
prod
ucin
g as
sets
are
Ane
th F
ield
in th
e Pa
rado
x Ba
sin o
f Uta
h an
d in
the
Perm
ian
Basin
of W
est T
exas
.
Annual
Corporate
NET
DEBT
TO
CAP
ITAL
Quarter
PRET
AX M
ARGI
N
0500
1000
1500
2000
2500
02468101214161820CL
OSE
PRI
CE20
0D M
AVG
50D
MAV
GSP
X
Stock Price
SPX

48
Sour
ce: E
nerC
om, C
ompa
ny fi
lings
, Blo
ombe
rg L
.P.,
as o
f Feb
ruar
y, 20
16
Sanc
hez E
nerg
y Co
rpDo
mic
ile: H
oust
on, T
XTi
cker
: SN
Exch
ange
: New
Yor
kSe
ctor
: Oil
& G
as P
rodu
cers
Floa
t: 61
.91
MM
Mkt
Cap
: $19
2.24
MM
Fina
ncia
l Det
ails
2010
2011
2012
2013
2014
2015
Dec 1
5Ju
n 14
Sep
14De
c 14
Mar
15
Jun
15Se
p 15
Dec 1
5EP
S ($
)--
0.09
-0.5
60.
22-1
.06
-25.
7010
2%EP
S ($
)-0
.38
0.77
-1.1
8-8
.83
-9.9
1-7
.33
0.30
CF/S
HR ($
)--
0.25
0.88
5.20
7.94
--DI
VIDE
NDN/
ACF
/SHR
($)
1.53
2.34
2.55
1.12
1.50
1.38
--PR
ETAX
MAR
GIN
-61%
14%
-38%
10%
-5%
-234
%W
ACC
6%-1
3%37
%-5
1%-3
50%
-333
%-2
71%
15%
RETU
RN O
N EQ
UITY
-16%
2%-6
%3%
0%--
BETA
2.15
RETU
RN O
N EQ
UITY
1%1%
0%-1
4%--
----
SALE
S %
CHA
NGE
1788
%21
9%19
5%61
4%12
0%-8
%AL
PHA
-1.7
2SA
LES
% C
HANG
E15
1%13
2%46
%6%
16%
-25%
-17%
SALE
S (M
IL$)
4.55
14.5
242
.85
305.
8067
1.66
618.
25SA
LES
(MIL
$)14
6.32
205.
7218
7.74
139.
9516
9.27
154.
0115
5.02
Trad
ing
and
Capi
tal S
truc
ture
Qua
rter
ly A
naly
st E
stim
ates
AVG
DAIL
Y VO
LUM
E--
----
--14
9K35
8KM
OM
ENTU
M--
----
----
--YE
ARRA
TE O
F CH
ANGE
----
----
-75.
03--
2013
RELA
TIVE
STR
ENGT
H--
----
----
--20
14W
ILLI
AMS'
%R
----
----
----
2015
MAC
D0.
000.
060.
62-0
.15
-1.1
6--
2016
YEAR
2013
2014
2015
2016
YEAR
2013
2014
2015
2016
Ow
ners
hip
Dec 1
4De
c 15
Chan
ge%
OF
SHAR
ES H
ELD
96%
90%
-7%
% O
F FL
OAT
HEL
D10
4%10
1%-3
%#
OF
HOLD
ERS
252
181
-28%
# O
F BU
YERS
118
76-3
6%#
OF
SELL
ERS
6554
-17%
# O
F NE
W B
UYER
S38
23-3
9%#
OF
SELL
OFF
S54
50-7
%
De
c 14
Dec 1
5Ch
ange
% O
F SH
ARES
HEL
D6%
9%54
%%
CHA
NGE
IN H
OLD
INGS
(6 M
O)
0%3%
1238
%#
OF
HOLD
ERS
912
33%
1FR
ANKL
IN R
ESO
URCE
S2
VANG
UARD
GRO
UP3
SANC
HEZ
JR A
NTO
NIO
4ST
DEN
IS J
VILL
ERE
& C
OM
PANY
5BL
ACKR
OCK
6SC
HRO
DER
INVE
STM
ENT
MGM
T GR
OUP
7BA
UPO
ST G
ROUP
LLC
8IN
VEST
EC A
SSET
MAN
AGEM
ENT
LTD
9FO
RTUN
E SG
AM F
UND
MAN
AGEM
ENT
CO10
GRT
CAPI
TAL P
ARTN
ERS
LLC
2,44
7,28
9
2,
000,
000
1,51
1,48
7
1,
463,
241
1,44
0,62
0
2,
972,
570
-0.3
75 E
-0.3
71 E
-0.3
45 E
-0.3
32 E
Top
10 H
olde
rs (S
hare
s Hel
d)5,
683,
133
3,74
6,33
0
3,
120,
523
3,04
3,27
8
Institution InsideEstimates
Q1
Q2
Q3
Q4
-0.0
60.
10-0
.05
0.19
-1.1
8-8
.83
-9.9
1-7
.33
0.30
-0.3
1-0
.38
0.77
BLO
OM
BERG
BES
T ES
TIM
ATES
- EP
S
95.1
286
.26
95.7
014
7.60
-66.
78-3
65.8
1-3
65.5
8-3
59.8
586
.93
73.8
73 E
72.6
36 E
73.8
27 E
73.9
27 E
146.
3220
5.72
187.
74
Estimates
Q1
Q2
Q3
Q4
120.
938
E12
3.08
8 E
125.
963
E12
9.25
E
BLO
OM
BERG
BES
T ES
TIM
ATES
- EB
ITDA
17.2
435
.52
56.9
9
139.
9516
9.27
154.
0115
5.02
Trading Data
BLO
OM
BERG
BES
T ES
TIM
ATES
- RE
VENU
E
Estimates
Q1
Q2
Q3
Q4
30.2
958
.37
88.6
712
8.47
131.
88
Sanc
hez E
nerg
y Co
rp
Sanc
hez E
nerg
y Co
rpor
atio
n is
an in
depe
nden
t exp
lora
tion
and
prod
uctio
n co
mpa
ny fo
cuse
d on
the
acqu
isitio
n an
d de
velo
pmen
t of u
ncon
vent
iona
l oil
reso
urce
s in
the
onsh
ore
U.S.
Gul
f Coa
st, w
ith a
curr
ent f
ocus
on
the
Eagl
e Fo
rd S
hale
in S
outh
Te
xas.
The
Com
pany
also
has
a p
ositi
on in
the
Tusc
aloo
sa M
arin
e Sh
ale
in M
ississ
ippi
and
Loui
siana
.
Annual
Corporate
NET
DEBT
TO
CAP
ITAL
Quarter
PRET
AX M
ARGI
N
0500
1000
1500
2000
2500
051015202530354045CL
OSE
PRI
CE20
0D M
AVG
50D
MAV
GSP
X
Stock Price
SPX
Tam
arac
k Va
lley
Ener
gy L
tdDo
mic
ile: C
alga
ry, A
BTi
cker
: TVE
CN
Exch
ange
: Tor
onto
Sect
or: O
il &
Gas
Pro
duce
rsFl
oat:
99.9
7 M
MM
kt C
ap: $
309.
91 M
M
Fina
ncia
l Det
ails
2009
2010
2011
2012
2013
2014
Dec 1
5M
ar 1
4Ju
n 14
Sep
14De
c 14
Mar
15
Jun
15Se
p 15
EPS
($)
-0.6
0-1
.20
-0.2
4-0
.16
0.44
-0.4
025
%EP
S ($
)0.
030.
090.
11-0
.50
-0.0
7-0
.03
-0.1
5CF
/SHR
($)
0.03
-0.0
50.
660.
540.
981.
06DI
VIDE
NDN/
ACF
/SHR
($)
0.30
0.20
0.28
0.26
0.22
0.11
0.12
PRET
AX M
ARGI
N-1
22%
-193
%-2
5%-1
5%28
%-2
9%W
ACC
18%
13%
27%
28%
-184
%-2
6%-2
3%-6
2%RE
TURN
ON
EQUI
TY-1
2%-2
0%-8
%-5
%6%
4%BE
TA2.
18RE
TURN
ON
EQUI
TY7%
10%
10%
4%1%
0%-3
%SA
LES
% C
HANG
E-3
5%65
%14
4%10
1%91
%78
%AL
PHA
0.14
SALE
S %
CHA
NGE
76%
98%
112%
39%
29%
-7%
-12%
SALE
S (M
IL$)
3.90
6.43
15.7
131
.59
60.3
610
7.54
SALE
S (M
IL$)
20.2
427
.11
32.9
227
.28
26.2
025
.20
29.0
2
Trad
ing
and
Capi
tal S
truc
ture
Qua
rter
ly A
naly
st E
stim
ates
AVG
DAIL
Y VO
LUM
E2K
1K19
K41
K15
K32
KM
OM
ENTU
M--
----
-4.7
7-5
.24
-6.9
4YE
ARRA
TE O
F CH
ANGE
-75.
83-2
5.00
4.55
41.6
711
6.09
-54.
7220
13RE
LATI
VE S
TREN
GTH
----
----
----
2014
WIL
LIAM
S' %
R--
----
----
--20
15M
ACD
-0.7
9-0
.60
-0.6
9-0
.88
-0.9
2-0
.99
2016
YEAR
2013
2014
2015
2016
YEAR
2013
2014
2015
2016
Ow
ners
hip
Dec 1
4De
c 15
Chan
ge%
OF
SHAR
ES H
ELD
35%
43%
24%
% O
F FL
OAT
HEL
D36
%45
%22
%#
OF
HOLD
ERS
3231
-3%
# O
F BU
YERS
1110
-9%
# O
F SE
LLER
S7
814
%#
OF
NEW
BUY
ERS
84
-50%
# O
F SE
LLO
FFS
33
0%
De
c 14
Dec 1
5Ch
ange
% O
F SH
ARES
HEL
D4%
3%-2
8%%
CHA
NGE
IN H
OLD
INGS
(6 M
O)
1%-1
%-1
79%
# O
F HO
LDER
S13
12-8
%
1GM
T CA
PITA
L CO
RP2
FIER
A CA
PITA
L CO
RPO
RATI
ON3
NATC
AN IN
VEST
MEN
T M
ANAG
EMEN
T IN
C4
AGF
INVE
STM
ENTS
INC
5CI
INVE
STM
ENTS
INC
6SE
I INV
ESTM
ENTS
CO
7BO
YCE
JEFF
REY
S8
FRAN
KLIN
RES
OUR
CES
9CI
BC G
LOBA
L ASS
ET M
ANAG
EMEN
T10
SENT
RY S
ELEC
T CA
PITA
L CO
RP
1,25
7,47
0
1,
201,
719
1,10
6,27
1
755,
410
74
4,36
6
1,49
1,70
0
-0.0
5 E
-0.0
55 E
-0.0
5 E
-0.0
3 E
Top
10 H
olde
rs (S
hare
s Hel
d)15
,890
,600
11
,373
,074
4,05
3,00
7
3,
715,
684
Institution InsideEstimates
Q1
Q2
Q3
Q4
0.01
0.00
0.13
0.24
-0.5
0-0
.07
-0.0
3-0
.15
-0.0
3 E
0.03
0.09
0.11
BLO
OM
BERG
BES
T ES
TIM
ATES
- EP
S
11.0
013
.39
18.2
218
.97
-14.
3413
.70
13.8
8-1
3.56
17.6
E15
.8 E
14.9
E16
.2 E
19 E
27.1
132
.92
27.2
8
Estimates
Q1
Q2
Q3
Q4
N/A
N/A
N/A
N/A
BLO
OM
BERG
BES
T ES
TIM
ATES
- EB
ITDA
7.10
9.04
10.3
5
26.2
025
.20
29.0
2N/
A
Trading Data
BLO
OM
BERG
BES
T ES
TIM
ATES
- RE
VENU
E
Estimates
Q1
Q2
Q3
Q4
11.4
713
.71
15.5
319
.65
20.2
4
Tam
arac
k Va
lley
Ener
gy Lt
d
Tam
arac
k Va
lley
Ener
gy Lt
d. e
xplo
res f
or o
il an
d na
tura
l gas
in th
e w
este
rn C
anad
ian
sedi
men
tary
bas
in.
The
Com
pany
ow
ns C
ardi
um li
ght o
il pr
oper
ties i
n Al
bert
a, a
nd n
atur
al g
as p
rope
rtie
s in
Albe
rta
and
Briti
sh C
olum
bia.
Annual
Corporate
NET
DEBT
TO
CAP
ITAL
Quarter
PRET
AX M
ARGI
N
0500
1000
1500
2000
2500
0123456789CL
OSE
PRI
CE20
0D M
AVG
50D
MAV
GSP
X
Stock Price
SPX

49
Sour
ce: E
nerC
om, C
ompa
ny fi
lings
, Blo
ombe
rg L
.P.,
as o
f Feb
ruar
y, 20
16
Tam
arac
k Va
lley
Ener
gy L
tdDo
mic
ile: C
alga
ry, A
BTi
cker
: TVE
CN
Exch
ange
: Tor
onto
Sect
or: O
il &
Gas
Pro
duce
rsFl
oat:
99.9
7 M
MM
kt C
ap: $
309.
91 M
M
Fina
ncia
l Det
ails
2009
2010
2011
2012
2013
2014
Dec 1
5M
ar 1
4Ju
n 14
Sep
14De
c 14
Mar
15
Jun
15Se
p 15
EPS
($)
-0.6
0-1
.20
-0.2
4-0
.16
0.44
-0.4
025
%EP
S ($
)0.
030.
090.
11-0
.50
-0.0
7-0
.03
-0.1
5CF
/SHR
($)
0.03
-0.0
50.
660.
540.
981.
06DI
VIDE
NDN/
ACF
/SHR
($)
0.30
0.20
0.28
0.26
0.22
0.11
0.12
PRET
AX M
ARGI
N-1
22%
-193
%-2
5%-1
5%28
%-2
9%W
ACC
18%
13%
27%
28%
-184
%-2
6%-2
3%-6
2%RE
TURN
ON
EQUI
TY-1
2%-2
0%-8
%-5
%6%
4%BE
TA2.
18RE
TURN
ON
EQUI
TY7%
10%
10%
4%1%
0%-3
%SA
LES
% C
HANG
E-3
5%65
%14
4%10
1%91
%78
%AL
PHA
0.14
SALE
S %
CHA
NGE
76%
98%
112%
39%
29%
-7%
-12%
SALE
S (M
IL$)
3.90
6.43
15.7
131
.59
60.3
610
7.54
SALE
S (M
IL$)
20.2
427
.11
32.9
227
.28
26.2
025
.20
29.0
2
Trad
ing
and
Capi
tal S
truc
ture
Qua
rter
ly A
naly
st E
stim
ates
AVG
DAIL
Y VO
LUM
E2K
1K19
K41
K15
K32
KM
OM
ENTU
M--
----
-4.7
7-5
.24
-6.9
4YE
ARRA
TE O
F CH
ANGE
-75.
83-2
5.00
4.55
41.6
711
6.09
-54.
7220
13RE
LATI
VE S
TREN
GTH
----
----
----
2014
WIL
LIAM
S' %
R--
----
----
--20
15M
ACD
-0.7
9-0
.60
-0.6
9-0
.88
-0.9
2-0
.99
2016
YEAR
2013
2014
2015
2016
YEAR
2013
2014
2015
2016
Ow
ners
hip
Dec 1
4De
c 15
Chan
ge%
OF
SHAR
ES H
ELD
35%
43%
24%
% O
F FL
OAT
HEL
D36
%45
%22
%#
OF
HOLD
ERS
3231
-3%
# O
F BU
YERS
1110
-9%
# O
F SE
LLER
S7
814
%#
OF
NEW
BUY
ERS
84
-50%
# O
F SE
LLO
FFS
33
0%
De
c 14
Dec 1
5Ch
ange
% O
F SH
ARES
HEL
D4%
3%-2
8%%
CHA
NGE
IN H
OLD
INGS
(6 M
O)
1%-1
%-1
79%
# O
F HO
LDER
S13
12-8
%
1GM
T CA
PITA
L CO
RP2
FIER
A CA
PITA
L CO
RPO
RATI
ON3
NATC
AN IN
VEST
MEN
T M
ANAG
EMEN
T IN
C4
AGF
INVE
STM
ENTS
INC
5CI
INVE
STM
ENTS
INC
6SE
I INV
ESTM
ENTS
CO
7BO
YCE
JEFF
REY
S8
FRAN
KLIN
RES
OUR
CES
9CI
BC G
LOBA
L ASS
ET M
ANAG
EMEN
T10
SENT
RY S
ELEC
T CA
PITA
L CO
RP
1,25
7,47
0
1,
201,
719
1,10
6,27
1
755,
410
74
4,36
6
1,49
1,70
0
-0.0
5 E
-0.0
55 E
-0.0
5 E
-0.0
3 E
Top
10 H
olde
rs (S
hare
s Hel
d)15
,890
,600
11
,373
,074
4,05
3,00
7
3,
715,
684
Institution InsideEstimates
Q1
Q2
Q3
Q4
0.01
0.00
0.13
0.24
-0.5
0-0
.07
-0.0
3-0
.15
-0.0
3 E
0.03
0.09
0.11
BLO
OM
BERG
BES
T ES
TIM
ATES
- EP
S
11.0
013
.39
18.2
218
.97
-14.
3413
.70
13.8
8-1
3.56
17.6
E15
.8 E
14.9
E16
.2 E
19 E
27.1
132
.92
27.2
8
Estimates
Q1
Q2
Q3
Q4
N/A
N/A
N/A
N/A
BLO
OM
BERG
BES
T ES
TIM
ATES
- EB
ITDA
7.10
9.04
10.3
5
26.2
025
.20
29.0
2N/
A
Trading Data
BLO
OM
BERG
BES
T ES
TIM
ATES
- RE
VENU
E
Estimates
Q1
Q2
Q3
Q4
11.4
713
.71
15.5
319
.65
20.2
4
Tam
arac
k Va
lley
Ener
gy Lt
d
Tam
arac
k Va
lley
Ener
gy Lt
d. e
xplo
res f
or o
il an
d na
tura
l gas
in th
e w
este
rn C
anad
ian
sedi
men
tary
bas
in.
The
Com
pany
ow
ns C
ardi
um li
ght o
il pr
oper
ties i
n Al
bert
a, a
nd n
atur
al g
as p
rope
rtie
s in
Albe
rta
and
Briti
sh C
olum
bia.
Annual
Corporate
NET
DEBT
TO
CAP
ITAL
Quarter
PRET
AX M
ARGI
N
0500
1000
1500
2000
2500
0123456789CL
OSE
PRI
CE20
0D M
AVG
50D
MAV
GSP
X
Stock Price
SPX

THE OIL & GASCONFERENCE®
Save the Date:
August 14-18, 2016Denver, Colorado
www.theoilandgasconference.com