The Oil Patch Report - fergusonwhite.com
7
The Oil Patch Report November 2015
Transcript of The Oil Patch Report - fergusonwhite.com

The Oil Patch Report
July 2015
The Oil Patch
Report
November 2015
4w3
Oil & Gas Deal Geography
Page 1
Oil & Gas Quarterly Transaction Volume (USA)
5
WWW.FERGUSONWHITE.COM
Oil & Gas November Deals
Nov 2015
Mill
ion
s ($
)
148
111
105
132
147138
146 152
137
106 121
38
115
50
9890
117
100 100
155
174
128
150 150
0
20
40
60
80
100
120
140
160
180
200
2012 Q4 2013 Q1 2013 Q2 2013 Q3 2013 Q4 2014 Q1 2014 Q2 2014 Q3 2014 Q4 2015 Q1 2015 Q2 2015 Q3
Number Deals Average Deal Size
Company Name AcquirersValuation ($
Millions)Description Date HQ Location
Bridge Solutions (Canada) OneSoft Solutions 0.76 Compliance software for oil pipeline companies 30-Jul-2015 Canada
Enterprise Products Genesis Energy 1,500.00 Operator of gas and oil pipelines. 24-Jul-2015 Houston, TX
QEP Midstream Partners Tesoro Logistics 2,500.00 Oil gathering and storage operations 22-Jul-2015 Denver, CO
Halliburton (HAL) BlackRock Oilfield Services 20-Jul-2015 Houston, TX
Priority Energy Services Airgas Oilfield Services: artificial lift, coil tubing, equipment rental 20-Jul-2015 Covington, LA
Weldinghouse Airgas Distributor of welding equipment and gases to the oil industry 17-Jul-2015 Corpus Christi, TX
PanAmerican Operating Oil & Gas Producer 15-Jul-2015 Dallas, TX
RKI Exploration and Production First Reserve 3,600.00 Oil & Gas Producer 14-Jul-2015 Oklahoma City, OK
UET Midstream Arc Logistics Partners 76.60 Oil storage operations 14-Jul-2015 Lakewood, CO
Markwest Energy Partners (MWE) Kayne Anderson 21,666.00 Natural Gas Gathering & Transportation 13-Jul-2015 Denver, CO
Tengasco (TGC) 16.65 Oil & Gas Producer 13-Jul-2015 Greenwood, CO
Arctic Pipe Inspection Arctic Slope Regional Oilfield Services: Non destructvive drill pipe inspection 10-Jul-2015 Channelview, TX
Garland Welding Supply Praxair Oilfield Services: Provides welding supplies 09-Jul-2015 Garland, TX
Pacific Rubiales Energy (PRE) ALFA 6,128.00 Oil & Gas Producer 09-Jul-2015 Toronto, Canada
Delta Industrial Valves The Weir Group 47.00 Manufactures valves for the oil industry 08-Jul-2015 Niles, MI
GasFrac Energy Services (GSFVF) Calfrac Well Services Oilfield Services: Fracturing Services 08-Jul-2015 Calgary, Canada
StonePoint Energy (STO) 13.56 Oil & Gas Producer 07-Jul-2015 Calgary, Canada
American Midstream Partners High Point Infrastructure Gathering, treating, transportation of natural gas 02-Jul-2015 Denver, CO
Coral Hill Energy 112.00 Oil & Gas Producer 02-Jul-2015 Calgary, Canada
SilverWillow Energy (SWE) 1.38 Oil & Gas Producer 02-Jul-2015 Calgary, Canada
Eagle Ford Shale Midstream Enterprise Products Partners 2,150.00 Gas transportation 01-Jul-2015 Irving, TX
$103.9M
$61.0M
$99.0M
$121.6M
$135.5M
$100.0M$95.2M
$147.3M
$127.5M
$162.5M
$100.0M$107.5M
219
161156
205 206
193
210218
212
170
195
170
0
50
100
150
200
250
$0.00M
$20.0M
$40.0M
$60.0M
$80.0M
$100.0M
$120.0M
$140.0M
$160.0M
$180.0M
2012 Q4 2013 Q1 2013 Q2 2013 Q3 2013 Q4 2014 Q1 2014 Q2 2014 Q3 2014 Q4 2015 Q1 2015 Q2 2015 Q3
Source: PitchBook Data, Inc.Median Post Valuation Deal Count
Company Description Active Investors Value Date HQ Location EBITDA
Electro-Petroleum Patented technology to enhance the recovery of heavy oil. Element Partners 26-Oct-2014 Villanova, PA
Source Energy Partners Explorer and producer of oil and gas properties. Apollo Global Management 26-Oct-2015 CO
Northern Tier Energy Owner and operator of Minnesota downstream assets. 2,520.00 26-Oct-2015 Tempe, AZ 432.80
Juniper Resources Producer and explorer of oil and gas assets. Natural Gas Partners 26-Oct-2015 Dallas, TX
ZaZa Energy (ZAZA) Operator of exploration and production firm. Quantum Energy Partners 23-Oct-2015 Houston, TX (15.60)
Oklahoma's Mississippi Lime play Explorer and producer of oil and natural gas. Fairway Resources 195.00 22-Oct-2015 Tulsa, OK
Ajax Resources Operator of oil and gas company. Kelso & Co. 22-Oct-2015 Houston, TX
Exco Resources (XCO) Producer of oil and natural gas. Ares Private Equity 20-Oct-2015 Dallas, TX (845.05)
Valor Energy Producer and developer of crude oil and natural gas properties. 19-Oct-2015 Salmon Arm, Canada 0.14
Manta Biofuel Provider of renewable crude oil. Chesapeake Bay Seed Capital Fund 19-Oct-2015 Baltimore, MD
SandRidge Energy (SD) Provider of natural gas and oil + pulling units, mud logging, trucking Ares Private Equity Group 16-Oct-2015 Oklahoma City, OK (1,505.01)
Mart Resources Provider of oil production services. 94.21 16-Oct-2015 Calgary, Canada 61.72
W&T Offshore (Permian Basin assets) Provider of oil exploration services. Ajax Resources 376.10 15-Oct-2015 Houston, TX
Sanchez Production Partners (SPP) Operator of oil and natural gas properties & midstream PostRock Energy 15-Oct-2015 Houston, TX (63.84)
Redwater Asset (Alberta) Operating of oil and gas assets Rifle Shot Oil 15-Oct-2015 Canada
Occidental Petroleum (North Dakota Oil Assets) Provider of oil production and exploration services. Occidental Petroleum 500.00 15-Oct-2015 Bismarck, ND
Riverside Petroleum Indiana Provider of oil and gas exploration services. Umbono 14-Oct-2015 The Woodlands, TX
Kicking Horse Energy Provider of oil and gas exploration services. 300.00 13-Oct-2015 Calgary, Canada 7.49
Fx Energy (FXEN) Provider of oil and gas exploration services. Apache 119.00 13-Oct-2015 Salt Lake City, UT (28.41)
Casper Crude to Rail Operator of a crude oil rail infrastructure terminal. Cogent Energy Solutions 225.00 12-Oct-2015 Casper, WY 26.00
Milagro Exploration Operator of an independent oil and gas company. White Oak Resources 217.00 08-Oct-2015 Houston, TX
Ev Energy Partners (EVEP) Owner of oil and gas properties within the continental United States. EnCap Investments, EnerVest 08-Oct-2015 Houston, TX (103.81)
Encana (Colorado Oil and Gas Assets) A 51,000 acre oil and gas field in Colorado. Encana 900.00 08-Oct-2015 CO
Canadian Oil Sands (COS) Holder of interest in a Canadian oil-extraction project. 4,977.45 07-Oct-2015 Calgary, Canada 489.84
Wild Wind Petroleum Provider of oil and gas exploration services. Natural Gas Partners 06-Oct-2015 Calgary, Canada
Vaalco Energy (EGY) Explorer and developer of crude oil and natural gas properties. Group 42 06-Oct-2015 Houston, TX (101.85)
Pinon Gathering Provider of gas gathering services EIG Global Energy Partners 126.00 05-Oct-2015 Houston, TX
LRR Energy Owner of oil and natural gas properties. Vanguard Natural Resources 127.10 05-Oct-2015 Houston, TX
Eagle Rock Energy Partners Oil producer Vanguard Natural Resources 232.90 05-Oct-2015 Houston, TX
Alta Mesa Eagle Provider of oil and gas exploration services. EnerVest 118.00 02-Oct-2015 TX
Valero Energy (Corpus Christi Terminal Services) Provider of petroleum refining services. Valero Energy Partners 465.00 01-Oct-2015 Amarillo, TX
Miller Energy Resources (MILL) Provider of energy exploration and production services. 01-Oct-2015 Huntsville, TN (550.88)
Madison PetroGas Provider of exploration services. 01-Oct-2015 Calgary, Canada
Belden & Blake Developer and producer of natural gas and oil properties. Ev Energy Partners 259.00 01-Oct-2015 Canton, OH 64.96
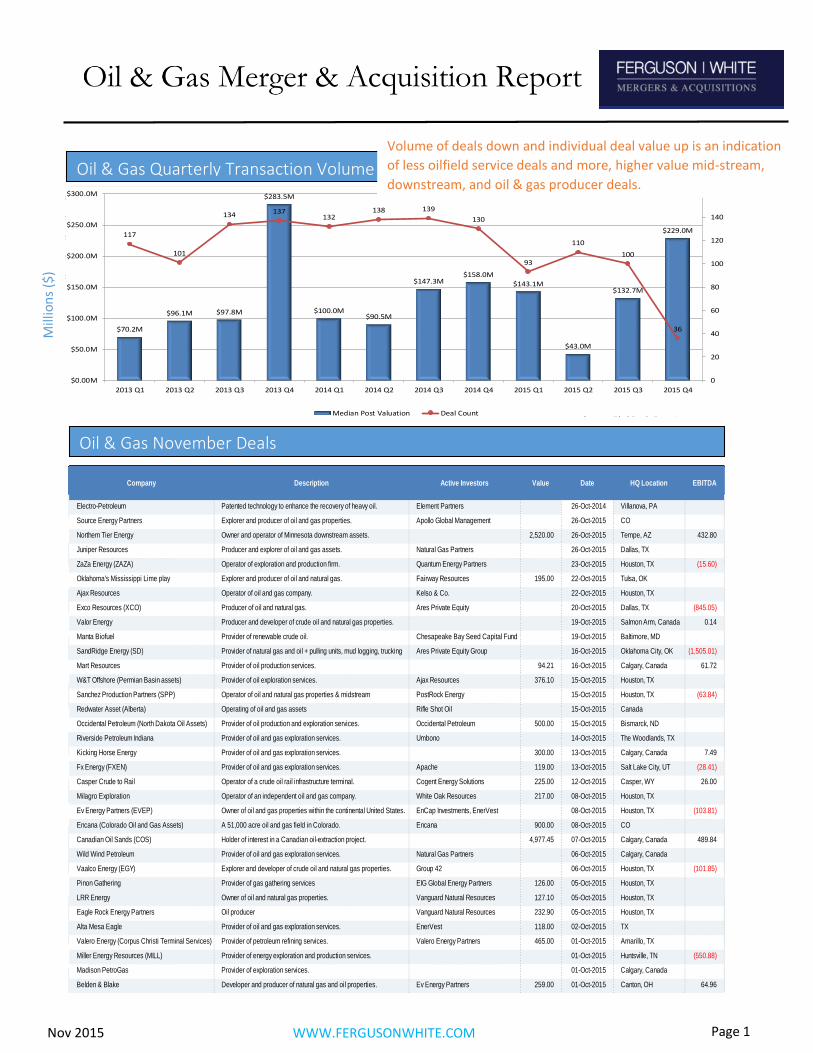
$70.2M
$96.1M $97.8M
$283.5M
$100.0M$90.5M
$147.3M$158.0M
$143.1M
$43.0M
$132.7M
$229.0M117
101
134 137132
138 139
130
93
110
100
36
0
20
40
60
80
100
120
140
160
$0.00M
$50.0M
$100.0M
$150.0M
$200.0M
$250.0M
$300.0M
2013 Q1 2013 Q2 2013 Q3 2013 Q4 2014 Q1 2014 Q2 2014 Q3 2014 Q4 2015 Q1 2015 Q2 2015 Q3 2015 Q4
Source: PitchBook Data, Inc.Median Post Valuation Deal Count
Volume of deals down and individual deal value up is an indication
of less oilfield service deals and more, higher value mid-stream,
downstream, and oil & gas producer deals.

Where the deals were
WWW.FERGUSONWHITE.COM
Oil & Gas November Transaction Geography
Oil & Gas Deals as % All Deals
TX Deals
Canada
Bakken deals
AZ Deals
OH Deals CO Deals
OK Deals
Oil & Gas Transaction Type
Page 2 Nov 2015
15
1
8
2
This graph computes oil & gas deals for the month as a
percentage of all deals completed in the month. This graph distinguishes between the types of oil & gas
deals completed.
1 TN Deal
1
Pennsylvania
Deal
1 MD Deal
1 1 1
UT Deals
WY Deals
1
B2C11%
Information Tech42%
B2B13%
Materials & Resources3%
Energy (Oil & Gas)7%
Healthcare9%
Financial Services15%
Pipeline/Storage Facilities/Transportation
22%
Oil/Gas Exploration/Producer
72%
Oil Field Services6%
CHART TITLE
Very few upstream oilfield service deals as
these companies are feeling the pain of low
oil prices and their soft P&Ls make deals
difficult.

`
of
Public Company Valuation Multiples
1 1
Private Company Transaction Valuation Multiples
Page 2 of 2
Public comparable data is used to value private companies. Total public company value is divided by EBITDA to determine a multiple
that can be similarly applied to the EBITDA of comparable private companies. This multiple must be discounted prior to applying it to
valuing a private company to account for much less risk related to the public companies. Less risk is attributable to public companies
because they are typically larger, more transparent, have audited financials and the like, when compared to private companies.
Company Name Acquirers DescriptionDeal
ValueEBITDA
Value
MultipleHQ Location Deal Date Deal Type
Kodiak Oil & Gas Whiting Petroleum Oil & Gas Exploration 3,800.00 721.05 5.27 Denver, CO 08-Dec-2014 Merger/Acquisition
Kinder Morgan Energy Partners Kinder Morgan Oil & Gas Pipeline Services 29,195.40 5,422.00 5.38 Houston, TX 26-Nov-2014 Merger/Acquisition
El Paso Pipeline Partners Kinder Morgan Natrual Gas Pipeline Services 8,983.05 1,068.00 8.41 Houston, TX 21-Nov-2014 Merger/Acquisition
Bolt Technology Teledyne Technologies Mfr of offshore oil and gas equipment 171.00 13.20 12.95 Norwalk, CT 19-Nov-2014 Merger/Acquisition
Vision Oil Tools OFS Energy Fund Oil & Gas Fishing & Rental 145.00 12.00 12.08 Houston, TX 29-Apr-2014 Merger/Acquisition
LT Energy Services BE Aerospace Oil & Gas Housing Services 105.00 5.40 19.44 Houston, TX 06-Jan-2014 Merger/Acquisition
Chemlogics Group Solvay Oil & Gas Specialty Chemicals 1,350.00 126.00 10.71 Paso Robles, CA 07-Oct-2013 Merger/Acquisition
Gardner Denver (GDI) KKR Mfr of compressors, pumps, vacuums 3,900.00 415.91 9.38 Wayne, PA 31-Jul-2013 Buyout/LBO
Badlands Energy Nuverra Environmental Solutions Fuel Transportation 509.80 154.70 3.30 Watford City, ND 30-Nov-2012 Merger/Acquisition
Union Drilling Sidewinder Drilling Contract land drilling and equipment services 263.67 48.82 5.40 Fort Worth, TX 05-Nov-2012 Buyout/LBO
OMNI Energy Services (OMNI) Gibson Energy Oilfield Services 445.00 82.80 5.37 Carencro, LA 31-Oct-2012 Merger/Acquisition
Gulf Coast Machine & Supply Altus Capital Mfr of large forgings for oil and gas industry 72.00 12.00 6.00 Beaumont, TX 12-Oct-2012 Buyout/LBO
Francis Drilling Fluids Prophet Equity, Gladstone Drilling, completion and specialized chemcals 21.90 11.70 1.87 Crowley, LA 04-May-2012 Buyout/LBO
Novatech The Weir Group Mfr of oil and gas industry valves 180.00 25.20 7.14 Dallas, TX 24-Feb-2012 Merger/Acquisition
Complete Production Services (CPX) Superior Energy Services Oilfield Services 3,550.00 590.15 6.02 Houston, TX 07-Feb-2012 Merger/Acquisition
Average 7.92
Private company transaction data is often used to value other private companies. Total transaction value is divided by EBITDA to
determine a multiple. This multiple must often be discounted prior to applying it to valuing a private company to account for less risk
related to the private company transaction data. Less risk is attributable to the private transaction data companies because they are
typically larger, have audited financials and the like, when compared to smaller private companies to be valued. It is also extremely
difficult to find accurate data pertaining to private transactions which is why the data below is not always updated.
Page 3 WWW.FERGUSONWHITE.COM Nov 2015
Discount the public company multiple by 35% to facilitate application
to private companies. The resulting discounted multiple is: 5.3x
Discount the private company computed multiple by 35% to facilitate
application to other private companies. The resulting discounted multiple is: 5.15x
Company Name Value EBITDA Value/EBITDA
Baker Hughes 30,398,040 3,370,000 9.02
Basic Energy 1,107,142 237,358 4.66
C&J Energy 1,090,268 231,889 4.70
Forbes Energy 263,605 67,644 3.90
Halliburton 42,931,850 5,755,000 7.46
National Oilwell Varco 22,551,750 4,157,000 5.43
Newpark Resources 963,477 158,237 6.09
Schlumberger 114,542,420 13,622,000 8.41
Superior Energy 4,681,048 1,123,842 4.17
Weatherford 16,979,925 1,761,000 9.64
AVERAGE VALUE/EBITDA 6.35
Company Name Value EBITDA Value/EBITDA
Baker Hughes 24,880,510 1,787,000 13.92
Basic Energy 966,743 Neg N/A
C&J Energy 2,074,412 139,511 14.87
Forbes Energy 261,863 55,182 4.75
Halliburton 35,792,000 3,056,000 11.71
National Oilwell Varco 17,352,000 2,919,000 5.94
Newpark Resources 511,290 76,779 6.66
Schlumberger 94,231,000 11,340,000 8.31
Superior Energy 3,015,000 neg N/A
Weatherford 13,858,000 862,000 16.08
AVERAGE VALUE/EBITDA 8.22
4 4.24.9 5.1 5.6 5.7 6.35
7.8
11.6
8.22
Jan Feb Mar Apr May Jun Jul Aug Sep Oct

5x
M
Valuation Multiple Matrix – What Certain Types of Oilfield
Service Companies Are Currently Worth (Multiple of EBITDA)
Flowback
Company
Drill Pipe
Inspection
Coil
Tubing
Manufacture
Pumps
Oil Well
Site Prep
Water
Transfer
Pipe Hard
Band
Workover
Rigs
Artifical Lift
Company
5x
4x
3x Proprietary Attributes
Mar
ket
Shar
e
Manufacture
Technology
6x
This valuation matrix indicates where the value of a variety of specific
oilfield service and manufacturing companies would fall on a spectrum of
multiples of EBITDA. The estimates of the relative value multiples included
herein are a function of the public and private comparables analyses in this
report and what Ferguson White is currently seeing in the market.
WWW.FERGUSONWHITE.COM Nov 2015 Page 4
Proprietary Attributes
Barriers to Entry
Customer Volume
Customer Diversity
Geographic Diversity
VALUE ENHANCERS
Production
Chemicals
Roustabout
Drilling
Chemicals

Oil & Gas Transaction Buyers & Funds
TOP 10
TOP 10
TOP 10 Private Equity
Corporate Buyers
Energy
Buyers
Buyers
Funds
Rank Investment Group Dry Powder Fund Size HQ Location
1 Energy Funds 6,189,000,000$ 6,500,000,000$ Houston, TX
2 EnCap Investments 5,231,000,000$ 5,325,000,000$ Irving, TX
3 Natural Gas Partners 4,500,000,000$ 4,500,000,000$ New York, NY
4 The Blackstone Group 4,335,000,000$ 6,000,000,000$ Washington, DC
5 EIG Global Energy Partners 3,109,910,000$ 3,502,550,000$ Greenwich, CT
6 First Reserve 2,896,500,000$ 3,000,000,000$ San Antonio, TX
7 EnCap Flatrock Midstream 2,686,720,000$ 5,056,870,000$ Houston, TX
8 EnCap Investments 2,470,000,000$ 2,500,000,000$ Houston, TX
9 Quantum Energy Partners 1,923,250,000$ 2,500,000,000$ Washington, DC
10 The Carlyle Group 1,822,290,000$ 1,900,000,000$ Stavanger, Norway
Rank Investment Group Historical Energy Active Energy HQ Location
Investments Investments
1 Lime Rock Partners 37 15 Westport, CT
2 Riverstone Holdings 41 14 New York, NY
3 ArcLight Capital Partners 26 13 Boston, MA
4 Intervale Capital 28 12 Boston, MA
5 First Reserve 38 11 Greenwich, CT
6 Scottish Enterprise 16 10 Glasgow, UK
7 Energy Excelerator 9 9 Honolulu, HI
8 KKR 16 9 New York, NY
9 Natural Gas Partners 15 9 Irving, TX
10 OFS Energy Fund 15 9 Houston, TX
Rank Corporate Buyer Acquisitions HQ Location
1 Complete Production Services 10 Houston, TX
2 Halliburton 9 Houston, TX
3 Stallion Oilfield Services 9 Houston, TX
4 Basic Energy Services 8 Fort Worth, TX
5 Forum Energy Technologies 8 Houston, TX
6 National Oilwell Varco 7 Houston, TX
7 Schlumberger 7 Houston, TX
8 Tuboscope 7 Houston, TX
9 Rockwater Energy 6 Houston, TX
10 Bronco Drilling 5 Edmond, OK
WWW.FERGUSONWHITE.COM Nov 2015 Page 5

The Oil Patch Report
July 2015
@ Copyright 2015 Ferguson White, LLC. All rights reserved.
Select Industry Transactions
Ferguson White is a mergers & acquisitions advisor specializing in oilfield service
companies.

![Chapter 15 Mechanics' Liens in the Oil Patch: An Illusory ... · PDF fileChapter 15 Mechanics' Liens in the Oil Patch: An Illusory Remedy ... --Oil and Gas Leases. [a] ... the common](https://static.fdocuments.net/doc/165x107/5a7276347f8b9aa7538d9464/chapter-15-mechanics-liens-in-the-oil-patch-an-illusory-wwwemlforgclientuploadsdirectorywhitepaperkite91pdfpdf.jpg)


