Industry Hong Kong Oil & Gas Demand - Oil & Gas China Periodical
Slide 1
The Oil and Gas Marketplace Canada-US Business Council - Chicago | May 13, 2015
President & CEO Tim Stauft

Slide 2 Slide 2
Aux Sable Operations

Slide 3 Slide 3
The Shale Revolution

Slide 4 Slide 4
What is Shale Oil & Gas and Why is It Important?
Traditional Wells Horizontal Drilling
Source: America’s Natural Gas Alliance

Slide 5 Slide 5
Hydraulic Fracturing Groundwater aquifers
Depth from surface is typically more than a mile
Private well, about 500 feet deep
Protective steel casing encased in cement extends to shale depth
Public well, about 1,000 feet deep
Several layers of steel tubes encased in cement protect groundwater supplies
Shale Fractures
Multiple protective layers extend from surface to below aquifers.
Source: America’s Natural Gas Alliance

Slide 6 Slide 6
Production: The Power of Progress Smaller surface impact The average well site today is just 30% of the size of its 1970s
counterpart—and today’s wells can access over 60 times more below-ground area.
Fewer wells, more clean energy Half as many wells are needed to produce the same amount of clean
energy as 20 years ago.
Less waste Retrieve the same amount of gas while producing 30% less waste than a
decade ago.
Fewer air emissions More efficient operations also means less energy consumption, and thus
less air emissions, per unit of natural gas produced.

Slide 7 Slide 7
U.S. Production from Shale Growing Rapidly Combination of horizontal drilling & hydraulic fracturing growing production US gas production from shale projected to grow 42% by 2020
Source: EnVantage, EIA
Bcf/d Bcf/d
Slide 8 Slide 8
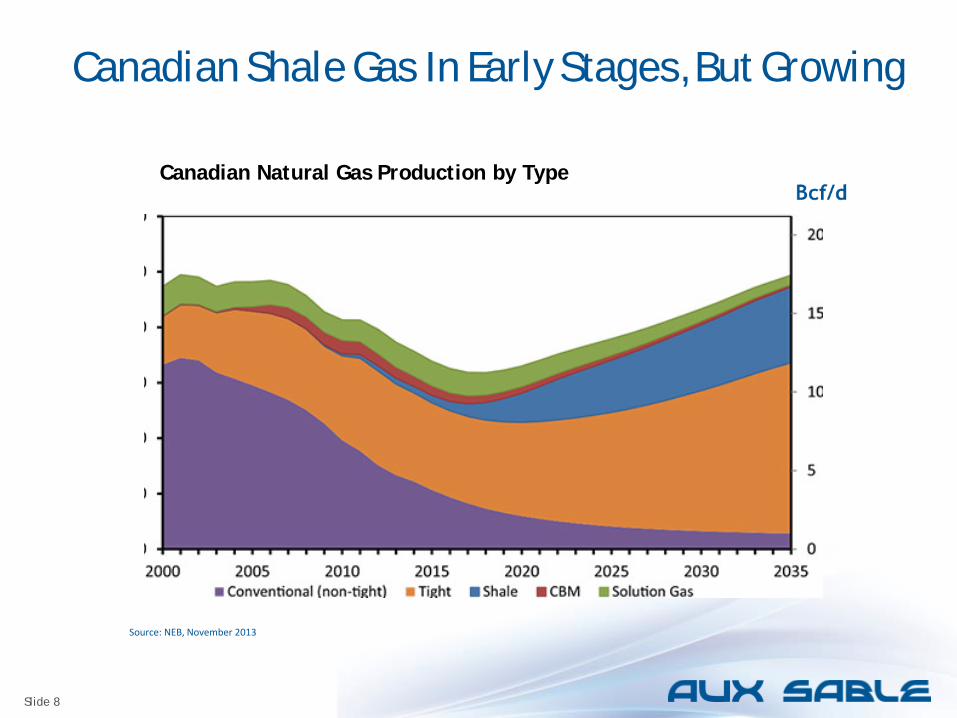
Canadian Shale Gas In Early Stages, But Growing
Source: NEB, November 2013
Canadian Natural Gas Production by Type

Slide 9 Slide 9
Business Environment With oil prices now below $60 we are in the midst of uncertain times in the oil and gas industry. The current decline in commodity prices is having an impact all around us.

Slide 10 Slide 10
Business Environment: What’s Going On WTI Spot Price (Dollars per Barrel)
Start of ~ 50% price decline
Source: U.S. EIA
Slide 11 Slide 11
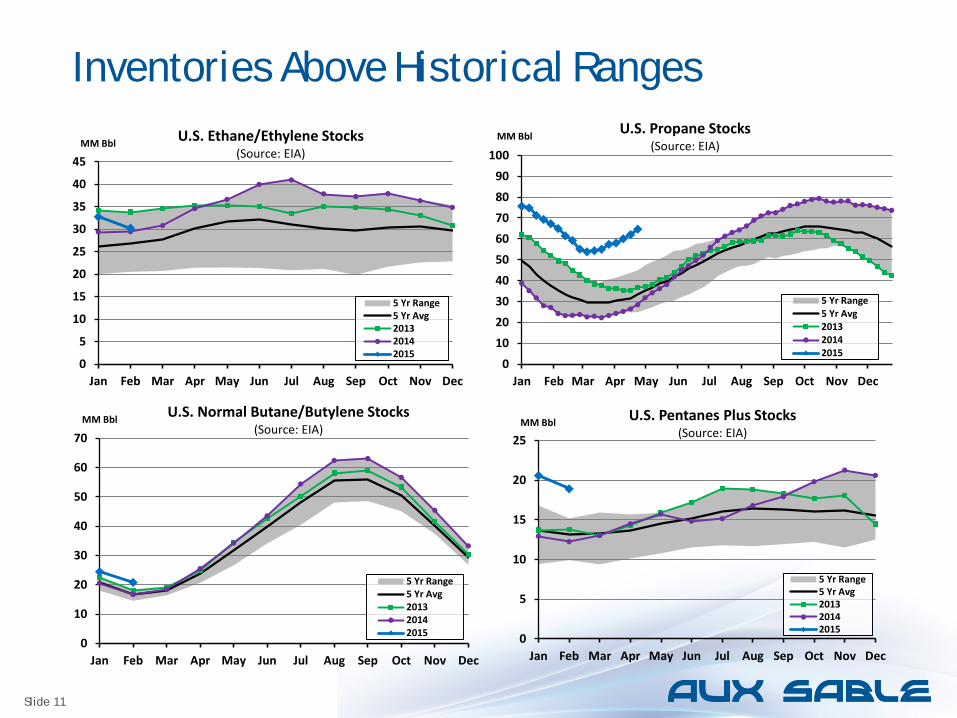
Inventories Above Historical Ranges
0
5
10
15
20
25
30
35
40
45
Jan Feb Mar Apr May Jun Jul Aug Sep Oct Nov Dec
MM Bbl U.S. Ethane/Ethylene Stocks (Source: EIA)
5 Yr Range5 Yr Avg201320142015
0102030405060708090
100
Jan Feb Mar Apr May Jun Jul Aug Sep Oct Nov Dec
MM Bbl U.S. Propane Stocks (Source: EIA)
5 Yr Range5 Yr Avg201320142015
0
10
20
30
40
50
60
70
Jan Feb Mar Apr May Jun Jul Aug Sep Oct Nov Dec
MM Bbl U.S. Normal Butane/Butylene Stocks (Source: EIA)
5 Yr Range5 Yr Avg201320142015 0
5
10
15
20
25
Jan Feb Mar Apr May Jun Jul Aug Sep Oct Nov Dec
MM Bbl U.S. Pentanes Plus Stocks (Source: EIA)
5 Yr Range5 Yr Avg201320142015

Slide 12 Slide 12
When Will Prices Rebound?
Sources: EnVantage, IHS
Slide 13 Slide 13
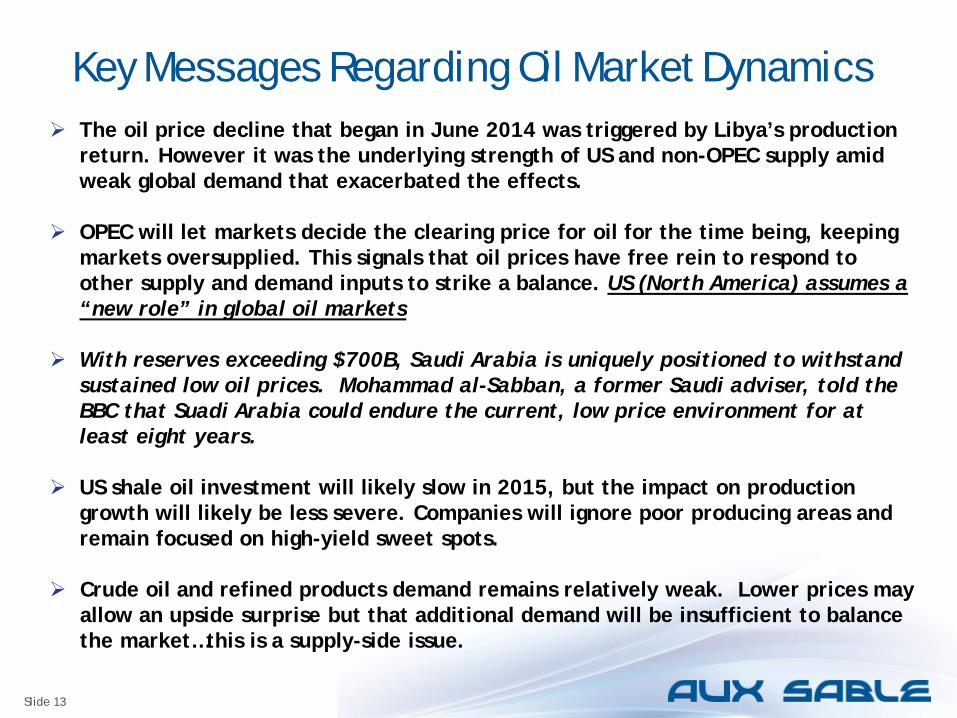
Key Messages Regarding Oil Market Dynamics The oil price decline that began in June 2014 was triggered by Libya’s production
return. However it was the underlying strength of US and non-OPEC supply amid weak global demand that exacerbated the effects.
OPEC will let markets decide the clearing price for oil for the time being, keeping
markets oversupplied. This signals that oil prices have free rein to respond to other supply and demand inputs to strike a balance. US (North America) assumes a “new role” in global oil markets
With reserves exceeding $700B, Saudi Arabia is uniquely positioned to withstand
sustained low oil prices. Mohammad al-Sabban, a former Saudi adviser, told the BBC that Suadi Arabia could endure the current, low price environment for at least eight years.
US shale oil investment will likely slow in 2015, but the impact on production
growth will likely be less severe. Companies will ignore poor producing areas and remain focused on high-yield sweet spots.
Crude oil and refined products demand remains relatively weak. Lower prices may
allow an upside surprise but that additional demand will be insufficient to balance the market…this is a supply-side issue.

Slide 14 Slide 14
NGL Market Expansion as a Result of Shale
Expansion of NGL Markets US markets gaining confidence that
NGLs will be available and competitively priced.
NGL consumption rising with plans to add more US petrochemical capacity to consume NGLs, particularly ethane.
Export markets for US NGLs expanding as global demand for NGLs grows.
Gas Surplus Production capability exceeding demand
Cheap Natural Gas Prices Relative to Crude and NGLs
Drilling Rich Shale Plays Value Uplift from NGLs and Condensates
Greater NGL Extraction Build Out of Processing Plants and NGL
Infrastructure
Source: Peter Fasullo, En*Vantage
Greater Gas Production Shale and Unconventional Gas Plays
Slide 15 Slide 15
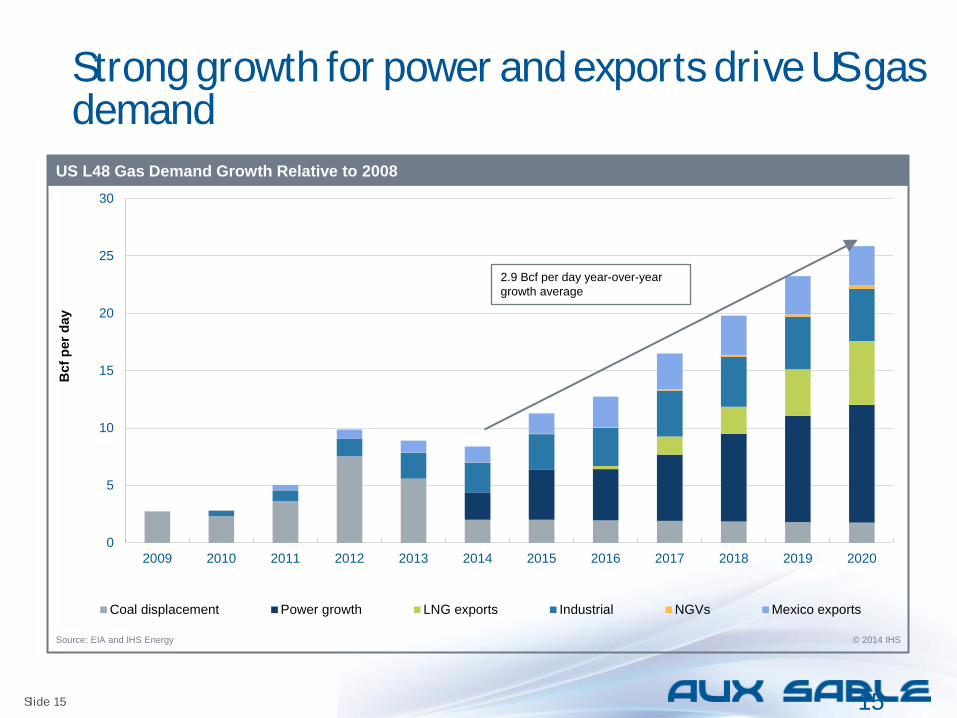
Strong growth for power and exports drive US gas demand
15
0
5
10
15
20
25
30
2009 2010 2011 2012 2013 2014 2015 2016 2017 2018 2019 2020
Coal displacement Power growth LNG exports Industrial NGVs Mexico exports
US L48 Gas Demand Growth Relative to 2008
Source: EIA and IHS Energy © 2014 IHS
Bcf
per
day
2.9 Bcf per day year-over-year growth average

Slide 16 Slide 16

Slide 17 Slide 17
The Importance of Market Access & Optionality Western Canada Demand
United States Demand
Source: Petral Consulting Company, Alberta Energy Regulator
Slide 18 Slide 18
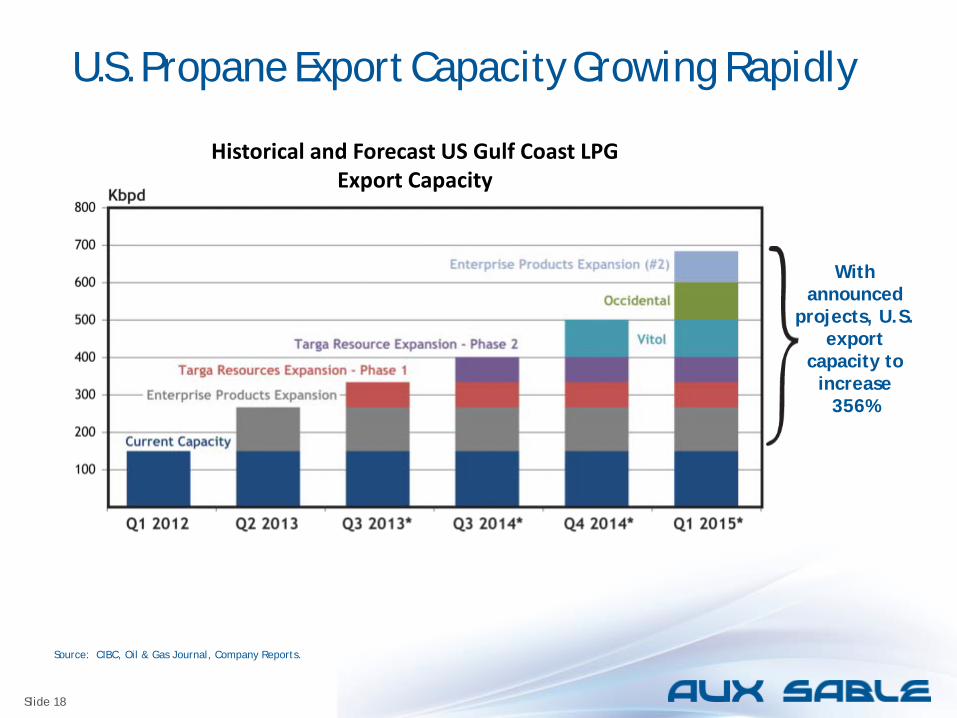
U.S. Propane Export Capacity Growing Rapidly Historical and Forecast US Gulf Coast LPG
Export Capacity
Source: CIBC, Oil & Gas Journal, Company Reports.
With announced
projects, U.S. export
capacity to increase
356%

Slide 19 Slide 19
Natural Gas: An Industrial Renaissance The abundance of stable priced natural gas has led to many American companies to revitalize their workforce and bring manufacturing operations back to America. Canada is also reaping the benefits of low-cost natural gas and increased NGL volumes with recent expansion announcements by NOVA Chemicals in Alberta and Ontario.
19

Slide 20 Slide 20
U.S. Economic Impacts of Shale Gas $930 Billion in Tax Revenues Cumulative to 2035
Nearly $1.9 Trillion in Capital Expenditure Between 2010 and 2035
Lower Energy Prices for Consumers Electricity prices average 10% lower
Households will save an average of $926 per year between 2012 and 2015
This savings will exceed $2,000 by 2035
Source: IHS, “Economic and Employment Contributions of Shale Gas in the United States.” 2011

Slide 21 Slide 21
Employment Contribution Jobs Associated with U.S. Unconventional Gas Production
0
500,000
1,000,000
1,500,000
2,000,000
2,500,000
3,000,000
2010 2015 2020 2025 2030 2035
Induced
Indirect
Direct
Source: IHS/ANGA, “The Economic and Employment Contributions of Unconventional Gas Development in State Economies”. July, 2012

Slide 22 Slide 22
Illinois Chamber Foundation Study New natural gas production from Southern Illinois shale has the potential to create more than 45,000 jobs in Illinois and $9 billion in economic investment, according to a study released by the Illinois Chamber Foundation. The New Albany shale formation could bring significant economic benefits to Illinois: 1,034 new jobs for the “low” scenario
10,337 new jobs for the “medium” scenario
47,312 new jobs for the “high scenario” (over $9.5 billion of economic impact for the state)
The study’s estimates do not include the economic impact of land leases that would be given to local landowners, or what could happen if exploration discovers extractable oil deposits.
Slide 23 Slide 23
Canadian Economic Impacts The oil and gas sector is a major contributor to the Canadian economy,
currently contributing more than 500 000 direct and indirect jobs across Canada.
The Canadian Energy Research Institute anticipates that the oil and gas industry will contribute more than $3.5 trillion to the Canadian economy over the next 25 years.
In 2013 the Canadian Energy Research Institute found significant benefits in developing Quebec’s shale gas resources over a 2021-2036 (under 500 MMcf/d and 1500 MMcf/d scenarios) period including:
Total Canadian GDP impact as a result of investment is estimated to be $37.3 billion and $112.0 billion
Canadian employee compensation is estimated to total $12.9 billion and $38.7 billion for the 500
Employment in Canada (direct, indirect and induced) is expected to grow by 293,000 and 880,000 person-years
Tax revenue in Québec from development of the Utica Shale is estimated to total $7.0 billion and $21.0 billion over the 25-year period
Sources: CERI 2013, NEB, NRCAN

Slide 24
Click to edit Master title style Click to edit Master text styles Second level
― Third level
• Fourth level
Slide 24
Aux Sable Channahon NGL Facilities Extraction: (2) 1.05 Bcf/d extraction trains
Fractionation: C2+: 107,000 bpd Storage: 200,000 bbls onsite (9 spheres) 170,000 bbls at Monee, Il (underground)
Pipelines: Own and operate NGL Pipelines connecting to local refineries, Enterprise, and ONEOK.
Rail: 16 spot rail rack served by CN & CSX 150 Rail Storage Yard
Truck: Propane Loading Terminal at Monee, IL Pipeline connections to ONEOK Truck Loading Terminal
Slide 25
Click to edit Master title style Click to edit Master text styles Second level
― Third level
• Fourth level
Slide 25
New Project Overview – Frac Expansion Aux Sable’s Rich Gas Acquisition Strategy has been very successful.
― We have been successful in attracting liquids-rich gas to our facility through Alliance.
― Changing drilling activity/economics in Western Canada and North Dakota, means that the gas we are attracting will continue to get richer (higher heat content).
An expansion of our fractionation facility (the area that processes mixed NGL streams into purity NGL products) is required to handle the liquids-rich gas coming into ASLP Channahon.
― The expansion is underpinned by the success of our recontracting strategy.
The Project Execution Plan has been thoroughly reviewed and the proper procedures are in place for seamless and safe execution of the project.
The Aux Sable project team is fully mobilized and all key fabrication and engineering partners are in place to begin immediate execution.
New product distribution options are being evaluated.
Slide 26
Click to edit Master title style Click to edit Master text styles Second level
― Third level
• Fourth level
Slide 26
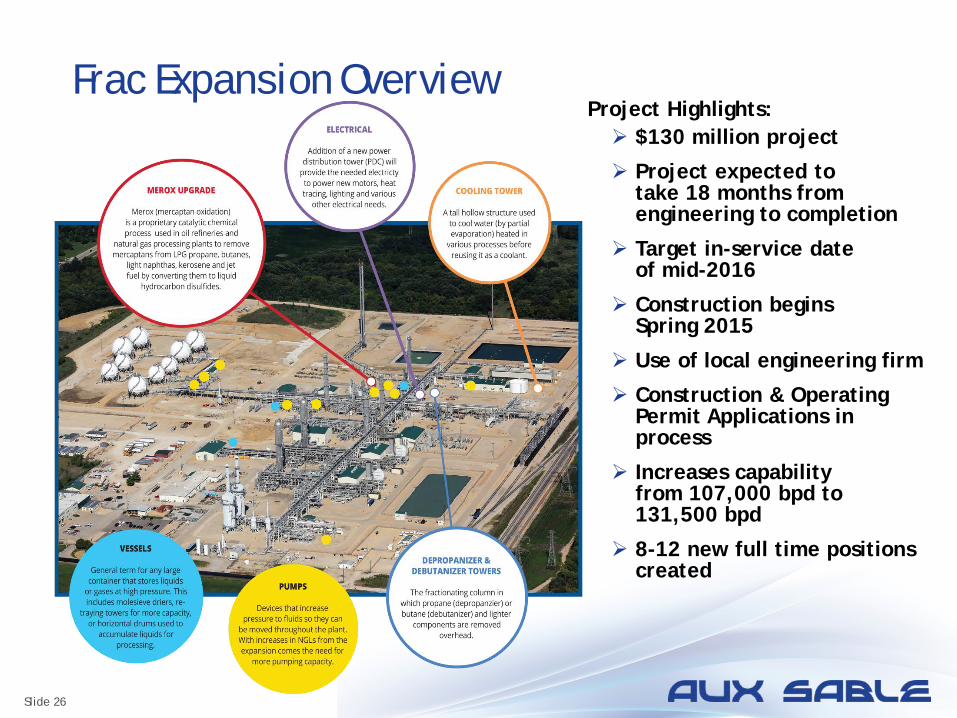
Frac Expansion Overview Project Highlights: $130 million project
Project expected to take 18 months from engineering to completion
Target in-service date of mid-2016
Construction begins Spring 2015
Use of local engineering firm
Construction & Operating Permit Applications in process
Increases capability from 107,000 bpd to 131,500 bpd
8-12 new full time positions created

Slide 27 Slide 27
Summary The Shale Revolution is transforming the U.S. and Canadian energy landscape: Robust production increases in natural gas and oil
Record NGL (ethane) supplies from gas processing
Historical build out of midstream infrastructure
A revitalized US petrochemical industry
A net exporter of hydrocarbon products
Development can and does happen in an safe and environmentally responsible manner.
The US is now one of the lowest cost producers of hydrocarbons in the World - a position that it has not enjoyed in decades
Leverage in World Markets The energy business is cyclical - downtrends are not new, in fact they tend to
occur every 4-7 years The length of energy cycles is variable; recovery periods seem to be getting
shorter driven by higher demand and higher marginal supply costs Aux Sable and Alliance Pipeline are strategically positioned to take advantage of
the growth in North America as a result of the shale revolution Jobs, Jobs, Jobs!


![Crude Assay Report · 15 Vacuum Gas Oil Cuts - Gas Oil [325-370°C] 15 16 Vacuum Gas Oil Cuts - Gas Oil 1[370 - 540°C] 16 17 Vacuum Gas Oil Cuts - Heavy Vacuum Gas Oil [370 - 548°C]](https://static.fdocuments.net/doc/165x107/5e68681c2598ff04995c67bc/crude-assay-report-15-vacuum-gas-oil-cuts-gas-oil-325-370c-15-16-vacuum-gas.jpg)