The Offshore-Intensity Ratio - Welcome to City · This paper presents the Offshore-Intensity Ratio...
19
CIYPERC Working Paper Series 2015/02 The Offshore-Intensity Ratio Identifying the Strongest Magnets for Foreign Capital Jan Fichtner City Political Economy Research Centre Department of International Politics City University London London, EC1V 0HB [email protected] @cityperc
Transcript of The Offshore-Intensity Ratio - Welcome to City · This paper presents the Offshore-Intensity Ratio...
CIYPERC Working Paper Series 2015/02
The Offshore-Intensity Ratio Identifying the Strongest Magnets for Foreign Capital
Jan Fichtner
City Political Economy Research Centre
Department of International Politics City University London
London, EC1V 0HB [email protected] @cityperc
The Offshore-Intensity Ratio:
Identifying the Strongest Magnets for Foreign Capital
Jan Fichtner
Goethe University Frankfurt
[email protected] | www.jfichtner.net
Abstract
This paper presents the Offshore-Intensity Ratio – a simple and straightforward way to identify which
countries and jurisdictions could be seen as offshore financial centres (OFCs). By setting the aggregated
amount of external capital booked in a jurisdiction in relation to the size of its domestic economy, we
get a ratio that expresses the strength with which the particular jurisdiction has acted as a magnet for
foreign capital. Sixteen jurisdictions are identified as probable OFCs, including the Cayman Islands, the
British Virgin Islands, Bermuda and Luxembourg, but also Ireland and the Netherlands. A novel
visualization shows the role of the largest offshore centres in contemporary global finance.
Keywords: Offshore Finance; Tax Havens; Foreign Capital; International Financial System
Introduction
During the last fifty years, offshore finance has evolved from a peripheral phenomenon to a
central constituent of contemporary capitalism. Offshore finance allows private investors and
corporations to escape taxation and regulation of the ‘onshore’ jurisdictions in which they live
and operate. Hence, offshore financial centres are virtually always both tax and regulatory
havens. In essence, these jurisdictions enable predominantly rich individuals (so called ‘high
net worth individuals’ or HNWIs) and large multinational corporations (MNCs) to be
‘elsewhere, ideally nowhere’ by creating legal spaces that escape existing regulations and
controls enacted by onshore countries (Palan and Nesvetailova 2014). Calculations by Zucman
(2013) have shown that private assets amounting to about USD 6 trillion are registered in
offshore financial centres (OFCs), three-quarters of which are unrecorded in official statistics.
According to estimates by Henry (2012), assets (financial and non-financial) in the amount of
USD 21-32 trillion could be located in tax havens. OFCs have also played an important role in
the global financial crisis, because they are central elements of the ‘shadow banking system’
(FSB 2014). Some OFCs have acted as legal domiciles for the creation of complex structured
financial products, such as collateralized debt obligations and other asset-backed securities.

2
These opaque financial products have contributed to the development of the financial crisis,
or at least to the aggravation of the crisis (Lysandrou and Nesvetailova 2015).
The measures taken by the G20 in 2009 to increase the regulation of offshore finance
have merely led to a relocation of assets between tax havens, but not to a general decline of
assets booked in OFCs (Johannesen and Zucman 2014). Rixen (2013) characterizes the reforms
implemented so far as largely symbolic and relatively ineffective measures that primarily serve
the political function to demonstrate state activity in this highly sensitive policy field to
national electorates. The fact that a far-reaching international regulation of OFCs has not
happened yet and that these tax havens potentially contribute to financial crises of great
magnitude suggests a high academic and societal relevance of research on offshore financial
centres. OFCs are not purely geographic or economic phenomena, however. At the core, the
topic of OFCs is about political sovereignty (Palan 1998, 2002; Palan et al. 2010). In fact, many
OFCs are dependent territories that use their (inner) sovereignty to attract financial activities
from abroad through low taxation and lax regulation. Hence, in most instances OFCs (and the
HNWIs and MNCs that primarily use them) benefit at the expense of onshore countries and
the majority of the population that do not utilize ‘offshore’ (Denault 2011; Shaxson 2011).
The international debate about offshore finance and its consequences has clearly been
intensifying in recent years. Increasingly it becomes more widely understood that offshore
finance is not a phenomenon that only pertains to small islands in exotic parts of the world.
On the contrary, geographically speaking many large OFCs are not located ‘off-shore’ but
onshore in North America (e.g. the US state of Delaware) or continental Europe. In November
2014, the International Consortium of Investigative Journalists (ICIJ) released a report that
quickly gained widespread media attention and became known as the ‘Luxembourg Leaks’
(Wayne and Carr 2014). The ICIJ report revealed that the Grand Duchy of Luxembourg helped
nearly 350 large MNCs to lower their global tax bills drastically, Amazon and IKEA for example.
These MNCs have channelled hundreds of billions of dollars through this tiny jurisdiction and
as a result saved billions of dollars in taxes elsewhere. Another example, which has drawn a
lot of attention in recent years is a tax construction known as the ‘Double Irish With a Dutch
Sandwich’ that reduces taxes for large MNCs (most prominently Apple) by shifting profits from
an Irish subsidiary to the Netherlands then back to Ireland and subsequently elsewhere, e.g.
to Caribbean tax havens (Duhigg and Kocieniewski 2012).
Measuring Offshore Financial Centres
Offshore finance has attracted increasing scholarly attention. However, which countries and
jurisdictions can be reliably identified as OFCs? There is still no universally accepted definition
of the term OFC. Most observers agree that a central characteristic of tax and regulatory
havens is that they seek to attract foreign capital through special legislation, which allows

3
foreigners to evade and escape taxation and regulation of their ‘home’ countries. However,
many analysts and organizations that have published lists of OFCs disagree which jurisdictions
precisely should be included (see Palan et al. 2010). A working definition that is well suited for
empirical research is from Zoromé (2007:7): ‘an OFC is a country or jurisdiction that provides
financial services to nonresidents on a scale that is incommensurate with the size and the
financing of its domestic economy.’ On the one hand, such an approach might seem a bit
simplistic, because it does not look into the jurisdictions to see if they specifically tried to
attract foreign capital by lowering their standards in order to attract external capital.
However, the simplicity of this approach is also its great advantage, because it leads to one
single ratio that is easy to compare with other jurisdictions. Zoromé based his analysis only on
data for portfolio investment, thus excluding the two segments of direct investment and
foreign bank deposits. I build on Zoromé’s approach, however I include these two important
segments of cross-border global finance. Together, foreign banking deposits, foreign direct
investment, and foreign portfolio investment constitute virtually the entire international (i.e.
cross-border) financial system – excluded are only reserve assets held by central banks and
derivatives, for which no comparative data are available and which are difficult to classify.
Using all three segments enables a better overview about the true scale of offshore finance.
Foreign portfolio investment is admittedly the largest of the three segments (USD 46.6 trillion
in 2013), but foreign direct investment (USD 27.9 trillion in 2013) and foreign bank deposits
(USD 21.6 trillion in 2013) are hardly insignificant (IMF 2015a, 2015b; BIS 2015a). Thus, in 2013
these three segments of cross-border global finance together amounted to USD 96.1 trillion –
more than 25 per cent larger than global GDP (USD 75.6 trillion).
I proceed as follows; for each jurisdiction, I aggregate the three segments of cross-border
finance to produce one value that combines all foreign capital that is booked in the particular
jurisdiction. In the next step, I divide this value by the GDP of the jurisdiction. The result is a
ratio that specifies the intensity with which any given jurisdiction acts as an OFC; this Offshore-
Intensity Ratio describes the strength of a jurisdiction to function as a magnet for foreign
capital. By setting the foreign capital that has been attracted to the particular jurisdiction in
relation to its domestic economy we get a ratio that is readily understandable and that can
easily be compared between different jurisdictions. Thus, the Offshore-Intensity Ratio is
complementary to the Financial Secrecy Index developed by the Tax Justice Network (TJN
2013a). The Financial Secrecy Index – combining a secrecy score with a global scale weight for
each jurisdiction – is a very valuable and thoroughly researched coefficient. However, the
Financial Secrecy Index most likely understates the role of some OFCs significantly, because –
similar to the approach by Zoromé – it only uses data pertaining to portfolio investment. The
distinction between portfolio investment and direct investment is an arbitrary one though.
The IMF defines direct investment as investment by a resident of one country in a
corporation that is resident in another country to have control or exert significant influence

4
over the management of that corporation (IMF 2015b). Direct investment comprises both
‘greenfield’ investment – the building of new facilities – as well as stakes in private or publicly
listed corporations, for example through cross-border mergers & acquisitions. Direct
investment is theorized to be longer term than portfolio investment. However, according to
the IMF, it is direct investment when an investor owns more than 10% of the voting rights of
a foreign corporation, below that threshold it is portfolio investment (IMF 2015b). The
threshold of 10% is completely arbitrary, however. Imagine the situation that an investor holds
11% of the voting rights of a foreign corporation but remains passive and does not attempt to
influence the management of the company. In this situation, the holdings would be classified
as direct investment. If, on the other hand, an activist investor such as a hedge fund owns a
stake of 9% in a foreign target firm and successfully influences the company to pay a special
dividend, initiate a share buy-back program or sell itself to another corporation, the holdings
would be treated as portfolio investment (see Fichtner 2013a, 2013b, 2015 for analyses of
hedge funds). Hence, there is no objective rationale for the arbitrary division between direct
and portfolio investment at the 10% threshold. Consequently, it makes sense to include direct
investment in an analysis of offshore finance. The cases of the Netherlands and Luxembourg,
the two eminent global direct investment conduits according to the IMF, will support this
argument later on in this paper. Similarly, the segment of foreign banking deposits should not
be excluded from our analysis, because jurisdictions such as the Cayman Islands, Ireland, and
others host very large amounts of foreign banking assets. This paper builds on a previous
publication, in which I have compiled a ratio for offshore-intensity using 2011 data only for
foreign portfolio investment and foreign banking assets (Fichtner 2014).
The structure of this paper is as such: I begin with the smallest segment, foreign bank
deposits, and present the most intensive jurisdictions and the amount of external capital they
have attracted. The next section covers foreign direct investment, followed by a section on
the largest of the three segments, foreign portfolio investment. Subsequently, I aggregate all
three segments and present the ‘Offshore-Intensity Ratio’ for the top forty global jurisdictions.
In the final section of the paper, I present a novel visualization showing the position of the
largest OFCs within the entire contemporary system of cross-border global finance.
Foreign Bank Deposits
To analyse cross-border banking activities, the locational banking statistics by the Bank for
International Settlement (BIS) are well suited. I use data on external deposits of reporting
banks vis-à-vis individual countries, covering all sectors (BIS 2015a). Table 1 provides an
overview of the forty most intensive countries and jurisdictions in the segment of external
banking assets. Data is presented for total foreign bank deposits (FBD), the GDP of the
jurisdiction, and finally for ‘Banking-Intensity’, the ratio of FBD divided by GDP.

5
Table 1 The 40 Most Intensive Jurisdictions in Foreign Bank Deposits 2013
Rank Jurisdiction (Sovereign country)
FBD (USD bn)
GDP (USD bn)
Banking-Intensity
1 Cayman Islands (UK) 1,640 2.7 607.4 2 West Indies UK1 230 3.3 69.7 3 Jersey (UK) 358 6.2 57.7 4 Marshall Islands (US) 11 0.2 55.0 5 Guernsey (UK) 122 3.6 33.9 6 Bahamas 210 8.4 25.0 7 Bermuda (UK) 84 5.6 15.0 8 Samoa 11 0.8 13.8 9 Luxembourg 765 60.1 12.7
10 Curaçao (NL) 61 5.6 10.9 11 Barbados 42 4.3 9.8 12 Isle of Man (UK) 58 6.7 8.7 13 Belize 13 1.6 8.1 14 Gibraltar (UK) 12 1.9 6.3 15 Liberia 10 2.0 5.0 16 Liechtenstein 18 6.2 2.9 17 Ireland 570 232.2 2.5 18 Malta 23 9.6 2.4 19 Panama 75 42.6 1.8 20 Hong Kong (China) 427 274.0 1.6 21 Mauritius 18 11.9 1.5 22 Cyprus 32 21.9 1.5 23 Singapore 448 297.9 1.5
24 United Kingdom 3,422 2,678.5 1.3 25 Switzerland 742 685.4 1.1 26 Macao (China) 51 51.8 1.0 27 Bahrain 32 32.9 1.0 28 Lebanon 40 44.4 0.9 29 Belgium 349 524.8 0.7 30 Netherlands 541 853.5 0.6 31 Libya 46 74.2 0.6 32 Turkmenistan 25 41.9 0.6
33 Sweden 262 579.7 0.5 34 Denmark 148 335.9 0.4 35 Kuwait 72 175.8 0.4 36 Germany 1,503 3,730.3 0.4 37 France 1,113 2,806.4 0.4 38 Jordan 13 33.7 0.4 39 Finland 86 267.3 0.3 40 Saudi Arabia 224 748.4 0.3
Source: BIS (2015a); World Bank (2015); statistical offices of various small jurisdictions. Note: Jurisdictions below USD10 billion have been disregarded due to their relative global insignificance.
1 West Indies UK comprises Anguilla, Antigua and Barbuda, British Virgin Islands, Montserrat, and St Kitts-Nevis.

6
Now, the question is which jurisdictions should be seen as OFCs? At which value of banking-
intensity can we say that – in the words of Zoromé – the financial sector catering to foreigners
is incommensurate for the size and the financing of the domestic economy? Zoromé himself
used the standard deviation to identify OFCs. However, he excluded ‘outliers’ such as
Luxembourg from his analysis. Cases with extreme values significantly distort statistical
measures such as the standard deviation. Moreover, there is no cogent reason that the
standard deviation can tell us what proportion of foreign capital is commensurate for the size
and the financing of an economy. In essence, we face the problem that there is no ‘objective’
value above which a jurisdiction could be unequivocally identified as an OFC. Thus, it is not
the purpose of this paper to find such a precise threshold. Instead, this paper seeks to pose
questions and stimulate a debate about this pivotal topic. In order to create a rough yardstick
for such a threshold I divide total global foreign bank deposits (USD 21.6 trillion) by global GDP
(USD 75.6 trillion). Hence, the result of 0.29 is the average global value of banking-Intensity in
2013. (Note that the median is about the same when we exclude jurisdictions with less than
USD 10 billion in external assets due to their relative insignificance on the global level.) There
are two dashed lines in Table 1. The first one is between Sweden and Turkmenistan; all
jurisdictions above this line (set in italics) have more than twice the average global foreign
bank deposits, i.e. banking-intensity values above 0.58. Hence, the foreign bank deposits of
the Netherlands, Switzerland or the United Kingdom could potentially be considered as
incommensurate and consequently it should be debated whether these countries could be
seen as OFCs. The second dashed line (between the United Kingdom and Singapore) marks
the threshold of five times the global average of external bank deposits, i.e. banking-intensity
values above 1.45. We can classify these jurisdictions, including Ireland, Luxembourg, and the
Bahamas with much greater confidence as OFCs.
The Cayman Islands is by far the most intensive jurisdiction in the segments of foreign
bank deposits; in 2013, deposits from abroad amounted to more than 607 times the GDP of
this tiny archipelago in the Caribbean. The Cayman Islands is also a very large international
banking jurisdiction in absolute terms. Approximately USD 1.64 trillion foreign bank deposits
have been booked there – more than in Germany or France. There is no space here to present
the fine details for every single jurisdiction; but for the Cayman Islands the majority of external
bank deposits originated from the US and Japan (the visualization presented below will
provide more detail about the main counterpart jurisdictions of the largest OFCs). As can be
seen in Table 1, the Cayman Islands is not an independent country but remains under the
sovereignty of the United Kingdom. The Cayman Islands, Bermuda, Gibraltar and others are
‘British Overseas Territories’; Jersey, Guernsey, and the Isle of Man are ‘Crown Dependencies’
– all these British dependencies have very high banking-intensity values. Hendry and Dickinson
(2011, p.12) characterize the position of these jurisdictions in international law as follows:
‘The overseas territories are plainly not independent sovereign states. Their external relations
7
remain the responsibility of the UK, the sovereign power. Accordingly, the UK is responsible
for each of the territories under international law.’ In legal terms, these territories could in
fact still be referred to as ‘colonies’ of the UK (ibid.). In a bizarre twist, however, the territories
are not constitutionally parts of the UK (or the EU), but under direct authority of the Crown.
The Queen also appoints the governor of each territory. Even though the British Overseas
Territories have their own judicial systems and enact most of their laws themselves, the final
court of appeal is the ancient Privy Council of Her Majesty (TJN 2013b). That the UK has
ultimate sovereignty over all these territories has been demonstrated conspicuously when in
2009 London suspended local government in Turks and Caicos Islands due to evidence for
widespread corruption (Reuters 2009). This peculiar pseudo-independent status of the British
Overseas Territories and Crown Dependencies, having semi-autonomy in areas such as fiscal
policy, but remaining dependent on the UK in foreign affairs and defence, seems to be
perfectly suited for the development of offshore finance, as OFCs need political, economic and
fiscal stability, and of course a stable currency. The Marshall Islands – the fourth most
intensive jurisdiction concerning foreign bank deposits – are located in the Pacific and became
formally independent in 1986, but are since then ‘in free association’ with the US, which also
uses the jurisdiction as a military base and provides financial aid.
In total, 23 jurisdictions should seriously be considered as OFCs, because they have
attracted banking deposits from abroad that are between 1.5 and 607 times the size of their
domestic economies. These enormous foreign bank deposits seem to be clearly out of
proportion for the size and the financing of these economies. The global extreme case is the
Cayman Islands, a small island jurisdiction that has a banking-intensity almost ten times that
of the second placed West Indies UK – a remnant of British colonial history strangely still used
for statistical purposes by the Bank of England and the Bank for International Settlements. The
West Indies UK comprise Anguilla, Antigua and Barbuda, British Virgin Islands, Montserrat,
and St Kitts-Nevis, and thus both formally independent former colonies and dependent
territories. Nine other jurisdictions (place 24 to 32) have attracted more than two times the
global average of foreign bank deposits. Thus, there should be an open debate about whether
the banking sectors of these jurisdictions that serve foreign clients should be considered as
disproportionate. Here the most interesting cases are clearly the United Kingdom and
Switzerland. The UK has attracted almost USD 3.5 trillion in external bank deposits – reflecting
the position of the City of London as the only true global financial centre besides Wall Street.
Switzerland, the traditional epitome of a banking centre catering to foreign clients is – perhaps
surprisingly to some – slightly less banking-intensive than the UK. Of course, it could be that
Switzerland significantly underreports external bank deposits. However, this caveat applies to
almost all jurisdictions that appear in Table 1, and the value of Swiss foreign bank deposits is
roughly in line with findings by Zucman (2013). The next segment is foreign direct investment,
which is almost thirty per cent larger than global foreign bank deposits.

8
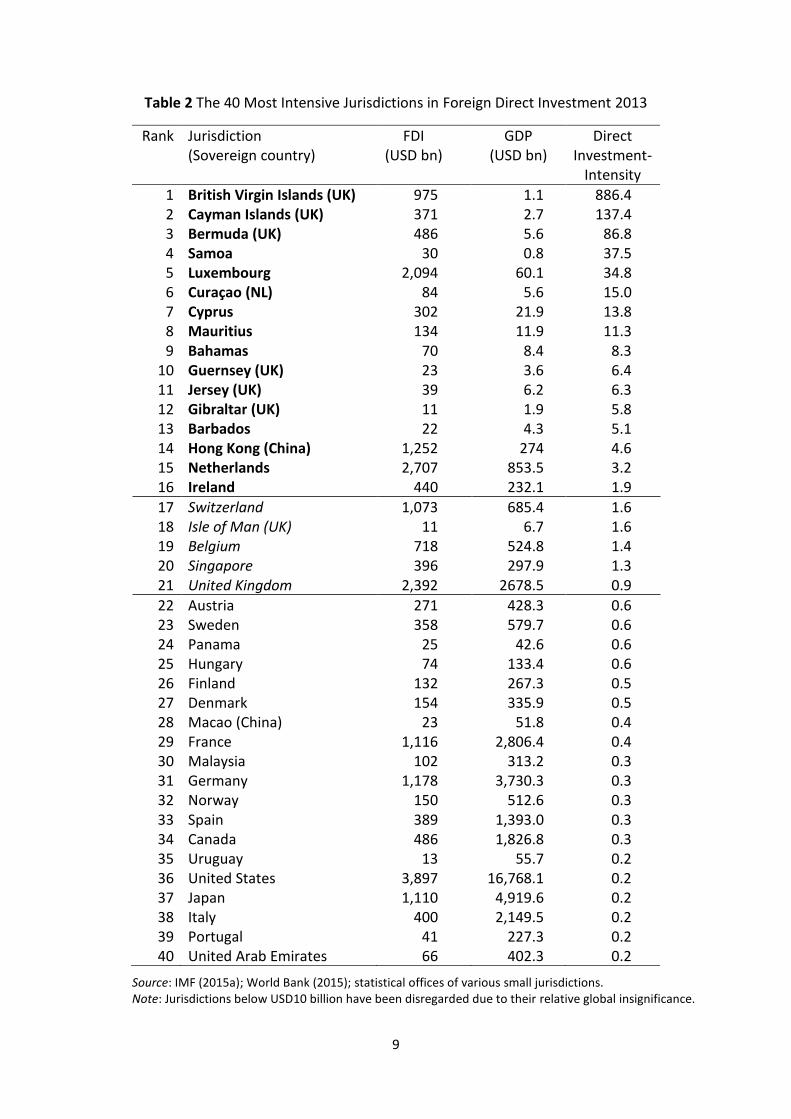
Foreign Direct Investment
According to the Coordinated Direct Investment Survey (CDIS) by the IMF, global foreign direct
investment amounted to USD 27.9 trillion in 2013, compared to global GDP of USD 75.6
trillion. Thus the simple global average of direct investment-intensity would be roughly 0.37
(median is 0.3 for jurisdictions with more than USD 10 billion in direct investment). Similar to
external bank deposits, we can see this value as a rough yardstick to gauge which jurisdictions
could be classified as OFCs in this segment. Again, there are two dashed lines in Table 2,
highlighting the thresholds of two times, respectively five times the global average. The top
16 jurisdictions have very high proportions of external capital to domestic GDP and should
clearly be seen as OFCs. Several dependent territories of the UK are the most intensive
jurisdictions in direct investment, occupying places one to three and ten to twelve. The British
Virgin Islands is by far the most intensive centre for foreign direct investment, primarily
functioning as a conduit (or ‘secrecy jurisdiction’) for Chinese direct investment in- and
outflows (also via Hong Kong). In a similar way, Mauritius (place eight) acts as a conduit for
Indian foreign direct investment. Luxembourg and the Netherlands are both very large and
very intensive centres for direct investment (note that the indirect data shown in Table 2 are
in fact understating the direct investment holdings of both countries significantly). They act as
the eminent global corporate havens; MNCs have routed trillions of dollars through these
conduit jurisdictions to save taxes elsewhere. Of course, there are also ‘legitimate’ holdings in
these numbers included, e.g. when a Belgian firm builds Dutch facilities. However, the very
high values of direct investment-intensity suggest that these holdings constitute only a tiny
share of the giant amounts of direct investment booked in these two conduits.
The category of ambiguous jurisdictions (place 17 to 21) this time only comprises five
jurisdictions, again including Switzerland and the UK. The high absolute amounts of direct
investment of both countries could be the result of the strong activity of MNCs in cross-border
mergers & acquisitions, which are part of direct investment. There are also many other
interesting aspects in Table 2, which can only be touched upon briefly in this paper. For
example, the Netherlands too have a dependent territory that acts as an OFC: Curaçao, a
remnant of the former Netherlands Antilles that were dissolved in 2010. Similar to the British
dependencies, Curaçao is part of the Kingdom of the Netherlands but has internal autonomy
to set tax rates. These British and Dutch colonial vestiges act as very intensive offshore
jurisdictions. Before we turn to the largest segment of cross-border global finance, portfolio
investment, it is important to note that I have used indirect data, e.g. the amount of direct
investment holdings for a jurisdiction that all participating counterpart economies have
reported to the IMF (CDIS Table 6 ‘Direct Investment Positions Cross-classified by Counterpart
Economies’). Most OFCs do not participate in the CDIS; thus, if we used the inward direct
investment positions reported only by participating jurisdictions, we would miss them.
9
Table 2 The 40 Most Intensive Jurisdictions in Foreign Direct Investment 2013
Rank Jurisdiction (Sovereign country)
FDI (USD bn)
GDP (USD bn)
Direct Investment-
Intensity
1 British Virgin Islands (UK) 975 1.1 886.4 2 Cayman Islands (UK) 371 2.7 137.4 3 Bermuda (UK) 486 5.6 86.8 4 Samoa 30 0.8 37.5 5 Luxembourg 2,094 60.1 34.8 6 Curaçao (NL) 84 5.6 15.0 7 Cyprus 302 21.9 13.8 8 Mauritius 134 11.9 11.3 9 Bahamas 70 8.4 8.3
10 Guernsey (UK) 23 3.6 6.4 11 Jersey (UK) 39 6.2 6.3 12 Gibraltar (UK) 11 1.9 5.8 13 Barbados 22 4.3 5.1 14 Hong Kong (China) 1,252 274 4.6 15 Netherlands 2,707 853.5 3.2 16 Ireland 440 232.1 1.9
17 Switzerland 1,073 685.4 1.6 18 Isle of Man (UK) 11 6.7 1.6 19 Belgium 718 524.8 1.4 20 Singapore 396 297.9 1.3 21 United Kingdom 2,392 2678.5 0.9
22 Austria 271 428.3 0.6 23 Sweden 358 579.7 0.6 24 Panama 25 42.6 0.6 25 Hungary 74 133.4 0.6 26 Finland 132 267.3 0.5 27 Denmark 154 335.9 0.5 28 Macao (China) 23 51.8 0.4 29 France 1,116 2,806.4 0.4 30 Malaysia 102 313.2 0.3 31 Germany 1,178 3,730.3 0.3 32 Norway 150 512.6 0.3 33 Spain 389 1,393.0 0.3 34 Canada 486 1,826.8 0.3 35 Uruguay 13 55.7 0.2 36 United States 3,897 16,768.1 0.2 37 Japan 1,110 4,919.6 0.2 38 Italy 400 2,149.5 0.2 39 Portugal 41 227.3 0.2 40 United Arab Emirates 66 402.3 0.2
Source: IMF (2015a); World Bank (2015); statistical offices of various small jurisdictions. Note: Jurisdictions below USD10 billion have been disregarded due to their relative global insignificance.

10
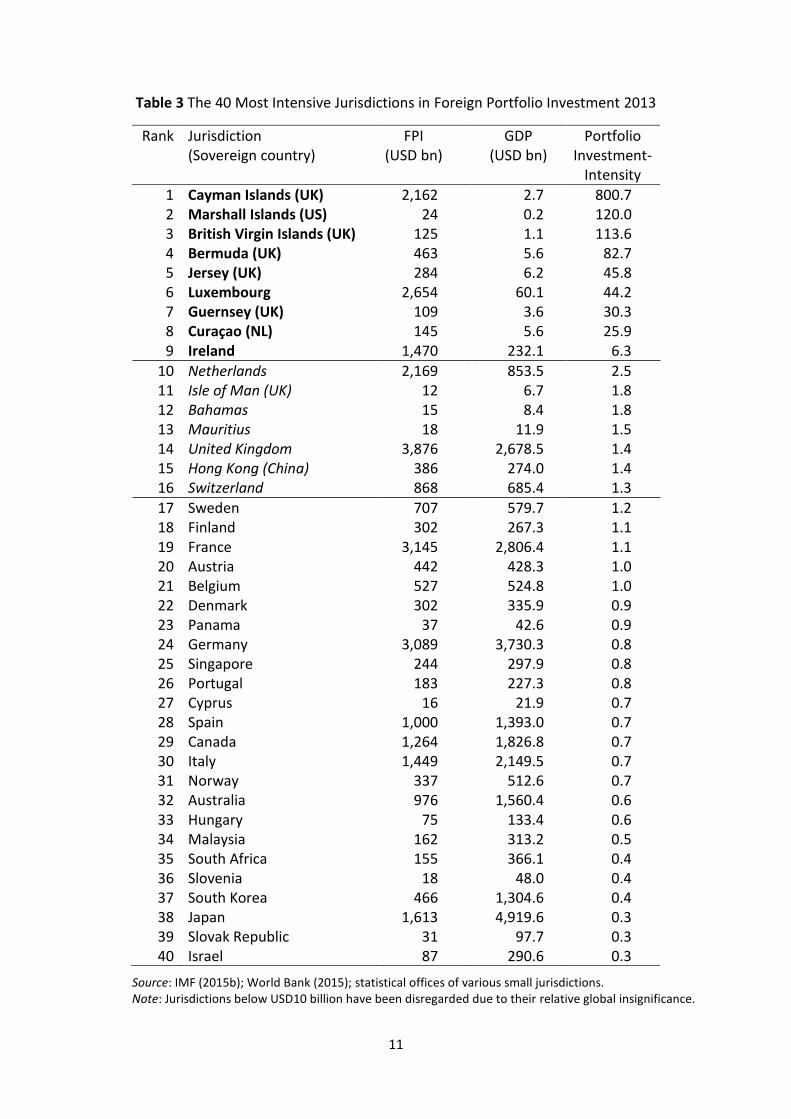
Foreign Portfolio Investment
The approach to use indirect data is also useful for the largest of the three segments of cross-
border global finance, foreign portfolio investment (which consists mostly of shares and
bonds). The Coordinated Portfolio Investment Survey (CPIS) by the IMF is a good data source
on cross-border holdings of portfolio investment. Specifically, this paper uses derived portfolio
investment liabilities. Both Zoromé (2007) and the Financial Secrecy Index (TJN 2013a) use
data on portfolio investment assets reported directly by the participating jurisdictions.
However, many OFCs either underreport to the IMF or do not report at all (e.g. the British
Virgin Islands). The extreme case of underreporting is the Cayman Islands that does not
include the vast hedge fund sector in its reported portfolio investment assets and thus only
reports assets of about USD 50 billion instead of over USD 2 trillion. The TJN has aptly called
this the ‘Cayman discrepancy’ and developed an adjustment procedure. However, this
adjustment still seems to understate the scale of the Cayman Islands in global offshore finance
significantly. The global scale weight of the Cayman Islands calculated by the TJN is only about
40% of the scale weight of Luxembourg. According to the CPIS values presented in Table 3,
however, the Cayman Islands has about 80% of the scale of Luxembourg. Similarly, the TJN
scale weight for Switzerland is slightly larger than that of the Cayman Islands, whereas
according to the CPIS data Cayman has more than twice the scale of Switzerland. The
differences between the data presented here and those by the TJN and Zoromé most likely
stem from the fact that they compare yearly flows (trade in financial services of the particular
jurisdiction) with flows (GDP of the jurisdiction), whereas this paper compares accumulated
stocks (amounts of foreign capital) with yearly flows (GDP). Of course, it might seem more
precise to compare flows with flows, but this paper is more interested in giving a broad
overview about the intensity with which different jurisdictions have acted as OFCs than in
precision. The stocks of accumulated foreign assets (measured indirectly by derived liabilities)
are a good proxy of the size of the financial sector that has catered to non-residents. Thus, the
approaches by the TJN and Zoromé, and this one are not competitive but complementary.
In 2013, total global foreign portfolio investment amounted to USD 46.6 trillion, almost
as much as external bank deposits and direct investment combined. Only nine jurisdictions
are above the threshold of five times the global average of foreign portfolio investment to
GDP (3.1 in 2013). Five of these nine jurisdictions are under British sovereignty; the Cayman
Islands is by far the most intensive jurisdiction in the world, as foreign portfolio investment
amounts to 800 times the size of domestic GDP. The reason for this extreme value of portfolio-
intensity is the fact that the Cayman Islands is the global jurisdiction of choice for the hedge
fund industry with about 50 per cent of all hedge funds having their legal domicile in this
British dependency (see Fichtner 2014). Luxembourg is the second largest global centre for
mutual funds and Ireland is a preferred jurisdiction for money market funds (Zucman 2013).
11
Table 3 The 40 Most Intensive Jurisdictions in Foreign Portfolio Investment 2013
Rank Jurisdiction (Sovereign country)
FPI (USD bn)
GDP (USD bn)
Portfolio Investment-
Intensity
1 Cayman Islands (UK) 2,162 2.7 800.7 2 Marshall Islands (US) 24 0.2 120.0 3 British Virgin Islands (UK) 125 1.1 113.6 4 Bermuda (UK) 463 5.6 82.7 5 Jersey (UK) 284 6.2 45.8 6 Luxembourg 2,654 60.1 44.2 7 Guernsey (UK) 109 3.6 30.3 8 Curaçao (NL) 145 5.6 25.9 9 Ireland 1,470 232.1 6.3
10 Netherlands 2,169 853.5 2.5 11 Isle of Man (UK) 12 6.7 1.8 12 Bahamas 15 8.4 1.8 13 Mauritius 18 11.9 1.5 14 United Kingdom 3,876 2,678.5 1.4 15 Hong Kong (China) 386 274.0 1.4 16 Switzerland 868 685.4 1.3
17 Sweden 707 579.7 1.2 18 Finland 302 267.3 1.1 19 France 3,145 2,806.4 1.1 20 Austria 442 428.3 1.0 21 Belgium 527 524.8 1.0 22 Denmark 302 335.9 0.9 23 Panama 37 42.6 0.9 24 Germany 3,089 3,730.3 0.8 25 Singapore 244 297.9 0.8 26 Portugal 183 227.3 0.8 27 Cyprus 16 21.9 0.7 28 Spain 1,000 1,393.0 0.7 29 Canada 1,264 1,826.8 0.7 30 Italy 1,449 2,149.5 0.7 31 Norway 337 512.6 0.7 32 Australia 976 1,560.4 0.6 33 Hungary 75 133.4 0.6 34 Malaysia 162 313.2 0.5 35 South Africa 155 366.1 0.4 36 Slovenia 18 48.0 0.4 37 South Korea 466 1,304.6 0.4 38 Japan 1,613 4,919.6 0.3 39 Slovak Republic 31 97.7 0.3 40 Israel 87 290.6 0.3
Source: IMF (2015b); World Bank (2015); statistical offices of various small jurisdictions. Note: Jurisdictions below USD10 billion have been disregarded due to their relative global insignificance.
12
Six jurisdictions (places 10 to 16) are ambiguous; they have portfolio-intensity values of over
two times the global average (1.24 in 2013) but less than the more decisive threshold of five
times. Hence, jurisdictions such as the Netherlands, the United Kingdom, Hong Kong, and
Switzerland could potentially be considered as OFCs, but the situation is not that clear. Note
that in the segment of portfolio investment the median of 0.5 is lower than the simple global
average of 0.62 – even if we disregard jurisdictions that have less than USD 10 billion in foreign
assets due to their relative unimportance in the international context.
The Offshore-Intensity Ratio
Now we are in a positon to aggregate the three segments of foreign bank deposits, foreign
direct investment and foreign portfolio investment, in order to achieve a truly broad and
comprehensive overview about the role of different jurisdictions in offshore finance. For each
jurisdiction, I combine the three segments of cross-border finance to produce one value that
aggregates all external capital that is booked in the particular jurisdiction. Then, this value is
divided by the GDP of the jurisdiction. The result is a ratio that specifies the intensity with
which any given jurisdiction has acted as an OFC. Thus, the Offshore-Intensity Ratio describes
the strength of a jurisdiction to function as a magnet for foreign capital. By setting the foreign
capital that has been attracted to the particular jurisdiction in relation to its domestic
economy we get a ratio that is readily understandable and that can easily be compared
between different jurisdictions. As mentioned above, in 2013 the three segments of cross-
border global finance together amounted to USD 96.1 trillion. This is more than 25 per cent
larger than global GDP (USD 75.6 trillion). Hence, the simple global average is roughly 1.27;
the median is slightly lower at 1.0. It is extremely difficult to say which value of offshore-
intensity is ‘normal’ for a jurisdiction. Values that are between the median of 1.0 and the
global average of 1.27 could very likely be considered as commensurate for the size and the
financing of the domestic economy. As shown in Table 4, countries such as Italy, the United
States, Canada, Spain, and Norway fall in this category. Above two times the simple global
average of aggregated foreign assets (2.54) it is doubtful that the foreign assets can still be
considered as commensurate. Hence, countries such as Belgium, the United Kingdom,
Singapore and Switzerland could already be seen as OFCs, but clearly more research and a
much more intense debate about this is needed. Jurisdictions that have Offshore-Intensity
Ratios above five times the simple global average (6.35) have a very high probability to be
OFCs. Perhaps surprisingly to some, the Netherlands (with a value of exactly 6.35) could thus
be considered an offshore financial centre. This is mainly due to the enormous amounts of
foreign direct investment that have been routed through this country; the Offshore-Intensity
Ratio for the Netherlands would have been even much higher if the officially reported direct
investment assets had been used instead of the indirectly measured direct investment.

13
Table 4 The 40 Most Intensive Jurisdictions in Cross-border Global Finance 2013
Rank Jurisdiction (Sovereign country)
Foreign Assets
(USD bn)
GDP (USD bn)
Offshore-Intensity
Ratio
1 Cayman Islands (UK) 4,173 2.7 1,545.6 2 British Virgin Islands (UK) 1,177 1.1 1,070.0 3 Marshall Islands (US) 40 0.2 200.0 4 Bermuda (UK) 1,033 5.6 184.5 5 Jersey (UK) 681 6.2 109.8 6 Luxembourg 5,513 60.1 91.7 7 Guernsey (UK) 254 3.6 70.6 8 Curaçao (NL) 290 5.6 51.8 9 Bahamas 295 8.4 35.1
10 Barbados 71 4.3 16.5 11 Cyprus 350 21.9 16.0 12 Mauritius 170 11.9 14.3 13 Isle of Man (UK) 81 6.7 12.1 14 Ireland 2,480 232.1 10.7 15 Hong Kong (China) 2,065 274.0 7.5 16 Netherlands 5,417 853.5 6.3
17 Liechtenstein 32 6.2 5.2 18 Switzerland 2,683 685.4 3.9 19 Singapore 1,088 297.9 3.7 20 United Kingdom 9,690 2,678.5 3.6 21 Panama 137 42.6 3.2 22 Belgium 1,594 524.8 3.0
23 Sweden 1,327 579.7 2.3 24 Finland 520 267.3 1.9 25 France 5,374 2,806.4 1.9 26 Austria 805 428.3 1.9 27 Denmark 604 335.9 1.8 28 Germany 5,770 3,730.3 1.6 29 Macao (China) 76 51.8 1.5 30 Bahrain 41 32.9 1.3 31 Portugal 287 227.3 1.3 32 Hungary 160 133.4 1.2 33 Norway 602 512.6 1.2 34 Spain 1,593 1,393.0 1.1 35 Lebanon 49 44.4 1.1 36 Canada 2,002 1,826.8 1.1 37 United States 16,745 16,768.1 1.0 38 Italy 2,105 2,149.5 1.0 39 Malaysia 292 313.2 0.9 40 Australia 1,334 1,560.4 0.9
Source: Calculations by the author based on Tables 1 – 3. Note: Jurisdictions below USD30 billion have been disregarded due to their relative global insignificance. Foreign assets of British Virgin Islands contain one third of the banking assets of West Indies UK.
14
Hong Kong (on place 15) with an Offshore-Intensity Ratio of 7.5 could also be seen as an OFC,
however here we have to take into account that this jurisdiction primarily acts as a conduit
financial centre for China and not as a truly global OFC. Ireland has a high Offshore-Intensity
Ratio of 10.7 and in each of the three segments studied in this paper, Ireland has been above
the threshold of five times the global average of foreign capital. Thus, Ireland should clearly
be seen as an OFC. Mauritius mainly acts as an OFC for India, and Cyprus fulfils this role for
Russia. Both jurisdictions are quite small in global perspective, however. Luxembourg on place
six is both a very large international financial centre (over USD 5.5 trillion foreign capital) and
a very intensive OFC – the external assets booked in the Grand Duchy are over 90 times as
large as the GDP of this small state. All of the top eight most intensive OFCs in the world are
dependent territories (except Luxembourg). Guernsey and Curaçao are medium-sized OFCs
with external assets between USD 250 and 300 billion. The British Crown Dependency of
Jersey has attracted almost USD 700 billion in foreign capital and an Offshore-Intensity Ratio
of over 100. Both Jersey and Guernsey mainly act as OFCs for the United Kingdom (i.e. the City
of London) but also for the United States. The British Overseas Territory of Bermuda has over
USD 1 trillion in external capital and primarily functions as a conduit jurisdiction for US foreign
direct and portfolio investment. The Offshore-Intensity Ratio of over 180 signals a very
intensive OFC. The Marshall Islands on place three have made it barely over the threshold of
USD 30 billion under which I consider jurisdictions too small to matter in the global context.
The jurisdiction became formally independent in 1986 but is de facto dependent on the United
States, which provides aid payments and also maintains a military base on the archipelago, as
mentioned above. Not surprisingly then, the Marshall Islands almost exclusively cater to US
investors. Much more interesting is the British Virgin Islands (another British Overseas
Territory), which in 2013 has been the second most intensive OFC in the world. Comparably
to Bermuda, the British Virgin Islands has about USD 1 trillion of foreign capital, but the
structure of the OFCs is completely different. The British Virgin Islands acts almost exclusively
as a secrecy jurisdiction for foreign direct investment – the largest counterpart economy by
far is China (both the mainland and Hong Kong) followed by Russia. The Offshore-Intensity
Ratio of the British Virgin Islands of over 1,000 is much higher than that of Bermuda because
the domestic economy is only about one-fifth the size of Bermuda and thus the denominator
is much lower. Finally, we have the Cayman Islands as the most intensive OFC in the world by
far with an Offshore-Intensity Ratio of over 1,500. This is both due to a relatively small GDP
and a very high amount of foreign capital (over USD 4 trillion) that has been attracted to this
tax and regulatory haven under British sovereignty (mainly via hedge funds). The two largest
counterpart countries of the Cayman Islands are the United States and Japan. In the following
section, I present a novel visualization of the position that the largest OFCs occupy in the
contemporary system of cross-border global finance, clearly showing the main counterpart
jurisdictions that have utilised offshore finance.

15
Visualizing the Position of the Largest OFCs in Global Finance
Figure 1 shows the bilateral financial relations between the largest 34 jurisdictions of cross-
border global finance aggregating the 2012 data for foreign bank deposits, foreign direct
investment and foreign portfolio investment. The bilateral financial relations visualised here
amount to USD 81.6 trillion. Jurisdictions that most likely do not act as OFCs (or ‘onshore’
countries) are shown in grey; jurisdictions that could potentially be seen as OFCs (having
Offshore-Intensity Ratios of over two times the global average in 2013) are shown in yellow;
and jurisdictions with Offshore-Intensity Ratios of over five (that in all likelihood should be
seen as OFCs) are coloured red. The size of the jurisdictions derives from the value of financial
relations with the other 33 countries and territories; in other words, the magnitude of the
spheres in the visualization is equivalent to the sum of all their bilateral relations in the field
of cross-border global finance. The largest jurisdictions are placed at the centre of the
visualization; the smaller ones are moved to the periphery.
Figure 1 The Position of the Largest OFCs in Cross-border Global Finance in 2012
Source: Author based on BIS (2015b), IMF (2015a, 2015b).
16
I add the two bilateral financial relations (e.g. US investment in the UK and vice versa) to get
one value describing the scale of bilateral financial activity. This procedure reduces the detail
of the graph but enhances clarity significantly. The purpose of Figure 1 is not to give the
greatest possible amount of detail, but to provide a broad and comprehensive overview. This
visualization clearly shows two important things: 1) The United States is still the dominant
country in cross-border global finance – US centrality is supported by the US-UK axis being the
largest bilateral financial relation on the planet with almost USD 4.7 trillion in 2012, and by
the strong integration of Japan in Anglo-American structures of international finance (also via
the Cayman Islands); 2) large offshore financial centres, such as the Netherlands, Luxembourg,
Ireland, Hong Kong, the Cayman Islands, Bermuda, and the British Virgin Islands play a central
role in contemporary cross-border global finance.
Conclusion
The Offshore-Intensity Ratio is a very simple and straightforward way to identify which
countries and jurisdictions could be seen as offshore financial centres. By setting the
aggregated amount of external assets that has been attracted in relation to the size of the
domestic economy we get a ratio that expresses the strength with which the particular
jurisdiction has acted as a magnet for foreign capital. It is not the purpose of this paper to
establish exact thresholds for identifying offshore financial centres, for there are no ‘objective’
thresholds. Instead, there has to be an intense academic and public discussion about this
pivotal topic. The data presented in Tables 1 – 4 as well as in the novel visualization of global
finance show that a relatively small number of offshore financial centres are responsible for
the majority of offshore financial activities. These jurisdictions include the Netherlands,
Luxembourg, the Cayman Islands, Bermuda and others. Many mainstream economists still
argue against a stricter regulation of offshore finance on the grounds that due to its high
mobility, capital would supposedly just shift to another jurisdiction to evade regulatory
measures. The findings of this paper, however, suggest that a stricter regulation of a few key
offshore jurisdictions could have a very significant effect, because certain segments of global
finance (e.g. direct investment in the Netherlands and Luxembourg) or specific financial actors
(such as hedge funds in the case of the Cayman Islands or money market funds in Ireland) are
strongly concentrated there.

17
Bibliography
BIS (2015a) ‘Locational banking statistics’, accessed at http://www.bis.org/statistics/bankstats.htm, 28 August 2015.
------- (2015b) ‘Consolidated banking statistics’, accessed at http://www.bis.org/statistics/consstats.htm, 28 August 2015.
Deneault, A. (2011) Offshore: Tax Havens and the Rule of Crime. New York: The New Press.
Duhigg and Kocieniewski (2012) ‘How Apple Sidesteps Billions in Taxes’, The New York Times, accessed at http://www.nytimes.com/2012/04/29/business/apples-tax-strategy-aims-at-low-tax-states-and-nations.html, 28 August 2015.
Fichtner, J. (2013a) The Rise of Hedge Funds: A Story of Inequality. Momentum Quarterly, Vol. 2, No. 1, pp. 3-20.
------- (2013b) Hedge Funds: Agents of Change for Financialization. Critical Perspectives on International Business, Vol. 9, No. 4, pp. 358-376.
------- (2014) Privateers of the Caribbean: The Hedge Funds-US-UK-Offshore Nexus. Competition & Change, Vol. 18, No. 1, pp. 37-53.
------- (2015) Rhenish capitalism meets activist hedge funds: Blockholders and the impact of impatient capital. Competition & Change, Vol. 19, No. 4, pp. 336-352.
FSB (2014) ‘Global Shadow Banking Monitoring Report 2014’, accessed at http://www.financialstabilityboard.org/wp-content/uploads/r_141030.pdf, 19 August 2015.
Hendry, I. and Dickinson, S. (2011) British Overseas Territories Law. Oxford: Hart Publishing.
Henry (2012) The Price of Offshore Revisited, accessed at http://www.taxjustice.net/cms/upload/pdf/Price_of_Offshore_Revisited_120722.pdf, 28 August 2015.
IMF (2015a) ‘Coordinated Direct Investment Survey’, accessed at http://cdis.imf.org, 28 August 2015.
------- (2015b) ‘Coordinated Portfolio Investment Survey’, accessed at http://cpis.imf.org, 28 August 2015.
Johannesen, N. and Zucman, G. (2014) The End of Bank Secrecy? An Evaluation of the G20 Tax Haven Crackdown. American Economic Journal: Economic Policy, 6 (1), 65-91.
Lysandrou, P. and Nesvetailova, A. (2015) The role of shadow banking entities in the financial crisis: a disaggregated view. Review of International Political Economy, 22 (2), 257-279.
Palan, R. (1998) Trying to Have Your Cake and Eating It: How and Why the State System Has Created Offshore. International Studies Quarterly, 42 (4), 625-643.
------- (2002) Tax Havens and the Commercialization of State Sovereignty. International Organization, 56 (1), 151-176.
Palan, R., Murphy, R. and Chavagneux, C. (2010) Tax Havens: How Globalization Really Works. Ithaca: Cornell University Press.

18
Palan, R. and Nesvetailova, A. (2014) Elsewhere, Ideally Nowhere: Shadow Banking and Offshore Finance. CITYPERC Working Paper Series, No. 2014-01.
Reuters (2009) ‘Britain Suspends Government in Turks and Caicos Islands’, accessed at http://www.reuters.com/article/2009/08/14/us-britain-turkscaicos-idUSTRE57D3LN200 90814, 28 August 2015.
Rixen, T. (2013) Why reregulation after the crisis is feeble: Shadow banking, offshore financial centers, and jurisdictional competition. Regulation & Governance, 7 (4), 435-459.
Shaxson, N. (2011) Treasure Islands: Tax Havens and the Men Who Stole the World. London: The Bodley Head.
TJN (2013a) Financial Secrecy Index – 2013 Results, accessed at http://www.financialsecrecyindex.com/introduction/fsi-2013-results, 28 August 2015.
------- (2013b) Financial Secrecy Index – Narrative Report on United Kingdom, accessed at http://www.financialsecrecyindex.com/PDF/UnitedKingdom.pdf, 28 August 2015.
Wayne and Carr (2014) ‘Lux Leaks’ Revelations Bring Swift Response Around World, accessed at http://www.icij.org/project/luxembourg-leaks/lux-leaks-revelations-bring-swift-resp onse-around-world, 28 August 2015.
World Bank (2015) The World Bank DataBank, accessed at http://databank.worldbank.org/data/home.aspx, 28 August 2015.
Zucman (2013) The Missing Wealth of Nations, Are Europe and the U.S. net Debtors or net Creditors? Quarterly Journal of Economics, 2013, 128 (3), 1321-1364.


![Preoperative neoadjuvant chemotherapy using nanoparticle … · 2017. 8. 24. · by the ratio of actual total dose intensity (ATDI) to planned total dose intensity (PTDI) [18]. Response](https://static.fdocuments.net/doc/165x107/610394b8d3addf540b527b05/preoperative-neoadjuvant-chemotherapy-using-nanoparticle-2017-8-24-by-the-ratio.jpg)
![Analysis of offshore turbulence intensity comparison with … · [4] S. Emeis, ”Wind Energy Meteorology. Atmospheric Physics for Wind Power Generation”, Springer, 2012 Atmospheric](https://static.fdocuments.net/doc/165x107/5edaeee309ac2c67fa688a79/analysis-of-offshore-turbulence-intensity-comparison-with-4-s-emeis-awind.jpg)