The official poverty monitoring system (PMS) in the Philippines relies mainly on family income and...
315
The Many Faces of Poverty Volume 9
Transcript of The official poverty monitoring system (PMS) in the Philippines relies mainly on family income and...

The Many Faces of
PovertyVolume 9

The Many Faces of
PovertyVolume 9

The Many Faces of Poverty: Volume 9Copyright © CBMS Network Office, 2018
ALL RIGHTS RESERVED.No part of this publication may be reproduced, stored in a retrievalsystem, or transmitted in any form or by any means—whether virtual,electronic, mechanical, photocopying, recording, or otherwise—without the written permission of the copyright owner.
Published by De La Salle University Publishing House for the CBMS Network Team
First printing, 2018
Published and distributed byDe La Salle University2401 Taft Avenue, Manila, Philippines 1004Tel. No: (632) 524-4611 loc. 271Telefax: (632) 523-4281Email: [email protected]: www.dlsu.edu.ph
The De La Salle University Publishing House is the publications officeof De La Salle University, Manila, Philippines
Printed in the Philippines
Pr ep a r ed b yCelia M. ReyesAnne Bernadette E. MandapJasminda A. QuilitisSteffie Joi I. CalubayanJezha Lee Z. NabiongNastasha Brigitte M. KuanCarmela A. PredoKristine T. Madreliño
Cover design © Ariel Manuel, 2018Photos used for the cover are entries from previous CBMS Special Awards events.
The CBMS Network Team would like to acknowledge the excellent technical assistance ofMs. Rachelle Gladys Audar for the preparation of this publication.

CONTENTS
Foreword
Introduction
Explanatory Text
The Many Faces of Poverty
Province of Aurora
Province of Occidental Mindoro
Province of Romblon
Province of Ifugao
i
Province of Tarlac
1
4
9
95
141
181
235
CONTENTS
Province of Camiguin55

FOREWORDThe official poverty monitoring system (PMS) in the Philippines relies mainly on family income and
expenditure surveys. Information on other aspects of well-being is generally obtained from demographicand health surveys, national population and housing censuses, labor force survey, and others. However,these surveys and censuses are (i) too costly to be replicated frequently; (ii) conducted at different timeperiods, making it impossible to get a comprehensive profile of the different socio-demographic groups ofinterest at a specific point in time; and (iii) have sampling designs that do not usually correspond to thegeographical disaggregation needed by local government units (LGUs). In addition, the implementation ofthe decentralization policy, which devolves to LGUs the function of delivering basic services, creates greaterdemand for data at the local level.
The Community-Based Monitoring System (CBMS) seeks to address these gaps by providing data atthe local level appropriate for diagnosing the cause and extent of local poverty, formulating appropriatepolicies and programs, identifying eligible beneficiaries for targeted programs, and assessing the impact ofpolicies and programs. It also supports the decentralization process by capacitating the LGUs to collect,analyze, and use the data in local planning, budgeting, and program implementation to achieve the sustainabledevelopment goals (SDGs).
This ninth volume of statistical tables and poverty maps of provinces generated through the CBMSmethodology represents part of a series of publications resulting from the collaboration between the CBMSNetwork Office and its partner-LGUs. These partnerships have been in place for several years now, andpartner-LGUs are finally enjoying the fruits of their hard labor.
The CBMS poverty maps will identify who and where the poor are as they provide a comprehensivepicture of the different faces of poverty in different parts of the country. They will also aid in identifying themost pressing needs of the community, assist in prioritizing interventions to address these needs, andfacilitate the targeting of programs for those who need the assistance most.
This volume features the provinces of Aurora, Camiguin, Ifugao, Occidental Mindoro, Romblon, andTarlac. Since 2013, mobile technology is being used to fast-track the generation of CBMS results in orderto serve as timely inputs in local development planning and budgeting. The CBMS Accelerated PovertyProfiling (APP) is an organized , systematic, and efficient use of the latest information and communicationtechnology tools, and the standard CBMS instruments for data collection, processing, and poverty mappingand data management instruments. It was built to fast-track the generation of CBMS results in order toserve as timely inputs in local developement planning and budgeting.
The work leading to the publication of this book owes much to the unwavering support and commitmentof our partners both at the provincial and municipal levels. We have worked hand-in-hand with them inconsolidating databases and validating the survey findings. And now, with their consent, we are sharing theirdata to a wide range of CBMS stakeholders all over the country – indeed a glowing testament of theirdedication to make their development planning processes more efficient and effective! We are also gratefulto all our partner national government agencies, particularly the Department of Interior and Local Government,for making this possible.
It is hoped that this publication will provide the necessary data to facilitate evidence-based decision-making toward improving local governance and reducing poverty and inequality in the country.
i
The Many Faces of Poverty (Volume 9)
CELIA M. REYESCBMS Network Team Leader
FOREWORD

INTRODUCTIONConsidered a foremost legislation that ushered in a new era of local governance, the Local Government
Code (LGC) of 1991 has paved the way not only for greater autonomy but also for increased expenditureresponsibility and revenue authority of local government units.
Since then, the local government units (LGUs) have assumed a greater role in local governmentmanagement and service delivery. The devolution is substantial not only in the magnitude of responsibilitiesthat were shifted to LGUs but also in the amount of resources at their disposal to effectively discharge thedevolved functions. Today, LGUs have access to multiple revenue sources, chief of which is their share in thenational internal revenues—the Internal Revenue Allotment (IRA). For the period 2013-2017, the average IRAper year is P389.9 billion (see Table 1).
While experts agree that local governments are not awash with cash, the P1949.3 billion worth of IRAthat the LGUs have received over the 5-year period is certainly a big amount. This underscores the importanceof making sure that LGUs are equipped with the right tools, systems, and procedures to ensure the effective useof these public financial resources. One way to do this is by providing them access to comprehensivesocioeconomic data, on the basis of which they can craft their development plans and budgets.
Statistical Issues and Concerns at the Subnational Level
With decentralization, the types of data demanded by a wide range of users—policymakers, programimplementers, civil society, and others—are changing. Data disaggregated to correspond to the different levelsof government are needed by LGUs to adequately assess their local situation. Moreover, longitudinal data areneeded to track welfare changes over time. Household-level data are also needed to identify eligiblebeneficiaries of different programs.
In 2005, 14 years after the LGC enactment, the Asian Development Bank and the World Bank releaseda report highlighting statistical issues and concerns at the subnational level. It said: "The most comprehensiveand consistent comparative subnational data is at the regional level although this is simply an administrativelevel of government that has no responsibilities for delivery of social services. More data is gradually becomingavailable at the provincial level, but not at lower levels, which are at the frontline of efforts to reduce poverty.”1
The Many Faces of Poverty (Volume 9)
1
1 Decentralization in the Philippines: Strengthening Local Government Financing and Resource Management in the Short-Term, 2005 (A joint document of the World Bank and the Asian Development Bank).
Table 1. Internal Revenue Allotment of LocalGovernment Units, 2013–2017
Year2017
2016
2015
2014
2013
TOTALAve. per yearSource: DBM
Amount(in P billion)
486.9
428.6
389.9
341.6
302.3
1,949.3389.9
INTRODUCTION

Local Poverty Monitoring System Rise up to the Challenge
Owing to still unresolved statistical issues and concerns at the subnational level, an increasing number of LGUsall over the country have taken the initiative to adopt and establish the Community-Based Monitoring System(CBMS). National government agencies have likewise recognized the value of CBMS as a cost-effective tool forvarious thematic concerns such as the Millenium Development Goals/Sustainable Development Goals, genderand development, Disaster Risk Reduction and Management (DRRM), and Climate Change Adaptation (CCA),Bottom-Up Budgeting (BUB), and migration and development, among others.
The CBMS (then known as MIMAP CBMS) was developed by Celia Reyes in 1993 to fill in the necessaryinformation for more evidence-based planning and program implementation and for monitoring the micro-level impacts of macro policies and shocks particularly on the most vulnerable groups of the population. CBMSis an organized process of collecting, processing, validating and use of data for various development concerns.It was designed as a system that can be used and sustained by LGUs over time and facilitates informationsharing at each geopolitical level for purposes of better policymaking and program implementation.
Since the early 2000, the implementation and use of CBMS has been supported by policy issuances at thelocal and national levels. Also, the inclusion of CBMS in the list of projects that can be funded through the BUBfunds is a recognition that CBMS is important in facilitating evidence-based decision-making.
Some of the policy issuances are as follows:o DILG Memorandum Circular 2001-105
Issued in August 2001, the circular enjoins all local chief executives to undertake local programs on povertyreduction and economic transformation and emphasized the need to designate Local Poverty ReductionAction Officers (LPRAOs) and to formulate a Local Poverty Reduction Action Plan (LPRAP).
o NAPC En Banc Resolution No. 7Issued in March 2003, the resolution directs LGUs to adopt the 13 core local poverty indicators as theminimum set of community-based information for poverty diagnosis and planning at the local levels andintegrate such information in their local poverty monitoring system and local level action plans and program.
o DILG Memorandum Circular 2003-92Issued in April 2003, it provides policy guidelines for the adoption of the 13 core local poverty indicators forplanning. The guidelines shall aid the LGUs in assessing and understanding poverty and its dimensions atthe barangays, municipalities, cities and provinces with the end view of formulating an LPRAP and implementingthe plans and programs to reduce poverty.
o DILG Memorandum Circular 2004-152Issued in November 2004, the circular encourages LGUs to intensify efforts in implementing programs,projects and activities towards the achievement of the millennium development goals (MDGs).
o NSCB Resolution No. 6, Series of 2005Issued in January 24, 2005, attests to the statistical and technical soundness of the CBMS, Furthermore, itrecognized the CBMS as a tool for strengthening the statistical system at the local level that will generatestatistics for monitoring and evaluation of local development plans, including the progress of the localgovernments in attaining the Millennium Development Goals (MDG). It also further resolved that the NSCBTechnical Staff initiate and coordinate an advocacy program for the adoption of the CBMS by the LGUs,through the RSCCs, the technical arm of the NSCB Executive Board in the regions.
o League of Municipalities of the Philippines (LMP) Memorandum Circular 027-2006Issued in June 2006, enjoining all CBMS-implementing municipalities to adopt/sustain the adoption of theCBMS as a tool for local poverty diagnosis and ensure the incorporation of the MDG targets and utilization ofCBMS data in the formulation of local development plans.
o SDC Resolution No. 3, Series of 2006Issued on July 19, 2006, the resolution adopts the CBMS as the prescribed monitoring tool for the generationof the Core Local Poverty Indicator Database. It further enjoined the NAPC, DILG, other government agenciesand LGUs to coordinate with the CBMS Network Coordinating Team towards the fast-tracking and fullimplementation of the CBMS.
2
The Many Faces of Poverty (Volume 9)

The Many Faces of Poverty (Volume 9)
3
o PhilHealth Board Resolution No. 982, S.2007In March 2007, the Philippine Health Insurance Corporation (PhilHealth) adopted the CBMS as the principalsource of data in identifying indigent families to be enrolled under the sponsorship program of the NationalHealth Insurance Program (NHIP). The Program is implemented in partnership with the local governmentunits (LGUs) and PhilHealth. The LGU and the National Government through PhilHealth share the annualpremium payment of P1,200 per indigent household to get enrolled.
o League of Provinces of the Philippines (LPP) Resolution No. 2011-01Issued in January 28, 2011, urging the Department of Social and Welfare Development (DSWD) and theDepartment of Health (DOH) to adopt the CBMS and other locally-developed poverty monitoring systems as itstargeting system in identifying beneficiaries to the Pantawid Pamilyang Pilipino Program (4Ps) and thePhilhealth Indigent Sponsored Program
o DBM-DILG-DSWD-NAPC Joint Memorandum Circular No. 1, Series of 2012Issued on March 8, 2012, the joint memorandum circular identifies the collection of relevant economic andsocial data such as those that can be obtained from CBMS, as one of the main components in empoweringpoor LGUs and in the bottom-up planning and budgeting approach.
o DILG Memorandum Circular 2012-73Issued on April 17, 2012, the circular provides that the Local Disaster Risk Reduction and Management Fundcan be utilized for disaster prevention and mitigation projects including the implementation of a CBMS withCCA/DRRM indicators.
o DILG Memorandum Circular 2012-142Issued in August 10, 2012, the circular enjoins all local chief executives to utilize the community-basedmonitoring system (CBMS) in planning and project development. It also recommends for the adoption ofCBMS to coincide with the synchronized local planning and budgeting calendar and with the bottom upplanning and budgeting preparation calendar.
As of February 15, 2018, CBMS is being implemented in 77 provinces (33 of which are implementing thesystem province-wide), 1,037 municipalities, and 93 cities, covering a total of 29,145 barangays. Data generatedby CBMS have so far been used in diagnosing the nature and extent of poverty in their localities, identifyingappropriate interventions, identifying eligible beneficiaries of poverty reduction programs, and assessing theimpact of some of these programs.
Parallel with efforts to establish databanks at each geopolitical level, a national repository of CBMS data hasalso been established at the CBMS Network Office, the Department of the Interior and Local Government(DILG) and the National Anti-Poverty Commission (NAPC). The national repository aims to facilitate data sharingacross government agencies, the private sector, donor agencies, and other relevant stakeholders. Specifically,the national repository will (i) facilitate the access and use of the integrated CBMS database by nationalentities in their advocacy work with key decision makers, (ii) support government and non-government agenciesin strengthening evidence-based planning and monitoring and in aligning their interventions to national priorities,and (iii) facilitate the implementation of targeted programs.
Concluding Remarks
Public statistics will increasingly shape public agenda at the local level as more and more LGUs establish theirown monitoring systems to make their development planning processes more efficient and effective. In thisscenario, local poverty monitoring systems such as the CBMS will have an extremely important role to play.
The country's experience with local-level poverty monitoring systems clearly demonstrates that there can be acomprehensive picture of the poverty situation. Very few, if any, national surveys collect information on thedifferent dimensions of poverty. There is a survey on income and expenditure, another on health, another oneducation, another on employment, another on nutrition, and others. As the samples and the reference periodsare different, there is no comprehensive picture of the poverty status of the population at any point in time. Thisis where CBMS can make a difference as it addresses these gaps through its set of core indicators relating tothe different dimensions of poverty.

4
The Many Faces of Poverty (Volume 9)
EXPLANATORY TEXTA. CBMS Core Indicators
The statistical tables and poverty maps presented in this volume pertain to the CBMS Core Indicators(also known as Core Local Poverty Indicators1), which were generated using the CBMS methodology.
The CBMS Core Indicators are a set of carefully selected indicators that capture the multiple dimensionsof poverty. They define the basic criteria for attaining a decent quality of life and correspond to theminimum basic needs covering (a) health, (b) nutrition, (c) housing, (d) water and sanitation, (e) basiceducation, (f) income, (g) employment, and (h) peace and order. Together, these indicators provideinformation not only on how poor a community is, but also on who in the community is poor, and where.
The CBMS Core Indicators are presented in Table 1. Meanwhile, the poverty and food thresholds usedare presented in Table 2.
1 The Department of the Interior and Local Government (DILG) has issued Memorandum Circular 2003-92 (April 2003) to setpolicy guidelines for the adoption of the 13 core local poverty indicators, for planning and Memoradum Circular 2004-152(November 2004) to encourage LGUs to intensify efforts toward the achievement of the millennium development goals (MDGs).The latter circular also enjoins LGUs to use monitoring systems such as MBN-CBIS, CBMS, IRAP, etc., to monitor and diagnosethe nature and extent of poverty in their respective localities. CBMS was adopted by the DILG as the data collection andprocessing system for the CLPIMS which was the tool adopted to monitor the MDGs for LGUs.
Box 1. Community-Based Monitoring System (CBMS)
The CBMS is an organized way of collecting ongoing or recurring information at the locallevel to be used by local governments, national government agencies, non-governmentorganization (NGOs), and civil society for planning, budgeting, and implementing localdevelopment programs, as well as for monitoring and evaluating their performance. It is a toolfor improved local governance and democratic decision-making that promotes greatertransparency and accountability in resource allocation.
It involves the following steps:
CBMS APP Track
Step 1 Advocacy/organization
Step 2 Data collection, GPS reading, and data transmission
Step 3 Data consolidation, database-building, and poverty mapping
Step 4 Data validation and community consultation
Step 5 Knowledge (database) management
Step 6 Plan formulation
Step 7 Dissemination, implementation, and monitoring
EXPLANATORY TEXT

The Many Faces of Poverty (Volume 9)
5
Table 1. CBMS Core Indicators, Formula, and CBMS Composite Index Using Simple Scoring
A. Hea lth 1 Proportion of children under 5 years old who died
Total number of children aged 0 to less than 5 years old who died divided by the sum of (i) total number of children aged 0 to less than 5 years old, and (ii) the total number of child deaths 0 to less than 5 years old
One (1) if the household has a member under 5 years old who died; zero (0) otherwise.
2 Proportion of women who died due to pregnancy related causes
Total number of women who died due to pregnancy related causes divided by the sum of (i) the total number of children less than one year old, and (ii) total number of women who died due to pregnancy related causes
One (1) if the household has a female member who died due to pregnancy-related causes; zero (0) otherwise.
B. Nutrition 3 Proportion of children 0-5 years old who are malnourished
Total number of children aged 0-5 years old who are moderately or severely underweight over total number of children aged 0-5 years old
One (1) if the household has a member 0-5 years old who is malnourished; zero (0) otherwise.
C. Housing 4 Proportion of households living in makeshift housing
Total number of households living in housing with makeshift roof and/or walls over total number of households
One (1) if the household lives in makeshift housing; zero (0) otherwise.
5 Proportion of households who are informal settlers
Total number of households occupying house and/or lots without permission of owner over total number of households
One (1) if the household is an informal settler; zero (0) otherwise.
D. Water and Sanitation
6 Proportion of households without access to safe water source
Total number of households without access to safe water supply over total number of households
One (1) if the household does not have access to safe water supply; zero (0) otherwise.
7 Proportion of households without access to sanitary toilet facilities
Total number of households without access to water-sealed toilet or closed pit over total number of households
One (1) if the household does not have access to sanitary toilet facilities; zero (0) otherwise.
E. Education 8 Proportion of children 6-11 years old who are not attending elementary school
Total number of children 6-11 years old who are not attending elementary school over total number of children 6-11 years old
9 Proportion of children 12-15 years old who are not attending secondary school
Total number of children 12-15 years old who are not attending secondary school over total number of children 12-15 years old
8-9 Proportion of children 6-15 years old who are not attending school
Total number of children 6-15 years old who are not attending school over total number of children 6-15 years old
One (1) if the household has a member 6-15 years old not attending school; zero (0) otherwise.
F. Income 10 Proportion of households with income below the poverty threshold
Total number of households with income below the poverty threshold over total number of households
One (1) if the household has a per capita income below poverty threshold; zero (0) otherwise.
11 Proportion of households with income below the food threshold
Total number of households with income below the food (subsistence) threshold over total number of households
One (1) if the household has a per capita income below food threshold; zero (0) otherwise.
12 Proportion of households who experienced hunger due to food shortage
Total number of households who experienced food shortage over total number of households
One (1) if the household has experienced food shortage; zero (0) otherwise.
G. Employment 13 Proportion of persons in the labor force who are unemployed
Total number of persons aged 15 and above who are not working over total number of labor force*
One (1) if the household has unemployed member/s; zero (0) otherwise.
H. Peace and Order
14 Proportion of persons who are vict ims of crimes
Total number of persons who are victims of crimes over total population
One (1) if the household has victim/s of crime; zero (0) otherwise.
CBMS Composite Indicator
Average number of deprivations
Sum of deprivations of households over total number of households
Sum of the scores (number of deprivations) of the 13 indicators.
BASIC NEEDS CORE INDICATORS Computation/Formula Simple Scoring

6
The Many Faces of Poverty (Volume 9)
B. CBMS Methodology
The CBMS is an organized system of collecting, processing, validating and use of information and is beingimplemented using structured instruments and training modules. One of the primary objectives of theCBMS is to generate data to diagnose the extent and causes of poverty, formulate appropriate plans andprograms,identify eligible beneficiaries and assess the impacts of policies and programs.
Data used in this report is a by-product of the CBMS implementation by the LGUs featured in this volume.In particular, primary data was generated using the CBMS Accelerated Poverty Profiling (APP)2 tools includingthe CBMS Scan and Portal (using android gadgets and ICT for data collection), the CBMS StatSim (dataprocessing) and Quantum GIS (QGIS)3 for poverty mapping.
Primary data collection is done through the conduct of a household census administered by trained localenumerators and field coordinators using the standard CBMS APP modules and instruments (householdprofile questionnaires and barangay profile questionnaires). Data from the census operations aretransmitted and stored in a CBMS Portal and are likewise established at the databanks at the LGU-level.
Table 2. Poverty and Food Thresholds
2 See CBMS APP details from the CBMS Network website at https://www.pep-net.org/cbms-network-launches-cbms-app
3 Since 2013, the CBMS Mapping System under the CBMS PAPER and CBMS APP Tracks uses Quantum GIS (QGIS)
PROVINCE Reference Year Poverty Threshold Food Threshold
AURORA201520162017
21,61922,31623,086
20,45821,11821,846
15,09715,58716,124
14,28614,75015,258
IFUGAO20152016
22,47524,154
21,64623,267
15,69816,870
15,11816,251
OCCIDENTAL MINDORO
2014201520162017
20,17020,76121,27621,607
19,16519,73120,22020,535
14,08814,49714,86015,091
13,38613,77814,12314,343
ROMBLON20152016
22,73623,299
21,60122,137
15,87616,274
15,08415,462
TARLAC
20142015
21,25323,990
20,18722,786
14,84416,752
14,10015,911
Urban Rural Urban Rural
201420152016
21,15222,49422,661
20,28321,55021,711
14,77415,70715,828
14,16615,04815,164
CAMIGUIN
20162017
24,76325,617
23,52024,331
17,29617,892
16,42716,994
The Many Faces of Poverty (Volume 9)
7
C. Statistical Clearance for the CBMS CensusIn 2005, the Philippine Statisical Authority (formerly National Statistical Coordination Board) has issuedResolution No. 6, which recognizes and enjoins support to the CBMS as a tool for strengthening thestatistical system at the local level. It also directs the PSA Technical Staff to initiate and coordinate anadvocacy program for the adoption of the CBMS by the LGUs, through the Regional Statistical CoordinationCommittees (RSCCs), the technical arm of the Executive Board in the regions. The PSA has also approvedthe 2015 CBMS Questionnaire (PSA Approval No.DILG1540-01 and DILG-1540-02).
D. CBMS Census Operations
All census operations were undertaken under the supervision of the CBMS Technical Working Groups(TWGs) at the local levels. They identified the local personnel who were trained as enumerators and fieldcoordinators. Technical assistance was provided by the CBMS Network Office and the Department of theInterior and Local Government (DILG).
Training is mainly conducted at two levels. The first level training (Training of Trainors) is conducted formembers of the TWGs. This is conducted by a pool of CBMS Trainers from the DILG. Meanwhile, a secondlevel training (Training of Enumerators) is conducted for enumerators--usually composed of barangayhealth workers and students. Members of the TWG act as trainors in this training.
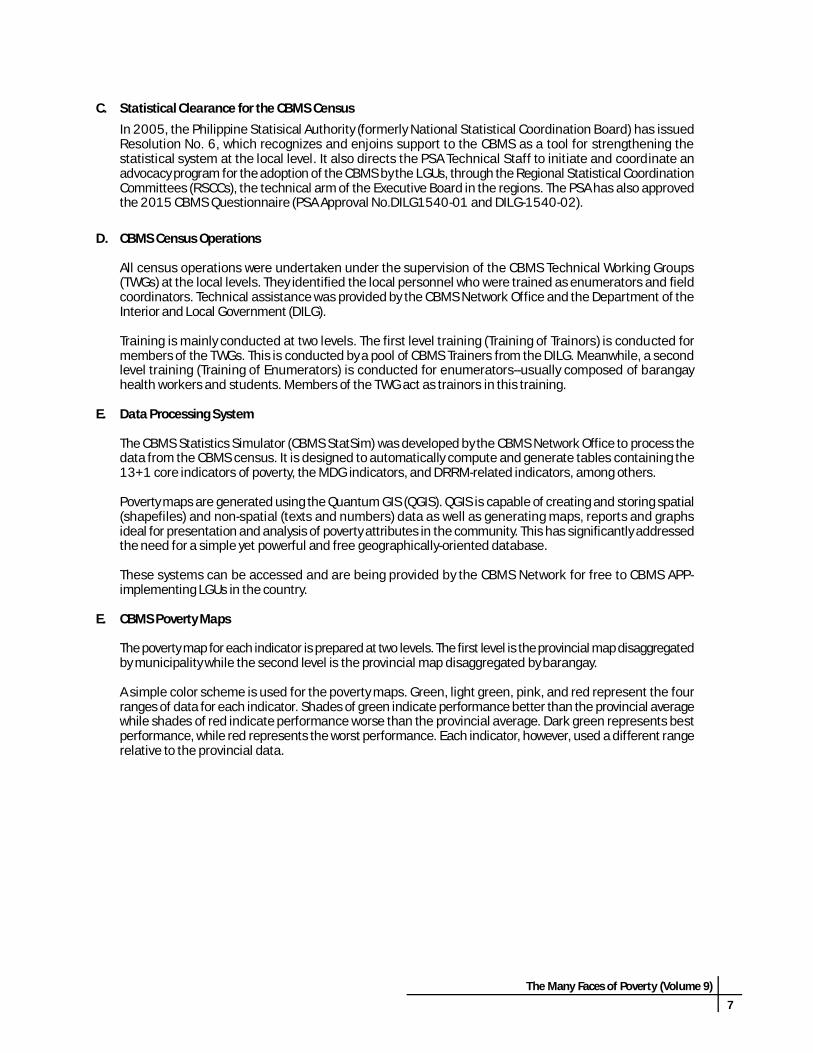
E. Data Processing System
The CBMS Statistics Simulator (CBMS StatSim) was developed by the CBMS Network Office to process thedata from the CBMS census. It is designed to automatically compute and generate tables containing the13+1 core indicators of poverty, the MDG indicators, and DRRM-related indicators, among others.
Poverty maps are generated using the Quantum GIS (QGIS). QGIS is capable of creating and storing spatial(shapefiles) and non-spatial (texts and numbers) data as well as generating maps, reports and graphsideal for presentation and analysis of poverty attributes in the community. This has significantly addressedthe need for a simple yet powerful and free geographically-oriented database.
These systems can be accessed and are being provided by the CBMS Network for free to CBMS APP-implementing LGUs in the country.
E. CBMS Poverty Maps
The poverty map for each indicator is prepared at two levels. The first level is the provincial map disaggregatedby municipality while the second level is the provincial map disaggregated by barangay.
A simple color scheme is used for the poverty maps. Green, light green, pink, and red represent the fourranges of data for each indicator. Shades of green indicate performance better than the provincial averagewhile shades of red indicate performance worse than the provincial average. Dark green represents bestperformance, while red represents the worst performance. Each indicator, however, used a different rangerelative to the provincial data.
8
The Many Faces of Poverty (Volume 9)
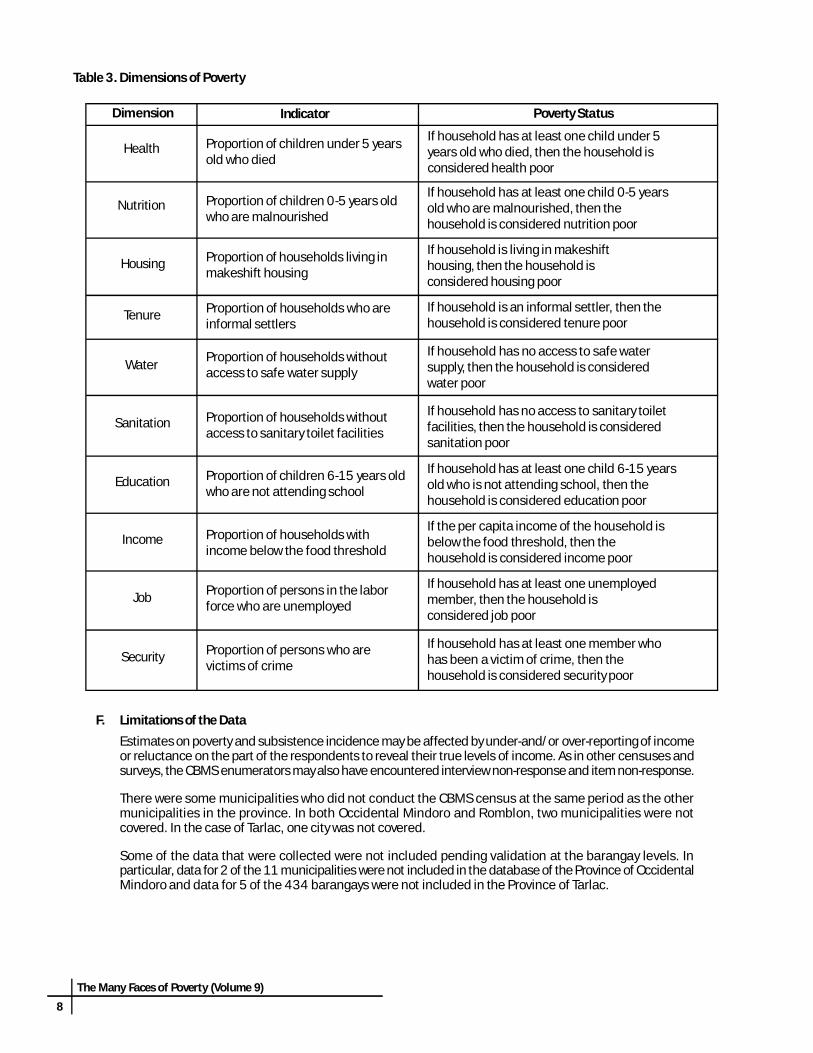
Table 3. Dimensions of Poverty
Dimension
If household has at least one child under 5years old who died, then the household isconsidered health poor
If household has at least one child 0-5 yearsold who are malnourished, then thehousehold is considered nutrition poor
If household is living in makeshifthousing, then the household isconsidered housing poor
If household is an informal settler, then thehousehold is considered tenure poor
If household has no access to safe watersupply, then the household is consideredwater poor
If household has no access to sanitary toiletfacilities, then the household is consideredsanitation poor
If household has at least one child 6-15 yearsold who is not attending school, then thehousehold is considered education poor
If the per capita income of the household isbelow the food threshold, then thehousehold is considered income poor
If household has at least one unemployedmember, then the household isconsidered job poor
If household has at least one member whohas been a victim of crime, then thehousehold is considered security poor
Indicator Poverty Status
Proportion of children under 5 yearsold who died
Proportion of children 0-5 years oldwho are malnourished
Proportion of households living inmakeshift housing
Proportion of households who areinformal settlers
Proportion of households withoutaccess to safe water supply
Proportion of households withoutaccess to sanitary toilet facilities
Proportion of children 6-15 years oldwho are not attending school
Proportion of households withincome below the food threshold
Proportion of persons in the laborforce who are unemployed
Proportion of persons who arevictims of crime
Health
Nutrition
Housing
Tenure
Water
Sanitation
Education
Income
Job
Security
F. Limitations of the DataEstimates on poverty and subsistence incidence may be affected by under-and/or over-reporting of incomeor reluctance on the part of the respondents to reveal their true levels of income. As in other censuses andsurveys, the CBMS enumerators may also have encountered interview non-response and item non-response.
There were some municipalities who did not conduct the CBMS census at the same period as the othermunicipalities in the province. In both Occidental Mindoro and Romblon, two municipalities were notcovered. In the case of Tarlac, one city was not covered.
Some of the data that were collected were not included pending validation at the barangay levels. Inparticular, data for 2 of the 11 municipalities were not included in the database of the Province of OccidentalMindoro and data for 5 of the 434 barangays were not included in the Province of Tarlac.

The Many Faces of Poverty (Volume 9)
9
Republic of the PhilippinesProvince of AURORA
Message
GERARDO NOVERAS Governor
My warmest salutations to the CBMS Network Office for publishing the 9thvolume of “The Many Faces of Poverty”.
Indeed, this publication will be an extremely beneficial tool for localgovernments and development planners in gauging the most pressing needs ofthe Filipino people in the periphery, and thus enabling the formulation of socio-economic programs that genuinely respond to their pressing needs.
I sincerely commend the members of the CBMS Network Office for theirtireless efforts and unwavering commitment to serve as a catalyst for sustainabledevelopment in the Philippine countryside, especially in the Province of Aurora.
Mabuhay po kayo!

MAYORS OF AURORA
HON. NELIANTO BIHASA(Municipality of Baler)
HON. RICARDO BITONG(Municipality of Casiguran)
HON. JOE GOROSPE(Municipality of Dilasag)
HON. MANUEL TORRES(Municipality of Dinalungan)

HON. SHERWIN TAAY(Municipality of Dingalan)
HON. JOANNA WILMA SALAMANCA(Municipality of Dipaculao)
HON. AMADO GENETA(Municipality of Maria Aurora)
HON. MARIANO TANGSON(Municipality of San Luis)
MAYORS OF AURORA

12
The Many Faces of Poverty (Volume 9)
The Many Faces of Poverty in theProvince of Aurora
Aurora had a total population of 180,716 covering 43,811 householdsThe CBMS census conducted from 2016 to 2017 covered 8 municipalities in the province, namely, Baler, Casiguran,Dilasag, Dinalungan, Dingalan, Dipaculao, Maria Aurora, and San Luis, with 151 barangays. Of the 180,716 locals, 51.1percent are male, while 48.9 percent are female. The Municipality of Maria Aurora has the largest population with35,185 members (or 19.5%) in 8,028 households, followed by Baler with 34,707 members (or 19.2%) in 7,950households. Meanwhile, Barangay Dikapanikian in Dingalan has the largest population size across all the barangayswith 392 individuals in 75 households.
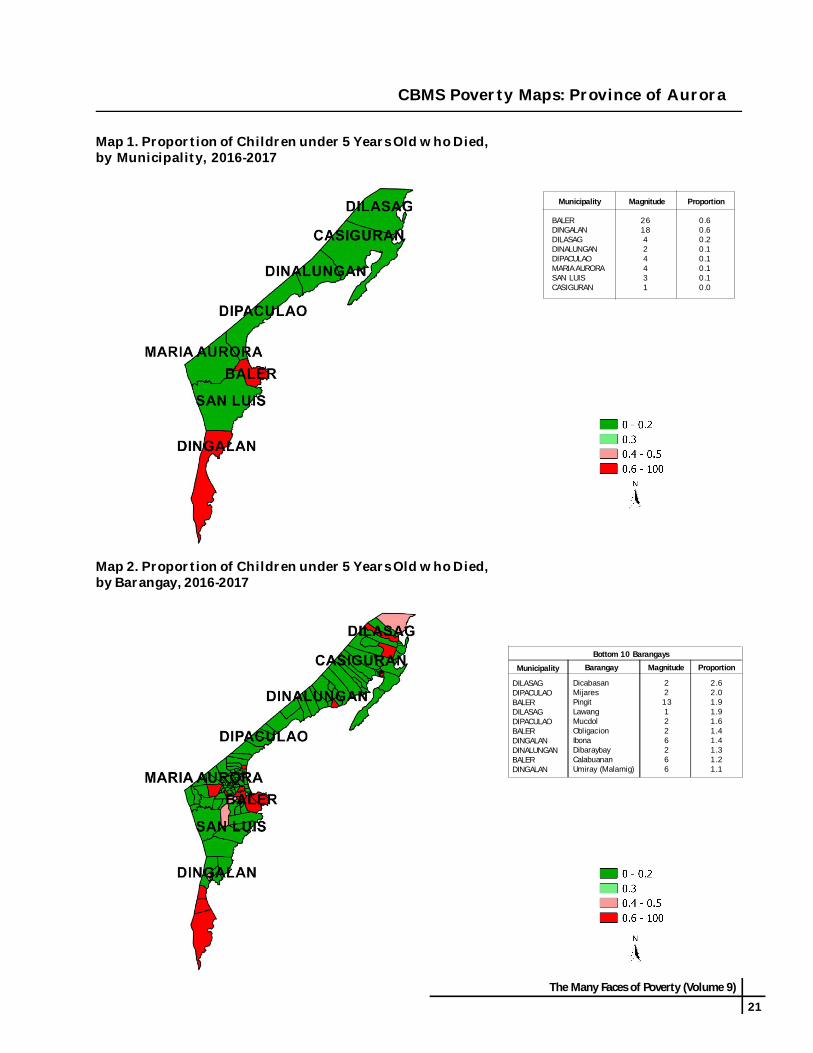
HEALTH AND NUTRITIONThree in every 1000 children under five years old diedAbout 0.3 percent of children under five years old died duringthe reference period. This is equivalent to 62 child deaths inthe province. An equal proportion of child deaths (0.3%)between boys and girls was observed in the province of Aurora.The highest proportion of child deaths was reported in themunicipalities of Baler (26 cases) and Dingalan (18 cases),where 0.7 percent of children under five years old died. Baleralso ranked first in terms of magnitude. Among all 148barangays, Barangay Dicabasan in Dilasag registered thehighest proportion of child deaths at 2.6 percent. This wasfollowed by Barangay Mijares in Dipaculao at 2 percent, andboth Barangay Pingit in Baler and Barangay Lawang in Dilasagat 1.9 percent.
The 2016-2017 CBMS Census covers 8 municipalities in the Province of Aurora, namely, Baler, Casiguran, Dilasag, Dinalungan,Dingalan, Dipaculao, Maria Aurora, and San Luis.
POPULATION

The Many Faces of Poverty (Volume 9)
13
One in every 1000 pregnant women died due to pregnancy-related causesAccording to the results of the CBMS census, 0.1 percent of pregnant women aged 15-49 in the Province of Aurora dieddue to pregnancy-related causes during the reference period. Two cases of maternal death were reported in Aurora, oneof which was in Barangay Nipoo in Dinalungan and the other one was in Barangay Umiray in Dingalan.
Around 3 in every 100 children zero to five years old weremalnourishedAround 3.1 percent or 757 children zero to five years old wereclassified as moderately or severely underweight in the Provinceof Aurora. In particular, 362 boys and 395 girls zero to fiveyears old were considered malnourished. Malnutritionprevalence among girls at 3.4 percent was higher than boys at2.9 percent. The highest prevalence of malnutrition wasobserved in Dingalan at 9.5 percent, followed by Dinalunganat 5 percent. Barangay Umiray reported the highest proportionof malnourished children at 17.9 percent or 107 cases,followed by Barangay Dikapanikian at 17 percent, andBarangay Paltic at 14.1 percent, all of which are found in themunicipality of Dingalan.
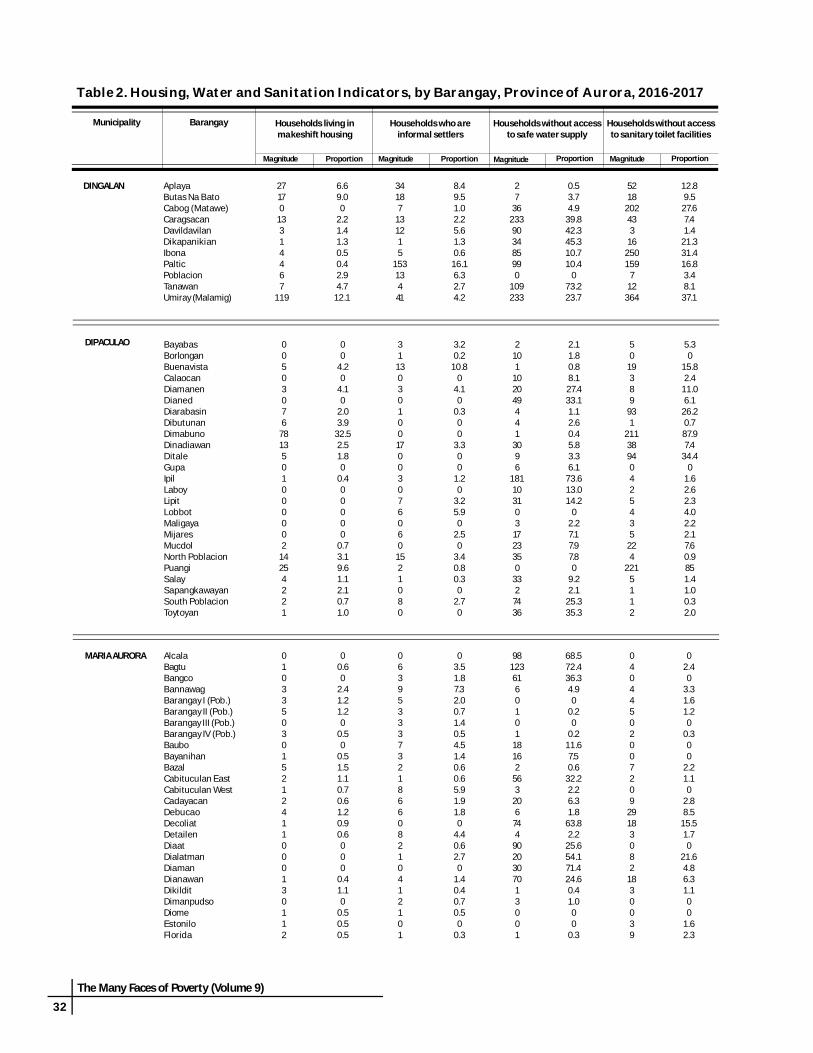
HOUSINGAbout 2 percent of households were living in makeshift housing while 3.3 percent were informal settlersThe 2016-2017 CBMS data showed that 2 in every 100 households in the province were living in makeshift housing.First in terms of proportion was the municipality of Dingalan, with about 3.8 percent or 201 households living inmakeshift housing. Second was Casiguran at 3.5 percent or 185 households, while third was Dipaculao at 3 percent or168 households. At the barangay level, Barangay Dimabuno in Dipaculao had the highest proportion of householdsliving in makeshift housing at 32.5 percent or 78 households. This was followed by Barangay Umiray in Dingalan at 12.1percent, which accounts for 119 households, the highest number of households with makeshift housing.
In terms of tenure status, 1,456 households or 3 in every 100 households in the province were considered informalsettlers. The highest proportion of informal settlers, as well as highest number of informal settlers overall, was observedin the Municipality of Dilasag at 10.1 percent with 363 cases. This was followed by the municipality of Dingalan at 5.7percent with 301 cases. At the barangay level, the highest proportion of informal settlers, as well as highest number ofinformal settlers overall, was observed in Barangay Masagana at 37.2 percent, accounting for 188 households in thesaid barangay. Meanwhile, the second highest in terms of proportion was Barangay Diniog at 16.8 percent, accountingfor 87 households in the said barangay. Both of which are found in the municipality of Dilasag.

14
The Many Faces of Poverty (Volume 9)
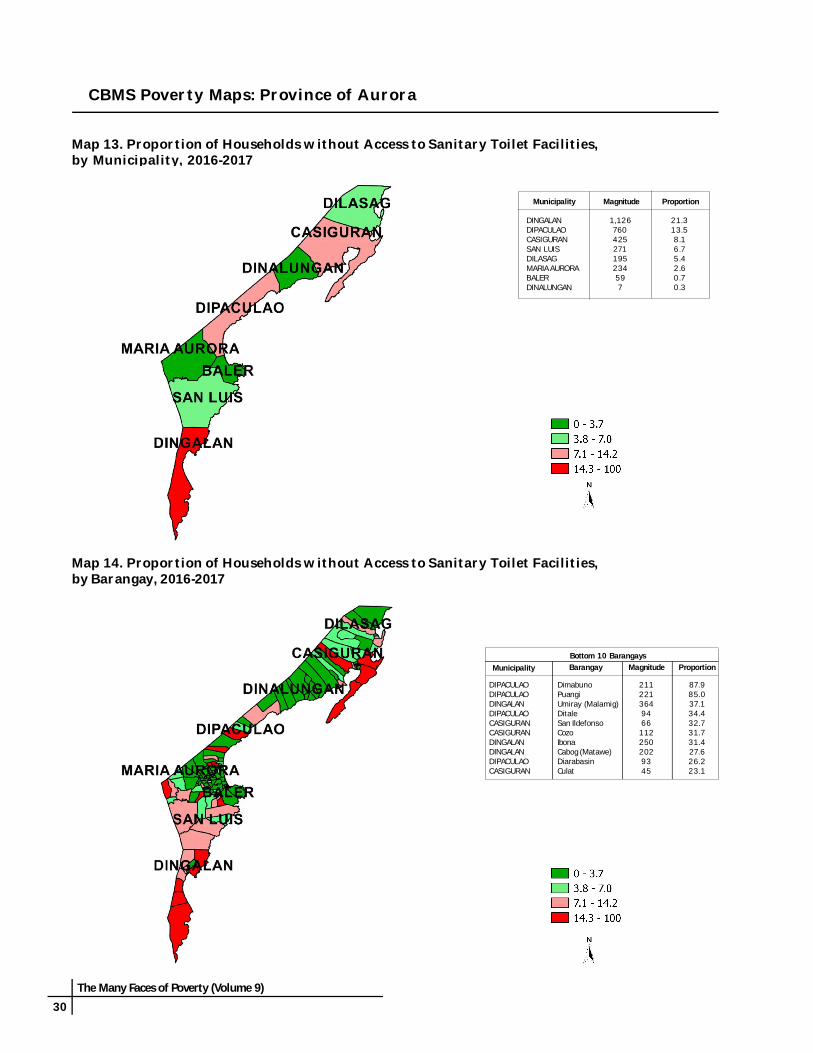
WATER AND SANITATIONAbout 12.7 percent of the households do not have access to safe water supply and about 7 percent do not have accessto sanitary toilet facilitiesBased on the results of the CBMS census, 13 in every 100 households in Aurora had no access to safe water supply. TheMunicipality of Dingalan had the worst condition in terms of water accessibility as 12.7 percent of its households werereported to have no access to safe water supply during the reference period. This was followed by Maria Aurora with15.7 percent, and San Luis with 14.4 percent. In terms of magnitude, the Municipality of Maria Aurora ranked first with1,430 cases. The top two barangays in terms of proportion of households with no access to safe water supply wereBarangay Galintuja and Barangay Villa Aurora, at 93.3 percent and 91.3 percent, respectively. Both barangays are inMaria Aurora. Of the 151 barangays, 17 can be considered “waterless”1.
On the other hand, 7 percent of the households do not have access to sanitary toilet facilities. This means that around7 in every 100 households in the province lacked access to sanitary toilet facilities. The Municipality of Dingalanreported the highest proportion of sanitation poor households at 21.3 percent or 1,126 households, followed byDipaculao at 13.5 percent or 760 households. Meanwhile, at the barangay level, the highest proportion of sanitationpoor households was observed in Barangay Dimabuno in Dipaculao at 87.9 percent or 211 cases, followed by BarangayPuangi in Dipaculao at 85 percent or 221 cases.
1 “Waterless” barangays refer to barangays with less than 50 percent safe water supply coverage, as defined by the SALINTUBIG Programof the Department of Health (DOH).

The Many Faces of Poverty (Volume 9)
15
BASIC EDUCATIONAbout 3 in every 100 children 6 to 15 years old were notattending schoolThe proportion of out-of-school children 6-15 years old was2.8 percent. Regardless of education level, 3 in every 100children 6-15 years old were not attending school. Further,results revealed that 7.6 percent of children 6-11 years oldwere not attending elementary school, while 26 percent ofchildren 12-15 years old were not attending high school.Results also showed that the proportion of out-of-schoolchildren among boys (3.7%) was higher compared to girls (2%).Out of 8 municipalities, Dingalan had the highest proportion ofout-of-school children 6-5 years old at 4.8 percent. Dilasagwas second highest at 3.5 percent, followed by San Luis at 3percent. Meanwhile, in terms magnitude, Dingalan had thehighest number of out-of school children 6-15 years old, with263 cases observed.
INCOME AND LIVELIHOODAbout 53 in every 100 households were living below thepoverty thresholdMore than half or 53 percent of the households in theprovince were considered income poor, which means thataround 53 in every 100 households have no sufficientincome to satisfy their basic food and non-food needs. Outof 8 municipalities, only Baler and Maria Aurora reportedan income poverty rate below 50 percent, at 32.9 and 39.6,respectively. San Luis had the highest proportion ofhouseholds living below poverty threshold at 68.4 percent,followed closely by Casiguran at 67.7 percent. Across allbarangays in the province, the highest proportion of incomepoor households was observed in Barangay Ditinagyan inCasiguran at 97.6 percent, followed by Barangay Dibut inSan Luis at 93.8 percent.
Around 38 in every 100 households had no sufficientincome to satisfy their food needsAccording to the CBMS data, 38 percent of the householdsin Aurora were living below the food threshold. Subsistenceincidence was most prevalent in Casiguran where 56.8percent of the households were food poor. With 2,977cases, Casiguran also had the highest number of foodpoor households. In particular, Barangay Ditinagyan inCasiguran recorded the highest incidence of subsistencewhere 113 or 91.1 percent of the households were livingbelow the food threshold, closely followed by BarangayDibut at 89.3 percent.

16
The Many Faces of Poverty (Volume 9)
Around 1 percent of households experienced hunger dueto food shortageOne in every 100 households or 1.3 percent of thehouseholds in the province suffered from hunger duringthe three-month period before the census. Hunger dueto food shortage was most prevalent in the municipalityof Dingalan at 4.8 percent or 254 cases. Next to Dingalanwas Baler at 2.2 percent or 186 cases. Across all thebarangays, the highest proportion of households thatexperienced hunger due to food shortage was observedin Barangay Obligacion at 17.8 percent, followed byBarangay Umiray in Dingalan at 13.2 percent, andBarangay Diteki at 13 percent.
Unemployment rate in the province was recorded at 6.2 percentAbout 6.2 percent or 3,822 individuals of the 61,277 membersof the labor force aged 15 and above were reported to beunemployed. It appears that the unemployment rate was higheramong females at 8.2 percent than among males at 5.4 percent.Unemployment was most prevalent in Dilasag where 18.6 percentor 919 members of the labor force were unemployed during thereference period. This was followed by Dingalan at 7.6 percent or602 cases, and Dipaculao at 7 percent or 568 cases. Across allbarangays, Barangay Esperanza in Dilasag recorded the highestunemployment rate at 41.3 percent, followed by BarangayDitinagyan in Casiguran at 28.2 percent, and Barangay Calabganin Casiguran at 26.3 percent.
PEACE AND ORDERAround 0.1 percent of the population were victims of crimeA total of 113 individuals in the Province of Aurora were reported to be victims of crime. Dingalan reported the highestnumber of crime victims with 43 cases, followed by Baler with 38 cases. At the barangay level, Barangay V in Balerrecorded the highest proportion of crime victims with 1.3 percent or 23 cases. This was followed by Umiray with 0.5percent or 23 cases, and Dicabasan with 0.5 percent or 3 cases.
CBMS COMPOSITE INDEXHouseholds in the Province of Aurora suffered from one deprivation2 on the averageThe Province of Aurora recorded a CBMS composite index (CCI) of 1.3, which means that households in the provincewere not able to meet the 13 basic needs and suffered from one deprivation, on the average. In particular, householdsin Dingalan were not able to meet 2 of the 13 basic needs, on the average. On the other hand, households in BarangayDimabuno in Dipaculao, on the average, had the highest incidence of deprivation with 3 unmet needs. This was followedby Barangay Dibalo and Barangay Dimanayat, both in San Luis, with 3 unmet needs, on the average.
2 The deprivations are based on the 13+1 indicators: (1) children under 5 years old who died; 2) women who died due to pregnancy-related causes; (3) malnourished children 0-5 years old; (4) households living in makeshift housing ; 5) households who are informalsettlers; (6) households without access to safe water supply; (7) households without access to sanitary toilet facilities; (8) children 6-15years old not in school; (9) households with income below the poverty threshold; (10) households with income below the food threshold;(11) households that experienced food shortage; (12) unemployment; and (13) victims of crime. A high er index would mean moredeprivation and hence, worse condition for the households.

The Many Faces of Poverty (Volume 9)
17
DIMENSIONS OF POVERTY3
Based on the CBMS data, around 46.3 percent of all households are non-poorwhile 53.7 percent of households were poor in at least one dimension. Inparticular, about 36.8 percent or 16,135 households in the province werepoor in one deprivation, while 13.3 percent or 5,846 households were poor intwo deprivations. Meanwhile, 3 percent or 1,292 households were poor inthree dimensions.
DIMENSIONS OF POVERTY IN AURORA
Number ofDimensions
Proportion ofHouseholds
Total 53.7
1234567
36.813.33.00.50.10.00.0
3 From the 13+1 CBMS core indicators, one indicator is selected to determine whether a household is poor in a particular dimension: 1)children aged under 5 years old who died for health, 2) malnourished children 0-5 years old for nutr ition, 3) households living inmakeshift houses for housing, 4) households who are informal settlers for tenure, 5) households without access to safe water supply forwater, 6) households without access to sanitary toilet facilities for sanitation, 7) children aged 6-15 years not in school for education, 8)households with income below the food threshold for income, 9) unemployment for job, and 10) victims of crime for security.
0.3 3.1
2.03.3
12.77.0
2.838.0
6.2 0.10.0
10.0
20.0
30.0
40.0
50.0
60.0Health Poor
Nutrition Poor
Housing Poor
Tenure Poor
Water Poor
SanitationPoor
Education Poor
Income Poor
Job Poor
Security Poor

18
The Many Faces of Poverty (Volume 9)

The Many Faces of Poverty (Volume 9)
19
The Many Faces of Poverty inthe Province of Aurora
INDICATOR
DEMOGRAPHYPopulationAverage household sizeChildren under 1 year oldChildren under 5 years oldChildren 0-5 years oldChildren 6-11 years oldMembers 12-15 years oldMembers 6-15 years oldMembers 10 years old and aboveMembers of the labor force
HEALTH AND NUTRITIONChildren under 5 years old who diedWomen who died due to pregnancy related-causesMalnourished children 0-5 years old
HOUSINGHouseholds living in makeshift housingHouseholds who are informal settlers
WATER AND SANITATIONHouseholds without access to safe water supplyHouseholds without access to sanitary toilet facilities
BASIC EDUCATIONChildren 6-11 years old not attending elementary schoolChildren 12-15 years old not attending high schoolChildren 6-15 years old not attending school
INCOME AND LIVELIHOODHouseholds with income below the poverty thresholdHouseholds with income below the food thresholdHouseholds who experienced hunger due to food shortageUnemployment rate (15 years old and above)
PEACE AND ORDERVictims of crime
Magnitude
43,8114
868 1,456
5,556 3,077
23,229 16,666
552
Proportion
2.03.3
12.77.0
53.038.0
1.3
Households Population
CBMS Core Indicators, Province of Aurora, 2016-2017
ProportionMagnitude
3,632 19,920 24,110 25,431 16,212 41,643
139,430 61,277
180,716
62 2
757
1,938 4,222 1,182
7.6262.8
113 0.1
0.30.13.1
3,822 6.2
CBMS Composite Indicator, Province of Aurora, 2016-2017
CBMS Composite IndicatorAverage
1.3

20
The Many Faces of Poverty (Volume 9)
CBMS Core Indicators, by Municipality, Province of Aurora, 2016-2017
Number ofchildren
(6-11 yearsold)
Children not attendingelementary school
(6-11 years old)
Children not attending highschool
(12-15 years old)
Number ofchildren(12-15
years old)
Number ofchildren
(6-15 yearsold)
Children not attendingschool
(6-15 years old)
Municipality
ProportionProportionProportion MagnitudeMagnitudeMagnitude
Households living inmakeshift housing
Households who areinformal settlers
Households without access tosafe water supply
Households without access tosanitary toilet facilities
Municipality
ProportionProportion ProportionProportion MagnitudeMagnitudeMagnitudeMagnitude
BALERCASIGURANDILASAGDINALUNGANDINGALANDIPACULAOMARIA AURORASAN LUIS
1061858233
2011685142
1.33.52.31.33.83.00.61.0
12015936311030186
114203
59425195
71,126760234271
0.78.15.40.3
21.313.52.66.7
1.43.0
10.14.35.71.51.25.0
1,086534173228928591
1,430586
13.110.24.88.917.610.515.714.4
Municipality Totalhouseholds
Number ofchildren (0-5
years old)
Malnourishedchildren
(0-5 years old)
Children under 5years old who died
Numberof children
under 1year old
Women deathsdue to pregnancy-
related causes
Totalpopulation
ProportionProportion Proportion MagnitudeMagnitudeMagnitude
Number ofchildrenunder 5
years old
BALERCASIGURANDILASAGDINALUNGANDINGALANDIPACULAOMARIA AURORASAN LUIS
8,309 5,237 3,605 2,568 5,285 5,6109,1354,062
34,70721,26413,89110,84423,02823,64335,15818,181
3,7552,3331,6681,2552,6702,5163,6452,078
4,4992,8292,0461,5313,2043,0804,4172,504
76141976
30313212116
1.70.50.95.09.54.32.70.6
26142
18443
0.60.00.20.10.60.10.10.1
744410289241499380637432
00011000
000
0.40.2000
BALERCASIGURANDILASAGDINALUNGANDINGALANDIPACULAOMARIA AURORASAN LUIS
4,6773,0052,1481,5043,2643,4304,8792,524
373268176129245251330166
8.08.98.28.67.57.36.86.6
4,0292,6361,8271,2282,7922,8783,9572,178
15313312368
263153166123
2.02.63.52.74.82.82.13.0
3,1262,0461,322989
2,1692,1112,8461,603
691607348244781537577437
22.129.726.324.736.025.420.327.3
Households with income below the povertythreshold
Households with income below the foodthreshold
Households who experienced hunger duefood shortage
Municipality
Proportion Proportion ProportionMagnitudeMagnitudeMagnitude
Unemployment rate(15 years old and above)
Persons who are victimsof crimes
Number of persons in thelabor force
(15 years old and above)
Municipality CBMSCompositeIndicatorProportionProportionMagnitude Magnitude
BALERCASIGURANDILASAGDINALUNGANDINGALANDIPACULAOMARIA AURORASAN LUIS
2,7323,5462,3371,5113,5293,1763,6202,778
32.967.764.858.866.856.639.668.4
1864724
2543
1541
2.20.90.10.24.80.10.21.0
1,6812,9771,7891,1172,6932,0302,1712,208
20.256.849.643.551.036.223.854.4
BALERCASIGURANDILASAGDINALUNGANDINGALANDIPACULAOMARIA AURORASAN LUIS
12,1286,9324,9453,9407,9198,107
11,5355,771
21150791969
602568554392
0.10.00.00
0.20.00.00.0
0.81.61.61.21.91.40.91.6
1.77.3
18.61.87.67.04.86.8
38730
431048
CBMS Poverty Maps: Province of Aurora
The Many Faces of Poverty (Volume 9)
21
CBMS Poverty Maps: Province of Aurora
Map 1. Proportion of Children under 5 Years Old who Died,by Municipality, 2016-2017
Map 2. Proportion of Children under 5 Years Old who Died,by Barangay, 2016-2017
Barangay Magnitude ProportionMunicipality
Bottom 10 Barangays
DILASAGDIPACULAOBALERDILASAGDIPACULAOBALERDINGALANDINALUNGANBALERDINGALAN
DicabasanMijaresPingitLawangMucdolObligacionIbonaDibaraybayCalabuananUmiray (Malamig)
2 2
13 1 2 2 6 2 6 6
2.62.01.91.91.61.41.41.31.21.1
Municipality ProportionMagnitude
BALERDINGALANDILASAGDINALUNGANDIPACULAOMARIA AURORASAN LUISCASIGURAN
26 18 4 2 4 4 3 1
0.6 0.6 0.2 0.1 0.1 0.1 0.1 0.0

22
The Many Faces of Poverty (Volume 9)
Map 4. Proportion of Women who Died Due to Pregnancy-Related Causes,by Barangay, 2016-2017
Map 3. Proportion of Women who Died Due to Pregnancy-Related Causes,by Municipality, 2016-2017
CBMS Poverty Maps: Province of Aurora
Barangay Magnitude ProportionMunicipalityBottom 2 Barangays
DINALUNGANDINGALAN
Nipoo (Bulo)Umiray (Malamig)
1 1
4.0 1.0
Municipality ProportionMagnitude
DINALUNGANDINGALANBALERDILASAGDIPACULAOMARIA AURORASAN LUISCASIGURAN
1 1 0 0 0 0 0 0
0.4 0.2 0 0 0 0 0 0

The Many Faces of Poverty (Volume 9)
23
CBMS Poverty Maps: Province of Aurora
Map 5. Proportion of Children 0-5 Years Old who are Malnourished,by Municipality, 2016-2017
Map 6. Proportion of Children 0-5 Years Old who are Malnourished,by Barangay, 2016-2017
Barangay Magnitude ProportionMunicipality
Bottom 10 Barangays
DINGALANDINGALANDINGALANDINALUNGANMARIA AURORADIPACULAODINGALANDIPACULAODINGALANDINGALAN
Umiray (Malamig)DikapanikianPalticNipoo (Bulo)DebucaoDianedCaragsacanBayabasButas Na BatoTanawan
107 9
87 17 20 12 34 5
13 8
17.917.014.112.111.411.411.310.910.710.4
Municipality ProportionMagnitude
DINGALANDINALUNGANDIPACULAOMARIA AURORABALERDILASAGSAN LUISCASIGURAN
303 76
132 121 76 19 16 14
9.5 5.0 4.3 2.7 1.7 0.9 0.6 0.5

24
The Many Faces of Poverty (Volume 9)
Table 1. Health and Nutrition Indicators, by Barangay, Province of Aurora, 2016-2017
BALER Barangay I (Pob.)Barangay II (Pob.)Barangay III (Pob.)Barangay IV (Pob.)Barangay V (Pob.)BuhanginCalabuananObligacionPingitReservaSabangSuclayinZabali
CASIGURAN Barangay 1 (Pob.)Barangay 2 (Pob.)Barangay 3 (Pob.)Barangay 4 (Pob.)Barangay 5 (Pob.)Barangay 6 (Pob.)Barangay 7 (Pob.)Barangay 8 (Pob.)BianuanCalabganCalangcuasanCalantasCozoCulatDibacongDibetDitinagyanEsperanzaEstevesLualMarikitSan IldefonsoTabasTinib
41222424
202526576167793559535544486
00002119
29171511
0000
1.00.20.25.43.73.02.80.20.2
32181717
168432480139668481445451407
00000062130014
000000
1.21.41.900
0.21.0
7633
40818325141101818984
0000000000000
0000000000000
77501515231
2732
38029861761671242261074268
15316581
11111167
98631817291
344247539
1082141981522611275481
18620593
12712681
130000101000000000030050
1.04.80000
2.90
0.20000000000
1.500
4.00
000000000000000000010000
0000000000000000000
0.60000
188644046714
153231163914111127191227247
000000000000000000000000
000000000000000000000000
Municipality Barangay Number ofchildren
(0-5years old)
Malnourishedchildren
(0-5 years old)
Proportion
Children under 5years oldwho died
Number ofchildrenunder 1year old
Women deaths due topregnancy-related
causes
Magnitude Magnitude Proportion Magnitude Proportion
Number ofchildrenunder 5years old
DILASAG DiagyanDicabasanDilaguidiDimasesetDiniogEsperanzaLawangMaligaya (Pob.)ManggitahanMasagana (Pob.)Ura
2697693
13827912553
19317721946
32590
10916535116465
24021226956
90016200001
2.800
0.61.71.20000
1.8
12000010000
0.42.60000
1.90000
5210192741168
3435443
00000000000
00000000000
DINALUNGAN AbulegDibaraybayDitawiniMapaladNipoo (Bulo)PalegSimbahanZone I (Pob.)Zone II (Pob.)
1441577898
115143187182151
17819697
124140164229213190
155531787
115
8.42.65.22.4
12.14.93.15.22.6
020000000
01.30000000
213518252418423622
000010000
0000
4.00000

The Many Faces of Poverty (Volume 9)
25
Table 1. Health and Nutrition Indicators, by Barangay, Province of Aurora, 2016-2017
DINGALAN AplayaButas Na BatoCabog (Matawe)CaragsacanDavildavilanDikapanikianIbonaPalticPoblacionTanawanUmiray (Malamig)
2601214713019853
5256178277
599
22134
3459
108748
107
8.510.70.8
11.35.117.01.9
14.14.9
10.417.9
21910538425082444225127462516
10410060006
0.50
1.00.400
1.4000
1.1
4718764719680947897
00000000001
0000000000
1.0
Municipality Barangay Number ofchildren
(0-5years old)
Malnourishedchildren
(0-5 years old)
Proportion
Children under 5years oldwho died
Number ofchildrenunder 1year old
Women deaths due topregnancy-related
causes
Magnitude Magnitude Proportion Magnitude Proportion
Number ofchildrenunder 5
years old
DIPACULAO BayabasBorlonganBuenavistaCalaocanDiamanenDianedDiarabasinDibutunanDimabunoDinadiawanDitaleGupaIpilLaboyLipitLobbotMaligayaMijaresMucdolNorth PoblacionPuangiSalaySapangkawayanSouth PoblacionToytoyan
3826570595192
12394
103247121489436
1114850
10012517210412844
11578
46329857063105152113133296151551144513955621271442221341545913889
525312
12580322913225
131103465
10.97.63.51.43.2
11.43.37.10
1.01.33.67.92.22.23.63.23.99.05.00
1.96.84.35.6
0000000000000000022000000
000000000000000002
1.6000000
6471064
1628131232119
115
2376
14172714239
1317
0000000000000000000000000
0000000000000000000000000
MARIA AURORA AlcalaBagtuBangcoBannawagBarangay I (Pob.)Barangay II (Pob.)Barangay III (Pob.)Barangay IV (Pob.)BauboBayanihanBazalCabituculan EastCabituculan WestCadayacanDebucaoDecoliatDetailenDiaatDialatmanDiamanDianawanDikilditDimanpudsoDiomeEstoniloFlorida
3873845993
16761
15981
1031355655
1571515575
1382717
115124679576
133
4985997211220376
196931271647970175176659416932211461458611490166
02341314047017
20034112
132116
02.43.05.60.91.51.32.00
3.14.30
1.44.0
11.40
3.22.43.14.81.49.02.30.91.13.6
00000001000000100000000000
0000000
0.6000000
0.700000000000
814139
142710261816218
1123329
293454
132410211228
00000000000000000000000000
00000000000000000000000000

26
The Many Faces of Poverty (Volume 9)
SAN LUIS BacongBarangay I (Pob.)Barangay II (Pob.)Barangay III (Pob.)Barangay IV (Pob.)DibaloDibayabayDibutDikapinisanDimanayatDitekiDitumaboL. PimentelNonong SeniorRealSan IsidroSan JoseZarah
1591526298111
11067
16812916824081
21810721056
203
188173137
10012
1437821714919628810026712624769
239
101010001031220103
0.50
3.20
1.0000
0.50
1.50.32
0.70
0.40
1.3
100000000001000100
0.60000000000
0.4000
0.500
36485
222
151736184053154723398
44
000000000000000000
000000000000000000
Table 1. Health and Nutrition Indicators, by Barangay, Province of Aurora, 2016-2017
Municipality Barangay Number ofchildren
(0-5years old)
Malnourishedchildren
(0-5 years old)
Proportion
Children under 5years oldwho died
Number ofchildrenunder 1year old
Women deaths due topregnancy-related
causes
Magnitude Magnitude Proportion Magnitude Proportion
Number ofchildrenunder 5years old
MARIA AURORA GalintujaMalasinPongloQuirinoRamadaSan JoaquinSan JoseSan JuanSan LeonardoSanta LuciaSanto TomasSuguitVilla AuroraWenceslao
605957179105981471074459625394
127
69736821613612317112353737462111161
20321325016023
2.90
4.40.90.72.41.24.10
1.48.10
1.81.9
00000010000001
000000
0.7000000
0.8
5111230195
211879
129
2020
00000000000000
00000000000000

The Many Faces of Poverty (Volume 9)
27
CBMS Poverty Maps: Province of Aurora
Map 7. Proportion of Households Living in Makeshift Housing,by Municipality, 2016-2017
Map 8. Proportion of Households Living in Makeshift Housing,by Barangay, 2016-2017
Barangay Magnitude ProportionMunicipality
Bottom 10 Barangays
DIPACULAODINGALANCASIGURANDIPACULAODINGALANCASIGURANCASIGURANDINGALANCASIGURANDILASAG
DimabunoUmiray (Malamig)MarikitPuangiButas Na BatoBianuanCalangcuasanAplayaSan IldefonsoEsperanza
78 119 15 25 17 66 16 27 13 19
32.512.111.09.69.07.46.96.66.46.3
Municipality ProportionMagnitude
DINGALANCASIGURANDIPACULAODILASAGBALERDINALUNGANSAN LUISMARIA AURORA
201 185 168 82
106 33 42 51
3.8 3.5 3.0 2.3 1.3 1.3 1.0 0.6

28
The Many Faces of Poverty (Volume 9)
Map 10. Proportion of Households who are Informal Settlers,by Barangay, 2016-2017
Map 9. Proportion of Households who are Informal Settlers,by Municipality, 2016-2017
CBMS Poverty Maps: Province of Aurora
Barangay Magnitude ProportionMunicipalityBottom 10 Barangays
DILASAGDILASAGDINGALANCASIGURANSAN LUISSAN LUISDINALUNGANDIPACULAOSAN LUISDINGALAN
Masagana (Pob.)DiniogPalticBarangay 2 (Pob.)DitekiSan IsidroZone I (Pob.)BuenavistaRealButas Na Bato
188 87
153 18 39 46 45 13 18 18
37.216.816.114.113.712.111.210.89.69.5
Municipality ProportionMagnitude
DILASAGDINGALANSAN LUISDINALUNGANCASIGURANDIPACULAOBALERMARIA AURORA
363 301 203 110 159 86
120 114
10.1 5.7 5.0 4.3 3.0 1.5 1.4 1.2

The Many Faces of Poverty (Volume 9)
29
CBMS Poverty Maps: Province of Aurora
Map 11. Proportion of Households without Access to Safe Water Supply,by Municipality, 2016-2017
Map 12. Proportion of Households without Access to Safe Water Supply,by Barangay, 2016-2017
Barangay Magnitude ProportionMunicipality
Bottom 10 Barangays
MARIA AURORAMARIA AURORADILASAGMARIA AURORADIPACULAODINGALANMARIA AURORAMARIA AURORABALERMARIA AURORA
GalintujaVilla AuroraLawangPongloIpilTanawanBagtuDiamanObligacionAlcala
140 126 95 66
181 109 123 30
195 98
93.391.377.975.973.673.272.471.469.468.5
Municipality ProportionMagnitude
DINGALANMARIA AURORASAN LUISBALERDIPACULAOCASIGURANDINALUNGANDILASAG
928 1,430
586 1,086
591 534 228 173
17.6 15.7 14.4 13.1 10.5 10.2 8.9 4.8
30
The Many Faces of Poverty (Volume 9)
Map 14. Proportion of Households without Access to Sanitary Toilet Facilities,by Barangay, 2016-2017
Map 13. Proportion of Households without Access to Sanitary Toilet Facilities,by Municipality, 2016-2017
CBMS Poverty Maps: Province of Aurora
Barangay Magnitude ProportionMunicipalityBottom 10 Barangays
DIPACULAODIPACULAODINGALANDIPACULAOCASIGURANCASIGURANDINGALANDINGALANDIPACULAOCASIGURAN
DimabunoPuangiUmiray (Malamig)DitaleSan IldefonsoCozoIbonaCabog (Matawe)DiarabasinCulat
211 221 364 94 66
112 250 202 93 45
87.985.037.134.432.731.731.427.626.223.1
Municipality ProportionMagnitude
DINGALANDIPACULAOCASIGURANSAN LUISDILASAGMARIA AURORABALERDINALUNGAN
1,126 760 425 271 195 234 59 7
21.3 13.5 8.1 6.7 5.4 2.6 0.7 0.3
The Many Faces of Poverty (Volume 9)
31
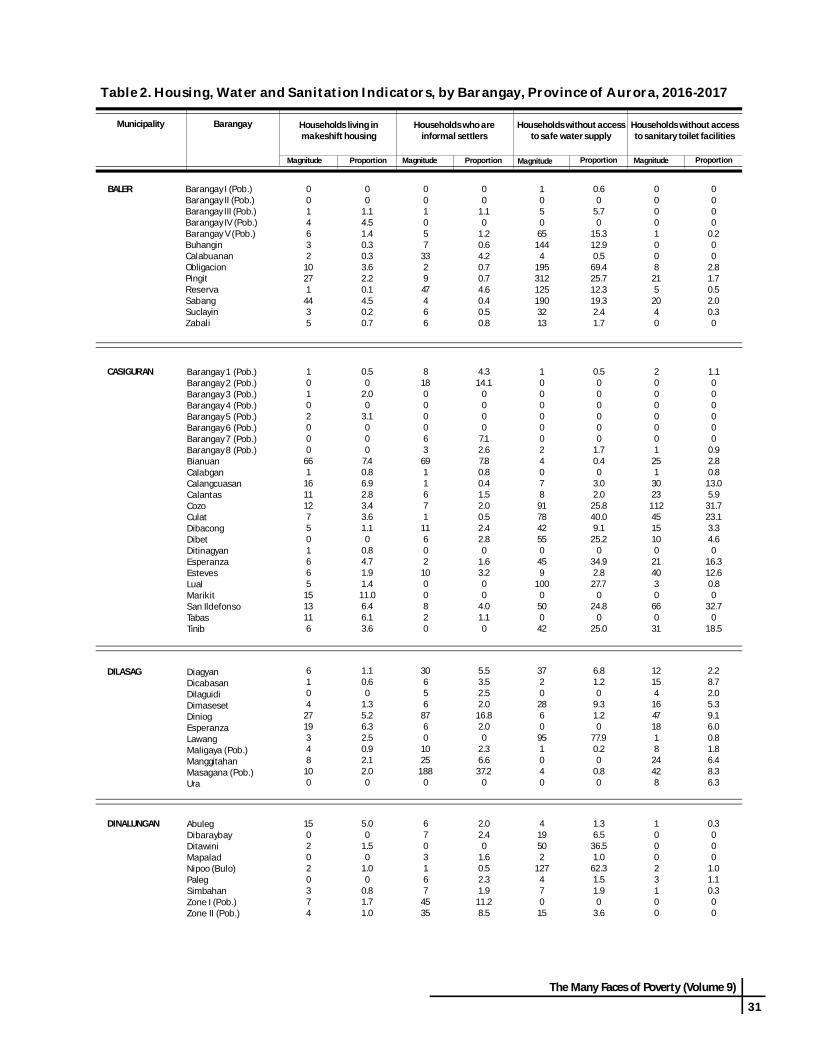
Table 2. Housing, Water and Sanitation Indicators, by Barangay, Province of Aurora, 2016-2017
Households living inmakeshift housing
Households who areinformal settlers
Households without accessto safe water supply
Households without accessto sanitary toilet facilities
BarangayMunicipality
ProportionProportion Proportion ProportionMagnitude Magnitude Magnitude Magnitude
0014632
10271
4435
00
1.14.51.40.30.33.62.20.14.50.20.7
001057
332947466
00
1.10
1.20.64.20.70.74.60.40.50.8
105065
1444
1953121251903213
0.60
5.70
15.312.90.5
69.425.712.319.32.41.7
00001008
215
2040
0000
0.200
2.81.70.52.00.30
1502020374
5.00
1.50
1.00
0.81.71.0
6703167
4535
2.02.40
1.60.52.31.9
11.28.5
419502
12747015
1.36.5
36.51.0
62.31.51.90
3.6
100023100
0.3000
1.01.10.300
BALER
CASIGURAN Barangay 1 (Pob.)Barangay 2 (Pob.)Barangay 3 (Pob.)Barangay 4 (Pob.)Barangay 5 (Pob.)Barangay 6 (Pob.)Barangay 7 (Pob.)Barangay 8 (Pob.)BianuanCalabganCalangcuasanCalantasCozoCulatDibacongDibetDitinagyanEsperanzaEstevesLualMarikitSan IldefonsoTabasTinib
DILASAG DiagyanDicabasanDilaguidiDimasesetDiniogEsperanzaLawangMaligaya (Pob.)ManggitahanMasagana (Pob.)Ura
DINALUNGAN AbulegDibaraybayDitawiniMapaladNipoo (Bulo)PalegSimbahanZone I (Pob.)Zone II (Pob.)
Barangay I (Pob.)Barangay II (Pob.)Barangay III (Pob.)Barangay IV (Pob.)Barangay V (Pob.)BuhanginCalabuananObligacionPingitReservaSabangSuclayinZabali
10102000
661
1611127501665
1513116
0.50
2.00
3.1000
7.40.86.92.83.43.61.10
0.84.71.91.411.06.46.13.6
818000063
6911671
11602
1000820
4.314.1
0000
7.12.67.80.80.41.52.00.52.42.80
1.63.200
4.01.10
100000024078917842550459
100050042
0.5000000
1.70.40
3.02.0
25.840.09.1
25.20
34.92.827.7
024.8
025.0
20000001
251
30231124515100
214030
660
31
1.1000000
0.92.80.8
13.05.9
31.723.13.34.60
16.312.60.80
32.70
18.5
6104
2719348
100
1.10.60
1.35.26.32.50.92.12.00
30656
8760
1025
1880
5.53.52.52.0
16.82.00
2.36.637.2
0
37202860951040
6.81.20
9.31.20
77.90.20
0.80
12154
16471818
24428
2.28.72.05.39.16.00.81.86.48.36.3
32
The Many Faces of Poverty (Volume 9)
Table 2. Housing, Water and Sanitation Indicators, by Barangay, Province of Aurora, 2016-2017
Households living inmakeshift housing
Households who areinformal settlers
Households without accessto safe water supply
Households without accessto sanitary toilet facilities
BarangayMunicipality
ProportionProportion Proportion ProportionMagnitude Magnitude Magnitude Magnitude
DINGALAN AplayaButas Na BatoCabog (Matawe)CaragsacanDavildavilanDikapanikianIbonaPalticPoblacionTanawanUmiray (Malamig)
5218
202433
16250159
712
364
12.89.527.67.41.4
21.331.416.83.48.137.1
27170
13314467
119
6.69.00
2.21.41.30.50.42.94.7
12.1
34187
131215
15313441
8.49.51.02.25.61.30.616.16.32.74.2
27
36233903485990
109233
0.53.74.9
39.842.345.310.710.4
073.223.7
DIPACULAO BayabasBorlonganBuenavistaCalaocanDiamanenDianedDiarabasinDibutunanDimabunoDinadiawanDitaleGupaIpilLaboyLipitLobbotMaligayaMijaresMucdolNorth PoblacionPuangiSalaySapangkawayanSouth PoblacionToytoyan
00503076
7813501000002
14254221
50
19389
931
21138940425435
224
2215112
5.30
15.82.4
11.06.1
26.20.787.97.4
34.40
1.62.62.34.02.22.17.60.9851.41.00.32.0
00
4.20
4.10
2.03.9
32.52.51.80
0.400000
0.73.19.61.12.10.71.0
3113030100170030760601521080
3.20.2
10.80
4.10
0.300
3.300
1.20
3.25.90
2.50
3.40.80.30
2.70
2101
102049441
3096
1811031031723350
3327436
2.11.80.88.127.433.11.12.60.45.83.36.1
73.613.014.2
02.27.17.97.80
9.22.1
25.335.3
MARIA AURORA AlcalaBagtuBangcoBannawagBarangay I (Pob.)Barangay II (Pob.)Barangay III (Pob.)Barangay IV (Pob.)BauboBayanihanBazalCabituculan EastCabituculan WestCadayacanDebucaoDecoliatDetailenDiaatDialatmanDiamanDianawanDikilditDimanpudsoDiomeEstoniloFlorida
01033503015212411000130112
04044502007209
29183082
1830039
02.40
3.31.61.20
0.300
2.21.10
2.88.5
15.51.70
21.64.86.31.100
1.62.3
00.60
2.41.21.20
0.50
0.51.51.10.70.61.20.90.6000
0.41.10
0.50.50.5
06395333732186608210412101
03.51.87.32.00.71.40.54.51.40.60.65.91.91.80
4.40.62.70
1.40.40.70.50
0.3
981236160101
18162
563
206744
9020307013001
68.572.436.34.90
0.20
0.211.67.50.6
32.22.26.31.8
63.82.2
25.654.171.424.60.41.000
0.3

The Many Faces of Poverty (Volume 9)
33
Table 2. Housing, Water and Sanitation Indicators, by Barangay, Province of Aurora, 2016-2017
Households living inmakeshift housing
Households who areinformal settlers
Households without accessto safe water supply
Households without accessto sanitary toilet facilities
BarangayMunicipality
ProportionProportion Proportion ProportionMagnitude Magnitude Magnitude Magnitude
1000100326321154004
3.600
1.200
1.31.81.81.30.70.20.61.12.100
1.1
24011628862
39244
11184603
8.60
1.51.23.76.73.47.11.80.8
13.74.82.22.39.6
12.10
0.8
210161119141512
15229
1251868243248
7.60
1.57.56.8
63.35.9
13.43.6
63.610.225.010.114.51.1
11.31.6
13.2
1602105
15143029272117262380
37
5.80
3.01.20
16.76.3
12.59.1
12.19.54.29.65.5
12.32.10
10.2
SAN LUIS BacongBarangay I (Pob.)Barangay II (Pob.)Barangay III (Pob.)Barangay IV (Pob.)DibaloDibayabayDibutDikapinisanDimanayatDitekiDitumaboL. PimentelNonong SeniorRealSan IsidroSan JoseZarah
MARIA AURORA GalintujaMalasinPongloQuirinoRamadaSan JoaquinSan JoseSan JuanSan LeonardoSanta LuciaSanto TomasSuguitVilla AuroraWenceslao
00113030020100
9189
140
2417162391
6.00.79.21.75.30
7.29.11.05.11.22.76.50.3
00
1.10.21.10
0.900
1.70
0.900
000
115043010311
000
2.11.90
1.21.60
0.90
2.70.70.3
14012660060
82309
70126212
93.38.9
75.900
1.50
43.93.10
5.363.691.367.7

34
The Many Faces of Poverty (Volume 9)
Map 16. Proportion of Children 6-11 Years Old Not Attending Elementary School,by Barangay, 2016-2017
Map 15. Proportion of Children 6-11 Years Old Not Attending Elementary School,by Municipality, 2016-2017
CBMS Poverty Maps: Province of Aurora
Barangay Magnitude ProportionMunicipalityBottom 10 Barangays
CASIGURANCASIGURANMARIA AURORADIPACULAODIPACULAOCASIGURANBALERMARIA AURORAMARIA AURORASAN LUIS
Barangay 5 (Pob.)CalabganRamadaDitaleDimabunoDibetBarangay I (Pob.)BangcoDecoliatDiteki
6 14 24 27 21 18 8
12 10 24
23.118.717.815.914.614.114.013.012.812.6
Municipality ProportionMagnitude
CASIGURANDINALUNGANDILASAGBALERDINGALANDIPACULAOMARIA AURORASAN LUIS
268 129 176 373 245 251 330 166
8.9 8.6 8.2 8.0 7.5 7.3 6.8 6.6

The Many Faces of Poverty (Volume 9)
35
CBMS Poverty Maps: Province of Aurora
Map 17. Proportion of Children 12-15 Years Old Not Attending High School,by Municipality, 2016-2017
Map 18. Proportion of Children 12-15 Years Old Not Attending High School,by Barangay, 2016-2017
Barangay Magnitude ProportionMunicipality
Bottom 10 Barangays
CASIGURANSAN LUISCASIGURANDINGALANCASIGURANDINGALANDINALUNGANDIPACULAOSAN LUISDINGALAN
Barangay 6 (Pob.)DibutEsperanzaAplayaCulatDavildavilanDitawiniDitaleDikapinisanDikapanikian
5423091383240427614
71.465.653.650.848.748.547.645.745.245.2
Magnitude ProportionMunicipality
DINGALANCASIGURANSAN LUISDILASAGDIPACULAODINALUNGANBALERMARIA AURORA
781607437348537244691577
36.029.727.326.325.424.722.120.3

36
The Many Faces of Poverty (Volume 9)
Map 20. Proportion of Children 6-15 Years Old Not Attending School,by Barangay, 2016-2017
Map 19. Proportion of Children 6-15 Years Old Not Attending School,by Municipality, 2016-2017
CBMS Poverty Maps: Province of Aurora
Barangay Magnitude ProportionMunicipalityBottom 10 Barangays
DibutBarangay 5 (Pob.)DianedCalabganDitawiniLawangDitekiCabog (Matawe)AplayaButas Na Bato
245
1811159
24603013
15.212.510.39.18.17.97.77.27.15.9
Magnitude ProportionMunicipality
DINGALANDILASAGSAN LUISDIPACULAODINALUNGANCASIGURANMARIA AURORABALER
26312312315368
133166153
4.83.53.02.82.72.62.12.0
SAN LUISCASIGURANDIPACULAOCASIGURANDINALUNGANDILASAGSAN LUISDINGALANDINGALANDINGALAN

The Many Faces of Poverty (Volume 9)
37
Table 3. Education Indicators, by Barangay, Province of Aurora, 2016-2017
Number ofchildren (6-
11 years old)
Children notattending
elementary school(6-11 years old)
Number ofchildren (12-15 years old)
Children not attendinghigh school
(12-15 years old)
Number ofchildren (6-
15 yearsold)
Children notattending school(6-15 years old)
BarangayMunicipality
Magnitude Magnitude MagnitudeProportion Proportion Proportion
57233025
229634544177816568528596450
8023
214743128168213037
14.00
6.712.09.27.47.96.89.9
12.04.05.08.2
53272723
149410300116551376412415267
1296740707648
134114587344
22.633.322.230.426.817.125.341.424.330.314.117.616.5
110505748
3781,044844293
1,367944940
1,011717
0200
1014244
3020152311
0400
2.61.32.81.42.22.11.62.31.5
15720310188
143158214240200
181182
168
192819
11.55.47.92.3
11.25.18.9
11.79.5
1219984629381151156142
40124083415433319
33.112.147.612.936.618.528.521.213.4
278302185150236239365396342
113
152
102
1375
4.01.08.11.34.20.83.61.81.5
BALER Barangay I (Pob.)Barangay II (Pob.)Barangay III (Pob.)Barangay IV (Pob.)Barangay V (Pob.)BuhanginCalabuananObligacionPingitReservaSabangSuclayinZabali
CASIGURAN Barangay 1 (Pob.)Barangay 2 (Pob.)Barangay 3 (Pob.)Barangay 4 (Pob.)Barangay 5 (Pob.)Barangay 6 (Pob.)Barangay 7 (Pob.)Barangay 8 (Pob.)BianuanCalabganCalangcuasanCalantasCozoCulatDibacongDibetDitinagyanEsperanzaEstevesLualMarikitSan IldefonsoTabasTinib
DILASAG DiagyanDicabasanDilaguidiDimasesetDiniogEsperanzaLawangMaligaya (Pob.)ManggitahanMasagana (Pob.)Ura
DINALUNGAN AbulegDibaraybayDitawiniMapaladNipoo (Bulo)PalegSimbahanZone I (Pob.)Zone II (Pob.)
8669244826104954442751002292731303091285876
18022476
12512094
66236153
32148
242212361876
11107
10118
7.08.78.36.2
23.110
10.25.67.2
18.78.0
10.58.19.2
11.714.112.17.96.14.59.28.09.28.5
655110251472533
3574673
16415078
222814356
13014446838756
1617153578
91111836463883211430354315212815
24.633.310.020.021.471.428.024.225.523.924.722.030.748.737.425.932.653.626.929.932.625.332.226.8
151120347340177487
799121173393423208531209101132310368122208207150
40105010
22115
1117
24864541841
2.60
2.90
12.50
1.40
2.89.12.92.80.23.44.53.85.93.01.61.10.83.81.90.7
3419911518836219171
22421127967
325
122034224
1212212
9.45.1
10.410.69.4
11.55.65.45.77.53.0
210775996
23511343
14014115949
503111298821152629399
23.840.318.630.237.418.634.918.620.624.518.4
551176174284597304114364352438116
1694
13201196
14183
2.95.12.34.63.43.67.91.64.04.12.6

38
The Many Faces of Poverty (Volume 9)
Table 3. Education Indicators, by Barangay, Province of Aurora, 2016-2017
Number ofchildren (6-
11 years old)
Children notattending
elementary school(6-11 years old)
Number ofchildren (12-15 years old)
Children not attendinghigh school
(12-15 years old)
Number ofchildren (6-
15 yearsold)
Children notattending school(6-15 years old)
BarangayMunicipality
Magnitude Magnitude MagnitudeProportion Proportion Proportion
2441315053229567
50959498
106593
271663963
234662
44
11.112.212.52.86.34.54.57.76.11.97.4
17988
3252026631
3134266668
405
9134
13548321485
133924176
50.838.641.523.848.545.227.231.213.635.343.5
42321983052416198
8221,020164174998
3013601351
345378
39
7.15.97.22.53.11.04.15.24.34.63.9
DINGALAN AplayaButas Na BatoCabog (Matawe)CaragsacanDavildavilanDikapanikianIbonaPalticPoblacionTanawanUmiray (Malamig)
DIPACULAO BayabasBorlonganBuenavistaCalaocanDiamanenDianedDiarabasinDibutunanDimabunoDinadiawanDitaleGupaIpilLaboyLipitLobbotMaligayaMijaresMucdolNorth PoblacionPuangiSalaySapangkawayanSouth PoblacionToytoyan
MARIA AURORA AlcalaBagtuBangcoBannawagBarangay I (Pob.)Barangay II (Pob.)Barangay III (Pob.)Barangay IV (Pob.)BauboBayanihanBazalCabituculan EastCabituculan WestCadayacanDebucaoDecoliatDetailenDiaatDialatmanDiamanDianawanDikilditDimanpudsoDiomeEstoniloFlorida
7710092691471929425593156198101651801827882199121915214511811297
198
27
127
13126
206
10103697
105
1111
105
13939
2.67.0
13.010.18.86.26.47.86.56.45.13.09.25.03.8
12.86.15.58.35.36.63.4
11.08.03.14.5
3662625288
14080
16765871074427
11110448608211248570545647
110
15122213263326221913131110182088
1644
266
128317
41.719.435.525.029.523.632.513.229.214.912.125.037.016.219.216.713.319.536.416.730.68.622.214.36.415.5
11316215412123533217442215824330514592
2912861261422812343
237215172168144308
53846983919248251911
1014415
4.41.95.23.32.62.74.60.75.70.43.01.44.32.70.74.00.73.24.32.34.20.52.32.40.71.6
48322739065107187119144367170581484612957731201542721692066515586
2387
1046
125
2122274917427
11201170
113
4.211.89.6
11.16.25.66.44.2
14.66.0
15.96.96.12.25.47.02.75.87.17.46.53.40
7.13.5
3318547523768
1276570
22992248730873547
100109162120117379160
4695
22152535161860428
131
20118
13154038129
1523
12.137.310.642.340.536.827.624.625.726.245.733.314.93.323.031.417.013.013.824.731.710.324.316.538.3
8150712014210217531418421459626282
23576
21692
120220263434289323102246146
218323
18670
182280812751787333
2.53.62.51.42.9
10.31.93.80
3.00.82.43.40
3.71.11.73.21.93.92.82.22.91.22.1

The Many Faces of Poverty (Volume 9)
39
Table 3. Education Indicators, by Barangay, Province of Aurora, 2016-2017
Number ofchildren (6-
11 years old)
Children notattending
elementary school(6-11 years old)
Number ofchildren (12-15 years old)
Children not attendinghigh school
(12-15 years old)
Number ofchildren (6-
15 yearsold)
Children notattending school(6-15 years old)
BarangayMunicipality
Magnitude Magnitude MagnitudeProportion Proportion Proportion
817548
22713518119312147849859
120197
32317241413938338
13
3.72.76.27.517.87.76.77.46.49.53.15.16.76.6
464630
1249489
125652843474585
100
9106211223331075362621
19.621.720.016.912.825.826.415.425.011.66.4
13.330.621.0
1271217835122927031818675
127145104205297
21087761221150
1.60.80
2.33.12.61.90.52.71.60.71.02.40
SAN LUIS BacongBarangay I (Pob.)Barangay II (Pob.)Barangay III (Pob.)Barangay IV (Pob.)DibaloDibayabayDibutDikapinisanDimanayatDitekiDitumaboL. PimentelNonong SeniorRealSan IsidroSan JoseZarah
MARIA AURORA GalintujaMalasinPongloQuirinoRamadaSan JoaquinSan JoseSan JuanSan LeonardoSanta LuciaSanto TomasSuguitVilla AuroraWenceslao
16816263878151599428013119030510728212323166215
801120
105
351124103
226
1279
4.80
3.82.62.60
6.35.3
12.58.4
12.63.32.87.84.95.2
10.64.2
93102937458
10664
16888
1202075717571
13937
149
2135521
224276395130194312271128
22.630.017.213.54.4
12.520.865.645.244.342.514.533.324.616.919.429.718.8
261265575
12323
265158448219310512164457194370103364
4010006
24101024113
118434
1.50
1.8000
2.315.22.24.67.72.11.82.44.11.12.91.1

40
The Many Faces of Poverty (Volume 9)
Map 22. Proportion of Households with Income Below the Poverty Threshold,by Barangay, 2016-2017
Map 21. Proportion of Households with Income Below the Poverty Threshold,by Municipality, 2016-2017
CBMS Poverty Maps: Province of Aurora
Barangay Magnitude ProportionMunicipalityBottom 10 Barangays
CASIGURANSAN LUISSAN LUISCASIGURANDIPACULAOSAN LUISCASIGURANSAN LUISCASIGURANDIPACULAO
DitinagyanDibutDimanayatDibacongDimabunoDibayabayCalabganDibaloDibetPuangi
12110521741721721412027
192221
97.693.890.890.790.490.390.290.088.185.0
Magnitude ProportionMunicipality
SAN LUISCASIGURANDINGALANDILASAGDINALUNGANDIPACULAOMARIA AURORABALER
2,7783,5463,5292,3371,5113,1763,6202,732
68.467.766.864.858.856.639.632.9
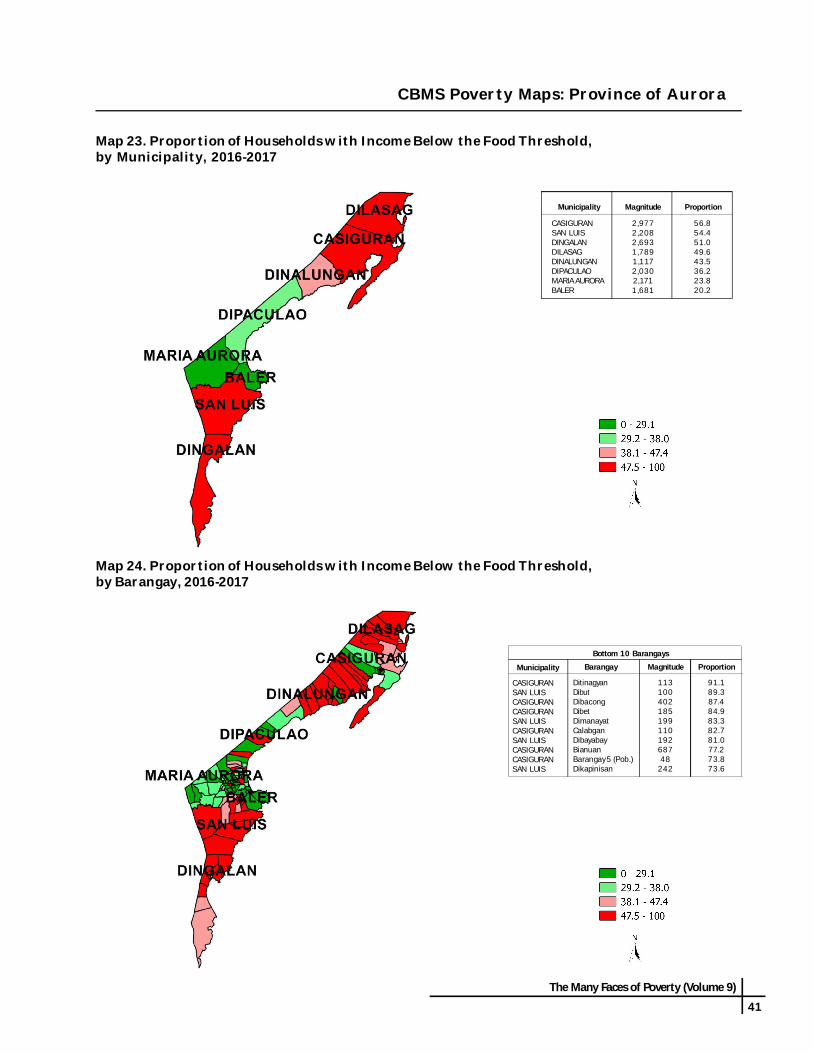
The Many Faces of Poverty (Volume 9)
41
CBMS Poverty Maps: Province of Aurora
Map 23. Proportion of Households with Income Below the Food Threshold,by Municipality, 2016-2017
Map 24. Proportion of Households with Income Below the Food Threshold,by Barangay, 2016-2017
Barangay Magnitude ProportionMunicipality
Bottom 10 Barangays
CASIGURANSAN LUISCASIGURANCASIGURANSAN LUISCASIGURANSAN LUISCASIGURANCASIGURANSAN LUIS
DitinagyanDibutDibacongDibetDimanayatCalabganDibayabayBianuanBarangay 5 (Pob.)Dikapinisan
11310040218519911019268748
242
91.189.387.484.983.382.781.077.273.873.6
Magnitude ProportionMunicipality
CASIGURANSAN LUISDINGALANDILASAGDINALUNGANDIPACULAOMARIA AURORABALER
2,9772,2082,6931,7891,1172,0302,1711,681
56.854.451.049.643.536.223.820.2

42
The Many Faces of Poverty (Volume 9)
Map 26. Proportion of Households who Experienced Hunger Due to Food Shortage,by Barangay, 2016-2017
Map 25. Proportion of Households who Experienced Hunger Due to Food Shortage,by Municipality, 2016-2017
CBMS Poverty Maps: Province of Aurora
Barangay Magnitude ProportionMunicipalityBottom 10 Barangays
BALERDINGALANSAN LUISDINGALANDINGALANBALERBALERDINGALANDINGALANCASIGURAN
ObligacionUmiray (Malamig)DitekiPalticDikapanikianPingitSabangButas Na BatoAplayaBianuan
5013037836
72488
1732
17.813.213.08.78.05.94.94.24.23.6
Magnitude ProportionMunicipality
DINGALANBALERSAN LUISCASIGURANDINALUNGANMARIA AURORADILASAGDIPACULAO
25418641474
1523
4.82.21.00.90.20.20.10.1

The Many Faces of Poverty (Volume 9)
43
Table 4. Income Poverty and Hunger Indicators, by Barangay, Province of Aurora, 2016-2017
128
22774
438288157450441412240183
7.411.425.38.017.539.236.555.937.043.441.918.324.0
9416542
30220197
238302242112111
5.65.718.45.79.927.025.434.519.629.724.68.514.6
0100
1500
50720
4800
01.400
3.500
17.85.90
4.900
768632475441718074512010420317310541719212178
2201398714713375
40.967.264.079.783.168.384.569.083.790.245.051.749.053.890.788.197.660.569.438.564.072.874.344.6
4969223948345960
68711066
14011777
40218511361
19210163
12511345
26.353.944.066.173.856.770.251.777.282.728.635.633.139.587.484.991.147.360.628.046.361.963.126.8
10000000
32000008000050100
0.50000000
3.600000
1.70000
1.40
0.500
Households with income below thepoverty threshold
Households with income below thefood threshold
Households who experienced hungerdue to food shortage
BarangayMunicipality
Magnitude Magnitude MagnitudeProportion Proportion Proportion
36410912818940819976
25524327987
66.863.463.762.878.866.162.358.464.655.169.0
28382
1031433341365217819920574
51.947.751.247.564.545.242.640.752.940.558.7
11000000000
0.20.6000000000
BALER Barangay I (Pob.)Barangay II (Pob.)Barangay III (Pob.)Barangay IV (Pob.)Barangay V (Pob.)BuhanginCalabuananObligacionPingitReservaSabangSuclayinZabali
CASIGURAN Barangay 1 (Pob.)Barangay 2 (Pob.)Barangay 3 (Pob.)Barangay 4 (Pob.)Barangay 5 (Pob.)Barangay 6 (Pob.)Barangay 7 (Pob.)Barangay 8 (Pob.)BianuanCalabganCalangcuasanCalantasCozoCulatDibacongDibetDitinagyanEsperanzaEstevesLualMarikitSan IldefonsoTabasTinib
DILASAG DiagyanDicabasanDilaguidiDimasesetDiniogEsperanzaLawangMaligaya (Pob.)ManggitahanMasagana (Pob.)Ura
DINALUNGAN AbulegDibaraybayDitawiniMapaladNipoo (Bulo)PalegSimbahanZone I (Pob.)Zone II (Pob.)
20321199
132134179242181130
67.772.072.368.865.767.367.044.931.6
15717279
10110114219310666
52.358.757.752.649.553.453.526.316.0
000040000
0000
2.00000

44
The Many Faces of Poverty (Volume 9)
Table 4. Income Poverty and Hunger Indicators, by Barangay, Province of Aurora, 2016-2017
2501335164071306351969891102620
61.470.470.469.661.084.065.173.644.268.563.1
183106406303105543765526579
464
45.056.155.451.849.372.047.258.231.653.047.3
17814063
8302
130
4.24.20.10.70
8.00.48.70
1.313.2
7328065824556
256672173001934210760
1167173
114130199221175709965
76.850.654.266.761.637.872.143.890.458.470.742.943.577.953.270.353.347.944.744.685.048.672.233.963.7
481614347322117029
1321831482871486853567187
129147108525642
50.529.135.838.243.814.247.919.055.035.654.228.628.962.331.252.540.929.829.928.956.530.053.619.241.2
0010000000000000000100100
00
0.80000000000000000
0.200
1.000
Households with income below thepoverty threshold
Households with income below thefood threshold
Households who experienced hungerdue to food shortage
BarangayMunicipality
Magnitude Magnitude MagnitudeProportion Proportion Proportion
5082554757
14047
17777
1131014736
1591304456
1812025
15493
1329453
145
35.048.232.738.223.432.421.529.749.752.831.127.026.549.838.037.931.151.454.159.554.235.543.945.928.837.8
25463130367526
112498853342792663139
1221514934979702589
17.527.118.524.414.817.411.918.831.641.116.319.519.928.819.326.721.734.740.533.332.718.726.234.113.623.2
00120040000010001010100000
00
0.61.600
1.800000
0.7000
0.60
2.70
0.400000
DINGALAN AplayaButas Na BatoCabog (Matawe)CaragsacanDavildavilanDikapanikianIbonaPalticPoblacionTanawanUmiray (Malamig)
DIPACULAO BayabasBorlonganBuenavistaCalaocanDiamanenDianedDiarabasinDibutunanDimabunoDinadiawanDitaleGupaIpilLaboyLipitLobbotMaligayaMijaresMucdolNorth PoblacionPuangiSalaySapangkawayanSouth PoblacionToytoyan
MARIA AURORA AlcalaBagtuBangcoBannawagBarangay I (Pob.)Barangay II (Pob.)Barangay III (Pob.)Barangay IV (Pob.)BauboBayanihanBazalCabituculan EastCabituculan WestCadayacanDebucaoDecoliatDetailenDiaatDialatmanDiamanDianawanDikilditDimanpudsoDiomeEstoniloFlorida

The Many Faces of Poverty (Volume 9)
45
Table 4. Income Poverty and Hunger Indicators, by Barangay, Province of Aurora, 2016-2017
7363441938918999783949666079184
48.746.750.636.134.047.629.841.740.641.938.654.557.258.8
533127
12446
1124952262933344297
35.323.031.023.217.628.214.827.827.124.819.330.930.431.0
00002001010000
0000
0.800
0.50
0.90000
1908
23467527
21410527321720431211830213523379217
68.319.534.357.546.690.090.393.883.090.871.862.466.364.372.261.363.259.6
154517375422
19210024219916321977
22910417863
153
55.412.225.446.233.573.381.089.373.683.357.443.843.348.755.646.850.442.0
0010000010
370000020
00
1.500000
0.30
13.000000
1.60
Households with income below thepoverty threshold
Households with income below thefood threshold
Households who experienced hungerdue to food shortage
BarangayMunicipality
Magnitude Magnitude MagnitudeProportion Proportion Proportion
SAN LUIS BacongBarangay I (Pob.)Barangay II (Pob.)Barangay III (Pob.)Barangay IV (Pob.)DibaloDibayabayDibutDikapinisanDimanayatDitekiDitumaboL. PimentelNonong SeniorRealSan IsidroSan JoseZarah
MARIA AURORA GalintujaMalasinPongloQuirinoRamadaSan JoaquinSan JoseSan JuanSan LeonardoSanta LuciaSanto TomasSuguitVilla AuroraWenceslao
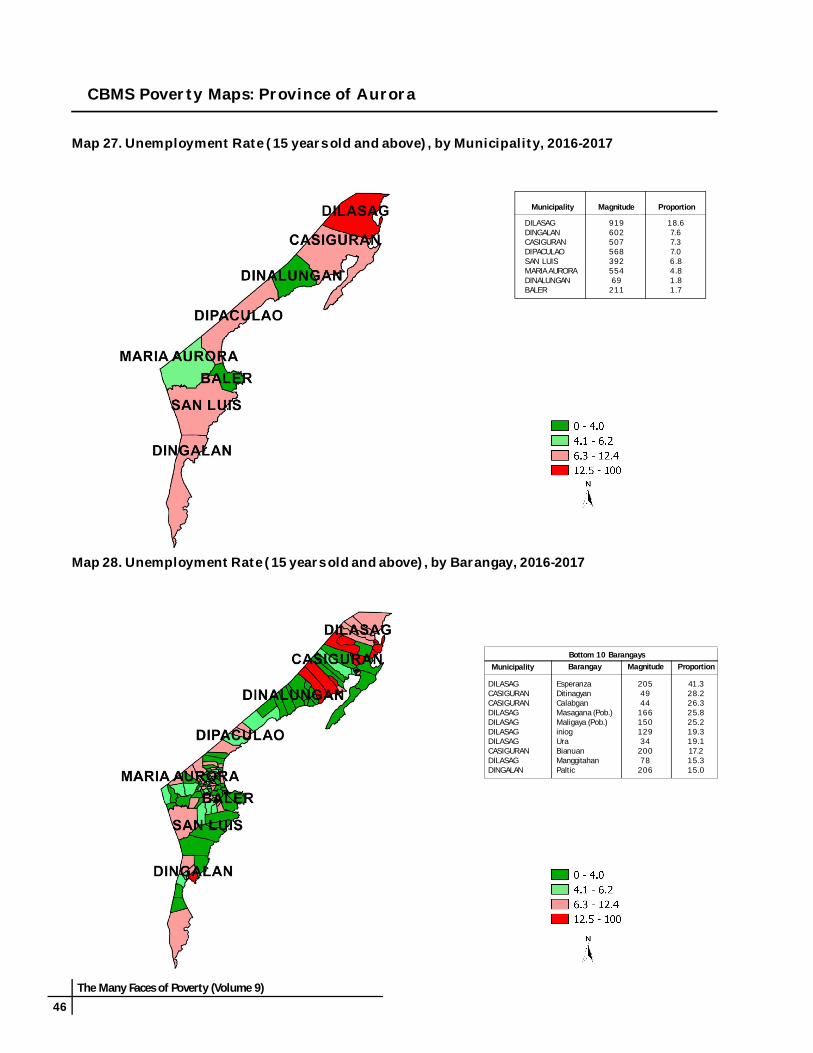
46
The Many Faces of Poverty (Volume 9)
Map 28. Unemployment Rate (15 years old and above), by Barangay, 2016-2017
Map 27. Unemployment Rate (15 years old and above), by Municipality, 2016-2017
CBMS Poverty Maps: Province of Aurora
Barangay Magnitude ProportionMunicipalityBottom 10 Barangays
DILASAGCASIGURANCASIGURANDILASAGDILASAGDILASAGDILASAGCASIGURANDILASAGDINGALAN
EsperanzaDitinagyanCalabganMasagana (Pob.)Maligaya (Pob.)iniogUraBianuanManggitahanPaltic
2054944
16615012934
20078
206
41.328.226.325.825.219.319.117.215.315.0
Magnitude ProportionMunicipality
DILASAGDINGALANCASIGURANDIPACULAOSAN LUISMARIA AURORADINALUNGANBALER
91960250756839255469
211
18.67.67.37.06.84.81.81.7

The Many Faces of Poverty (Volume 9)
47
CBMS Poverty Maps: Province of Aurora
Map 29. Proportion of Persons who are Victims of Crimes, by Municipality, 2016-2017
Map 30. Proportion of Persons who are Victims of Crimes, by Barangay, 2016-2017
Magnitude ProportionMunicipality
DINGALANBALERDILASAGCASIGURANDIPACULAOSAN LUISMARIA AURORADINALUNGAN
433837
10840
0.20.10.00.00.00.00.00
Barangay Magnitude ProportionMunicipalityBottom 10 Barangays
BALERDINGALANDILASAGDIPACULAOCASIGURANDIPACULAOBALERDINGALANCASIGURANCASIGURAN
Barangay V (Pob.)Umiray (Malamig)DicabasanNorth PoblacionBarangay 5 (Pob.)DianedBarangay III (Pob.)Butas Na BatoCalantasEsperanza
232338121231
1.30.50.50.40.40.30.30.20.20.2

48
The Many Faces of Poverty (Volume 9)
Table 5. Unemployment and Victims of Crime Indicators, by Barangay,Province of Aurora, 2016-2017
Unemployment rate(15 years old and above)
Persons who are victims of crimesNumber of persons in thelabor force
(15 years old and above)
BarangayMunicipality
ProportionProportion MagnitudeMagnitude
250104122142707
1,4161,233429
1,8951,3951,5561,7571,122
15214
2315244
3120173124
6.01.90.82.83.31.11.90.91.61.41.11.82.1
0010
2300360500
00
0.30
1.300
0.20.10
0.100
27317237796858
102150
1,164167300584476296447280174192389579192250259244
111406311
20044142378
145
496
2747679
14
4.00.6
10.80
8.85.21.00.717.226.34.73.91.52.73.11.8
28.23.16.98.13.12.83.55.7
100010001003000001000000
0.1000
0.4000000
0.200000
0.2000000
765274265406669496143596510643178
86211733
129205
015078
16634
11.27.76.48.1
19.341.3
025.215.325.819.1
03000000000
00.5000000000
BALER Barangay I (Pob.)Barangay II (Pob.)Barangay III (Pob.)Barangay IV (Pob.)Barangay V (Pob.)BuhanginCalabuananObligacionPingitReservaSabangSuclayinZabali
CASIGURAN Barangay 1 (Pob.)Barangay 2 (Pob.)Barangay 3 (Pob.)Barangay 4 (Pob.)Barangay 5 (Pob.)Barangay 6 (Pob.)Barangay 7 (Pob.)Barangay 8 (Pob.)BianuanCalabganCalangcuasanCalantasCozoCulatDibacongDibetDitinagyanEsperanzaEstevesLualMarikitSan IldefonsoTabasTinib
DILASAG DiagyanDicabasanDilaguidiDimasesetDiniogEsperanzaLawangMaligaya (Pob.)ManggitahanMasagana (Pob.)Ura
DINALUNGAN AbulegDibaraybayDitawiniMapaladNipoo (Bulo)PalegSimbahanZone I (Pob.)Zone II (Pob.)
470422261294323375599612584
1619546
117
10
3.40.23.41.71.21.61.81.11.7
000000000
000000000

The Many Faces of Poverty (Volume 9)
49
Table 5. Unemployment and Victims of Crime Indicators, by Barangay,Province of Aurora, 2016-2017
Unemployment rate(15 years old and above)
Persons who are victims of crimesNumber of persons in thelabor force
(15 years old and above)
BarangayMunicipality
ProportionProportion MagnitudeMagnitude
692339
1,044729313134
1,1521,369314189
1644
67212140344
212062515
148
9.76.22.05.5
10.93.01.8
15.08.07.99.0
228110060023
0.10.20.20
0.100
0.100
0.5
10687418919811723640923830476432812637484
333121148419319729340564160475152
46110781720204
38124
433
2745
421080315911426
3.87.05.33.56.87.24.98.41.35.03.73.2
11.53.68.13.33.4
10.03.1
11.09.1
10.56.98.83.9
0000020000000000000800000
00000
0.30000000000000
0.400000
1562242031733716103327561632634412261755004431472353795156
340332291231275436
1417145
272419513
15169517873
2622
161015129
34
9.07.66.92.97.33.95.76.71.85.73.64.02.93.41.84.81.36.93.93.64.73.05.25.23.37.8
00000000001000000000010001
0000000000
0.10000000000
0.1000
0.1
DINGALAN AplayaButas Na BatoCabog (Matawe)CaragsacanDavildavilanDikapanikianIbonaPalticPoblacionTanawanUmiray (Malamig)
DIPACULAO BayabasBorlonganBuenavistaCalaocanDiamanenDianedDiarabasinDibutunanDimabunoDinadiawanDitaleGupaIpilLaboyLipitLobbotMaligayaMijaresMucdolNorth PoblacionPuangiSalaySapangkawayanSouth PoblacionToytoyan
MARIA AURORA AlcalaBagtuBangcoBannawagBarangay I (Pob.)Barangay II (Pob.)Barangay III (Pob.)Barangay IV (Pob.)BauboBayanihanBazalCabituculan EastCabituculan WestCadayacanDebucaoDecoliatDetailenDiaatDialatmanDiamanDianawanDikilditDimanpudsoDiomeEstoniloFlorida

50
The Many Faces of Poverty (Volume 9)
Table 5. Unemployment and Victims of Crime Indicators, by Barangay,Province of Aurora, 2016-2017
Unemployment rate(15 years old and above)
Persons who are victims of crimesNumber of persons in thelabor force
(15 years old and above)
BarangayMunicipality
ProportionProportion MagnitudeMagnitude
213170127605366387463266108168210126175342
1854
356
27198785
124
16
8.52.93.15.81.67.04.13.06.54.82.49.52.34.7
00001000000000
0000
0.1000000000
40879
10012126543307135435298488642227619275583185561
384
1115393
112
14104629143125522
46
9.35.1
11.012.414.77.03.61.53.23.49.44.56.25.09.18.91.18.2
000000000023010101
0000000000
0.10.10
0.00
0.10
0.1
SAN LUIS BacongBarangay I (Pob.)Barangay II (Pob.)Barangay III (Pob.)Barangay IV (Pob.)DibaloDibayabayDibutDikapinisanDimanayatDitekiDitumaboL. PimentelNonong SeniorRealSan IsidroSan JoseZarah
MARIA AURORA GalintujaMalasinPongloQuirinoRamadaSan JoaquinSan JoseSan JuanSan LeonardoSanta LuciaSanto TomasSuguitVilla AuroraWenceslao

The Many Faces of Poverty (Volume 9)
51
CBMS Poverty Maps: Province of Aurora
Map 31. CBMS Composite Indicator, by Municipality, 2016-2017
Map 32. CBMS Composite Indicator, by Barangay, 2016-2017
AverageMunicipality
DINGALANSAN LUISCASIGURANDILASAGDIPACULAODINALUNGANMARIA AURORABALER
1.91.61.61.61.41.20.90.8
Barangay AverageMunicipality
Bottom 10 Barangays
DIPACULAOSAN LUISSAN LUISDINGALANDIPACULAOSAN LUISDINGALANDINGALANCASIGURANDINGALAN
DimabunoDibaloDimanayatDikapanikianPuangiDibutTawanUmiray (Malamig)DitinagyanPaltic
2.72.62.62.52.52.42.32.32.22.2

52
The Many Faces of Poverty (Volume 9)
Table 6. CBMS Composite Indicator, by Barangay, Province of Aurora, 2016-2017
BarangayMunicipality Barangay CBMS CompositeIndicator
Municipality
0.20.20.50.20.60.80.71.91.01.01.00.30.5
1.41.41.91.32.01.31.30.90.7
1.71.81.71.91.82.51.62.21.02.32.3
1.51.01.41.21.71.21.60.92.71.21.70.91.71.61.21.41.11.11.01.12.51.11.51.01.6
1.31.71.00.90.60.60.50.61.01.10.60.90.61.00.81.50.71.21.91.81.30.70.80.90.50.7
DINGALAN AplayaButas Na BatoCabog (Matawe)CaragsacanDavildavilanDikapanikianIbonaPalticPoblacionTanawanUmiray (Malamig)
DIPACULAO BayabasBorlonganBuenavistaCalaocanDiamanenDianedDiarabasinDibutunanDimabunoDinadiawanDitaleGupaIpilLaboyLipitLobbotMaligayaMijaresMucdolNorth PoblacionPuangiSalaySapangkawayanSouth PoblacionToytoyan
MARIA AURORA AlcalaBagtuBangcoBannawagBarangay I (Pob.)Barangay II (Pob.)Barangay III (Pob.)Barangay IV (Pob.)BauboBayanihanBazalCabituculan EastCabituculan WestCadayacanDebucaoDecoliatDetailenDiaatDialatmanDiamanDianawanDikilditDimanpudsoDiomeEstoniloFlorida
BALER Barangay I (Pob.)Barangay II (Pob.)Barangay III (Pob.)Barangay IV (Pob.)Barangay V (Pob.)BuhanginCalabuananObligacionPingitReservaSabangSuclayinZabali
CASIGURAN Barangay 1 (Pob.)Barangay 2 (Pob.)Barangay 3 (Pob.)Barangay 4 (Pob.)Barangay 5 (Pob.)Barangay 6 (Pob.)Barangay 7 (Pob.)Barangay 8 (Pob.)BianuanCalabganCalangcuasanCalantasCozoCulatDibacongDibetDitinagyanEsperanzaEstevesLualMarikitSan IldefonsoTabasTinib
DILASAG DiagyanDicabasanDilaguidiDimasesetDiniogEsperanzaLawangMaligaya (Pob.)ManggitahanMasagana (Pob.)Ura
DINALUNGAN AbulegDibaraybayDitawiniMapaladNipoo (Bulo)PalegSimbahanZone I (Pob.)Zone II (Pob.)
0.81.41.21.51.81.31.71.32.02.01.01.11.51.72.02.12.21.71.61.11.32.11.51.3
1.51.41.31.42.01.81.91.31.51.81.6
CBMS CompositeIndicator

The Many Faces of Poverty (Volume 9)
53
Table 6. CBMS Composite Indicator, by Barangay, Province of Aurora, 2016-2017
BarangayMunicipality CBMS CompositeIndicator
1.90.81.70.70.70.90.61.30.80.80.71.61.91.6
1.60.40.91.31.12.61.92.41.82.62.01.51.41.41.71.51.21.4
SAN LUIS BacongBarangay I (Pob.)Barangay II (Pob.)Barangay III (Pob.)Barangay IV (Pob.)DibaloDibayabayDibutDikapinisanDimanayatDitekiDitumaboL. PimentelNonong SeniorRealSan IsidroSan JoseZarah
MARIA AURORA GalintujaMalasinPongloQuirinoRamadaSan JoaquinSan JoseSan JuanSan LeonardoSanta LuciaSanto TomasSuguitVilla AuroraWenceslao

54
The Many Faces of Poverty (Volume 9)

Republic of the PhilippinesProvince of CAMIGUIN
Message
MARIA LUISA ROMUALDO Governor
For a small island province like Camiguin to be featured in this vital publicationis both an honor and privilege. Knowing that we are placed side-by-side with otherfront-runner LGUs in the country, we felt sheer pride and joy as this constitute ameaningful recognition of the incremental successes we have collectively attainedin reducing poverty by embracing the new trend for evidence-based governance.
Starting CY 2014, rising up to the challenge to address pressing performancegaps, the provincial government assisted all our component municipalities inundergoing the rigorous demand of the CBMS process in order to establish a databasefor poverty monitoring. With the use of generated information for prioritizinginterventions, despite financial and systemic limitations, significant developmentsare consequently observed in the areas of health, nutrition, water and sanitation,and tourism which is our source of income.
Notwithstanding what we have accomplished so far, still we know that wehave a long way to go in fulfilling the collective aspirations of our people. But fueledby constant dynamism and commitment to serve the public, we can be assured ofthe continuing transformation of Camiguin and therefore leave a lasting legacy ofpositive difference in the lives of our constituents.

MAYORS OF CAMIGUIN
HON. NESTOR JACOT(Municipality of Catarman)
HON. HELENIO ABECIA(Municipality of Guinsiliban)
HON. ROGERIO ACLE(Municipality of Mahinog)

MAYORS OF CAMIGUIN
HON. JURDIN JESUS ROMUALDO(Municipality of Mambajao)
HON. JOSEPH UAYAN(Municipality of Sagay)

58
The Many Faces of Poverty (Volume 9)
The Many Faces of Poverty in theProvince of Camiguin
Camiguin had a total population of 73,850 covering 16,927 householdsThe CBMS census conducted from 2015 to 2016 covered 5 municipalities in the province, namely, Catarman, Guinsiliban,Mahinog, Mambajao, and Sagay, with 58 barangays. Of the 73,850 locals, 50.4 percent are male, while 49.6 percentare female. The Municipality of Mambajao has the largest population with 26,358 members (or 35.7%) in 5,814households, followed by Catarman with 15,695 members (or 21.3%) in 3,764 households.
HEALTH AND NUTRITIONThree in every 1000 children under five years old diedAbout 0.3 percent of children under five years old died duringthe reference period. This is equivalent to 28 child deaths inthe Province of Camiguin. The proportion of child deathsamong boys was higher than girls, at 0.4 percent and 0.3percent, respectively. The highest proportion of child deathswas reported in the Municipality of Guinsiliban where 0.9percent of children under five years old died, followed by Sagaywith 0.8 percent. Meanwhile, Sagay ranked first in terms ofmagnitude with 10 cases of child deaths. Across all thebarangays, Barangay Liong in Guinsiliban registered the highestproportion of child deaths at 3.7 percent. This was followedby Barangay Bacnit in Sagay at 3.1 percent, and BarangayBonbon in Sagay at 1.9 percent.
The 2015-2016 CBMS Census covers 5 municipalities in the Province of Camiguin, namely, Catarman, Guinsiliban, Mahinog,Mambajao, and Sagay.
POPULATION
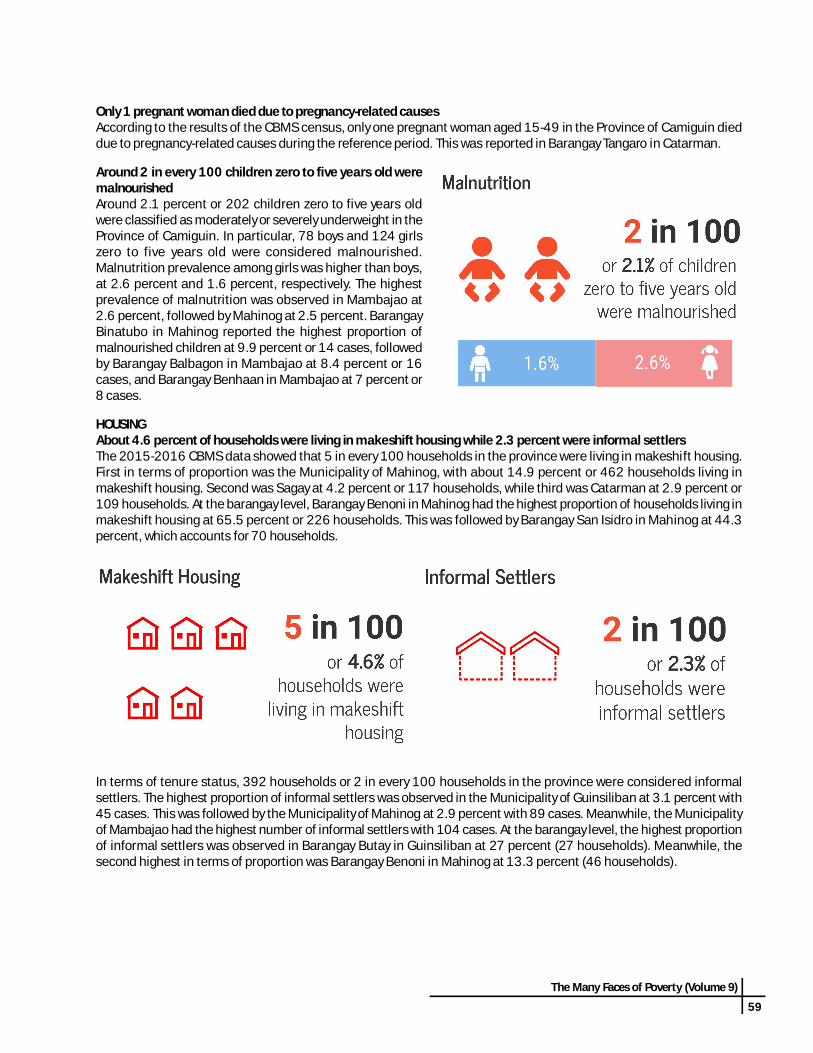
The Many Faces of Poverty (Volume 9)
59
Only 1 pregnant woman died due to pregnancy-related causesAccording to the results of the CBMS census, only one pregnant woman aged 15-49 in the Province of Camiguin dieddue to pregnancy-related causes during the reference period. This was reported in Barangay Tangaro in Catarman.
Around 2 in every 100 children zero to five years old weremalnourishedAround 2.1 percent or 202 children zero to five years oldwere classified as moderately or severely underweight in theProvince of Camiguin. In particular, 78 boys and 124 girlszero to five years old were considered malnourished.Malnutrition prevalence among girls was higher than boys,at 2.6 percent and 1.6 percent, respectively. The highestprevalence of malnutrition was observed in Mambajao at2.6 percent, followed by Mahinog at 2.5 percent. BarangayBinatubo in Mahinog reported the highest proportion ofmalnourished children at 9.9 percent or 14 cases, followedby Barangay Balbagon in Mambajao at 8.4 percent or 16cases, and Barangay Benhaan in Mambajao at 7 percent or8 cases.
HOUSINGAbout 4.6 percent of households were living in makeshift housing while 2.3 percent were informal settlersThe 2015-2016 CBMS data showed that 5 in every 100 households in the province were living in makeshift housing.First in terms of proportion was the Municipality of Mahinog, with about 14.9 percent or 462 households living inmakeshift housing. Second was Sagay at 4.2 percent or 117 households, while third was Catarman at 2.9 percent or109 households. At the barangay level, Barangay Benoni in Mahinog had the highest proportion of households living inmakeshift housing at 65.5 percent or 226 households. This was followed by Barangay San Isidro in Mahinog at 44.3percent, which accounts for 70 households.
In terms of tenure status, 392 households or 2 in every 100 households in the province were considered informalsettlers. The highest proportion of informal settlers was observed in the Municipality of Guinsiliban at 3.1 percent with45 cases. This was followed by the Municipality of Mahinog at 2.9 percent with 89 cases. Meanwhile, the Municipalityof Mambajao had the highest number of informal settlers with 104 cases. At the barangay level, the highest proportionof informal settlers was observed in Barangay Butay in Guinsiliban at 27 percent (27 households). Meanwhile, thesecond highest in terms of proportion was Barangay Benoni in Mahinog at 13.3 percent (46 households).

60
The Many Faces of Poverty (Volume 9)
WATER AND SANITATIONAbout 0.8 percent of the households do not have access to safe water supply and about 6.3 percent do not have accessto sanitary toilet facilitiesBased on the results of the CBMS census, 1 in every 100 households in Camiguin had no access to safe water supply.The Municipality of Guinsiliban had the worst condition in terms of water accessibility as 2.2 percent of its householdswere reported to have no access to safe water supply during the reference period. This was followed by Mahinog with1.2 percent, and Sagay with 1.1 percent. In terms of magnitude, the Municipality of Mahinog ranked first with 36 cases.Barangay Tupsan Pequeño, in particular, with 7.7 percent (22 cases) had the highest proportion of households withoutaccess to safe water supply. There were no cases of “waterless”1 barangays in the province.
On the other hand, 6.3 percent of the households do not have access to sanitary toilet facilities. This means that around6 in every 100 households in the province lacked access to sanitary toilet facilities. The Municipality of Sagay reportedthe highest proportion of sanitation poor households at 11.7 percent or 327 households, followed by Guinsiliban at 9.9percent or 144 households. Meanwhile, at the barangay level, the highest proportion of sanitation poor households wasobserved in Barangay Cuna at 27 percent (54 cases), followed by Barangay Balite at 24.5 percent (53 cases).
1 “Waterless” barangays refer to barangays with less than 50 percent safe water supply coverage, as defined by the SALINTUBIG Programof the Department of Health (DOH).

The Many Faces of Poverty (Volume 9)
61
BASIC EDUCATIONAbout 2 in every 100 children 6 to 15 years old were notattending schoolThe proportion of out-of-school children 6-15 years old was1.6 percent. Regardless of education level, 2 in every 100children 6-15 years old were not attending school. Further,results revealed that 7.3 percent of children 6-11 years oldwere not attending elementary school, while 28.3 percent ofchildren 12-15 years old were not attending high school.Results also showed that the proportion of out-of-schoolchildren among boys (2.2%) was higher compared to girls(1.1%). Out of 5 municipalities, Sagay had the highestproportion of out-of-school children 6-15 years old at 2.7percent. Catarman was second highest at 2.2 percent,followed by Guinsiliban at 1.5 percent. Sagay also ranked firstin terms of magnitude, with 76 cases observed.
INCOME AND LIVELIHOODAbout 63 in every 100 households were living below thepoverty thresholdMore than half or 62.8 percent of the households in theprovince were considered income poor, which means thataround 63 in every 100 households have no sufficientincome to satisfy their basic food and non-food needs. All5 municipalities in Camiguin had an income poverty rateabove 50 percent. Catarman had the highest proportion ofhouseholds living below poverty threshold at 78.6 percent,followed by Guinsiliban at 68 percent. Across all barangaysin the province, the highest proportion of income poorhouseholds was observed in Barangay Tangaro, at 92.1percent (233 cases). This was followed by Barangay Butayat 86 percent.
Around 49 in every 100 households had no sufficient incometo satisfy their food needsAccording to the CBMS data, 48.5 percent of the householdsin Camiguin were living below the food threshold.Subsistence incidence was most prevalent in Catarmanwhere 68.4 percent of the households (2,573 cases) werefood poor. In particular, Barangay Tangaro recorded the highestincidence of subsistence where 85.4 percent of thehouseholds were living below the food threshold, followedby Barangay Butay where 81 percent of the households wereliving below the food threshold.

62
The Many Faces of Poverty (Volume 9)
One in every 100 households experienced hunger due tofood shortageAround 1 percent of the households in the provincesuffered from hunger during the three-month period beforethe census. Hunger due to food shortage was mostprevalent in the Municipality of Sagay at 3.3 percent or 93cases. Next to Sagay was Mahinog at 1.1 percent or 33cases. Across all the barangays, the highest proportion ofhouseholds that experienced hunger due to food shortagewas observed in Barangay Manuyog at 17.3 percent,followed by Barangay Bacnit at 11.4 percent, and BarangayTupsan Pequeño at 5.6 percent.
Unemployment rate in the province was recorded at 7.6 percentAbout 7.6 percent or 1,692 individuals of the 22,264 membersof the labor force aged 15 and above were reported to beunemployed. It appears that the unemployment rate was higheramong females at 10.1 percent than among males at 6.6percent. Unemployment was most prevalent in Sagay where11.4 percent or 458 members of the labor force wereunemployed during the reference period. This was followed byCatarman at 10.1 percent or 431 cases, and Guinsiliban at 8.4percent or 174 cases. Across all barangays, Barangay Poblacionand Barangay Looc recorded the two highest unemploymentrates in the province, at 24.3 percent and 19.4 percent,respectively.
PEACE AND ORDERAround 1 in every 1000 people were victims of crimeCBMS results show that around 0.1 percent of the population or 42 individuals in the Province of Camiguin werereported to be victims of crime. Catarman reported the highest number of crime victims with 15 cases, followed byMambajao with 8 cases. At the barangay level, Barangay Poblacion in Catarman recorded the highest number of crimevictims with 11 cases. This is followed by Barangay Bacnit, Barangay Bug-ong, and Barangay San Roque with 3 caseseach.
CBMS COMPOSITE INDEXHouseholds in the Province of Camiguin suffered from one deprivation2 on the averageThe Province of Camiguin recorded a CBMS composite index (CCI) of 1.4, which means that households in the provincewere not able to meet the 13 basic needs and suffered from 1 deprivation, on the average. In particular, households inCatarman and in Guinsiliban were not able to meet 2 of the 13 basic needs, on the average. Further disaggregated datashow that Barangay Butay, Barangay Tangaro, and Barangay Cantaan had the highest incidence of deprivation, with 2unmet needs, on the average.
2 The deprivations are based on the 13+1 indicators: (1) children under 5 years old who died; 2) women who died due to pregnancy-related causes; (3) malnourished children 0-5 years old; (4) households living in makeshift housing ; 5) households who are informalsettlers; (6) households without access to safe water supply; (7) households without access to sanitary toilet facilities; (8) children 6-15years old not in school; (9) households with income below the poverty threshold; (10) households with income below the food threshold;(11) households that experienced food shortage; (12) unemployment; and (13) victims of crime. A high er index would mean moredeprivation and hence, worse condition for the households.

The Many Faces of Poverty (Volume 9)
63
DIMENSIONS OF POVERTY3
Based on the CBMS data, around 41.6 percent of all households are non-poorwhile 58.4 percent of households were poor in at least one dimension. Inparticular, about 44.6 percent or 7,553 households in the province were poorin one dimension, while 12 percent or 2,029 households were poor in twodimensions. Meanwhile, 1.6 percent or 276 households were poor in threedimensions.
DIMENSIONS OF POVERTY IN CAMIGUIN
Number ofDimensions
Proportion ofHouseholds
Total 58.4
1234567
44.612.01.60.20.00.00.0
3 From the 13+1 CBMS core indicators, one indicator is selected to determine whether a household is poor in a particular dimension: 1)children aged under 5 years old who died for health, 2) malnourished children 0-5 years old for nutr ition, 3) households living inmakeshift houses for housing, 4) households who are informal settlers for tenure, 5) households without access to safe water supply forwater, 6) households without access to sanitary toilet facilities for sanitation, 7) children aged 6-15 years not in school for education, 8)households with income below the food threshold for income, 9) unemployment for job, and 10) victims of crime for security.
0.3 2.14.6
2.3
0.8
6.3
1.6
48.5
7.6 0.10.0
10.0
20.0
30.0
40.0
50.0
60.0Health Poor
Nutrition Poor
Housing Poor
Tenure Poor
Water Poor
SanitationPoor
Education Poor
Income Poor
Job Poor
Security Poor

64
The Many Faces of Poverty (Volume 9)

The Many Faces of Poverty (Volume 9)
65
The Many Faces of Poverty inthe Province of Camiguin
INDICATOR
DEMOGRAPHYPopulationAverage household sizeChildren under 1 year oldChildren under 5 years oldChildren 0-5 years oldChildren 6-11 years oldMembers 12-15 years oldMembers 6-15 years oldMembers 10 years old and aboveMembers of the labor force
HEALTH AND NUTRITIONChildren under 5 years old who diedWomen who died due to pregnancy related-causesMalnourished children 0-5 years old
HOUSINGHouseholds living in makeshift housingHouseholds who are informal settlers
WATER AND SANITATIONHouseholds without access to safe water supplyHouseholds without access to sanitary toilet facilities
BASIC EDUCATIONChildren 6-11 years old not attending elementary schoolChildren 12-15 years old not attending high schoolChildren 6-15 years old not attending school
INCOME AND LIVELIHOODHouseholds with income below the poverty thresholdHouseholds with income below the food thresholdHouseholds who experienced hunger due to food shortageUnemployment rate (15 years old and above)
PEACE AND ORDERVictims of crime
Magnitude
16,9274
785392
1281,071
10,6278,215
177
Proportion
4.62.3
0.86.3
62.848.5
1.0
Households Population
CBMS Core Indicators, Province of Camiguin, 2015-2016
ProportionMagnitude
1,3798,0849,7729,9046,333
16,23757,50622,264
73,850
281
202
7201,792
267
7.328.3
1.6
42 0.1
0.30.12.1
1,692 7.6
CBMS Composite Indicator, Province of Camiguin, 2015-2016
CBMS Composite IndicatorAverage
1.5

66
The Many Faces of Poverty (Volume 9)
CBMS Core Indicators, by Municipality, Province of Camiguin, 2015-2016
Number ofchildren
(6-11 yearsold)
Children not attendingelementary school
(6-11 years old)
Children not attending highschool
(12-15 years old)
Number ofchildren(12-15
years old)
Number ofchildren
(6-15 yearsold)
Children not attendingschool
(6-15 years old)
Municipality
ProportionProportionProportion MagnitudeMagnitudeMagnitude
Households living inmakeshift housing
Households who areinformal settlers
Households without access tosafe water supply
Households without access tosanitary toilet facilities
Municipality
ProportionProportion ProportionProportion MagnitudeMagnitudeMagnitudeMagnitude
CATARMANGUINSILIBANMAHINOGMAMBAJAOSAGAY
10923
46274
117
2.91.6
14.91.34.2
844589
10470
202144209189327
5.49.96.73.3
11.7
2.23.12.91.82.5
832362131
0.22.21.20.41.1
Municipality Totalhouseholds
Number ofchildren (0-5
years old)
Malnourishedchildren
(0-5 years old)
Children under 5years old who died
Numberof children
under 1year old
Women deathsdue to pregnancy-
related causes
Totalpopulation
ProportionProportion Proportion MagnitudeMagnitudeMagnitude
Number ofchildrenunder 5
years old
CATARMANGUINSILIBANMAHINOGMAMBAJAOSAGAY
3,7641,4493,1075,8142,793
15,6956,265
13,33126,35812,201
1,674667
1,4902,9721,281
2,015803
1,7843,5961,574
2116459525
1.02.02.52.61.6
8613
10
0.50.90.10.10.8
312100262559146
10000
0.30000
CATARMANGUINSILIBANMAHINOGMAMBAJAOSAGAY
2,003874
1,8323,4371,758
1226167
211259
6.17.03.76.1
14.7
3,3271,4162,9865,6722,836
7221336576
2.21.51.11.12.7
1,324542
1,1542,2351,078
301151251672417
22.727.921.830.138.7
Households with income below the povertythreshold
Households with income below the foodthreshold
Households who experienced hunger duefood shortage
Municipality
Proportion Proportion ProportionMagnitudeMagnitudeMagnitude
Unemployment rate(15 years old and above)
Persons who are victimsof crimes
Number of persons in thelabor force
(15 years old and above)
Municipality CBMSCompositeIndicatorProportionProportionMagnitude Magnitude
CATARMANGUINSILIBANMAHINOGMAMBAJAOSAGAY
2,959986
1,6183,8211,243
78.668.052.165.744.5
2812331193
0.70.81.10.23.3
2,573822
1,1512,899770
68.456.737.049.927.6
CATARMANGUINSILIBANMAHINOGMAMBAJAOSAGAY
4,2562,0704,1767,7464,016
431174224405458
0.10.10.10.00.0
1.71.61.21.31.1
10.18.45.45.2
11.4
156786
CBMS Poverty Maps: Province of Camiguin

The Many Faces of Poverty (Volume 9)
67
CBMS Poverty Maps: Province of Camiguin
Map 1. Proportion of Children under 5 Years Old who Died,by Municipality, 2015-2016
Map 2. Proportion of Children under 5 Years Old who Died,by Barangay, 2015-2016
Barangay Magnitude ProportionMunicipality
Bottom 11 Barangays
GUINSILIBANSAGAYSAGAYCATARMANCATARMANSAGAYMAMBAJAOCATARMANMAMBAJAOSAGAYCATARMAN
LiongBacnitBonbonLiloanSanto NiñoAlangilanKuguitaPoblacionBug-ongBugangLawigan
63312212111
3.73.11.91.81.51.41.21.00.90.90.9
Magnitude ProportionMunicipality
GUINSILIBANSAGAYCATARMANMAHINOGMAMBAJAO
610813
0.90.80.50.10.1

68
The Many Faces of Poverty (Volume 9)
Map 4. Proportion of Women who Died Due to Pregnancy-Related Causes,by Barangay, 2015-2016
Map 3. Proportion of Women who Died Due to Pregnancy-Related Causes,by Municipality, 2015-2016
CBMS Poverty Maps: Province of Camiguin
Barangay Magnitude ProportionMunicipality
Bottom Barangay
CATARMAN Tangaro 1 4.0
Magnitude ProportionMunicipality
CATARMANGUINSILIBANSAGAYMAHINOGMAMBAJAO
10000
0.30000

The Many Faces of Poverty (Volume 9)
69
CBMS Poverty Maps: Province of Camiguin
Map 5. Proportion of Children 0-5 Years Old who are Malnourished,by Municipality, 2015-2016
Map 6. Proportion of Children 0-5 Years Old who are Malnourished,by Barangay, 2015-2016
Barangay Magnitude ProportionMunicipality
Bottom 10 Barangays
MAHINOGMAMBAJAOMAMBAJAOMAHINOGMAMBAJAOMAHINOGMAMBAJAOMAMBAJAOSAGAYGUINSILIBAN
Binatubo (Binaliwan)BalbagonBenhaanOwakanTupsanTupsan PequeñoSoro-soroAnitoAlangilanSouth Poblacion
14 16 8 4
12 6 5 7 7 4
9.98.47.06.54.94.64.54.24.14.0
Magnitude ProportionMunicipality
MAMBAJAOMAHINOGGUINSILIBANSAGAYCATARMAN
9545162521
2.62.52.01.61.0

70
The Many Faces of Poverty (Volume 9)
Table 1. Health and Nutrition Indicators, by Barangay, Province of Camiguin, 2015-2016
CATARMAN AlgaBonbonBuraCatibacCompolLawiganLiloanLoocMainitManduaoPanghiawanPoblacionSanto NiñoTangaro
1052851001271881376153
18994
108244155169
10034021130312
1.000
2.42.10
3.31.90.53.20
1.20.61.2
8523883
1091561125439
1568094
200129139
00001110000221
0000
0.60.91.80000
1.01.50.7
155316132928106
301519332124
00000000000001
0000000000000
4.0
Municipality Barangay Number ofchildren
(0-5years old)
Malnourishedchildren
(0-5 years old)
Proportion
Children under 5years oldwho died
Number ofchildrenunder 1year old
Women deaths due topregnancy-related
causes
Magnitude Magnitude Proportion Magnitude Proportion
Number ofchildrenunder 5years old
GUINSILIBAN ButayCabuanCantaanLiongMaacNorth PoblacionSouth Poblacion
23114015228289
10880
18714222271187
106208227
27416719134611513595
218175255860111133247274
47
165820506
1253
1210
1.54.28.41.47.01.50
2.30
2.41.44.52.34.93.6
100001100000000
0.40000
0.91.200000000
48213361151714342641
12718233843
000000000000000
000000000000000
MAHINOG BenoniBinatubo (Binaliwan)CatohuganHubangonOwakanPoblacionPuntodSan IsidroSan JoseSan MiguelSan RoqueTubodTupsan Pequeño
MAMBAJAO AgohoAnitoBalbagonBaylaoBenhaanBug-ongKuguitaMagtingNaasagPandanPoblacionSoro-soroTagdoTupsanYumbing
16512011813047
30711169785314637109
20414214415662
367129849462
16743
130
41404490111106
2.09.90
2.66.52.50
1.21.11.60.60
4.6
0000000000100
0000000000
0.700
28232327546231910423526
0000000000000
0000000000000
5214948
155879284
6017658
185111113100
1116124
1.70.61.73.20.91.84.0
0006000
000
3.7000
6246
27141211
0000000
0000000

The Many Faces of Poverty (Volume 9)
71
Table 1. Health and Nutrition Indicators, by Barangay, Province of Camiguin, 2015-2016
SAGAY AlangilanBacnitBaliteBonbonBugangCunaManuyogMayanaPoblacion
170128164184132150188136322
713151142
4.10.81.80.53.80.70.52.90.6
14593139152107121157108259
231310000
1.43.10.71.90.90000
41015311213331315
000000000
000000000
Municipality Barangay Number ofchildren
(0-5years old)
Malnourishedchildren
(0-5 years old)
Proportion
Children under 5years oldwho died
Number ofchildrenunder 1year old
Women deaths due topregnancy-related
causes
Magnitude Magnitude Proportion Magnitude Proportion
Number ofchildrenunder 5
years old

72
The Many Faces of Poverty (Volume 9)
Map 7. Proportion of Households Living in Makeshift Housing,by Municipality, 2015-2016
Map 8. Proportion of Households Living in Makeshift Housing,by Barangay, 2015-2016
Barangay Magnitude ProportionMunicipality
Bottom 10 Barangays
MAHINOGMAHINOGMAHINOGSAGAYMAHINOGCATARMANMAHINOGCATARMANSAGAYCATARMAN
BenoniSan IsidroTupsan PequeñoManuyogBinatubo (Binaliwan)BonbonSan RoqueCatibacPoblacionLiloan
226 70 99 57 31 41 22 14 35 5
65.544.334.720.111.98.07.96.24.44.1
Magnitude ProportionMunicipality
MAHINOGSAGAYCATARMANGUINSILIBANMAMBAJAO
4621171092374
14.94.22.91.61.3
CBMS Poverty Maps: Province of Camiguin

The Many Faces of Poverty (Volume 9)
73
Map 10. Proportion of Households who are Informal Settlers,by Barangay, 2015-2016
Map 9. Proportion of Households who are Informal Settlers,by Municipality, 2015-2016
CBMS Poverty Maps: Province of Camiguin
Barangay Magnitude ProportionMunicipalityBottom 10 Barangays
GUINSILIBANMAHINOGGUINSILIBANSAGAYCATARMANMAHINOGSAGAYSAGAYMAHINOGMAMBAJAO
ButayBenoniCantaanBugangMainitSan IsidroBaliteCunaCatohuganMagting
27 46 8
12 18 8
10 9 8
12
27.013.37.45.35.25.14.64.53.73.4
Magnitude ProportionMunicipality
GUINSILIBANMAHINOGSAGAYCATARMANMAMBAJAO
45897084
104
3.12.92.52.21.8

74
The Many Faces of Poverty (Volume 9)
Map 11. Proportion of Households without Access to Safe Water Supply,by Municipality, 2015-2016
Map 12. Proportion of Households without Access to Safe Water Supply,by Barangay, 2015-2016
Barangay Magnitude ProportionMunicipality
Bottom 10 Barangays
MAHINOGGUINSILIBANSAGAYGUINSILIBANSAGAYGUINSILIBANMAHINOGMAHINOGSAGAYMAMBAJAO
Tupsan PequeñoCantaanManuyogCabuanBonbonButayBenoniSan MiguelCunaBaylao
22 7 17 18 11 3 8 2 3 6
7.76.56.05.83.43.02.32.21.51.2
Magnitude ProportionMunicipality
GUINSILIBANMAHINOGSAGAYMAMBAJAOCATARMAN
323631218
2.21.21.10.40.2
CBMS Poverty Maps: Province of Camiguin

The Many Faces of Poverty (Volume 9)
75
Map 14. Proportion of Households without Access to Sanitary Toilet Facilities,by Barangay, 2015-2016
Map 13. Proportion of Households without Access to Sanitary Toilet Facilities,by Municipality, 2015-2016
CBMS Poverty Maps: Province of Camiguin
Barangay Magnitude ProportionMunicipalityBottom 10 Barangays
SAGAYSAGAYSAGAYSAGAYMAHINOGGUINSILIBANMAHINOGGUINSILIBANGUINSILIBANMAHINOG
CunaBaliteBugangBacnitSan MiguelMaacSan RoqueCabuanButayOwakan
54 53 53 40 17 39 43 47 15 15
27.024.523.519.018.718.715.515.315.014.6
Magnitude ProportionMunicipality
SAGAYGUINSILIBANMAHINOGCATARMANMAMBAJAO
327144209202189
11.79.96.75.43.3

76
The Many Faces of Poverty (Volume 9)
Table 2. Housing, Water and Sanitation Indicators, by Barangay, Province of Camiguin, 2015-2016
Households living inmakeshift housing
Households who areinformal settlers
Households without accessto safe water supply
Households without accessto sanitary toilet facilities
BarangayMunicipality
ProportionProportion Proportion ProportionMagnitude Magnitude Magnitude Magnitude
3413
1412552642264
1.78.01.66.23.42.04.11.11.72.41.00.42.51.6
214115615
18221773
1.12.70.50.41.42.40.82.75.21.21.03.22.91.2
01020200010020
00.20
0.90
0.8000
0.600
0.80
22131029321341
2491
121517
12.42.55.5
12.88.95.13.30.56.95.40.52.36.26.7
4447453422175634
0.91.61.21.42.61.91.31.10.70.51.23.03.20.71.0
54
104284
1249
203496
1.11.63.00.81.33.11.83.41.42.41.41.82.12.21.4
000612001430040
000
1.20.70.800
0.31.10.200
1.00
417161517114
14136
4610
1510
0.96.84.73.011.14.21.84.04.41.63.30.60
3.62.4
CATARMAN AlgaBonbonBuraCatibacCompolLawiganLiloanLoocMainitManduaoPanghiawanPoblacionSanto NiñoTangaro
GUINSILIBAN ButayCabuanCantaanLiongMaacNorth PoblacionSouth Poblacion
MAHINOG BenoniBinatubo (Binaliwan)CatohuganHubangonOwakanPoblacionPuntodSan IsidroSan JoseSan MiguelSan RoqueTubodTupsan Pequeño
MAMBAJAO AgohoAnitoBalbagonBaylaoBenhaanBug-ongKuguitaMagtingNaasagPandanPoblacionSoro-soroTagdoTupsanYumbing
2726123
2.02.31.92.10.50.81.8
27283023
27.00.67.41.00
0.81.8
31871021
3.05.86.50.30
0.80.6
1547137
399
14
15.015.312.02.418.73.48.4
2263110093
7001
220
99
65.511.90.500
1.51.5
44.30
1.17.90
34.7
46287132802208
13.30.83.72.21.00.51.05.10
2.20.70
2.8
800103000200
22
2.300
0.30
0.5000
2.200
7.7
1104
20156487017430
20
3.20
1.96.4
14.610.83.94.40
18.715.5
07.0

The Many Faces of Poverty (Volume 9)
77
Table 2. Housing, Water and Sanitation Indicators, by Barangay, Province of Camiguin, 2015-2016
Households living inmakeshift housing
Households who areinformal settlers
Households without accessto safe water supply
Households without accessto sanitary toilet facilities
BarangayMunicipality
ProportionProportion Proportion ProportionMagnitude Magnitude Magnitude Magnitude
264053175354189
57
7.519.024.55.3
23.527.06.44.77.2
264831
571
35
0.62.91.92.51.30.5
20.10.54.4
53
107
12912
21
1.41.44.62.25.34.50.41.02.6
000
11031700
000
3.40
1.56.000
SAGAY AlangilanBacnitBaliteBonbonBugangCunaManuyogMayanaPoblacion

78
The Many Faces of Poverty (Volume 9)
Map 16. Proportion of Children 6-11 Years Old Not Attending Elementary School,by Barangay, 2015-2016
Map 15. Proportion of Children 6-11 Years Old Not Attending Elementary School,by Municipality, 2015-2016
CBMS Poverty Maps: Province of Camiguin
Barangay Magnitude ProportionMunicipalityBottom 10 Barangays
SAGAYSAGAYSAGAYSAGAYSAGAYCATARMANSAGAYMAMBAJAOCATARMANMAMBAJAO
AlangilanPoblacionCunaBonbonMayanaPanghiawanBugangKuguitaLoocAgoho
41 73 26 34 21 14 18 14 11 32
20.717.917.316.415.314.612.912.212.212.1
Magnitude ProportionMunicipality
SAGAYGUINSILIBANCATARMANMAMBAJAOMAHINOG
25961
12221167
14.77.06.16.13.7

The Many Faces of Poverty (Volume 9)
79
CBMS Poverty Maps: Province of Camiguin
Map 17. Proportion of Children 12-15 Years Old Not Attending High School,by Municipality, 2015-2016
Map 18. Proportion of Children 12-15 Years Old Not Attending High School,by Barangay, 2015-2016
Barangay Magnitude ProportionMunicipality
Bottom 10 Barangays
SAGAYSAGAYSAGAYSAGAYMAMBAJAOSAGAYSAGAYGUINSILIBANMAMBAJAOMAMBAJAO
AlangilanMayanaBacnitBaliteBaylaoCunaPoblacionLiongBug-ongKuguita
61 26 44 37 90 33
113 50 37 29
47.747.345.843.543.342.942.341.040.237.7
Magnitude ProportionMunicipality
SAGAYMAMBAJAOGUINSILIBANCATARMANMAHINOG
417672151301251
38.730.127.922.721.8

80
The Many Faces of Poverty (Volume 9)
Map 20. Proportion of Children 6-15 Years Old Not Attending School,by Barangay, 2015-2016
Map 19. Proportion of Children 6-15 Years Old Not Attending School,by Municipality, 2015-2016
CBMS Poverty Maps: Province of Camiguin
Barangay Magnitude ProportionMunicipalityBottom 10 Barangays
SAGAYCATARMANCATARMANCATARMANSAGAYMAHINOGSAGAYSAGAYSAGAYCATARMAN
MayanaPoblacionAlgaSanto NiñoPoblacionTubodAlangilanCunaBugangPanghiawan
10 17 6 8
24 2
10 7 7 5
5.24.34.13.73.63.23.13.13.13.0
Magnitude ProportionMunicipality
SAGAYCATARMANGUINSILIBANMAMBAJAOMAHINOG
7672216533
2.72.21.51.11.1
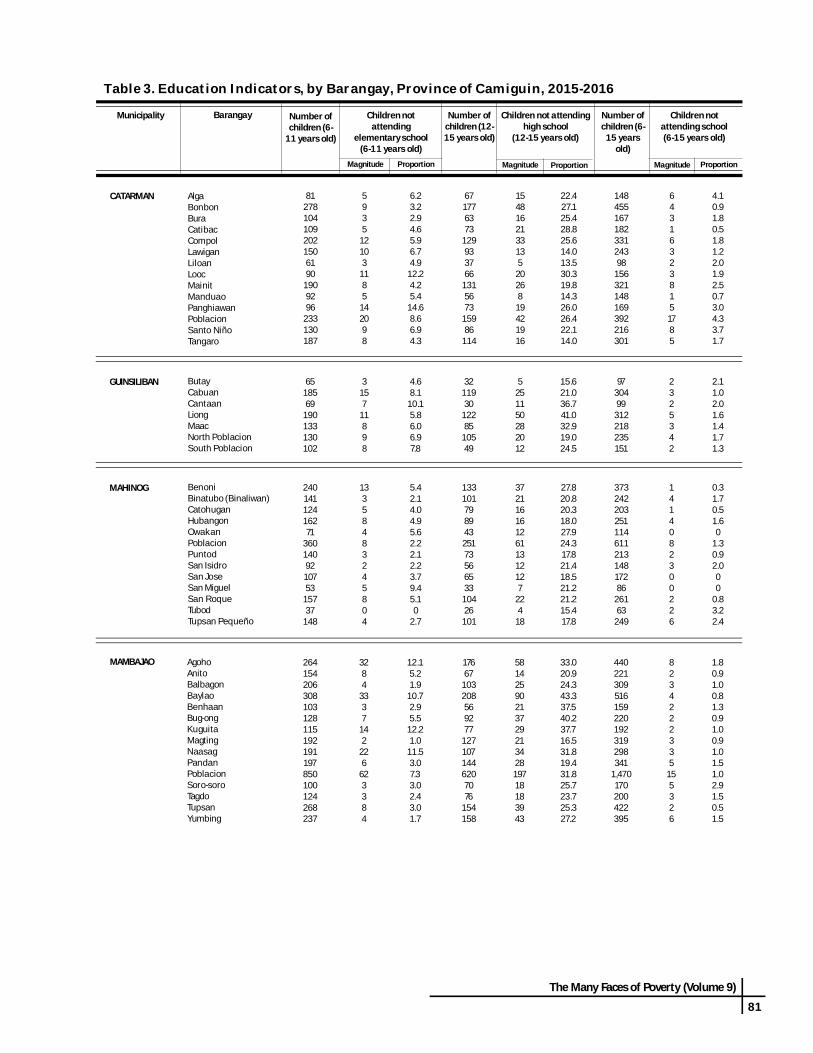
The Many Faces of Poverty (Volume 9)
81
Table 3. Education Indicators, by Barangay, Province of Camiguin, 2015-2016
Number ofchildren (6-
11 years old)
Children notattending
elementary school(6-11 years old)
Number ofchildren (12-15 years old)
Children not attendinghigh school
(12-15 years old)
Number ofchildren (6-
15 yearsold)
Children notattending school(6-15 years old)
BarangayMunicipality
Magnitude Magnitude MagnitudeProportion Proportion Proportion
812781041092021506190
1909296
233130187
5935
12103
1185
142098
6.23.22.94.65.96.74.9
12.24.25.4
14.68.66.94.3
671776373
129933766
1315673
15986
114
15481621331352026819421916
22.427.125.428.825.614.013.530.319.814.326.026.422.114.0
14845516718233124398
156321148169392216301
643163238151785
4.10.91.80.51.81.22.01.92.50.73.04.33.71.7
264154206308103128115192191197850100124268237
3284
3337
142
226
623384
12.15.21.9
10.72.95.5
12.21.0
11.53.07.33.02.43.01.7
17667
103208569277
1271071446207076
154158
5814259021372921342819718183943
33.020.924.343.337.540.237.716.531.819.431.825.723.725.327.2
440221309516159220192319298341
1,470170200422395
8234222335
155326
1.80.91.00.81.30.91.00.91.01.51.02.91.50.51.5
CATARMAN AlgaBonbonBuraCatibacCompolLawiganLiloanLoocMainitManduaoPanghiawanPoblacionSanto NiñoTangaro
GUINSILIBAN ButayCabuanCantaanLiongMaacNorth PoblacionSouth Poblacion
MAHINOG BenoniBinatubo (Binaliwan)CatohuganHubangonOwakanPoblacionPuntodSan IsidroSan JoseSan MiguelSan RoqueTubodTupsan Pequeño
MAMBAJAO AgohoAnitoBalbagonBaylaoBenhaanBug-ongKuguitaMagtingNaasagPandanPoblacionSoro-soroTagdoTupsanYumbing
6518569
190133130102
3157
11898
4.68.1
10.15.86.06.97.8
3211930
12285
10549
5251150282012
15.621.036.741.032.919.024.5
9730499312218235151
2325342
2.11.02.01.61.41.71.3
24014112416271
3601409210753
15737
148
13358483245804
5.42.14.04.95.62.22.12.23.79.45.10
2.7
1331017989432517356653310426101
3721161612611312127
224
18
27.820.820.318.027.924.317.821.418.521.221.215.417.8
37324220325111461121314817286
26163
249
1414082300226
0.31.70.51.60
1.30.92.000
0.83.22.4

82
The Many Faces of Poverty (Volume 9)
Table 3. Education Indicators, by Barangay, Province of Camiguin, 2015-2016
Number ofchildren (6-
11 years old)
Children notattending
elementary school(6-11 years old)
Number ofchildren (12-15 years old)
Children not attendinghigh school
(12-15 years old)
Number ofchildren (6-
15 yearsold)
Children notattending school(6-15 years old)
BarangayMunicipality
Magnitude Magnitude MagnitudeProportion Proportion Proportion
198123170207139150227137407
411318341826152173
20.710.610.616.412.917.36.6
15.317.9
1289685
1318977
15055
267
6144374230333126
113
47.745.843.532.133.742.920.747.342.3
326219255338228227377192674
10158774
1024
3.10.52.02.43.13.11.15.23.6
SAGAY AlangilanBacnitBaliteBonbonBugangCunaManuyogMayanaPoblacion
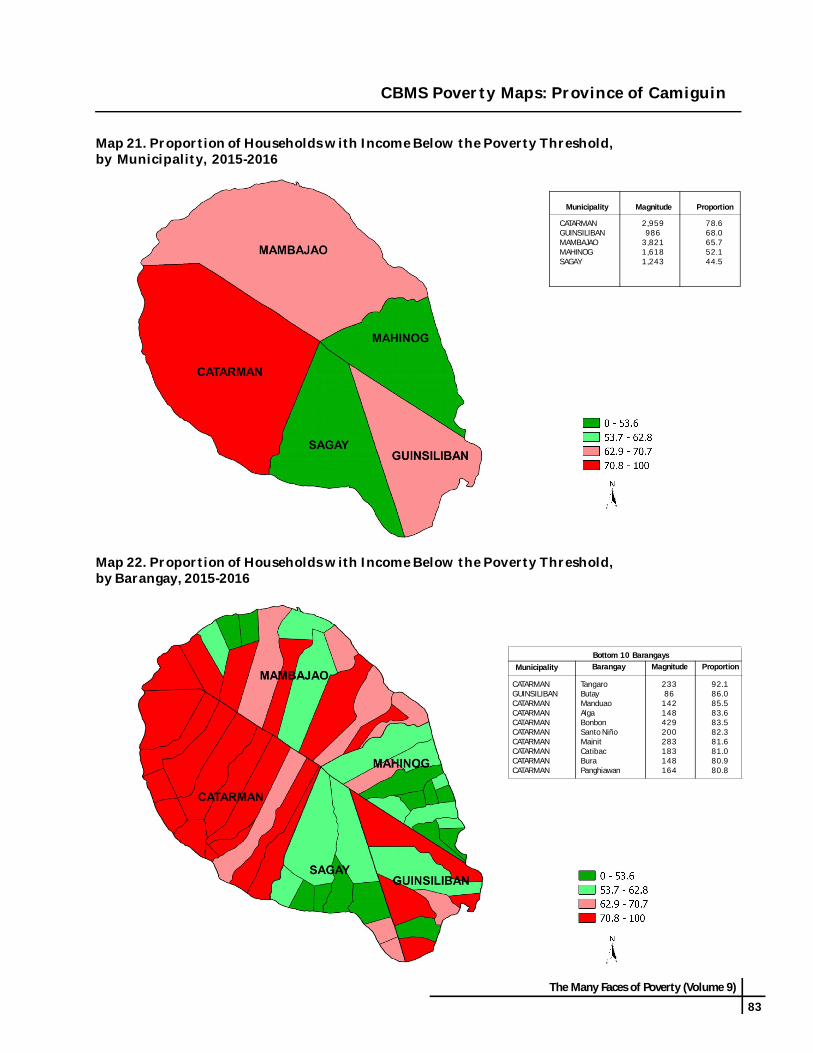
The Many Faces of Poverty (Volume 9)
83
Map 22. Proportion of Households with Income Below the Poverty Threshold,by Barangay, 2015-2016
Map 21. Proportion of Households with Income Below the Poverty Threshold,by Municipality, 2015-2016
CBMS Poverty Maps: Province of Camiguin
Barangay Magnitude ProportionMunicipalityBottom 10 Barangays
CATARMANGUINSILIBANCATARMANCATARMANCATARMANCATARMANCATARMANCATARMANCATARMANCATARMAN
TangaroButayManduaoAlgaBonbonSanto NiñoMainitCatibacBuraPanghiawan
23386
142148429200283183148164
92.186.085.583.683.582.381.681.080.980.8
Magnitude ProportionMunicipality
CATARMANGUINSILIBANMAMBAJAOMAHINOGSAGAY
2,959986
3,8211,6181,243
78.668.065.752.144.5

84
The Many Faces of Poverty (Volume 9)
Map 23. Proportion of Households with Income Below the Food Threshold,by Municipality, 2015-2016
Map 24. Proportion of Households with Income Below the Food Threshold,by Barangay, 2015-2016
Barangay Magnitude ProportionMunicipality
Bottom 10 Barangays
CATARMANGUINSILIBANCATARMANCATARMANCATARMANCATARMANCATARMANCATARMANCATARMANCATARMAN
TangaroButayManduaoBonbonPanghiawanSanto NiñoCatibacAlgaLiloanBura
21681
12538214917816212687
128
85.481.075.374.373.473.371.771.270.769.9
Magnitude ProportionMunicipality
CATARMANGUINSILIBANMAMBAJAOMAHINOGSAGAY
2,573822
2,8991,151770
68.456.749.937.027.6
CBMS Poverty Maps: Province of Camiguin

The Many Faces of Poverty (Volume 9)
85
Map 26. Proportion of Households who Experienced Hunger Due to Food Shortage,by Barangay, 2015-2016
Map 25. Proportion of Households who Experienced Hunger Due to Food Shortage,by Municipality, 2015-2016
CBMS Poverty Maps: Province of Camiguin
Barangay Magnitude ProportionMunicipality
Bottom 10 Barangays
SAGAYSAGAYMAHINOGMAHINOGSAGAYSAGAYMAHINOGCATARMANGUINSILIBANGUINSILIBAN
ManuyogBacnitTupsan PequeñoSan IsidroMayanaBugangBinatubo (Binaliwan)PoblacionSouth PoblacionButay
4924168788
1342
17.311.45.65.13.63.53.12.52.42.0
Magnitude ProportionMunicipality
SAGAYMAHINOGGUINSILIBANCATARMANMAMBAJAO
9333122811
3.31.10.80.70.2

86
The Many Faces of Poverty (Volume 9)
Table 4. Income Poverty and Hunger Indicators, by Barangay, Province of Camiguin, 2015-2016
14842914818326118299141283142164346200233
83.683.580.981.072.971.980.575.081.685.580.865.382.392.1
12638212816221515487
121237125149293178216
71.274.369.971.760.160.970.764.468.375.373.455.373.385.4
00033201031
1302
000
1.30.80.80
0.50
1.80.52.50
0.8
Households with income below thepoverty threshold
Households with income below thefood threshold
Households who experienced hungerdue to food shortage
BarangayMunicipality
Magnitude Magnitude MagnitudeProportion Proportion Proportion
289192239332122140113243216225865121143275306
62.076.870.765.479.753.649.869.873.060.261.771.675.366.473.2
21215017225999
10583
19817116164186
111214237
45.560.050.951.064.740.236.656.957.843.045.750.958.451.756.7
220103000120000
0.40.80
0.20
1.1000
0.30.10000
CATARMAN AlgaBonbonBuraCatibacCompolLawiganLiloanLoocMainitManduaoPanghiawanPoblacionSanto NiñoTangaro
GUINSILIBAN ButayCabuanCantaanLiongMaacNorth PoblacionSouth Poblacion
MAHINOG BenoniBinatubo (Binaliwan)CatohuganHubangonOwakanPoblacionPuntodSan IsidroSan JoseSan MiguelSan RoqueTubodTupsan Pequeño
MAMBAJAO AgohoAnitoBalbagonBaylaoBenhaanBug-ongKuguitaMagtingNaasagPandanPoblacionSoro-soroTagdoTupsanYumbing
8617585
23615117083
86.056.878.780.872.264.249.7
8148.465.764.760.852.838.9
81.048.465.764.760.852.838.9
2012034
2.00
0.90.70
1.12.4
18484
12116260
36188
10010818
15817
157
53.332.356.051.958.360.843.363.361.419.856.819.855.1
1084876
13144
2825276819
1263
115
31.318.535.242.042.747.525.648.146.09.9
45.33.5
40.4
080000080010
16
03.100000
5.100
0.40
5.6

The Many Faces of Poverty (Volume 9)
87
Table 4. Income Poverty and Hunger Indicators, by Barangay, Province of Camiguin, 2015-2016
10611813912413812419698200
30.556.264.438.461.162.069.351.025.1
527096729481
1555991
15.033.344.422.341.640.554.830.711.4
1241080
4973
0.311.40.50
3.50
17.33.60.4
Households with income below thepoverty threshold
Households with income below thefood threshold
Households who experienced hungerdue to food shortage
BarangayMunicipality
Magnitude Magnitude MagnitudeProportion Proportion Proportion
SAGAY AlangilanBacnitBaliteBonbonBugangCunaManuyogMayanaPoblacion

88
The Many Faces of Poverty (Volume 9)
Map 28. Unemployment Rate (15 years old and above), by Barangay, 2015-2016
Map 27. Unemployment Rate (15 years old and above), by Municipality, 2015-2016
CBMS Poverty Maps: Province of Camiguin
Barangay Magnitude ProportionMunicipalityBottom 10 Barangays
SAGAYCATARMANGUINSILIBANSAGAYMAHINOGGUINSILIBANCATARMANCATARMANCATARMANCATARMAN
PoblacionLoocMaacCunaSan RoqueCantaanLawiganPoblacionTangaroBonbon
286 30 41 48 59 26 51 84 33 53
24.319.416.916.716.115.615.511.710.410.2
Magnitude ProportionMunicipality
SAGAYCATARMANGUINSILIBANMAHINOGMAMBAJAO
458431174224405
11.410.18.45.45.2

The Many Faces of Poverty (Volume 9)
89
CBMS Poverty Maps: Province of Camiguin
Map 29. Proportion of Persons who are Victims of Crimes, by Municipality, 2015-2016
Map 30. Proportion of Persons who are Victims of Crimes, by Barangay, 2015-2016
Barangay Magnitude ProportionMunicipality
Bottom 10 Barangays
GUINSILIBANCATARMANMAHINOGMAMBAJAOSAGAYMAHINOGCATARMANGUINSILIBANCATARMANSAGAY
ButayPoblacionSan RoqueBug-ongBacnitSan MiguelCatibacLiongLawiganAlangilan
2 11 3 3 3 1 2 2 1 1
0.50.50.30.30.30.20.20.20.10.1
Magnitude ProportionMunicipality
CATARMANGUINSILIBANMAHINOGSAGAYMAMBAJAO
156768
0.10.10.10.00.0

90
The Many Faces of Poverty (Volume 9)
Table 5. Unemployment and Victims of Crime Indicators, by Barangay,Province of Camiguin, 2015-2016
Unemployment rate(15 years old and above)
Persons who are victims of crimesNumber of persons in thelabor force
(15 years old and above)
BarangayMunicipality
ProportionProportion MagnitudeMagnitude
195520202231379328131155382176220720301316
1853132333511130257
20843033
9.210.26.4
10.08.7
15.58.4
19.46.54.09.1
11.710.010.4
01020100000
1100
00.00
0.20
0.100000
0.500
636300420652177379290429409538
1992217243493571
4689
505
3414172126
13547
1415
7.22.72.17.72.89.04.84.05.14.86.81.82.92.82.6
200103000110000
0.100
0.00
0.3000
0.10.00000
CATARMAN AlgaBonbonBuraCatibacCompolLawiganLiloanLoocMainitManduaoPanghiawanPoblacionSanto NiñoTangaro
GUINSILIBAN ButayCabuanCantaanLiongMaacNorth PoblacionSouth Poblacion
MAHINOG BenoniBinatubo (Binaliwan)CatohuganHubangonOwakanPoblacionPuntodSan IsidroSan JoseSan MiguelSan RoqueTubodTupsan Pequeño
MAMBAJAO AgohoAnitoBalbagonBaylaoBenhaanBug-ongKuguitaMagtingNaasagPandanPoblacionSoro-soroTagdoTupsanYumbing
118491167356242407289
2312614413723
1.76.3
15.63.9
16.99.18.0
2102001
0.50.10
0.200
0.1
397411257456167805303170197134367148364
16280974723979
5946
4.06.80
2.04.25.87.65.33.66.7
16.12.71.6
0000020001301
00000
0.1000
0.20.30
0.1

The Many Faces of Poverty (Volume 9)
91
Table 5. Unemployment and Victims of Crime Indicators, by Barangay,Province of Camiguin, 2015-2016
Unemployment rate(15 years old and above)
Persons who are victims of crimesNumber of persons in thelabor force
(15 years old and above)
BarangayMunicipality
ProportionProportion MagnitudeMagnitude
468320310445292288425293
1,175
432219245
4856
286
9.26.96.15.41.7
16.71.22.0
24.3
130200000
0.10.30
0.100000
SAGAY AlangilanBacnitBaliteBonbonBugangCunaManuyogMayanaPoblacion

92
The Many Faces of Poverty (Volume 9)
Map 31. CBMS Composite Indicator, by Municipality, 2015-2016
Map 32. CBMS Composite Indicator, by Barangay, 2015-2016
Barangay AverageMunicipality
Bottom 10 Barangays
GUINSILIBANCATARMANGUINSILIBANCATARMANCATARMANCATARMANCATARMANCATARMANMAHINOGSAGAY
ButayTangaroCantaanCatibacSanto NiñoBonbonAlgaManduaoSan IsidroManuyog
2.22.02.01.91.91.91.91.91.91.8
Municipality Average
CATARMANGUINSILIBANMAMBAJAOMAHINOGSAGAY
1.81.61.41.31.2
CBMS Poverty Maps: Province of Camiguin

The Many Faces of Poverty (Volume 9)
93
Table 6. CBMS Composite Indicator, by Barangay, Province of Camiguin, 2015-2016
BarangayMunicipality Barangay CBMS CompositeIndicator
Municipality
1.81.81.71.81.61.61.71.61.71.81.71.51.82.0
0.71.41.50.81.41.61.81.00.8
1.21.51.41.31.71.21.01.41.51.21.21.41.51.31.4
CBMS CompositeIndicator
SAGAY AlangilanBacnitBaliteBonbonBugangCunaManuyogMayanaPoblacion
CATARMAN AlgaBonbonBuraCatibacCompolLawiganLiloanLoocMainitManduaoPanghiawanPoblacionSanto NiñoTangaro
GUINSILIBAN ButayCabuanCantaanLiongMaacNorth PoblacionSouth Poblacion
MAHINOG BenoniBinatubo (Binaliwan)CatohuganHubangonOwakanPoblacionPuntodSan IsidroSan JoseSan MiguelSan RoqueTubodTupsan Pequeño
MAMBAJAO AgohoAnitoBalbagonBaylaoBenhaanBug-ongKuguitaMagtingNaasagPandanPoblacionSoro-soroTagdoTupsanYumbing
2.21.42.01.61.71.41.2
1.70.81.01.11.31.30.91.81.10.61.50.31.6

94
The Many Faces of Poverty (Volume 9)

The Many Faces of Poverty (Volume 9)
95
Republic of the PhilippinesProvince of IFUGAO
Message
PEDRO MAYAM-O Governor
Kindly accept my warmest greetings on the occasion of your 14th CBMS NationalConference. May I also express my gratitude in including the Province of Ifugao inyour publication, entitled, “The Many Faces of Poverty.” I personally take this as arecognition of our unceasing efforts to research and to study the underlying reasonsof the widespread poverty in our locality, the impediments of economic advancement,and our strong determination to improve the lives of our constituencies.
Because of the CBMS, statistics on poverty and other areas of developmentin our local government unit is now available at our fingertips. The planners, decisionmakers and implementers are provided with a clearer and solid basis to determinespecific areas on where to accord the necessary and appropriate interventions. Thisis to stir economic pursuits and promote other community development undertakings.In like manner, our aspiration for the less fortunate families of the province is forthem to improve their situation and become economically liberated.
All of the aforementioned scenarios are promising due to the enduring supportof De La Salle University (DLSU) Angelo King Institute for Economic and BusinessStudies specifically, on data generation, other concerned government and non-government agencies. Together, we are confident to win the war on poverty.
Thank you and good luck to all your future endeavors.

MAYORS OF IFUGAO
HON. GASPAR CHILAGAN, JR.(Municipality of Aguinaldo)
HON. GLENN PRUDENCIANO(Municipality of Alfonso Lista)
HON. JERRY DALIPOG(Municipality of Banaue)
HON. ARMANDO DOMILOD(Municipality of Asipulo)

HON. GERALDO LUGLUG(Municipality of Hingyon)
MAYORS OF IFUGAO
HON. HILARIO BUMANGABANG(Municipality of Hungduan)
HON. JOSELITO GUYGUYON(Municipality of Kiangan)
HON. MARTIN HABAWEL, JR.(Municipality of Lagawe)

MAYORS OF IFUGAO
HON. RONIE LUMAYNA(Municipality of Mayoyao)
HON. MARCELO CATALINO(Municipality of Tinoc)
HON. MARIANO BUYAGAWAN, JR.(Municipality of Lamut)

The Many Faces of Poverty (Volume 9)
99
The Many Faces of Poverty in theProvince of Ifugao
Ifugao had a total population of 176,540 covering 42, 147 householdsThe CBMS census conducted from 2015 to 2016 covered 11 municipalities in the province, namely, Aguinaldo, AlfonsoLista, Asipulo, Banaue, Hingyon, Hungduan, Kiangan, Lagawe, Lamut, Mayoyao, and Tinoc, with 175 barangays. Of the176,540 locals, 52.1 percent are male, while 47.9 percent are female. The Municipality of Alfonso Lista has the largestpopulation with 30,234 members (or 17.1%) in 7,361 households, followed by Lamut with 21,591 members (or 12.2%)in 5,544 households.
HEALTH AND NUTRITIONTwo in every 1000 children under five years old diedAbout 0.2 percent of children under five years old died duringthe reference period. This is equivalent to 46 child deaths inthe province. The proportion of child deaths among boys waslower than girls, at 0.2 percent and 0.3 percent, respectively.The highest proportion of child deaths was reported in themunicipalities of Tinoc (9 cases), Mayoyao (6 cases), andHungduan (4 cases), all were at 0.5 percent. Tinoc also rankedfirst in terms of magnitude. Among all the barangays, BarangayLiwo in Mayoyao registered the highest proportion of childdeaths at 7.4 percent. This was followed by Barangay Burnayin Lagawe at 4 percent, and both Barangay Pullaan in Lagaweand Barangay Nungulunan in Hungduan at 3.4 percent.
The 2015-2016 CBMS Census covers 11 municipalities in the Province of Ifugao, namely, Aguinaldo, Alfonso Lista, Asipulo,Banaue, Hingyon, Hungduan, Kiangan, Lagawe, Lamut, Mayoyao, and Tinoc.
POPULATION

100
The Many Faces of Poverty (Volume 9)
Three in every 10000 pregnant women died due to pregnancy-related causesAccording to the results of the CBMS census, 0.03 percent of pregnant women aged 15-49 in the Province of Ifugao dieddue to pregnancy-related causes during the reference period. Only one case of maternal death was reported in Ifugao,which was in Barangay Chalalo in Aguinaldo.
Around 2 in every 100 children zero to five years old weremalnourishedAround 1.6 percent or 362 children zero to five years old wereclassified as moderately or severely underweight in theProvince of Ifugao. In particular, 160 boys and 202 girls zeroto five years old were considered malnourished. Malnutritionprevalence among girls was higher than boys, at 1.9 percentand 1.4 percent, respectively. The highest prevalence ofmalnutrition was observed in Hingyon at 2.7 percent, followedby Tinoc at 2.3 percent. Barangay San Juan in Alfonso Listareported the highest proportion of malnourished children at20.5 percent, followed by Barangay Buninan in Mayoyao at12.8 percent, and Barangay Umalbong in Hingyon at 12.4percent.
HOUSINGAbout 1.7 percent of households were living in makeshift housing while 2.3 percent were informal settlersThe 2015-2016 CBMS data showed that 2 in every 100 households in the province were living in makeshift housing.First in terms of proportion was the Municipality of Hungduan, with around 6.2 percent of its households living inmakeshift housing. Second was Lagawe at 2.3 percent, while third was Alfonso Lista at 2.2 percent. At the barangaylevel, Barangay Luta in Lagawe had the highest proportion of households living in makeshift housing at 29.3 percent (17households). This was followed by Barangay Calupaan in Alfonso Lista at 23.7 percent (44 households).
In terms of tenure status, 956 households or 2 in every 100 households in the province were considered informalsettlers. The highest proportion of informal settlers was observed in the Municipality of Hungduan at 6.3 percent. Thiswas followed by the Municipality of Aguinaldo at 5.2 percent. Meanwhile, the Municipality of Aguinaldo ranked first interms of magnitude (246 households). At the barangay level, the highest proportion of informal settlers was observedin Barangay Halag in Aguinaldo at 51.7 percent, accounting for 178 households in the said barangay. The second highestwas Barangay Cababuyan in Hingyon at 32.6 percent, accounting for 43 households in the said barangay.

The Many Faces of Poverty (Volume 9)
101
WATER AND SANITATIONAbout 26.6 percent of the households do not have access to safe water supply and about 21.8 percent do not haveaccess to sanitary toilet facilitiesBased on the results of the CBMS census, 27 in every 100 households in Ifugao had no access to safe water supply. TheMunicipality of Banaue had the worst condition in terms of water accessibility as 59.5 percent of its households werereported to have no access to safe water supply during the reference period. This was followed by Aguinaldo with 50percent, and Tinoc with 48.7 percent. In terms of magnitude, Banaue also ranked first with 2,459 cases. Two barangayshad no access to safe water supply at all, namely, Barangay Bangaan and Barangay Anaba, both of which are in Banaue.Of the 169 barangays, 36 can be considered “waterless”1.
On the other hand, 21.8 percent of the households do not have access to sanitary toilet facilities. This means thataround 22 in every 100 households in the province lacked access to sanitary toilet facilities. The Municipality of Hingyonreported the highest proportion of sanitation poor households at 30.5 percent (634 households), followed by Tinoc at27.8 percent (937 households). Meanwhile, at the barangay level, the highest proportion of sanitation poor householdswas observed in Barangay Palaad at 91.9 percent (68 cases), followed by Barangay Langayan at 85.5 percent (53cases). Both of which are in the Municipality of Mayoyao.
1 “Waterless” barangays refer to barangays with less than 50 percent safe water supply coverage, as defined by the SALINTUBIG Programof the Department of Health (DOH).

102
The Many Faces of Poverty (Volume 9)
BASIC EDUCATIONAbout 4 in every 100 children 6 to 15 years old were notattending schoolThe proportion of out-of-school children 6-15 years old was3.7 percent. Regardless of education level, 4 in every 100children 6-15 years old were not attending school. Further,results revealed that 6.3 percent of children 6-11 years oldwere not attending elementary school, while 30.6 percent ofchildren 12-15 years old were not attending high school.Results also showed that the proportion of out-of-schoolchildren among boys (5.7%) was higher compared to girls(1.6%). Out of 11 municipalities, Aguinaldo had the highestproportion of out-of-school children 6-15 years old at 6 percent.Tinoc was second highest at 5.9 percent, and third was Asipuloat 5.4 percent. Meanwhile, in terms magnitude, Aguinaldohad the highest number of out-of school children 6-15 yearsold, with 262 cases observed.
INCOME AND LIVELIHOODAbout 54 in every 100 households were living below thepoverty thresholdMore than half or 54 percent of the households in theprovince were considered income poor, which means thataround 54 in every 100 households have no sufficientincome to satisfy their basic food and non-food needs. Outof 11 municipalities, only Lamut and Lagawe reported anincome poverty rate below 50 percent, at 34.2 and 46.7,respectively. Aguinaldo had the highest proportion ofhouseholds living below poverty threshold at 71.6 percent,followed by Tinoc at 64.5 percent. Across all barangays inIfugao, the highest proportion of income poor householdswas observed in Barangay Nalbu in Mayoyao at 98.4percent, followed by Barangay Buwag in Aguinaldo at 96.5percent.
Around 39 in every 100 households had no sufficientincome to satisfy their food needsAccording to the CBMS data, 39.4 percent of thehouseholds in Ifugao were living below the food threshold.Subsistence incidence was most prevalent in Aguinaldoat 58.3 percent. Meanwhile, with 2,779 cases each, bothAguinaldo and Alfonso Lista had the highest number offood poor households in the province. Barangay Buwagin Aguinaldo recorded the highest incidence ofsubsistence at 90.7 percent (78 households), closelyfollowed by Barangay Nalbu in Mayoyao at 90.6 percent(58 cases).

The Many Faces of Poverty (Volume 9)
103
Two in every 100 households experienced hunger due tofood shortageAround 2 percent of the households in the provincesuffered from hunger during the three-month period beforethe census. Hunger due to food shortage was mostprevalent in the Municipality of Mayoyao at 1.4 percent or46 cases. Next to Mayoyao was the Municipality of Lagawewith a proportion of 0.4 percent or 17 cases. Across all thebarangays, the highest proportion of households thatexperienced hunger due to food shortage was observed inBarangay Nalbu at 28.1 percent, followed by BarangayNattum at 13 percent.
Unemployment rate in the province was recorded at 5.2percentAbout 5.2 percent or 3,797 individuals of the 72,551members of the labor force aged 15 and above werereported to be unemployed. It appears that theunemployment rate was higher among females at 6.3percent than among males at 4.6 percent. Unemploymentwas most prevalent in Mayoyao where 13.2 percent or 398members of the labor force were unemployed during thereference period. This was followed by Alfonso Lista at 6.4percent or 718 cases, and Hingyon at 6.2 percent or 230cases. Across all barangays, Barangay Jacmal in Aguinaldorecorded the highest unemployment rate at 55.8 percent,followed by Barangay Mapawoy in Mayoyao at 48.5 percent,and Barangay Buninan, also in Mayoyao, at 38.4 percent.
PEACE AND ORDERAround 1 in every 1000 people were victims of crimeAround 0.1 percent of the population or 151 individuals in the Province of Ifugao were reported to be victims of crime.Alfonso Lista reported the highest number of crime victims with 42 cases, followed by Tinoc with 31 cases. At thebarangay level, Barangay Santo Domingo in Alfonso Lista recorded the highest proportion of crime victims at 1.6 percentor 23 cases. This was followed by Barangay Danggo in Tinoc at 1.2 percent.
CBMS COMPOSITE INDEXHouseholds in the Province of Ifugao suffered from two deprivations2 on the averageThe Province of Ifugao recorded a CBMS composite index (CCI) of 1.6, which means that households in the provincewere not able to meet the 13 basic needs and suffered from 2 deprivations, on the average. In particular, householdsin Aguinaldo, Tinoc, Banaue, Kiangan, Mayoyao, Hingyon, and Asipulo were not able to meet 2 of the 13 basic needs, onthe average. The highest incidence of deprivation was observed in barangays Halag, Chalalo, Banao, Pula, Ohaj, Jacmal,Butac, Nalbu, Bunhian, Dalligan, Ta-ang, Majlong, Wangwang, Hucab, Banga, Gumhang, Ducligan, Abinuan, and Balawis,with 3 unmet needs, on the average.
2 The deprivations are based on the 13+1 indicators: (1) children under 5 years old who died; 2) women who died due to pregnancy-related causes; (3) malnourished children 0-5 years old; (4) households living in makeshift housing ; 5) households who are informalsettlers; (6) households without access to safe water supply; (7) households without access to sanitary toilet facilities; (8) children 6-15years old not in school; (9) households with income below the poverty threshold; (10) households with income below the food threshold;(11) households that experienced food shortage; (12) unemployment; and (13) victims of crime. A high er index would mean moredeprivation and hence, worse condition for the households.

104
The Many Faces of Poverty (Volume 9)
DIMENSIONS OF POVERTY3
Based on the CBMS data, around 34.4 percent of all households are non-poorwhile 65.6 percent of households were poor in at least one dimension. Inparticular, about 36.3 percent or 15,299 households in the province werepoor in one dimension, while 21.6 percent or 9,093 households were poor intwo dimensions. Meanwhile, 6.6 percent or 2,790 households were poor inthree dimensions.
DIMENSIONS OF POVERTY IN IFUGAO
Number ofDimensions
Proportion ofHouseholds
Total 65.6
1234567
36.321.66.61.00.10.00.0
0.2 1.6
1.72.3
26.621.8
3.739.4
5.20.1
0.0
10.0
20.0
30.0
40.0
50.0
60.0Health Poor
Nutrition Poor
Housing Poor
Tenure Poor
Water Poor
SanitationPoor
Education Poor
Income Poor
Job Poor
Security Poor
3 From the 13+1 CBMS core indicators, one indicator is selected to determine whether a household is poor in a particular dimension: 1)children aged under 5 years old who died for health, 2) malnourished children 0-5 years old for nutr ition, 3) households living inmakeshift houses for housing, 4) households who are informal settlers for tenure, 5) households without access to safe water supply forwater, 6) households without access to sanitary toilet facilities for sanitation, 7) children aged 6-15 years not in school for education, 8)households with income below the food threshold for income, 9) unemployment for job, and 10) victims of crime for security.

The Many Faces of Poverty (Volume 9)
105
The Many Faces of Poverty inthe Province of Ifugao
INDICATOR
DEMOGRAPHYPopulationAverage household sizeChildren under 1 year oldChildren under 5 years oldChildren 0-5 years oldChildren 6-11 years oldMembers 12-15 years oldMembers 6-15 years oldMembers 10 years old and aboveMembers of the labor force
HEALTH AND NUTRITIONChildren under 5 years old who diedWomen who died due to pregnancy related-causesMalnourished children 0-5 years old
HOUSINGHouseholds living in makeshift housingHouseholds who are informal settlers
WATER AND SANITATIONHouseholds without access to safe water supplyHouseholds without access to sanitary toilet facilities
BASIC EDUCATIONChildren 6-11 years old not attending elementary schoolChildren 12-15 years old not attending high schoolChildren 6-15 years old not attending school
INCOME AND LIVELIHOODHouseholds with income below the poverty thresholdHouseholds with income below the food thresholdHouseholds who experienced hunger due to food shortageUnemployment rate (15 years old and above)
PEACE AND ORDERVictims of crime
Magnitude
42,1474
697956
11,213 9,208
22,744 16,598
101
Proportion
1.72.3
26.621.8
54.039.4
0.2
Households Population
CBMS Core Indicators, Province of Ifugao, 2015-2016
ProportionMagnitude
3,36918,40622,49924,558 15,232 39,790
137,490 72,571
176,540
461
362
873 3,054 1,162
6.330.6
3.7
151 0.1
0.20.031.6
3,800 5.2
CBMS Composite Indicator, Province of Ifugao, 2015-2016
CBMS Composite IndicatorAverage
1.6

106
The Many Faces of Poverty (Volume 9)
CBMS Core Indicators, by Municipality, Province of Ifugao, 2015-2016
Number ofchildren
(6-11 yearsold)
Children not attendingelementary school
(6-11 years old)
Children not attending highschool
(12-15 years old)
Number ofchildren(12-15
years old)
Number ofchildren
(6-15 yearsold)
Children not attendingschool
(6-15 years old)
Municipality
ProportionProportionProportion MagnitudeMagnitudeMagnitude
Households living inmakeshift housing
Households who areinformal settlers
Households without access tosafe water supply
Households without access tosanitary toilet facilities
Municipality
ProportionProportion ProportionProportion MagnitudeMagnitudeMagnitudeMagnitude
AGUINALDOALFONSO LISTAASIPULOBANAUEHINGYONHUNGDUANKIANGANLAGAWELAMUTMAYOYAOTINOC
95164
95141992089645312
22.20.31.22
6.20.62.31.21.60.4
246155518177
1004846517625
1,0281,412718
1,022634243635740
1,031808937
21.619.227.124.730.515.218.918.818.624.227.8
5.22.11.92.03.76.31.41.20.92.30.7
2,385750215
2,45924186
1,517750871296
1,643
50.010.28.1
59.511.65.4
45.119.015.78.9
48.7
Municipality Totalhouseholds
Number ofchildren (0-5
years old)
Malnourishedchildren
(0-5 years old)
Children under 5years old who died
Numberof children
under 1year old
Women deathsdue to pregnancy-
related causes
Totalpopulation
ProportionProportion Proportion MagnitudeMagnitudeMagnitude
Number ofchildrenunder 5
years old
AGUINALDOALFONSO LISTAASIPULOBANAUEHINGYONHUNGDUANKIANGANLAGAWELAMUTMAYOYAOTINOC
4,7687,3612,6534,1302,0791,5973,3623,9395,5443,3413,373
18,62130,23413,16018,4498,9227,490
15,00016,33321,59112,07414,666
2,2533,0501,4461,862914778
1,5751,5362,0891,1761,727
2,7023,7471,7792,2681,132957
1,9551,8712,5461,4422,100
3077204230191928163249
1.12.11.11.92.72.01.01.50.62.22.3
66231425269
0.30.20.10.20.10.50.10.30.10.50.5
438488274364152147303255373235340
10000000000
0.20000000000
AGUINALDOALFONSO LISTAASIPULOBANAUEHINGYONHUNGDUANKIANGANLAGAWELAMUTMAYOYAOTINOC
2,7374,4881,9532,4971,194988
1,9302,1682,9901,5752,038
2892451201605548
112112179118119
10.65.56.16.44.64.95.85.26.07.55.8
4,3606,9823,0944,1072,0381,6613,2203,6094,8582,6153,246
2621831671287056
1081099598
192
6.02.65.43.13.43.43.43.02.03.75.9
1,6232,4941,1411,610844673
1,2901,4411,8681,0401,208
686507516478279182461402459246451
42.320.345.229.733.127.035.727.924.623.737.3
CBMS Poverty Maps: Province of Ifugao

The Many Faces of Poverty (Volume 9)
107
Households with income below the povertythreshold
Households with income below the foodthreshold
Households who experienced hunger duefood shortage
Municipality
Proportion Proportion ProportionMagnitudeMagnitudeMagnitude
Unemployment rate(15 years old and above)
Persons who are victimsof crimes
Number of persons in thelabor force
(15 years old and above)
Municipality CBMSCompositeIndicatorProportionProportionMagnitude Magnitude
AGUINALDOALFONSO LISTAASIPULOBANAUEHINGYONHUNGDUANKIANGANLAGAWELAMUTMAYOYAOTINOC
3,4163,6961,5622,1981,205908
1,8391,8391,8942,0022,177
71.650.258.953.258.056.954.746.734.259.964.5
31210707177470
0.10.20.00
0.30
0.20.40.11.40
2,7792,7791,1021,597864580
1,3791,3781,0831,4681,581
58.337.841.538.741.636.341.035.019.543.946.9
AGUINALDOALFONSO LISTAASIPULOBANAUEHINGYONHUNGDUANKIANGANLAGAWELAMUTMAYOYAOTINOC
8,17011,1896,0087,7513,7213,6216,3516,3907,9015,2066,263
43171896
445230124318309294689146
0.00.10.00.10.10.10.10.10.00.10.2
2.21.31.51.91.61.41.71.31.01.62.0
5.36.41.65.76.23.45.04.83.7
13.22.3
6425
15109995
1031
CBMS Poverty Maps: Province of Ifugao

108
The Many Faces of Poverty (Volume 9)
Map 1. Proportion of Children under 5 Years Old who Died,by Municipality, 2015-2016
Map 2. Proportion of Children under 5 Years Old who Died,by Barangay, 2015-2016
Municipality Barangay Magnitude Proportion
Bottom 10 Barangays
MAYOYAOLAGAWEHUNGDUANLAGAWETINOCMAYOYAOAGUINALDOTINOCHUNGDUANMAYOYAO
LiwoBurnayNungulunanPullaanGumhangChayaTa-angAp-apidMaggokMapawoy
2421422311
7.44.03.43.42.42.12.12.12.01.7
CBMS Poverty Maps: Province of Ifugao
Magnitude ProportionMunicipality
HUNGDUANMAYOYAOTINOCAGUINALDOLAGAWEALFONSO LISTABANAUEASIPULOHINGYONKIANGANLAMUT
46965632122
0.50.50.50.30.30.20.20.10.10.10.1

The Many Faces of Poverty (Volume 9)
109
Map 4. Proportion of Women who Died Due to Pregnancy-Related Causes,by Barangay, 2015-2016
Map 3. Proportion of Women who Died Due to Pregnancy-Related Causes,by Municipality, 2015-2016
CBMS Poverty Maps: Province of Ifugao
Barangay Magnitude ProportionMunicipality
Bottom 1 Barangay
AGUINALDO Chalalo 1 2.4
Magnitude ProportionMunicipality
AGUINALDOHUNGDUANMAYOYAOTINOCLAGAWEALFONSO LISTABANAUEASIPULOHINGYONKIANGANLAMUT
10000000000
0.20000000000

110
The Many Faces of Poverty (Volume 9)
CBMS Poverty Maps: Province of Ifugao
Map 5. Proportion of Children 0-5 Years Old who are Malnourished,by Municipality, 2015-2016
Map 4. Proportion of Children 0-5 Years Old who are Malnourished,by Barangay, 2015-2016
Barangay Magnitude ProportionMunicipality
Bottom 10 Barangays
ALFONSO LISTAMAYOYAOHINGYONLAGAWEALFONSO LISTAMAYOYAOMAYOYAOTINOCMAYOYAOLAGAWE
San JuanBuninanUmalbongAbinuanDolowogMagulonMagaLuhongChumangLuta
345
117743
1252
20.512.812.411.58.48.28.17.76.05.9
Magnitude ProportionMunicipality
HINGYONTINOCMAYOYAOALFONSO LISTAHUNGDUANBANAUELAGAWEAGUINALDOASIPULOKIANGANLAMUT
3049327719422830201916
2.72.32.22.12.01.91.51.11.11.00.6

The Many Faces of Poverty (Volume 9)
111
Table 1. Health and Nutrition Indicators, by Barangay, Province of Ifugao, 2015-2016
AGUINALDO AwayanBunhianButacBuwagChalaloDamagGalonogonHalagItabJacmalMajlongMongayangPosnaanTa-angTaliteUbao
ALFONSO LISTA BangarBusilacCalimagCalupaanCaragasanDolowogKilingLayaLittle TadianNamillanganNamnamaNgilebPintoPoblacionSan JoseSan JuanSan MarcosSan QuintinSanta MariaSanto Domingo (Cabicalan)
21113519038
16313514924312311372
267254118123368
105204000001230
12
0.50
2.65.30
3.000000
0.40.82.50
3.3
17011115431
13311812420497
10161
22721195
104312
0010000000000212
00
0.60000000000
2.11.00.6
2519195
402920411320154939132962
0000100000000000
0000
2.400000000000
5218257671726825152
12120213610328021296
135104108444208
60232738720783
31461
139249162129336256117166144135550247
300007301230130
345159
5.00000
8.41.00
0.70.81.90
0.31.20
20.53.50.70.93.6
00000000010002020001
000000000
0.5000
0.90
1.5000
0.5
92194
3117307
233724154541271614176536
00000000000000000000
00000000000000000000
Municipality Barangay Number ofchildren
(0-5years old)
Malnourishedchildren
(0-5 years old)
Proportion
Children under 5years oldwho died
Number ofchildrenunder 1year old
Women deaths due topregnancy-related
causes
Magnitude Magnitude Proportion Magnitude Proportion
Number ofchildrenunder 5years old
ASIPULO AmduntogAntipoloCamandagCawayanHallapNamalNungawaPanubtubanPula
1648347713812317243
126120
21210758118214421251
141149
016416011
00.91.02.20.72.80
0.70.7
100000001
0.60000000
0.8
3024992420285
2123
000000000
000000000
BANAUE AmganadAnabaBalawisBanaoBangaanBatadBocosCambuloDucliganGohangKinakinOhajPoblacionPoitanPulaSan FernandoTam-anView Point
1855985506277
21311876747057
2261344847
155126
21269
103587391
26514393858774
2831645855
196159
212124370231932000
0.91.41.91.72.74.41.14.90
2.43.41.43.21.83.4000
001000000000200000
00
1.2000000000
0.900000
377
189
1315402016139
1146298
143623
000000000000000000
000000000000000000
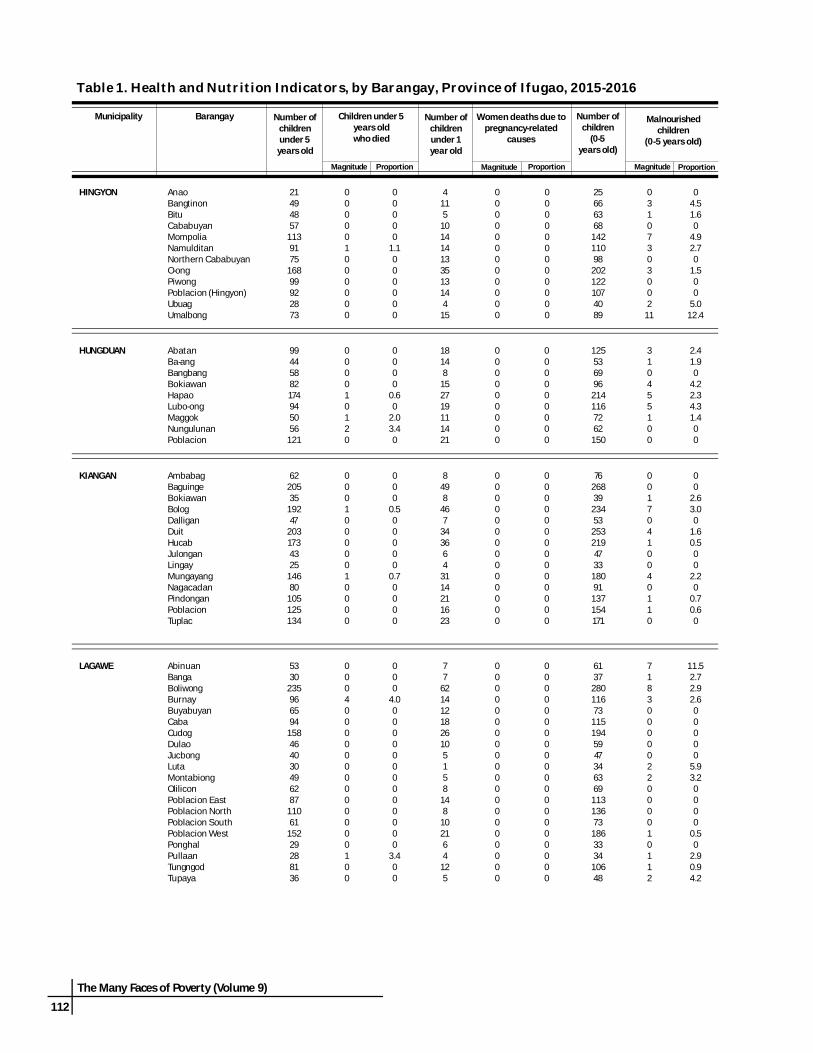
112
The Many Faces of Poverty (Volume 9)
Table 1. Health and Nutrition Indicators, by Barangay, Province of Ifugao, 2015-2016
HINGYON AnaoBangtinonBituCababuyanMompoliaNamulditanNorthern CababuyanO-ongPiwongPoblacion (Hingyon)UbuagUmalbong
HUNGDUAN AbatanBa-angBangbangBokiawanHapaoLubo-ongMaggokNungulunanPoblacion
21494857
1139175
16899922873
25666368142110982021221074089
03107303002
11
04.51.60
4.92.70
1.500
5.012.4
000001000000
00000
1.1000000
4115
101414133513144
15
000000000000
000000000000
99445882174945056
121
1255369962141167262150
310455100
2.41.90
4.22.34.31.400
000010120
0000
0.60
2.03.40
18148
152719111421
000000000
000000000
Municipality Barangay Number ofchildren
(0-5years old)
Malnourishedchildren
(0-5 years old)
Proportion
Children under 5years oldwho died
Number ofchildrenunder 1year old
Women deaths due topregnancy-related
causes
Magnitude Magnitude Proportion Magnitude Proportion
Number ofchildrenunder 5years old
LAGAWE AbinuanBangaBoliwongBurnayBuyabuyanCabaCudogDulaoJucbongLutaMontabiongOliliconPoblacion EastPoblacion NorthPoblacion SouthPoblacion WestPonghalPullaanTungngodTupaya
5330
235966594
158464030496287
11061
15229288136
613728011673115194594734636911313673186333410648
71830000022000010112
11.52.72.92.600000
5.93.20000
0.50
2.90.94.2
00040000000000000100
000
4.00000000000000
3.400
77
6214121826105158
148
102164
125
00000000000000000000
00000000000000000000
KIANGAN AmbabagBaguingeBokiawanBologDalliganDuitHucabJulonganLingayMungayangNagacadanPindonganPoblacionTuplac
6220535
19247
2031734325
14680
105125134
762683923453253219473318091137154171
00170410040110
00
2.63.00
1.60.500
2.20
0.70.60
00010000010000
000
0.500000
0.70000
8498
467
343664
3114211623
00000000000000
00000000000000

The Many Faces of Poverty (Volume 9)
113
Table 1. Health and Nutrition Indicators, by Barangay, Province of Ifugao, 2015-2016
LAMUT AmbasaBimpalHapidHolowonLawigLucbanMabatobato (Lamut)MagulonNayonPanopdopanPayawanPiezaPoblacion EastPoblacion WestPugol (Ifugao Reservation)SalamagueSanafeUmilag
MAYOYAO AduyonganAlimitAyanganBalangbangBanaoBanhalBato-AlatbangBonganBuninanChayaChumangEpengGuinihonInwaloyLangayanLiwoMagaMagulonMapawoyMayoyao ProperMongolNalbuNattumPalaadPoblacionTalbocTulaed
7313117590
10880
11612710410713877
12016919477
10697
861652091131319413316012612217095147209230101130125
400210030001100301
4.700
1.80.800
1.9000
1.10.700
3.00
0.8
000000000000200000
000000000000
1.600000
131933202415162918161615202735191919
000000000000000000
000000000000000000
235617753057863932925943412224252938592427268120853432
3163219434671004939111835249282729374974293231100231074241
120010005151200034100140010
3.23.200
2.9000
12.80.96.01.94.1000
8.18.21.400
3.24.000
2.40
000000000200000200100000100
000000000
2.100000
7.400
1.700000
1.200
882
187
1117127
201537036398597
194
1476
000000000000000000000000000
000000000000000000000000000
Municipality Barangay Number ofchildren
(0-5years old)
Malnourishedchildren
(0-5 years old)
Proportion
Children under 5years oldwho died
Number ofchildrenunder 1year old
Women deaths due topregnancy-related
causes
Magnitude Magnitude Proportion Magnitude Proportion
Number ofchildrenunder 5years old
TINOC AhinAp-apidBinablayanDanggoEhebGumhangImpugongLuhongTinocTukucanTulludanWangwang
17314079
10484
16618312826017514293
21016599
12799
198221156332216169108
6001265
123572
2.900
0.82.03.02.37.70.92.34.11.9
030114000000
02.10
1.01.22.4000000
292916211041342657272822
000000000000
000000000000

114
The Many Faces of Poverty (Volume 9)
Map 7. Proportion of Households Living in Makeshift Housing,by Municipality, 2015-2016
Map 8. Proportion of Households Living in Makeshift Housing,by Barangay, 2015-2016
Magnitude ProportionMunicipality
HUNGDUANLAGAWEALFONSO LISTAHINGYONAGUINALDOMAYOYAOBANAUELAMUTKIANGANTINOCASIPULO
9989
164419553516420129
6.22.32.22.02.01.61.21.20.60.40.3
Barangay Magnitude ProportionMunicipality
Bottom 10 Barangays
LAGAWEALFONSO LISTAMAYOYAOAGUINALDOHUNGDUANHUNGDUANHUNGDUANLAGAWEALFONSO LISTAKIANGAN
LutaCalupaanChumangHalagAbatanPoblacionLubo-ongPullaanPintoBokiawan
174432632529187
576
29.323.718.418.315.810.410.19.78.78.3
CBMS Poverty Maps: Province of Ifugao

The Many Faces of Poverty (Volume 9)
115
Map 10. Proportion of Households who are Informal Settlers,by Barangay, 2015-2016
Map 9. Proportion of Households who are Informal Settlers,by Municipality, 2015-2016
Magnitude ProportionMunicipality
HUNGDUANAGUINALDOHINGYONMAYOYAOALFONSO LISTABANAUEASIPULOKIANGANLAGAWELAMUTTINOC
1002467776
155815148465125
6.35.23.72.32.12.01.91.41.20.90.7
Barangay Magnitude ProportionMunicipality
Bottom 10 Barangays
AGUINALDOHINGYONHUNGDUANLAGAWEHUNGDUANMAYOYAOAGUINALDOMAYOYAOHINGYONALFONSO LISTA
HalagCababuyanLubo-ongBangaMaggokBuninanItabNalbuBangtinonSan Juan
17843461021142867
26
51.732.625.819.218.316.913.39.49.37.9
CBMS Poverty Maps: Province of Ifugao

116
The Many Faces of Poverty (Volume 9)
Map 11. Proportion of Households without Access to Safe Water Supply,by Municipality, 2015-2016
Map 12. Proportion of Households without Access to Safe Water Supply,by Barangay, 2015-2016
CBMS Poverty Maps: Province of Ifugao
Magnitude ProportionMunicipality
BANAUEAGUINALDOTINOCKIANGANLAGAWELAMUTHINGYONALFONSO LISTAMAYOYAOASIPULOHUNGDUAN
2,4592,3851,6431,51775087124175029621586
59.550.048.745.119.015.711.610.28.98.15.4
Barangay Magnitude ProportionMunicipality
Bottom 10 Barangays
BANAUEBANAUEAGUINALDOAGUINALDOTINOCAGUINALDOKIANGANAGUINALDOBANAUEAGUINALDO
BangaanAnabaTa-angBunhianGumhangChalaloHucabButacOhajMongayang
159145183342303299314289151531
10010099.599.499.399.098.497.697.496.2

The Many Faces of Poverty (Volume 9)
117
Map 14. Proportion of Households without Access to Sanitary Toilet Facilities,by Barangay, 2015-2016
Map 13. Proportion of Households without Access to Sanitary Toilet Facilities,by Municipality, 2015-2016
CBMS Poverty Maps: Province of Ifugao
Magnitude ProportionMunicipality
HINGYONTINOCASIPULOBANAUEMAYOYAOAGUINALDOALFONSO LISTAKIANGANLAGAWELAMUTHUNGDUAN
634937718
1,022808
1,0281,412635740
1,031243
30.527.827.124.724.221.619.218.918.818.615.2
Barangay Magnitude ProportionMunicipality
Bottom 10 Barangays
MAYOYAOMAYOYAOMAYOYAOMAYOYAOASIPULOTINOCBANAUELAGAWEKIANGANMAYOYAO
PalaadLangayanLiwoNattumCawayanAhinKinakinAbinuanDalliganBongan
685347
159193207132774095
91.985.578.376.475.466.865.364.262.560.9

118
The Many Faces of Poverty (Volume 9)
Table 2. Housing, Water and Sanitation Indicators, by Barangay, Province of Ifugao, 2015-2016
Households living inmakeshift housing
Households who areinformal settlers
Households without accessto safe water supply
Households without accessto sanitary toilet facilities
BarangayMunicipality
ProportionProportion Proportion ProportionMagnitude Magnitude Magnitude Magnitude
AGUINALDO AwayanBunhianButacBuwagChalaloDamagGalonogonHalagItabJacmalMajlongMongayangPosnaanTa-angTaliteUbao
8621200
630001110
10
2.61.70.71.20.700
18.3000
0.20.20.50
1.6
41700000
178281090009
1.34.900000
51.713.30.50
1.6000
1.4
56342289
3299
07
1708
5213853114318328136
18.099.497.63.599.0
02.549.43.827.787.396.234.299.513.021.4
92599420
1813
37178526731221
236
29.617.231.823.359.91.2
13.451.724.835.61.90.20.51.10.537.0
ASIPULO AmduntogAntipoloCamandagCawayanHallapNamalNungawaPanubtubanPula
123120000
0.30.90.40.40.80000
1616723637
4.10.40.82.70.81.15.61.53.2
393
462543174
2117
10.01.36.49.817.06.13.7
10.57.7
423
16919345141
66554
10.81.3
23.475.417.850.45.6
32.524.3
ALFONSO LISTA BangarBusilacCalimagCalupaanCaragasanDolowogKilingLayaLittle TadianNamillanganNamnamaNgilebPintoPoblacionSan JoseSan JuanSan MarcosSan QuintinSanta MariaSanto Domingo (Cabicalan)
010
4413001
1385
577505482
00.20
23.70.31.800
0.42.42.71.88.71.41.90
1.61.10.80.5
1.40.70
1.100
0.62.30.82.900
6.30.80.47.97.20.62.50.2
227068
25936
610
333
19082
572987923
1.46.30
3.22.3
15.317.14.5
23.60
11.11.12.90
3.00.617.984.47.65.6
45004717132
228259825
10382
1301010
1491
9414310
2.811.6
025.348.319.641.918.838.04.5
34.630.019.82.03.7
45.30.3
26.613.72.4
230200332
16004141
26232
261
BANAUE AmganadAnabaBalawisBanaoBangaanBatadBocosCambuloDucliganGohangKinakinOhajPoblacionPoitanPulaSan FernandoTam-anView Point
152
13520120012520001
4.21.47.94.11.30
0.20.900
0.51.31.00.7000
0.4
706310270011011740103
1.90
3.72.50.60
5.800
0.75.00.63.21.40
0.90
1.2
34214514911615989
28010
2064
1721511661501013811170
95.0100.090.995.1100.048.160.04.6
94.12.7
85.197.431.753.691.035.83.6
65.6
373243532780
135109630
132787040594
1347
10.322.126.243.417.043.228.950.528.8
065.350.313.414.353.23.84.2
18.1

The Many Faces of Poverty (Volume 9)
119
Table 2. Housing, Water and Sanitation Indicators, by Barangay, Province of Ifugao, 2015-2016
HINGYON AnaoBangtinonBituCababuyanMompoliaNamulditanNorthern CababuyanO-ongPiwongPoblacion (Hingyon)UbuagUmalbong
12346
10113811
1.12.72.53.02.04.70.70.31.33.91.40.7
0724365204620
09.31.732.62.02.41.30
1.72.92.70
370
300
14104
122
1500
42.00
24.80
46.80
2.73.60.87.400
25413355
1045942
1531432571
HUNGDUAN AbatanBa-angBangbangBokiawanHapaoLubo-ongMaggokNungulunanPoblacion
251891
1808
29
15.80.97.35.20.3
10.10
6.610.4
00018
46213
21
000
0.62.325.818.32.57.5
1750
2012211010
10.84.60
11.63.4
11.88.70.80
477
16372036341531
29.76.5
14.521.45.6
20.229.612.311.1
Households living inmakeshift housing
Households who areinformal settlers
Households without accessto safe water supply
Households without accessto sanitary toilet facilities
BarangayMunicipality
ProportionProportion Proportion ProportionMagnitude Magnitude Magnitude Magnitude
28.454.727.341.734.627.828.045.85.9
15.76.847.3
LAGAWE AbinuanBangaBoliwongBurnayBuyabuyanCabaCudogDulaoJucbongLutaMontabiongOliliconPoblacion EastPoblacion NorthPoblacion SouthPoblacion WestPonghalPullaanTungngodTupaya
00240
162221711958
101730
00
0.51.60
8.60.61.91.9
29.30.91.01.91.33.42.31.29.71.30
210520330035104530000
1.719.21.30.80
1.60.900
5.24.41.00
1.12.10.70000
2120
112150
424
2501
229
2937195810470
17.538.528.2603.6
12.878.90.9
21.415.525.438.10.22.42.11.81.20
20.80
7719
1915936383552318
323690306
194148
64.236.548.123.632.720.311.049.130.113.828.137.11.90
1.30
7.426.418.135.8
KIANGAN AmbabagBaguingeBokiawanBologDalliganDuitHucabJulonganLingayMungayangNagacadanPindonganPoblacionTuplac
12600010110440
0.60.48.3000
0.30
1.60.40
1.61.10
074415500105
151
01.45.61.21.61.21.600
0.40
2.14.10.3
107255
8829
72314152
1283
20928924
67.351.411.124.914.117.498.414.63.247.11.8
86.079.67.9
19273
8140
1336519249735571124
11.95.44.2
24.662.532.220.418.438.735.721.523.53.07.9

120
The Many Faces of Poverty (Volume 9)
Table 2. Housing, Water and Sanitation Indicators, by Barangay, Province of Ifugao, 2015-2016
LAMUT AmbasaBimpalHapidHolowonLawigLucbanMabatobato (Lamut)MagulonNayonPanopdopanPayawanPiezaPoblacion EastPoblacion WestPugol (Ifugao Reservation)SalamagueSanafeUmilag
132111212350
2086152
0.60.90.60.60.30.60.50.40.81.51.10
4.81.11.40.51.51.0
122271002246445270
0.60.60.61.22.30.600
0.81.00.93.51.00.61.10.92.00
121136113
0502
85345266205
12241
26169
72.942.832.5
01.60
0.533.513.826.714.411.71.21.75.40.57.6
88.0
551084879133424
1433710
126684
13168412040
33.134.013.849.44.2
20.05.7
56.315.05.127.639.81.01.837.818.85.8
20.8
MAYOYAO AduyonganAlimitAyanganBalangbangBanaoBanhalBato-AlatbangBonganBuninanChayaChumangEpengGuinihonInwaloyLangayanLiwoMagaMagulonMapawoyMayoyao ProperMongolNalbuNattumPalaadPoblacionTalbocTulaed
0041110014
320000010200040200
00
3.40.41.60.600
1.21.7
18.400000
1.30
1.2000
1.90
1.000
021015701412810001111006132000
01.40.90
1.62.84.10
16.95.14.60.8000
1.71.31.20.600
9.46.22.7000
006100000100000
14290
152011
19171
540
00
5.20.400000
0.400000
23.337.2
092.1
00.91.69.1
23.00.5
70.10
3447
231752
953
37330
490
53470
4931181330
1596810183
412.96.09.8
26.62.81.2
60.93.6
15.819.0
045.8
085.578.3
058.318.819.611.946.976.491.94.8
23.43.3
Households living inmakeshift housing
Households who areinformal settlers
Households without accessto safe water supply
Households without accessto sanitary toilet facilities
BarangayMunicipality
ProportionProportion Proportion ProportionMagnitude Magnitude Magnitude Magnitude
TINOC AhinAp-apidBinablayanDanggoEhebGumhangImpugongLuhongTinocTukucanTulludanWangwang
111000302202
0.30.50.3000
0.90
0.40.40
1.0
311422406110
1.00.50.32.31.40.71.20
1.20.20.50
5700
158101303308814115540
129
18.400
91.970.699.389.341.880.311.519.267.2
20701
253670
1029556
2337537
66.80
0.314.525.223
29.649.010.948.536.119.3

The Many Faces of Poverty (Volume 9)
121
CBMS Poverty Maps: Province of Ifugao
Map 15. Proportion of Children 6-11 Years Old Not Attending Elementary School,by Municipality, 2015-2016
Map 16. Proportion of Children 6-11 Years Old Not Attending Elementary School,by Barangay, 2015-2016
Magnitude ProportionMunicipality
AGUINALDOMAYOYAOBANAUEASIPULOLAMUTTINOCKIANGANALFONSO LISTALAGAWEHUNGDUANHINGYON
2891181601201791191122451124855
10.67.56.46.16.05.85.85.55.24.94.6
Barangay Magnitude ProportionMunicipality
Bottom 10 Barangays
MAYOYAOMAYOYAOAGUINALDOBANAUEBANAUEAGUINALDOMAYOYAOBANAUEAGUINALDOAGUINALDO
NattumAlimitUbaoBangaanBanaoTa-angGuinihonAnabaMongayangTalite
179
64148
147
133711
19.319.115.314.914.013.313.013.012.512.0

122
The Many Faces of Poverty (Volume 9)
Map 18. Proportion of Children 12-15 Years Old Not Attending High School,by Barangay, 2015-2016
Map 17. Proportion of Children 12-15 Years Old Not Attending High School,by Municipality, 2015-2016
CBMS Poverty Maps: Province of Ifugao
Barangay Magnitude ProportionMunicipality
Bottom 10 Barangays
AGUINALDOASIPULOMAYOYAOAGUINALDOBANAUEMAYOYAOASIPULOKIANGANASIPULOTINOC
BuwagNamalPalaadItabBanaoNattumCawayanBokiawanCamandagDanggo
26105155825325117
19238
78.869.568.266.765.860.457.356.754.453.5
Magnitude ProportionMunicipality
ASIPULOAGUINALDOTINOCKIANGANHINGYONBANAUELAGAWEHUNGDUANLAMUTMAYOYAOALFONSO LISTA
516686451461279478402182459246507
45.242.337.335.733.129.727.927.024.623.720.3

The Many Faces of Poverty (Volume 9)
123
Map 19. Proportion of Children 6-15 years old Not Attending School,by Municipality, 2015-2016
Map 20. Proportion of Children 6-15 years old Not Attending School,by Barangay, 2015-2016
CBMS Poverty Maps: Province of Ifugao
Magnitude ProportionMunicipality
AGUINALDOTINOCASIPULOMAYOYAOKIANGANHINGYONHUNGDUANBANAUELAGAWEALFONSO LISTALAMUT
26219216798
1087056
12810918395
6.05.95.43.73.43.43.43.13.02.62.0
Barangay Magnitude ProportionMunicipality
Bottom 10 Barangays
MAYOYAOLAGAWETINOCMAYOYAOAGUINALDOAGUINALDOAGUINALDOLAGAWEAGUINALDOTINOC
NattumDulaoGumhangLangayanButacBuwagItabAbinuanChalaloTukucan
36173910329
21112324
25.513.813.210.910.59.89.49.29.08.8

124
The Many Faces of Poverty (Volume 9)
Table 3. Education Indicators, by Barangay, Province of Ifugao, 2015-2016
Number ofchildren (6-
11 years old)
Children notattending
elementary school(6-11 years old)
Number ofchildren (12-15 years old)
Children not attendinghigh school
(12-15 years old)
Number ofchildren (6-
15 yearsold)
Children notattending school(6-15 years old)
BarangayMunicipality
Magnitude Magnitude MagnitudeProportion Proportion Proportion
AGUINALDO AwayanBunhianButacBuwagChalaloDamagGalonogonHalagItabJacmalMajlongMongayangPosnaanTa-angTaliteUbao
ALFONSO LISTA BangarBusilacCalimagCalupaanCaragasanDolowogKilingLayaLittle TadianNamillanganNamnamaNgilebPintoPoblacionSan JoseSan JuanSan MarcosSan QuintinSanta MariaSanto Domingo (Cabicalan)
17714819559
1521251442241369975
29529210592419
1816147
1111161812105
3725141164
10.210.87.2
11.97.28.8
11.18.08.8
10.16.7
12.58.6
13.312.015.3
12063
11033
10485
101126875247
1991575347
239
52214726514132545820168069211682
43.333.342.778.849.048.231.742.966.738.534.040.243.939.634.034.3
29721130592
256210245350223151122494449158139658
156
329
231413202155
262993
32
5.12.810.59.89.06.75.35.79.43.34.15.36.55.72.24.9
892578511729274
31193175249166205410299172180207201640266
42284
117
2396
14122
18166
116
113520
4.58.69.43.43.89.57.49.73.45.67.21.04.45.43.56.12.95.55.57.5
35995073
15852
15847
10316799
12124315110475
121103375160
1128714329267162121325724171723228142
31.428.314.019.220.317.316.514.915.512.621.226.423.515.916.322.719.021.421.626.2
124 356 135 190 450 126 469 140 278 416 265 326 653 450 276 255 328 304
1,015 426
10202175
13568
104
18118497
2213
8.15.61.50.51.64.02.83.62.21.93.81.22.82.42.91.62.72.32.23.1
ASIPULO AmduntogAntipoloCamandagCawayanHallapNamalNungawaPanubtubanPula
27114862717712824767
145143
13104714317448
4.86.87.57.92.36.96.02.85.6
15398
3538987151388488
5622
1925118
10552641
36.622.454.457.320.769.513.231.046.6
424246980266215398105229231
209
67205
3102
13
4.73.76.87.52.37.80
0.95.6
BANAUE AmganadAnabaBalawisBanaoBangaanBatadBocosCambuloDucliganGohangKinakinOhajPoblacionPoitanPulaSan FernandoTam-anView Point
197100985794
109305161119999799
3341508149177171
101368
147
136
10373
28580
127
5.113.06.1
14.014.96.44.33.78.43.07.23.08.43.39.90
6.84.1
1575968385373
18411184697465174964834
122101
502114251820444727181818522121112528
31.835.620.665.834.027.423.942.332.126.124.327.729.921.943.832.420.527.7
3541591669514718248927220316817116450824612983
299272
736768
111414458
1947320
2.01.93.67.44.14.42.25.16.92.42.94.93.71.65.43.60.70

The Many Faces of Poverty (Volume 9)
125
Table 3. Education Indicators, by Barangay, Province of Ifugao, 2015-2016
HINGYON AnaoBangtinonBituCababuyanMompoliaNamulditanNorthern CababuyanO-ongPiwongPoblacion (Hingyon)UbuagUmalbong
HUNGDUAN AbatanBa-angBangbangBokiawanHapaoLubo-ongMaggokNungulunanPoblacion
28536265
1541441181931421162990
01137114713512
01.91.64.64.57.63.43.69.24.33.42.2
272868501078265
156105721965
11142416392515522526923
40.750.035.332.036.430.523.133.323.836.147.435.4
5581
13011526122618334924718848
155
1454772
185548
1.84.93.83.52.73.11.15.22.02.78.35.2
1186968
1082181146072
161
10346
113047
8.54.35.95.65.02.60
5.64.3
64484183
158694951
110
271114203817161128
42.222.934.124.124.124.632.721.625.5
182117109191376183109123271
136453
11293
7.15.13.72.60.86.01.87.31.1
Number ofchildren (6-
11 years old)
Children notattending
elementary school(6-11 years old)
Number ofchildren (12-15 years old)
Children not attendinghigh school
(12-15 years old)
Number ofchildren (6-
15 yearsold)
Children notattending school(6-15 years old)
BarangayMunicipality
Magnitude Magnitude MagnitudeProportion Proportion Proportion
LAGAWE AbinuanBangaBoliwongBurnayBuyabuyanCabaCudogDulaoJucbongLutaMontabiongOliliconPoblacion EastPoblacion NorthPoblacion SouthPoblacion WestPonghalPullaanTungngodTupaya
7025
22613669
1382046848386769
159190114249524211787
42444
10601145
1597
230382
5.78.01.82.95.87.22.90
2.12.66.07.29.44.76.19.20
7.16.82.3
4923
169734875
135552619464099
13095
16638228746
218502224173026124205301825377112114
42.9 34.8 29.6 30.1 50.0 22.7 22.2 47.3 46.2 21.1 43.5 12.5 30.3 13.8 26.3 22.3 18.4 50.0 24.1 30.4
11948
3952091172133391237457
1131092583202094159064
204133
113
14952917117162641082
9.26.23.54.34.30.92.713.81.41.86.20.92.30.62.91.01.10
3.91.5
KIANGAN AmbabagBaguingeBokiawanBologDalliganDuitHucabJulonganLingayMungayangNagacadanPindonganPoblacionTuplac
9727051
22335
2221875327
15992
129180205
6173
122
14112145
109
16
6.26.35.95.45.76.35.93.83.72.55.47.85.07.8
265117529654916124417303637
33.832.356.740.652.939.235.850.050.038.936.229.429.527.0
1744288135152
3883248551
272139231302342
875
231
15102155
114
11
4.61.66.26.61.93.93.12.42.01.83.64.81.33.2
7715830
12817
1661373224
11347
102122137

126
The Many Faces of Poverty (Volume 9)
Table 3. Education Indicators, by Barangay, Province of Ifugao, 2015-2016
LAMUT AmbasaBimpalHapidHolowonLawigLucbanMabatobato (Lamut)MagulonNayonPanopdopanPayawanPiezaPoblacion EastPoblacion WestPugol (Ifugao Reservation)SalamagueSanafeUmilag
MAYOYAO AduyonganAlimitAyanganBalangbangBanaoBanhalBato-AlatbangBonganBuninanChayaChumangEpengGuinihonInwaloyLangayanLiwoMagaMagulonMapawoyMayoyao ProperMongolNalbuNattumPalaadPoblacionTalbocTulaed
9121326014216598
19518112110223584
191283232124154119
11614151658960
166
191498
125
1.17.55.4
10.69.75.14.15.05.00
6.87.19.94.93.96.57.84.2
7711713567
10360
1481008952
15059
116208157708872
23263314281029213415468275941151119
29.922.224.420.927.216.719.621.038.228.830.713.623.328.426.121.412.526.4
168330395209268158343281210154385143307491389194242191
14
1675414
10151767556
0.61.24.13.31.92.50.31.44.80.61.30.72.31.21.82.62.13.1
274747973171755746
1258755545655224464873726238840976354
3906216045637561436231172565
11.119.1
06.26.51.48.00
8.74.06.95.5
13.08.9
10.94.59.14.76.95.4
11.54.3
19.35.05.29.59.3
263637782453453832666034442737233630352515175322664437
649148736320119614127861042332151593
23.111.124.317.933.313.26.7
15.89.4
30.318.326.513.651.932.430.422.220.028.616.013.317.660.468.222.720.58.1
53838417555
1241209578
19114789988392458094
12262414014162
16310791
23121220063640
103105000
363620
3.83.61.21.11.81.61.700
3.12.06.74.10
10.96.71.20
4.1000
25.54.83.71.90
Number ofchildren (6-
11 years old)
Children notattending
elementary school(6-11 years old)
Number ofchildren (12-15 years old)
Children not attendinghigh school
(12-15 years old)
Number ofchildren (6-
15 yearsold)
Children notattending school(6-15 years old)
BarangayMunicipality
Magnitude Magnitude MagnitudeProportion Proportion Proportion
TINOC AhinAp-apidBinablayanDanggoEhebGumhangImpugongLuhongTinocTukucanTulludanWangwang
18413816314375
193236172292175135132
72
1924
11201410134
13
3.81.4
11.71.45.35.78.58.13.47.43.09.8
12470997142
103132106201989369
552336381655434156332827
44.432.936.453.538.153.432.638.727.933.730.139.1
308208262214117296368278493273228201
2415478
391516222499
7.87.21.53.36.813.24.15.84.58.83.94.5

The Many Faces of Poverty (Volume 9)
127
Map 22. Proportion of Households with Income Below the Poverty Threshold,by Barangay, 2015-2016
Map 21. Proportion of Households with Income Below the Poverty Threshold,by Municipality, 2015-2016
CBMS Poverty Maps: Province of Ifugao
Barangay Magnitude ProportionMunicipality
Bottom 10 Barangays
MAYOYAOAGUINALDOKIANGANMAYOYAOKIANGANMAYOYAOLAGAWEAGUINALDOAGUINALDOMAYOYAO
NalbuBuwagDalliganAduyonganLingayBuninanPonghalJacmalMajlongBanhal
63836178587674
167137153
98.496.595.394.093.591.691.488.886.786.4
Magnitude ProportionMunicipality
AGUINALDOTINOCMAYOYAOASIPULOHINGYONHUNGDUANKIANGANBANAUEALFONSO LISTALAGAWELAMUT
3,4162,1772,0021,5621,205908
1,8392,1983,6961,8391,894
71.664.559.958.958.056.954.753.250.246.734.2

128
The Many Faces of Poverty (Volume 9)
Map 23. Proportion of Households with Income Below the Food Threshold,by Municipality, 2015-2016
Map 24. Proportion of Households with Income Below the Food Threshold,by Barangay, 2015-2016
CBMS Poverty Maps: Province of Ifugao
Magnitude ProportionMunicipality
AGUINALDOTINOCMAYOYAOHINGYONASIPULOKIANGANBANAUEALFONSO LISTAHUNGDUANLAGAWELAMUT
2,7791,5811,468864
1,1021,3791,5972,779580
1,3781,083
58.346.943.941.641.541.038.737.836.335.019.5
Barangay Magnitude ProportionMunicipality
Bottom 10 Barangays
AGUINALDOMAYOYAOLAGAWEMAYOYAOKIANGANKIANGANAGUINALDOMAYOYAOHINGYONAGUINALDO
BuwagNalbuPonghalAduyonganDalliganLingayJacmalBalangbangBangtinonMajlong
785872735551
15418258
120
90.790.688.988.085.982.381.977.477.375.9

The Many Faces of Poverty (Volume 9)
129
Map 26. Proportion of Households who Experienced Hunger Due to Food Shortage,by Barangay, 2015-2016
Map 25. Proportion of Households who Experienced Hunger Due to Food Shortage,by Municipality, 2015-2016
CBMS Poverty Maps: Province of Ifugao
Magnitude ProportionMunicipality
MAYOYAOLAGAWEHINGYONKIANGANALFONSO LISTAAGUINALDOLAMUTASIPULOTINOCBANAUEHUNGDUAN
471777
12371000
1.40.40.30.20.20.10.10.0000
Barangay Magnitude ProportionMunicipality
Bottom 10 Barangays
MAYOYAOMAYOYAOLAGAWELAGAWEHINGYONLAGAWEAGUINALDOALFONSO LISTAMAYOYAOKIANGAN
NalbuNattumBangaBuyabuyanUmalbongTupayaBuwagSan JoseBalangbangBaguinge
182766731324
28.113.011.55.54.72.21.21.10.90.8

130
The Many Faces of Poverty (Volume 9)
Households with income below thepoverty threshold
Households with income below thefood threshold
Households who experienced hungerdue to food shortage
Table 4. Income Poverty and Hunger Indicators, by Barangay, Province of Ifugao, 2015-2016
BarangayMunicipality
Magnitude Magnitude MagnitudeProportion Proportion Proportion
AGUINALDO AwayanBunhianButacBuwagChalaloDamagGalonogonHalagItabJacmalMajlongMongayangPosnaanTa-angTaliteUbao
ALFONSO LISTA BangarBusilacCalimagCalupaanCaragasanDolowogKilingLayaLittle TadianNamillanganNamnamaNgilebPintoPoblacionSan JoseSan JuanSan MarcosSan QuintinSanta MariaSanto Domingo (Cabicalan)
23726424483
25518614428413716713734523114299
461
76.276.782.496.584.475.652.082.665.288.886.762.555.377.246.072.4
20423121778
22216196
25889
15412022615612455
388
65.667.273.390.773.565.434.775.042.481.975.940.937.367.425.660.9
0001000200000000
000
1.2000
0.600000000
8030285
116198853477214791
19621448348
133168100161504166
55.270.160.362.455.952.163.854.157.016.565.878.473.79.5
49.651.131.345.648.340.1
662416192
13459
261468240
15019541725
10314159
12139888
45.555.943.349.537.936.248.034.631.87.3
50.371.463.75.0
38.442.918.534.338.121.3
00101010100000300230
00
0.70
0.30
0.20
0.400000
1.100
0.60.30
ASIPULO AmduntogAntipoloCamandagCawayanHallapNamalNungawaPanubtubanPula
1747354717489
21455
103133
44.732.675.968.035.276.450.951.559.9
11850
42311545
166374999
30.322.358.744.917.859.334.324.544.6
000001000
00000
0.4000
BANAUE AmganadAnabaBalawisBanaoBangaanBatadBocosCambuloDucliganGohangKinakinOhajPoblacionPoitanPulaSan FernandoTam-anView Point
1868794
10396
1361861771458059
120160141917190176
51.760.057.384.460.473.539.881.966.254.129.277.430.550.482.067.029.268.0
1236468857510790
1631136122
1069698825457
133
34.244.141.569.747.257.819.375.551.641.210.968.418.335.073.950.918.551.4
000000000000000000
000000000000000000

The Many Faces of Poverty (Volume 9)
131
Table 4. Income Poverty and Hunger Indicators, by Barangay, Province of Ifugao, 2015-2016
HINGYON AnaoBangtinonBituCababuyanMompoliaNamulditanNorthern CababuyanO-ongPiwongPoblacion (Hingyon)UbuagUmalbong
HUNGDUAN AbatanBa-angBangbangBokiawanHapaoLubo-ongMaggokNungulunanPoblacion
42626177
16912711918877
12543
115
47.782.750.458.356.159.979.356.332.461.358.176.7
22583851978898
13354993294
25.077.331.438.632.241.565.339.822.748.543.262.7
000000000007
00000000000
4.7
1006878
119179857851
150
63.363.070.968.850.647.867.841.853.8
63373083
135506019
103
39.934.327.348.038.128.152.215.636.9
000000000
000000000
Households with income below thepoverty threshold
Households with income below thefood threshold
Households who experienced hungerdue to food shortage
BarangayMunicipality
Magnitude Magnitude MagnitudeProportion Proportion Proportion
LAGAWE AbinuanBangaBoliwongBurnayBuyabuyanCabaCudogDulaoJucbongLutaMontabiongOliliconPoblacion EastPoblacion NorthPoblacion SouthPoblacion WestPonghalPullaanTungngodTupaya
9738
2026485
1012228883379263
13940
1158874466699
80.873.150.925.677.354.070.083.080.663.880.764.929.610.748.320.291.463.929.273.9
8331
120237170
1917566258139
10325856372373286
69.259.630.29.2
64.537.460.370.864.143.171.140.222.06.7
35.714.588.951.414.264.2
06006000000000110003
011.5
00
5.5000000000
0.40.2000
2.2
KIANGAN AmbabagBaguingeBokiawanBologDalliganDuitHucabJulonganLingayMungayangNagacadanPindonganPoblacionTuplac
6019561
20561
2952226558
16996117126117
37.739.384.762.395.371.469.663.193.562.158.948.134.738.5
3411451
14856
2281945252
13175789777
21.423.070.845.087.555.260.850.583.948.246.032.126.725.3
04010000001001
00.80
0.3000000
0.600
0.3

132
The Many Faces of Poverty (Volume 9)
Households with income below thepoverty threshold
Households with income below thefood threshold
Households who experienced hungerdue to food shortage
Table 4. Income Poverty and Hunger Indicators, by Barangay, Province of Ifugao, 2015-2016
BarangayMunicipality
Magnitude Magnitude MagnitudeProportion Proportion Proportion
LAMUT AmbasaBimpalHapidHolowonLawigLucbanMabatobato (Lamut)MagulonNayonPanopdopanPayawanPiezaPoblacion EastPoblacion WestPugol (Ifugao Reservation)SalamagueSanafeUmilag
MAYOYAO AduyonganAlimitAyanganBalangbangBanaoBanhalBato-AlatbangBonganBuninanChayaChumangEpengGuinihonInwaloyLangayanLiwoMagaMagulonMapawoyMayoyao ProperMongolNalbuNattumPalaadPoblacionTalbocTulaed
951201921161037681
1207646
16378
10586
12098
113106
57.237.755.272.533.744.719.147.230.823.635.745.625.112.127.045.032.955.2
6074
114976953236442187454563460586766
36.123.332.860.622.531.25.4
25.217.09.2
16.231.613.44.8
13.526.619.534.4
000000010000212010
0000000
0.40000
0.50.10.50
0.30
787985
19814
153779476
1381305741223038565189535063
1140
1175544
94.056.473.384.321.986.445.060.391.659.074.747.538.320.248.463.371.860.753.957.645.998.454.8
056.571.447.8
735171
1827
1265075618798272910717313366314058780
983230
88.036.461.277.410.971.229.248.173.537.256.322.527.19.2
11.328.339.739.340.033.736.790.637.5
047.341.632.6
000200000000000000000
18270000
000
0.900000000000000000
28.113.0
0000
TINOC AhinAp-apidBinablayanDanggoEhebGumhangImpugongLuhongTinocTukucanTulludanWangwang
21616918012597
201173116301277163159
69.776.861.672.767.865.950.159.858.857.778.482.8
1641351228974
12811267
215205127143
52.961.441.851.751.742.032.534.542.042.761.174.5
000000000000
000000000000

The Many Faces of Poverty (Volume 9)
133
CBMS Poverty Maps: Province of Ifugao
Map 27. Unemployment Rate (15 years old and above), by Municipality, 2015-2016
Map 28. Unemployment Rate (15 years old and above), by Barangay, 2015-2016
Barangay Magnitude ProportionMunicipality
Bottom 10 Barangays
MAYOYAOAGUINALDOMAYOYAOMAYOYAOMAYOYAOMAYOYAOMAYOYAOALFONSO LISTAHINGYONKIANGAN
InwaloyJacmalPalaadChayaBalangbangAyanganMapawoyPintoNorthern CababuyanNagacadan
13619133
1421243335
1593844
62.455.848.538.437.321.219.616.315.714.7
Magnitude ProportionMunicipality
MAYOYAOALFONSO LISTAHINGYONBANAUEAGUINALDOKIANGANLAGAWELAMUTHUNGDUANTINOCASIPULO
68971823044543131830929412414696
13.26.46.25.75.35.04.83.73.42.31.6

134
The Many Faces of Poverty (Volume 9)
Map 30. Proportion of Persons who are Victims of Crime, by Barangay, 2015-2016
Map 29. Proportion of Persons who are Victims of Crime,by Municipality, 2015-2016
CBMS Poverty Maps: Province of Ifugao
Barangay Magnitude ProportionMunicipality
Bottom 9 Barangays
ALFONSO LISTATINOCTINOCMAYOYAOLAGAWETINOCMAYOYAOHINGYONHINGYON
Santo Domingo (Cabicalan)DanggoGumhangLangayanTupayaEhebPalaadNamulditanBitu
301112233142
1.61.20.90.70.60.50.40.40.4
Magnitude ProportionMunicipality
TINOCMAYOYAOALFONSO LISTAHINGYONBANAUEKIANGANLAGAWEHUNGDUANAGUINALDOLAMUTASIPULO
3110421015999655
0.20.10.10.10.10.10.10.10.00.00.0

The Many Faces of Poverty (Volume 9)
135
Table 5. Unemployment and Victims of Crime Indicators, by Barangay, Province of Ifugao,2015-2016
Unemployment rate(15 years old and above)
Persons who are victims of crimesNumber of persons in thelabor force
(15 years old and above)
BarangayMunicipality
ProportionProportion MagnitudeMagnitude
AGUINALDO AwayanBunhianButacBuwagChalaloDamagGalonogonHalagItabJacmalMajlongMongayangPosnaanTa-angTaliteUbao
ALFONSO LISTA BangarBusilacCalimagCalupaanCaragasanDolowogKilingLayaLittle TadianNamillanganNamnamaNgilebPintoPoblacionSan JoseSan JuanSan MarcosSan QuintinSanta MariaSanto Domingo (Cabicalan)
587 325 531 171 482 479 574 379 310 342 315 956 849 296 391
1,183
201862
199
252533
1914
1311171
37
2.47.11.21.04.31.55.05.18.0
60.71.71.11.13.40.52.3
1010000000001012
0.10
0.1000000000
0.10
0.10.1
194 599 225 291 693 389 818 118 338 785 517 281 976 859 397 394 394 535
1,611 775
11203231561
180
13452013
1593816501522
11345
5.73.3
14.210.78.10.32.20
3.85.73.94.6
16.34.44.0
12.73.84.17.05.8
110000001100010000730
0.20.1000000
0.10.0000
0.00000
0.21.6
ASIPULO AmduntogAntipoloCamandagCawayanHallapNamalNungawaPanubtubanPula
911 523
1,612 574 493 722 249 394 530
25111258
106
127
2.72.10.70.91.61.42.43.01.3
000210101
000
0.20.10
0.20
0.1
BANAUE AmganadAnabaBalawisBanaoBangaanBatadBocosCambuloDucliganGohangKinakinOhajPoblacionPoitanPulaSan FernandoTam-anView Point
657240334256241431916553375233371259933539203177543490
768
19251215456
102
15256424172
6119
11.63.35.79.85.03.54.91.12.70.94.09.76.94.58.41.1
11.23.9
502101100002110010
0.30
0.30.20
0.10.00000
0.30.00.100
0.10

136
The Many Faces of Poverty (Volume 9)
Table 5. Unemployment and Victims of Crime Indicators, by Barangay, Province of Ifugao,2015-2016
Unemployment rate(15 years old and above)
Persons who are victims of crimesNumber of persons in thelabor force
(15 years old and above)
BarangayMunicipality
ProportionProportion MagnitudeMagnitude
HINGYON AnaoBangtinonBituCababuyanMompoliaNamulditanNorthern CababuyanO-ongPiwongPoblacion (Hingyon)UbuagUmalbong
HUNGDUAN AbatanBa-angBangbangBokiawanHapaoLubo-ongMaggokNungulunanPoblacion
182120235204477376242628431400162264
113948
183876133749
6.02.53.82.01.74.8
15.712.13.09.22.53.4
102104010010
0.30
0.40.20
0.40
0.100
0.30
417245320409749362224324571
11037
81145
12
0.24.10.91.7
10.80.31.81.52.1
200160000
0.200
0.10.30000
KIANGAN AmbabagBaguingeBokiawanBologDalliganDuitHucabJulonganLingayMungayangNagacadanPindonganPoblacionTuplac
274878193677126814498200146529299626460631
13395
891
447
183
104450
40
4.74.42.6
13.10.85.41.49.02.11.9
14.70.80
6.3
11000410000101
0.10.0000
0.20.10000
0.10
0.1
KIANGAN AbinuanBangaBoliwongBurnayBuyabuyanCabaCudogDulaoJucbongLutaMontabiongOliliconPoblacion EastPoblacion NorthPoblacion SouthPoblacion WestPonghalPullaanTungngodTupaya
282120580456262393469178218115208180568535304634147159408174
04
1934111118787
193
1326134026
4919
03.33.37.54.22.83.83.93.76.19.11.72.34.94.36.31.43.8
12.010.9
00100120000010000103
00
0.100
0.10.100000
0.10000
0.30
0.6

The Many Faces of Poverty (Volume 9)
137
Table 5. Unemployment and Victims of Crime Indicators, by Barangay, Province of Ifugao,2015-2016
Unemployment rate(15 years old and above)
Persons who are victims of crimesNumber of persons in thelabor force
(15 years old and above)
BarangayMunicipality
ProportionProportion MagnitudeMagnitude
LAMUT AmbasaBimpalHapidHolowonLawigLucbanMabatobato (Lamut)MagulonNayonPanopdopanPayawanPiezaPoblacion EastPoblacion WestPugol (Ifugao Reservation)SalamagueSanafeUmilag
MAYOYAO AduyonganAlimitAyanganBalangbangBanaoBanhalBato-AlatbangBonganBuninanChayaChumangEpengGuinihonInwaloyLangayanLiwoMagaMagulonMapawoyMayoyao ProperMongolNalbuNattumPalaadPoblacionTalbocTulaed
272400512142419268540520383359594280523956654258426395
19159
15161219327
216
1628312175
15
7.03.81.8
10.63.84.53.56.21.85.81.05.75.43.23.22.71.23.8
001010001000100010
00
0.10
0.1000
0.1000
0.1000
0.10
13518115633212017025121911237028025414021815010615115117910322313034168
320136210
84
33124
316114
14238109
1367187
356122
33355
18
5.92.2
21.237.32.59.40.40.53.6
38.413.63.96.4
62.44.70.95.34.6
19.65.80.41.50.6
48.510.93.78.6
000000001300102000000001101
00000000
0.30.300
0.30
0.700000000
0.40.10
0.2
TINOC AhinAp-apidBinablayanDanggoEhebGumhangImpugongLuhongTinocTukucanTulludanWangwang
457 381 198 448 279 644 685 542
1,070 715 503 341
247
20098
304
2523
14
5.31.8
10.10
3.21.24.40.72.30.30.64.1
00011312202001
000
1.20.50.90.10
0.100
0.1

138
The Many Faces of Poverty (Volume 9)
Map 32. CBMS Composite Indicator, by Barangay, 2015-2016
Map 31. CBMS Composite Indicator, by Municipality, 2015-2016
CBMS Poverty Maps: Province of Ifugao
AverageMunicipality
AGUINALDOTINOCBANAUEKIANGANMAYOYAOHINGYONASIPULOHUNGDUANALFONSO LISTALAGAWELAMUT
2.22.01.91.71.61.61.51.41.31.31.0
Barangay AverageMunicipality
Bottom 9 Barangays
AGUINALDOAGUINALDOBANAUEBANAUEBANAUEAGUINALDOAGUINALDOMAYOYAOAGUINALDO
HalagChalaloBanaoPulaOhajJacmalButacNalbuBunhian
3.43.33.23.23.23.03.02.82.7

The Many Faces of Poverty (Volume 9)
139
Table 6. CBMS Composite Indicator, by Barangay, Province of Ifugao, 2015-2016
BarangayMunicipality CBMS Composite Indicator
Barangay CBMS Composite Indicator
Municipality
AGUINALDO AwayanBunhianButacBuwagChalaloDamagGalonogonHalagItabJacmalMajlongMongayangPosnaanTa-angTaliteUbao
BangarBusilacCalimagCalupaanCaragasanDolowogKilingLayaLittle TadianNamillanganNamnamaNgilebPintoPoblacionSan JoseSan JuanSan MarcosSan QuintinSanta MariaSanto Domingo (Cabicalan)
ALFONSO LISTA
HINGYON AnaoBangtinonBituCababuyanMompoliaNamulditanNorthern CababuyanO-ongPiwongPoblacion (Hingyon)UbuagUmalbong
HUNGDUAN AbatanBa-angBangbangBokiawanHapaoLubo-ongMaggokNungulunanPoblacion
2.0 2.7 3.0 2.3 3.3 1.5 1.2 3.4 1.7 3.0 2.6 2.1 1.4 2.6 0.9 2.1
1.2 1.5 1.3 1.8 1.6 1.3 1.8 1.2 1.6 0.4 1.7 1.9 2.0 0.3 1.1 1.7 0.9 2.0 1.2 0.9
1.6 2.4 1.5 1.8 1.8 1.5 2.0 1.7 0.7 1.6 1.3 2.1
1.7 1.3 1.3 1.6 1.3 1.5 1.8 0.9 1.3
KIANGAN AmbabagBaguingeBokiawanBologDalliganDuitHucabJulonganLingayMungayangNagacadanPindonganPoblacionTuplac
1.5 1.3 2.0 1.9 2.6 1.9 2.6 1.6 2.3 2.0 1.5 2.0 1.5 0.9
AmduntogAntipoloCamandagCawayanHallapNamalNungawaPanubtubanPula
ASIPULO 1.1 0.7 1.8 2.1 0.9 2.1 1.1 1.3 1.5
AmganadAnabaBalawisBanaoBangaanBatadBocosCambuloDucliganGohangKinakinOhajPoblacionPoitanPulaSan FernandoTam-anView Point
BANAUE 2.2 2.4 2.5 3.2 2.4 2.4 1.7 2.3 2.5 1.0 2.1 3.2 1.1 1.7 3.2 1.6 0.7 2.1
LAGAWE AbinuanBangaBoliwongBurnayBuyabuyanCabaCudogDulaoJucbongLutaMontabiongOliliconPoblacion EastPoblacion NorthPoblacion South
2.5 2.5 1.7 1.4 2.0 1.4 2.3 2.3 2.1 1.9 2.4 1.9 0.6 0.3 1.0

140
The Many Faces of Poverty (Volume 9)
Table 6. CBMS Composite Indicator, by Barangay, Province of Ifugao, 2015-2016
BarangayMunicipality CBMS CompositeIndicator
LAMUT AmbasaBimpalHapidHolowonLawigLucbanMabatobato (Lamut)MagulonNayonPanopdopanPayawanPiezaPoblacion EastPoblacion WestPugol (Ifugao Reservation)SalamagueSanafeUmilag
AduyonganAlimitAyanganBalangbangBanaoBanhalBato-AlatbangBonganBuninanChayaChumangEpengGuinihonInwaloyLangayanLiwoMagaMagulonMapawoyMayoyao ProperMongolNalbuNattumPalaadPoblacionTalbocTulaed
MAYOYAO
2.1 1.4 1.4 2.0 0.7 1.1 0.4 1.8 0.9 0.8 1.0 1.4 0.6 0.3 0.9 1.0 0.7 2.1
2.31.01.72.20.71.70.81.72.01.72.00.81.31.01.72.11.61.72.31.21.02.82.21.61.32.21.0
AhinAp-apidBinablayanDanggoEhebGumhangImpugongLuhongTinocTukucanTulludanWangwang
TINOC 2.2 1.5 1.1 2.4 2.3 2.5 2.2 2.0 2.0 1.7 2.0 2.6
Poblacion WestPonghalPullaanTungngodTupaya
0.5 1.9 1.6 1.0 1.9
LAGAWE

Republic of the PhilippinesProvince of OCCIDENTAL MINDORO
Message
MARIO GENE MENDIOLA Governor
Living today in an era where demands and expectations for the delivery ofpublic services are high, local government’s most efficient tool is the use of thelatest technologies of our time.
The Community–Based Monitoring System (CBMS) has proven its worth bymaking available and accurate disaggregated data that aids us, executives, in thelocal government units to veer our administration to the right path in planning andmanaging programs and projects for development.
Occidental Mindoro is now privileged to avail of the limitless e-informationprovided by the CBMS Network as that of the accurate frame of poverty in ourprovince guiding us in addressing the actual plight of our less privilege constituentsand providing appropriate responses to alleviate their primary concerns anddifficulties.
I would like to congratulate the CBMS Network and all those behind thepublication of the 9th Volume of “The Many Faces of Poverty” and the inclusion ofthe municipalities of Calintaan, Looc, Lubang, Mamburao, Rizal, Sablayan and Sta.Cruz to this data box information system.
God bless.

MAYORS OF OCCIDENTAL MINDORO
ERIC LABRADORMunicipality of Calintaan
BENJAMIN TRIAMunicipality of Looc
ELEONOR FAJARDOMunicipality of Magsaysay
ROBERTO SANCHEZMunicipality of Lubang

ANGELINA TRIAMunicipality of Mamburao
JESUS VALDEZ, SR.Municipality of Rizal
EDUARDO GADIANOMunicipality of Sablayan
MERIAM QUIJANOMunicipality of Santa Cruz
MAYORS OF OCCIDENTAL MINDORO

144
The Many Faces of Poverty (Volume 9)
The Many Faces of Poverty in theProvince of Occidental Mindoro
Occidental Mindoro had a total population of 216,186 covering 53,645 householdsThe CBMS census conducted from 2015 to 2017 covered 7 municipalities in the province, namely, Calintaan, Looc,Lubang, Mamburao, Rizal, Sablayan, and Santa Cruz, with 91 barangays. Of the 216,186 locals, 51.3 percent are male,while 48.7 percent are female. The Municipality of Sablayan has the largest population with 72,194 members (or 30%)in 17,887 households, followed by Mamburao with 51,645 members (or 21.5%) in 12,611 households.
HEALTH AND NUTRITIONTwo in every 1000 children under five years old diedAbout 0.2 percent of children under five years old died duringthe reference period. This is equivalent to 52 child deaths inthe province. The proportion of child deaths among boys washigher than girls, at 0.3 percent and 0.2 percent, respectively.The highest proportion of child deaths was reported in theMunicipality of Looc at 0.8 percent, followed by theMunicipality of Calintaan at 0.4 percent. Meanwhile, theMunicipality of Sablayan ranked first in terms of magnitudewith 16 cases of child deaths. Across all the barangays,Barangay Araw at Bituin in Lubang registered the highestproportion of child deaths at 3.1 percent. This was followed byBarangay Bonbon in Looc and Barangay Tanyag in Calintaan,at 2.4 percent and 1.7 percent, respectively.
The 2015-2017 CBMS Census covers 7 municipalities in the Province of Occidental Mindoro, namely, Calintaan, Looc, Lubang,Mamburao, Rizal, Sablayan, and Santa Cruz.
POPULATION

The Many Faces of Poverty (Volume 9)
145
One in every 1000 pregnant women died due to pregnancy-related causesAccording to the results of the CBMS census, 3 cases of pregnant women aged 15-49 died due to pregnancy-relatedcauses during the reference period. These cases were reported in 3 barangays, namely, Pitogo, Pag-Asa, and GeneralEmilio Aguinaldo.
Around 3 in every 1000 children zero to five years old weremalnourishedAround 2.5 percent or 729 children zero to five years oldwere classified as moderately or severely underweight in theProvince of Occidental Mindoro. In particular, 370 boys and359 girls zero to five years old were considered malnourished.Malnutrition prevalence among girls was higher than boys, at2.6 percent and 2.5 percent, respectively. The highestprevalence of malnutrition was observed in Looc at 8 percent,followed by Lubang at 4.4 percent. On the other hand,Sablayan ranked first in terms of magnitude with 291 casesof malnourished children. Barangay Kurtinganan in Santa Cruzreported the highest proportion of malnourished children at18.3 percent (38 cases), followed by Barangay Ambil in Loocat 16.6 percent (32 cases).
HOUSINGAbout 1.6 percent of households were living in makeshift housing while 3.2 percent were informal settlersThe 2015-2017 CBMS data showed that 2 in every 100 households in the province were living in makeshift housing.First in terms of proportion was the Municipality of Calintaan, with about 4 percent or 237 households living in makeshifthousing. Second was Looc at 2.7 percent or 59 households, while third was Rizal at 2.4 percent or 182 households. Atthe barangay level, Barangay Concepcion in Calintaan had the highest proportion of households living in makeshifthousing at 14.3 percent (130 households), followed by Barangay Bonbon in Looc at 12.7 percent (33 households).
In terms of tenure status, 1,699 households or 3 in every 100 households in the province were considered informalsettlers. The highest proportion of informal settlers was observed in the Municipality of Looc at 7.4 percent (159households). This was followed by the Municipality of Santa Cruz at 5.4 percent (457 households). Meanwhile, theMunicipality of Santa Cruz has the highest number of informal settlers across all municipalities. At the barangay level,the highest proportion of informal settlers was observed in Barangay Casague in Santa Cruz at 21.1 percent (128households), while the second highest in terms of proportion was Barangay Kanluran in Looc at 18.2 percent (24households).

146
The Many Faces of Poverty (Volume 9)
WATER AND SANITATIONAbout 9.4 percent of the households do not have access to safe water supply and about 8.2 percent do not have accessto sanitary toilet facilitiesBased on the results of the CBMS census, 9 in every 100 households in Occidental Mindoro had no access to safe watersupply. The Municipality of Lubang had the worst condition in terms of water accessibility as 39.2 percent of its householdswere reported to have no access to safe water supply during the reference period. This was followed by Calintaan at11.5 percent. In terms of magnitude, Lubang also ranked first with 1,952 cases. All 148 households in BarangayBulacan in Looc had no access to safe water supply. Of the 91 barangays, 5 can be considered “waterless”1.
On the other hand, 8.2 percent of the households do not have access to sanitary toilet facilities. This means that around8 in every 100 households in the province lacked access to sanitary toilet facilities. The Municipality of Calintaanreported the highest proportion of sanitation poor households at 11.7 percent or 691 households, followed by Mamburaoat 11.2 percent or 1,414 households. Meanwhile, at the barangay level, the highest proportion of sanitation poorhouseholds was observed in Barangay Malpalon at 37.1 percent (155 cases), followed by Barangay Lumangbayan at34.3 percent (267 cases).
1 “Waterless” barangays refer to barangays with less than 50 percent safe water supply coverage, as defined by the SALINTUBIG Programof the Department of Health (DOH).

The Many Faces of Poverty (Volume 9)
147
BASIC EDUCATIONAbout 5 in every 100 children 6 to 15 years old were notattending schoolThe proportion of out-of-school children 6-15 years old was5.1 percent. Regardless of education level, 5 in every 100children 6-15 years old were not attending school. Resultsrevealed that 10.3 percent of children 6-11 years old werenot attending elementary school, while 33.8 percent ofchildren 12-15 years old were not attending high school.Results also showed that the proportion of out-of-schoolchildren among boys (6.1%) was higher compared to girls(3.9%). Out of 7 municipalities, Santa Cruz had the highestproportion of out-of-school children 6-15 years old at 7.6percent. Sablayan was second highest at 5.8 percent, followedby Rizal at 5.7 percent. Sablayan ranked first in terms ofmagnitude, with 1,008 cases observed.
INCOME AND LIVELIHOODAbout 59 in every 100 households were living below thepoverty thresholdMore than half or 58.6 percent of the households in theprovince were considered income poor, which means thataround 59 in every 100 households have no sufficientincome to satisfy their basic food and non-food needs.Among 7 municipalities, only Mamburao had an incomepoverty rate below 50 percent. Rizal had the highestproportion of households living below poverty thresholdat 77.5 percent, followed by Calintaan at 71.3 percent.Across all barangays in the province, the highest proportionof income poor households was observed in BarangayManoot at 86.5 percent (895 cases). This was followedby Barangay Aguas at 86.1 percent (570 cases).
Around 45 in every 100 households had no sufficientincome to satisfy their food needsAccording to the CBMS data, 45.2 percent of thehouseholds in Occidental Mindoro were living below thefood threshold. Subsistence incidence was most prevalentin the Municipality of Rizal at 67.7 percent (5,129households). This was followed by the Municipality ofCalintaan at 62 percent (3,670 households). At thebarangay level, Barangay New Dagupan in Calintaanrecorded the highest incidence of subsistence at 79.9percent, followed by Barangay Manoot in Rizal at 78.6percent.

148
The Many Faces of Poverty (Volume 9)
One in every 100 households experienced hunger dueto food shortageAround 1 percent of the households in the provincesuffered from hunger during the three-month periodbefore the census. Hunger due to food shortage wasmost prevalent in the municipality of Calintaan at 8.3percent or 491 cases. Next to Calintaan was Rizal at2.1 percent or 161 cases. Across all the barangays, thehighest proportion of households that experiencedhunger due to food shortage was observed in BarangaySalvacion at 24 percent, followed by Barangay NewDagupan at 14.4 percent, and Barangay Malpalon at13.9 percent.
Unemployment rate in the province was recorded at 6.6 percentAbout 6.6 percent or 4,754 individuals of the 71,760 membersof the labor force aged 15 and above were reported to beunemployed. It appears that the unemployment rate was higheramong females at 8.3 percent than among males at 6 percent.Unemployment was most prevalent in Calintaan where 11.5percent or 889 members of the labor force were unemployedduring the reference period. This was followed by Rizal at 10percent or 924 cases, and Santa Cruz at 9.3 percent or 983cases. Meanwile, Sablayan ranked first in terms of magnitudewith 1,471 unemployed individuals in the municipality. Acrossall barangays, Barangay San Pedro in Rizal recorded the highestunemployment rate in the province at 30 percent (205 cases),followed by Barangay Balikyas in Looc at 25.8 percent (31cases).
PEACE AND ORDERAround 4 in every 10000 people were victims of crimeCBMS results show that around 0.04 percent of the population or 87 individuals in the Province of Occidental Mindorowere reported to be victims of crime. Sablayan reported the highest number of crime victims with 45 cases, followed byRizal with 19 cases. At the barangay level, Barangay Buenavista in Sablayan had the highest number of crime victimswith 10 cases, followed by Barangay Batong Buhay, also in Sablayan, with 9 cases.
CBMS COMPOSITE INDEXHouseholds in the Province of Occidental Mindoro suffered from one deprivation2 on the averageThe province of Occidental Mindoro recorded a CBMS composite index (CCI) of 1.4, which means that households in theprovince were not able to meet the 13 basic needs and suffered from one deprivations, on the average. In particular,households in Calintaan, Rizal, Lubang, and Santa Cruz were not able to meet 2 of the 13 basic needs, on the average.Further disaggregated data show that the highest incidence of deprivation was observed in Barangay Malpalon inCalintaan and Barangay Alacaak in Santa Cruz, both with 3 unmet needs, on the average.
2 The deprivations are based on the 13+1 indicators: (1) children under 5 years old who died; 2) women who died due to pregnancy-related causes; (3) malnourished children 0-5 years old; (4) households living in makeshift housing ; 5) households who are informalsettlers; (6) households without access to safe water supply; (7) households without access to sanitary toilet facilities; (8) children 6-15years old not in school; (9) households with income below the poverty threshold; (10) households with income below the food threshold;(11) households that experienced food shortage; (12) unemployment; and (13) victims of crime. A high er index would mean moredeprivation and hence, worse condition for the households.

The Many Faces of Poverty (Volume 9)
149
DIMENSIONS OF POVERTY3
Based on the CBMS data, around 41.5 percent of all households are non-poorwhile 58.5 percent of households were poor in at least one dimension. Inparticular, about 39.9 percent or 23,764 households in the province werepoor in one dimension, while 13.8 percent or 8,239 households were poor intwo dimensions. Meanwhile, 3.7 percent or 2,207 households were poor inthree dimensions.
DIMENSIONS OF POVERTY IN OCCIDENTAL MINDORO
Number ofDimensions
Proportion ofHouseholds
Total 58.5
1234567
39.913.83.70.90.10.00.0
0.2 2.5
1.63.2
9.48.2
5.145.2
6.6 0.00.0
10.0
20.0
30.0
40.0
50.0
60.0Health Poor
Nutrition Poor
Housing Poor
Tenure Poor
Water Poor
SanitationPoor
Education Poor
Income Poor
Job Poor
Security Poor
3 From the 13+1 CBMS core indicators, one indicator is selected to determine whether a household is poor in a particular dimension: 1)children aged under 5 years old who died for health, 2) malnourished children 0-5 years old for nutr ition, 3) households living inmakeshift houses for housing, 4) households who are informal settlers for tenure, 5) households without access to safe water supply forwater, 6) households without access to sanitary toilet facilities for sanitation, 7) children aged 6-15 years not in school for education, 8)households with income below the food threshold for income, 9) unemployment for job, and 10) victims of crime for security.

150
The Many Faces of Poverty (Volume 9)

The Many Faces of Poverty (Volume 9)
151
The Many Faces of Poverty inthe Province of Occidental Mindoro
INDICATOR
DEMOGRAPHYPopulationAverage household sizeChildren under 1 year oldChildren under 5 years oldChildren 0-5 years oldChildren 6-11 years oldMembers 12-15 years oldMembers 6-15 years oldMembers 10 years old and aboveMembers of the labor force
HEALTH AND NUTRITIONChildren under 5 years old who diedWomen who died due to pregnancy related-causesMalnourished children 0-5 years old
HOUSINGHouseholds living in makeshift housingHouseholds who are informal settlers
WATER AND SANITATIONHouseholds without access to safe water supplyHouseholds without access to sanitary toilet facilities
BASIC EDUCATIONChildren 6-11 years old not attending elementary schoolChildren 12-15 years old not attending high schoolChildren 6-15 years old not attending school
INCOME AND LIVELIHOODHouseholds with income below the poverty thresholdHouseholds with income below the food thresholdHouseholds who experienced hunger due to food shortageUnemployment rate (15 years old and above)
PEACE AND ORDERVictims of crime
Magnitude
53,6454
881 1,699
5,033 4,386
31,413 24,261
529
Proportion
1.63.2
9.48.2
58.645.2
1.0
Households Population
CBMS Core Indicators, Province of Occidental Mindoro, 2015-2017
ProportionMagnitude
4,174 23,675 28,848 31,122 19,411 50,533
166,319 71,760
216,186
52 3
729
3,2066,570
2,553
10.333.8
5.1
87 0.04
0.20.12.5
4,754 6.6
CBMS Composite Indicator, Province of Occidental Mindoro, 2015-2017
CBMS Composite IndicatorAverage
1.4

152
The Many Faces of Poverty (Volume 9)
CBMS Core Indicators, by Municipality, Province of Occidental Mindoro, 2015-2017
Number ofchildren
(6-11 yearsold)
Children not attendingelementary school
(6-11 years old)
Children not attending highschool
(12-15 years old)
Number ofchildren(12-15
years old)
Number ofchildren
(6-15 yearsold)
Children not attendingschool
(6-15 years old)
Municipality
ProportionProportionProportion MagnitudeMagnitudeMagnitude
Households living inmakeshift housing
Households who areinformal settlers
Households without access tosafe water supply
Households without access tosanitary toilet facilities
Municipality
ProportionProportion ProportionProportion MagnitudeMagnitudeMagnitudeMagnitude
CALINTAANLOOCLUBANGMAMBURAORIZALSABLAYANSANTA CRUZ
2375970
15918235952
4.02.71.41.32.42.00.6
15115960
339150534457
691212108
1,414568
1,153931
11.79.92.2
11.27.56.4
11.0
2.67.41.22.72.03.05.4
681158
1,952591630
1,128574
11.57.4
39.24.78.36.36.8
Municipality Totalhouseholds
Number ofchildren (0-5
years old)
Malnourishedchildren
(0-5 years old)
Children under 5years old who died
Numberof children
under 1year old
Women deathsdue to pregnancy-
related causes
Totalpopulation
ProportionProportion Proportion MagnitudeMagnitudeMagnitude
Number ofchildrenunder 5
years old
CALINTAANLOOCLUBANGMAMBURAORIZALSABLAYANSANTA CRUZ
5,9162,1494,975
12,6117,576
17,8878,447
24,0829,002
19,23951,64532,90072,19431,206
2,817647
1,4145,8603,8338,5643,357
3,369813
1,7717,0704,662
10,3914,141
74657843
127291125
2.28.04.40.62.72.83.0
1254
1110166
0.40.80.30.20.30.20.2
591107275
1123729
1363577
0000120
0000
0.10.10
CALINTAANLOOCLUBANGMAMBURAORIZALSABLAYANSANTA CRUZ
3,4511,1602,3077,0975,096
10,9464,516
32763107756551
1,170559
9.55.44.6
10.710.810.712.4
5,7791,9613,976
11,5458,324
17,4897,238
2326358
405471
1,008548
4.03.21.53.55.75.87.6
2,328801
1,6694,4483,2286,5432,722
833193259
1,4511,3642,463840
35.824.115.532.642.337.630.9
Households with income below the povertythreshold
Households with income below the foodthreshold
Households who experienced hunger duefood shortage
Municipality
Proportion Proportion ProportionMagnitudeMagnitudeMagnitude
Unemployment rate(15 years old and above)
Persons who are victimsof crimes
Number of persons in thelabor force
(15 years old and above)
Municipality CBMSCompositeIndicatorProportionProportionMagnitude Magnitude
CALINTAANLOOCLUBANGMAMBURAORIZALSABLAYANSANTA CRUZ
4,2181,1093,1695,2295,874
10,1025,930
71.351.663.741.577.556.570.2
49144
8816119676
8.30.20.10.72.11.10.9
3,670789
2,5883,4325,1297,5204,803
62.036.752.027.267.742.056.9
CALINTAANLOOCLUBANGMAMBURAORIZALSABLAYANSANTA CRUZ
7,7233,0886,491
18,7209,254
23,69210,515
8892845375559241,471983
0.10.00.00.00.10.10.0
1.91.31.71.01.81.31.7
11.59.28.33.0
10.06.29.3
18149
19459
CBMS Poverty Maps: Province of Occidental Mindoro

The Many Faces of Poverty (Volume 9)
153
CBMS Poverty Maps: Province of Occidental Mindoro
Map 1. Proportion of Children under 5 Years Old who Died,by Municipality, 2015-2017
Map 2. Proportion of Children under 5 Years Old who Died,by Barangay, 2015-2017
Barangay Magnitude ProportionMunicipality
Bottom 10 Barangays
LUBANGLOOCCALINTAANLOOCLOOCSANTA CRUZRIZALSANTA CRUZLUBANGRIZAL
Araw At Bituin (Pob.)Bonbon (Pob.)TanyagTalaotaoAgkawayanPoblacion I (Barangay 1)SalvacionSan VicenteCabraMagsikap
1262123213
3.12.41.71.41.41.21.20.90.90.7
Municipality ProportionMagnitude
LOOCCALINTAANLUBANGRIZALMAMBURAOSABLAYANSANTA CRUZ
5124
1011166
0.80.40.30.30.20.20.2

154
The Many Faces of Poverty (Volume 9)
Map 4. Proportion of Women who Died Due to Pregnancy-Related Causes,by Barangay, 2015-2017
Map 3. Proportion of Women who Died Due to Pregnancy-Related Causes,by Municipality, 2015-2017
CBMS Poverty Maps: Province of Occidental Mindoro
Barangay Magnitude ProportionMunicipality
Bottom 3 Barangays
RIZALSABLAYANSABLAYAN
PitogoPag-AsaGeneral Emilio Aguinaldo
111
2.72.62.2
Municipality ProportionMagnitude
RIZALSABLAYANLOOCCALINTAANLUBANGMAMBURAOSANTA CRUZ
1200000
0.10.100000

The Many Faces of Poverty (Volume 9)
155
CBMS Poverty Maps: Province of Occidental Mindoro
Map 5. Proportion of Children 0-5 Years Old who are Malnourished,by Municipality, 2015-2017
Map 6. Proportion of Children 0-5 Years Old who are Malnourished,by Barangay, 2015-2017
Barangay Magnitude ProportionMunicipality
Bottom 10 Barangays
SANTA CRUZLOOCRIZALLOOCLUBANGLUBANGCALINTAANSABLAYANLOOCLOOC
KurtingananAmbilMagsikapBonbon (Pob.)TilikMaginhawa (Pob.)MalpalonVictoriaGuitna (Pob.)Kanluran (Pob.)
38326611216
251233
18.316.613.010.99.88.58.27.77.57.0
Municipality ProportionMagnitude
LOOCLUBANGSANTA CRUZSABLAYANRIZALCALINTAANMAMBURAO
6578
1252911277443
8.04.43.02.82.72.20.6

156
The Many Faces of Poverty (Volume 9)
Table 1. Health and Nutrition Indicators, by Barangay, Province of Occidental Mindoro, 2015-2017
CALINTAAN ConcepcionIrironMalpalonNew DagupanPoblacionPoypoyTanyag
LOOC AgkawayanAmbilBalikyasBonbon (Pob.)BulacanBurolGuitna (Pob.)Kanluran (Pob.)Talaotao
540365306568771396423
82
250
191
19
1.50.58.20
2.50.34.5
450302253473654337348
2000406
0.4000
0.60
1.7
997142
1081247275
0000000
0000000
72151288344603437
138
9719334
10153814043171
4320
1121339
4.116.6
010.93.81.27.57.05.3
100200002
1.400
2.40000
1.4
10306
145554
28
000000000
000000000
Municipality Barangay Number ofchildren
(0-5years old)
Malnourishedchildren
(0-5 years old)
Proportion
Children under 5years oldwho died
Number ofchildrenunder 1year old
Women deaths due topregnancy-related
causes
Magnitude Magnitude Proportion Magnitude Proportion
Number ofchildrenunder 5years old
LUBANG Araw At Bituin (Pob.)Bagong Sikat (Pob.)Banaag At Pag-Asa (Pob.)BinakasCabraLikas Ng Silangan (Pob.)Maginhawa (Pob.)MaligayaMaliigNinikat Ng Pag-Asa (Pob.)Paraiso (Pob.)Surville (Pob.)TagbacTangalTilikVigo
31253048
106535453
230271617
209194175146
39313165
137647161
275352219
270251215185
200052604211
149
2111
5.1000
3.63.18.50
1.55.74.55.35.23.69.85.9
1000100010001000
3.1000
0.9000
0.4000
0.5000
5539
19128
1444676
37254035
0000000000000000
0000000000000000
MAMBURAO BalansayFatima (Tii)PayomponPoblacion 1 (Barangay 1)Poblacion 2 (Barangay 2)Poblacion 3 (Barangay 3)Poblacion 4 (Barangay 4)Poblacion 5 (Barangay 5)Poblacion 6 (Barangay 6)Poblacion 7 (Barangay 7)Poblacion 8 (Barangay 8)San Luis (Ligang)TalabaanTangkalanTayamaan
960257
1,43040
42124915990
38418690
280373
1,175
1,153310
1,74546
50233
10967
112467223113330461
1,399
211
12010001400012
1.80.30.70
0.2000
0.90.9000
0.20.1
401010000100004
0.40
0.10
0.20000
0.30000
0.3
19143
27710853
2018147937134571
217
000000000000000
000000000000000

The Many Faces of Poverty (Volume 9)
157
Table 1. Health and Nutrition Indicators, by Barangay, Province of Occidental Mindoro, 2015-2017
RIZAL AdelaAguasMagsikapMalawaanManootPitogoRizalRumbangSalvacionSan PedroSanto Niño
404366506688690261381374312332348
219669310548
10
0.55.2
13.01.30.40.40
1.31.32.42.9
342289412565576217309312252270289
02310010300
00.70.70.200
0.30
1.200
753886
103105364855626556
00000100000
00000
2.700000
Municipality Barangay Number ofchildren
(0-5years old)
Malnourishedchildren
(0-5 years old)
Proportion
Children under 5years oldwho died
Number ofchildrenunder 1year old
Women deaths due topregnancy-related
causes
Magnitude Magnitude Proportion Magnitude Proportion
Number ofchildrenunder 5
years old
SABLAYAN Batong BuhayBuenavistaBurgosClaudio SalgadoGeneral Emilio AguinaldoIbudIlvitaLagnasLigayaMalisbongPaetanPag-AsaPoblacion (Lumangbayan)San AgustinSan FranciscoSan NicolasSan VicenteSanta LuciaSanto NiñoTagumpayTubanVictoria
656972263403321201226179503183311354742211332283543499606288366122
7771,175329499379240281207639228367450891249403339667612738344422155
3455140
221600
19626
231020161114704
12
4.44.74.30
5.86.700
3.02.60.51.32.64.05.04.71.62.30.90
0.97.7
3400100001000011003020
0.50.400
0.30000
0.50000
0.30.400
0.50
0.50
13518545414538312444355937
1612240485959
103547820
0000100000010000000000
0000
2.2000000
2.60000000000
SANTA CRUZ AlacaakBarahanCasagueDayapKurtingananLumangbayanMulawinPinagturilan (San Pedro)Poblacion I (Barangay 1)Poblacion II (Barangay 2)San Vicente
320585208257176348289589169198218
378729274320208424361735196259257
11709
381021991
10
0.32.30
2.818.32.45.81.24.60.43.9
00000110202
00000
0.30.30
1.20
0.9
6497423130406089374146
00000000000
00000000000

158
The Many Faces of Poverty (Volume 9)
Map 7. Proportion of Households Living in Makeshift Housing,by Municipality, 2015-2017
Map 8. Proportion of Households Living in Makeshift Housing,by Barangay, 2015-2017
Barangay Magnitude ProportionMunicipality
Bottom 10 Barangays
CALINTAANLOOCRIZALSABLAYANCALINTAANLUBANGSABLAYANSABLAYANSABLAYANSANTA CRUZ
ConcepcionBonbon (Pob.)Santo NiñoSanta LuciaMalpalonTilikMalisbongBatong BuhayBuenavistaSan Vicente
130336361242915396915
14.312.79.16.25.75.44.44.13.53.3
Municipality ProportionMagnitude
CALINTAANLOOCRIZALSABLAYANLUBANGMAMBURAOSANTA CRUZ
23759
18235970
15952
4.02.72.42.01.41.30.6
CBMS Poverty Maps: Province of Occidental Mindoro

The Many Faces of Poverty (Volume 9)
159
Map 10. Proportion of Households who are Informal Settlers,by Barangay, 2015-2017
Map 9. Proportion of Households who are Informal Settlers,by Municipality, 2015-2017
CBMS Poverty Maps: Province of Occidental Mindoro
Barangay Magnitude ProportionMunicipalityBottom 10 Barangays
SANTA CRUZLOOCLOOCSANTA CRUZSANTA CRUZLOOCSABLAYANLOOCSABLAYANSANTA CRUZ
CasagueKanluran (Pob.)AmbilAlacaakDayapBalikyasPag-AsaBonbon (Pob.)LagnasLumangbayan
1282456808017
117293656
21.118.213.913.412.812.111.911.29.37.2
Municipality ProportionMagnitude
LOOCSANTA CRUZSABLAYANMAMBURAOCALINTAANRIZALLUBANG
15945753433915115060
7.45.43.02.72.62.01.2

160
The Many Faces of Poverty (Volume 9)
Map 11. Proportion of Households without Access to Safe Water Supply,by Municipality, 2015-2017
Map 12. Proportion of Households without Access to Safe Water Supply,by Barangay, 2015-2017
Barangay Magnitude ProportionMunicipality
Bottom 10 Barangays
LOOCLUBANGLUBANGLUBANGLUBANGLUBANGSANTA CRUZLUBANGLUBANGSABLAYAN
BulacanCabraTagbacParaiso (Pob.)MaliigAraw At Bituin (Pob.)AlacaakBagong Sikat (Pob.)Banaag At Pag-Asa (Pob.)Batong Buhay
14845263176
32657
2513639
275
100.098.783.971.056.747.942.039.133.628.6
Municipality ProportionMagnitude
LUBANGCALINTAANRIZALLOOCSANTA CRUZSABLAYANMAMBURAO
1,952681630158574
1,128591
39.211.58.37.46.86.34.7
CBMS Poverty Maps: Province of Occidental Mindoro

The Many Faces of Poverty (Volume 9)
161
Map 14. Proportion of Households without Access to Sanitary Toilet Facilities,by Barangay, 2015-2017
Map 13. Proportion of Households without Access to Sanitary Toilet Facilities,by Municipality, 2015-2017
CBMS Poverty Maps: Province of Occidental Mindoro
Barangay Magnitude ProportionMunicipalityBottom 10 Barangays
CALINTAANSANTA CRUZSANTA CRUZRIZALCALINTAANSABLAYANLOOCSANTA CRUZMAMBURAOSABLAYAN
MalpalonLumangbayanAlacaakManootPoypoyBatong BuhayTalaotaoPoblacion I (Barangay 1)TayamaanSan Agustin
1552671802981722468788
47280
37.134.330.228.826.525.624.623.923.621.2
Municipality ProportionMagnitude
CALINTAANMAMBURAOSANTA CRUZLOOCRIZALSABLAYANLUBANG
6911414931212568
1153108
11.711.211.09.97.56.42.2

162
The Many Faces of Poverty (Volume 9)
Table 2. Housing, Water and Sanitation Indicators, by Barangay,Province of Occidental Mindoro, 2015-2017
Households living inmakeshift housing
Households who areinformal settlers
Households without accessto safe water supply
Households without accessto sanitary toilet facilities
BarangayMunicipality
ProportionProportion Proportion ProportionMagnitude Magnitude Magnitude Magnitude
1307
2413439
11
14.30.95.71.33.01.41.5
249
1629594
10
2.61.23.82.84.20.61.3
425
1003
39510630
4.60.723.90.327.916.44.0
6177
1551135717256
6.710.337.111.04.0
26.57.4
338
272
222422
1143
128
19
1.92.00.71.52.52.21.20.90.81.30.91.52.41.30.9
6425648
253662
191026
1188
3.76.31.66.12.83.31.82.80.82.22.21.01.21.84.4
22752211922022
12155443149
13.013.10.50.81.02.20.60
0.80.22.67.4
10.86.97.4
35359
1272
5704
10265929309096472
20.114.93.21.56.40
1.24.7
10.16.96.3
14.818.115.423.6
02102012
1022096
294
02.20.90
0.40
0.41.01.71.61.90
1.20.85.40.9
40315140
152026665
3.40
2.60.41.10.61.60
2.61.60
6.90.80.81.11.1
5736390
45206611
32610762
631189
453
47.939.133.6
098.7
026.15.5
56.77.9
71.06.9
83.926.20.7
11.5
00111054
18000
22141428
00
0.90.40.20
2.02.03.1000
2.91.92.66.1
CALINTAAN ConcepcionIrironMalpalonNew DagupanPoblacionPoypoyTanyag
LOOC AgkawayanAmbilBalikyasBonbon (Pob.)BulacanBurolGuitna (Pob.)Kanluran (Pob.)Talaotao
LUBANG Araw At Bituin (Pob.)Bagong Sikat (Pob.)Banaag At Pag-Asa (Pob.)BinakasCabraLikas Ng Silangan (Pob.)Maginhawa (Pob.)MaligayaMaliigNinikat Ng Pag-Asa (Pob.)Paraiso (Pob.)Surville (Pob.)TagbacTangalTilikVigo
MAMBURAO BalansayFatima (Tii)PayomponPoblacion 1 (Barangay 1)Poblacion 2 (Barangay 2)Poblacion 3 (Barangay 3)Poblacion 4 (Barangay 4)Poblacion 5 (Barangay 5)Poblacion 6 (Barangay 6)Poblacion 7 (Barangay 7)Poblacion 8 (Barangay 8)San Luis (Ligang)TalabaanTangkalanTayamaan
594
3300233
1.42.22.812.7
00
1.42.30.8
26561729203
242
7.113.912.111.21.40
2.118.20.6
0406
1480000
01.00
2.3100.0
0000
6831
310004
87
1.620.50.711.9
000
3.024.6

The Many Faces of Poverty (Volume 9)
163
Table 2. Housing, Water and Sanitation Indicators, by Barangay,Province of Occidental Mindoro, 2015-2017
Households living inmakeshift housing
Households who areinformal settlers
Households without accessto safe water supply
Households without accessto sanitary toilet facilities
BarangayMunicipality
ProportionProportion Proportion ProportionMagnitude Magnitude Magnitude Magnitude
6575229
29825642
14138
0.88.67.82.9
28.84.99.90.32.92.51.2
197171614162
106
1263
2.51.12.51.61.43.10.31.71.32.39.1
149
24214
122211166
11
1.81.43.62.10.42.43.41.83.31.21.6
191234023176647496186
25.03.56.02.317.01.27.38.1
12.71.50.9
3969901301
18153
222712126
326123051
24667956
3100
797734
169238046
4487250
1043
25.63.4
18.40.75.800
20.45.00.90.617.21.4
21.20.61.53.68.81.80
17.40.9
4.13.51.70
0.20.70
0.31.24.40.52.21.73.21.81.52.66.21.70
0.80.3
8117542903620113911747311927103601310
0.86.01.00.50.42.00
9.31.33.26.1
11.92.90.81.62.22.21.02.60
2.23.1
27580733400
3511727
265267870
6330512
100
28.64.1
14.10.30.700
9.07.70.61.127.01.6
20.61.00
5.13.03.70.41.70
3624332
1130
15
180155344
44267
2118880
39
30.29.35.60.6
14.934.30.27.0
23.90
8.6
0.50.40.30.61.00.40.20.60.80
3.3
8022
12880656232510234
13.41.3
21.112.82.07.22.91.52.74.10.9
2512011730
1310
348613
42.01.20.22.7
10.116.8
02.0
23.40.20.7
RIZAL AdelaAguasMagsikapMalawaanManootPitogoRizalRumbangSalvacionSan PedroSanto Niño
SABLAYAN Batong BuhayBuenavistaBurgosClaudio SalgadoGeneral Emilio AguinaldoIbudIlvitaLagnasLigayaMalisbongPaetanPag-AsaPoblacion (Lumangbayan)San AgustinSan FranciscoSan NicolasSan VicenteSanta LuciaSanto NiñoTagumpayTubanVictoria
SANTA CRUZ AlacaakBarahanCasagueDayapKurtingananLumangbayanMulawinPinagturilan (San Pedro)Poblacion I (Barangay 1)Poblacion II (Barangay 2)San Vicente

164
The Many Faces of Poverty (Volume 9)
Map 16. Proportion of Children 6-11 Years Old Not Attending Elementary School,by Barangay, 2015-2017
Map 15. Proportion of Children 6-11 Years Old Not Attending Elementary School,by Municipality, 2015-2017
CBMS Poverty Maps: Province of Occidental Mindoro
Barangay Magnitude ProportionMunicipalityBottom 10 Barangays
SABLAYANSANTA CRUZSABLAYANSANTA CRUZSANTA CRUZRIZALRIZALCALINTAANSABLAYANSABLAYAN
Pag-AsaLumangbayanSan AgustinPinagturilan (San Pedro)CasagueRizalManootMalpalonLagnasPaetan
23510354
1694875
129503551
42.022.220.019.017.116.916.616.315.014.7
Municipality ProportionMagnitude
SANTA CRUZRIZALMAMBURAOSABLAYANCALINTAANLOOCLUBANG
559551756
1,17032763
107
12.410.810.710.79.55.44.6

The Many Faces of Poverty (Volume 9)
165
CBMS Poverty Maps: Province of Occidental Mindoro
Map 17. Proportion of Children 12-15 Years Old Not Attending High School,by Municipality, 2015-2017
Map 18. Proportion of Children 12-15 Years Old Not Attending High School,by Barangay, 2015-2017
Barangay Magnitude ProportionMunicipality
Bottom 10 Barangays
SABLAYANSABLAYANRIZALRIZALRIZALSABLAYANSANTA CRUZSABLAYANLOOCMAMBURAO
San AgustinPag-AsaRizalMalawaanManootLagnasLumangbayanBurgosBulacanTayamaan
872031472372286111710318
389
68.567.752.151.049.748.848.547.046.245.7
Municipality ProportionMagnitude
RIZALSABLAYANCALINTAANMAMBURAOSANTA CRUZLOOCLUBANG
1,3642,463833
1,451840193259
42.337.635.832.630.924.115.5

166
The Many Faces of Poverty (Volume 9)
Map 20. Proportion of Children 6-15 Years Old Not Attending School,by Barangay, 2015-2017
Map 19. Proportion of Children 6-15 Years Old Not Attending School,by Municipality, 2015-2017
CBMS Poverty Maps: Province of Occidental Mindoro
Barangay Magnitude ProportionMunicipalityBottom 10 Barangays
SABLAYANSANTA CRUZLOOCSABLAYANSANTA CRUZRIZALSABLAYANSABLAYANSABLAYANSANTA CRUZ
Pag-AsaPinagturilan (San Pedro)BulacanLagnasLumangbayanRizalBatong BuhaySan AgustinPaetanKurtinganan
27420914407980
110405230
31.914.613.211.211.211.010.310.19.49.1
Municipality ProportionMagnitude
SANTA CRUZSABLAYANRIZALCALINTAANMAMBURAOLOOCLUBANG
5481,008
4712324056358
7.65.85.74.03.53.21.5

The Many Faces of Poverty (Volume 9)
167
Table 3. Education Indicators, by Barangay, Province of Occidental Mindoro, 2015-2017
Number ofchildren (6-
11 years old)
Children notattending
elementary school(6-11 years old)
Number ofchildren (12-15 years old)
Children not attendinghigh school
(12-15 years old)
Number ofchildren (6-
15 yearsold)
Children notattending school(6-15 years old)
BarangayMunicipality
Magnitude Magnitude MagnitudeProportion Proportion Proportion
560367307553808392464
67385047455426
12.010.416.38.55.6
13.85.6
326268191409566255313
11710282
16119768
106
35.938.142.939.434.826.733.9
8866354989621374647777
47222245561921
5.33.54.44.74.12.92.7
1,095286
1,73557
53350
11487
133516225125351416
1,374
11028165
4535
129
126325152451
180
10.09.89.57.09.9
10.010.510.39.0
12.211.112.06.8
12.313.1
640190
1,18144
30118
1028068
31613875
206237852
26275
23511
10062920159250237173
389
40.939.519.925.033.233.328.425.022.129.136.230.734.530.845.7
1,735476
2,91610183468
216167201832363200557653
2,226
9914640
190393
272259
23108
5.72.92.20
2.30
1.45.41.53.26.12.51.63.54.9
15925077135671135864237
783
117
10539
4.43.23.98.1
10.48.88.64.73.8
111163439639883662
163
27459
1518274
1137
24.327.620.915.646.230.711.117.722.7
27041312023110620194
126400
22531
147218
0.76.12.50.4
13.23.52.10.82.0
CALINTAAN ConcepcionIrironMalpalonNew DagupanPoblacionPoypoyTanyag
LOOC AgkawayanAmbilBalikyasBonbon (Pob.)BulacanBurolGuitna (Pob.)Kanluran (Pob.)Talaotao
LUBANG Araw At Bituin (Pob.)Bagong Sikat (Pob.)Banaag At Pag-Asa (Pob.)BinakasCabraLikas Ng Silangan (Pob.)Maginhawa (Pob.)MaligayaMaliigNinikat Ng Pag-Asa (Pob.)Paraiso (Pob.)Surville (Pob.)TagbacTangalTilikVigo
MAMBURAO BalansayFatima (Tii)PayomponPoblacion 1 (Barangay 1)Poblacion 2 (Barangay 2)Poblacion 3 (Barangay 3)Poblacion 4 (Barangay 4)Poblacion 5 (Barangay 5)Poblacion 6 (Barangay 6)Poblacion 7 (Barangay 7)Poblacion 8 (Barangay 8)San Luis (Ligang)TalabaanTangkalanTayamaan
6635331501796710187302502117
342380240237
300348547211
13349
13
4.500
2.02.2
11.95.04.62.34.04.85.93.88.93.85.5
493327
100156358443
216381918
263250178160
942
1223371
38633
35353642
18.412.17.4
12.014.78.68.32.317.615.815.816.713.314.020.226.2
1156860
250335102185130518884035
605630418397
00010230
15100
111249
000
0.40
2.01.60
2.91.100
1.81.91.02.3

168
The Many Faces of Poverty (Volume 9)
Table 3. Education Indicators, by Barangay, Province of Occidental Mindoro, 2015-2017
Number ofchildren (6-
11 years old)
Children notattending
elementary school(6-11 years old)
Number ofchildren (12-15 years old)
Children not attendinghigh school
(12-15 years old)
Number ofchildren (6-
15 yearsold)
Children notattending school(6-15 years old)
BarangayMunicipality
Magnitude Magnitude MagnitudeProportion Proportion Proportion
462331528778779283443401334380377
46365274
129247529262733
10.010.99.89.5
16.68.5
16.97.27.87.18.8
308240319465459224282247206235243
11281
1362372289314764908888
36.433.842.651.049.741.552.125.943.737.436.2
770571847
1,2431,238507725648540615620
31293671
105278014292326
4.05.14.35.78.55.311.02.25.43.74.2
300912280307194463423890203297247
10107483016
10328
1696
2022
3.311.717.19.88.2
22.26.6
19.03.06.78.9
193540160189137241262539113177171
4716061605011760
168372357
24.429.638.131.736.548.522.931.232.713.033.3
4931,452440496331704685
1,429316474418
101262820307910
209133
20
2.08.76.44.09.1
11.21.5
14.64.10.64.8
6481,149323531416283337233865216347559902270469330734670793337375159
858132522014363593951
23537545121845765321610
13.17.09.99.84.84.9
10.715.010.84.2
14.742.04.1
20.010.96.4
11.48.58.29.54.36.3
419684219307241190220125569131204300532127267203393434492160200126
17521210312359497961
2423572
20316987
10567
146175153486832
41.831.047.040.124.525.835.948.842.526.735.367.731.868.539.333.037.240.331.130.034.025.4
1,0671,833542838657473557358
1,434347551859
1,434397736533
1,1271,1041,285497575285
110802017171213405110522745140322055235215204
10.34.43.72.02.62.52.3
11.23.62.99.4
31.93.6
10.14.33.84.92.14.03.03.51.4
RIZAL AdelaAguasMagsikapMalawaanManootPitogoRizalRumbangSalvacionSan PedroSanto Niño
SABLAYAN Batong BuhayBuenavistaBurgosClaudio SalgadoGeneral Emilio AguinaldoIbudIlvitaLagnasLigayaMalisbongPaetanPag-AsaPoblacion (Lumangbayan)San AgustinSan FranciscoSan NicolasSan VicenteSanta LuciaSanto NiñoTagumpayTubanVictoria
SANTA CRUZ AlacaakBarahanCasagueDayapKurtingananLumangbayanMulawinPinagturilan (San Pedro)Poblacion I (Barangay 1)Poblacion II (Barangay 2)San Vicente

The Many Faces of Poverty (Volume 9)
169
Map 22. Proportion of Households with Income Below the Poverty Threshold,by Barangay, 2015-2017
Map 21. Proportion of Households with Income Below the Poverty Threshold,by Municipality, 2015-2017
CBMS Poverty Maps: Province of Occidental Mindoro
Barangay Magnitude ProportionMunicipalityBottom 10 Barangays
RIZALRIZALCALINTAANSANTA CRUZRIZALRIZALRIZALLOOCCALINTAANLUBANG
ManootAguasNew DagupanDayapRumbangRizalSalvacionTalaotaoIrironMaliig
895570879532514545391288604465
86.586.185.985.384.884.181.681.681.180.9
Municipality ProportionMagnitude
RIZALCALINTAANSANTA CRUZLUBANGSABLAYANLOOCMAMBURAO
5,8744,2185,9303,169
10,1021,1095,229
77.571.370.263.756.551.641.5

170
The Many Faces of Poverty (Volume 9)
Map 23. Proportion of Households with Income Below the Food Threshold,by Municipality, 2015-2017
Map 24. Proportion of Households with Income Below the Food Threshold,by Barangay, 2015-2017
Barangay Magnitude ProportionMunicipality
Bottom 10 Barangays
CALINTAANRIZALRIZALRIZALRIZALRIZALRIZALSANTA CRUZCALINTAANLUBANG
New DagupanManootRumbangRizalAguasSalvacionMalawaanDayapIrironMaliig
817813470503490350725453541417
79.978.677.677.674.073.173.072.672.672.5
Municipality ProportionMagnitude
RIZALCALINTAANSANTA CRUZLUBANGSABLAYANLOOCMAMBURAO
5,1293,6704,8032,5887,520789
3,432
67.762.056.952.042.036.727.2
CBMS Poverty Maps: Province of Occidental Mindoro

The Many Faces of Poverty (Volume 9)
171
Map 26. Proportion of Households who Experienced Hunger Due to Food Shortage,by Barangay, 2015-2017
Map 25. Proportion of Households who Experienced Hunger Due to Food Shortage,by Municipality, 2015-2017
CBMS Poverty Maps: Province of Occidental Mindoro
Barangay Magnitude ProportionMunicipalityBottom 10 Barangays
RIZALCALINTAANCALINTAANCALINTAANCALINTAANSANTA CRUZSABLAYANCALINTAANSABLAYANCALINTAAN
SalvacionNew DagupanMalpalonPoypoyPoblacionKurtingananBuenavistaConcepcionTubanTanyag
1151475881
13622
108392427
24.014.413.912.59.67.45.54.34.03.6
Municipality ProportionMagnitude
CALINTAANRIZALSABLAYANSANTA CRUZMAMBURAOLOOCLUBANG
491161196768844
8.32.11.10.90.70.20.1

172
The Many Faces of Poverty (Volume 9)
Table 4. Income Poverty and Hunger Indicators, by Barangay,Province of Occidental Mindoro, 2015-2017
574604335879813507506
63.181.180.185.957.578.266.8
476541299817660456421
52.472.671.579.946.670.455.5
393
581471368127
4.30.4
13.914.49.6
12.53.6
845151
18627176
16713246553439
492534248307
70.655.444.070.559.245.866.066.380.941.740.231.065.474.046.466.6
754041
16619156
1409641736358
398490163236
63.043.535.362.941.733.755.348.272.528.332.727.652.967.930.551.2
2000000010001000
1.70000000
0.2000
0.1000
Households with income below thepoverty threshold
Households with income below thefood threshold
Households who experienced hungerdue to food shortage
BarangayMunicipality
Magnitude Magnitude MagnitudeProportion Proportion Proportion
806221
1,31021
35418715884
36119471
271329
1060
46.055.833.515.940.019.621.327.532.742.442.435.054.452.852.9
53015985011
25012434250
22512552
192211680
30.340.221.78.3
28.313.012.919.919.526.427.325.638.633.933.9
291150
280003321510
1.72.80.10
3.2000
1.20.40.40.51.00.20
CALINTAAN ConcepcionIrironMalpalonNew DagupanPoblacionPoypoyTanyag
LOOC AgkawayanAmbilBalikyasBonbon (Pob.)BulacanBurolGuitna (Pob.)Kanluran (Pob.)Talaotao
LUBANG Araw At Bituin (Pob.)Bagong Sikat (Pob.)Banaag At Pag-Asa (Pob.)BinakasCabraLikas Ng Silangan (Pob.)Maginhawa (Pob.)MaligayaMaliigNinikat Ng Pag-Asa (Pob.)Paraiso (Pob.)Surville (Pob.)TagbacTangalTilikVigo
MAMBURAO BalansayFatima (Tii)PayomponPoblacion 1 (Barangay 1)Poblacion 2 (Barangay 2)Poblacion 3 (Barangay 3)Poblacion 4 (Barangay 4)Poblacion 5 (Barangay 5)Poblacion 6 (Barangay 6)Poblacion 7 (Barangay 7)Poblacion 8 (Barangay 8)San Luis (Ligang)TalabaanTangkalanTayamaan
7320860
13698
1155972
288
19.951.542.652.366.256.741.854.581.6
36108379084804851
255
9.826.726.234.656.839.434.038.672.2
000000013
0000000
0.80.8

The Many Faces of Poverty (Volume 9)
173
Table 4. Income Poverty and Hunger Indicators, by Barangay,Province of Occidental Mindoro, 2015-2017
503570515796895379545514391358408
65.986.177.080.286.574.684.184.881.668.858.9
380490448725813319503470350305326
49.874.067.073.078.662.877.677.673.158.747.0
15
192
11151
11510
0.10.82.80.21.10.20.80.2
24.00.20
670771367607399220420242773161285793841305379301475594565337408189
69.739.371.169.774.248.075.362.550.747.244.980.851.780.755.774.338.860.140.861.868.358.0
558554301479329156321180521107168693573271266249310440371213328132
58.128.358.355.061.234.157.546.534.231.426.570.635.271.739.161.525.344.526.839.154.940.5
30108
400210000690102450
240
3.15.50.800
0.40.20000
0.60.60
0.10
0.20.40.40
4.00
Households with income below thepoverty threshold
Households with income below thefood threshold
Households who experienced hungerdue to food shortage
BarangayMunicipality
Magnitude Magnitude MagnitudeProportion Proportion Proportion
4601,307452532231614341
1,127262272332
77.178.374.685.378.078.942.566.671.248.473.6
3801065385453198474238922219188281
63.763.863.572.666.960.929.654.559.533.562.3
19508
22713074
3.20.30
1.37.40.90.10.20
1.20.9
RIZAL AdelaAguasMagsikapMalawaanManootPitogoRizalRumbangSalvacionSan PedroSanto Niño
SABLAYAN Batong BuhayBuenavistaBurgosClaudio SalgadoGeneral Emilio AguinaldoIbudIlvitaLagnasLigayaMalisbongPaetanPag-AsaPoblacion (Lumangbayan)San AgustinSan FranciscoSan NicolasSan VicenteSanta LuciaSanto NiñoTagumpayTubanVictoria
SANTA CRUZ AlacaakBarahanCasagueDayapKurtingananLumangbayanMulawinPinagturilan (San Pedro)Poblacion I (Barangay 1)Poblacion II (Barangay 2)San Vicente

174
The Many Faces of Poverty (Volume 9)
Map 28. Unemployment Rate (15 years old and above), by Barangay, 2015-2017
Map 27. Unemployment Rate (15 years old and above), by Municipality, 2015-2017
CBMS Poverty Maps: Province of Occidental Mindoro
Barangay Magnitude ProportionMunicipalityBottom 10 Barangays
RIZALLOOCSANTA CRUZCALINTAANSANTA CRUZSANTA CRUZCALINTAANLUBANGSANTA CRUZRIZAL
San PedroBalikyasDayapPoypoyKurtingananAlacaakIrironMaligayaSan VicenteSanto Niño
20531
195150981791865195
150
30.025.824.722.920.520.119.317.616.916.4
Municipality ProportionMagnitude
CALINTAANRIZALSANTA CRUZLOOCLUBANGSABLAYANMAMBURAO
889924983284537
1,471555
11.510.09.39.28.36.23.0
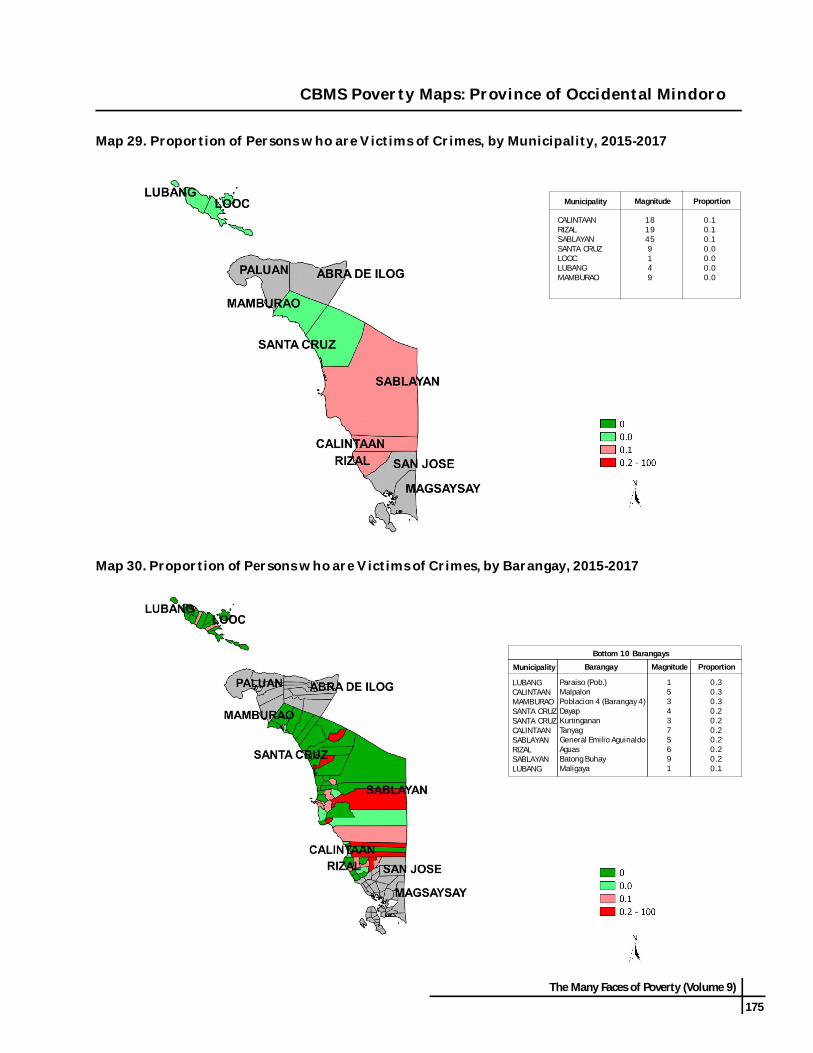
The Many Faces of Poverty (Volume 9)
175
CBMS Poverty Maps: Province of Occidental Mindoro
Map 29. Proportion of Persons who are Victims of Crimes, by Municipality, 2015-2017
Map 30. Proportion of Persons who are Victims of Crimes, by Barangay, 2015-2017
Barangay Magnitude ProportionMunicipality
Bottom 10 Barangays
LUBANGCALINTAANMAMBURAOSANTA CRUZSANTA CRUZCALINTAANSABLAYANRIZALSABLAYANLUBANG
Paraiso (Pob.)MalpalonPoblacion 4 (Barangay 4)DayapKurtingananTanyagGeneral Emilio AguinaldoAguasBatong BuhayMaligaya
1534375691
0.30.30.30.20.20.20.20.20.20.1
Municipality ProportionMagnitude
CALINTAANRIZALSABLAYANSANTA CRUZLOOCLUBANGMAMBURAO
1819459149
0.10.10.10.00.00.00.0

176
The Many Faces of Poverty (Volume 9)
Table 5. Unemployment and Victims of Crime Indicators, by Barangay,Province of Occidental Mindoro, 2015-2017
Unemployment rate(15 years old and above)
Persons who are victims of crimesNumber of persons in thelabor force
(15 years old and above)
BarangayMunicipality
ProportionProportion MagnitudeMagnitude
1,382963487
1,1672,041656
1,027
1231865882
142150148
8.919.311.97.07.0
22.914.4
1051407
00
0.30
0.10
0.2
19214116824540325136729083618211737
1,067874755566
161923147163051508
150
73698633
8.313.513.70.4
11.76.48.217.66.04.4
12.80
6.87.9
11.45.8
0000000100101001
0000000
0.100
0.30
0.000
0.1
2,706648
5,263189
1,490142465340382
1,319686344738
1,0322,976
8633
1324
853
13106
312110232771
3.25.12.52.15.72.12.82.91.62.43.12.93.12.62.4
002020301010000
00
0.00
0.10
0.30
0.10
0.10000
CALINTAAN ConcepcionIrironMalpalonNew DagupanPoblacionPoypoyTanyag
LOOC AgkawayanAmbilBalikyasBonbon (Pob.)BulacanBurolGuitna (Pob.)Kanluran (Pob.)Talaotao
LUBANG Araw At Bituin (Pob.)Bagong Sikat (Pob.)Banaag At Pag-Asa (Pob.)BinakasCabraLikas Ng Silangan (Pob.)Maginhawa (Pob.)MaligayaMaliigNinikat Ng Pag-Asa (Pob.)Paraiso (Pob.)Surville (Pob.)TagbacTangalTilikVigo
MAMBURAO BalansayFatima (Tii)PayomponPoblacion 1 (Barangay 1)Poblacion 2 (Barangay 2)Poblacion 3 (Barangay 3)Poblacion 4 (Barangay 4)Poblacion 5 (Barangay 5)Poblacion 6 (Barangay 6)Poblacion 7 (Barangay 7)Poblacion 8 (Barangay 8)San Luis (Ligang)TalabaanTangkalanTayamaan
532684120426153259186179549
426531361111192247
7.99.5
25.88.57.24.2
10.212.38.6
100000000
0.100000000

The Many Faces of Poverty (Volume 9)
177
Table 5. Unemployment and Victims of Crime Indicators, by Barangay,Province of Occidental Mindoro, 2015-2017
Unemployment rate(15 years old and above)
Persons who are victims of crimesNumber of persons in thelabor force
(15 years old and above)
BarangayMunicipality
ProportionProportion MagnitudeMagnitude
1,056561
1,0391,357953531824692641683917
3520
160638129
1122940
205150
3.33.6
15.44.68.55.5
13.64.26.2
30.016.4
06404100301
00.20.10
0.10.000
0.10
0.0
1,3282,836679877857714542566
1,508473695
1,0542,189455937582
1,8671,3862,059643898547
42286632979466
36344122
12417523669
8078147283324
3.210.19.33.39.26.41.16.42.38.73.2
11.88.05.17.01.54.35.67.14.43.74.4
91030500110006010420030
0.20.10.10
0.200
0.10.0000
0.10
0.00
0.10.000
0.10
8891,850669789479
1,0421,1121,810531782562
179148
41959835
10032544395
20.18.00.6
24.720.53.49.01.8
10.25.5
16.9
00043020000
000
0.20.20
0.10000
RIZAL AdelaAguasMagsikapMalawaanManootPitogoRizalRumbangSalvacionSan PedroSanto Niño
SABLAYAN Batong BuhayBuenavistaBurgosClaudio SalgadoGeneral Emilio AguinaldoIbudIlvitaLagnasLigayaMalisbongPaetanPag-AsaPoblacion (Lumangbayan)San AgustinSan FranciscoSan NicolasSan VicenteSanta LuciaSanto NiñoTagumpayTubanVictoria
SANTA CRUZ AlacaakBarahanCasagueDayapKurtingananLumangbayanMulawinPinagturilan (San Pedro)Poblacion I (Barangay 1)Poblacion II (Barangay 2)San Vicente

178
The Many Faces of Poverty (Volume 9)
Map 31. CBMS Composite Indicator, by Municipality, 2015-2017
Map 32. CBMS Composite Indicator, by Barangay, 2015-2017
AverageMunicipality
CALINTAANRIZALLUBANGSANTA CRUZLOOCSABLAYANMAMBURAO
1.91.81.71.71.31.31.0
Barangay AverageMunicipality
Bottom 10 Barangays
CALINTAANSANTA CRUZSABLAYANLOOCRIZALCALINTAANLUBANGSANTA CRUZLUBANGSABLAYAN
MalpalonAlacaakPag-AsaBulacanManootPoypoyMaliigKurtingananTagbacSan Agustin
2.62.62.42.42.32.32.32.22.22.2
CBMS Poverty Maps: Province of Occidental Mindoro

The Many Faces of Poverty (Volume 9)
179
Table 6. CBMS Composite Indicator, by Barangay, Province of Occidental Mindoro, 2015-2017
BarangayMunicipality Barangay CBMS CompositeIndicator
Municipality
1.61.92.62.11.72.31.6
1.51.92.01.82.31.62.11.82.11.71.4
2.11.11.81.31.61.01.41.61.11.00.92.41.12.21.11.50.91.30.91.11.61.1
2.61.71.72.02.22.10.91.42.01.01.8
0.51.41.11.42.41.01.01.32.0
1.31.50.70.41.00.40.40.60.7
CBMS CompositeIndicator
CALINTAAN ConcepcionIrironMalpalonNew DagupanPoblacionPoypoyTanyag
LOOC AgkawayanAmbilBalikyasBonbon (Pob.)BulacanBurolGuitna (Pob.)Kanluran (Pob.)Talaotao
LUBANG Araw At Bituin (Pob.)Bagong Sikat (Pob.)Banaag At Pag-Asa (Pob.)BinakasCabraLikas Ng Silangan (Pob.)Maginhawa (Pob.)MaligayaMaliigNinikat Ng Pag-Asa (Pob.)Paraiso (Pob.)Surville (Pob.)TagbacTangalTilikVigo
MAMBURAO BalansayFatima (Tii)PayomponPoblacion 1 (Barangay 1)Poblacion 2 (Barangay 2)Poblacion 3 (Barangay 3)Poblacion 4 (Barangay 4)Poblacion 5 (Barangay 5)Poblacion 6 (Barangay 6)
2.01.61.31.32.10.91.71.52.30.91.60.82.21.81.11.5
RIZAL AdelaAguasMagsikapMalawaanManootPitogoRizalRumbangSalvacionSan PedroSanto Niño
SABLAYAN Batong BuhayBuenavistaBurgosClaudio SalgadoGeneral Emilio AguinaldoIbudIlvitaLagnasLigayaMalisbongPaetanPag-AsaPoblacion (Lumangbayan)San AgustinSan FranciscoSan NicolasSan VicenteSanta LuciaSanto NiñoTagumpayTubanVictoria
SANTA CRUZ AlacaakBarahanCasagueDayapKurtingananLumangbayanMulawinPinagturilan (San Pedro)Poblacion I (Barangay 1)Poblacion II (Barangay 2)San Vicente
Poblacion 7 (Barangay 7)Poblacion 8 (Barangay 8)San Luis (Ligang)TalabaanTangkalanTayamaan
0.90.90.91.31.21.3
MAMBURAO

180
The Many Faces of Poverty (Volume 9)

The Many Faces of Poverty (Volume 9)
181
Republic of the PhilippinesProvince of ROMBLON
Message
EDUARDO FIRMALO Governor
Several years has passed since the Province of Romblon has adoptedCommunity-Based Monitoring System (CBMS) in 2007 which led to the productionof a Provincial MDG Status Report for Romblon. The users of the CBMS database,particularly the planners and program implementers have been clamoring for itsupdating. In line with this, the Provincial Government led the coordination with thecomponent Local Government Units (LGUs), the different line agencies including theDepartment of Interior and Local Government (DILG), and the CBMS Network toconduct the province-wide updating of the CBMS database in 2015 to 2017.
While there have been funding and operational challenges in theimplementation of the CBMS Accelerated Poverty Profiling (CBMS-APP)- using tabletsfor data collection- in the province, the Provincial Government fully supported thecontinued implementation of the program as we understand the need for grassroot-level database which is crucial for planning and project prioritization.
With the updated CBMS database of the Province, we will now be able toidentify who and where are the most vulnerable sectors of the community that needthe necessary strategic intervention. This will help us very much in theimplementation of programs, projects and activities that will support theInfrastructure, Health and Housing, Education and Employment, Agriculture and FoodSecurity, Revenue Generation and Livelihood, and True Public Service and TourismDevelopment (I-HEART) platform of governance of this administration.
Mabuhay, CBMS Network, for their laudable endeavor!
MAYORS OF ROMBLON
HON. EDDIE LOTA(Municipality of Alcantara)
HON. JOSEPH FADRI(Municipality of Banton)
HON. NICASIO RAMOS(Municipality of Cajidiocan)
HON. MARIETA BABERA(Municipality of Calatrava)

MAYORS OF ROMBLON
HON. MEDRITO FABREAG, JR.(Municipality of Concepcion)
HON. RACHEL BAÑARES(Municipality of Corcuera)
HON. JOVENCIO MAYOR, JR.(Municipality of Ferrol)
HON. LEILA ARBOLEDA(Municipality of Looc)

MAYORS OF ROMBLON
HON. DENISA REPIZO(Municipality of Magdiwang)
HON. MARIANO MATEO(Municipality of Romblon)
HON. ESTEBAN MADRONA, JR.(Municipality of San Agustin)
HON. SALEM TANSINGCO(Municipality of San Fernando)

MAYORS OF ROMBLON
HON. RONNIE SAMSON(Municipality of San Jose)
HON. ELSIE VISCA(Municipality of Santa Fe)
HON. ARTEMIO MADRID(Municipality of Santa Maria)

186
The Many Faces of Poverty (Volume 9)
The Many Faces of Poverty in theProvince of Romblon
Romblon had a total population of 206,644 covering 49,368 householdsThe CBMS census conducted from 2015 to 2016 covered 15 municipalities in the province, namely, Alcantara, Banton,Cajidiocan, Calatrava, Concepcion, Corcuera, Ferrol, Looc, Magdiwang, Romblon, San Agustin, San Fernando, San Jose,Santa Fe, and Santa Maria, with 181 barangays. Of the 206,644 locals, 50.4 percent are male, while 49.6 percent arefemale. The Municipality of Romblon has the largest population with 33,049 members (or 16%) in 7,783 households,followed by San Fernando with 20,498 members (or 9.9%) in 4,656 households.
HEALTH AND NUTRITIONThree in every 1000 children under five years old diedAbout 0.3 percent of children under five years old died duringthe reference period. This is equivalent to 71 child deaths inthe province. The proportion of child deaths among boys washigher than girls, at 0.4 percent and 0.2 percent, respectively.The highest proportion of child deaths was reported in theMunicipality of Corcuera at 0.8 percent (6 cases), followed bySan Jose at 0.7 percent (8 cases). Looc, on the other hand,ranked first in terms of magnitude with 11 cases of child deaths.Among all the barangays, Barangay Panangcalan in SanFernando registered the highest proportion of child deaths at4.9 percent. This was followed by Barangay Alegria in Corcueraat 2.5 percent, and Barangay Limon Norte in Looc at 2.4percent.
POPULATION
The 2015-2016 CBMS Census covers 15 municipalities in the Province of Romblon, namely, Alcantara, Banton, Cajidiocan,Calatrava, Concepcion, Corcuera, Ferrol, Looc, Magdiwang, Romblon, San Agustin, San Fernando, San Jose, Santa Fe, and SantaMaria.

The Many Faces of Poverty (Volume 9)
187
Two in every 1000 pregnant women died due to pregnancy-related causesAccording to the results of the CBMS census, 0.2 percent of pregnant women aged 15-49 in the Province of Romblondied due to pregnancy-related causes during the reference period. The highest proportion of of maternal deaths wasobserved in Concepcion at 3 percent. Barangay Calabasahan in Concepcion had the highest proportion of maternaldeaths at 16.7 percent. Meanwhile, Barangay Agmanic in Santa Fe ranked first in terms of magnitude with 3 cases.
Around 3 in every 100 children zero to five years old weremalnourishedAround 2.7 percent or 715 children zero to five years old wereclassified as moderately or severely underweight in the Provinceof Romblon. In particular, 345 boys and 370 girls zero to fiveyears old were considered malnourished. Malnutritionprevalence among girls was higher than boys, at 2.9 percentand 2.5 percent, respectively. The highest prevalence ofmalnutrition was observed in Corcuera at 5.1 percent, followedby Alcantara at 4.5 percent. Barangay Cagbuaya in San Agustinreported the highest proportion of malnourished children at20.8 percent (33 cases), followed by Barangay Bagsik inAlcantara at 19.3 percent (28 cases), and BarangayPagsangahan in Calatrava at 12.6 percent (22 cases).
HOUSINGAbout 1.9 percent of households were living in makeshift housing while 4.1 percent were informal settlersThe 2015-2016 CBMS data showed that 2 in every 100 households in the province were living in makeshift housing.The Municipality of Alcantara had the highest proportion of households living in makeshift housing at 3.2 percent (121households). Second was the Municipality of Romblon at 2.9 percent (225 households), while third was the Municipalityof San Fernando at 2.6 percent (121 households). At the barangay level, Barangay Tugdan in Alcantara had the highestproportion of households living in makeshift housing at 17.3 percent, which accounts for 91 households. This wasfollowed by Barangay Canjalon in San Fernando at 13 percent, which accounts for 50 households.
In terms of tenure status, 2,009 households or 4 in every 100 households in the province were considered informalsettlers. The highest proportion of informal settlers was observed in the Municipality of Magdiwang at 10.1 percent (272cases). This was followed by the Municipality of San Fernando at 8.8 percent (408 cases). In terms of magnitude, Sanfernando ranked first with 408 cases. At the barangay level, the highest proportion of informal settlers was observed inBarangay Otod in San Fernando at 70.8 percent (313 households), while the second highest was Barangay Silum inMagdiwang at 42.6 percent (60 households).

188
The Many Faces of Poverty (Volume 9)
WATER AND SANITATIONAbout 22.1 percent of the households do not have access to safe water supply and about 13.6 percent do not haveaccess to sanitary toilet facilitiesBased on the results of the CBMS census, 22 in every 100 households in the Province of Romblon had no access to safewater supply. The Municipality of Banton had the worst condition in terms of water accessibility as 78.8 percent of itshouseholds were reported to have no access to safe water supply during the reference period. This was followed by theMunicipality of Concepcion at 41 percent, and the Municipality of Romblon at 37.5 percent. In terms of magnitude, theMunicipality of Romblon ranked first with 2,917 cases. Four barangays, namely, Yabawon, Sampong, Tan-ag, andTumalum, had no access to safe water supply at all. Of the 200 barangays, 35 can be considered “waterless”1.
On the other hand, 13.6 percent of the households do not have access to sanitary toilet facilities. This means thataround 14 in every 100 households in the province lacked access to sanitary toilet facilities. The Municipality of SanJose reported the highest proportion of sanitation poor households at 20.6 percent or 436 households, followed by SanAgustin at 17.6 percent or 867 households. Meanwhile, at the barangay level, the highest proportion of sanitation poorhouseholds was observed in Barangay Alibagon at 58.1 percent (79 cases), followed by Barangay Combot at 46.6percent (97 cases).
1 “Waterless” barangays refer to barangays with less than 50 percent safe water supply coverage, as defined by the SALINTUBIG Programof the Department of Health (DOH).
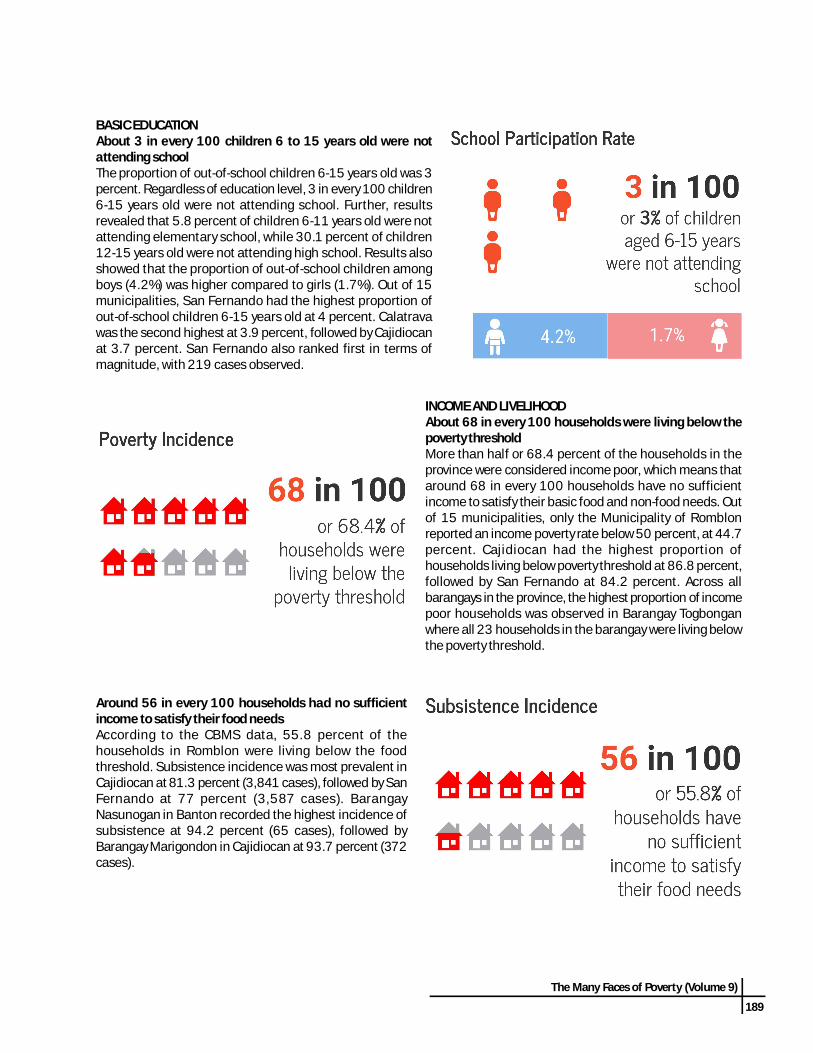
The Many Faces of Poverty (Volume 9)
189
BASIC EDUCATIONAbout 3 in every 100 children 6 to 15 years old were notattending schoolThe proportion of out-of-school children 6-15 years old was 3percent. Regardless of education level, 3 in every 100 children6-15 years old were not attending school. Further, resultsrevealed that 5.8 percent of children 6-11 years old were notattending elementary school, while 30.1 percent of children12-15 years old were not attending high school. Results alsoshowed that the proportion of out-of-school children amongboys (4.2%) was higher compared to girls (1.7%). Out of 15municipalities, San Fernando had the highest proportion ofout-of-school children 6-15 years old at 4 percent. Calatravawas the second highest at 3.9 percent, followed by Cajidiocanat 3.7 percent. San Fernando also ranked first in terms ofmagnitude, with 219 cases observed.
INCOME AND LIVELIHOODAbout 68 in every 100 households were living below thepoverty thresholdMore than half or 68.4 percent of the households in theprovince were considered income poor, which means thataround 68 in every 100 households have no sufficientincome to satisfy their basic food and non-food needs. Outof 15 municipalities, only the Municipality of Romblonreported an income poverty rate below 50 percent, at 44.7percent. Cajidiocan had the highest proportion ofhouseholds living below poverty threshold at 86.8 percent,followed by San Fernando at 84.2 percent. Across allbarangays in the province, the highest proportion of incomepoor households was observed in Barangay Togbonganwhere all 23 households in the barangay were living belowthe poverty threshold.
Around 56 in every 100 households had no sufficientincome to satisfy their food needsAccording to the CBMS data, 55.8 percent of thehouseholds in Romblon were living below the foodthreshold. Subsistence incidence was most prevalent inCajidiocan at 81.3 percent (3,841 cases), followed by SanFernando at 77 percent (3,587 cases). BarangayNasunogan in Banton recorded the highest incidence ofsubsistence at 94.2 percent (65 cases), followed byBarangay Marigondon in Cajidiocan at 93.7 percent (372cases).

190
The Many Faces of Poverty (Volume 9)
Two in every 100 households experienced hunger due tofood shortageAround 1.8 percent of the households in the provincesuffered from hunger during the three-month periodbefore the census. Hunger due to food shortage was mostprevalent in the Municipality of Magdiwang at 7.8 percentor 210 cases. Next to Magdiwang was Cajidiocan at 6percent or 284 cases. Across all the barangays, thehighest proportion of households that experienced hungerdue to food shortage was observed in Barangay Jao-asanat 48.3 percent, followed by Barangay Silum at 25.5percent, and Barangay Cambijang at 25.2 percent.
Unemployment rate in the province was recorded at 6.5 percentAbout 6.5 percent or 4,263 individuals of the 65,609members of the labor force aged 15 and above were reportedto be unemployed. It appears that the unemployment ratewas higher among females at 7 percent than among males at6.3 percent. Unemployment was most prevalent in theMunicipality of San Fernando at 11.1 percent (601 cases).This was followed by the Municipality of Alcantara at 10.7percent (512 cases), and the Municipality of San Jose at 7.4percent (245 cases). Across all barangays, Barangay Madalagand Barangay Lawan in Alcantara recorded the two highestunemployment rates in the province, at 30 percent and 29.7percent, respectively.
PEACE AND ORDERAround 4 in every 10000 people were victims of crimeAround 0.04 percent of the population or 91 individuals in the Province of Romblon were reported to be victims of crime.Corcuera and Magdiwang reported the highest number of crime victims with 11 cases each, followed by San Agustin andSan Jose with 10 cases each. At the barangay level, Barangay Masudsud in Concepcion recorded the highest proportionof crime victims at 1 percent (3 cases). This was followed by Barangay Busay and Barangay Calabasahan, both at 0.5percent.
CBMS COMPOSITE INDEXHouseholds in the Province of Romblon suffered from two deprivations2 on the averageThe Province of Romblon recorded a CBMS composite index (CCI) of 1.8, which means that households in the provincewere not able to meet the 13 basic needs and suffered from 2 deprivations, on the average. In particular, householdsin Banton were not able to meet 3 of the 13 basic needs, on the average. Further disaggregated data show thatBarangay Alibagon in Cajidiocan had the highest incidence of deprivation, with 4 unmet needs, on the average.
2 The deprivations are based on the 13+1 indicators: (1) children under 5 years old who died; 2) women who died due to pregnancy-related causes; (3) malnourished children 0-5 years old; (4) households living in makeshift housing ; 5) households who are informalsettlers; (6) households without access to safe water supply; (7) households without access to sanitary toilet facilities; (8) children 6-15years old not in school; (9) households with income below the poverty threshold; (10) households with income below the food threshold;(11) households that experienced food shortage; (12) unemployment; and (13) victims of crime. A high er index would mean moredeprivation and hence, worse condition for the households.

The Many Faces of Poverty (Volume 9)
191
DIMENSIONS OF POVERTY3
Based on the CBMS data, around 29.3 percent of all households are non-poorwhile 70.7 percent of households were poor in at least one dimension. Inparticular, about 41.5 percent or 20,472 households in the province werepoor in one dimension, while 21.5 percent or 10,608 households were poor intwo dimensions. Meanwhile, 6.5 percent or 3,202 households were poor inthree dimensions.
DIMENSIONS OF POVERTY IN ROMBLON
Number ofDimensions
Proportion ofHouseholds
Total 70.7
1234567
41.521.56.51.20.10.00.0
0.3 2.7
1.94.1
22.113.6
3.0
55.8
6.5 0.00.0
10.0
20.0
30.0
40.0
50.0
60.0Health Poor
Nutrition Poor
Housing Poor
Tenure Poor
Water Poor
SanitationPoor
Education Poor
Income Poor
Job Poor
Security Poor
3 From the 13+1 CBMS core indicators, one indicator is selected to determine whether a household is poor in a particular dimension: 1)children aged under 5 years old who died for health, 2) malnourished children 0-5 years old for nutr ition, 3) households living inmakeshift houses for housing, 4) households who are informal settlers for tenure, 5) households without access to safe water supply forwater, 6) households without access to sanitary toilet facilities for sanitation, 7) children aged 6-15 years not in school for education, 8)households with income below the food threshold for income, 9) unemployment for job, and 10) victims of crime for security.

192
The Many Faces of Poverty (Volume 9)
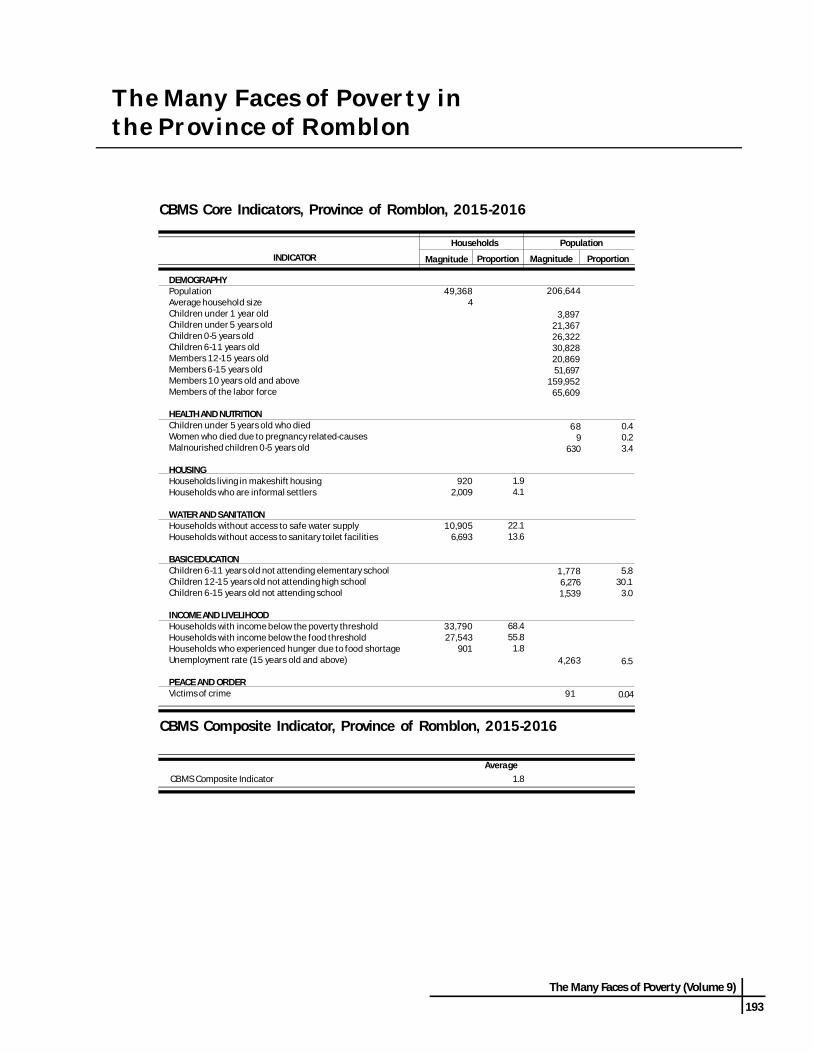
The Many Faces of Poverty (Volume 9)
193
The Many Faces of Poverty inthe Province of Romblon
INDICATOR
DEMOGRAPHYPopulationAverage household sizeChildren under 1 year oldChildren under 5 years oldChildren 0-5 years oldChildren 6-11 years oldMembers 12-15 years oldMembers 6-15 years oldMembers 10 years old and aboveMembers of the labor force
HEALTH AND NUTRITIONChildren under 5 years old who diedWomen who died due to pregnancy related-causesMalnourished children 0-5 years old
HOUSINGHouseholds living in makeshift housingHouseholds who are informal settlers
WATER AND SANITATIONHouseholds without access to safe water supplyHouseholds without access to sanitary toilet facilities
BASIC EDUCATIONChildren 6-11 years old not attending elementary schoolChildren 12-15 years old not attending high schoolChildren 6-15 years old not attending school
INCOME AND LIVELIHOODHouseholds with income below the poverty thresholdHouseholds with income below the food thresholdHouseholds who experienced hunger due to food shortageUnemployment rate (15 years old and above)
PEACE AND ORDERVictims of crime
Magnitude
49,3684
9202,009
10,9056,693
33,79027,543
901
Proportion
1.94.1
22.113.6
68.455.8
1.8
Households Population
CBMS Core Indicators, Province of Romblon, 2015-2016
ProportionMagnitude
3,89721,36726,32230,82820,86951,697
159,95265,609
206,644
689
630
1,7786,2761,539
5.830.1
3.0
91 0.04
0.40.23.4
4,263 6.5
CBMS Composite Indicator, Province of Romblon, 2015-2016
CBMS Composite IndicatorAverage
1.8

194
The Many Faces of Poverty (Volume 9)
CBMS Core Indicators, by Municipality, Province of Romblon, 2015-2016
Number ofchildren
(6-11 yearsold)
Children not attendingelementary school
(6-11 years old)
Children not attending highschool
(12-15 years old)
Number ofchildren(12-15
years old)
Number ofchildren
(6-15 yearsold)
Children not attendingschool
(6-15 years old)
Municipality
ProportionProportionProportion MagnitudeMagnitudeMagnitude
Households living inmakeshift housing
Households who areinformal settlers
Households without access tosafe water supply
Households without access tosanitary toilet facilities
Municipality
ProportionProportion ProportionProportion MagnitudeMagnitudeMagnitudeMagnitude
ALCANTARABANTONCAJIDIOCANCALATRAVACONCEPCIONCORCUERAFERROLLOOCMAGDIWANGROMBLONSAN AGUSTINSAN FERNANDOSAN JOSESANTA FESANTA MARIA
1214
37221339217938
22583
121535212
3.20.30.81.11.31.61.31.51.42.91.72.62.51.50.8
9623
30380434548
134272274166408168120
3786471530814
236155623325
1,178867782436426186
9.94.7
15.115.11.49.49.5
12.112.115.117.616.820.612.511.9
2.51.76.43.94.21.83.02.6
10.13.53.48.80.82.41.3
5911,0661,399377419232123496663
2,917876812389415130
15.578.829.618.441.09.37.69.6
24.637.517.717.418.412.28.3
Municipality Totalhouseholds
Number ofchildren (0-5
years old)
Malnourishedchildren
(0-5 years old)
Children under 5years old who died
Numberof children
under 1year old
Women deathsdue to pregnancy-
related causes
Totalpopulation
ProportionProportion Proportion MagnitudeMagnitudeMagnitude
Number ofchildrenunder 5
years old
ALCANTARABANTONCAJIDIOCANCALATRAVACONCEPCIONCORCUERAFERROLLOOCMAGDIWANGROMBLONSAN AGUSTINSAN FERNANDOSAN JOSESANTA FESANTA MARIA
3,8011,3534,7222,0441,0222,5041,6245,1502,6917,7834,9394,6562,1163,4001,563
14,7204,555
20,2308,8973,4199,6507,093
20,38312,60933,04919,76120,49810,22714,7536,800
1,394393
2,0441,081250748729
2,0631,4303,3302,1122,3271,1411,715610
1,726492
2,5691,314330928878
2,5381,7474,1012,6022,8571,3952,082763
781074351447154833
1129547465110
4.52.02.92.74.25.11.71.91.92.73.71.63.32.41.3
2133161
119758842
0.10.30.10.30.40.80.10.50.60.20.20.30.70.20.3
26762
36717532
12013939628160040643717034798
000010003101030
0000
3.0000
1.10.20
0.20
0.90
ALCANTARABANTONCAJIDIOCANCALATRAVACONCEPCIONCORCUERAFERROLLOOCMAGDIWANGROMBLONSAN AGUSTINSAN FERNANDOSAN JOSESANTA FESANTA MARIA
2,139626
3,2701,449506
1,368927
3,0231,8064,4893,0303,2351,6232,368969
13020
21011412
1124517710722713518314310855
6.13.26.47.92.48.24.95.95.95.14.55.78.84.65.7
3,5011,0665,5512,395860
2,3431,5805,0923,0747,3785,1455,4502,6713,9681,623
8720
2049497131
16099
19012121964
13040
2.51.93.73.91.03.02.03.13.22.62.44.02.43.32.5
1,362440
2,281946354975653
2,0691,2682,8892,1152,2151,0481,600654
36373
83032445
306158558398867567844354410179
26.716.636.434.212.731.424.227.031.430.026.838.133.825.627.4
CBMS Poverty Maps: Province of Romblon

The Many Faces of Poverty (Volume 9)
195
Households with income below the povertythreshold
Households with income below the foodthreshold
Households who experienced hunger duefood shortage
Municipality
Proportion Proportion ProportionMagnitudeMagnitudeMagnitude
Unemployment rate(15 years old and above)
Persons who are victimsof crimes
Number of persons in thelabor force
(15 years old and above)
Municipality CBMSCompositeIndicatorProportionProportionMagnitude Magnitude
ALCANTARABANTONCAJIDIOCANCALATRAVACONCEPCIONCORCUERAFERROLLOOCMAGDIWANGROMBLONSAN AGUSTINSAN FERNANDOSAN JOSESANTA FESANTA MARIA
2,3881,1234,1001,483617
1,7021,2313,0992,0963,4813,9483,9211,3422,0611,198
62.883.086.872.660.468.075.860.277.944.779.984.263.460.676.6
144
2848673
122102474
163116615
0.40.36.00.40.60.30.20.27.80.31.53.50.51.91.0
1,872995
3,8411,170463
1,2761,0052,3821,7292,3933,4423,5871,0211,3451,022
49.373.581.357.245.351.061.946.364.330.769.777.048.339.665.4
ALCANTARABANTONCAJIDIOCANCALATRAVACONCEPCIONCORCUERAFERROLLOOCMAGDIWANGROMBLONSAN AGUSTINSAN FERNANDOSAN JOSESANTA FESANTA MARIA
4,7731,5245,8972,3191,3483,8532,6085,9444,589
11,9815,5205,4223,2894,3252,217
5128841510179
148144412303583272601245213147
0.00
0.00.00.20.10.00.00.10.00.10.00.10.00.0
1.62.52.41.81.61.51.71.42.11.52.02.31.71.41.8
10.75.87.04.45.93.85.56.96.64.94.9
11.17.44.96.6
CBMS Core Indicators, by Municipality, Province of Romblon, 2015-2016
CBMS Poverty Maps: Province of Romblon
20817
1117
118
109
1051

196
The Many Faces of Poverty (Volume 9)
CBMS Poverty Maps: Province of Romblon
Map 1. Proportion of Children under 5 Years Old who Died,by Municipality, 2015-2016
Map 2. Proportion of Children under 5 Years Old who Died,by Barangay, 2015-2016
Barangay Magnitude ProportionMunicipality
Bottom 10 Barangays
SAN FERNANDOCORCUERALOOCALCANTARACORCUERACONCEPCIONLOOCSANTA MARIASAN JOSECORCUERA
PanangcalanAlegriaLimon NorteSan IsidroMahabaPoblacionTuguisConcepcion SurBusayIlijan
6352112231
4.92.52.42.12.01.91.81.81.71.7
Magnitude ProportionMunicipality
CORCUERASAN JOSEMAGDIWANGLOOCCONCEPCIONBANTONCALATRAVASAN FERNANDOSANTA MARIAROMBLONSAN AGUSTINSANTA FEALCANTARACAJIDIOCANFERROL
689
1111382754231
0.80.70.60.50.40.30.30.30.30.20.20.20.10.10.1

The Many Faces of Poverty (Volume 9)
197
Map 4. Proportion of Women who Died Due to Pregnancy-Related Causes,by Barangay, 2015-2016
Map 3. Proportion of Women who Died Due to Pregnancy-Related Causes,by Municipality, 2015-2016
CBMS Poverty Maps: Province of Romblon
Barangay Magnitude ProportionMunicipalityBottom 7 Barangays
CONCEPCIONSANTA FEROMBLONMAGDIWANGMAGDIWANGSAN FERNANDOMAGDIWANG
CalabasahanAgmanicCalabogoAmbulongPoblacionMabuloDulangan
1311111
16.77.75.95.03.13.12.2
Magnitude ProportionMunicipality
CONCEPCIONMAGDIWANGSANTA FESAN FERNANDOROMBLONCORCUERASAN JOSELOOCBANTONCALATRAVASANTA MARIASAN AGUSTINALCANTARACAJIDIOCANFERROL
133110000000000
3.01.10.90.20.20000000000

198
The Many Faces of Poverty (Volume 9)
Map 5. Proportion of Children 0-5 Years Old who are Malnourished,by Municipality, 2015-2016
Map 6. Proportion of Children 0-5 Years Old who are Malnourished,by Barangay, 2015-2016
Barangay Magnitude ProportionMunicipality
Bottom 10 Barangays
SAN AGUSTINALCANTARACALATRAVASAN FERNANDOROMBLONCORCUERACORCUERACONCEPCIONCAJIDIOCANCORCUERA
CagbuayaBagsikPagsangahanEspañaBagacaySan AgustinLabnigCalabasahanLicoAlegria
33281125275567
13
20.819.312.611.310.010.09.89.08.98.6
Magnitude ProportionMunicipality
CORCUERAALCANTARACONCEPCIONSAN AGUSTINSAN JOSECAJIDIOCANROMBLONCALATRAVASANTA FEBANTONMAGDIWANGLOOCFERROLSAN FERNANDOSANTA MARIA
477814954674
1123551103348154710
5.14.54.23.73.32.92.72.72.42.01.91.91.71.61.3
CBMS Poverty Maps: Province of Romblon

The Many Faces of Poverty (Volume 9)
199
Table 1. Health and Nutrition Indicators, by Barangay, Province of Romblon, 2015-2016
ALCANTARA BagsikBonlaoCalagonsaoCamiliCamod-OmGui-obLawanMadalagPoblacionSan IsidroSan RoqueTugdan
BANTON BalogoBaniceHambi-anLagangLibtongMainitNabalayNasunoganPoblacionSibayTan-AgToctocTogbonganTogongTumalumTungonanYabawon
14516611917513616792
132149119108218
2892448532247
19.35.41.72.32.94.85.42.31.31.73.73.2
11013099
13412013868
1101239590177
000000000200
000000000
2.100
262111302128131729191933
000000000000
000000000000
2829136
14245
19712331114
22343128
3636177
16317
22913035175
27404332
21000001120002001
5.62.800000
4.51.16.7000
7.400
3.1
00000000100000000
00000000
1.400000000
47312402
1415221446
00000000000000000
00000000000000000
Municipality Barangay Number ofchildren
(0-5years old)
Malnourishedchildren
(0-5 years old)
Proportion
Children under 5years oldwho died
Number ofchildrenunder 1year old
Women deaths due topregnancy-related
causes
Magnitude Magnitude Proportion Magnitude Proportion
Number ofchildrenunder 5years old
CAJIDIOCAN AlibagonCambajaoCambaloCambijangCantagdaDanaoGutivanLicoLumbang EsteLumbang WesteMarigondonPoblacionSugodTaguilos
6924517715190250115686820716599192148
843072391971153131457989
254206132237172
263401371
13134
116
2.42.01.32.00
0.32.18.91.15.16.33.04.63.5
01001000000010
00.400
1.10000000
0.50
1352312816351814112931154727
00000000000000
00000000000000
CALATRAVA BalogoLinaoPagsangahanPanguloPoblacionSan RoqueTalisay
19517470
201140125176
23321287
235172163212
213115202
0.96.1
12.62.11.20
0.9
1002000
0.500
1.0000
27319
35152830
0000000
0000000
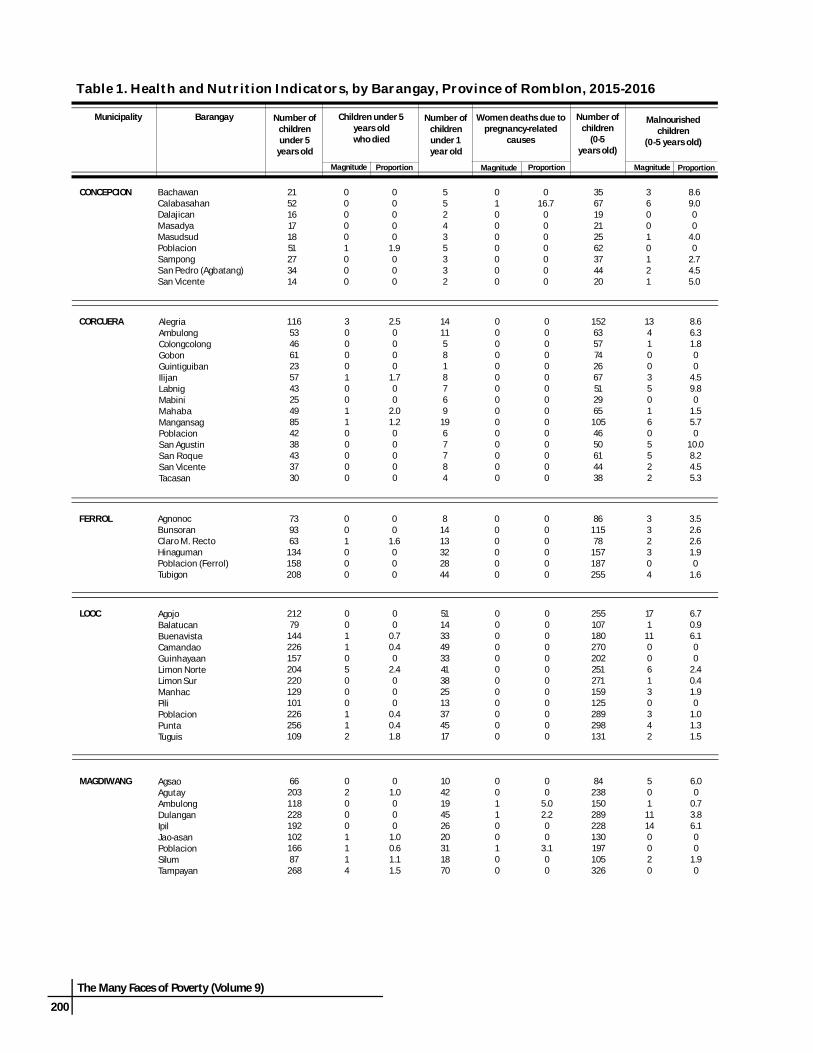
200
The Many Faces of Poverty (Volume 9)
Table 1. Health and Nutrition Indicators, by Barangay, Province of Romblon, 2015-2016
CONCEPCION BachawanCalabasahanDalajicanMasadyaMasudsudPoblacionSampongSan Pedro (Agbatang)San Vicente
356719212562374420
360010121
8.69.000
4.00
2.74.55.0
215216171851273414
000001000
00000
1.9000
552435332
010000000
016.7
0000000
Municipality Barangay Number ofchildren
(0-5years old)
Malnourishedchildren
(0-5 years old)
Proportion
Children under 5years oldwho died
Number ofchildrenunder 1year old
Women deaths due topregnancy-related
causes
Magnitude Magnitude Proportion Magnitude Proportion
Number ofchildrenunder 5
years old
CORCUERA AlegriaAmbulongColongcolongGobonGuintiguibanIlijanLabnigMabiniMahabaMangansagPoblacionSan AgustinSan RoqueSan VicenteTacasan
1165346612357432549854238433730
15263577426675129651054650614438
1341003501605522
8.66.31.800
4.59.80
1.55.70
10.08.24.55.3
300001001100000
2.50000
1.700
2.01.200000
14115818769
1967784
000000000000000
000000000000000
FERROL AgnonocBunsoranClaro M. RectoHinagumanPoblacion (Ferrol)Tubigon
739363
134158208
8611578
157187255
332304
3.52.62.61.90
1.6
001000
00
1.6000
81413322844
000000
000000
LOOC
MAGDIWANG
AgojoBalatucanBuenavistaCamandaoGuinhayaanLimon NorteLimon SurManhacPiliPoblacionPuntaTuguis
AgsaoAgutayAmbulongDulanganIpilJao-asanPoblacionSilumTampayan
21279
144226157204220129101226256109
255107180270202251271159125289298131
171
11006130342
6.70.96.100
2.40.41.90
1.01.31.5
001105000112
00
0.70.40
2.4000
0.40.41.8
511433493341382513374517
000000000000
000000000000
6620311822819210216687268
84238150289228130197105326
50111140020
6.00
0.73.86.100
1.90
020001114
01.0000
1.00.61.11.5
104219452620311870
001100100
00
5.02.200
3.100

The Many Faces of Poverty (Volume 9)
201
Table 1. Health and Nutrition Indicators, by Barangay, Province of Romblon, 2015-2016
Municipality Barangay Number ofchildren
(0-5years old)
Malnourishedchildren
(0-5 years old)
Proportion
Children under 5years oldwho died
Number ofchildrenunder 1year old
Women deaths due topregnancy-related
causes
Magnitude Magnitude Proportion Magnitude Proportion
Number ofchildrenunder 5years old
ROMBLON AgbalutoAgbudiaAgnagaAgnayAgnipaAgpanabatAgtongoAladBagacayBarangay I (Pob.)Barangay II (Pob.)Barangay III (Pob.)Barangay IV (Pob.)CajimosCalabogoCapaclanCobrador (Naguso)GinablanGuimpinganIlauranLamaoLi-oLogbonLonosLunasMacalasMapulaPaljeSablayanSawangTambac
7711699546381
10518420636597146
28488
406675477
1281141527914765
1014163
1367754
921441146375
10513023027043748956351111494796892
15513618692
18079
120577917310163
25132131027110212353510032103121120
2.23.50.94.82.71.02.34.3
10.02.31.40
3.63.42.71.03.87.41.100
1.62.25.63.80.83.51.30.62.00
1010001020100100000000000000000
1.30
1.0000
0.90
1.00
1.700
0.400000000000000000
1526151511181831403
118
103716731227
262729202217218
1423178
0000000000000010000000000000000
00000000000000
5.90000000000000000
SAN FERNANDO AgtiwaAzargaCampalingoCanjalonEspañaMabiniMabuloOtodPanangcalanPiliPoblacionTaclobo
118184155171178117185272116141117573
149231185218222151234318143168139699
0141252120632
00.42.20.5
11.31.30.40.60
3.62.20.3
001001006000
00
0.600
0.800
4.9000
2436223335193148212926
113
000000100000
000000
3.100000
SAN AGUSTIN BachawanBinongahanBinugusanBuliCabolutanCagbuayaCamantayaCarmenCawayanDoña JuanaDubdubanLusongMahabang Baybay (Long Beach)PoblacionSugod
122204929598
12851
18097
237230110208112148
14625911611711815954237121285280132261130187
34712
333
14421180
12
2.11.56.00.91.7
20.85.65.93.30.70.40.83.10
6.4
030000000010001
01.400000000
0.4000
0.7
273114162224123417534823421429
000000000000000
000000000000000

202
The Many Faces of Poverty (Volume 9)
Table 1. Health and Nutrition Indicators, by Barangay, Province of Romblon, 2015-2016
Municipality Barangay Number ofchildren
(0-5years old)
Malnourishedchildren
(0-5 years old)
Proportion
Children under 5years oldwho died
Number ofchildrenunder 1year old
Women deaths due topregnancy-related
causes
Magnitude Magnitude Proportion Magnitude Proportion
Number ofchildrenunder 5years old
SAN JOSE BusayCombotLanasPinamihaganPoblacion (Agcogon)
169128389161294
209147471207361
51
3073
2.40.76.43.40.8
31301
1.70.80.80
0.3
2718582146
00000
00000
SANTA FE AgmanicCanyayoDanao NorteDanao SurGuinbirayanGuintigbasanMagsaysayMat-iPandanPoblacionTabugon
18117417878
18662
153104138256205
2162102089922981182128176303250
92727271239
4.21.03.42.03.12.53.80.81.11.03.6
01000000102
00.6000000
0.70
1.0
36294512366
2822335446
30000000000
7.70000000000
SANTA MARIA BongaConcepcion Norte (Pob.)Concepcion SurParoyhogSan IsidroSanto Niño
1091941114845
103
1272391436460
130
205030
1.60
3.50
5.00
002000
00
1.8000
2625204617
000000
000000

The Many Faces of Poverty (Volume 9)
203
CBMS Poverty Maps: Province of Romblon
Map 1. Proportion of Households Living in Makeshift Housing,by Municipality, 2015-2016
Map 2. Proportion of Households Living in Makeshift Housing,by Barangay, 2015-2016
Barangay Magnitude ProportionMunicipality
Bottom 10 Barangays
ALCANTARASAN FERNANDOSAN AGUSTINLOOCROMBLONSAN JOSEROMBLONBANTONMAGDIWANGROMBLON
TugdanCanjalonBinongahanBalatucanLunasBusayCapaclanLagangTampayanBagacay
915044251425591
2725
17.313.09.99.77.97.16.65.65.45.1
Magnitude ProportionMunicipality
ALCANTARAROMBLONSAN FERNANDOSAN JOSESAN AGUSTINCORCUERASANTA FELOOCMAGDIWANGCONCEPCIONFERROLCALATRAVACAJIDIOCANSANTA MARIABANTON
12122512153833952793813212237124
3.22.92.62.51.71.61.51.51.41.31.31.10.80.80.3

204
The Many Faces of Poverty (Volume 9)
Map 10. Proportion of Households who are Informal Settlers,by Barangay, 2015-2016
Map 9. Proportion of Households who are Informal Settlers,by Municipality, 2015-2016
CBMS Poverty Maps: Province of Romblon
Barangay Magnitude ProportionMunicipalityBottom 10 Barangays
SAN FERNANDOMAGDIWANGMAGDIWANGCAJIDIOCANALCANTARALOOCCAJIDIOCANCONCEPCIONMAGDIWANGLOOC
OtodSilumAmbulongPoblacionLawanPiliCambaloSan Pedro (Agbatang)PoblacionAgojo
31360
107120283949134651
70.842.638.234.915.814.613.212.912.511.9
Magnitude ProportionMunicipality
MAGDIWANGSAN FERNANDOCAJIDIOCANCONCEPCIONCALATRAVAROMBLONSAN AGUSTINFERROLLOOCALCANTARASANTA FECORCUERABANTONSANTA MARIASAN JOSE
272408303438027416648
134968145232016
10.18.86.44.23.93.53.43.02.62.52.41.81.71.30.8

The Many Faces of Poverty (Volume 9)
205
CBMS Poverty Maps: Province of Romblon
Map 11. Proportion of Households without Access to Safe Water Supply,by Municipality, 2015-2016
Map 12. Proportion of Households without Access to Safe Water Supply,by Barangay, 2015-2016
Barangay Magnitude ProportionMunicipality
Bottom 10 Barangays
BANTONCONCEPCIONBANTONBANTONCAJIDIOCANROMBLONBANTONBANTONBANTONBANTON
YabawonSampongTan-AgTumalumAlibagonCobrador (Naguso)NabalayNasunoganBalogoTogbongan
731028682
13522116649521
100.0100.0100.0100.099.395.794.192.892.291.3
Magnitude ProportionMunicipality
BANTONCONCEPCIONROMBLONCAJIDIOCANMAGDIWANGCALATRAVASAN JOSESAN AGUSTINSAN FERNANDOALCANTARASANTA FELOOCCORCUERASANTA MARIAFERROL
1,066419
2,9171,399663377389876812591415496232130123
78.841.037.529.624.618.418.417.717.415.512.29.69.38.37.6

206
The Many Faces of Poverty (Volume 9)
Map 14. Proportion of Households without Access to Sanitary Toilet Facilities,by Barangay, 2015-2016
Map 13. Proportion of Households without Access to Sanitary Toilet Facilities,by Municipality, 2015-2016
CBMS Poverty Maps: Province of Romblon
Barangay Magnitude ProportionMunicipalityBottom 10 Barangays
CAJIDIOCANSAN JOSELOOCCALATRAVASAN AGUSTINROMBLONSAN AGUSTINROMBLONROMBLONSANTA MARIA
AlibagonCombotPiliTalisayCawayanCajimosBachawanLi-oAgbudiaBonga
7997
1181088017499
1007378
58.146.644.240.939.833.132.432.131.530.8
Magnitude ProportionMunicipality
SAN JOSESAN AGUSTINSAN FERNANDOROMBLONCAJIDIOCANCALATRAVASANTA FEMAGDIWANGLOOCSANTA MARIAALCANTARAFERROLCORCUERABANTONCONCEPCION
436867782
1,1787153084263256231863781552366414
20.617.616.815.115.115.112.512.112.111.99.99.59.44.71.4

The Many Faces of Poverty (Volume 9)
207
Table 2. Housing, Water and Sanitation Indicators, by Barangay, Province of Romblon, 2015-2016
Households living inmakeshift housing
Households who areinformal settlers
Households without accessto safe water supply
Households without accessto sanitary toilet facilities
BarangayMunicipality
ProportionProportion Proportion ProportionMagnitude Magnitude Magnitude Magnitude
11471500
1001
91
0.40.31.41.70.51.400
2.10
0.417.3
324
2702
283
21105
1.30.61.46.70
0.515.80.94.30.40
1.0
1591267131070015
452
6.62.94.3
16.76.10.30
2.200
6.185.9
1181456336691343177
29
4.926.216.315.716.819.07.31.30.66.52.95.5
20010000000000001
1.900
5.6000000000000
1.4
13102001710100015
1.03.11.90
3.200
1.42.51.30
2.7000
0.96.8
958540153641664
191668662141828273
92.287.675.55.6
85.577.194.192.868.283.510016.291.350.0
100.075.2100
207312700310005384
19.47.25.75.63.28.400
1.11.3000
6.13.77.35.5
02211
2100021421
00.40.50.30.43.5000
0.60.31.20.50.3
12
496
2717223
1325
120360
0.70.4
13.21.7
10.32.80.71.31.74.16.3
34.98.20
13533486
158076
1196511
24425197354
99.363.723.243.8
012.539.841.96.376.56.35.5
16.616.3
79123385815658
130
329431
10554
58.123.510.216.15.7
10.72.78.40
10.023.79.0
23.916.3
ALCANTARA BagsikBonlaoCalagonsaoCamiliCamod-OmGui-obLawanMadalagPoblacionSan IsidroSan RoqueTugdan
BANTON BalogoBaniceHambi-anLagangLibtongMainitNabalayNasunoganPoblacionSibayTan-AgToctocTogbonganTogongTumalumTungonanYabawon
CAJIDIOCAN AlibagonCambajaoCambaloCambijangCantagdaDanaoGutivanLicoLumbang EsteLumbang WesteMarigondonPoblacionSugodTaguilos
CALATRAVA BalogoLinaoPagsangahanPanguloPoblacionSan RoqueTalisay
4912420
1.02.90.70.61.40.70
32211231533
0.87.17.66.65.21.01.1
191121561143747
48.63.9
10.417.64.9
12.417.8
67682
341
28108
17.021.91.49.80.39.4
40.9
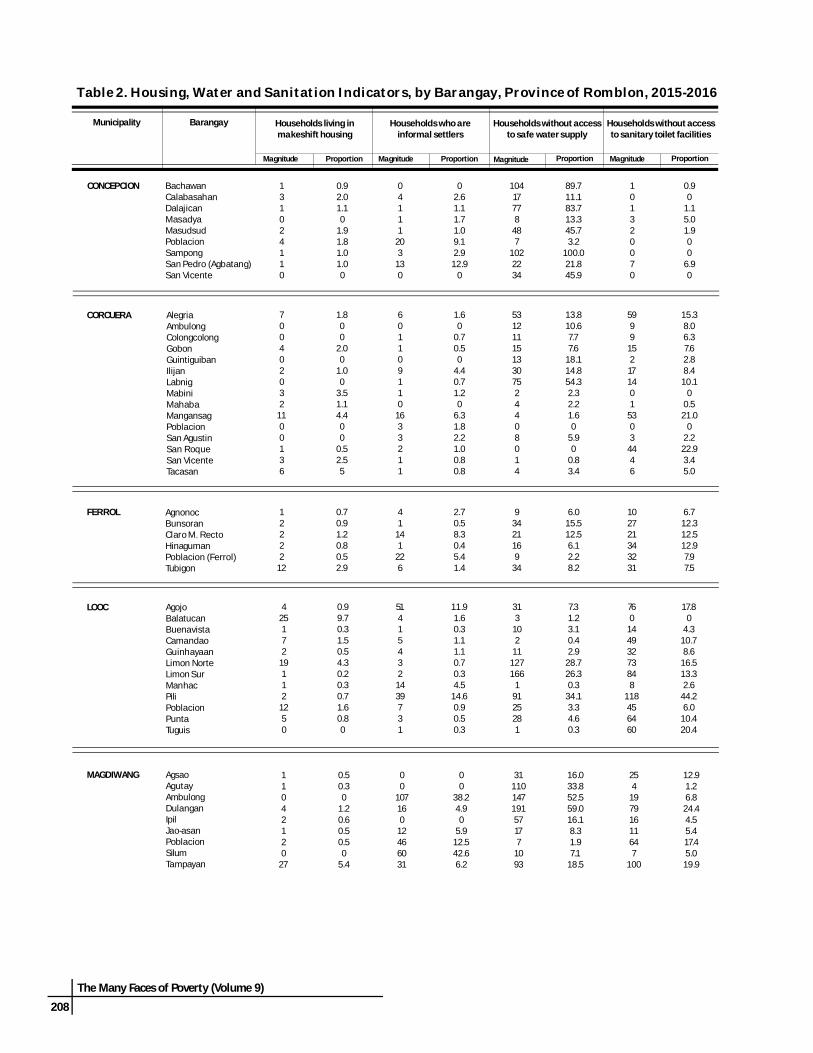
208
The Many Faces of Poverty (Volume 9)
Table 2. Housing, Water and Sanitation Indicators, by Barangay, Province of Romblon, 2015-2016
Households living inmakeshift housing
Households who areinformal settlers
Households without accessto safe water supply
Households without accessto sanitary toilet facilities
BarangayMunicipality
ProportionProportion Proportion ProportionMagnitude Magnitude Magnitude Magnitude
101320070
0.90
1.15.01.900
6.90
131024110
0.92.01.10
1.91.81.01.00
04111
203
130
02.61.11.71.09.12.912.9
0
10417778
487
1022234
89.711.183.713.345.73.2
100.021.845.9
425172
19112
1250
760
14493273848
118456460
17.80
4.310.78.6
16.513.32.6
44.26.0
10.420.4
0.99.70.31.50.54.30.20.30.71.60.80
514154321439731
11.91.60.31.11.10.70.34.5
14.60.90.50.3
313
102
11127166
19125281
7.31.23.10.42.9
28.726.30.3
34.13.34.60.3
CONCEPCION BachawanCalabasahanDalajicanMasadyaMasudsudPoblacionSampongSan Pedro (Agbatang)San Vicente
CORCUERA AlegriaAmbulongColongcolongGobonGuintiguibanIlijanLabnigMabiniMahabaMangansagPoblacionSan AgustinSan RoqueSan VicenteTacasan
FERROL AgnonocBunsoranClaro M. RectoHinagumanPoblacion (Ferrol)Tubigon
LOOC
MAGDIWANG
AgojoBalatucanBuenavistaCamandaoGuinhayaanLimon NorteLimon SurManhacPiliPoblacionPuntaTuguis
AgsaoAgutayAmbulongDulanganIpilJao-asanPoblacionSilumTampayan
5999
152171401
5303
4446
15.38.06.37.62.88.410.1
00.521.0
02.222.93.45.0
700402032
1100136
1.800
2.00
1.00
3.51.14.400
0.52.55
601109110
1633211
1.60
0.70.50
4.40.71.20
6.31.82.21.00.80.8
5312111513307524408014
13.810.67.77.6
18.114.854.32.32.21.60
5.90
0.83.4
102721343231
6.712.312.512.97.97.5
12222
12
0.70.91.20.80.52.9
41
141
226
2.70.58.30.45.41.4
93421169
34
6.015.512.56.12.28.2
254
19791611647
100
12.91.26.824.44.55.417.45.019.9
11042120
27
0.50.30
1.20.60.50.50
5.4
00
107160
12466031
00
38.24.90
5.912.542.66.2
3111014719157177
1093
16.033.852.559.016.18.31.97.1
18.5

The Many Faces of Poverty (Volume 9)
209
Table 2. Housing, Water and Sanitation Indicators, by Barangay, Province of Romblon, 2015-2016
Households living inmakeshift housing
Households who areinformal settlers
Households without accessto safe water supply
Households without accessto sanitary toilet facilities
BarangayMunicipality
ProportionProportion Proportion ProportionMagnitude Magnitude Magnitude Magnitude
161262913250413271597144033814265260
0.82.60.51.23.10.93.42.95.10
2.10.51.95.10.56.63.00.72.51.30
1.01.52.27.90.94.63.40.83.00
46255293
131044
152
10443456
112
204897336
3.02.61.03.02.60.93.40.72.71.10
2.12.52.91.1
11.61.72.22.51.73.03.51.05.42.23.56.94.81.21.54.1
14132139374015116326159
11
190
2581292432211463220117934391503729152153644
10.656.972.422.320.56.843.972.132.61.10.59.70
49.168.627.195.710.138.973.858.229.822.124.528.116.222.110.385.018.230.1
1073551412117540441420
17451
14939
323736
100236034214
3140258
7.631.528.68.46.25.0
28.48.89.01.12.11.00
33.127.116.61.36.5
19.812.417.932.111.816.119.19.23.1
21.215.812.65.5
ROMBLON AgbalutoAgbudiaAgnagaAgnayAgnipaAgpanabatAgtongoAladBagacayBarangay I (Pob.)Barangay II (Pob.)Barangay III (Pob.)Barangay IV (Pob.)CajimosCalabogoCapaclanCobrador (Naguso)GinablanGuimpinganIlauranLamaoLi-oLogbonLonosLunasMacalasMapulaPaljeSablayanSawangTambac
64400082104110115
9912016427
218280
14411555183
101
32.427.18.42.00.82.2
19.616.639.827.918.524.04.81.027.3
2.09.9000
2.51.90.20
0.80.20.40
0.34.1
1522241090471265133
0.31.11.01.09.20.30
1.80
0.811.411.41.34.40.8
12014030142
32931621714025360
20
39.231.615.70.51.50.6
29.918.88.0
42.022.510.99.60
5.4
SAN FERNANDO AgtiwaAzargaCampalingoCanjalonEspañaMabiniMabuloOtodPanangcalanPiliPoblacionTaclobo
SAN AGUSTIN BachawanBinongahanBinugusanBuliCabolutanCagbuayaCamantayaCarmenCawayanDoña JuanaDubdubanLusongMahabang Baybay (Long Beach)PoblacionSugod
1022105044701229
510557734129217651460
278
2.322.815.019.010.010.65.817.222.615.6
030.5
4.64.82.6
13.01.01.51.90
0.40.70.71.0
116163336
31336
299
0.53.54.20.80.71.11.7
70.81.32.0
10.01.0
4612458
122191731
226242515
105
21.027.015.231.74.66.28.651.110.68.55.2
11.5

210
The Many Faces of Poverty (Volume 9)
Table 2. Housing, Water and Sanitation Indicators, by Barangay, Province of Romblon, 2015-2016
Households living inmakeshift housing
Households who areinformal settlers
Households without accessto safe water supply
Households without accessto sanitary toilet facilities
BarangayMunicipality
ProportionProportion Proportion ProportionMagnitude Magnitude Magnitude Magnitude
226110
0.80.41.70.71.00
758000
2.81.12.3000
36311918260
14.26.85.4
12.424.8
0
7836467
190
30.87.8
13.14.8
18.10
253
120
13
7.11.41.80
2.0
62611
1.71.00.90.40.2
0186159
143
089.424.50.46.6
8997
1545046
25.446.623.719.67.1
SAN JOSE BusayCombotLanasPinamihaganPoblacion (Agcogon)
SANTA FE AgmanicCanyayoDanao NorteDanao SurGuinbirayanGuintigbasanMagsaysayMat-iPandanPoblacionTabugon
SANTA MARIA BongaConcepcion Norte (Pob.)Concepcion SurParoyhogSan IsidroSanto Niño
213216303
1147
0.63.70.80.61.51.70
1.23.90.81.7
5222
12514
13278
1.50.60.81.23.12.80.31.64.65.62.0
7186535
33389
3138141
2.153.620.12.98.421.53.012.713.42.90.2
561064012281224465
6928
17.030.515.26.97.16.87.9
18.81.8
14.37.0

The Many Faces of Poverty (Volume 9)
211
Map 16. Proportion of Children 6-11 Years Old Not Attending Elementary School,by Barangay, 2015-2016
Map 15. Proportion of Children 6-11 Years Old Not Attending Elementary School,by Municipality, 2015-2016
CBMS Poverty Maps: Province of Romblon
Barangay Magnitude ProportionMunicipalityBottom 10 Barangays
CORCUERACORCUERABANTONCAJIDIOCANCORCUERASAN JOSEALCANTARACORCUERASAN FERNANDOCALATRAVA
MabiniLabnigBaniceCambajaoAmbulongPinamihaganLawanAlegriaCanjalonPoblacion
4105
46102711273219
14.312.512.512.312.312.011.711.311.110.6
Magnitude ProportionMunicipality
SAN JOSECORCUERACALATRAVACAJIDIOCANALCANTARAMAGDIWANGLOOCSAN FERNANDOSANTA MARIAROMBLONFERROLSANTA FESAN AGUSTINBANTONCONCEPCION
14311211421013010717718355
22745
1081352012
8.88.27.96.46.15.95.95.75.75.14.94.64.53.22.4

212
The Many Faces of Poverty (Volume 9)
Map 17. Proportion of Children 12-15 Years Old Not Attending High School,by Municipality, 2015-2016
Map 18. Proportion of Children 12-15 Years Old Not Attending High School,by Barangay, 2015-2016
Barangay Magnitude ProportionMunicipality
Bottom 10 Barangays
SAN FERNANDOSAN FERNANDOMAGDIWANGCALATRAVACAJIDIOCANCORCUERASAN JOSECAJIDIOCANSANTA MARIACAJIDIOCAN
PanangcalanCanjalonSilumTalisayCambajaoLabnigLanasSugodBongaLumbang Weste
511113767
11925
143894773
53.753.150.747.946.945.545.044.944.844.0
Magnitude ProportionMunicipality
SAN FERNANDOCAJIDIOCANCALATRAVASAN JOSECORCUERAMAGDIWANGROMBLONSANTA MARIALOOCSAN AGUSTINALCANTARASANTA FEFERROLBANTONCONCEPCION
8448303243543063988671795585673634101587345
38.136.434.233.831.431.430.027.427.026.826.725.624.216.612.7
CBMS Poverty Maps: Province of Romblon
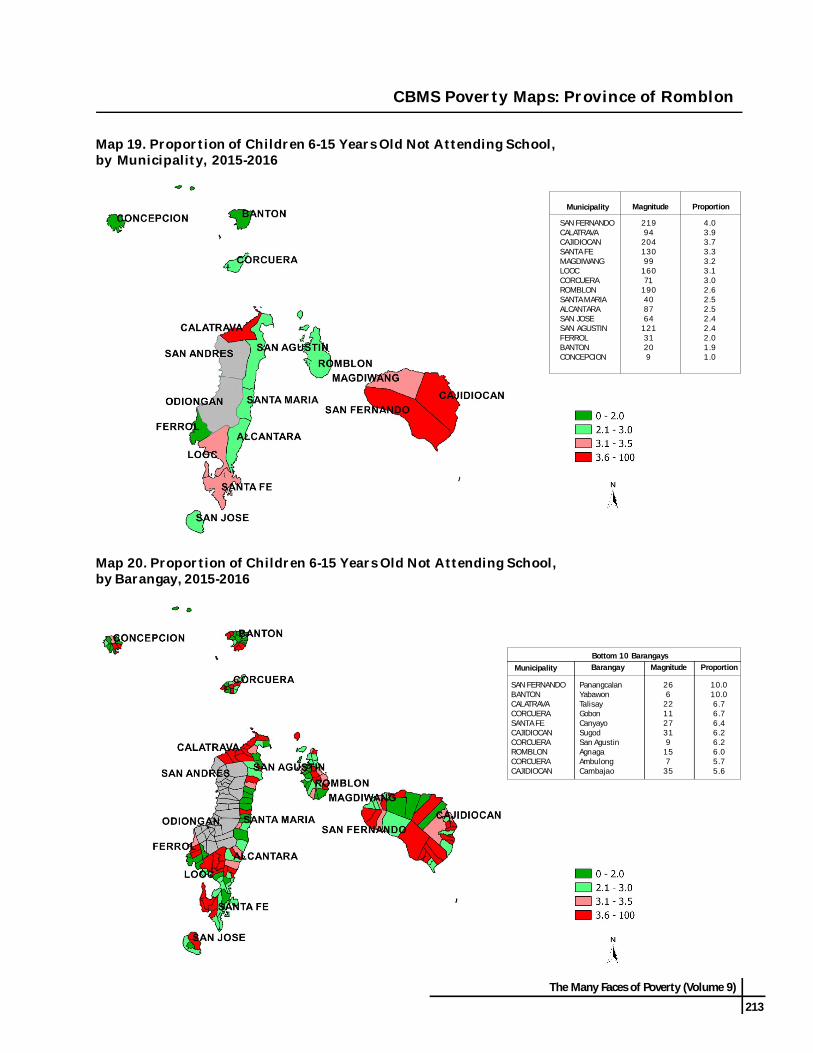
The Many Faces of Poverty (Volume 9)
213
Map 20. Proportion of Children 6-15 Years Old Not Attending School,by Barangay, 2015-2016
Map 19. Proportion of Children 6-15 Years Old Not Attending School,by Municipality, 2015-2016
CBMS Poverty Maps: Province of Romblon
Barangay Magnitude ProportionMunicipalityBottom 10 Barangays
SAN FERNANDOBANTONCALATRAVACORCUERASANTA FECAJIDIOCANCORCUERAROMBLONCORCUERACAJIDIOCAN
PanangcalanYabawonTalisayGobonCanyayoSugodSan AgustinAgnagaAmbulongCambajao
266
221127319
157
35
10.010.06.76.76.46.26.26.05.75.6
Magnitude ProportionMunicipality
SAN FERNANDOCALATRAVACAJIDIOCANSANTA FEMAGDIWANGLOOCCORCUERAROMBLONSANTA MARIAALCANTARASAN JOSESAN AGUSTINFERROLBANTONCONCEPCION
21994
20413099
16071
190408764
12131209
4.03.93.73.33.23.13.02.62.52.52.42.42.01.91.0

214
The Many Faces of Poverty (Volume 9)
Table 3. Education Indicators, by Barangay, Province of Romblon, 2015-2016
Number ofchildren (6-
11 years old)
Children notattending
elementary school(6-11 years old)
Number ofchildren (12-15 years old)
Children not attendinghigh school
(12-15 years old)
Number ofchildren (6-
15 yearsold)
Children notattending school(6-15 years old)
BarangayMunicipality
Magnitude Magnitude MagnitudeProportion Proportion Proportion
16117217919714218294176202141159334
4121495
14115
15101219
2.57.07.84.63.57.7
11.72.87.47.17.55.7
10312913312093
14257
1291167677
187
292644323240172926211750
28.220.233.126.734.428.229.822.522.427.622.126.7
264301312317235324151305318217236521
117895763265
18
4.22.32.62.82.12.24.01.00.62.82.13.5
5340371323421217
1293433247
25456032
15300200110002320
1.912.58.100
4.800
0.82.9000
8.06.73.30
3626267133152199282312624253028
57415706
1234221158
13.926.915.414.338.522.6
028.612.110.717.416.733.34.24.016.728.6
8966632036731738
2286256361349709060
13000202100102116
1.14.5000
2.70
5.30.400
2.80
4.11.41.1
10.0
77374292249187427179102112277281201299213
546145
1025766
19188
2912
6.512.34.82.05.35.93.95.95.46.96.44.09.75.6
612542121821303191157283
166177161198151
20119615056
1363020217369408946
32.846.928.827.543.142.626.127.825.344.039.024.844.930.5
138628504431317746294174195443458362497364
63510113
341274
15164
3116
4.35.62.02.60.94.64.14.02.13.43.51.16.24.4
ALCANTARA BagsikBonlaoCalagonsaoCamiliCamod-OmGui-obLawanMadalagPoblacionSan IsidroSan RoqueTugdan
BANTON BalogoBaniceHambi-anLagangLibtongMainitNabalayNasunoganPoblacionSibayTan-AgToctocTogbonganTogongTumalumTungonanYabawon
CAJIDIOCAN AlibagonCambajaoCambaloCambijangCantagdaDanaoGutivanLicoLumbang EsteLumbang WesteMarigondonPoblacionSugodTaguilos
CALATRAVA BalogoLinaoPagsangahanPanguloPoblacionSan RoqueTalisay
278238118265179184187
19177
24191216
6.87.15.99.1
10.66.58.6
16914971
162121134140
60492760283367
35.532.938.037.023.124.647.9
447387189427300318327
19149
1848
22
4.33.64.84.21.32.56.7

The Many Faces of Poverty (Volume 9)
215
Table 3. Education Indicators, by Barangay, Province of Romblon, 2015-2016
Number ofchildren (6-
11 years old)
Children notattending
elementary school(6-11 years old)
Number ofchildren (12-15 years old)
Children not attendinghigh school
(12-15 years old)
Number ofchildren (6-
15 yearsold)
Children notattending school(6-15 years old)
BarangayMunicipality
Magnitude Magnitude MagnitudeProportion Proportion Proportion
6497382737
109386927
121031121
1.62.12.60
8.10.92.62.93.7
356239262758403631
4483311723
11.46.5
20.511.511.119.017.55.69.7
99159775364
16778
10558
011021211
00.61.30
3.10.62.61.01.7
101263169257198142236108332
4279
1942
155
22
4.010.35.37.42.01.46.44.66.6
831751151561539917573
239
205836614420413781
24.133.131.339.128.820.223.450.733.9
184438284413351241411181571
597
19124
123
28
2.72.12.54.63.41.72.91.74.9
CONCEPCION BachawanCalabasahanDalajicanMasadyaMasudsudPoblacionSampongSan Pedro (Agbatang)San Vicente
CORCUERA AlegriaAmbulongColongcolongGobonGuintiguibanIlijanLabnigMabiniMahabaMangansagPoblacionSan AgustinSan RoqueSan VicenteTacasan
FERROL AgnonocBunsoranClaro M. RectoHinagumanPoblacion (Ferrol)Tubigon
LOOC
MAGDIWANG
AgojoBalatucanBuenavistaCamandaoGuinhayaanLimon NorteLimon SurManhacPiliPoblacionPuntaTuguis
AgsaoAgutayAmbulongDulanganIpilJao-asanPoblacionSilumTampayan
23881839337
1018028821177487
1216185
27105515
1047579
1124
11.312.36.05.42.75.0
12.514.38.54.39.5
10.39.13.34.7
1544178722982553262874358754859
581527245
22254
24191018231418
37.736.634.633.317.226.845.512.538.721.823.331.030.729.230.5
39212216116566
18313560
144204117145196109144
9751105613119742
2.35.73.16.70
2.74.41.72.10.50.96.23.63.71.4
8113493
164213242
472
101012
4.95.22.26.14.75.0
558763
132141175
171418392545
30.916.128.629.517.725.7
136221156296354417
54341
14
3.71.81.91.40.33.4
251159218320221269342170137375367194
1777
1312232026
273112
6.84.43.24.15.48.65.81.24.47.28.46.2
16613415819614517725512510028523296
633429543749712822628128
38.025.418.427.625.527.727.822.422.021.834.929.2
417293376516366446597295237660599290
22125
148
22337
101287
5.34.11.32.72.24.95.52.44.21.81.32.4

216
The Many Faces of Poverty (Volume 9)
Table 3. Education Indicators, by Barangay, Province of Romblon, 2015-2016
Number ofchildren (6-
11 years old)
Children notattending
elementary school(6-11 years old)
Number ofchildren (12-15 years old)
Children not attendinghigh school
(12-15 years old)
Number ofchildren (6-
15 yearsold)
Children notattending school(6-15 years old)
BarangayMunicipality
Magnitude Magnitude MagnitudeProportion Proportion Proportion
8717814379
11612414224531150848978
3581174591327169
21211117380
22385
1496274
18411193
368467
108
253594
153
36623
11376
112423735
3.43.45.65.15.25.67.03.38.06.06.0
10.15.14.22.67.84.52.84.35.22.74.07.54.92.42.73.24.13.82.75.4
6089
1064185941071691891959644519790
328742764
11263
10961
14257
1013250
1306857
243641924333745593121255028
1162581532212616431828817451912
40.040.438.722.028.235.134.626.631.215.820.318.811.125.431.135.433.829.623.428.633.323.926.230.331.627.725.034.034.627.921.1
14726724912020121824941450069
14315312355520778720698
13332417428214136514225094
124314179150
610151348
1071352
127
1810137660
123924537
4.13.76.00.81.51.83.22.41.41.42.13.31.62.23.42.34.91.02.32.23.42.10
3.32.13.62.13.21.61.74.7
ROMBLON AgbalutoAgbudiaAgnagaAgnayAgnipaAgpanabatAgtongoAladBagacayBarangay I (Pob.)Barangay II (Pob.)Barangay III (Pob.)Barangay IV (Pob.)CajimosCalabogoCapaclanCobrador (Naguso)GinablanGuimpinganIlauranLamaoLi-oLogbonLonosLunasMacalasMapulaPaljeSablayanSawangTambac
17226613012516118471
273131330350141266154276
1015427
112
134
1126954
12
5.85.63.11.64.36.02.84.83.13.37.46.41.92.64.3
117208969511712950
19189
21824594
192119155
33722925243184927526827472550
28.234.630.226.320.524.016.025.730.323.927.828.724.521.032.3
289474226220278313121464220548595235458273431
51731540
159
1317894
11
1.73.61.30.51.81.30
3.24.12.42.93.42.01.52.6
SAN FERNANDO AgtiwaAzargaCampalingoCanjalonEspañaMabiniMabuloOtodPanangcalanPiliPoblacionTaclobo
SAN AGUSTIN BachawanBinongahanBinugusanBuliCabolutanCagbuayaCamantayaCarmenCawayanDoña JuanaDubdubanLusongMahabang Baybay (Long Beach)PoblacionSugod
183263217287300182288311164190154696
13141332121012181255
37
7.15.36.0
11.14.05.54.25.87.32.63.25.3
10519217320924011120117195141111466
435443
11196367960515933179
41.028.124.953.140.032.439.335.153.741.829.738.4
288455390496540293489482259331265
1,162
15108
201415162326167
49
5.22.22.14.02.65.13.34.8104.82.64.2

The Many Faces of Poverty (Volume 9)
217
Table 3. Education Indicators, by Barangay, Province of Romblon, 2015-2016
Number ofchildren (6-
11 years old)
Children notattending
elementary school(6-11 years old)
Number ofchildren (12-15 years old)
Children not attendinghigh school
(12-15 years old)
Number ofchildren (6-
15 yearsold)
Children notattending school(6-15 years old)
BarangayMunicipality
Magnitude Magnitude MagnitudeProportion Proportion Proportion
1522912388380
125
12206674
7.96.92.57.28.83.2
1051851446646
108
473533181729
44.818.922.927.337.026.9
257476382149126233
14117143
5.42.31.80.73.21.3
271192502225433
2416482728
8.98.39.6
12.06.5
169105318155301
4838
1436362
28.436.245.040.620.6
440297820380734
166
24117
3.62.02.92.91.0
SAN JOSE BusayCombotLanasPinamihaganPoblacion (Agcogon)
SANTA FE AgmanicCanyayoDanao NorteDanao SurGuinbirayanGuintigbasanMagsaysayMat-iPandanPoblacionTabugon
SANTA MARIA BongaConcepcion Norte (Pob.)Concepcion SurParoyhogSan IsidroSanto Niño
266249162112253118208155186347312
101222
1314
13112317
3.84.81.21.85.10.81.98.45.96.65.4
15717012693
16281
126114148214209
4961241535193023386155
31.235.919.016.121.623.523.820.225.728.526.3
423419288205415199334269334561521
112743
1157
11142314
2.66.41.41.52.72.52.14.14.24.12.7

218
The Many Faces of Poverty (Volume 9)
Map 22. Proportion of Households with Income Below the Poverty Threshold,by Barangay, 2015-2016
Map 21. Proportion of Households with Income Below the Poverty Threshold,by Municipality, 2015-2016
CBMS Poverty Maps: Province of Romblon
Barangay Magnitude ProportionMunicipalityBottom 10 Barangays
BANTONBANTONSAN AGUSTINSAN AGUSTINCAJIDIOCANCALATRAVACAJIDIOCANSAN AGUSTINSAN FERNANDOBANTON
TogbonganNasunoganCabolutanLusongMarigondonTalisayCantagdaSugodTacloboNabalay
2368
25522238125225035186216
10098.697.396.996.095.595.194.994.594.1
Magnitude ProportionMunicipality
CAJIDIOCANSAN FERNANDOBANTONSAN AGUSTINMAGDIWANGSANTA MARIAFERROLCALATRAVACORCUERASAN JOSEALCANTARASANTA FECONCEPCIONLOOCROMBLON
4,1003,9211,1233,9482,0961,1981,2311,4831,7021,3422,3882,061
6173,0993,481
86.884.283.079.977.976.675.872.668.063.462.860.660.460.244.7

The Many Faces of Poverty (Volume 9)
219
CBMS Poverty Maps: Province of Romblon
Map 23. Proportion of Households with Income Below the Food Threshold,by Municipality, 2015-2016
Map 24. Proportion of Households with Income Below the Food Threshold,by Barangay, 2015-2016
Barangay Magnitude ProportionMunicipality
Bottom 10 Barangays
BANTONCAJIDIOCANCAJIDIOCANSAN AGUSTINCALATRAVASAN AGUSTINBANTONSAN AGUSTINCAJIDIOCANSAN FERNANDO
NasunoganMarigondonCantagdaCabolutanTalisayLusongTogbonganSugodCambaloTaclobo
6537224424224421121
336337827
94.293.792.892.492.492.191.390.890.890.7
Magnitude ProportionMunicipality
CAJIDIOCANSAN FERNANDOBANTONSAN AGUSTINSANTA MARIAMAGDIWANGFERROLCALATRAVACORCUERAALCANTARASAN JOSELOOCCONCEPCIONSANTA FEROMBLON
3,8413,587995
3,4421,0221,7291,0051,1701,2761,8721,0212,382463
1,3452,393
81.377.073.569.765.464.361.957.251.049.348.346.345.339.630.7

220
The Many Faces of Poverty (Volume 9)
Map 26. Proportion of Households who Experienced Hunger Due to Food Shortage,by Barangay, 2015-2016
Map 25. Proportion of Households who Experienced Hunger Due to Food Shortage,by Municipality, 2015-2016
CBMS Poverty Maps: Province of Romblon
Barangay Magnitude ProportionMunicipalityBottom 10 Barangays
MAGDIWANGMAGDIWANGCAJIDIOCANCAJIDIOCANSAN AGUSTINSANTA FECAJIDIOCANSAN FERNANDOMAGDIWANGMAGDIWANG
Jao-asanSilumCambijangCambajaoBuliMat-iSugodTacloboAgsaoAmbulong
993691
106343353901622
48.325.525.220.217.013.512.09.98.27.9
Magnitude ProportionMunicipality
MAGDIWANGCAJIDIOCANSAN FERNANDOSANTA FESAN AGUSTINSANTA MARIACONCEPCIONSAN JOSECALATRAVAALCANTARABANTONCORCUERAROMBLONFERROLLOOC
2102841636674156
118
1447
243
12
7.86.03.51.91.51.00.60.50.40.40.30.30.30.20.2

The Many Faces of Poverty (Volume 9)
221
Table 4. Income Poverty and Hunger Indicators, by Barangay, Province of Romblon, 2015-2016
11918476
21614829593241235176193412
52.759.527.553.769.281.052.576.348.467.778.878.3
7912938
13010826868
187185144172364
35.041.713.832.350.573.638.459.238.155.470.269.2
252020102000
0.91.60.70
0.90
0.60
0.4000
86854816537316681976073282374708865
83.587.690.688.985.588.094.198.670.475.984.975.7
100.090.285.480.789.0
71774714477115651735066232167557756
68.979.488.777.875.885.588.294.261.863.376.762.291.381.767.170.676.7
10000000010100010
1.000000000
1.30
2.7000
0.90
Households with income below thepoverty threshold
Households with income below thefood threshold
Households who experienced hungerdue to food shortage
BarangayMunicipality
Magnitude Magnitude MagnitudeProportion Proportion Proportion
238244120246152231252
60.678.583.370.953.177.395.5
161199102163108193244
41.064.070.847.037.864.592.4
3120002
0.80.31.4000
0.8
ALCANTARA BagsikBonlaoCalagonsaoCamiliCamod-OmGui-obLawanMadalagPoblacionSan IsidroSan RoqueTugdan
BANTON BalogoBaniceHambi-anLagangLibtongMainitNabalayNasunoganPoblacionSibayTan-AgToctocTogbonganTogongTumalumTungonanYabawon
CAJIDIOCAN AlibagonCambajaoCambaloCambijangCantagdaDanaoGutivanLicoLumbang EsteLumbang WesteMarigondonPoblacionSugodTaguilos
CALATRAVA BalogoLinaoPagsangahanPanguloPoblacionSan RoqueTalisay
126418344330250552241132134293381259350290
92.679.892.791.495.190.980.685.276.691.896.075.379.587.6
117379337316244531207115126274372234314275
86.072.390.887.592.887.569.274.272.085.993.768.071.483.1
0106209108000060
530
020.25.4
25.20
1.30000
1.50
12.00

222
The Many Faces of Poverty (Volume 9)
Table 4. Income Poverty and Hunger Indicators, by Barangay, Province of Romblon, 2015-2016
7810674476479685645
67.269.380.478.361.036.166.755.460.8
588662424353504029
50.056.267.470.041.024.249.039.639.2
000111201
000
1.71.00.52.00
1.4
Households with income below thepoverty threshold
Households with income below thefood threshold
Households who experienced hungerdue to food shortage
BarangayMunicipality
Magnitude Magnitude MagnitudeProportion Proportion Proportion
15523624227428214327695
393
79.972.686.484.679.969.875.267.478.3
13218422024322211123876
303
68.056.678.675.062.954.164.953.960.4
160
22129
9910366
8.20
7.93.72.5
48.32.7
25.51.2
CONCEPCION BachawanCalabasahanDalajicanMasadyaMasudsudPoblacionSampongSan Pedro (Agbatang)San Vicente
CORCUERA AlegriaAmbulongColongcolongGobonGuintiguibanIlijanLabnigMabiniMahabaMangansagPoblacionSan AgustinSan RoqueSan VicenteTacasan
FERROL AgnonocBunsoranClaro M. RectoHinagumanPoblacion (Ferrol)Tubigon
LOOC
MAGDIWANG
AgojoBalatucanBuenavistaCamandaoGuinhayaanLimon NorteLimon SurManhacPiliPoblacionPuntaTuguis
AgsaoAgutayAmbulongDulanganIpilJao-asanPoblacionSilumTampayan
28367
1111686098
11331
11517841
10814110385
73.559.377.684.883.348.381.936.062.870.624.879.473.486.671.4
2034387
1405064912275
1341892968774
52.738.160.870.769.431.565.925.641.053.210.967.650.073.162.2
200000001000130
0.50000000
0.5000
0.52.50
114177121214289316
76.080.572.081.171.076.1
9415485177248247
62.770.050.667.060.959.5
300000
2.000000
87170203243347318380240235421268187
20.466.163.052.993.071.860.276.988.056.143.663.6
40128181153318257278180213309175150
9.449.856.233.385.358.044.157.779.841.228.551.0
000003100125
00000
0.70.200
0.10.31.7

The Many Faces of Poverty (Volume 9)
223
Table 4. Income Poverty and Hunger Indicators, by Barangay, Province of Romblon, 2015-2016
7152
1527374
13531
21327319887465
1281452731506741
1981361081001041061225187
1887384
53.822.479.244.037.960.811.747.155.920.446.337.940.124.477.130.464.948.625.366.467.734.651.328.059.653.538.959.674.336.957.5
4722
1135455
11216
1461861460524543
12314911048141519560675687963864
1535265
35.69.5
58.932.528.250.56.1
32.338.115.131.626.727.88.2
65.416.647.634.88.6
50.747.319.234.415.148.942.129.043.860.526.344.5
1402100000000211000100180001010
0.81.70
1.20.500000000
0.40.50.1000
0.300
0.52.2000
0.70
0.50
Households with income below thepoverty threshold
Households with income below thefood threshold
Households who experienced hungerdue to food shortage
BarangayMunicipality
Magnitude Magnitude MagnitudeProportion Proportion Proportion
ROMBLON AgbalutoAgbudiaAgnagaAgnayAgnipaAgpanabatAgtongoAladBagacayBarangay I (Pob.)Barangay II (Pob.)Barangay III (Pob.)Barangay IV (Pob.)CajimosCalabogoCapaclanCobrador (Naguso)GinablanGuimpinganIlauranLamaoLi-oLogbonLonosLunasMacalasMapulaPaljeSablayanSawangTambac
26434314716225521783386174371476222330167351
86.377.477.081.097.367.477.678.086.671.876.596.987.856.094.9
23828211713724217075
345160287407211295140336
77.863.761.368.592.452.870.169.779.655.565.492.178.547.090.8
13413400000110002
0.37.70.517.0
00000
0.20.2000
0.5
SAN FERNANDO AgtiwaAzargaCampalingoCanjalonEspañaMabiniMabuloOtodPanangcalanPiliPoblacionTaclobo
SAN AGUSTIN BachawanBinongahanBinugusanBuliCabolutanCagbuayaCamantayaCarmenCawayanDoña JuanaDubdubanLusongMahabang Baybay (Long Beach)PoblacionSugod
188405268325354251316375182244151862
85.888.070.384.485.991.987.584.880.583.051.994.5
174368224297325241292340161220118827
79.580.058.877.178.988.380.976.971.274.840.590.7
01012601
2149
100
90
02.23.11.60
0.45.80.94.03.40
9.9
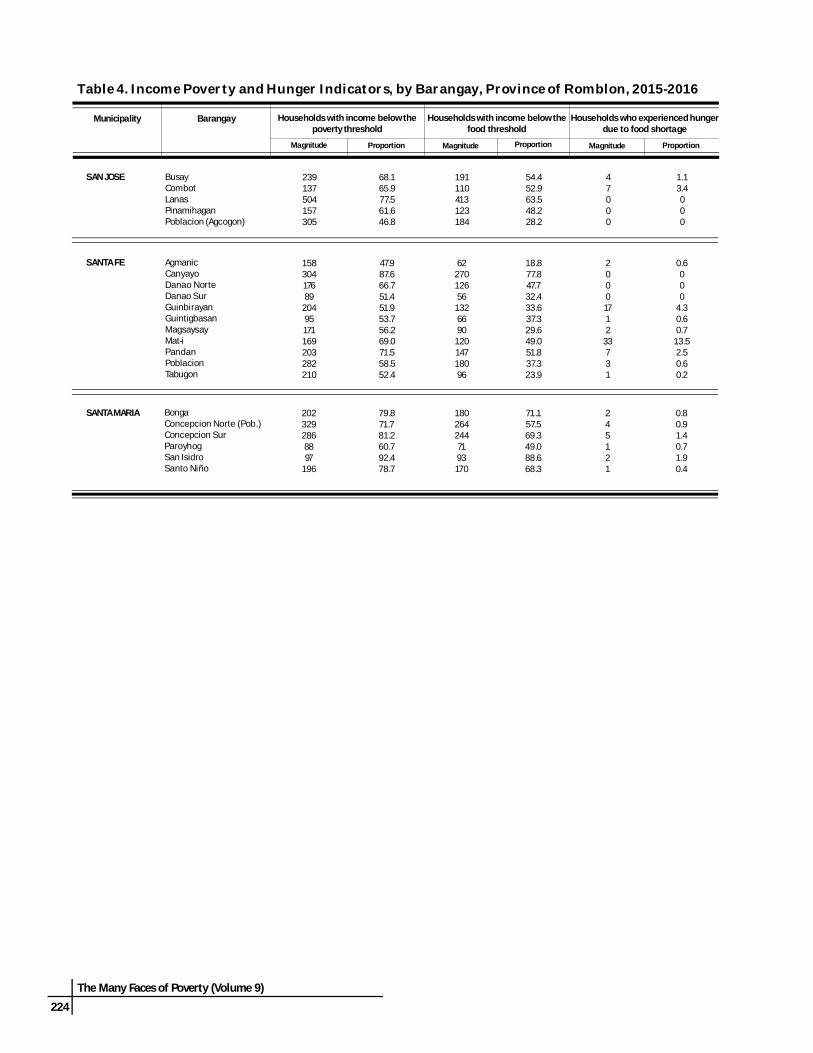
224
The Many Faces of Poverty (Volume 9)
Table 4. Income Poverty and Hunger Indicators, by Barangay, Province of Romblon, 2015-2016
Households with income below thepoverty threshold
Households with income below thefood threshold
Households who experienced hungerdue to food shortage
BarangayMunicipality
Magnitude Magnitude MagnitudeProportion Proportion Proportion
15830417689
20495171169203282210
47.987.666.751.451.953.756.269.071.558.552.4
6227012656
1326690
12014718096
18.877.847.732.433.637.329.649.051.837.323.9
20001712
33731
0.6000
4.30.60.7
13.52.50.60.2
2023292868897
196
79.871.781.260.792.478.7
1802642447193170
71.157.569.349.088.668.3
245121
0.80.91.40.71.90.4
SAN JOSE BusayCombotLanasPinamihaganPoblacion (Agcogon)
SANTA FE AgmanicCanyayoDanao NorteDanao SurGuinbirayanGuintigbasanMagsaysayMat-iPandanPoblacionTabugon
SANTA MARIA BongaConcepcion Norte (Pob.)Concepcion SurParoyhogSan IsidroSanto Niño
239137504157305
68.165.977.561.646.8
191110413123184
54.452.963.548.228.2
47000
1.13.4000

The Many Faces of Poverty (Volume 9)
225
Map 28. Unemployment Rate (15 years old and above), by Barangay, 2015-2016
Map 27. Unemployment Rate (15 years old and above), by Municipality, 2015-2016
CBMS Poverty Maps: Province of Romblon
Barangay Magnitude ProportionMunicipalityBottom 10 Barangays
ALCANTARAALCANTARALOOCBANTONALCANTARAMAGDIWANGSAN JOSEBANTONCONCEPCIONSAN FERNANDO
MadalagLawanManhacLagangCamiliPoblacionCombotToctocSan VicenteCanjalon
10963636
6811577111790
30.029.724.823.119.819.118.318.318.318.1
Magnitude ProportionMunicipality
SAN FERNANDOALCANTARASAN JOSECAJIDIOCANLOOCMAGDIWANGSANTA MARIACONCEPCIONBANTONFERROLSANTA FESAN AGUSTINROMBLONCALATRAVACORCUERA
6015122454154123031477988
144213272583101148
11.110.77.47.06.96.66.65.95.85.54.94.94.94.43.8

226
The Many Faces of Poverty (Volume 9)
Map 29. Proportion of Persons who are Victims of Crime, by Municipality, 2015-2016
Map 30. Proportion of Persons who are Victims of Crime, by Barangay, 2015-2016
Barangay Magnitude ProportionMunicipality
Bottom 10 Barangays
CONCEPCIONSAN JOSECONCEPCIONCORCUERASAN AGUSTINSANTA FECORCUERACONCEPCIONLOOCMAGDIWANG
MasudsudBusayCalabasahanAlegriaBinongahanMat-iIlijanBachawanLimon NorteTampayan
3835532144
1.00.50.50.30.30.30.30.30.20.2
Magnitude ProportionMunicipality
CONCEPCIONCORCUERAMAGDIWANGSAN AGUSTINSAN JOSESAN FERNANDOCAJIDIOCANROMBLONLOOCSANTA FEALCANTARACALATRAVAFERROLSANTA MARIABANTON
7111110109887521110
0.20.10.10.10.10.00.00.00.00.00.00.00.00.00
CBMS Poverty Maps: Province of Romblon

The Many Faces of Poverty (Volume 9)
227
Table 5. Unemployment and Victims of Crime Indicators, by Barangay,Province of Romblon, 2015-2016
Unemployment rate(15 years old and above)
Persons who are victims of crimesNumber of persons in thelabor force
(15 years old and above)
BarangayMunicipality
ProportionProportion MagnitudeMagnitude
376351360344334486212363555348236808
5285168295263
1097518131
1.38.0
14.219.88.7
10.729.730.013.55.25.50.1
000000110000
000000
0.20.10000
165111442646892240
3151119160238284
13976
99462000
19135
1101180
5.58.19.123.14.3000
6.011.75.518.3
01.21.25.80
00000000000000000
00000000000000000
219418370386332655329173222554737491592419
33126
195641201165
78328610
15.12.91.64.916.96.36.16.42.70.910.66.514.52.4
00102000030020
00
0.10
0.20000
0.200
0.10
ALCANTARA BagsikBonlaoCalagonsaoCamiliCamod-OmGui-obLawanMadalagPoblacionSan IsidroSan RoqueTugdan
BANTON BalogoBaniceHambi-anLagangLibtongMainitNabalayNasunoganPoblacionSibayTan-AgToctocTogbonganTogongTumalumTungonanYabawon
CAJIDIOCAN AlibagonCambajaoCambaloCambijangCantagdaDanaoGutivanLicoLumbang EsteLumbang WesteMarigondonPoblacionSugodTaguilos
CALATRAVA BalogoLinaoPagsangahanPanguloPoblacionSan RoqueTalisay
607259188420343209293
3529917056
5.811.24.84.00
2.42.0
0100000
00.100000

228
The Many Faces of Poverty (Volume 9)
Table 5. Unemployment and Victims of Crime Indicators, by Barangay,Province of Romblon, 2015-2016
Unemployment rate(15 years old and above)
Persons who are victims of crimesNumber of persons in thelabor force
(15 years old and above)
BarangayMunicipality
ProportionProportion MagnitudeMagnitude
1352299786
12031313713893
415167
165817
3.06.61.07.05.85.13.65.8
18.3
130030000
0.30.500
1.00000
624284352521423496778254395808722287
19338
195
23826350434324
3.011.62.33.61.24.610.524.812.75.36.08.4
010004000020
00.1000
0.20000
0.10
CONCEPCION BachawanCalabasahanDalajicanMasadyaMasudsudPoblacionSampongSan Pedro (Agbatang)San Vicente
CORCUERA AlegriaAmbulongColongcolongGobonGuintiguibanIlijanLabnigMabiniMahabaMangansagPoblacionSan AgustinSan RoqueSan VicenteTacasan
FERROL AgnonocBunsoranClaro M. RectoHinagumanPoblacion (Ferrol)Tubigon
LOOC
MAGDIWANG
AgojoBalatucanBuenavistaCamandaoGuinhayaanLimon NorteLimon SurManhacPiliPoblacionPuntaTuguis
AgsaoAgutayAmbulongDulanganIpilJao-asanPoblacionSilumTampayan
58220718524894
344187133266434232247353150191
2410612613114032461262
4.14.83.24.86.43.85.93.00
7.41.72.43.44.01.0
511002001000010
0.30.20.200
0.300
0.20000
0.20
211308382354626727
1714188
2859
8.14.54.72.34.58.1
000001
00000
0.1
291530428630441498601322848
31662262315
1151825
1.03.014.54.15.23.019.15.62.9
000112214
000
0.10.10.20.10.10.2

The Many Faces of Poverty (Volume 9)
229
Table 5. Unemployment and Victims of Crime Indicators, by Barangay,Province of Romblon, 2015-2016
Unemployment rate(15 years old and above)
Persons who are victims of crimesNumber of persons in thelabor force
(15 years old and above)
BarangayMunicipality
ProportionProportion MagnitudeMagnitude
ROMBLON AgbalutoAgbudiaAgnagaAgnayAgnipaAgpanabatAgtongoAladBagacayBarangay I (Pob.)Barangay II (Pob.)Barangay III (Pob.)Barangay IV (Pob.)CajimosCalabogoCapaclanCobrador (Naguso)GinablanGuimpinganIlauranLamaoLi-oLogbonLonosLunasMacalasMapulaPaljeSablayanSawangTambac
2404262952282782624528317371552882892188073381217394205265488287468298596227375212208385278234
9241018151
2325199
157
233635925
1515269
2010271315117
161617
3.85.63.47.95.40.45.13.02.65.85.22.4
10.64.5
10.47.61.37.35.75.33.14.33.44.55.74.05.23.44.25.87.3
0000000000000110011010010001010
0000000000000
0.00.100
0.20.10
0.100
0.1000
0.20
0.10
262583194155235509114537201737579180526325383
27149
2428141
132
61321814105
10.32.44.6
15.511.92.80.92.41.08.35.5
10.02.73.11.3
151000000111000
0.10.30.1000000
0.00.00.1000
SAN FERNANDO AgtiwaAzargaCampalingoCanjalonEspañaMabiniMabuloOtodPanangcalanPiliPoblacionTaclobo
SAN AGUSTIN BachawanBinongahanBinugusanBuliCabolutanCagbuayaCamantayaCarmenCawayanDoña JuanaDubdubanLusongMahabang Baybay (Long Beach)PoblacionSugod
177475623496396379384462319392401918
2172
103903827472925552767
11.915.216.518.19.67.1
12.26.37.8
14.06.77.3
001101102210
00
0.10.10
0.10.10
0.20.20.10

230
The Many Faces of Poverty (Volume 9)
Table 5. Unemployment and Victims of Crime Indicators, by Barangay,Province of Romblon, 2015-2016
Unemployment rate(15 years old and above)
Persons who are victims of crimesNumber of persons in thelabor force
(15 years old and above)
BarangayMunicipality
ProportionProportion MagnitudeMagnitude
584421
1098350836
5377682918
9.118.36.28.32.2
81100
0.50.10.000
376666499192175309
2463616641
0.56.97.28.33.4
13.3
010000
00.00000
SAN JOSE BusayCombotLanasPinamihaganPoblacion (Agcogon)
SANTA FE AgmanicCanyayoDanao NorteDanao SurGuinbirayanGuintigbasanMagsaysayMat-iPandanPoblacionTabugon
SANTA MARIA BongaConcepcion Norte (Pob.)Concepcion SurParoyhogSan IsidroSanto Niño
464486289186447232389324369601538
2126659
152615174528
4.55.32.12.72.06.56.74.64.67.55.2
01000103000
00.1000
0.10
0.3000

The Many Faces of Poverty (Volume 9)
231
CBMS Poverty Maps: Province of Romblon
Map 31. CBMS Composite Indicator, by Municipality, 2015-2016
Map 32. CBMS Composite Indicator, by Barangay, 2015-2016
AverageMunicipality
BANTONCAJIDIOCANSAN FERNANDOMAGDIWANGSAN AGUSTINCALATRAVASANTA MARIAFERROLSAN JOSECONCEPCIONALCANTARACORCUERAROMBLONLOOCSANTA FE
2.52.42.32.12.01.81.81.71.71.61.61.51.51.41.4
Barangay AverageMunicipality
Bottom 10 Barangays
CAJIDIOCANSAN FERNANDOSAN JOSEMAGDIWANGBANTONBANTONBANTONBANTONLOOCCAJIDIOCAN
AlibagonOtodCombotAmbulongNasunoganYabawonTogbonganBalogoPiliLumbang Weste
3.63.13.02.92.92.92.82.82.82.8
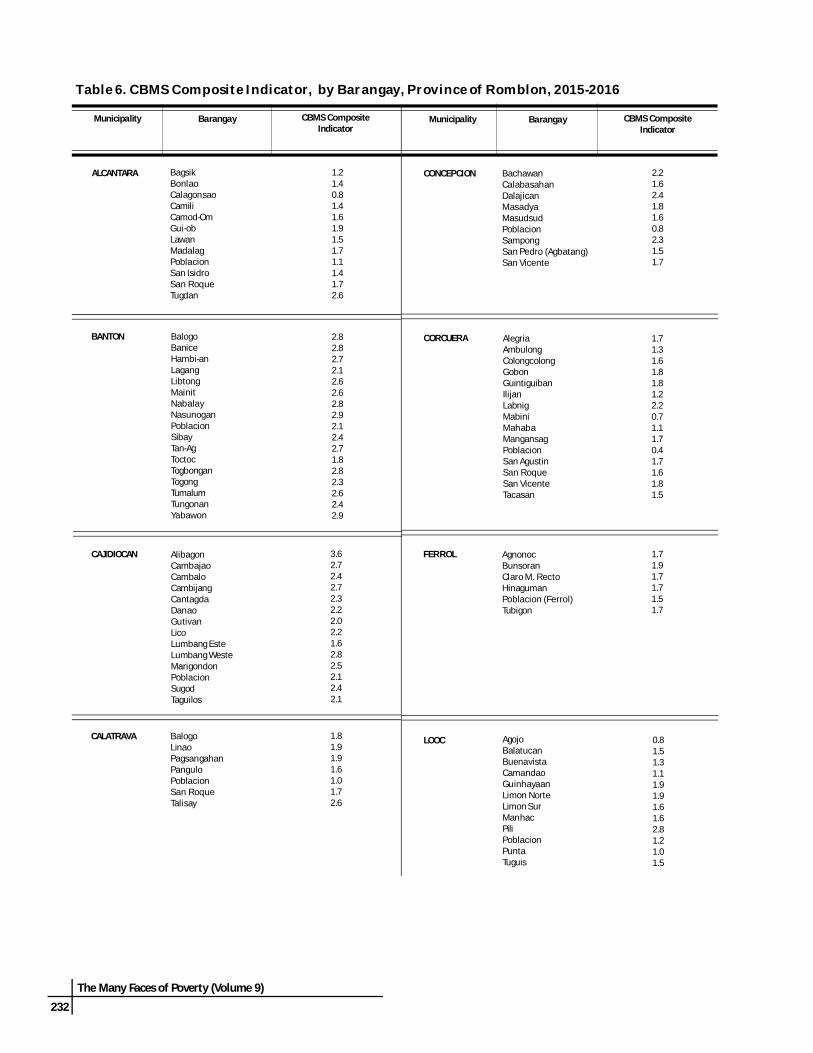
232
The Many Faces of Poverty (Volume 9)
Table 6. CBMS Composite Indicator, by Barangay, Province of Romblon, 2015-2016
BarangayMunicipality Barangay CBMS CompositeIndicator
Municipality
1.21.40.81.41.61.91.51.71.11.41.72.6
2.21.62.41.81.60.82.31.51.7
2.82.82.72.12.62.62.82.92.12.42.71.82.82.32.62.42.9
1.81.91.91.61.01.72.6
CBMS CompositeIndicator
ALCANTARA BagsikBonlaoCalagonsaoCamiliCamod-OmGui-obLawanMadalagPoblacionSan IsidroSan RoqueTugdan
BANTON BalogoBaniceHambi-anLagangLibtongMainitNabalayNasunoganPoblacionSibayTan-AgToctocTogbonganTogongTumalumTungonanYabawon
CAJIDIOCAN AlibagonCambajaoCambaloCambijangCantagdaDanaoGutivanLicoLumbang EsteLumbang WesteMarigondonPoblacionSugodTaguilos
CALATRAVA BalogoLinaoPagsangahanPanguloPoblacionSan RoqueTalisay
CONCEPCION BachawanCalabasahanDalajicanMasadyaMasudsudPoblacionSampongSan Pedro (Agbatang)San Vicente
CORCUERA AlegriaAmbulongColongcolongGobonGuintiguibanIlijanLabnigMabiniMahabaMangansagPoblacionSan AgustinSan RoqueSan VicenteTacasan
FERROL AgnonocBunsoranClaro M. RectoHinagumanPoblacion (Ferrol)Tubigon
LOOC AgojoBalatucanBuenavistaCamandaoGuinhayaanLimon NorteLimon SurManhacPiliPoblacionPuntaTuguis
3.62.72.42.72.32.22.02.21.62.82.52.12.42.1
1.71.31.61.81.81.22.20.71.11.70.41.71.61.81.5
1.71.91.71.71.51.7
0.81.51.31.11.91.91.61.62.81.21.01.5

The Many Faces of Poverty (Volume 9)
233
Table 6. CBMS Composite Indicator, by Barangay, Province of Romblon, 2015-2016
BarangayMunicipality Barangay CBMS CompositeIndicator
Municipality
1.83.02.11.50.9
1.31.42.51.21.11.31.11.71.50.50.90.80.91.32.61.22.21.21.12.22.01.31.31.11.81.41.21.52.51.11.5
CBMS CompositeIndicator
SAN JOSE BusayCombotLanasPinamihaganPoblacion (Agcogon)
SANTA FE AgmanicCanyayoDanao NorteDanao SurGuinbirayanGuintigbasanMagsaysayMat-iPandanPoblacionTabugon
SANTA MARIA BongaConcepcion Norte (Pob.)Concepcion SurParoyhogSan IsidroSanto Niño
ROMBLON AgbalutoAgbudiaAgnagaAgnayAgnipaAgpanabatAgtongoAladBagacayBarangay I (Pob.)Barangay II (Pob.)Barangay III (Pob.)Barangay IV (Pob.)CajimosCalabogoCapaclanCobrador (Naguso)GinablanGuimpinganIlauranLamaoLi-oLogbonLonosLunasMacalasMapulaPaljeSablayanSawangTambac
1.02.71.61.01.21.41.11.81.61.31.0
2.11.61.91.42.41.6
2.52.31.71.82.11.42.01.92.22.12.02.51.91.12.3
SAN AGUSTIN BachawanBinongahanBinugusanBuliCabolutanCagbuayaCamantayaCarmenCawayanDoña JuanaDubdubanLusongMahabang Baybay (Long Beach)PoblacionSugod
2.12.51.92.52.02.22.13.12.12.11.22.5
SAN FERNANDO AgtiwaAzargaCampalingoCanjalonEspañaMabiniMabuloOtodPanangcalanPiliPoblacionTaclobo
1.91.72.92.71.82.02.02.22.0
AgsaoAgutayAmbulongDulanganIpilJao-asanPoblacionSilumTampayan
MAGDIWANG

234
The Many Faces of Poverty (Volume 9)

Republic of the PhilippinesPROVINCE OF TARLAC
Message
SUSAN YAP Governor
-My warmest congratulations to the men and women of the Community BasedMonitoring System [CBMS] Network. The launching of the ninth (9th) volume is atestament of the publication’s success in promulgating information to reduce povertyand foster evidence-based governance.
The data from CBMS is vital for the Province of Tarlac in achieving its goal ongood governance, particularly in poverty reduction. The information gathered in thegrassroots level is instrumental in addressing various challenges in local planningand budgeting, poverty monitoring, disaster-risk reduction management and impact-monitoring among other concerns.
Furthermore, the CBMS census data of Tarlac paved the way for key policiesand programs of the government in providing better opportunities and achieving abetter quality of life particularly among the poor and vulnerable sectors of thepopulation (e.g. women, children, persons with disabilities [PWDs]).
Our thrust has always been Tao Muna where the priority is the upliftment ofevery Tarlaqueño. Our mantra has always been to provide basic necessities andservices to the poor and to remove them from the intergenerational cycle of poverty.
Our goal is for Inclusive Growth and that no Tarlaqueño is left behind,characterized by people’s involvement in good governance, responsible leadership,sustainable development, and equal access to opportunities for all. In our province,we prioritize human capital development focusing on Food, Health, Education,Livelihood, and Environment.
We have to think freely. We have to open up to endless possibilities. We haveto engage ourselves for further partnerships. We aim to establish a progressiveprovince where socio-economic activities are anchored on empowerment andpeople’s participation. We mark this year as the continuation of grassroots datagathering through statistical tables and poverty maps that will provide acomprehensive picture of the different faces of poverty in our province. Thus, throughthis publication, local executives, local planners, and other development practitionerscan be accurately guided in identifying the poor so we can effectively address theirconcerns.
I urge you to continue with your prolific work and further enrich your partnershipwith the government in pursuing economic prosperity.
Again, my warmest congratulations and Mabuhay!

MAYORS OF TARLAC
HON. BETTY LACBAYAN(Municipality of Anao)
HON. JOSE ANTONIO FELICIANO(Municipality of Bamban)
HON. ERLON AGUSTIN(Municipality of Camiling)
HON. REYNALDO CATACUTAN(Municipality of Capas)

MAYORS OF TARLAC
HON. ANDRES LACSON(Municipality of Concepcion)
HON. ELOY ECLAR(Municipality of Gerona)
HON. MICHAEL MANUEL(Municipality of La Paz)
HON. ILUMINADO POBRE, JR.(Municipality of Mayantoc)

MAYORS OF TARLAC
HON. ESTELITA AQUINO(Municipality of Moncada)
HON. LEONARDO ROXAS(Municipality of Paniqui)
HON. CONCEPCION ZARATE(Municipality of Pura)
HON. DIOSDADO REGINALDO(Municipality of Ramos)

MAYORS OF TARLAC
HON. ELMA MACADAMIA(Municipality of San Clemente)
HON. JOSE YAP, JR.(Municipality of San Jose)
HON. BENJAMIN TESORO(Municipality of San Manuel)
HON. NORA MODOMO(Municipality of Santa Ignacia)

MAYORS OF TARLAC
HON. MARVIN SILAO(Municipality of Victoria)

The Many Faces of Poverty (Volume 9)
241
The Many Faces of Poverty in theProvince of Tarlac
Tarlac had a total population of 747,182 covering 198,296 householdsThe CBMS census conducted from 2014 to 2017 covered 17 municipalities in the province, namely, Anao, Bamban,Camiling, Capas, Concepcion, Gerona, La Paz, Mayantoc, Moncada, Paniqui, Pura, Ramos, San Clemente, San Jose, SanManuel, Santa Ignacia, and Victoria, with 430 barangays. Of the 747,182 locals, 50.7 percent are male, while 49.3percent are female. The Municipality of Concepcion has the largest population with 129,624 members (or 17.3%) in32,156 households, followed by Capas with 96,400 members (or 12.9%) in 25,811 households.
HEALTH AND NUTRITIONTwo in every 1000 children under five years old diedAbout 0.2 percent of children under five years old died duringthe reference period. This is equivalent to 109 child deaths inthe province. The proportion of child deaths among boys washigher than girls, at 0.2 percent and 0.1 percent, respectively.The highest proportion of child deaths was reported in theMunicipality of Victoria where 0.3 percent of children underfive years old died. Concepcion, on the other hand, rankedfirst in terms of magnitude, with 21 cases of child deaths.Across all the barangays, Barangay Poblacion in Anaoregistered the highest proportion of child deaths at 9.1percent. This was followed by Barangay Manupeg in Camilingat 2.8 percent, and Barangay Poblacion J, also in Camiling, at2.5 percent.
The 2014-2017 CBMS Census covers 17 municipalities in the Province of Tarlac, namely, Anao, Bamban, Camiling, Capas,Concepcion, Gerona, La Paz, Mayantoc, Moncada, Paniqui, Pura, Ramos, San Clemente, San Jose, San Manuel, Santa Ignacia,and Victoria.
POPULATION

242
The Many Faces of Poverty (Volume 9)
One in every 1000 pregnant women died due to pregnancy-related causesAccording to the results of the CBMS census, 0.1 percent of pregnant women aged 15-49 in the Province of Tarlac dieddue to pregnancy-related causes during the reference period. The highest proportion of maternal deaths was observedin San Manuel at 1.1 percent. Meanwhile, at the barangay level, Barangay Taldiapan in Mayantoc had the highestproportion of maternal deaths at 20 percent.
Around 6 in every 1000 children zero to five years old weremalnourishedAround 0.6 percent or 506 children zero to five years oldwere classified as moderately or severely underweight in theProvince of Tarlac. In particular, 289 boys and 217 girls zeroto five years old were considered malnourished. Malnutritionprevalence among girls was lower than boys, at 0.5 percentand 0.6 percent, respectively. The highest prevalence ofmalnutrition was observed in Paniqui at 2 percent, followedby La Paz at 1.3 percent. Barangay Barang in Paniqui reportedthe highest proportion of malnourished children at 19.7percent (12 cases). This was followed by BarangayColibangbang and Barangay San Juan de Valdez, at 17.1percent (12 cases) and 9.6 percent (14 cases), respectively.
HOUSINGAbout 2 percent of households were living in makeshift housing while 4.2 percent were informal settlersThe 2014-2017 CBMS data showed that 2 in every 100 households in the province were living in makeshift housing.First in terms of proportion was the Municipality of La Paz, with about 5.5 percent or 525 households living in makeshifthousing. Second was Ramos at 4.1 percent or 184 households, while third was Camiling at 3.7 percent or 574 households.At the barangay level, Barangay Batangbatang in Victoria had the highest proportion of households living in makeshifthousing at 31.5 percent or 94 households. This was followed by Barangay Caramutan in La Paz at 12.5 percent or 55households.
In terms of tenure status, 8,391 households or 4 in every 100 households in the province were considered informalsettlers. The highest proportion of informal settlers was observed in the Municipality of San Jose at 30.6 percent with2,219 cases, also the highest number of informal settlers across all municipalities. This was followed by the Municipalityof Capas at 6.3 percent with 1,618 cases. At the barangay level, the highest proportion of informal settlers wasobserved in Barangay Maamot in San Jose at 100 percent (705 households), closely followed by Barangay Pao, also inSan Jose, at 99.7 percent (379 households).

The Many Faces of Poverty (Volume 9)
243
WATER AND SANITATIONAbout 3.5 percent of the households do not have access to safe water supply and about 2.1 percent do not have accessto sanitary toilet facilitiesBased on the results of the CBMS census, 4 in every 100 households in Tarlac had no access to safe water supply. TheMunicipality of San Clemente had the worst condition in terms of water accessibility as 16.4 percent of its householdswere reported to have no access to safe water supply during the reference period. This was closely followed by Mayantocwith 15.6 percent, and La Paz with 12.7 percent. In terms of magnitude, La Paz ranked first with 1,222 cases. Meanwhile,Barangay Maasin in San Clemente reported the highest proportion of households without access to safe water supplyat 61.3 percent or 234 cases. Of the 435 barangays, 2 can be considered “waterless”1.
On the other hand, 2.1 percent of the households do not have access to sanitary toilet facilities. This means that around2 in every 100 households in the province lacked access to sanitary toilet facilities. The Municipality of San Manuelreported the highest proportion of sanitation poor households at 7.3 percent or 303 households, followed by San Joseat 6.3 percent or 455 households. Meanwhile, at the barangay level, the highest proportion of sanitation poor householdswas observed in Barangay Caturay at 45.7 percent or 126 cases, followed by Barangay Santa Lucia at 45.5 percent or81 cases.
1 “Waterless” barangays refer to barangays with less than 50 percent safe water supply coverage, as defined by the SALINTUBIG Programof the Department of Health (DOH).

244
The Many Faces of Poverty (Volume 9)
BASIC EDUCATIONAbout 3 in every 100 children 6 to 15 years old were notattending schoolThe proportion of out-of-school children 6-15 years old was3.3 percent. Regardless of education level, 3 in every 100children 6-15 years old were not attending school. Further,results revealed that 8.6 percent of children 6-11 years oldwere not attending elementary school, while 25.9 percent ofchildren 12-15 years old were not attending high school.Results also showed that the proportion of out-of-schoolchildren among boys (4.1%) was higher compared to girls(2.6%). Out of 17 municipalities, San Jose had the highestproportion of out-of-school children 6-15 years old at 6.6percent. Concepcion was second highest at 4.1 percent,followed by Santa Ignacia at 4 percent. Meanwhile, in termsmagnitude, Concepcion had the highest number of out-ofschool children 6-15 years old, with 1,083 cases observed.
INCOME AND LIVELIHOODAbout 53 in every 100 households were living below thepoverty thresholdMore than half or 53.3 percent of the households in theprovince were considered income poor, which means thataround 53 in every 100 households have no sufficientincome to satisfy their basic food and non-food needs. Only4 out of 17 municipalities, namely, Paniqui, Bamban,Concepcion and Capas, reported an income poverty ratebelow 50 percent. La Paz had the highest proportion ofhouseholds living below poverty threshold at 78.2 percent,followed by San Jose at 74 percent. Across all barangays inthe province, the highest proportion of income poorhouseholds was observed in Barangay Dicolor in Geronaat 98.2 percent, closely followed by Barangay David in SanJose at 97.3 percent.
About 42 in every 100 households had no sufficientincome to satisfy their food needsAccording to the CBMS data, 41.5 percent of thehouseholds in Tarlac were living below the food threshold.Subsistence incidence was most prevalent in La Paz where69.4 percent of the households were food poor.Meanwhile, with 9,556 cases, Concepcion had the highestnumber of food poor households. Barangay Dicolor inGerona recorded the highest incidence of subsistence at96.7 percent, followed by Barangay David in San Jose at96.3 percent, and Barangay Sembrano, also in Gerona, at90.4 percent.

The Many Faces of Poverty (Volume 9)
245
Two in every 100 households experienced hunger due tofood shortageAround 1.9 percent of the households in the provincesuffered from hunger during the three-month periodbefore the census. Hunger due to food shortage was mostprevalent in the Municipality of Victoria at 9.3 percent or1,283 cases. Next to Victoria was Camiling with aproportion of 2.9 percent or 455 cases. Across all thebarangays, the highest proportion of households thatexperienced hunger due to food shortage was observedin Barangay Cruz in Victoria at 84.2 percent, followed byBarangay Bueno in Capas at 68.8 percent, and BarangaySanta Lucia in Gerona at 43.8 percent.
Unemployment rate in the province was recorded at 8 percentAbout 8 percent or 19,433 individuals of the 241,988 membersof the labor force aged 15 and above were reported to beunemployed. It appears that the unemployment rate was higheramong females at 10.1 percent than among males at 7.3percent. Unemployment was most prevalent in Mayantocwhere 14.8 percent or 1,280 members of the labor force wereunemployed during the reference period. This was followed bySan Jose at 14.1 percent or 1,042 cases, and Bamban at11.4 percent or 1,582 cases. Across all barangays, BarangayMaamot in San Jose recorded the highest unemployment rateat 96.2 percent, followed by Barangay Talimunduc San Miguelin Concepcion at 49.9 percent, and Barangay Nagmisaan inPaniqui at 44.7 percent.
PEACE AND ORDERAround 2 in every 10000 people were victims of crimeAround 0.02 percent of the population or 161 individuals in the Province of Tarlac were reported to be victims of crime.Concepcion and Camiling reported the highest number of crime victims with 27 cases, followed by Gerona with 21cases. At the barangay level, Barangay Bobon 2nd in Camiling recorded the highest proportion of crime victims at 0.6percent (7 cases). This was followed by Barangay Dungan at 0.4 percent (4 cases).
CBMS COMPOSITE INDEXHouseholds in the Province of Tarlac suffered from one deprivation2 on the averageThe Province of Tarlac recorded a CBMS composite index (CCI) of 1.1, which means that households in the provincewere not able to meet the 13 basic needs and suffered from 1 deprivation, on the average. In particular, households inSan Jose, La Paz, Mayantoc, San Clemente, and Victoria were not able to meet 2 of the 13 basic needs, on the average.The highest incidence of deprivation was observed in 5 barangays, namely, Maamot, Caturay, Cruz, Pao, and Bueno,with 3 unmet needs, on the average.
2 The deprivations are based on the 13+1 indicators: (1) children under 5 years old who died; 2) women who died due to pregnancy-related causes; (3) malnourished children 0-5 years old; (4) households living in makeshift housing ; 5) households who are informalsettlers; (6) households without access to safe water supply; (7) households without access to sanitary toilet facilities; (8) children 6-15years old not in school; (9) households with income below the poverty threshold; (10) households with income below the food threshold;(11) households that experienced food shortage; (12) unemployment; and (13) victims of crime. A high er index would mean moredeprivation and hence, worse condition for the households.

246
The Many Faces of Poverty (Volume 9)
DIMENSIONS OF POVERTY3
Based on the CBMS data, around 48.6 percent of all households are non-poorwhile 51.4 percent of households were poor in at least one dimension. Inparticular, about 40.5 percent or 96,313 households in the province werepoor in one dimension, while 9.3 percent or 18,428 households were poor intwo dimensions. Meanwhile, 1.4 percent or 2,698 households were poor inthree dimensions.
DIMENSIONS OF POVERTY IN TARLAC
Number ofDimensions
Proportion ofHouseholds
Total 51.4
1234567
40.59.31.40.20.00.00.0
0.2 0.62.0
4.2
3.52.13.341.5
8.0 00.0
10.0
20.0
30.0
40.0
50.0
60.0Health Poor
Nutrition Poor
Housing Poor
Tenure Poor
Water Poor
Sanitation Poor
Education Poor
Income Poor
Job Poor
Security Poor
3 From the 13+1 CBMS core indicators, one indicator is selected to determine whether a household is poor in a particular dimension: 1)children aged under 5 years old who died for health, 2) malnourished children 0-5 years old for nutr ition, 3) households living inmakeshift houses for housing, 4) households who are informal settlers for tenure, 5) households without access to safe water supply forwater, 6) households without access to sanitary toilet facilities for sanitation, 7) children aged 6-15 years not in school for education, 8)households with income below the food threshold for income, 9) unemployment for job, and 10) victims of crime for security.

The Many Faces of Poverty (Volume 9)
247
The Many Faces of Poverty inthe Province of Tarlac
INDICATOR
DEMOGRAPHYPopulationAverage household sizeChildren under 1 year oldChildren under 5 years oldChildren 0-5 years oldChildren 6-11 years oldMembers 12-15 years oldMembers 6-15 years oldMembers 10 years old and aboveMembers of the labor force
HEALTH AND NUTRITIONChildren under 5 years old who diedWomen who died due to pregnancy related-causesMalnourished children 0-5 years old
HOUSINGHouseholds living in makeshift housingHouseholds who are informal settlers
WATER AND SANITATIONHouseholds without access to safe water supplyHouseholds without access to sanitary toilet facilities
BASIC EDUCATIONChildren 6-11 years old not attending elementary schoolChildren 12-15 years old not attending high schoolChildren 6-15 years old not attending school
INCOME AND LIVELIHOODHouseholds with income below the poverty thresholdHouseholds with income below the food thresholdHouseholds who experienced hunger due to food shortageUnemployment rate (15 years old and above)
PEACE AND ORDERVictims of crime
Magnitude
198,2964
3,876 8,391
7,020 4,174
105,73982,264
3,724
Proportion
2.04.2
3.52.1
53.341.51.9
Households Population
CBMS Core Indicators, Province of Tarlac, 2014-2017
ProportionMagnitude
13,74771,900
87,162 92,361 59,453
151,814 597,775 241,988
747,182
109 15
506
7,90615,418
5,085
8.625.9
3.3
158 0.02
0.20.10.6
19,433 8.0
CBMS Composite Indicator, Province of Tarlac, 2014-2017
CBMS Composite IndicatorAverage
1.1
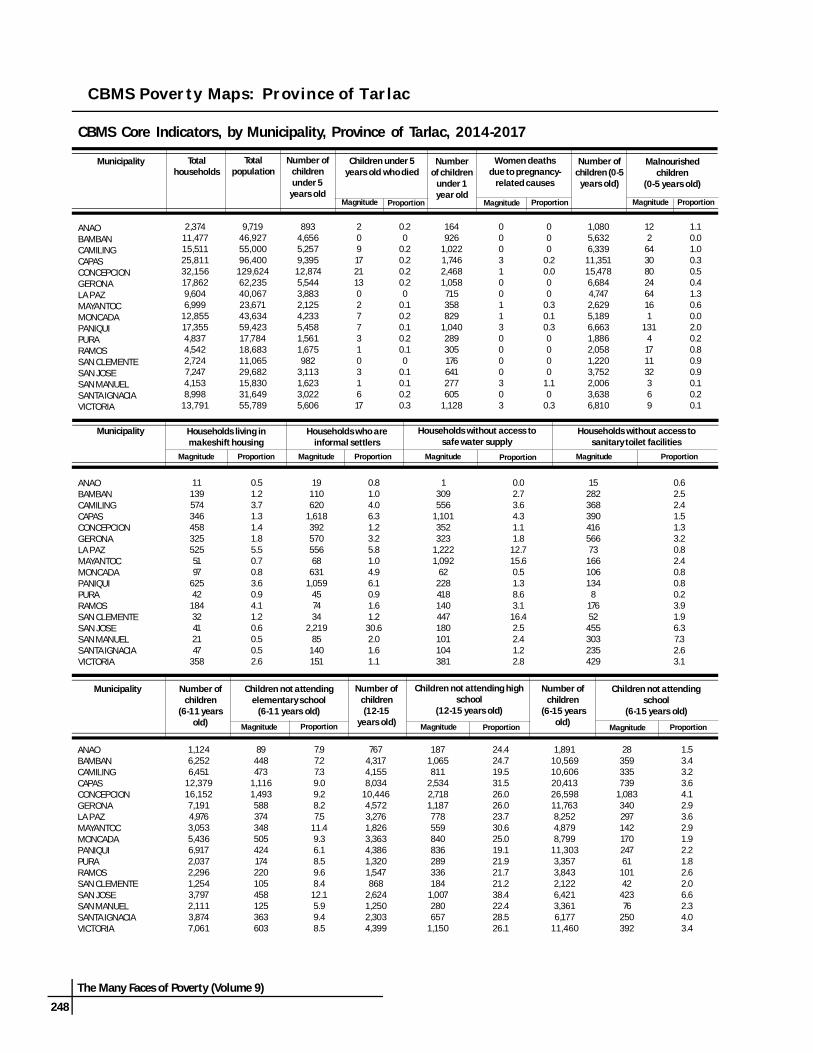
248
The Many Faces of Poverty (Volume 9)
CBMS Core Indicators, by Municipality, Province of Tarlac, 2014-2017
Number ofchildren
(6-11 yearsold)
Children not attendingelementary school
(6-11 years old)
Children not attending highschool
(12-15 years old)
Number ofchildren(12-15
years old)
Number ofchildren
(6-15 yearsold)
Children not attendingschool
(6-15 years old)
Municipality
ProportionProportionProportion MagnitudeMagnitudeMagnitude
Households living inmakeshift housing
Households who areinformal settlers
Households without access tosafe water supply
Households without access tosanitary toilet facilities
Municipality
ProportionProportion ProportionProportion MagnitudeMagnitudeMagnitudeMagnitude
ANAOBAMBANCAMILINGCAPASCONCEPCIONGERONALA PAZMAYANTOCMONCADAPANIQUIPURARAMOSSAN CLEMENTESAN JOSESAN MANUELSANTA IGNACIAVICTORIA
111395743464583255255197
62542
18432412147
358
0.51.23.71.31.41.85.50.70.83.60.94.11.20.60.50.52.6
19110620
1,61839257055668
6311,059
457434
2,21985
140151
1528236839041656673
166106134
817652
455303235429
0.62.52.41.51.33.20.82.40.80.80.23.91.96.37.32.63.1
0.81.04.06.31.23.25.81.04.96.10.91.61.2
30.62.01.61.1
1309556
1,101352323
1,2221,092
62228418140447180101104381
0.02.73.64.31.11.8
12.715.60.51.38.63.1
16.42.52.41.22.8
Municipality Totalhouseholds
Number ofchildren (0-5
years old)
Malnourishedchildren
(0-5 years old)
Children under 5years old who died
Numberof children
under 1year old
Women deathsdue to pregnancy-
related causes
Totalpopulation
ProportionProportion Proportion MagnitudeMagnitudeMagnitude
Number ofchildrenunder 5
years old
ANAOBAMBANCAMILINGCAPASCONCEPCIONGERONALA PAZMAYANTOCMONCADAPANIQUIPURARAMOSSAN CLEMENTESAN JOSESAN MANUELSANTA IGNACIAVICTORIA
2,37411,47715,51125,81132,15617,8629,6046,999
12,85517,3554,8374,5422,7247,2474,1538,998
13,791
9,71946,92755,00096,400
129,62462,23540,06723,67143,63459,42317,78418,68311,06529,68215,83031,64955,789
8934,6565,2579,39512,8745,5443,8832,1254,2335,4581,5611,675982
3,1131,6233,0225,606
1,0805,6326,339
11,35115,4786,6844,7472,6295,1896,6631,8862,0581,2203,7522,0063,6386,810
122
6430802464161
1314171132369
1.10.01.00.30.50.41.30.60.02.00.20.80.90.90.10.20.1
209172113027731031617
0.20
0.20.20.20.20
0.10.20.10.20.10
0.10.10.20.3
164926
1,0221,7462,4681,058715358829
1,040289305176641277605
1,128
00031001130000303
000
0.20.000
0.30.10.30000
1.10
0.3
ANAOBAMBANCAMILINGCAPASCONCEPCIONGERONALA PAZMAYANTOCMONCADAPANIQUIPURARAMOSSAN CLEMENTESAN JOSESAN MANUELSANTA IGNACIAVICTORIA
1,1246,2526,451
12,37916,1527,1914,9763,0535,4366,9172,0372,2961,2543,7972,1113,8747,061
89448473
1,1161,493588374348505424174220105458125363603
7.97.27.39.09.28.27.5
11.49.36.18.59.68.4
12.15.99.48.5
1,89110,56910,60620,41326,59811,7638,2524,8798,799
11,3033,3573,8432,1226,4213,3616,177
11,460
28359335739
1,08334029714217024761
10142
42376
250392
1.53.43.23.64.12.93.62.91.92.21.82.62.06.62.34.03.4
7674,3174,1558,034
10,4464,5723,2761,8263,3634,3861,3201,547868
2,6241,2502,3034,399
1871,065811
2,5342,7181,187778559840836289336184
1,007280657
1,150
24.424.719.531.526.026.023.730.625.019.121.921.721.238.422.428.526.1
CBMS Poverty Maps: Province of Tarlac

The Many Faces of Poverty (Volume 9)
249
Households with income below the povertythreshold
Households with income below the foodthreshold
Households who experienced hunger duefood shortage
Municipality
Proportion Proportion ProportionMagnitudeMagnitudeMagnitude
Unemployment rate(15 years old and above)
Persons who are victimsof crimes
Number of persons in thelabor force
(15 years old and above)
Municipality CBMSCompositeIndicatorProportionProportionMagnitude Magnitude
ANAOBAMBANCAMILINGCAPASCONCEPCIONGERONALA PAZMAYANTOCMONCADAPANIQUIPURARAMOSSAN CLEMENTESAN JOSESAN MANUELSANTA IGNACIAVICTORIA
1,2674,8449,6458,113
13,46210,3537,5104,5798,0408,3772,7752,6291,8185,3662,4905,7328,739
53.442.262.231.441.958.078.265.462.548.357.457.966.774.060.063.763.4
611
45550026918712419514116432179
8020
2311283
0.30.12.91.90.81.01.32.81.10.90.70.40.31.10.52.69.3
9463,6227,8055,2699,5568,4546,6653,7656,3815,7762,2032,0471,5024,4671,8914,7067,209
39.831.650.320.429.747.369.453.849.633.345.545.155.161.645.552.352.3
ANAOBAMBANCAMILINGCAPASCONCEPCIONGERONALA PAZMAYANTOCMONCADAPANIQUIPURARAMOSSAN CLEMENTESAN JOSESAN MANUELSANTA IGNACIAVICTORIA
3,42613,92116,00432,87043,94519,94211,9058,677
14,64620,8904,9686,4293,6067,3764,3809,986
19,017
1521,582815
2,9732,8821,271992
1,280903
1,770393472323
1,042391917
1,275
0.00
0.00.00.00.00.00.00.00.00.00
0.00.00.00.00.0
1.01.01.40.80.91.21.81.61.31.01.21.31.51.91.31.41.5
4.411.45.19.06.66.48.3
14.86.28.57.97.39.0
14.18.99.26.7
30
2717272186
11440263217
CBMS Core Indicators, by Municipality, Province of Tarlac, 2014-2017
CBMS Poverty Maps: Province of Tarlac

250
The Many Faces of Poverty (Volume 9)
Map 1. Proportion of Children under 5 Years Old who Died,by Municipality, 2014-2017
Map 2. Proportion of Children under 5 Years Old who Died,by Barangay, 2014-2017
Barangay Magnitude ProportionMunicipality
Bottom 10 Barangays
ANAOCAMILINGCAMILINGMAYANTOCCONCEPCIONVICTORIAMONCADAVICTORIASAN MANUELCAMILING
PoblacionManupegPoblacion JBaybayaoasDunganBantogSanta MonicaSan Gavino (Pob.)MatarannocBirbira
2111232311
9.12.82.52.41.91.61.51.51.41.3
Magnitude ProportionMunicipality
VICTORIAANAOCAMILINGCAPASCONCEPCIONGERONAMONCADAPURASANTA IGNACIAMAYANTOCPANIQUIRAMOSSAN JOSESAN MANUELBAMBANLA PAZSAN CLEMENTE
172917211373627131000
0.30.20.20.20.20.20.20.20.20.10.10.10.10.1000
CBMS Poverty Maps: Province of Tarlac

The Many Faces of Poverty (Volume 9)
251
Map 4. Proportion of Women who Died Due to Pregnancy-Related Causes,by Barangay, 2014-2017
Map 3. Proportion of Women who Died Due to Pregnancy-Related Causes,by Municipality, 2014-2017
CBMS Poverty Maps: Province of Tarlac
Barangay Magnitude ProportionMunicipalityBottom 10 Barangays
MAYANTOCSAN MANUELSAN MANUELPANIQUIVICTORIASAN MANUELMONCADAVICTORIAPANIQUIPANIQUI
TaldiapanMatarannocPacpacoAcocolaoSan Gavino (Pob.)San MiguelLapsingSan Fernando (Pob.)NancamarinanSamput
1111211111
20.08.36.25.94.94.83.33.22.91.7
Magnitude ProportionMunicipality
SAN MANUELVICTORIAMAYANTOCPANIQUICAPASMONCADACONCEPCIONANAOCAMILINGGERONAPURASANTA IGNACIARAMOSSAN JOSEBAMBANLA PAZSAN CLEMENTE
33133110000000000
1.10.30.30.30.20.10.00000000000

252
The Many Faces of Poverty (Volume 9)
Map 5. Proportion of Children 0-5 Years Old who are Malnourished,by Municipality, 2014-2017
Map 6. Proportion of Children 0-5 Years Old who are Malnourished,by Barangay, 2014-2017
Barangay Magnitude ProportionMunicipality
Bottom 10 Barangays
PANIQUIPANIQUISAN JOSECONCEPCIONGERONACAMILINGPANIQUIPANIQUIANAOSAN CLEMENTE
Barang (Borang)ColibangbangSan Juan de ValdezParangRizalSinilian 1stAbogadoManaoisDon RamonBamban
12121434139
31526
19.717.19.69.58.98.07.56.35.65.3
Magnitude ProportionMunicipality
PANIQUILA PAZANAOCAMILINGSAN JOSESAN CLEMENTERAMOSMAYANTOCCONCEPCIONGERONACAPASPURASANTA IGNACIASAN MANUELVICTORIAMONCADABAMBAN
13164126432111716802430463912
2.01.31.11.00.90.90.80.60.50.40.30.20.20.10.10.00.0
CBMS Poverty Maps: Province of Tarlac

The Many Faces of Poverty (Volume 9)
253
Table 1. Health and Nutrition Indicators, by Barangay, Province of Tarlac, 2014-2017
ANAO Baguindoc (Baguinloc)BantogCamposCarmenCasiliDon RamonHernandoPoblacionRizalSan Francisco EastSan Francisco WestSan Jose NorthSan Jose SouthSan JuanSan RoqueSanto DomingoSinenseSuaverdez
BAMBAN AnupulBanabaBangcuCulubasaDela CruzLa PazLourdesMalonzoSan Nicolas (Pob.)San PedroSan RafaelSan RoqueSan VicenteSanto NiñoVirgen de los Remedios(Pacalcal)
40462263913637318348
105515031
10831
104103
000102012020111100
000
1.60
5.60
3.22.40
1.90
2.03.20.93.200
333919517231282065408744422693299084
000000020000000000
0000000
9.10000000000
752
1119470
108
18993
145
1320
000000000000000000
000000000000000000
1,0084608659
294151588143570191190144215366191
1,23553210177
358194734165680232218186255439226
100000000000010
0.1000000000000
0.20
000000000000000
000000000000000
20494151060279738
108463524606840
000000000000000
000000000000000
Municipality Barangay Number ofchildren
(0-5years old)
Malnourishedchildren
(0-5 years old)
Proportion
Children under 5years oldwho died
Number ofchildrenunder 1year old
Women deaths due topregnancy-related
causes
Magnitude Magnitude Proportion Magnitude Proportion
Number ofchildrenunder 5years old
CAMILING Anoling 1stAnoling 2ndAnoling 3rdBacabacBacsayBancay 1stBancay 2ndBiladBirbiraBobon 1stBobon 2ndBobon CaarosipanCabanabaanCacamilingan NorteCacamilingan SurCaniagCaraelCayaoanCayasanFloridaLasongLibuegMalacampa
536480
21913010181
18678
205995368
1181946878
113198885
168262
6175
1052571531121002231012341156681
1372308493
13123
109101213315
0001001002112000000223
12
000
0.400
1.000
0.90.91.52.5000000
1.82.01.43.8
00001002100000000000000
0000
0.800
1.11.300000000000000
14151539242215387412010151940121717517173951
00000000000000000000000
00000000000000000000000

254
The Many Faces of Poverty (Volume 9)
Table 1. Health and Nutrition Indicators, by Barangay, Province of Tarlac, 2014-2017
CAMILING ManakemManupegMarawiMatubogNagrambacanPalimbo ProperPalimbo-CaarosipanPao 1stPao 2ndPao 3rdPapaacPindangan 1stPindangan 2ndPoblacion BPoblacion DPoblacion EPoblacion GPoblacion HPoblacion JSanta MariaSawatSinilian 1stSinilian 2ndSinilian 3rdSinilian CacalibosoanSinulatan 1stSinulatan 2ndSurgui 1stSurgui 2ndSurgui 3rdTambuganTelbangTuec
7044
13813045
103244754051
1011062281381592608748
15411811211910667
14557
1046688968390
000010010001
1110013200912002200000
0000
2.200
1.3000
0.94.80.700
1.73.44.2008
0.81.900
3.51.900000
61351171083479
2106234448592
1941131372506739
1189588
1039656
11443815773776473
011100100000000000100000000000000
02.80.80.900
0.500000000000
2.500000000000000
13623208173396819223519367181023221120219231316171420715
000000000000000000000000000000000
000000000000000000000000000000000
Municipality Barangay Number ofchildren
(0-5years old)
Malnourishedchildren
(0-5 years old)
Proportion
Children under 5years oldwho died
Number ofchildrenunder 1year old
Women deaths due topregnancy-related
causes
Magnitude Magnitude Proportion Magnitude Proportion
Number ofchildrenunder 5
years old
CAPAS ArangurenBuenoCristo ReyCubcub (Pob.)Cutcut 1stCutcut 2ndDoloresEstrada (Calingcuan)LawyMangaManlapigMarugluO’DonnellSanta JulianaSanta LuciaSanta RitaSanto Domingo 1stSanto Domingo 2ndSanto RosarioTalaga
540185
1,460239975365343264209196124236
1,116401
1,058172204335582391
670213
1,810293
1,148447404331240236156281
1,351482
1,273215238412699452
00
110000100004
11100011
00
0.60000
0.30000
0.32.30.1000
0.10.2
20301011000022400010
0.40
0.20
0.10
0.30.40000
0.20.50.4000
0.20
12142
2164517157715539321648
21070
239323657
12366
00000000000010100010
000000000000
0.50
0.4000
0.80

The Many Faces of Poverty (Volume 9)
255
GERONA AbagonAmacalanApsayanAysonBawaBuenlagBularitCalayaanCarbonelCardonaCaturayDanzoDicolorDon Basilio
271113170587190
2279483
2126714141
114
2991321957587
1032791161102578317554147
00000020000000
000000
0.70000000
10100020010100
0.40
0.6000
0.900
0.50
0.700
461834127
164418235312236
26
00000000000000
00000000000000
Table 1. Health and Nutrition Indicators, by Barangay, Province of Tarlac, 2014-2017
Municipality Barangay Number ofchildren
(0-5years old)
Malnourishedchildren
(0-5 years old)
Proportion
Children under 5years oldwho died
Number ofchildrenunder 1year old
Women deaths due topregnancy-related
causes
Magnitude Magnitude Proportion Magnitude Proportion
Number ofchildrenunder 5years old
CONCEPCION AlfonsoBalutuCafeCalius GuecoCaluluanCastilloCorazon de JesusCulatinganDunganDutung-A-MatasGreen VillageLilibanganMabilogMagaoMalupaMinanePanalicsian (Panalicsican)PandoParangParulungPitabunanSan Agustin (Murcia)San AntonioSan BartolomeSan FranciscoSan Isidro (Almendras)San Jose (Pob.)San Juan (Castro)San MartinSan Nicolas (Pob.)San Nicolas BalasSan Vicente (Caluis/Cobra)Santa CruzSanta MariaSanta MonicaSanta RitaSanta RosaSantiagoSanto CristoSanto NiñoSanto Rosario (Magunting)Talimunduc MarimlaTalimunduc San MiguelTelabancaTinang
60533324814038827120734010435422313723614716222113821529318828655930522359534190832826
286329200365171598412
138610944819816818091411
749418302172459318252421126435267158288179187279166255357223333682379258710405
1,07837634345403236441212695487
3483124544236211207111474
000000010100010311
341000003401040200100082110
10
0000000
0.20
0.2000
0.60
1.10.60.49.50.400000
0.70.40
2.90
1.00
0.500
0.2000
1.50.80.50.50
2.1
000100012000100000000221001000210100011002002
000
0.7000
0.31.9000
0.400000000
0.40.70.400
0.1000
0.60.50
0.6000
0.30.900
1.200
0.5
1386340337153404813624127412732402646434953
1015841
13653
166646
4869285836
137910
7918744131332193
000000000000000000000000000000000000000100000
000000000000000000000000000000000000000
1.300000

256
The Many Faces of Poverty (Volume 9)
LA PAZ BalanoyBantog-CaricutanCaramutanCautComillasDumaraisGuevarraKapanikianLa PurisimaLaraLaungcupangLomboyMacalongMatayumtayumMayangMotricoPaludpudRizalSan Isidro (Pob.)San Roque (Pob.)Sierra
11618319212134713827212426293
182340153155118134125119170392147
156237235155426164326147321114225405194191140159148138206477183
7201
110208343401041805
4.50.80
0.62.60
0.60
2.52.61.80.72.10
0.70
2.70.73.90
2.7
000000000000000000000
000000000000000000000
203337255125502046203263292620272424308033
000000000000000000000
000000000000000000000
Table 1. Health and Nutrition Indicators, by Barangay, Province of Tarlac, 2014-2017
Municipality Barangay Number ofchildren
(0-5years old)
Malnourishedchildren
(0-5 years old)
Proportion
Children under 5years oldwho died
Number ofchildrenunder 1year old
Women deaths due topregnancy-related
causes
Magnitude Magnitude Proportion Magnitude Proportion
Number ofchildrenunder 5years old
GERONA LunaMabiniMagaspacMalayepMatapitapMatayumcabNew SalemOloybuayaPadapadaParsolinganPinasling (Pinasung)PlastadoPoblacion 1Poblacion 2Poblacion 3QuezonRizalSalapunganSan AgustinSan AntonioSan BartolomeSan JoseSanta LuciaSantiagoSembranoSingatSulipaTagumbaoTangcaranVilla Paz
154149292174110124437059
18730413914555
14539
12311180
264417362
124306793
34865
122
195170348206138144498876
2323591641697018148146141100302559277140388210842387144
2000000102000000
130010000000030
1.0000000
1.10
0.9000000
8.900
0.300000000
3.40
010010000001000000020000000200
00.700
0.9000000
0.70000000
0.80000000
0.600
3928414013278
15103358233010229
22219
599
1312318
1217601922
000000000000000000000000000000
000000000000000000000000000000
MAYANTOC AmbalingitBaybayaoasBigbigaBinbinacaCalabtanganCaocaoayan
5041
131564829
6547
149666034
000200
000
3.000
010000
02.40000
111122845
000000
000000

The Many Faces of Poverty (Volume 9)
257
MONCADA Ablang-SapangAringinAtencioBanaoang EastBanaoang WestBaquero NorteBaquero SurBurgosCalamayCalapanCamangaan EastCamangaan WestCamposanto 1 - NorteCamposanto 1 - SurCamposanto 2CapaoayanLapsingMabiniMaluacPoblacion 1Poblacion 2Poblacion 3Poblacion 4RizalSan JuanSan JulianSan LeonSan PedroSan RoqueSanta Lucia EastSanta Lucia WestSanta MariaSanta MonicaTolega NorteTolega SurTubectubangVilla
28213233
10110211811211947
10275
10213413917322312416712495
138769795151151985694549188
13173
11117352
34816246
1251291471271515811793
11817317119926415020415511817692
11911619118311673
12067
11510616585
13920962
0000000000000000000000100000000000000
0000000000000000000000
0.800000000000000
0000100000000000001010100010000020000
0000
1.00000000000000
0.80
0.70
1.0000
1.000000
1.50000
62282
20121929238
1916232327324129352819191518183826201118102322231622296
0000000000000000100000000000000000000
0000000000000000
3.300000000000000000000
Table 1. Health and Nutrition Indicators, by Barangay, Province of Tarlac, 2014-2017
Municipality Barangay Number ofchildren
(0-5years old)
Malnourishedchildren
(0-5 years old)
Proportion
Children under 5years oldwho died
Number ofchildrenunder 1year old
Women deaths due topregnancy-related
causes
Magnitude Magnitude Proportion Magnitude Proportion
Number ofchildrenunder 5
years old
MAYANTOC CarabaoanCubcubGayonggayongGossoodLabneyMamonitManiniogMapandanNambalanPedro L. QuinesPitombayogPoblacion NortePoblacion SurRotrottoocSan BartolomeSan JoseTaldiapanTangcarang
499
2245
1301885494
14414112715321674907847
109
59123259
15224461
12917218116718425897
1159958
129
000050012000600000
0000
3.300
0.81.2000
2.300000
000000010000000000
0000000
1.10000000000
725
10222771714201933441519124
20
000000000000000010
0000000000000000
20.00

258
The Many Faces of Poverty (Volume 9)
PURA BaliteBuenavistaCadanglaanEstiponaLinaoMaasinMatindegMaungibNayaNilasin 1stNilasin 2ndPoblacion 1Poblacion 2Poblacion 3PorocSingat
11617958
30511842965284508459545374
137
1422137137113452
11269
102639770686687
169
0003000000010000
000
0.80000000
1.40000
0002000000100000
000
0.7000000
1.200000
21341058269
19988
187
14141123
0000000000000000
0000000000000000
Table 1. Health and Nutrition Indicators, by Barangay, Province of Tarlac, 2014-2017
Municipality Barangay Number ofchildren
(0-5years old)
Malnourishedchildren
(0-5 years old)
Proportion
Children under 5years oldwho died
Number ofchildrenunder 1year old
Women deaths due topregnancy-related
causes
Magnitude Magnitude Proportion Magnitude Proportion
Number ofchildrenunder 5years old
PANIQUI AbogadoAcocolaoAduasApulidBalaoangBarang (Borang)BrillanteBurgosCabayaoasanCananCarinoCayangaColibangbangCoralDapdapEstacionMabilangManaoisMatalapitapNagmisaanNancamarinanNipacoPatalanPoblacion NortePoblacion SurRang-ayanSalumagueSamputSan CarlosSan IsidroSan Juan de MillaSanta InesSinigpitTablangVentenilla
3581181351781074942
1461731972958759
10664
19021970
1576717686
19033725717024531910212485
111116137186
416150166241135615217621423136211370121772292627918786215104235432308213291389130155101137140162223
312013
12001304
124020570001
1436320005019
7.51.30
0.42.2
19.700
0.51.30
3.517.13.30
0.90
6.33.7000
0.43.21.02.81.00.5000
3.60
0.64.0
00000000100001010000100110010000000
00000000
0.60000
0.90
0.50000
0.600
0.30.400
0.30000000
741633281495
28304052169
19133929143716331941724324545817251524233239
01000000000000000000100000010000000
05.9000000000000000000
2.9000000
1.70000000

The Many Faces of Poverty (Volume 9)
259
SAN CLEMENTE BallocBambanCasipoCatagudinganDaldalayapDoclong 1Doclong 2MaasinNagsabaranPit-aoPoblacion NortePoblacion Sur
14690215072606617758
10635
101
1861132760866979
22372
13144
130
060000000500
05.30000000
3.800
000000000000
000000000000
24182
1397
14386
243
18
000000000000
000000000000
Table 1. Health and Nutrition Indicators, by Barangay, Province of Tarlac, 2014-2017
Municipality Barangay Number ofchildren
(0-5years old)
Malnourishedchildren
(0-5 years old)
Proportion
Children under 5years oldwho died
Number ofchildrenunder 1year old
Women deaths due topregnancy-related
causes
Magnitude Magnitude Proportion Magnitude Proportion
Number ofchildrenunder 5years old
RAMOS Coral-IlocoGuitebPancePoblacion CenterPoblacion NorthPoblacion SouthSan JuanSan RaymundoToledo
2963263597586
1906498
181
3623954409211224073118226
083000105
02.00.7000
1.40
2.2
000000010
0000000
1.00
5753708
1532122038
000000000
000000000
SAN JOSE BurgosDavidIbaLabneyLawacamulagLubiganMaamotMababanabaMorionesPaoSan Juan de ValdezSulaVilla Aglipay
236221269160114161409268292144115323401
276253328201139200475314350179146401490
000002016001400
00000
1.00
5.100
9.600
0001001000001
000
0.600
0.200000
0.2
64874730203885435313176579
0000000000000
0000000000000
SAN MANUEL ColubotLanatLegaspiMangandingayMatarannocPacpacoPoblacionSalcedoSan AgustinSan FelipeSan JacintoSan MiguelSan NarcisoSan VicenteSanta Maria
6610518746719252
16614517674
13911811472
951212275686
12168
19318821494
15615014988
000011000000100
0000
1.20.8000000
0.700
000010000000000
0000
1.40000000000
1519256
1115113921291020182315
000011000001000
0000
8.36.200000
4.8000

260
The Many Faces of Poverty (Volume 9)
VICTORIA BaculongBalayangBalbalotoBangarBantogBatangbatangBuloCabuluanCalibunganCanaremCruzLalapacMaluidMangolagoMasalasaPalacpalacSan AgustinSan AndresSan Fernando (Pob.)San FranciscoSan Gavino (Pob.)San JacintoSan Nicolas (Pob.)San VicenteSanta BarbaraSanta Lucia (Pob.)
411295139230186136191114174226125200272258140155291207197179200292169166531122
506356169282219169237139214278168235319317174192349245247207240356200198646148
21002000010000000000020010
0.40.300
0.90000
0.400000000000
0.600
0.20
00103000111001000012300030
00
0.70
1.6000
0.60.40.800
0.40000
0.51.11.5000
0.60
875927382523412330382654595027376847304139573521
12323
00000000000000000010200000
000000000000000000
3.20
4.900000
Table 1. Health and Nutrition Indicators, by Barangay, Province of Tarlac, 2014-2017
Municipality Barangay Number ofchildren
(0-5years old)
Malnourishedchildren
(0-5 years old)
Proportion
Children under 5years oldwho died
Number ofchildrenunder 1year old
Women deaths due topregnancy-related
causes
Magnitude Magnitude Proportion Magnitude Proportion
Number ofchildrenunder 5years old
SANTA IGNACIA BaldiosBotbotonesCaanamonganCabaruanCabugbuganCaduldulaoanCalipayanMacaguingNambalanPadapadaPilpilaPinpinasPoblacion EastPoblacion WestPugo-CecilioSan FranciscoSan SoteroSan VicenteSanta Ines CentroSanta Ines EastSanta Ines WestTaguiporoTimmaguabVargas
115133107819953
11851
17822414793
16910911714498
15910316317022
160209
14115412398111701406322027316811421012813717611419112220120430195255
001010000100000201000000
00
0.80
0.90000
0.400000
1.10
0.5000000
100100000010000101100000
0.900
1.2000000
0.70000
0.70
0.61.000000
2525241625162212374528152917232816332234286
4237
000000000000000000000000
000000000000000000000000

The Many Faces of Poverty (Volume 9)
261
CBMS Poverty Maps: Province of Tarlac
Map 7. Proportion of Households Living in Makeshift Housing,by Municipality, 2014-2017
Map 8. Proportion of Households Living in Makeshift Housing,by Barangay, 2014-2017
Barangay Magnitude ProportionMunicipality
Bottom 10 Barangays
VICTORIALA PAZLA PAZPANIQUIPANIQUIPANIQUICAMILINGVICTORIARAMOSPANIQUI
BatangbatangCaramutanRizalSinigpitBurgosApulidBacsayCruzToledoSalumague
94553039576026384158
31.512.510.810.710.310.29.89.59.19.1
Magnitude ProportionMunicipality
LA PAZRAMOSCAMILINGPANIQUIVICTORIAGERONACONCEPCIONCAPASSAN CLEMENTEBAMBANPURAMONCADAMAYANTOCSAN JOSEANAOSANTA IGNACIASAN MANUEL
52518457462535832545834632
13942975141114721
5.54.13.73.62.61.81.41.31.21.20.90.80.70.60.50.50.5

262
The Many Faces of Poverty (Volume 9)
Map 10. Proportion of Households who are Informal Settlers,by Barangay, 2014-2017
Map 9. Proportion of Households who are Informal Settlers,by Municipality, 2014-2017
CBMS Poverty Maps: Province of Tarlac
Barangay Magnitude ProportionMunicipalityBottom 10 Barangays
SAN JOSESAN JOSEGERONAMONCADASAN JOSEPANIQUIGERONASAN JOSEMONCADASAN JOSE
MaamotPaoCaturaySan JuanMorionesMatalapitapOloybuayaIbaSan LeonBurgos
70537927242644520499
28992
161
100.099.798.675.470.050.747.638.434.532.1
Magnitude ProportionMunicipality
SAN JOSECAPASPANIQUILA PAZMONCADACAMILINGGERONASAN MANUELRAMOSSANTA IGNACIACONCEPCIONSAN CLEMENTEVICTORIABAMBANMAYANTOCPURAANAO
2,2191,6181,0595566316205708574
14039234
151110684519
30.66.36.15.84.94.03.22.01.61.61.21.21.11.01.00.90.8

The Many Faces of Poverty (Volume 9)
263
CBMS Poverty Maps: Province of Tarlac
Map 11. Proportion of Households without Access to Safe Water Supply,by Municipality, 2014-2017
Map 12. Proportion of Households without Access to Safe Water Supply,by Barangay, 2014-2017
Barangay Magnitude ProportionMunicipality
Bottom 10 Barangays
SAN CLEMENTEVICTORIAMAYANTOCLA PAZCAPASGERONASAN CLEMENTELA PAZPURAVICTORIA
MaasinBatangbatangPoblacion SurRizalSanto RosarioDicolorBallocCaramutanSingatBantog
234180345125655189149158130173
61.360.445.844.842.041.940.936.035.434.7
Magnitude ProportionMunicipality
SAN CLEMENTEMAYANTOCLA PAZPURACAPASCAMILINGRAMOSVICTORIABAMBANSAN JOSESAN MANUELGERONAPANIQUISANTA IGNACIACONCEPCIONMONCADAANAO
4471,0921,222418
1,101556140381309180101323228104352621
16.415.612.78.64.33.63.12.82.72.52.41.81.31.21.10.50.0

264
The Many Faces of Poverty (Volume 9)
Map 14. Proportion of Households without Access to Sanitary Toilet Facilities,by Barangay, 2014-2017
Map 13. Proportion of Households without Access to Sanitary Toilet Facilities,by Municipality, 2014-2017
CBMS Poverty Maps: Province of Tarlac
Barangay Magnitude ProportionMunicipalityBottom 10 Barangays
GERONAGERONACAPASVICTORIABAMBANSAN JOSEGERONASAN MANUELCONCEPCIONVICTORIA
CaturaySanta LuciaBuenoCruzSanto NiñoMaamotTangcaranSan FelipeTalimunduc MarimlaBalayang
12681
11013013320254
10058
108
45.745.537.732.628.828.726.121.815.814.3
Magnitude ProportionMunicipality
SAN MANUELSAN JOSERAMOSGERONAVICTORIASANTA IGNACIABAMBANMAYANTOCCAMILINGSAN CLEMENTECAPASCONCEPCIONLA PAZPANIQUIMONCADAANAOPURA
30345517656642923528216636852
39041673
134106158
7.36.33.93.23.12.62.52.42.41.91.51.30.80.80.80.60.2

The Many Faces of Poverty (Volume 9)
265
Table 2. Housing, Water and Sanitation Indicators, by Barangay, Province of Tarlac, 2014-2017
Households living inmakeshift housing
Households who areinformal settlers
Households without accessto safe water supply
Households without accessto sanitary toilet facilities
BarangayMunicipality
ProportionProportion Proportion ProportionMagnitude Magnitude Magnitude Magnitude
100000102100003111
1.300000
1.00
1.20.90000
1.61.10.40.5
101211010211302030
1.30
1.71.40.51.20
1.30
1.90.51.13.20
1.10
1.30
010000000000000000
00.70000000000000000
000000100000019112
000000
1.0000000
0.94.81.10.41.0
50110
101
37072921
153
1.70.10.40
1.70.22.00
0.50.52.80.30.33.20.7
11170609012071020
0.40.13.10
1.00
0.50
0.10.50
12.30
0.40
1310010020301741
1437
4.500
0.700
0.10
0.20
5.40.70.3
31.01.7
11900000000000
30133
0
4.100000000000
9.028.8
0
55
10232632
371026174261710
15365
2715
3.22.43.43.89.81.20.76.24.24.85.42.40.91.43.90.50
4.75.02.72.15.01.8
612
7895
16151
12507
2726243240
221947
3.80.50.7
12.93.42.05.82.50.42.21.60
3.36.35.9
11.715.51.20
9.90.41.75.7
581928106122315426013110136135
3.23.86.54.63.82.40.43.71.22.81.31.22.80
3.00.50.50
1.71.42.50.24.2
0088
151
11172383461
1617425
152014
00
2.71.35.60.44.02.90.80.62.61.81.91.40.27.88.31.23.32.36.43.71.7
ANAO Baguindoc (Baguinloc)BantogCamposCarmenCasiliDon RamonHernandoPoblacionRizalSan Francisco EastSan Francisco WestSan Jose NorthSan Jose SouthSan JuanSan RoqueSanto DomingoSinenseSuaverdez
BAMBAN AnupulBanabaBangcuCulubasaDela CruzLa PazLourdesMalonzoSan Nicolas (Pob.)San PedroSan RafaelSan RoqueSan VicenteSanto NiñoVirgen de los Remedios(Pacalcal)
CAMILING Anoling 1stAnoling 2ndAnoling 3rdBacabacBacsayBancay 1stBancay 2ndBiladBirbiraBobon 1stBobon 2ndBobon CaarosipanCabanabaanCacamilingan NorteCacamilingan SurCaniagCaraelCayaoanCayasanFloridaLasongLibuegMalacampa

266
The Many Faces of Poverty (Volume 9)
Table 2. Housing, Water and Sanitation Indicators, by Barangay, Province of Tarlac, 2014-2017
Households living inmakeshift housing
Households who areinformal settlers
Households without accessto safe water supply
Households without accessto sanitary toilet facilities
BarangayMunicipality
ProportionProportion Proportion ProportionMagnitude Magnitude Magnitude Magnitude
5091411400
182817509000237
21116
106912332
3.40
2.90.34.40.40.22.300
8.313.84.11.50
3.3000
0.51.02.27.43.33.03.55.33.20.50.81.11.70.8
849219
42101486
2121
12862
331319860
131018489
102
5.45.62.90.51.13.97.65.61.02.63.73.05.00.62.34.44.33.31.67.54.45.82.81.80
4.68.86.51.93.03.45.60.8
05
11151
2019031
139
3451
214
1110311211454001140
123
07.03.53.81.18.73.40
3.10.76.04.48.11.52.37.72.26.18.27.04.13.41.41.52.000
0.40.51.50
6.71.3
42
22114
261304
690
12000174
281321864
201115121127146
2.72.87.00.31.11.74.77.30
2.631.9
02.9000
0.53.93.36.44.46.52.81.82.07.19.65.45.64.2
10.37.92.5
340
701
341627
10133
898
4002
13103
13110
8154223011
30103
301
9940
0.837.70.20.10.20.30.20.40.30
0.20.21.0
13.70.10
0.28.30.30
2.10
1.30.11.71.40.21.40.90.30.60.73.01.11.80
0.41.10.60.3
44170
135575
8160
2211124
23534029
1663991
2.70.31.3
15.828.60.7
14.90.40.20.30.20.20.8
31.21.60
6.213.92.58.3
92780101
194800
4610200170
655249
0.69.20.20
0.00
0.13.74.300
10.60.32.70
0.21.50
42.022.8
CAMILING ManakemManupegMarawiMatubogNagrambacanPalimbo ProperPalimbo-CaarosipanPao 1stPao 2ndPao 3rdPapaacPindangan 1stPindangan 2ndPoblacion BPoblacion DPoblacion EPoblacion GPoblacion HPoblacion JSanta MariaSawatSinilian 1stSinilian 2ndSinilian 3rdSinilian CacalibosoanSinulatan 1stSinulatan 2ndSurgui 1stSurgui 2ndSurgui 3rdTambuganTelbangTuec
CAPAS ArangurenBuenoCristo ReyCubcub (Pob.)Cutcut 1stCutcut 2ndDoloresEstrada (Calingcuan)LawyMangaManlapigMarugluO’DonnellSanta JulianaSanta LuciaSanta RitaSanto Domingo 1stSanto Domingo 2ndSanto RosarioTalaga

The Many Faces of Poverty (Volume 9)
267
Table 2. Housing, Water and Sanitation Indicators, by Barangay, Province of Tarlac, 2014-2017
Households living inmakeshift housing
Households who areinformal settlers
Households without accessto safe water supply
Households without accessto sanitary toilet facilities
BarangayMunicipality
ProportionProportion Proportion ProportionMagnitude Magnitude Magnitude Magnitude
2312240238
32902118
3.53.65.40
0.40.91.47.54.00
0.70.20.23.3
3240044001
272203
0.50.60.900
1.20.700
0.298.60.50
1.2
4600000090000
1891
7.0000000
2.10000
41.90.4
8304001
3800
126000
1.20.90
1.800
0.28.900
45.7000
151041
105070
14374141515104
4821
127102434491
103
2027237900438
10
3434000
6200100100
150
121
164004493010018
300500
29235801
59
0.10
6.013.8
000
9.400
0.200
0.200
5.60
1.80.32.60.300
0.30.60.40.30
0.100
0.12.12.20
0.500
3.56.1
15.80
0.45.5
0.91.10.70.40.90.80
1.10
1.47.31.60.21.00.30.70.40.90.10
0.73.90.30.28.01.61.20.34.70.41.10.20.90.81.52.70.20.32.41.100
0.61.30.7
10002
320011333740102
180
132493100
1932
140
22302
1137
144101
113
0.600
0.83.000
0.20.40.30.61.21.21.00
0.10
0.42.60
21.64.00.40.200
0.90.32.41.40
5.30.30
0.11.10.30.74.80.50.30
0.14.70.3
220000001400002105600
1200171201000002
30300000000
0.10.2000000
0.40.40000
0.60.10
0.90.900
1.000
0.11.10
0.20
0.100000
0.232.7
00000000
GERONA AbagonAmacalanApsayanAysonBawaBuenlagBularitCalayaanCarbonelCardonaCaturayDanzoDicolorDon Basilio
CONCEPCION AlfonsoBalutuCafeCalius GuecoCaluluanCastilloCorazon de JesusCulatinganDunganDutung-A-MatasGreen VillageLilibanganMabilogMagaoMalupaMinanePanalicsian (Panalicsican)PandoParangParulungPitabunanSan Agustin (Murcia)San AntonioSan BartolomeSan FranciscoSan Isidro (Almendras)San Jose (Pob.)San Juan (Castro)San MartinSan Nicolas (Pob.)San Nicolas BalasSan Vicente (Caluis/Cobra)Santa CruzSanta MariaSanta MonicaSanta RitaSanta RosaSantiagoSanto CristoSanto NiñoSanto Rosario (Magunting)Talimunduc MarimlaTalimunduc San MiguelTelabancaTinang

268
The Many Faces of Poverty (Volume 9)
Table 2. Housing, Water and Sanitation Indicators, by Barangay, Province of Tarlac, 2014-2017
Households living inmakeshift housing
Households who areinformal settlers
Households without accessto safe water supply
Households without accessto sanitary toilet facilities
BarangayMunicipality
ProportionProportion Proportion ProportionMagnitude Magnitude Magnitude Magnitude
311010
1.91.00.30
0.80
183100
0.67.80.80.800
252115201310
15.420.64.115.79.99.2
15
18111
0.64.94.90.80.80.9
2120
133627
150357
1014161
140
224
12391
110
161
01120201728140
160001
1524
23292621811020
271
540
03.00.30
0.50
6.713.57.10
2.3000
0.35.80.70.65.34.48.45.1
45.52.20.60
6.80.1
26.10
0.50.30.30
3.30.82.41.03.53.00
1.01.22.82.75.45.80.13.20
7.11.06.70.72.70.42.80
7.70.3
5230
37010
99031142
330
161016011001381
12.80.80
9.70
0.30
47.60
0.60.10.31.00.88.80
5.80.10
0.21.90
0.60.200
0.30.33.90.3
0110010
11102
54100000300100020000
00.30.100
0.30
5.30.50
0.317.40.200000
0.700
0.2000
0.80000
LA PAZ BalanoyBantog-CaricutanCaramutanCautComillasDumaraisGuevarraKapanikianLa PurisimaLaraLaungcupangLomboyMacalongMatayumtayumMayangMotricoPaludpudRizalSan Isidro (Pob.)San Roque (Pob.)Sierra
GERONA LunaMabiniMagaspacMalayepMatapitapMatayumcabNew SalemOloybuayaPadapadaParsolinganPinasling (Pinasung)PlastadoPoblacion 1Poblacion 2Poblacion 3QuezonRizalSalapunganSan AgustinSan AntonioSan BartolomeSan JoseSanta LuciaSantiagoSembranoSingatSulipaTagumbaoTangcaranVilla Paz
MAYANTOC AmbalingitBaybayaoasBigbigaBinbinacaCalabtanganCaocaoayan
1618552633614210251330282085
232630132320
4.43.812.56.53.67.17.03.44.85.98.84.45.12.41.97.68.810.83.12.65.3
131349
1243
1430638
271072742240364
1223
3.62.70.92.2
13.60.32.3
10.212.03.77.9
16.86.8
12.59.10
1.02.21.01.46.1
12135
15897
1871400811487188237041
1251215053
33.27.4
36.024.220.40.16.70
1.55.0
14.01.14.62.48.7
23.313.944.828.95.7
14.2
01102
1018
1100822
24200010
00.20.20
0.21.20.22.72.100
1.30.50.69.10.7000
0.10

The Many Faces of Poverty (Volume 9)
269
Table 2. Housing, Water and Sanitation Indicators, by Barangay, Province of Tarlac, 2014-2017
Households living inmakeshift housing
Households who areinformal settlers
Households without accessto safe water supply
Households without accessto sanitary toilet facilities
BarangayMunicipality
ProportionProportion Proportion ProportionMagnitude Magnitude Magnitude Magnitude
1431002140321640431
142114010203110
151110
1.70.80.700
0.50.40.80
1.00.70.41.41.00
0.70.80.23.90.70.30.51.60
0.20
0.70
1.10.50.40
4.10.40.30.20
311011264101
1833010476033
426219202011612
100
0.40.30.70
0.30.30.81.22.40.30
0.44.30.70.60
0.30
1.12.31.60
1.20.9
75.44.1
34.50
0.70
0.40.21.60.40.72.30
50130251022131224010100031200000401141
0.60
0.70.90
0.51.90.20
0.70.75.00.20.50.40.70
0.20
0.3000
0.90.20.400000
0.90
0.40.30.90.6
5000000200200000000041100
16200
102416230000
0.6000000
0.400
0.7000000000
1.10.50.400
3.10.700
4.910.73.76.30000
000454161001
1302512
1021
30112
231777181
111007
0.60
2.70.6
13.21.61.16.25.21.41.40.21.10.33.03.20
2.1
000
2.22.20.60.51.60.300
0.21.70
0.61.60.60.6
0056616
107000700610
00
6.73.32.60.13.32.72.2000
0.900
1.90.60
233
124
42740
10294277
1823453962265
13
13.76.4
16.02.2
18.511.1
02.79.08.5
15.233.545.813.617.28.23.23.9
MONCADA Ablang-SapangAringinAtencioBanaoang EastBanaoang WestBaquero NorteBaquero SurBurgosCalamayCalapanCamangaan EastCamangaan WestCamposanto 1 - NorteCamposanto 1 - SurCamposanto 2CapaoayanLapsingMabiniMaluacPoblacion 1Poblacion 2Poblacion 3Poblacion 4RizalSan JuanSan JulianSan LeonSan PedroSan RoqueSanta Lucia EastSanta Lucia WestSanta MariaSanta MonicaTolega NorteTolega SurTubectubangVilla
MAYANTOC CarabaoanCubcubGayonggayongGossoodLabneyMamonitManiniogMapandanNambalanPedro L. QuinesPitombayogPoblacion NortePoblacion SurRotrottoocSan BartolomeSan JoseTaldiapanTangcarang

270
The Many Faces of Poverty (Volume 9)
Table 2. Housing, Water and Sanitation Indicators, by Barangay, Province of Tarlac, 2014-2017
Households living inmakeshift housing
Households who areinformal settlers
Households without accessto safe water supply
Households without accessto sanitary toilet facilities
BarangayMunicipality
ProportionProportion Proportion ProportionMagnitude Magnitude Magnitude Magnitude
2116714011233406
0.50.20.60.72.20.61.60
0.50.40.81.41.61.60
1.6
0002200017031
2801
000
0.20.6000
0.53.00
1.40.5
11.20
0.3
9300
67400
4500
140
15950
130
25.100
8.212.4
018.3
00
6.00
7.14.72.00
35.4
0004200020000000
000
0.50.6000
0.90000000
36152
602722
57201683183
21101171
22149
20304
58541
3424
39213
620
150022512002025240300490
15230
2701110
0.70.50
2.600
1.10.40.90.20.200
0.60
0.40.91.11.00
0.500
0.41.10
2.42.70
6.10
0.30.30.20
4.03.50.6
10.23.90.81.1
10.33.52.60.70.90.42.41.13.81.70.54.20.43.44.61.62.03.80.79.16.50.37.70.81.1
10.74.70.6
2142
5440461687421
1067
11910
204090
112613718
432
463
520
124
23.50.5
15.36.80.62.50.61.11.4
12.30.20.34.11.82.7
21.60.20
50.70
1.40
1.92.61.6
12.81.35.10.6
10.41.2
14.90
2.70.8
1450
12500
141830617030190003730
48310
18000
200
1.51.20
2.00.700
2.53.20.50
1.90.42.10
0.50
0.52.2000
0.50.70.40
7.53.70
4.1000
4.50
PURA BaliteBuenavistaCadanglaanEstiponaLinaoMaasinMatindegMaungibNayaNilasin 1stNilasin 2ndPoblacion 1Poblacion 2Poblacion 3PorocSingat
PANIQUI AbogadoAcocolaoAduasApulidBalaoangBarang (Borang)BrillanteBurgosCabayaoasanCananCarinoCayangaColibangbangCoralDapdapEstacionMabilangManaoisMatalapitapNagmisaanNancamarinanNipacoPatalanPoblacion NortePoblacion SurRang-ayanSalumagueSamputSan CarlosSan IsidroSan Juan de MillaSanta InesSinigpitTablangVentenilla

The Many Faces of Poverty (Volume 9)
271
Table 2. Housing, Water and Sanitation Indicators, by Barangay, Province of Tarlac, 2014-2017
Households living inmakeshift housing
Households who areinformal settlers
Households without accessto safe water supply
Households without accessto sanitary toilet facilities
BarangayMunicipality
ProportionProportion Proportion ProportionMagnitude Magnitude Magnitude Magnitude
0100211
139104
00.300
1.40.40.63.45.40.40
1.1
180001291813
0.32.8000
0.41.22.40.62.80.60.8
1494232012
23413001
40.914.75.11.40
0.41.2
61.37.700
0.3
21420000
310102
0.54.93.40000
8.10
0.40
0.6
3736222
11189841
25344206
13106
40
3.14.54.60
2.02.57.52.08.9
4.64.82.40.53.63.56.72.69.1
1212342
11084
0.12.82.51.00.72.10
2.60.9
05
134000010
00.7
14.80000
0.30
SAN CLEMENTE BallocBambanCasipoCatagudinganDaldalayapDoclong 1Doclong 2MaasinNagsabaranPit-aoPoblacion NortePoblacion Sur
RAMOS Coral-IlocoGuitebPancePoblacion CenterPoblacion NorthPoblacion SouthSan JuanSan RaymundoToledo
SAN JOSE BurgosDavidIbaLabneyLawacamulagLubiganMaamotMababanabaMorionesPaoSan Juan de ValdezSulaVilla Aglipay
SAN MANUEL ColubotLanatLegaspiMangandingayMatarannocPacpacoPoblacionSalcedoSan AgustinSan FelipeSan JacintoSan MiguelSan NarcisoSan VicenteSanta Maria
57222040111
133
1.01.90.30.50.60
0.60
0.20.30.32.00.2
1613
289740
705121445379
4974
32.10.8
38.41.61.30
100.017.670.099.71.2
15.30.3
33021001020002
1111
6.60
2.800
3.40.3000
0.617.50.1
420
643420
20210270
839
8.40
8.57.80.60
28.71.50.31.80
13.10.7
211030137001002
1.00.50.30
1.40
0.50.81.900
0.300
0.9
520034012
390
24140
2.61.000
1.41.80
0.30.68.50
6.50.41.20
10530570202910030
0.50
13.80
2.43.10
0.50
6.30.500
0.90
191
1616192700
34100
054
3923
9.70.54.29.49.1
11.900
9.421.8
01.41.5
12.110.5

272
The Many Faces of Poverty (Volume 9)
Table 2. Housing, Water and Sanitation Indicators, by Barangay, Province of Tarlac, 2014-2017
Households living inmakeshift housing
Households who areinformal settlers
Households without accessto safe water supply
Households without accessto sanitary toilet facilities
BarangayMunicipality
ProportionProportion Proportion ProportionMagnitude Magnitude Magnitude Magnitude
2413122028946035
381
1642029
11156
15120
220
2.71.73.14.15.6
31.51.30
0.50.99.50.22.70.70.50
0.32.01.74.61.12.32.70
1.90
1018
42921
101815
2103012302
1010
100
1.10.12.18.61.80.70.23.00.21.50.31.13.50
0.80
0.10.40.50
0.41.50.20
0.90
5150
173180
00007000000080200000
0.60.11.30
34.760.4
0000
1.80000000
1.20
0.400000
01081410102800
10130
4261102
392010510100
014.33.62.02.00.71.700
1.932.60.94.31.80
0.55.50.40
0.30
7.70
0.200
203030202603201026054123
012191
141
1114
101157
1028132297
101101712
03.26.70.45.00.63.50.70.71.52.42.11.22.29.23.4
10.32.02.12.12.20
3.71.9
0.50
1.10
1.10
0.60
0.40.90
1.30.30
0.30
0.91.30
1.00.80.90.40.5
120796205
1052045
251214457123
0.25.42.54.02.11.20
3.51.80.70.40
0.71.18.33.10.50.91.21.01.40.90.40.5
435100
141
121085993029341010
1.00.81.80.400
4.40.72.21.51.82.11.52.01.00
0.92.00.90.80.20
0.20
VICTORIA BaculongBalayangBalbalotoBangarBantogBatangbatangBuloCabuluanCalibunganCanaremCruzLalapacMaluidMangolagoMasalasaPalacpalacSan AgustinSan AndresSan Fernando (Pob.)San FranciscoSan Gavino (Pob.)San JacintoSan Nicolas (Pob.)San VicenteSanta BarbaraSanta Lucia (Pob.)
SANTA IGNACIA BaldiosBotbotonesCaanamonganCabaruanCabugbuganCaduldulaoanCalipayanMacaguingNambalanPadapadaPilpilaPinpinasPoblacion EastPoblacion WestPugo-CecilioSan FranciscoSan SoteroSan VicenteSanta Ines CentroSanta Ines EastSanta Ines WestTaguiporoTimmaguabVargas

The Many Faces of Poverty (Volume 9)
273
Map 16. Proportion of Children 6-11 Years Old Not Attending Elementary School,by Barangay, 2014-2017
Map 15. Proportion of Children 6-11 Years Old Not Attending Elementary School,by Municipality, 2014-2017
CBMS Poverty Maps: Province of Tarlac
Barangay Magnitude ProportionMunicipalityBottom 10 Barangays
MAYANTOCCAPASSAN JOSESAN JOSEPURACAMILINGMAYANTOCCAMILINGMONCADACONCEPCION
GayonggayongMarugluMaamotDavidMaasinSurgui 2ndCubcubPoblacion HSan PedroSan Martin
857
1004517123
15118
27.623.422.520.620.519.418.818.818.017.8
Magnitude ProportionMunicipality
SAN JOSEMAYANTOCRAMOSSANTA IGNACIAMONCADACONCEPCIONCAPASVICTORIAPURASAN CLEMENTEGERONAANAOLA PAZCAMILINGBAMBANPANIQUISAN MANUEL
458348220363505
1,4931,11660317410558889374473448424125
12.111.49.69.49.39.29.08.58.58.48.27.97.57.37.26.15.9

274
The Many Faces of Poverty (Volume 9)
Map 17. Proportion of Children 12-15 Years Old Not Attending High School,by Municipality, 2014-2017
Map 18. Proportion of Children 12-15 Years Old Not Attending High School,by Barangay, 2014-2017
Barangay Magnitude ProportionMunicipality
Bottom 10 Barangays
SAN JOSEMAYANTOCCAPASBAMBANCAPASCAPASSAN JOSEGERONASAN JOSESAN JOSE
MaamotLabneyBuenoSanto NiñoSanta JulianaMarugluDavidCarbonelSulaBurgos
2225889
133157686530
13885
75.371.665.057.857.553.150.848.446.943.8
Magnitude ProportionMunicipality
SAN JOSECAPASMAYANTOCSANTA IGNACIAVICTORIACONCEPCIONGERONAMONCADABAMBANANAOLA PAZSAN MANUELPURARAMOSSAN CLEMENTECAMILINGPANIQUI
1,0072,534559657
1,1502,7181,187840
1,065187778280289336184811836
38.431.530.628.526.126.026.025.024.724.423.722.421.921.721.219.519.1
CBMS Poverty Maps: Province of Tarlac

The Many Faces of Poverty (Volume 9)
275
Map 20. Proportion of Children 6-15 Years Old Not Attending School,by Barangay, 2014-2017
Map 19. Proportion of Children 6-15 Years Old Not Attending School,by Municipality, 2014-2017
CBMS Poverty Maps: Province of Tarlac
Barangay Magnitude ProportionMunicipalityBottom 10 Barangays
SAN JOSESAN JOSECAPASBAMBANMAYANTOCCAPASSANTA IGNACIACAMILINGCAMILINGCONCEPCION
DavidMaamotBuenoSan VicenteLabneyMarugluCabugbuganLasongCayasanTinang
601185043263719154
56
17.315.914.512.311.89.99.39.18.38.1
Magnitude ProportionMunicipality
SAN JOSECONCEPCIONSANTA IGNACIACAPASLA PAZVICTORIABAMBANCAMILINGMAYANTOCGERONARAMOSSAN MANUELPANIQUISAN CLEMENTEMONCADAPURAANAO
4231,08325073929739235933514234010176
247421706128
6.64.14.03.63.63.43.43.22.92.92.62.32.22.01.91.81.5

276
The Many Faces of Poverty (Volume 9)
Table 3. Education Indicators, by Barangay, Province of Tarlac, 2014-2017
Number ofchildren (6-
11 years old)
Children notattending
elementary school(6-11 years old)
Number ofchildren (12-15 years old)
Children not attendinghigh school
(12-15 years old)
Number ofchildren (6-
15 yearsold)
Children notattending school(6-15 years old)
BarangayMunicipality
Magnitude Magnitude MagnitudeProportion Proportion Proportion
31803469994543348036963748429232
124102
4936956252622265
114
12.911.28.88.79.1
11.114.05.96.25.66.25.44.24.86.5
15.68.93.9
163615567225252970456722233566227667
5961716498191185542061817
31.225.040.030.422.216.036.027.627.124.411.922.721.711.430.327.323.725.4
4711649
125171706863
15081
163597177
15854
200169
120310304200005214
2.11.70
2.40.60
4.40
2.72.50000
3.23.70.52.4
1,3466329782364231
1,017185715226196315206369271
1132877
2110612441139
21274620
8.44.47.28.55.84.36.0
13.05.75.84.66.7
13.112.57.4
8964658556
255187728134523126103207145230177
2218117124127
18730
12022293963
13343
24.717.420.021.416.114.425.722.422.917.528.218.843.457.824.3
2,2421,097182138619418
1,745319
1,238352299522351599448
643284
134
551529101010434517
2.92.94.42.92.11.03.24.72.32.83.31.9
12.37.53.8
6282982681401119322899221127808116521386951362511490200340
133
2576
13104
10162
10136556165
1432
1.63.73.19.35.05.4
14.04.44.04.5
12.62.5
12.37.92.85.85.34.44.05.35.67.09.4
445469
15068697217852
14892415999
1235069
105237675
106202
47
1826151319404
29185
1225271114234
13191553
9.113.026.117.322.118.826.422.57.7
19.619.612.220.325.322.022.020.321.917.417.125.314.226.2
10613616741820818016540615136921912114026433613616424148
190165306542
11
1020926837
1027
101227546
158
19
0.90.76.04.84.31.13.62.02.01.94.61.75.03.83.61.54.32.18.33.29.12.63.5
ANAO Baguindoc (Baguinloc)BantogCamposCarmenCasiliDon RamonHernandoPoblacionRizalSan Francisco EastSan Francisco WestSan Jose NorthSan Jose SouthSan JuanSan RoqueSanto DomingoSinenseSuaverdez
BAMBAN AnupulBanabaBangcuCulubasaDela CruzLa PazLourdesMalonzoSan Nicolas (Pob.)San PedroSan RafaelSan RoqueSan VicenteSanto NiñoVirgen de los Remedios(Pacalcal)
CAMILING Anoling 1stAnoling 2ndAnoling 3rdBacabacBacsayBancay 1stBancay 2ndBiladBirbiraBobon 1stBobon 2ndBobon CaarosipanCabanabaanCacamilingan NorteCacamilingan SurCaniagCaraelCayaoanCayasanFloridaLasongLibuegMalacampa

The Many Faces of Poverty (Volume 9)
277
Table 3. Education Indicators, by Barangay, Province of Tarlac, 2014-2017
Number ofchildren (6-
11 years old)
Children notattending
elementary school(6-11 years old)
Number ofchildren (12-15 years old)
Children not attendinghigh school
(12-15 years old)
Number ofchildren (6-
15 yearsold)
Children notattending school(6-15 years old)
BarangayMunicipality
Magnitude Magnitude MagnitudeProportion Proportion Proportion
7327
12814035
111253853458
134108188128
891788032
18212613512611384
12951
1426288929977
41
111637
22232
116
231907
10154
148
11107532
11123558
5.53.78.6
11.48.66.38.72.48.83.48.25.6
12.214.8
07.7
12.818.812.57.76.38.17.96.26.02.33.97.7
19.43.45.45.1
10.4
461578
1102345
1313923336265
121897
69514819
13266
1219066507336865862875179
6323162132071416183319110813329525211271061811107119
13.020.029.514.58.7
28.915.317.94.3
12.125.827.727.321.314.314.515.727.115.822.07.6
20.723.318.214.013.716.720.919.016.18.0
21.611.4
11942
20625058
1563841245791
19617330921715
16012912851
31419225621617913420287
228120150179150156
126804
1212143
21906571
121
1032145
1072245
0.84.82.93.20
2.63.10.83.51.12.01.76.84.10
3.83.95.52.03.80.53.91.41.10.72.05.74.45.81.31.12.73.2
667209
2,169340
1,197594365331291246201244
1,480496
1,245264270488741541
6637
1942810750293026231357
10870
1141824324248
9.917.78.98.28.98.47.99.18.99.36.5
23.47.3
14.19.26.88.96.65.78.9
4911371512216717350301208229164123128933273808154159295499337
15689
42656
254139713655443268
277157244455873
15896
31.865.028.225.935.439.723.617.324.026.826.053.129.757.530.229.236.524.731.728.5
1,158346
3,681556
1,914944666539520410324372
2,413769
2,053418429783
1,240878
2250
1345
70205
111587
3781609118195
4635
1.914.53.60.93.72.10.82.02.92.02.29.93.47.84.44.34.40.63.74.0
CAMILING ManakemManupegMarawiMatubogNagrambacanPalimbo ProperPalimbo-CaarosipanPao 1stPao 2ndPao 3rdPapaacPindangan 1stPindangan 2ndPoblacion BPoblacion DPoblacion EPoblacion GPoblacion HPoblacion JSanta MariaSawatSinilian 1stSinilian 2ndSinilian 3rdSinilian CacalibosoanSinulatan 1stSinulatan 2ndSurgui 1stSurgui 2ndSurgui 3rdTambuganTelbangTuec
CAPAS ArangurenBuenoCristo ReyCubcub (Pob.)Cutcut 1stCutcut 2ndDoloresEstrada (Calingcuan)LawyMangaManlapigMarugluO’DonnellSanta JulianaSanta LuciaSanta RitaSanto Domingo 1stSanto Domingo 2ndSanto RosarioTalaga

278
The Many Faces of Poverty (Volume 9)
Table 3. Education Indicators, by Barangay, Province of Tarlac, 2014-2017
Number ofchildren (6-
11 years old)
Children notattending
elementary school(6-11 years old)
Number ofchildren (12-15 years old)
Children not attendinghigh school
(12-15 years old)
Number ofchildren (6-
15 yearsold)
Children notattending school(6-15 years old)
BarangayMunicipality
Magnitude Magnitude MagnitudeProportion Proportion Proportion
748458332158556362232429151441297155268214182291166267354203389733352302766382
1,13138745
379420272530181705484
1514151557218229202125433
81581512483217216
42356
111612406
203717468032246524142448
483727392171560
451140132351743
10.812.74.57.68.68.87.34.94.09.5
11.83.94.17.56.6
13.73.67.5
10.58.4
11.810.99.17.98.56.3
12.611.417.812.78.89.97.4
11.610.111.6
08.87.37.26.0102.5
13.69.9
55729618979
36420813326677
28220411823811611922611819025717721644823215053519371621526
273268149345140468308
136394
33212715513781
260
1546653197945345323675523403129612546534761
1385236
15846
2272894285458031147110
09717
1022337293085
27.622.328.024.121.721.625.619.929.923.827.019.516.826.724.427.021.224.220.626.628.230.822.424.029.523.831.713.034.615.431.730.223.222.131.435.7
026.718.130.718.123.921.237.032.7
1,305754521237920570365695228723501273506330301517284457611380605
1,181584452
1,301575
1,84760271
652688421875321
1,173792
2877245889345384339206693
5934317
152111271213218
19121111106
23153433241467199192
143216431467520
257
549
12167
56
4.54.56.03.01.63.73.03.95.31.84.22.93.83.63.72.13.51.33.83.95.62.84.13.15.13.34.91.52.82.14.73.84.94.45.76.60
2.92.96.12.63.14.73.48.1
309140209881071293161551282748020971
126
239
1282
16341418196
196
18
7.46.45.79.11.9
12.410.89.0
14.16.97.59.18.5
14.3
181109155486478
2138462
20061
1214692
43184087
226117304623321537
23.816.525.816.710.928.228.620.248.423.037.726.432.640.2
490249364136171207529239190474141330117218
1164136
306
15123
1348
2.22.41.10.71.82.95.72.57.92.52.13.93.43.7
GERONA AbagonAmacalanApsayanAysonBawaBuenlagBularitCalayaanCarbonelCardonaCaturayDanzoDicolorDon Basilio
CONCEPCION AlfonsoBalutuCafeCalius GuecoCaluluanCastilloCorazon de JesusCulatinganDunganDutung-A-MatasGreen VillageLilibanganMabilogMagaoMalupaMinanePanalicsian (Panalicsican)PandoParangParulungPitabunanSan Agustin (Murcia)San AntonioSan BartolomeSan FranciscoSan Isidro (Almendras)San Jose (Pob.)San Juan (Castro)San MartinSan Nicolas (Pob.)San Nicolas BalasSan Vicente (Caluis/Cobra)Santa CruzSanta MariaSanta MonicaSanta RitaSanta RosaSantiagoSanto CristoSanto NiñoSanto Rosario (Magunting)Talimunduc MarimlaTalimunduc San MiguelTelabancaTinang

The Many Faces of Poverty (Volume 9)
279
Table 3. Education Indicators, by Barangay, Province of Tarlac, 2014-2017
Number ofchildren (6-
11 years old)
Children notattending
elementary school(6-11 years old)
Number ofchildren (12-15 years old)
Children not attendinghigh school
(12-15 years old)
Number ofchildren (6-
15 yearsold)
Children notattending school(6-15 years old)
BarangayMunicipality
Magnitude Magnitude MagnitudeProportion Proportion Proportion
210195350161119151729576
2322851921796624782
13516798
330509977
15833
134114478105160
222236137
13653
151518193
128
11147
31367
12178
4488
10.511.310.38.15.98.68.35.33.96.55.39.4
10.64.54.99.88.18.47.19.46.06.19.17.63.05.27.09.27.65.0
12211324310678
103445439
16221310410770
15940
116915817036725387237072
3066087
513960311527139113945332118448503084281015229819661225
41.834.524.729.219.226.229.516.728.224.121.131.719.625.727.720.043.133.013.824.722.213.928.325.339.111.426.421.620.028.7
3323085932671972541161491153944982962861364061222512581565008617113024556
204186784165247
131616923523
1314395
105
141544352
11255866
3.95.22.73.41.01.24.31.32.63.32.81.03.13.72.54.15.65.82.60.83.52.91.54.53.62.52.71.03.62.4
7641
177567046
74
246
116
9.29.8
13.610.715.713.0
5832
111343337
13143612116
22.443.832.435.333.316.2
13473
28890
10383
532321
3.74.10.73.31.91.2
158305247219483178308153340107209353197189152153174135206468242
72121163217211624108
29132414994
15577
4.46.98.57.36.69.66.8
10.57.19.33.88.26.6
12.79.25.95.23.07.3
12.22.9
10820515112936016020311019156
123221120107111979174
152347160
2046372476504530419364317393017291227
11040
18.522.424.518.621.131.222.227.321.516.129.319.514.236.427.017.531.916.217.831.725.0
266510398348843338511263531163332574317296263250265209358815402
522177
25191910204
1518131565
153
113216
1.94.34.32.03.05.63.73.83.82.54.53.14.15.12.32.05.71.43.13.94.0
LA PAZ BalanoyBantog-CaricutanCaramutanCautComillasDumaraisGuevarraKapanikianLa PurisimaLaraLaungcupangLomboyMacalongMatayumtayumMayangMotricoPaludpudRizalSan Isidro (Pob.)San Roque (Pob.)Sierra
GERONA LunaMabiniMagaspacMalayepMatapitapMatayumcabNew SalemOloybuayaPadapadaParsolinganPinasling (Pinasung)PlastadoPoblacion 1Poblacion 2Poblacion 3QuezonRizalSalapunganSan AgustinSan AntonioSan BartolomeSan JoseSanta LuciaSantiagoSembranoSingatSulipaTagumbaoTangcaranVilla Paz
MAYANTOC AmbalingitBaybayaoasBigbigaBinbinacaCalabtanganCaocaoayan

280
The Many Faces of Poverty (Volume 9)
Table 3. Education Indicators, by Barangay, Province of Tarlac, 2014-2017
Number ofchildren (6-
11 years old)
Children notattending
elementary school(6-11 years old)
Number ofchildren (12-15 years old)
Children not attendinghigh school
(12-15 years old)
Number ofchildren (6-
15 yearsold)
Children notattending school(6-15 years old)
BarangayMunicipality
Magnitude Magnitude MagnitudeProportion Proportion Proportion
39162974
1392756717718725820722332310111512580
152
0384
24305
142534172933101399
23
018.827.65.417.310.97.57.9
13.413.28.2
13.010.29.9
11.37.2
11.215.1
3411155581
13648
11483
1381451291917681643783
715115849101934345024542430211422
20.69.1
33.320.071.636.020.816.741.024.634.518.628.331.637.032.837.826.5
732744
129220411115291270396352352514177196189117235
1121
2611138898
137745
11
1.43.74.50.811.82.70.91.03.02.02.62.32.54.03.62.14.34.7
3601785414212914212615572110119130168174202257167192173103193871111332231901306114372921552158413418080
43122
189
1516111
13181314221815161397
23101012241413112376
101667
1612
11.96.73.7
12.77.0
10.612.77.11.4
11.815.110.08.3
12.68.95.89.66.85.26.8
11.911.59.09.0
10.87.4
10.018.016.19.76.56.57.47.15.28.9
15.0
23211832789774659949868666
1111151061547490
10377
148435691
1341128544884563
1051326196
11533
62253
1815122420162023121921253622222321431219174321288
258
2127391922409
26.721.29.423.115.516.236.920.232.723.326.718.217.118.323.623.429.724.422.327.329.127.933.918.732.118.832.918.228.417.833.325.729.531.122.934.827.3
59229686
220226216191254121196205196279289308411241282276180341130167224357302215105231117155260347145230295113
153043275073234472
1141692793327125545
103
2.51.00
1.81.30.93.72.00
3.61.51.01.11.41.31.70.83.91.40.61.86.91.23.12.51.01.41.93.00.91.31.91.42.82.23.42.7
MONCADA Ablang-SapangAringinAtencioBanaoang EastBanaoang WestBaquero NorteBaquero SurBurgosCalamayCalapanCamangaan EastCamangaan WestCamposanto 1 - NorteCamposanto 1 - SurCamposanto 2CapaoayanLapsingMabiniMaluacPoblacion 1Poblacion 2Poblacion 3Poblacion 4RizalSan JuanSan JulianSan LeonSan PedroSan RoqueSanta Lucia EastSanta Lucia WestSanta MariaSanta MonicaTolega NorteTolega SurTubectubangVilla
MAYANTOC CarabaoanCubcubGayonggayongGossoodLabneyMamonitManiniogMapandanNambalanPedro L. QuinesPitombayogPoblacion NortePoblacion SurRotrottoocSan BartolomeSan JoseTaldiapanTangcarang

The Many Faces of Poverty (Volume 9)
281
Table 3. Education Indicators, by Barangay, Province of Tarlac, 2014-2017
Number ofchildren (6-
11 years old)
Children notattending
elementary school(6-11 years old)
Number ofchildren (12-15 years old)
Children not attendinghigh school
(12-15 years old)
Number ofchildren (6-
15 yearsold)
Children notattending school(6-15 years old)
BarangayMunicipality
Magnitude Magnitude MagnitudeProportion Proportion Proportion
4211701702561688249
2162422513731241111246119722773
16086
22510325842738119829239812820185
142131205182
29121118111028
1511223443
102654
10196
1543281011246555
12107
6.97.16.57.06.5
12.24.13.76.24.45.92.43.63.24.95.1
11.56.82.5
11.68.45.85.8
10.17.35.13.86.04.72.55.93.59.24.93.8
25911699
16498473414717316526064667158
13614647
11154
154491472642429417125883
106678291
132131
55211839218324213156101891020386191031933703814225220241014172124
21.218.118.223.821.417.08.8
16.312.118.821.515.627.312.717.214.726.012.817.118.520.118.422.426.515.714.912.920.224.122.614.917.118.715.918.3
68028626942026612983
363415416633188177195119333373120271140379152405691623292463656211307152224222337313
19118830128
111423226
21122436
24156
14166417564
2.83.83.01.91.10
1.20.61.92.62.21.11.71.01.71.85.60.80.71.41.12.01.53.52.42.13.02.42.81.30.73.12.31.81.3
PURA BaliteBuenavistaCadanglaanEstiponaLinaoMaasinMatindegMaungibNayaNilasin 1stNilasin 2ndPoblacion 1Poblacion 2Poblacion 3PorocSingat
PANIQUI AbogadoAcocolaoAduasApulidBalaoangBarang (Borang)BrillanteBurgosCabayaoasanCananCarinoCayangaColibangbangCoralDapdapEstacionMabilangManaoisMatalapitapNagmisaanNancamarinanNipacoPatalanPoblacion NortePoblacion SurRang-ayanSalumagueSamputSan CarlosSan IsidroSan Juan de MillaSanta InesSinigpitTablangVentenilla
15818890
34414883
12575
10697
1007563
10595
185
16197
2341795
10107
1057817
10.110.17.86.72.7
20.57.26.79.4
10.37.0
13.37.96.78.49.2
13313544
257944561416362595256715097
242116502317117202012101517818
18.015.636.419.524.537.818.017.131.732.320.319.226.823.916.018.6
291323134601242128186116169159159127119176145282
355
13362323332143
1.01.53.72.21.24.71.12.61.21.91.92.41.70.62.81.1

282
The Many Faces of Poverty (Volume 9)
Table 3. Education Indicators, by Barangay, Province of Tarlac, 2014-2017
Number ofchildren (6-
11 years old)
Children notattending
elementary school(6-11 years old)
Number ofchildren (12-15 years old)
Children not attendinghigh school
(12-15 years old)
Number ofchildren (6-
15 yearsold)
Children notattending school(6-15 years old)
BarangayMunicipality
Magnitude Magnitude MagnitudeProportion Proportion Proportion
37043846914115324965
148263
4538411418236
1223
12.28.78.79.9
11.89.29.28.18.7
26929126110110219551
103174
587039271948162732
21.624.114.926.718.624.631.426.218.4
639729730242255444116251437
122328104
1004
10
1.93.23.84.11.62.30
1.62.3
10511621668109130782071982709515513915471
812157325176
12126
1073
7.610.36.9
10.32.81.56.48.23.04.4
12.63.97.24.54.2
6257
12046797937
10910416869
109768946
161529101615103019231527162910
25.826.324.221.720.319.027.027.518.313.721.724.821.132.621.7
167173336114188209115316302438164264215243117
925255295556682
5.41.21.51.82.72.41.72.81.71.13.02.32.83.31.7
SAN CLEMENTE BallocBambanCasipoCatagudinganDaldalayapDoclong 1Doclong 2MaasinNagsabaranPit-aoPoblacion NortePoblacion Sur
RAMOS Coral-IlocoGuitebPancePoblacion CenterPoblacion NorthPoblacion SouthSan JuanSan RaymundoToledo
SAN JOSE BurgosDavidIbaLabneyLawacamulagLubiganMaamotMababanabaMorionesPaoSan Juan de ValdezSulaVilla Aglipay
SAN MANUEL ColubotLanatLegaspiMangandingayMatarannocPacpacoPoblacionSalcedoSan AgustinSan FelipeSan JacintoSan MiguelSan NarcisoSan VicenteSanta Maria
1891142657799171
2008213254159
161422
1075
15894
13
8.512.37.73.5
12.77.77.07.59.86.87.48.2
1271061436485841
146569731
108
19232583
125514178
18
15.021.714.313.916.75.229.337.725.017.525.816.7
3162204093
12714911234613822985
267
4711403
115510
1.33.22.51.13.10
2.73.23.62.21.20
238218362215178148445343377187162392532
38453415178
100232724104176
16.020.69.47.09.65.4
22.56.77.2
12.86.2
10.514.3
194128291142111137295218226136107294345
856594373832
22234574634
138125
43.850.832.326.134.223.475.315.625.233.831.846.936.2
432346653357289285740561603323269686877
34603310187
118112115114936
7.917.35.12.86.22.5
15.92.03.54.64.17.14.1

The Many Faces of Poverty (Volume 9)
283
Table 3. Education Indicators, by Barangay, Province of Tarlac, 2014-2017
Number ofchildren (6-
11 years old)
Children notattending
elementary school(6-11 years old)
Number ofchildren (12-15 years old)
Children not attendinghigh school
(12-15 years old)
Number ofchildren (6-
15 yearsold)
Children notattending school(6-15 years old)
BarangayMunicipality
Magnitude Magnitude MagnitudeProportion Proportion Proportion
14913911910113180
13870
21530820311822215416218212822493
23019247
205264
1221149
12378
31362910159
15238
186
18142
1528
8.115.111.88.99.23.85.1
11.414.411.714.38.56.85.89.3
12.66.28.06.57.87.34.37.3
10.6
9585897173447833
12918911073
14910477
11268
11664
10413228
139141
2234242824181385155232034262338214117344563220
23.240.027.039.432.940.916.724.239.529.120.927.422.825.029.933.930.935.326.632.734.121.423.014.2
24422420817220412421610334449731319137125823929419634015733432475
344405
61587
19544
2024131210129
134
1158
200
129
2.56.73.84.19.34.01.93.95.84.84.26.32.74.73.84.42.03.23.22.46.20
3.52.2
529335171291231171252178226254212248328293196183360246331178244339201257619188
3018122225172220141121162424162131272830172210218420
5.75.47.07.6
10.89.98.7
11.26.24.39.96.57.38.28.2
11.58.6
11.08.5
16.97.06.55.08.2
13.610.6
34019714117912070
12693
140151111123216166109114266173232162173192146163382114
853433623119222117383826624623276634515944713657
11434
25.017.323.434.625.827.117.522.612.125.234.221.128.727.721.123.724.819.722.036.425.437.024.735.029.829.8
869532312470351241378271366405323371544459305297626419563340417531347420
1001302
44117
201069
111
13142029138
10221011227
2710133410
5.12.12.24.32.82.52.44.10.33.24.35.45.32.82.63.43.52.42.06.51.75.12.93.13.43.3
VICTORIA BaculongBalayangBalbalotoBangarBantogBatangbatangBuloCabuluanCalibunganCanaremCruzLalapacMaluidMangolagoMasalasaPalacpalacSan AgustinSan AndresSan Fernando (Pob.)San FranciscoSan Gavino (Pob.)San JacintoSan Nicolas (Pob.)San VicenteSanta BarbaraSanta Lucia (Pob.)
SANTA IGNACIA BaldiosBotbotonesCaanamonganCabaruanCabugbuganCaduldulaoanCalipayanMacaguingNambalanPadapadaPilpilaPinpinasPoblacion EastPoblacion WestPugo-CecilioSan FranciscoSan SoteroSan VicenteSanta Ines CentroSanta Ines EastSanta Ines WestTaguiporoTimmaguabVargas
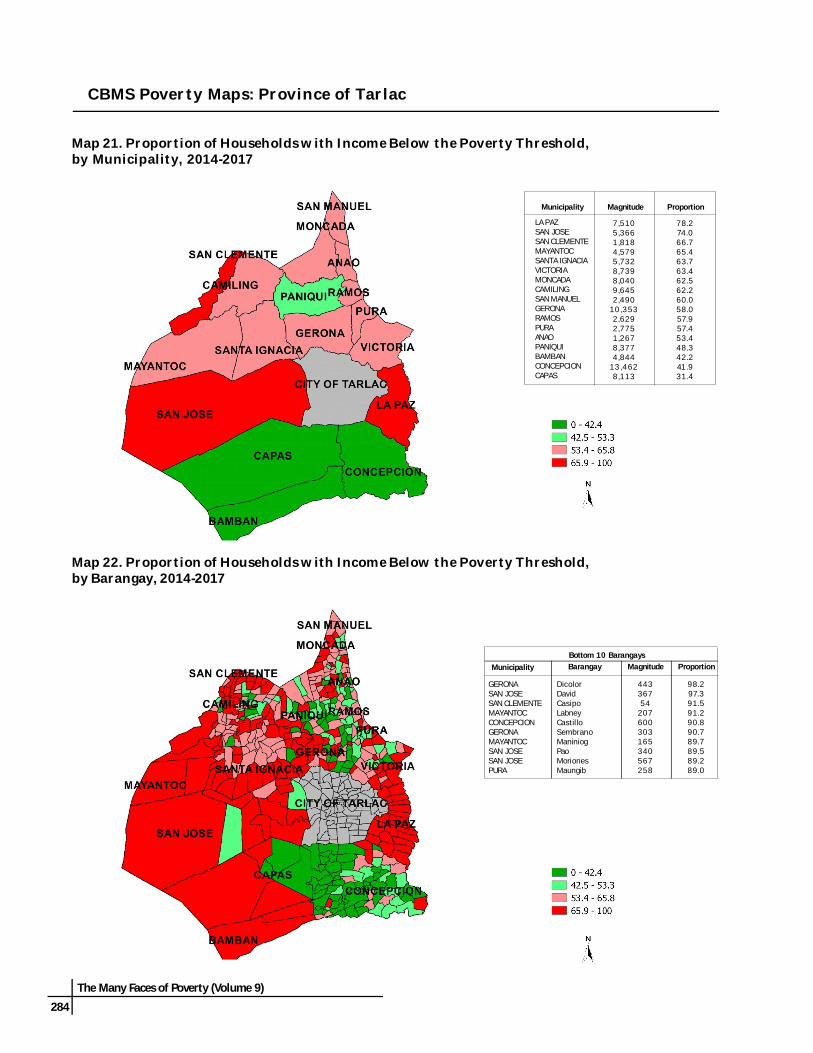
284
The Many Faces of Poverty (Volume 9)
Map 22. Proportion of Households with Income Below the Poverty Threshold,by Barangay, 2014-2017
Map 21. Proportion of Households with Income Below the Poverty Threshold,by Municipality, 2014-2017
CBMS Poverty Maps: Province of Tarlac
Barangay Magnitude ProportionMunicipalityBottom 10 Barangays
GERONASAN JOSESAN CLEMENTEMAYANTOCCONCEPCIONGERONAMAYANTOCSAN JOSESAN JOSEPURA
DicolorDavidCasipoLabneyCastilloSembranoManiniogPaoMorionesMaungib
44336754
207600303165340567258
98.297.391.591.290.890.789.789.589.289.0
Magnitude ProportionMunicipality
LA PAZSAN JOSESAN CLEMENTEMAYANTOCSANTA IGNACIAVICTORIAMONCADACAMILINGSAN MANUELGERONARAMOSPURAANAOPANIQUIBAMBANCONCEPCIONCAPAS
7,5105,3661,8184,5795,7328,7398,0409,6452,490
10,3532,6292,7751,2678,3774,844
13,4628,113
78.274.066.765.463.763.462.562.260.058.057.957.453.448.342.241.931.4

The Many Faces of Poverty (Volume 9)
285
CBMS Poverty Maps: Province of Tarlac
Map 23. Proportion of Households with Income Below the Food Threshold,by Municipality, 2014-2017
Map 24. Proportion of Households with Income Below the Food Threshold,by Barangay, 2014-2017
Barangay Magnitude ProportionMunicipality
Bottom 10 Barangays
GERONASAN JOSEGERONACONCEPCIONGERONAMAYANTOCSAN CLEMENTEMAYANTOCCAPASLA PAZ
DicolorDavidSembranoCastilloCaturayLabneyCasipoManiniogSanta JulianaLaungcupang
43636330257323418949
152617278
96.796.390.486.784.883.383.182.681.981.3
Magnitude ProportionMunicipality
LA PAZSAN JOSESAN CLEMENTEMAYANTOCSANTA IGNACIAVICTORIACAMILINGMONCADAGERONASAN MANUELPURARAMOSANAOPANIQUIBAMBANCONCEPCIONCAPAS
6,6654,4671,5023,7654,7067,2097,8056,3818,4541,8912,2032,047946
5,7763,6229,5565,269
69.461.655.153.852.352.350.349.647.345.545.545.139.833.331.629.720.4

286
The Many Faces of Poverty (Volume 9)
Map 26. Proportion of Households who Experienced Hunger Due to Food Shortage,by Barangay, 2014-2017
Map 25. Proportion of Households who Experienced Hunger Due to Food Shortage,by Municipality, 2014-2017
CBMS Poverty Maps: Province of Tarlac
Barangay Magnitude ProportionMunicipalityBottom 10 Barangays
VICTORIACAPASGERONAVICTORIAVICTORIAGERONAMONCADACAMILINGVICTORIACONCEPCION
CruzBuenoSanta LuciaBangarBalayangTangcaranSanta MonicaManupegSan FranciscoCalius Gueco
33620178
2123014973114433
84.268.843.843.339.823.719.915.513.613.4
Magnitude ProportionMunicipality
VICTORIACAMILINGMAYANTOCSANTA IGNACIACAPASLA PAZSAN JOSEMONCADAGERONAPANIQUICONCEPCIONPURASAN MANUELRAMOSSAN CLEMENTEANAOBAMBAN
1,2834551952315001248014118716426932201796
11
9.32.92.82.61.91.31.11.11.00.90.80.70.50.40.30.30.1

The Many Faces of Poverty (Volume 9)
287
Table 4. Income Poverty and Hunger Indicators, by Barangay, Province of Tarlac, 2014-2017
30884190112535129111489651256111346107115
38.059.168.365.256.061.651.536.767.745.346.458.626.956.060.451.145.555.8
136932748345461684297641164381357687
16.546.353.353.641.552.346.520.351.227.436.747.117.239.443.338.932.342.2
000000001000014000
00000000
0.60000
0.92.1000
9373062051
452242
1,01598
5904264
236243343205
32.327.88.9
33.374.851.655.936.241.110.320.341.072.574.250.5
6541931429
39219282653
4062040177215281130
22.517.66.2
19.064.940.945.519.628.34.9
12.730.864.260.832.0
000000602003000
000000
0.30
0.100
0.5000
Households with income below thepoverty threshold
Households with income below thefood threshold
Households who experienced hungerdue to food shortage
BarangayMunicipality
Magnitude Magnitude MagnitudeProportion Proportion Proportion
8614116144316817619941814737018211613521631714514612535179114255586
54.466.854.873.363.270.471.670.661.268.558.370.363.150.672.070.770.938.858.380.648.347.670.7
661141323771261321653411203081491011041642771091089631
15682
199489
41.854.044.962.447.452.859.457.650.057.047.861.248.638.463.053.252.429.851.770.334.737.159.0
084
342230
274
1413956
1400431701
29
03.81.45.68.31.20
4.61.72.64.25.52.31.43.200
1.25.07.70
0.23.5
ANAO Baguindoc (Baguinloc)BantogCamposCarmenCasiliDon RamonHernandoPoblacionRizalSan Francisco EastSan Francisco WestSan Jose NorthSan Jose SouthSan JuanSan RoqueSanto DomingoSinenseSuaverdez
BAMBAN
CAMILING Anoling 1stAnoling 2ndAnoling 3rdBacabacBacsayBancay 1stBancay 2ndBiladBirbiraBobon 1stBobon 2ndBobon CaarosipanCabanabaanCacamilingan NorteCacamilingan SurCaniagCaraelCayaoanCayasanFloridaLasongLibuegMalacampa
AnupulBanabaBangcuCulubasaDela CruzLa PazLourdesMalonzoSan Nicolas (Pob.)San PedroSan RafaelSan RoqueSan VicenteSanto NiñoVirgen de los Remedios(Pacalcal)

288
The Many Faces of Poverty (Volume 9)
Table 4. Income Poverty and Hunger Indicators, by Barangay, Province of Tarlac, 2014-2017
84452012075315540895501001601233192052216376
1088130818521017523711516171
1148013310615382
56.463.464.052.458.267.173.953.751.566.274.160.676.362.150.059.541.360.066.470.063.164.661.471.258.456.962.341.037.250.440.686.034.3
6938
16115337
119354713581
13598
26917618
118648462
26114116014920184
134628948
11377
13563
46.353.551.338.740.751.564.140.136.153.662.548.364.453.340.943.134.846.750.859.348.149.252.360.442.647.354.432.022.342.829.575.826.4
1611150
11117006
120
285011
156
231012760635151
131
10.715.54.80
12.10.43.100
4.05.60
6.71.50
0.40.58.34.95.23.43.72.51.80
2.12.61.80.51.90.47.30.4
Households with income below thepoverty threshold
Households with income below thefood threshold
Households who experienced hungerdue to food shortage
BarangayMunicipality
Magnitude Magnitude MagnitudeProportion Proportion Proportion
394208
1256253637347279183200104117349
1,088669734149111426221388
24.571.223.829.731.730.025.936.017.926.324.480.637.088.833.536.323.635.714.235.6
2311618441453822351551331124861
270659617454945929785
227
14.455.116.017.019.020.314.426.110.012.112.762.422.481.920.722.912.624.95.5
20.8
7201280
400001110
3418
101013
4915
0.468.80.50
2.0000
0.10.30.20
1.22.44.60
0.20.33.11.4
CAMILING ManakemManupegMarawiMatubogNagrambacanPalimbo ProperPalimbo-CaarosipanPao 1stPao 2ndPao 3rdPapaacPindangan 1stPindangan 2ndPoblacion BPoblacion DPoblacion EPoblacion GPoblacion HPoblacion JSanta MariaSawatSinilian 1stSinilian 2ndSinilian 3rdSinilian CacalibosoanSinulatan 1stSinulatan 2ndSurgui 1stSurgui 2ndSurgui 3rdTambuganTelbangTuec
CAPAS ArangurenBuenoCristo ReyCubcub (Pob.)Cutcut 1stCutcut 2ndDoloresEstrada (Calingcuan)LawyMangaManlapigMarugluO’DonnellSanta JulianaSanta LuciaSanta RitaSanto Domingo 1stSanto Domingo 2ndSanto RosarioTalaga

The Many Faces of Poverty (Volume 9)
289
Table 4. Income Poverty and Hunger Indicators, by Barangay, Province of Tarlac, 2014-2017
43258513211569460012029683575200122464162152267881284681632864243992186542744261773228524610435382852642532738936518518337758579
27.164.823.346.664.190.828.144.937.159.239.747.877.139.048.936.933.122.768.446.746.834.258.649.441.143.321.019.637.627.630.825.131.421.862.864.25.7
26.130.743.848.849.956.024.853.7
24843862704975735417759
43611569
3541061022245563
3841102052942861395681972061181817916453
21240
57858935
16750
23713211926135478
15.648.510.928.345.986.712.626.926.344.922.827.158.825.532.830.920.711.256.131.533.623.742.031.535.731.110.113.021.217.320.512.818.910.642.658.93.816.017.228.434.832.438.815.044.3
000
33200003030002013000091
330070003300000
3140
891923
000
13.40.20000
0.30
1.2000
0.30
0.20.40000
2.00.15.200
8.2000
0.30.800000
3.71.10
13.28.12.1
24419423211738116621931111321424488
443166
37.358.852.653.775.751.938.672.849.834.788.421.398.268.6
18916017299
32711412427010710823437
436114
28.948.539.045.465.035.621.963.247.117.584.89.0
96.747.1
30000050122010
0.500000
0.90
0.40.30.70
0.20
Households with income below thepoverty threshold
Households with income below thefood threshold
Households who experienced hungerdue to food shortage
BarangayMunicipality
Magnitude Magnitude MagnitudeProportion Proportion Proportion
GERONA AbagonAmacalanApsayanAysonBawaBuenlagBularitCalayaanCarbonelCardonaCaturayDanzoDicolorDon Basilio
CONCEPCION AlfonsoBalutuCafeCalius GuecoCaluluanCastilloCorazon de JesusCulatinganDunganDutung-A-MatasGreen VillageLilibanganMabilogMagaoMalupaMinanePanalicsian (Panalicsican)PandoParangParulungPitabunanSan Agustin (Murcia)San AntonioSan BartolomeSan FranciscoSan Isidro (Almendras)San Jose (Pob.)San Juan (Castro)San MartinSan Nicolas (Pob.)San Nicolas BalasSan Vicente (Caluis/Cobra)Santa CruzSanta MariaSanta MonicaSanta RitaSanta RosaSantiagoSanto CristoSanto NiñoSanto Rosario (Magunting)Talimunduc MarimlaTalimunduc San MiguelTelabancaTinang

290
The Many Faces of Poverty (Volume 9)
Table 4. Income Poverty and Hunger Indicators, by Barangay, Province of Tarlac, 2014-2017
15588499155103287172861351075011292901003161939042934322626934312828530352323711136267
38.223.862.540.526.274.068.041.368.221.770.641.672.340.383.874.832.863.779.034.087.183.571.963.290.719.981.868.965.774.8
7944
4209870
26014469
11342
42481
26377
29117337
36730815224130410721430233
292607113238
19.511.952.625.617.867.056.933.257.18.559.726.165.631.077.267.113.554.571.022.978.074.060.147.590.412.673.958.854.666.7
0060102200606601202
1100
7800010
490
00
0.80
0.30
0.81.000
0.80
1.52.40
0.40.70
0.51.700
43.8000
0.30
23.70
Households with income below thepoverty threshold
Households with income below thefood threshold
Households who experienced hungerdue to food shortage
BarangayMunicipality
Magnitude Magnitude MagnitudeProportion Proportion Proportion
280400337330607742497211446180295481317252197251243222289612321
76.984.476.882.366.385.983.271.885.082.286.375.680.375.074.383.482.779.669.070.385.8
252375304297505655459188394160278410291222179210226200248516296
69.279.169.274.155.275.876.963.975.073.181.364.573.766.167.569.876.971.759.259.279.1
140202
104
21101211131013030107
0.30.80
0.50
0.21.71.44.04.63.51.73.33.04.90
1.00
0.20
1.9
9964
264928387
61.162.771.972.463.479.8
7546
215776477
46.345.158.660.648.970.6
711181
106
4.310.84.90.87.65.5
LA PAZ BalanoyBantog-CaricutanCaramutanCautComillasDumaraisGuevarraKapanikianLa PurisimaLaraLaungcupangLomboyMacalongMatayumtayumMayangMotricoPaludpudRizalSan Isidro (Pob.)San Roque (Pob.)Sierra
GERONA LunaMabiniMagaspacMalayepMatapitapMatayumcabNew SalemOloybuayaPadapadaParsolinganPinasling (Pinasung)PlastadoPoblacion 1Poblacion 2Poblacion 3QuezonRizalSalapunganSan AgustinSan AntonioSan BartolomeSan JoseSanta LuciaSantiagoSembranoSingatSulipaTagumbaoTangcaranVilla Paz
MAYANTOC AmbalingitBaybayaoasBigbigaBinbinacaCalabtanganCaocaoayan

The Many Faces of Poverty (Volume 9)
291
Table 4. Income Poverty and Hunger Indicators, by Barangay, Province of Tarlac, 2014-2017
1122652141207492165212270378330309199197200227110263
66.755.369.378.391.273.889.757.383.376.165.256.826.468.955.471.669.678.0
892246
126189427152141243322269236120161146188102232
53.046.861.370.083.364.082.638.175.064.853.243.415.956.340.459.364.668.8
70159
1301
358424
158
191
10
4.20
1.32.84.01.90
0.310.81.60.80.40.55.22.26.00.63.0
54522770
21514722816326411217410214625425326336624427420617924811365197436426183112195165188329211159193286102
65.059.152.264.448.259.861.352.367.560.037.156.661.261.754.268.461.556.857.258.567.257.925.856.377.283.268.560.569.180.983.976.757.768.265.265.961.4
4151725216999171124192901347211020819118128919421616713620373361513973871538316215417827316612114323485
49.544.838.850.632.544.946.638.054.246.226.242.650.146.637.354.048.944.846.444.455.037.414.343.170.375.657.344.957.475.579.563.645.451.948.353.951.2
20003000003001200300
1202061
2100480
730000
0.2000
1.000000
1.100
0.20.400
0.600
3.30
0.80
1.10.27.900
2.03.60
19.90000
Households with income below thepoverty threshold
Households with income below thefood threshold
Households who experienced hungerdue to food shortage
BarangayMunicipality
Magnitude Magnitude MagnitudeProportion Proportion Proportion
MONCADA Ablang-SapangAringinAtencioBanaoang EastBanaoang WestBaquero NorteBaquero SurBurgosCalamayCalapanCamangaan EastCamangaan WestCamposanto 1 - NorteCamposanto 1 - SurCamposanto 2CapaoayanLapsingMabiniMaluacPoblacion 1Poblacion 2Poblacion 3Poblacion 4RizalSan JuanSan JulianSan LeonSan PedroSan RoqueSanta Lucia EastSanta Lucia WestSanta MariaSanta MonicaTolega NorteTolega SurTubectubangVilla
MAYANTOC CarabaoanCubcubGayonggayongGossoodLabneyMamonitManiniogMapandanNambalanPedro L. QuinesPitombayogPoblacion NortePoblacion SurRotrottoocSan BartolomeSan JoseTaldiapanTangcarang

292
The Many Faces of Poverty (Volume 9)
Table 4. Income Poverty and Hunger Indicators, by Barangay, Province of Tarlac, 2014-2017
43515010327037211711931925823571312492
111157174406106194182453199156454335161273352218248107195273171145
47.935.429.345.953.948.068.457.545.538.962.438.437.733.459.731.670.756.148.376.570.664.827.146.142.129.142.942.165.955.942.155.774.838.630.8
28310234
1892519599
21517715454584657598
11236573
14413532214668
30924577
18025513516656
14019911271
31.124.19.7
32.136.438.956.938.731.225.547.726.026.622.637.320.363.638.635.856.750.247.611.831.430.813.928.330.540.837.422.040.054.525.315.1
159001000
113010
100300100002
250
35180
13000170
1.72.100
0.1000
1.90.50
0.30
3.00
0.500
0.20000
0.23.10
5.52.20
2.9000
3.80
Households with income below thepoverty threshold
Households with income below thefood threshold
Households who experienced hungerdue to food shortage
BarangayMunicipality
Magnitude Magnitude MagnitudeProportion Proportion Proportion
19042410042020913112025812811111911192
12869
165
51.474.063.751.664.982.448.889.059.047.847.652.447.751.037.545.0
12638883
31316811586
22810496977768
11233
109
34.167.752.938.552.272.335.078.647.941.438.836.335.244.617.929.7
000
29000000010200
000
3.60000000
0.50
0.800
PURA BaliteBuenavistaCadanglaanEstiponaLinaoMaasinMatindegMaungibNayaNilasin 1stNilasin 2ndPoblacion 1Poblacion 2Poblacion 3PorocSingat
PANIQUI AbogadoAcocolaoAduasApulidBalaoangBarang (Borang)BrillanteBurgosCabayaoasanCananCarinoCayangaColibangbangCoralDapdapEstacionMabilangManaoisMatalapitapNagmisaanNancamarinanNipacoPatalanPoblacion NortePoblacion SurRang-ayanSalumagueSamputSan CarlosSan IsidroSan Juan de MillaSanta InesSinigpitTablangVentenilla

The Many Faces of Poverty (Volume 9)
293
Table 4. Income Poverty and Hunger Indicators, by Barangay, Province of Tarlac, 2014-2017
48246345823217930659163287
60.061.950.660.759.159.844.053.363.9
37936535317714925440
114216
47.248.839.046.349.249.629.937.348.1
090000521
01.20000
3.70.70.2
139185549772177114293138165111273
38.264.791.570.348.679.470.876.782.158.171.276.9
1101514984501519225312312291226
30.252.883.160.933.867.757.166.273.243.058.363.7
000000081000
0000000
2.10.6000
Households with income below thepoverty threshold
Households with income below thefood threshold
Households who experienced hungerdue to food shortage
BarangayMunicipality
Magnitude Magnitude MagnitudeProportion Proportion Proportion
428367574292210228595420567340162329854
85.397.376.366.766.578.184.461.089.289.550.351.871.0
380363463232148201495318509299104222733
75.796.361.653.046.868.870.246.280.078.732.335.060.9
160
152909400
2410
3.20
2.00.52.80
1.30.600
7.50.20
12411819612714415410523923731299
189144171131
63.658.450.974.369.267.855.960.465.768.052.751.554.353.159.8
86831411031141158220016325173144110116110
44.141.136.660.254.850.743.650.545.254.738.839.241.536.050.2
0100
105000102001
00.500
4.82.2000
0.20
0.500
0.5
SAN CLEMENTE BallocBambanCasipoCatagudinganDaldalayapDoclong 1Doclong 2MaasinNagsabaranPit-aoPoblacion NortePoblacion Sur
RAMOS Coral-IlocoGuitebPancePoblacion CenterPoblacion NorthPoblacion SouthSan JuanSan RaymundoToledo
SAN JOSE BurgosDavidIbaLabneyLawacamulagLubiganMaamotMababanabaMorionesPaoSan Juan de ValdezSulaVilla Aglipay
SAN MANUEL ColubotLanatLegaspiMangandingayMatarannocPacpacoPoblacionSalcedoSan AgustinSan FelipeSan JacintoSan MiguelSan NarcisoSan VicenteSanta Maria

294
The Many Faces of Poverty (Volume 9)
Table 4. Income Poverty and Hunger Indicators, by Barangay, Province of Tarlac, 2014-2017
23624918714817311522987
34045229713836027318322618424823132633664
284366
58.967.165.866.161.668.972.261.762.866.765.758.561.161.360.458.486.054.968.568.368.459.861.557.1
19320516312615388
18666
28138924711329923513717716119919127429750
200276
48.155.357.456.254.452.758.746.851.957.454.647.950.852.845.245.775.244.056.757.460.546.743.343.1
41712212
1203
33301162308
131901
26620
1.04.64.29.40.77.20
2.16.14.42.42.50.30.70
2.16.14.20
0.25.35.60.40
556583300286371195208280360240344354392513303286354292274285196426282306476277
62.277.076.958.474.365.444.685.463.644.986.277.065.284.277.576.550.164.042.688.235.164.162.765.841.983.2
442532273228323162148255309164310317340463255244252228199253133343241250296249
49.470.370.046.564.754.431.877.754.630.777.768.956.676.065.265.235.650.030.978.323.851.653.653.826.174.8
113301
0212190
56005
336335110
16539
441
3540120
12.639.8
043.33.80
12.000
0.984.27.20.80.20.30
2.311.61.4
13.60.25.38.90.20.20
Households with income below thepoverty threshold
Households with income below thefood threshold
Households who experienced hungerdue to food shortage
BarangayMunicipality
Magnitude Magnitude MagnitudeProportion Proportion Proportion
VICTORIA BaculongBalayangBalbalotoBangarBantogBatangbatangBuloCabuluanCalibunganCanaremCruzLalapacMaluidMangolagoMasalasaPalacpalacSan AgustinSan AndresSan Fernando (Pob.)San FranciscoSan Gavino (Pob.)San JacintoSan Nicolas (Pob.)San VicenteSanta BarbaraSanta Lucia (Pob.)
SANTA IGNACIA BaldiosBotbotonesCaanamonganCabaruanCabugbuganCaduldulaoanCalipayanMacaguingNambalanPadapadaPilpilaPinpinasPoblacion EastPoblacion WestPugo-CecilioSan FranciscoSan SoteroSan VicenteSanta Ines CentroSanta Ines EastSanta Ines WestTaguiporoTimmaguabVargas

The Many Faces of Poverty (Volume 9)
295
Map 28. Unemployment Rate (15 years old and above), by Barangay, 2014-2017
Map 27. Unemployment Rate (15 years old and above), by Municipality, 2014-2017
CBMS Poverty Maps: Province of Tarlac
Barangay Magnitude ProportionMunicipalityBottom 10 Barangays
SAN JOSECONCEPCIONPANIQUIGERONAGERONAMAYANTOCSAN CLEMENTEPANIQUIMAYANTOCMONCADA
MaamotTalimunduc San MiguelNagmisaanBawaSalapunganPitombayogPit-aoSinigpitPedro L. QuinesPoblacion 2
23041896
19515416512381
168163
96.249.944.733.129.928.127.026.024.824.3
Magnitude ProportionMunicipality
MAYANTOCSAN JOSEBAMBANSANTA IGNACIACAPASSAN CLEMENTESAN MANUELPANIQUILA PAZPURARAMOSVICTORIACONCEPCIONGERONAMONCADACAMILINGANAO
1,2801,0421,582
9172,973323391
1,770992393472
1,2752,8821,271903815152
14.814.111.49.29.09.08.98.58.37.97.36.76.66.46.25.14.4

296
The Many Faces of Poverty (Volume 9)
Map 29. Proportion of Persons who are Victims of Crime, by Municipality, 2014-2017
Map 30. Proportion of Persons who are Victims of Crime, by Barangay, 2014-2017
Barangay Magnitude ProportionMunicipality
Bottom 10 Barangays
CAMILINGCONCEPCIONGERONAMONCADASAN JOSECAMILINGCAMILINGSAN MANUELCONCEPCIONSAN CLEMENTE
Bobon 2ndDunganTangcaranSanta MonicaSan Juan de ValdezNagrambacanPoblacion HMatarannocCalius GuecoDaldalayap
7424412221
0.60.40.30.30.30.30.30.20.20.2
Magnitude ProportionMunicipality
CAMILINGCONCEPCIONGERONAVICTORIACAPASMONCADALA PAZMAYANTOCSAN JOSEPANIQUIPURASAN MANUELANAOSANTA IGNACIASAN CLEMENTERAMOSBAMBAN
27272117171186644332200
0.00.00.00.00.00.00.00.00.00.00.00.00.00.00.000
CBMS Poverty Maps: Province of Tarlac

The Many Faces of Poverty (Volume 9)
297
Table 5. Unemployment and Victims of Crime Indicators, by Barangay,Province of Tarlac, 2014-2017
Unemployment rate(15 years old and above)
Persons who are victims of crimesNumber of persons in thelabor force
(15 years old and above)
BarangayMunicipality
ProportionProportion MagnitudeMagnitude
11518590
191290118150107250167308110154153274138351275
4132
1510346
146
16575
247
101
3.57.02.27.93.42.52.75.65.63.65.24.54.53.38.85.12.80.4
000000000100001010
000000000
0.20000
0.10
0.10
3,5391,566252181537623
1,953308
1,640502454786391741448
490372
41911
1313640
14593
12433
12144
13.823.81.6
10.52.0
21.01.8
13.08.81.80.7
15.88.4
16.39.8
000000000000000
000000000000000
15819332866340322319656326361136218721645643618321432364
226225534714
51310442256
3716403498
357
1014123
226
1049
3.26.73.06.65.52.23.16.66.16.59.44.83.77.71.65.56.53.74.79.72.71.96.9
00002010017100000000002
0000
0.20
0.1000
0.60.20000000000
0.1
ANAO Baguindoc (Baguinloc)BantogCamposCarmenCasiliDon RamonHernandoPoblacionRizalSan Francisco EastSan Francisco WestSan Jose NorthSan Jose SouthSan JuanSan RoqueSanto DomingoSinenseSuaverdez
BAMBAN
CAMILING Anoling 1stAnoling 2ndAnoling 3rdBacabacBacsayBancay 1stBancay 2ndBiladBirbiraBobon 1stBobon 2ndBobon CaarosipanCabanabaanCacamilingan NorteCacamilingan SurCaniagCaraelCayaoanCayasanFloridaLasongLibuegMalacampa
AnupulBanabaBangcuCulubasaDela CruzLa PazLourdesMalonzoSan Nicolas (Pob.)San PedroSan RafaelSan RoqueSan VicenteSanto NiñoVirgen de los Remedios(Pacalcal)

298
The Many Faces of Poverty (Volume 9)
Table 5. Unemployment and Victims of Crime Indicators, by Barangay,Province of Tarlac, 2014-2017
Unemployment rate(15 years old and above)
Persons who are victims of crimesNumber of persons in thelabor force
(15 years old and above)
BarangayMunicipality
ProportionProportion MagnitudeMagnitude
2091233073861392565722058514726820543428142
250195190114454338350269256192333143341231260278156254
127
1915191627969
195
38125083
23172095
16226
133
132092
5.75.76.23.9
13.76.24.74.47.16.17.12.48.80.44.82.00
4.22.65.15.05.73.32.08.36.64.23.81.35.07.25.80.8
101010300110000002000100000002000
0.20
0.10
0.30
0.100
0.20.1000000
0.3000
0.10000000
0.2000
2,010487
5,6951,2272,8261,3931,300754
1,171636626529
3,588880
3,275471643
1,5952,0811,683
13011
59011821864
12211280164332
23222
2193844
273243366
6.52.3
10.49.67.74.69.4
14.96.82.56.96.06.52.56.78.16.817.111.721.7
01407000100001000021
00.10.00
0.1000
0.00000
0.00000
0.00.0
CAMILING ManakemManupegMarawiMatubogNagrambacanPalimbo ProperPalimbo-CaarosipanPao 1stPao 2ndPao 3rdPapaacPindangan 1stPindangan 2ndPoblacion BPoblacion DPoblacion EPoblacion GPoblacion HPoblacion JSanta MariaSawatSinilian 1stSinilian 2ndSinilian 3rdSinilian CacalibosoanSinulatan 1stSinulatan 2ndSurgui 1stSurgui 2ndSurgui 3rdTambuganTelbangTuec
CAPAS ArangurenBuenoCristo ReyCubcub (Pob.)Cutcut 1stCutcut 2ndDoloresEstrada (Calingcuan)LawyMangaManlapigMarugluO’DonnellSanta JulianaSanta LuciaSanta RitaSanto Domingo 1stSanto Domingo 2ndSanto RosarioTalaga

The Many Faces of Poverty (Volume 9)
299
Table 5. Unemployment and Victims of Crime Indicators, by Barangay,Province of Tarlac, 2014-2017
Unemployment rate(15 years old and above)
Persons who are victims of crimesNumber of persons in thelabor force
(15 years old and above)
BarangayMunicipality
ProportionProportion MagnitudeMagnitude
2,5751,190788433
1,250936560
1,052344985873442754535458785475797
1,153589782
2,006899616
1,9761,0552,8651,027119
1,3891,209705
1,426512
1,6271,382702
1,212418
1,179634600838291
1,502
248665
49119119
4429
114676
67155
305698
1544186891
31448690167
123348372
30231115175
5010941816
292
9.65.50.6
11.39.5
12.70.74.02.6
11.67.71.48.92.81.13.8
11.812.313.47.0
11.04.40.15.02.28.23.11.65.90.92.76.82.60.41.81.71.61.24.10.47.9
18.249.95.5
19.4
000220004011000101100301111000000140001100000
000
0.20.0000
0.40
0.00.1000
0.00
0.00.000
0.10
0.00.00.00.0000000
0.10.1000
0.10.000000
849339504214590340719332307913132574117278
805
263
19513421640301079
9.41.55.21.4
33.13.85.84.8133.30.80
6.03.2
00000010002010
000000
0.0000
0.20
0.10
GERONA AbagonAmacalanApsayanAysonBawaBuenlagBularitCalayaanCarbonelCardonaCaturayDanzoDicolorDon Basilio
CONCEPCION AlfonsoBalutuCafeCalius GuecoCaluluanCastilloCorazon de JesusCulatinganDunganDutung-A-MatasGreen VillageLilibanganMabilogMagaoMalupaMinanePanalicsian (Panalicsican)PandoParangParulungPitabunanSan Agustin (Murcia)San AntonioSan BartolomeSan FranciscoSan Isidro (Almendras)San Jose (Pob.)San Juan (Castro)San MartinSan Nicolas (Pob.)San Nicolas BalasSan Vicente (Caluis/Cobra)Santa CruzSanta MariaSanta MonicaSanta RitaSanta RosaSantiagoSanto CristoSanto NiñoSanto Rosario (Magunting)Talimunduc MarimlaTalimunduc San MiguelTelabancaTinang

300
The Many Faces of Poverty (Volume 9)
Table 5. Unemployment and Victims of Crime Indicators, by Barangay,Province of Tarlac, 2014-2017
Unemployment rate(15 years old and above)
Persons who are victims of crimesNumber of persons in thelabor force
(15 years old and above)
BarangayMunicipality
ProportionProportion MagnitudeMagnitude
512655
1,117517461473220265180637
1,106428526341465207357515286905161304287368
9341310
1,071217493
1211832
314513286
12282823121949
154698
4014170
360
545149
2.31.77.40.46.79.55.910.63.31.92.56.54.43.54.11.92.529.92.11.05.013.24.94.60
10.60
5.023.59.9
010000000002100002260010000020
00.1000000000
0.10.10000
0.10.20.200
0.100000
0.30
467643498466915856707354693291446776545435321345413378561
1,350445
2239142739134726632131574939337
38245032726
4.76.12.85.84.31.56.67.39.17.27.07.39.09.0
10.32.09.26.38.9
24.25.8
000000020020010000012
0000000
0.200
0.100
0.100000
0.00.1
255133463152168117
221390162624
8.69.8
19.410.515.520.5
101000
0.20
0.1000
LA PAZ BalanoyBantog-CaricutanCaramutanCautComillasDumaraisGuevarraKapanikianLa PurisimaLaraLaungcupangLomboyMacalongMatayumtayumMayangMotricoPaludpudRizalSan Isidro (Pob.)San Roque (Pob.)Sierra
GERONA LunaMabiniMagaspacMalayepMatapitapMatayumcabNew SalemOloybuayaPadapadaParsolinganPinasling (Pinasung)PlastadoPoblacion 1Poblacion 2Poblacion 3QuezonRizalSalapunganSan AgustinSan AntonioSan BartolomeSan JoseSanta LuciaSantiagoSembranoSingatSulipaTagumbaoTangcaranVilla Paz
MAYANTOC AmbalingitBaybayaoasBigbigaBinbinacaCalabtanganCaocaoayan

The Many Faces of Poverty (Volume 9)
301
Table 5. Unemployment and Victims of Crime Indicators, by Barangay,Province of Tarlac, 2014-2017
Unemployment rate(15 years old and above)
Persons who are victims of crimesNumber of persons in thelabor force
(15 years old and above)
BarangayMunicipality
ProportionProportion MagnitudeMagnitude
1855686
219303831213605415677587674806347413369189414
167
181349
1614
7329
168165107143477861652
8.612.520.95.9
16.219.41.9
12.17.0
24.828.115.91.79.8
18.623.38.5
12.6
000000020100000010
0000000
0.10
0.1000000
0.20
1,032432163356450460292501169338348287462432590515400547534347671277379384411450288212325190215415511244329499191
1317136
219217107
30699
10211049176
1631126168528471612214912959
118
12
1.33.98.01.74.72.00.73.45.92.18.62.11.92.11.74.12.59.03.21.7
24.34.06.94.2
20.76.2
16.37.53.7
11.122.82.9
18.63.73.31.66.3
0000000000000301000000110010000040000
0000000000000
0.20
0.1000000
0.10.100
0.100000
0.30000
MONCADA Ablang-SapangAringinAtencioBanaoang EastBanaoang WestBaquero NorteBaquero SurBurgosCalamayCalapanCamangaan EastCamangaan WestCamposanto 1 - NorteCamposanto 1 - SurCamposanto 2CapaoayanLapsingMabiniMaluacPoblacion 1Poblacion 2Poblacion 3Poblacion 4RizalSan JuanSan JulianSan LeonSan PedroSan RoqueSanta Lucia EastSanta Lucia WestSanta MariaSanta MonicaTolega NorteTolega SurTubectubangVilla
MAYANTOC CarabaoanCubcubGayonggayongGossoodLabneyMamonitManiniogMapandanNambalanPedro L. QuinesPitombayogPoblacion NortePoblacion SurRotrottoocSan BartolomeSan JoseTaldiapanTangcarang

302
The Many Faces of Poverty (Volume 9)
Table 5. Unemployment and Victims of Crime Indicators, by Barangay,Province of Tarlac, 2014-2017
Unemployment rate(15 years old and above)
Persons who are victims of crimesNumber of persons in thelabor force
(15 years old and above)
BarangayMunicipality
ProportionProportion MagnitudeMagnitude
1,254551437812632217158648757767
1,292358244431269741451246494215588289768
1,2161,206615890
1,188368568259416311614620
112312039194
2025747790293
36296733243896446257
1021411672
11931402933815225
8.95.64.64.83.01.812.73.99.810.07.08.11.28.410.89.07.39.87.7
44.77.5
21.57.48.411.72.68.110.08.47.0
11.27.9
26.08.54.0
00000000000000010000000020010000000
000000000000000
0.100000000
0.100
0.00000000
338369160
1,00038283264141228203291259239286289436
352812653815270
1417161614312342
10.47.67.56.59.9
18.110.2
06.18.45.56.25.9
10.88.09.6
1001100000010000
0.100
0.00.1000000
0.10000
PURA BaliteBuenavistaCadanglaanEstiponaLinaoMaasinMatindegMaungibNayaNilasin 1stNilasin 2ndPoblacion 1Poblacion 2Poblacion 3PorocSingat
PANIQUI AbogadoAcocolaoAduasApulidBalaoangBarang (Borang)BrillanteBurgosCabayaoasanCananCarinoCayangaColibangbangCoralDapdapEstacionMabilangManaoisMatalapitapNagmisaanNancamarinanNipacoPatalanPoblacion NortePoblacion SurRang-ayanSalumagueSamputSan CarlosSan IsidroSan Juan de MillaSanta InesSinigpitTablangVentenilla

The Many Faces of Poverty (Volume 9)
303
Table 5. Unemployment and Victims of Crime Indicators, by Barangay,Province of Tarlac, 2014-2017
Unemployment rate(15 years old and above)
Persons who are victims of crimesNumber of persons in thelabor force
(15 years old and above)
BarangayMunicipality
ProportionProportion MagnitudeMagnitude
1,1641,0861,272391454725204446687
11065
106184739101958
9.56.08.34.610.45.44.94.38.4
000000000
000000000
59134899860849948023969733764447379
1,689
626657141988
230145
227446
111
10.519.05.723.219.61.796.220.80.63.116.612.16.6
1000010000400
0.00000
0.10000
0.300
200257420134217234235432329419232423284355209
1816251331328
1880271041222426
9.06.26.09.7
14.313.73.44.2
24.36.44.39.77.76.8
12.4
000020001000000
0000
0.2000
0.1000000
SAN CLEMENTE BallocBambanCasipoCatagudinganDaldalayapDoclong 1Doclong 2MaasinNagsabaranPit-aoPoblacion NortePoblacion Sur
RAMOS Coral-IlocoGuitebPancePoblacion CenterPoblacion NorthPoblacion SouthSan JuanSan RaymundoToledo
SAN JOSE BurgosDavidIbaLabneyLawacamulagLubiganMaamotMababanabaMorionesPaoSan Juan de ValdezSulaVilla Aglipay
SAN MANUEL ColubotLanatLegaspiMangandingayMatarannocPacpacoPoblacionSalcedoSan AgustinSan FelipeSan JacintoSan MiguelSan NarcisoSan VicenteSanta Maria
51037367164207285232507214455162430
26250
1122256
220
1232241
5.16.70
6.710.68.82.64.30
27.013.69.5
000010000001
0000
0.2000000
0.1

304
The Many Faces of Poverty (Volume 9)
Table 5. Unemployment and Victims of Crime Indicators, by Barangay,Province of Tarlac, 2014-2017
Unemployment rate(15 years old and above)
Persons who are victims of crimesNumber of persons in thelabor force
(15 years old and above)
BarangayMunicipality
ProportionProportion MagnitudeMagnitude
404351359283364197364162534755470272615406395419228570324532561134586701
6635391927203417469142103221323912648
24451055129
16.310.010.96.77.4
10.29.3
10.58.6
12.18.93.75.25.28.19.35.3
11.22.54.58.07.59.4
18.4
000000000200000000000000
000000000
0.100000000000000
1,525872409692595372718386753903377534826827544456
1,123667895544899987539547
1,638389
725513303752052613916151294116665255580
1853689529
4.76.33.20.40
0.810.45.26.96.8
10.33.0
18.33.57.53.55.97.80.6
10.18.9
18.76.7
16.33.22.3
10210010311000000002101102
0.00
0.10.000
0.10
0.10.00.100000000
0.10.00
0.10.10
0.1
VICTORIA BaculongBalayangBalbalotoBangarBantogBatangbatangBuloCabuluanCalibunganCanaremCruzLalapacMaluidMangolagoMasalasaPalacpalacSan AgustinSan AndresSan Fernando (Pob.)San FranciscoSan Gavino (Pob.)San JacintoSan Nicolas (Pob.)San VicenteSanta BarbaraSanta Lucia (Pob.)
SANTA IGNACIA BaldiosBotbotonesCaanamonganCabaruanCabugbuganCaduldulaoanCalipayanMacaguingNambalanPadapadaPilpilaPinpinasPoblacion EastPoblacion WestPugo-CecilioSan FranciscoSan SoteroSan VicenteSanta Ines CentroSanta Ines EastSanta Ines WestTaguiporoTimmaguabVargas

The Many Faces of Poverty (Volume 9)
305
CBMS Poverty Maps: Province of Tarlac
Map 31. CBMS Composite Indicator, by Municipality, 2014-2017
Map 32. CBMS Composite Indicator, by Barangay, 2014-2017
Barangay AverageMunicipality
Bottom 10 Barangays
SAN JOSEGERONAVICTORIASAN JOSECAPASMAYANTOCSAN JOSEGERONAMONCADAGERONA
MaamotCaturayCruzPaoBuenoLabneyMorionesDicolorSan JuanSanta Lucia
3.23.23.02.72.62.42.42.42.42.4
AverageMunicipality
SAN JOSELA PAZMAYANTOCSAN CLEMENTEVICTORIACAMILINGSANTA IGNACIASAN MANUELMONCADARAMOSGERONAPURAPANIQUIANAOBAMBANCONCEPCIONCAPAS
1.91.81.61.51.51.41.41.31.31.31.21.21.01.01.00.90.8

306
The Many Faces of Poverty (Volume 9)
Table 6. CBMS Composite Indicator, by Barangay, Province of Tarlac, 2014-2017
BarangayMunicipality Barangay CBMS CompositeIndicator
Municipality
0.61.21.31.31.01.21.10.71.30.80.91.10.61.01.31.00.81.0
1.31.61.41.01.41.41.61.11.01.42.01.31.81.21.01.20.91.41.41.61.31.51.31.41.21.31.51.00.71.10.92.00.7
0.52.60.60.81.00.60.70.90.40.50.51.70.82.30.70.70.61.00.81.2
0.80.80.20.71.51.11.10.70.80.20.41.01.62.31.0
1.11.41.21.71.51.31.51.61.31.51.31.51.31.11.51.51.60.81.41.91.01.01.6
CBMS CompositeIndicator
ANAO Baguindoc (Baguinloc)BantogCamposCarmenCasiliDon RamonHernandoPoblacionRizalSan Francisco EastSan Francisco WestSan Jose NorthSan Jose SouthSan JuanSan RoqueSanto DomingoSinenseSuaverdez
BAMBAN
CAMILING Anoling 1stAnoling 2ndAnoling 3rdBacabacBacsayBancay 1stBancay 2ndBiladBirbiraBobon 1stBobon 2ndBobon CaarosipanCabanabaanCacamilingan NorteCacamilingan SurCaniagCaraelCayaoanCayasanFloridaLasongLibuegMalacampa
AnupulBanabaBangcuCulubasaDela CruzLa PazLourdesMalonzoSan Nicolas (Pob.)San PedroSan RafaelSan RoqueSan VicenteSanto NiñoVirgen de los Remedios(Pacalcal)
CAMILING ManakemManupegMarawiMatubogNagrambacanPalimbo ProperPalimbo-CaarosipanPao 1stPao 2ndPao 3rdPapaacPindangan 1stPindangan 2ndPoblacion BPoblacion DPoblacion EPoblacion GPoblacion HPoblacion JSanta MariaSawatSinilian 1stSinilian 2ndSinilian 3rdSinilian CacalibosoanSinulatan 1stSinulatan 2ndSurgui 1stSurgui 2ndSurgui 3rdTambuganTelbangTuec
CAPAS ArangurenBuenoCristo ReyCubcub (Pob.)Cutcut 1stCutcut 2ndDoloresEstrada (Calingcuan)LawyMangaManlapigMarugluO’DonnellSanta JulianaSanta LuciaSanta RitaSanto Domingo 1stSanto Domingo 2ndSanto RosarioTalaga
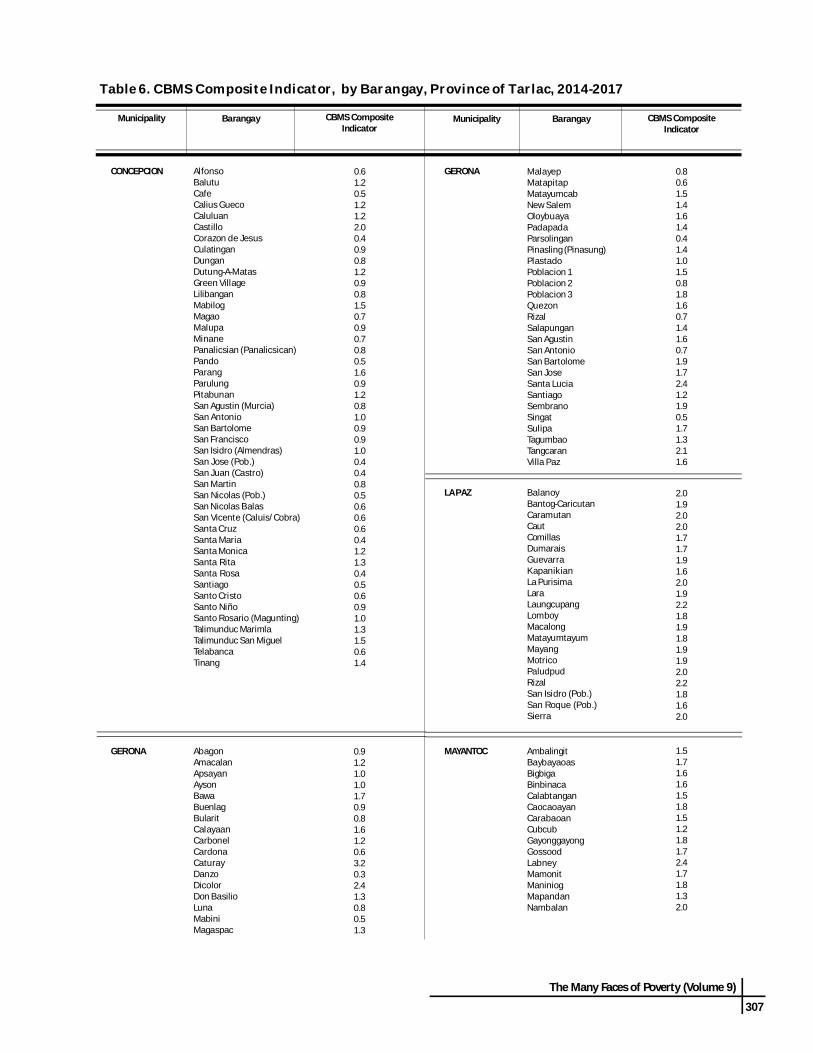
The Many Faces of Poverty (Volume 9)
307
Table 6. CBMS Composite Indicator, by Barangay, Province of Tarlac, 2014-2017
BarangayMunicipality Barangay CBMS CompositeIndicator
Municipality
0.61.20.51.21.22.00.40.90.81.20.90.81.50.70.90.70.80.51.60.91.20.81.00.90.91.00.40.40.80.50.60.60.60.41.21.30.40.50.60.91.01.31.50.61.4
0.80.61.51.41.61.40.41.41.01.50.81.81.60.71.41.60.71.91.72.41.21.90.51.71.32.11.6
2.01.92.02.01.71.71.91.62.01.92.21.81.91.81.91.92.02.21.81.62.0
1.51.71.61.61.51.81.51.21.81.72.41.71.81.32.0
0.91.21.01.01.70.90.81.61.20.63.20.32.41.30.80.51.3
CBMS CompositeIndicator
LA PAZ BalanoyBantog-CaricutanCaramutanCautComillasDumaraisGuevarraKapanikianLa PurisimaLaraLaungcupangLomboyMacalongMatayumtayumMayangMotricoPaludpudRizalSan Isidro (Pob.)San Roque (Pob.)Sierra
GERONA MalayepMatapitapMatayumcabNew SalemOloybuayaPadapadaParsolinganPinasling (Pinasung)PlastadoPoblacion 1Poblacion 2Poblacion 3QuezonRizalSalapunganSan AgustinSan AntonioSan BartolomeSan JoseSanta LuciaSantiagoSembranoSingatSulipaTagumbaoTangcaranVilla Paz
MAYANTOC AmbalingitBaybayaoasBigbigaBinbinacaCalabtanganCaocaoayanCarabaoanCubcubGayonggayongGossoodLabneyMamonitManiniogMapandanNambalan
GERONA AbagonAmacalanApsayanAysonBawaBuenlagBularitCalayaanCarbonelCardonaCaturayDanzoDicolorDon BasilioLunaMabiniMagaspac
CONCEPCION AlfonsoBalutuCafeCalius GuecoCaluluanCastilloCorazon de JesusCulatinganDunganDutung-A-MatasGreen VillageLilibanganMabilogMagaoMalupaMinanePanalicsian (Panalicsican)PandoParangParulungPitabunanSan Agustin (Murcia)San AntonioSan BartolomeSan FranciscoSan Isidro (Almendras)San Jose (Pob.)San Juan (Castro)San MartinSan Nicolas (Pob.)San Nicolas BalasSan Vicente (Caluis/Cobra)Santa CruzSanta MariaSanta MonicaSanta RitaSanta RosaSantiagoSanto CristoSanto NiñoSanto Rosario (Magunting)Talimunduc MarimlaTalimunduc San MiguelTelabancaTinang

308
The Many Faces of Poverty (Volume 9)
Table 6. CBMS Composite Indicator, by Barangay, Province of Tarlac, 2014-2017
BarangayMunicipality Barangay CBMS CompositeIndicator
Municipality
1.81.61.51.01.51.31.71.51.7
1.20.80.61.11.01.01.41.21.00.91.20.80.80.81.10.91.51.11.51.71.31.30.51.01.00.61.11.11.21.30.81.21.60.90.5
1.21.51.31.11.41.71.21.71.11.10.91.11.01.20.71.2
1.21.11.01.20.91.11.11.01.31.10.81.11.21.11.01.31.11.11.11.11.61.10.51.12.41.71.91.11.31.72.01.51.61.31.21.31.2
CBMS CompositeIndicator
PURA BaliteBuenavistaCadanglaanEstiponaLinaoMaasinMatindegMaungibNayaNilasin 1stNilasin 2ndPoblacion 1Poblacion 2Poblacion 3PorocSingat
PANIQUI AbogadoAcocolaoAduasApulidBalaoangBarang (Borang)BrillanteBurgosCabayaoasanCananCarinoCayangaColibangbangCoralDapdapEstacionMabilangManaoisMatalapitapNagmisaanNancamarinanNipacoPatalanPoblacion NortePoblacion SurRang-ayanSalumagueSamputSan CarlosSan IsidroSan Juan de MillaSanta InesSinigpitTablangVentenilla
MONCADA Ablang-SapangAringinAtencioBanaoang EastBanaoang WestBaquero NorteBaquero SurBurgosCalamayCalapanCamangaan EastCamangaan WestCamposanto 1 - NorteCamposanto 1 - SurCamposanto 2CapaoayanLapsingMabiniMaluacPoblacion 1Poblacion 2Poblacion 3Poblacion 4RizalSan JuanSan JulianSan LeonSan PedroSan RoqueSanta Lucia EastSanta Lucia WestSanta MariaSanta MonicaTolega NorteTolega SurTubectubangVilla
MAYANTOC Pedro L. QuinesPitombayogPoblacion NortePoblacion SurRotrottoocSan BartolomeSan JoseTaldiapanTangcarang

The Many Faces of Poverty (Volume 9)
309
Table 6. CBMS Composite Indicator, by Barangay, Province of Tarlac, 2014-2017
BarangayMunicipality Barangay CBMS CompositeIndicator
Municipality
1.31.41.31.21.31.31.01.11.4
1.31.11.11.51.61.51.11.21.41.71.01.11.11.11.3
1.31.51.51.51.41.41.51.31.41.51.41.21.21.31.41.31.91.21.31.41.51.21.21.2
1.42.11.61.71.92.21.11.71.30.93.01.61.61.71.51.51.11.40.82.10.81.61.41.40.81.6
1.21.51.81.41.01.61.42.31.71.41.41.5
2.32.22.01.61.51.63.21.52.42.71.11.51.4
CBMS CompositeIndicator
VICTORIA BaculongBalayangBalbalotoBangarBantogBatangbatangBuloCabuluanCalibunganCanaremCruzLalapacMaluidMangolagoMasalasaPalacpalacSan AgustinSan AndresSan Fernando (Pob.)San FranciscoSan Gavino (Pob.)San JacintoSan Nicolas (Pob.)San VicenteSanta BarbaraSanta Lucia (Pob.)
SANTA IGNACIA BaldiosBotbotonesCaanamonganCabaruanCabugbuganCaduldulaoanCalipayanMacaguingNambalanPadapadaPilpilaPinpinasPoblacion EastPoblacion WestPugo-CecilioSan FranciscoSan SoteroSan VicenteSanta Ines CentroSanta Ines EastSanta Ines WestTaguiporoTimmaguabVargas
SAN CLEMENTE BallocBambanCasipoCatagudinganDaldalayapDoclong 1Doclong 2MaasinNagsabaranPit-aoPoblacion NortePoblacion Sur
RAMOS Coral-IlocoGuitebPancePoblacion CenterPoblacion NorthPoblacion SouthSan JuanSan RaymundoToledo
SAN JOSE BurgosDavidIbaLabneyLawacamulagLubiganMaamotMababanabaMorionesPaoSan Juan de ValdezSulaVilla Aglipay
SAN MANUEL ColubotLanatLegaspiMangandingayMatarannocPacpacoPoblacionSalcedoSan AgustinSan FelipeSan JacintoSan MiguelSan NarcisoSan VicenteSanta Maria

The Many Faces of
PovertyVolume 9