The of New Bennani - uni-trier.de · Hamza Bennani Matthias ... and had a collegial communication...
28
Research Papers in Economics No. 16/14 The (Home) Bias of European Central Bankers: New Evidence Based on Speeches Hamza Bennani Matthias Neuenkirch
Transcript of The of New Bennani - uni-trier.de · Hamza Bennani Matthias ... and had a collegial communication...

Research Papers in Economics
No. 16/14
The (Home) Bias of
European Central Bankers:
New Evidence Based on Speeches
Hamza Bennani
Matthias Neuenkirch

The (Home) Bias of European Central Bankers:
New Evidence Based on Speeches∗
Hamza Bennani†
University of Lille 1, France
Matthias Neuenkirch‡
University of Trier, Germany
June 8, 2015
Abstract
Speeches are an important vehicle for central bankers to convey individual
views on the preferred policy stance. In this paper, we employ an automated
text linguistic approach to create an indicator that measures the tone of the 1,618
speeches delivered by members of the Governing Council (GC) during the period
1999M1−2014M4. We then relate this variable to euro-area and national macroe-
conomic forecasts. Our key findings are as follows. First, inflation and growth
expectations have a positive and significant impact on the hawkishness of a speech.
Second, the voiced preferences of national central bankers largely coincide with the
level of independence their banks had at the time of the Maastricht Treaty. Third,
country-specific macroeconomic conditions matter for speeches delivered inside the
central banker’s home country but not for those made abroad. Fourth, differences
in central banker preferences are the key source of variation in their speeches before
the financial crisis, whereas divergent national economic conditions are the main
factor in the second part of the sample.
JEL Codes: E52, E58.
Keywords: Central Bank Communication; European Central Bank;
Governing Council; Monetary Policy; National Interests; Speeches.
∗Thanks to Christian Bauer for his data support and Etienne Farvaque, Alexander Jung, Pierre-Guillaume Meon, Edith Neuenkirch, Florian Neumeier, Peter Tillmann, and participants of the 7thEconomic Workshop at the IAAEU Trier and the 2015 Meeting of the European Public Choice Societyin Groningen for their helpful comments on earlier versions of the paper. The usual disclaimer applies.†Email: [email protected].‡Email: [email protected].
1

1 Introduction
Monetary policy in the euro area is set by the Governing Council (GC), which consists of
25 members (as of 2015). Six of these are the members of the Executive Board (EB) in
Frankfurt, who are appointed by the European Council. The other 19 are the presidents
of national central banks (NCB), who are appointed by their respective governments.
Every six to eight weeks, the GC votes on the future course of monetary policy in the
euro area.1
As with any committee, members of the GC can disagree with each other, perhaps
because they have different preferences when it comes to what they believe is appropriate
monetary policy. For instance, GC members might disagree on the timing and size of
necessary interest rate firming when prices are expected to increase by more than the
ECB’s inflation objective. Furthermore, in a supranational central bank like the ECB,
the preferred monetary policy of GC members may vary due to the member’s different
home countries, with different business cycles and different economic problems (see also
Sturm and Wollmershauser 2008; Lee and Crowley 2009).
Indeed, Gildea (1992), Meade and Sheets (2005), and Chappell et al. (2008) find this
to be true for the Federal Open Market Committee (FOMC). Presidents of the regional
Federal Reserve Banks (FRB) and even members of the Board of Governors—who are
supposed to represent federal interests—take into account economic conditions in their
home region when they vote on the preferred interest rate. Consequently, it is likely
that different preferences and national interests play a role in the European Monetary
Union, being that it is comprised of largely autonomous states.2 The latter conjecture
is supported by Hayo and Meon (2013), who find that the GC’s decision-making process
is best described by a scenario in which individual members of the GC follow national
objectives and bargain over the interest rate.3
However, the GC had never openly acknowledged such disagreements prior to the
press conference held after the interest rate decision on 6 September 2012, at which the
following was stated during the questions and answer session:4
Question : My question regards the vote today. Was it unanimous and, if not, what does
it mean? Thank you.
1Before 2015, the GC voted once a month on the future course of monetary policy. The accessionof Lithuania to the euro area in 2015 triggered a rotation scheme for voting rights in the GC. NCBpresidents participate in all meetings but are no longer allowed to vote every time.
2Other sources of a disagreement include different information about the state of the economy andthe use of different economic models.
3In addition, Badinger and Nitsch (2014) find that the ECB’s interest rate setting behavior is bestdescribed by weights based on national representation in its mid-level management.
4http://www.ecb.europa.eu/press/pressconf/2012/html/is120906.en.html.
2

Draghi : Well, it was not unanimous. There was one dissenting view. We do not
disclose the details of our work. It is up to you to guess.
This was a surprising revelation because, until then, officially, the GC had always reached
decisions by consensus (see also Jung et al. 2010) and had a collegial communication
strategy (see also Ehrmann and Fratzscher 2007). Furthermore, unlike many other central
banks, the ECB does not disclose individual voting records, meaning that disagreements,
if any, are hidden behind a diplomatic veil. Thus, it is impossible for outsiders to observe
such disagreements unless GC members express them in interviews or speeches (see also
Jansen and de Haan 2006).
Indeed, GC members often make public speeches. During the period 1999M1−2014M4,
a total of 1,618 transcripts of speeches by members of the EB and the Presidents of the 11
biggest NCBs in the Eurosystem were stored on the website of the Bank for International
Settlements.5 The content of these speeches can be used as a proxy for the preferences of
the monetary policymakers, and also for their voting behaviour (see also Siklos and Bohl
2007). Of course, speeches are nonbinding; any GC member could ‘oppose’ the commit-
tee’s position publicly but still vote in line with the GC’s decision. In our view, however,
such behaviour is very unlikely given the GC’s consensus mantra. Consequently, we be-
lieve that those GC members who publicly disagree with the committee’s position match
their words with deeds. This conjecture is supported by Jansen and de Haan (2009), who
find that informal statements by GC members are significantly related to upcoming inter-
est rate decisions. Moreover, central bankers are aware that voicing their disagreements
publicly might have a negative impact on financial markets in terms of higher volatility
and might lead to a lower predictability of future monetary policy decisions. These ad-
verse consequences make subtle differences in speeches even more relevant for revealing
differences in monetary policy preferences.
In this paper we analyse the determinants of the tone of speeches by members of the
Governing Council. We first use an automated text linguistic approach to create a vari-
able that measures the tone of each speech on a continuous scale from −1 (dovish) to
+1 (hawkish). Second, we relate this communication indicator to euro-area and national
macroeconomic forecasts. The estimated parameters of this reaction function are then
indicative of whether the divergence in opinions within the GC is due to different prefer-
ences and/or different macroeconomic developments in the euro area. Our prior is, first,
that inflation and GDP growth forecasts are positively related to the tone of a speech and,
second, that national macroeconomic forecasts significantly explain the tone of a speech
in addition to euro area macroeconomic forecasts.
5The Bank for International Settlements provides a comprehensive database of all speeches made bycentral bank officials worldwide. The use of this database has the major advantage that all speeches aretranslated into English by the same team of translators.
3
We make three contributions to the literature. First, we create a comprehensive
dataset measuring the tone of all speeches by GC members during the period 1999M1−2014M4. No existing dataset covers speeches by all GC members over this entire 15-year
period. Ehrmann and Fratzscher (2007) create indicator variables of speeches by GC
members based on newswire reports during the period 1999M1−2004M5 and find that
financial market returns react to these speeches by moving in the ‘intended’ direction.
Conrad and Lamla (2010) analyse introductory remarks made by the ECB President at
monthly press conferences. They cover the period 1999M1−2006M10 and detect an ap-
preciation of the euro against the US dollar in response to statements about increasing
risks to price stability.
Our second contribution is that, based on the findings of a comprehensive literature
survey conducted by Blinder et al. (2008), we are convinced that this is the first study to
investigate determinants of the tone of speeches by GC members.6 Hayo and Neuenkirch
(2013) conduct a similar analysis for FRB presidents and find that regional macroeconomic
variables are particularly relevant for speeches made (i) by nonvoting FOMC members,
(ii) within the president’s home district, (iii) during Ben Bernanke’s tenure as Chairman,
(iv) during recessions, and (v) during the financial crisis.
Finally, our paper contributes to the literature aimed at opening the black box of
the GC’s decision-making rule (see, e.g., Cancelo et al. 2011; Hayo and Meon 2013).
Discovering this decision rule is of utmost importance to the general public, particularly
in light of the crucial role the ECB has taken in the ongoing economic and financial crisis
in the euro area. The GC’s decisions affect more than 300 million people in the euro area.
However, the individual positions of its 25 members, unlike those of fiscal policymakers,
are largely unknown. This (non) accountability issue is possibly the reason the GC has
decided to publish the minutes of its meetings starting in 2015.
Our key results are as follows. First, inflation and growth expectations have a positive
and significant impact on the hawkishness of a speech. Second, different growth expec-
tations across the euro area and different preferences significantly explain discrepancies
across speakers. Third, the voiced preferences of NCB presidents largely coincide with the
level of independence their central banks had at the time of the Maastricht Treaty; pres-
idents of the least independent central banks take the most dovish tone in their speeches
and vice versa. Fourth, country-specific macroeconomic conditions matter for speeches
delivered inside the central banker’s home country, but not for those made abroad. Fi-
6Other papers focus on ECB communication in general (e.g., Jansen and de Haan 2006, 2007; Berger etal. 2011; Bulir et al. 2012), the impact of ECB communication on financial markets (e.g., Jansen and deHaan 2005; Ehrmann and Fratzscher 2007; Rosa and Verga 2007; de Haan 2008; Brand et al. 2010; Conradand Lamla 2010), the usefulness of ECB communication when predicting future interest rate decisions(e.g., Heinemann and Ullrich 2007; Sturm and de Haan 2011), and the role of ECB communication inthe monetary policy transmission process (Neuenkirch 2013).
4

nally, differences in central banker preferences are the key source of variation in their
speeches before the financial crisis, whereas divergent national economic conditions are
the main factor in the second part of the sample.
The remainder of this paper is organised as follows. In Section 2, we describe the
coding procedure for extracting the tone of speeches by GC members, introduce the
explanatory variables, and explain the econometric methodology. Section 3 presents the
baseline results. Section 4 contains some further estimates and robustness tests. Section
5 concludes with some policy implications.
2 Data and Empirical Methodology
2.1 Measuring the Tone of Speeches
We create a dataset that covers 1,618 speeches by members of the Governing Council
during the period 1999M1−2014M4.7 We focus on the members of the Executive Board
and the presidents of the 11 largest NCBs.8 The crucial task is to quantify the gist of
a speech, that is, what are the speech’s implications for the future course of monetary
policy. We follow recent practice (e.g., Bligh and Hess 2007; Armesto et al. 2009; Lucca
and Trebbi 2009; Apel and Blix Grimaldi 2012; Born et al. 2013; Hansen et al. 2014) and
use an automated text linguistic approach to extract the tone of each speech.
In a first step, we collected all words and their frequency of occurrence in our sample
of 1,618 speeches with the purpose of identifying those keywords that are directly related
to the future course of monetary policy. Furthermore, we searched for keywords that can
be used as indirect indicators of monetary policy inclination via the economic outlook.
Similar to Apel and Blix Grimaldi (2012), we sorted these keywords into two categories
depending on whether they indicate a more hawkish tone or a more dovish tone. Examples
are the keywords high∗, strong∗, increas∗, and fast∗, which are indications of a more
7Note that this does not include the introductory statement made at the press conferences held aftereach interest rate decision. In addition, we do not include interviews in our sample since (i) not all ofthese are recorded on the website of the Bank for International Settlements and (ii) the answers of centralbankers during interviews are naturally biased with respect to the questions asked by the journalists.
8National Bank of Belgium, German Bundesbank, Central Bank of Ireland, Banco de Espana, Banquede France, Bank of Greece, Banca d’Italia, De Nederlandsche Bank, Austrian Nationalbank, Banco dePortugal, and Suomen Pankki. We do not include the 85 speeches by the President of The BanqueCentrale du Luxembourg as there are no macroeconomic forecasts by Consensus Economics available forthis country. Data availablity issues or a very low frequency of speeches are also the reasons why we donot include speeches by the Presidents of the Banka Slovenije (2 speeches), Central Bank of Malta (0),Narodna Banka Slovenska (0), Eesti Pank (8), and Latvijas Banka (0). The Lietuvos Bankas became amember of the euro area in 2015, that is, after the end of our sample period.
5

hawkish tone, whereas their antonyms, low∗, weak∗, decreas∗, and slow∗, convey a more
dovish tone.9
Next, we searched each of the 1,618 speeches for these words and counted the number
of hawkish and dovish words in each speech. Finally, we created a variable measuring the
tone of each speech using the following formula:
tonei,t =hawkishi,t − dovishi,thawkishi,t + dovishi,t
(1)
Thus, our automated search and word-counting approach creates a continuous variable
tonei,t for the speech of central banker i on day t that is bound between −1 (dovish) and
+1 (hawkish). To avoid extreme values for the communication indicator, we included in
our dataset only those speeches containing at least 10 occurrences of our keywords. This
leaves a total of 1,202 observations.
Table 1 sets out descriptive statistics for the communication indicator.10 A couple of
things are worth highlighting. First, speeches contain, on average, more hawkish words
than dovish ones as the mean is positive throughout all groups. This is also reflected in
its maximum value, which takes the value +1 despite the fact that we dropped from our
analysis all speeches with less than 10 occurrences of keywords. The minimum value, in
contrast, is ‘only’ −0.67. Second, the ECB President is, on average, more hawkish than
other GC members and GC members from France, Spain, and Greece, in particular, are
more hawkish than Irish and Italian central bankers.
Figure 1 shows the average tone of speeches within a year and the average main
refinancing rate within a year over the sample period. The average tone in speeches is
more dovish when interest rates are lower and vice versa. The correlation between both
series is substantial (ρ = 0.82). Consequently, we feel confirmed that our automated
search and word-counting approach creates a reasonable indicator for the future course
of monetary policy and we can use differences in the indicator across speakers to reveal
differences in their near-term monetary policy preferences.
9The full list of keywords indicating more hawkish monetary policy is as follows: accelerat∗, better,boom∗, emerg∗, expansion, fast∗, favo(u)rabl∗, firm∗, great∗, high∗, improv∗, increas∗, larger, posi-tive, rais∗, ris∗, stabili∗, stable, strengthen∗, strong∗, subdued, unsustainable, upside, upswing, upturn,upward∗. The list of dovish keywords is: collaps∗, contraction, dampen∗, decelerat∗, declin∗, decreas∗,delay∗, depression, destabili∗, deteriorat∗, difficul∗, diminish∗, disappear∗, downside, downswing, down-turn, downward∗, fall∗, fragil∗, low∗, negative, poor, recession∗, slow∗, sluggish, small∗, struggling,sustainable, unfavo(u)rabl∗, unstable, weak∗, worse.
10A detailed overview of the number of speeches per year and by position/country can be found inTable A1 in the Appendix.
6

Table 1: Communication Indicator: Descriptive Statistics
Mean S.D. Min. Max. Obs.Governing Council 0.34 0.31 −0.67 1.00 1202By Position. . . President 0.47 0.26 −0.40 1.00 222. . . Exec. Board (excl. Pres.) 0.32 0.31 −0.58 0.91 389. . . NCB Presidents 0.31 0.31 −0.67 1.00 591By Country. . . Austria 0.37 0.33 −0.50 1.00 76. . . Belgium 0.31 0.29 −0.35 0.85 39. . . Finland 0.27 0.23 −0.33 0.71 39. . . France 0.44 0.28 −0.47 1.00 290. . . Germany 0.36 0.29 −0.45 1.00 153. . . Greece 0.40 0.30 −0.27 0.91 71. . . Ireland 0.20 0.31 −0.53 0.85 60. . . Italy 0.22 0.31 −0.64 1.00 225. . . The Netherlands 0.38 0.32 −0.67 1.00 99. . . Portugal 0.26 0.26 −0.29 0.79 50. . . Spain 0.41 0.29 −0.50 0.90 100
Figure 1: Average Tone of Speeches per Year and Average Main Refinancing Rate
Notes: The figure shows the average tone of speeches per year (solid line, left scale) and the
average main refinancing rate per year (dashed line, right scale).
A note of caution here. Given that private documents are inaccessible to the general
public, empirical studies in politics and psychology mainly use public sources to assess
decision makers’ views (van Esch 2007). It could be argued that deriving decision makers’
beliefs from public sources may be biased given that most public speeches are written by
7

speech writers and thus might not reflect the speaker’s personal views. However, Renshon
(2009) shows that analysing public sources leads to the same outcome as analysing private
sources. Moreover, de Jong and van Esch (2013) argue that an additional advantage of
using public speeches is that they reflect the person’s opinion in his or her official role.
Finally, a manuscript can be subject to review, implying that there could be a degree of
censorship or restraint for which we cannot control. However, in our view, this makes our
results even more convincing since speeches might reveal more subtlety in central bankers’
views on monetary policy despite the potential censorship.
2.2 Econometric Methodology
The following simple framework motivates our empirical approach (Meade and Sheets
2005; Hayo and Neuenkirch 2013). Central bankers choose their wording based on their
preferences as well as on euro-area and country-specific economic conditions:
tonei,t = f(φi, EtxEAt+12, Etx
Natt+12 − Etx
EAt+12) (2)
tonei,t is the degree of hawkishness/dovishness of a speech made by central banker i on
day t and φi denotes central banker i’s preferences, as expressed in speeches, depending on
nationality and/or position within the GC. EtxEAt+12 is a vector of euro-area macroeconomic
forecasts available before the time of the speech and, similarly, EtxNatt+12−Etx
EAt+12 is a vector
of ‘country-specific macroeconomic forecasts,’ defined as differences between national and
euro-area macroeconomic forecasts.
A linear representation of this function illustrates the two sources of potential differ-
ences across central bankers:
tonei,t = φi + βiEtxEAt+12 + γi(Etx
Natt+12 − Etx
EAt+12) (3)
First, national economic forecasts EtxNatt+12 for the 11 sample countries could be different
from the euro-area aggregate EtxEAt+12 and lead to variation in the left-hand-side variable
if γi 6= 0. Second, differences in the preferences φi across central bankers could be another
source of variation.
To identify whether these two aspects have any influence on the wording chosen for a
central banker’ speech, we need to make a couple of assumptions. First, we make uniform
each central banker’s responsiveness to euro-area forecasts and county-specific forecasts,
that is, βi = β and γi = γ. Preliminary regressions indicate that this assumption is
not overly restrictive as we detect no significant differences across central bankers when
allowing for heterogeneity in βi and γi, whereas we detect significant differences in the
8

estimates for φi.11 Second, we assume that there are no differences in central bankers’
information sets, that is, the forecasts of EtxEAt+12 and Etx
Natt+12 only change over time. Based
on these assumptions, we can interpret the coefficient vectors β and γ as weights for euro-
area and country-specific information and φi as measuring country- and position-specific
preferences.
In line with the idea of a Taylor (1993) rule, we use inflation forecasts and real GDP
growth forecasts to explain the tone of a speech. In addition, the ECB’s mandate is
Consensus Economics provides monthly forecasts of both variables, separately for the
current calendar year and the next calendar year. To obtain fixed-horizon 12-month-
ahead forecasts, we use the following formula:
Etxt+12 =d
365Et,dxcy +
365− d365
Et,dxny (4)
Etxt+12 is the 12-month-ahead forecast and Et,dxcy as well as Et,dxny are the corresponding
forecasts for the current calendar year and the next calendar year. d refers to the days
remaining in the respective calendar year on the day the forecast was published, for
instance, d = 262 for the forecast on 14 April 2014.12
Figures A1 and A2 show the 12-month-ahead national inflation and GDP growth
expectations and the corresponding measures for the euro area. Inflation and growth
expectations in Austria, Belgium, France, Germany, and Italy do not deviate much from
corresponding euro-area measures, and the same is true for growth expectations in the
Netherlands. In contrast, inflation and growth expectations were substantially higher in
Greece and Ireland compared to the corresponding euro-area values before 2008M9 and
lower afterward. Similarly, inflation expectations in the Netherlands and Portugal deviate
considerably from the euro-area figures during the early sample years. Thus, there are
differences in the economic conditions across countries and it remains to be discovered
whether GC members take these into account when phrasing their speeches.
Table 2 shows bivariate correlations between the communication indicator and euro-
area and country-specific macroeconomic forecasts. All correlations with euro-area fore-
casts are positive and significant at the 1 percent level. Similarly, we observe a positive and
significant correlation between the tone of a speech and the difference between national
growth forecasts and the euro-area aggregate. In contrast, country-specific inflation expec-
11To conserve space, we do not report these regressions in detail. All omitted results are available uponrequest.
12Note that Consensus Economics forecasts for the euro area became available in 2002M12. We usereal-time national GDP weights to aggregate the national inflation forecasts and growth forecasts as aproxy for euro-area forecasts before that date. We checked the validity of this approach by comparingthe actual euro-area forecasts and our proxy measure for the period 2002M12−2014M4. The differencesbetween both series are negligible.
9

tations are not correlated with the communication indicator (at the 10 percent level). To
summarise, we have some descriptive evidence that country-specific growth expectations
might matter for central bankers when phrasing their speeches.
Table 2: Communication Indicator: Correlation with Macroeconomic Forecasts
EtπEAt+12 Ety
EAt+12 Etπ
Natt+12 − Etπ
EAt+12 Ety
Natt+12 − Ety
EAt+12
Governing Council 0.19 0.24 0.03 0.15By Position. . . President 0.27 0.21 −0.09 0.15. . . EB (excl. Pres.) 0.17 0.27 0.07 0.15. . . NCB Presidents 0.20 0.20 0.05 0.17
Notes: Bold correlations are significant at the 10 percent level.
To more formally describe the relationship between the tone of a speech and euro-area
and country-specific macroeconomic forecasts we estimate the following pooled model via
OLS:13
tonei,t = αNat1i + αPos
2i + β1EtπEAt+12 + β2Ety
EAt+12 (5)
+γ1(EtπNatt+12 − Etπ
EAt+12) + γ2(Ety
Natt+12 − Ety
EAt+12) + µi,t
The estimates of β1 and β2 measure the sensitivity of a speech with inflation expecta-
tions EtπEAt+12 and GDP growth expectations Ety
EAt+12 in the euro area. γ1 and γ2 de-
note the estimates for the corresponding country-specific measures, EtπNatt+12−Etπ
EAt+12 and
EtyNatt+12 −Ety
EAt+12. Fixed effects based on a central banker’s nationality and her/his posi-
tion within the GC are captured by αNat1i and αPos
2i and provide a proxy for whether there
are differences in the average degree of hawkishness across nationalities and positions
(ECB President, EB members (excl. ECB President), and NCB presidents).14
13It is impossible to estimate a ‘true’ panel model since speeches are not delivered at a regular frequencylike, for instance, once a month or once a quarter. This irregular frequency is also why we decided againstmodelling Equation (5) with a lagged dependent variable.
14To capture time variation not related to the cyclical position captured by the macroeconomic forecastswe also included year-fixed effects into Equation (5). In addition, we also investigated whether differencesin preferences not related to nationality and position might play a role by adding central banker-fixedeffects in addition to country- and position-fixed effects. However, both year-fixed effects and centralbanker-fixed effects are insignificant. Results are available on request.
10

3 Empirical Results
3.1 Governing Council
Table 3 presents the results for Equation (5), which is estimated for all members of the
Governing Council. The results indicate that speeches by GC members can be explained
by a Taylor-type rule as inflation expectations and growth expectations have a positive and
significant impact on the degree of hawkishness. Both euro-area indicators significantly
explain the communication indicator. In contrast, the coefficient on country-specific in-
flation expectations is insignificant, leaving growth expectations as the only significant
country-specific forecast.
Table 3: Explaining Speeches: Governing Council
Coefficient Std. Error p-valueConstant Term 0.334 (0.047) [0.00]Etπ
EAt+12 0.053 (0.019) [0.01]
EtyEAt+12 0.047 (0.009) [0.00]
EtπNatt+12 − Etπ
EAt+12 −0.014 (0.025) [0.57]
EtyNatt+12 − Ety
EAt+12 0.043 (0.015) [0.00]
Country-Fixed EffectsAustria 0.009 (0.042) [0.83]Belgium −0.027 (0.049) [0.58]Finland −0.140 (0.044) [0.00]France 0.002 (0.032) [0.95]GermanyGreece 0.022 (0.045) [0.62]Ireland −0.194 (0.047) [0.00]Italy −0.132 (0.035) [0.00]The Netherlands −0.070 (0.044) [0.12]Portugal −0.023 (0.052) [0.66]Spain 0.066 (0.040) [0.10]Position-Fixed EffectsPresidentEB (excl. Pres.) −0.135 (0.029) [0.00]NCB Presidents −0.122 (0.028) [0.00]Observations 1202R2 0.17
Notes: Estimates of Equation (5). Dependent variable: tonei,t. OLS with White (1980)
standard errors is used. Bold coefficients are significant at the 10 percent level.
Thus, when it comes to the ECB’s primary objective, that is, to ‘maintain price sta-
bility,’ the euro-area measure of inflation expectations is more relevant than the national
11

indicator.15 However, in the case of the secondary objective, that is, to ‘support the gen-
eral economic policies’, GC members put equal weight on euro-area and country-specific
conditions.16 Consequently, we have evidence that different macroeconomic developments
in the euro area play a role in the tone of speeches by GC members.
Turning to the country- and position-fixed effects we see, first, that the ECB Presi-
dent is, on average, more hawkish than other GC members in his speeches. In addition,
speeches by Finnish, Irish, and Italian central bankers are more dovish than speeches by
German GC members, indicating that differences in preferences might also play a role
when central bankers phrase their speeches. Speeches by Spanish GC members are, on
average, more hawkish than speeches by central bankers from the reference country (Ger-
many). Finally, the R2 is in line with the figures of Hayo and Neuenkirch (2013) in the
context of the Federal Reserve.
3.2 National Central Bank Presidents
Since the literature finds that central bankers on the ‘periphery’ are more likely to dissent
in interest rate decisions (see, e.g., Gildea 1992; Meade and Sheets 2005) and to voice
disagreement in the discussion around interest rate decisions (Meade 2005, 2010) or in
speeches (Hayo and Neuenkirch 2013) we re-do the analysis of the previous subsection for
a subsample consisting of NCB presidents only. Table 4 sets out the results.
Similar to the results for all GC members, we find that speeches by NCB presidents can
be explained by a Taylor-type rule with euro-area inflation expectations, euro-area growth
expectations, and country-specific growth expectations being the significant variables. We
also observe some differences based on the nationality of central bankers as speeches by
the presidents of the Suomen Pankki, Bank of Greece, Central Bank of Ireland, and
Banca d’Italia are, on average, more dovish than those by the president of the German
Bundesbank.
Next, we relate the estimated country-fixed effects to the level of central bank inde-
pendence (CBI). We use the indicator by Klomp and de Haan (2009) for economic CBI
and total CBI (i.e., the average of economic and political CBI) in the year 1993 to obtain
a proxy for a country’s preferred level of CBI prior to harmonisation of central bank laws
in the aftermath of the Maastricht Treaty. Figure 2 illustrates this relationship.
15Test for equality of coefficents: F(1,1185) = 5.23 [0.02].16Test for equality of coefficents: F(1,1185) = 0.08 [0.78].
12

Table 4: Explaining Speeches: National Central Bank Presidents
Coefficient Std. Error p-valueConstant Term 0.216 (0.057) [0.00]Etπ
EAt+12 0.062 (0.030) [0.04]
EtyEAt+12 0.048 (0.014) [0.00]
EtπNatt+12 − Etπ
EAt+12 −0.019 (0.031) [0.56]
EtyNatt+12 − Ety
EAt+12 0.047 (0.020) [0.02]
Country-Fixed EffectsAustria 0.015 (0.050) [0.76]Belgium 0.080 (0.075) [0.29]Finland −0.164 (0.047) [0.00]France 0.032 (0.049) [0.51]GermanyGreece −0.159 (0.069) [0.02]Ireland −0.217 (0.051) [0.00]Italy −0.160 (0.047) [0.00]The Netherlands −0.056 (0.057) [0.32]Portugal −0.107 (0.071) [0.13]Spain 0.002 (0.051) [0.97]Observations 591R2 0.16
Notes: Estimates of Equation (5). Dependent variable: tonei,t. OLS with White (1980)
standard errors is used. Bold coefficients are significant at the 10 percent level.
Figure 2: Country-Fixed Effects and Central Bank Independence
Notes: The figures relate country-fixed effects from Table 4 to the degree of economic central
bank independence in 1993 (left) and total central bank independence in 1993 (right).
13
Both panels of Figure 2 indicate a positive relationship between the estimate of the
country-fixed effect, that is, the relative degree of hawkishness with Germany as reference
country, and the level of CBI at the time of the Maastricht Treaty. The correlation is
substantial for economic CBI (ρ = 0.75) and total CBI (ρ = 0.56). Notable outliers are the
Banco de Espana and the National Bank of Belgium, where the presidents communicate
more hawkishly than the pre-Maastricht CBI level suggests they should and the Central
Bank of Ireland, where we observe the opposite phenomenon. Nevertheless, both figures
imply that the presidents of the least independent central banks (in 1993) are most dovish
in their speeches and vice versa. One interpretation of these findings is that the NCBs
still follow their old habits despite all the formal reforms undertaken after the Maastricht
Treaty. Our findings for communication are also in line with the literature on CBI where
a negative relationship between CBI and the level of inflation is documented (see, for
instance, Eijffinger et al. 1998).
4 Further Results and Robustness Tests
4.1 Speeches in the Home Country Versus Speeches Abroad
In the case of the Federal Reserve, Hayo and Neuenkirch (2013) find that regional macroe-
conomic variables are relevant for speeches made within the home district but not for
speeches delivered elsewhere. In the following, we test whether GC members also adjust
the content of their speeches to the audience and estimate separate models for speeches
within the respective home country (Home) and those delivered abroad (Abroad). The
results are presented in Table 5.
The estimates for speeches within the home district are very similar to those for
the full sample in terms of coefficient size and significance. For speeches outside the
home country, country-specific macroeconomic conditions do not matter as only euro-
area macroeconomic forecasts are found to significantly explain the degree of hawkishness.
Consequently, we have evidence that GC members adjust the gist of their speeches to their
audience. If a speech is delivered inside their home country, they put more emphasis on
county-specific information than they do in speeches made abroad.
Another interesting finding is that some of the country-fixed effects differ across the
locations where speeches were delivered. Irish and Italian central bankers use significantly
more dovish words compared to the reference country when they speak within their home
country. However, when speaking abroad, the significant difference vanishes. There is a
similar shift in the degree of hawkishness for Spanish central bankers. When they deliver
their remarks outside Spain, their tone is significantly more hawkish than that of German
14
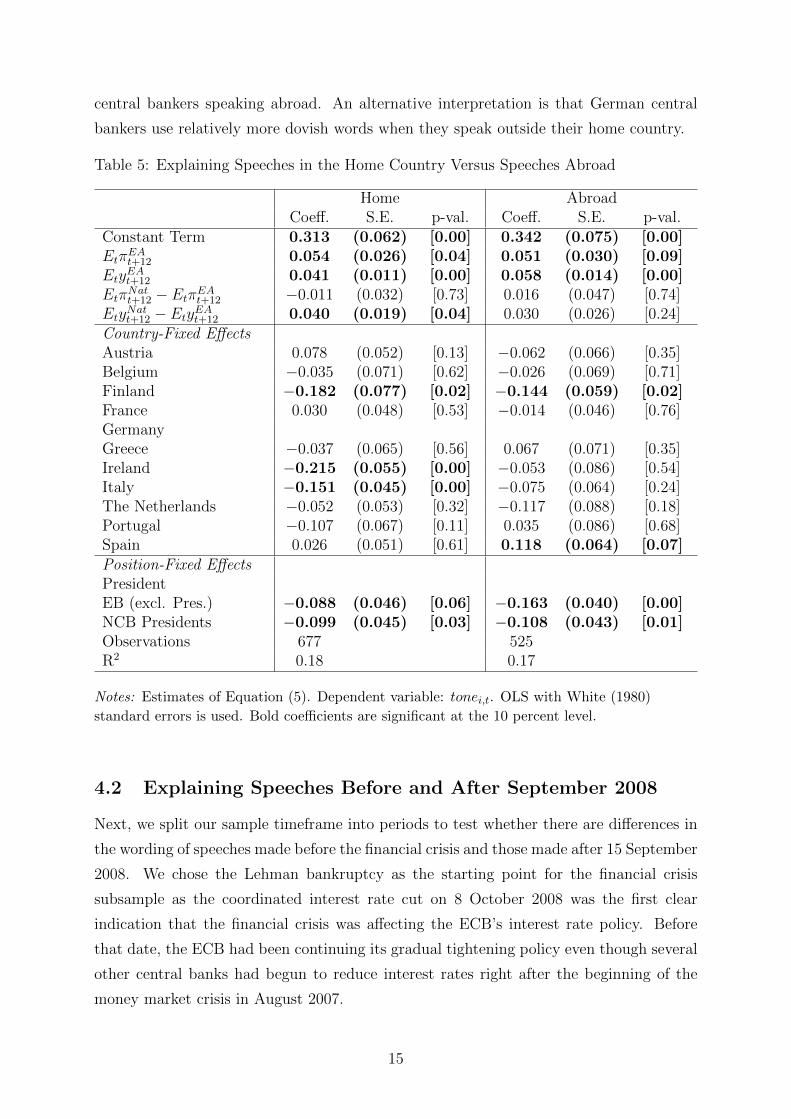
central bankers speaking abroad. An alternative interpretation is that German central
bankers use relatively more dovish words when they speak outside their home country.
Table 5: Explaining Speeches in the Home Country Versus Speeches Abroad
Home AbroadCoeff. S.E. p-val. Coeff. S.E. p-val.
Constant Term 0.313 (0.062) [0.00] 0.342 (0.075) [0.00]Etπ
EAt+12 0.054 (0.026) [0.04] 0.051 (0.030) [0.09]
EtyEAt+12 0.041 (0.011) [0.00] 0.058 (0.014) [0.00]
EtπNatt+12 − Etπ
EAt+12 −0.011 (0.032) [0.73] 0.016 (0.047) [0.74]
EtyNatt+12 − Ety
EAt+12 0.040 (0.019) [0.04] 0.030 (0.026) [0.24]
Country-Fixed EffectsAustria 0.078 (0.052) [0.13] −0.062 (0.066) [0.35]Belgium −0.035 (0.071) [0.62] −0.026 (0.069) [0.71]Finland −0.182 (0.077) [0.02] −0.144 (0.059) [0.02]France 0.030 (0.048) [0.53] −0.014 (0.046) [0.76]GermanyGreece −0.037 (0.065) [0.56] 0.067 (0.071) [0.35]Ireland −0.215 (0.055) [0.00] −0.053 (0.086) [0.54]Italy −0.151 (0.045) [0.00] −0.075 (0.064) [0.24]The Netherlands −0.052 (0.053) [0.32] −0.117 (0.088) [0.18]Portugal −0.107 (0.067) [0.11] 0.035 (0.086) [0.68]Spain 0.026 (0.051) [0.61] 0.118 (0.064) [0.07]Position-Fixed EffectsPresidentEB (excl. Pres.) −0.088 (0.046) [0.06] −0.163 (0.040) [0.00]NCB Presidents −0.099 (0.045) [0.03] −0.108 (0.043) [0.01]Observations 677 525R2 0.18 0.17
Notes: Estimates of Equation (5). Dependent variable: tonei,t. OLS with White (1980)
standard errors is used. Bold coefficients are significant at the 10 percent level.
4.2 Explaining Speeches Before and After September 2008
Next, we split our sample timeframe into periods to test whether there are differences in
the wording of speeches made before the financial crisis and those made after 15 September
2008. We chose the Lehman bankruptcy as the starting point for the financial crisis
subsample as the coordinated interest rate cut on 8 October 2008 was the first clear
indication that the financial crisis was affecting the ECB’s interest rate policy. Before
that date, the ECB had been continuing its gradual tightening policy even though several
other central banks had begun to reduce interest rates right after the beginning of the
money market crisis in August 2007.
15

In addition to re-estimating Equation (5) separately for the two subsamples, we aug-
ment it by including two additional regressors. First, we include the Eurostoxx 50 Volatil-
ity Index to discover whether GC members react to financial market stress when phrasing
their speeches (incl. vstoxxt). Second, we add the difference between the 10-year govern-
ment bond yield and the corresponding German yield to explore whether GC members
take into account relative refinancing costs in their home country when making a speech
(incl. iNatt,10y − iGer
t,10y). Tables 6 and 7 set out the results.
Several striking results come to light when comparing the pre-crisis and crisis subsam-
ples. First, expected inflation, both euro-area-wide and country-specific, plays a role in
GC member speeches only during the crisis episode. This reflects that inflation expecta-
tions were well anchored in the euro area before 2008, whereas deflationary risks began
to emerge in 2013. Second, euro-area and country-specific growth expectations are sig-
nificant in both subsamples, albeit with numerically smaller coefficients during the crisis
period. Third, in neither subsample do GC members react to financial market stress.
Finally, a larger government bond yield spread compared to that of Germany causes GC
members to use more dovish words in their speeches.
There are no significant position-fixed effects during the pre-crisis episode, whereas the
ECB President is found to be, on average, more hawkish than other GC members during
the second subsample. In contrast, differences based on the speaker’s nationality play a
much larger role before 15 September 2008 as only the country-fixed effects of Finland
and Italy are significantly negative in both subsamples.
To summarise, we find more significant differences in preferences before the finan-
cial crisis. Afterward, national economic conditions are the major source of variation in
speeches, arguably due to the divergent macroeconomic development in the euro area after
2008 (see also Figures A1 and A2). The culmination of this effect is the significant reac-
tion by GC members to the yield spread in their countries compared to that in Germany,
which crowds out the effect of the other country-specific macroeconomic variables.
16

Tab
le6:
Expla
inin
gSp
eech
esB
efor
eSep
tem
ber
2008
incl
.vstoxxt
incl
.iN
at
t,10y−iG
ert,10y
Coef
.S.E
.p-v
al.
Coef
.S.E
.p-v
al.
Coef
.S.E
.p-v
al.
Con
stan
tT
erm
0.286
(0.111)
[0.01]
0.277
(0.114)
[0.02]
0.283
(0.127)
[0.03]
Etπ
EA
t+12
0.04
6(0
.035
)[0
.18]
0.04
6(0
.035
)[0
.19]
0.04
7(0
.042
)[0
.26]
Ety
EA
t+12
0.081
(0.023)
[0.00]
0.082
(0.023)
[0.00]
0.081
(0.023)
[0.00]
Etπ
Nat
t+12−E
tπEA
t+12
0.00
6(0
.045
)[0
.89]
0.00
3(0
.045
)[0
.94]
0.00
6(0
.045
)[0
.89]
Ety
Nat
t+12−E
tyEA
t+12
0.072
(0.041)
[0.08]
0.072
(0.041)
[0.08]
0.072
(0.042)
[0.09]
vstoxxt
0.00
0(0
.002
)[0
.78]
iNat
t,10y−iG
ert,10y
−0.
006
(0.1
60)
[0.9
7]
Cou
ntr
y-F
ixed
Eff
ects
Aust
ria
0.01
0(0
.055
)[0
.86]
0.01
1(0
.055
)[0
.85]
0.01
1(0
.060
)[0
.86]
Bel
gium
0.05
2(0
.072
)[0
.47]
0.05
4(0
.072
)[0
.46]
0.05
3(0
.076
)[0
.49]
Fin
land
−0.266
(0.077)
[0.00]
−0.265
(0.077)
[0.00]
−0.265
(0.082)
[0.00]
Fra
nce
0.00
7(0
.049
)[0
.89]
0.00
6(0
.049
)[0
.90]
0.00
8(0
.053
)[0
.88]
Ger
man
yG
reec
e−
0.06
4(0
.090
)[0
.48]
−0.
059
(0.0
92)
[0.5
2]−
0.06
2(0
.105
)[0
.56]
Irel
and
−0.429
(0.117)
[0.00]
−0.424
(0.117)
[0.00]
−0.427
(0.123)
[0.00]
Ital
y−0.225
(0.051)
[0.00]
−0.226
(0.051)
[0.00]
−0.223
(0.072)
[0.00]
The
Net
her
lands
−0.154
(0.055)
[0.01]
−0.156
(0.056)
[0.01]
−0.154
(0.060)
[0.01]
Por
tuga
l−0.245
(0.118)
[0.04]
−0.245
(0.118)
[0.04]
−0.243
(0.127)
[0.06]
Spai
n−
0.04
5(0
.075
)[0
.55]
−0.
041
(0.0
76)
[0.5
9]−
0.04
4(0
.077
)[0
.57]
Pos
itio
n-F
ixed
Eff
ects
Pre
siden
tE
B(e
xcl
.P
res.
)−
0.07
6(0
.047
)[0
.11]
−0.
080
(0.0
50)
[0.1
1]−
0.07
6(0
.048
)[0
.11]
NC
BP
resi
den
ts−
0.03
8(0
.046
)[0
.40]
−0.
040
(0.0
47)
[0.3
9]−
0.03
8(0
.045
)[0
.40]
Obse
rvat
ions
578
578
578
R2
0.19
0.19
0.19
Notes:
Est
imat
esof
Equ
atio
n(5
).D
epen
den
tva
riab
le:tone i,t.
OL
Sw
ith
Wh
ite
(198
0)st
and
ard
erro
rsis
use
d.
Bold
coeffi
cien
tsare
sign
ifica
nt
at
the
10p
erce
nt
leve
l.
17

Tab
le7:
Expla
inin
gSp
eech
esA
fter
Sep
tem
ber
2008
incl
.vstoxxt
incl
.iN
at
t,10y−iG
ert,10y
Coef
.S.E
.p-v
al.
Coef
.S.E
.p-v
al.
Coef
.S.E
.p-v
al.
Con
stan
tT
erm
0.383
(0.062)
[0.00]
0.377
(0.064)
[0.00]
0.370
(0.062)
[0.00]
Etπ
EA
t+12
0.054
(0.027)
[0.05]
0.050
(0.029)
[0.08]
0.076
(0.029)
[0.01]
Ety
EA
t+12
0.030
(0.014)
[0.03]
0.031
(0.015)
[0.03]
0.024
(0.014)
[0.10]
Etπ
Nat
t+12−E
tπEA
t+12
0.061
(0.036)
[0.09]
0.060
(0.036)
[0.10]
0.05
8(0
.036
)[0
.11]
Ety
Nat
t+12−E
tyEA
t+12
0.034
(0.020)
[0.10]
0.033
(0.020)
[0.10]
0.01
4(0
.024
)[0
.56]
vstoxxt
0.00
0(0
.001
)[0
.74]
iNat
t,10y−iG
ert,10y
−0.021
(0.011)
[0.05]
Cou
ntr
y-F
ixed
Eff
ects
Aust
ria
−0.
035
(0.0
60)
[0.5
6]−
0.03
7(0
.060
)[0
.54]
−0.
023
(0.0
60)
[0.7
0]B
elgi
um
−0.
058
(0.0
59)
[0.3
3]−
0.05
6(0
.059
)[0
.34]
−0.
039
(0.0
59)
[0.5
1]F
inla
nd
−0.108
(0.063)
[0.09]
−0.107
(0.064)
[0.09]
−0.
099
(0.0
64)
[0.1
2]F
rance
−0.
024
(0.0
44)
[0.5
9]−
0.02
3(0
.044
)[0
.60]
−0.
022
(0.0
44)
[0.6
1]G
erm
any
Gre
ece
−0.
048
(0.0
80)
[0.5
5]−
0.04
9(0
.080
)[0
.54]
0.03
7(0
.091
)[0
.68]
Irel
and
−0.
050
(0.0
72)
[0.4
8]−
0.05
0(0
.072
)[0
.48]
0.00
6(0
.075
)[0
.94]
Ital
y−0.134
(0.053)
[0.01]
−0.135
(0.053)
[0.01]
−0.115
(0.053)
[0.03]
The
Net
her
lands
0.11
6(0
.113
)[0
.31]
0.11
5(0
.113
)[0
.31]
0.11
3(0
.113
)[0
.32]
Por
tuga
l0.
036
(0.0
71)
[0.6
1]0.
036
(0.0
71)
[0.6
1]0.
111
(0.0
76)
[0.1
4]Spai
n0.
069
(0.0
55)
[0.2
2]0.
067
(0.0
56)
[0.2
4]0.
082
(0.0
56)
[0.1
4]P
osit
ion
-Fix
edE
ffec
tsP
resi
den
tE
B(e
xcl
.P
res.
)−0.188
(0.040)
[0.00]
−0.187
(0.040)
[0.00]
−0.200
(0.040)
[0.00]
NC
BP
resi
den
ts−0.202
(0.043)
[0.00]
−0.201
(0.043)
[0.00]
−0.209
(0.043)
[0.00]
Obse
rvat
ions
624
624
624
R2
0.11
0.11
0.12
Notes:
Est
imat
esof
Equ
atio
n(5
).D
epen
den
tva
riab
le:tone i,t.
OL
Sw
ith
Wh
ite
(198
0)st
and
ard
erro
rsis
use
d.
Bold
coeffi
cien
tsare
sign
ifica
nt
at
the
10p
erce
nt
leve
l.
18

5 Conclusions
In this paper, we analyse the determinants of the tone of speeches by members of the
Governing Council. Using an automated text linguistic approach, we create a variable
measuring the tone of all 1,618 speeches delivered by GC members during the period
1999M1−2014M4 on a continuous scale from−1 (dovish) to +1 (hawkish). Next, we relate
this communication indicator to euro-area and national macroeconomic forecasts. The
estimated parameters of this reaction function are indicative of whether the divergence
in opinions within the GC is due to different preferences and/or different macroeconomic
developments in the euro area.
Our key results are as follows. First, speeches by GC members can be explained by a
Taylor-type rule. Both inflation expectations and growth expectations have a positive and
significant impact on hawkishness. Second, the euro-area measure of inflation expectations
is more relevant than the national indicator. In contrast, GC members put equal weight
on euro-area and country-specific growth expectations, which is evidence that different
macroeconomic developments have an influence on the words central bankers choose to
employ in their speeches. Different preferences are also a source of variation as speeches
by the ECB President are, on average, more hawkish than those by other GC members
and communications by Finnish, Irish, and Italian (Spanish) central bankers are more
dovish (hawkish) than speeches made by German GC members.
Third, the voiced preferences of NCB presidents largely coincide with the independence
level their central banks had at the time of the Maastricht Treaty; that is, the presidents of
the least independent central banks (prior to the Maastricht Treaty) make the most dovish
speeches and vice versa. One interpretation of these findings is that NCBs still follow
their old habits despite all the formal reforms undertaken since the Maastricht Treaty.
Fourth, country-specific macroeconomic conditions matter for speeches delivered inside
the central bankers home country but not for those made abroad. Finally, differences
in central banker preferences are the key source of variation in their speeches before the
financial crisis, whereas divergent national economic conditions are the main factor during
and after the crisis.
Our results have some policy implications. In January 2015, the GC implemented a
rotation scheme for voting at each meeting. Similar to the FRB presidents in the FOMC,
NCB presidents will participate in all meetings but will not be allowed to vote every
time. Consequently, they will need to rely on instruments other than voting to express
their views and make an impact on monetary policy. Speeches and interviews are ways
of publicly expressing their disagreement with a decision and of exerting some influence
19

on their voting colleagues. It remains to be seen if this change in the decision-making
process will lead to an increase in voiced disagreement.
Finally, our findings have some implications for central bank watchers. When drawing
conclusions with respect to the future course of monetary policy, central bank watchers
should be aware that GC members seem to make audience-specific adjustments to the
gist of their speeches.
20

References
[1] Apel, M. and M. Blix Grimaldi (2012): ‘The Information Content of Central Bank
Minutes,’ Sveriges Riksbank Working Paper 261.
[2] Armesto, M., R. Hernandez-Murillo, M. Owyang, and J. Piger (2009): ‘Measuring
the Information Content of the Beige Book: A Mixed Data Sampling Approach,’
Journal of Money, Credit and Banking 41, 35−55.
[3] Badinger, H. and V. Nitsch (2014): ‘National Representation in Supranational In-
stitutions: The Case of the European Central Bank,’ Journal of Comparative Eco-
nomics 42, 19−33.
[4] Berger, H., J. de Haan, and J.-E. Sturm (2011): ‘Does Money Matter in the ECB
Strategy? New Evidence Based on ECB Communication,’ International Journal of
Finance and Economics 16, 16−31.
[5] Bligh, M. C. and G. D. Hess (2007): ‘The Power of Leading Subtly: Alan Greenspan,
Rhetorical Leadership, and Monetary Policy,’ Leadership Quarterly 18, 87−104.
[6] Blinder, A., M. Ehrmann, M. Fratzscher, J. de Haan, and D.-J. Jansen (2008): ‘Cen-
tral Bank Communication and Monetary Policy: A Survey of Theory and Evidence,’
Journal of Economic Literature 46, 910−945.
[7] Born, B., M. Ehrmann, and M. Fratzscher (2013): ‘Central Bank Communication
on Financial Stability,’ Economic Journal 124, 701−734.
[8] Brand, C., D. Buncic, and J. Turunen (2010): ‘The Impact of ECB Monetary
Policy Decisions and Communication on the Yield Curve,’ Journal of the European
Economic Association 8, 1266−1298.
[9] Bulir, A., M. Cihak and K. Smidkova (2012): ‘Writing Clearly: The ECB’s Mone-
tary Policy Communication,’ German Economic Review 14, 50−72.
[10] Cancelo, J. R., D. Varela, and J. M. Sanchez-Santos (2011): ‘Interest Rate Setting
at the ECB: Individual Preferences and Collective Decision Making,’ Journal of
Policy Modeling, 33 804−820.
[11] Chappell, H. W., R. R. McGregor, and T. A. Vermilyea (2008): ‘Regional Eco-
nomic Conditions and Monetary Policy,’ European Journal of Political Economy
24, 283−293.
21

[12] Conrad, C. and M. J. Lamla (2010): ‘The High-Frequency Response of the EUR-
USD Exchange Rate to ECB Communication,’ Journal of Money, Credit and Bank-
ing 42, 1391−1417.
[13] de Haan, J. (2008): ‘The Effect of ECB Communication on Interest Rates: An
Assessment,’ Review of International Organizations 3, 375−398.
[14] de Jong, E. and F. van Esch (2013): ‘Culture Matters: French-German Conflicts on
European Central Bank Independence and Crisis Resolution,’ Nijmegen Center for
Economics Working Paper 13-104.
[15] Ehrmann, M. and M. Fratzscher (2007): ‘Communication by Central Bank Commit-
tee Members: Different Strategies, Same Effectiveness?’ Journal of Money, Credit
and Banking 39, 509−541.
[16] Eijffinger, S., E. Schaling, and M. Hoeberichts (1998): ‘Central Bank Independence:
A Sensitivity Analysis’ European Journal of Political Economy 14, 73−88.
[17] Gildea, J. A. (1992): ‘The Regional Representation of Federal Reserve Bank Presi-
dents,’ Journal of Money, Credit and Banking 24, 215−225.
[18] Hansen, S. E., M. McMahon, and A. Prat (2014), ‘Transparency and Deliberation
Within the FOMC: A Computational Linguistics Approach,’ CEP Discussion Pa-
pers 1276.
[19] Hayo, B. and P.-G. Meon (2013): ‘Behind Closed Doors: Revealing the ECB’s
Decision Rule,’ Journal of International Money and Finance 37, 135−160.
[20] Hayo, B. and M. Neuenkirch (2013): ‘Do Federal Reserve Presidents Communicate
with a Regional Bias?’ Journal of Macroeconomics 35, 62−72.
[21] Heinemann, F. and K. Ullrich (2007): ‘Does it Pay to Watch Central Bankers’
Lips? The Information Content of ECB Wording,’ Swiss Journal of Economics and
Statistics 143, 155−185.
[22] Jansen, D.-J. and J. de Haan (2005): ‘Talking Heads: The Effects of ECB State-
ments on the Euro-Dollar Exchange Rate,’ Journal of International Mo- ney and
Finance 24, 343−361.
[23] Jansen, D.-J. and J. de Haan (2006): ‘Look Who’s Talking: ECB Communication
During the First Years of EMU,’ International Journal of Finance and Economics
11, 219−228.
22

[24] Jansen, D.-J. and J. de Haan (2007): ‘Were Verbal Efforts to Support the Euro
Effective? A High-Frequency Analysis of ECB Statements,’ European Journal of
Political Economy 23, 245−259.
[25] Jansen, D.-J. and J. de Haan (2009): ‘Has ECB Communication Been Helpful
in Predicting Interest Rate Decisions? An Evaluation of the Early Years of the
Economic and Monetary Union,’ Applied Economics 41, 1995−2003.
[26] Jung, A., F. P. Mongelli, and P. Moutot (2010): ‘How are the Eurosystem’s Mone-
tary Policy Decisions Prepared: A Roadmap,’ Journal of Common Market Studies
48, 319−345.
[27] Klomp, J. and J. de Haan (2009): ‘Central Bank Independence and Financial In-
stability,’ Journal of Financial Stability 5, 321−338.
[28] Lee, J. and P. M. Crowley (2009): ‘Evaluating the Stresses from ECB Monetary
Policy in the Euro Area,’ Bank of Finland Research Discussion Papers 11−2009.
[29] Lucca, D. O. and F. Trebbi (2009): ‘Measuring Central Bank Communication:
An Automated Approach with Application to FOMC Statements,’ NBER Working
Paper No. 15367.
[30] Meade, E. E. (2005): ‘The FOMC: Preferences, Voting, Consensus,’ Federal Reserve
Bank of St. Louis Review 87, 93−101.
[31] Meade, E. E. (2010): ‘Federal Reserve Transcript Publication and Regional Repre-
sentation,’ Contemporary Economic Policy 28, 162−170.
[32] Meade, E. E. and D. N. Sheets (2005): ‘Regional Influences on FOMC Voting
Patterns,’ Journal of Money, Credit and Banking 37, 661−677.
[33] Neuenkirch, M. (2013): ‘Monetary Policy Transmission in Vector Autoregressions:
A New Approach Using Central Bank Communication,’ Journal of Banking and
Finance 37, 4278−4285.
[34] Renshon, J. (2009): ‘When Public Statements Reveal Private Beliefs: Assessing
Operational Codes at a Distance,’ Political Psychology 30, 649−661.
[35] Rosa, C. and G. Verga (2007): ‘On the Consistency and Effectiveness of Cen-
tral Bank Communication: Evidence from the ECB,’ European Journal of Political
Economy 23, 146−175.
23

[36] Siklos, P. L. and M. T. Bohl (2007): ‘Do Actions Speak Louder than Words?
Evaluating Monetary Policy at the Bundesbank,’ Journal of Macroeconomics 29,
368−386.
[37] Sturm, J.-E. and J. de Haan (2011): ‘Does Central Bank Communication Really
Lead to Better Forecasts of Policy Decisions? New Evidence Based on a Taylor Rule
Model for the ECB,’ Review of World Economics 147, 41−58.
[38] Sturm, J.-E. and T. Wollmershauser (2011): ‘The Stress of Having a Single Mone-
tary Policy in Europe,’ KOF Working Paper No. 190.
[39] Taylor, J. B. (1993): ‘Discretion Versus Policy Rules in Practice,’ Carnegie-Rochester
Conference Series on Public Policy 39, 195−214.
[40] van Esch, F. (2007): ‘Mapping the Road to Maastricht. A Comparative Study of
German and French Pivotal Decision Makers’ Preferences Concerning the Estab-
lishment of a European Monetary Union During the Early 1970s and Late 1980s,’
Unpublished Ph.D. Thesis, Nijmegen: Radboud University Nijmegen.
[41] White, H. (1980): ‘A Heteroskedasticity-Consistent Covariance Matrix Estimator
and a Direct Test for Heteroskedasticity,’ Econometrica 48, 817−838.
24

Appendix
Figure A1: National Versus Euro Area 12-Month-Ahead Inflation Expectations
25

Figure A2: National Versus Euro Area 12-Month-Ahead Growth Expectations
26

Tab
leA
1:F
requen
cyof
Sp
eech
esp
erY
ear
and
Pos
itio
n/C
ountr
y
1999
2000
2001
2002
2003
2004
2005
2006
2007
2008
2009
2010
2011
2012
2013
2014
By
Pos
itio
n...
Pre
siden
t19
114
78
2018
2118
2120
1516
117
6...
Exec
.B
oard
(excl
.P
res.
)7
149
31
76
1217
5946
3856
4462
8...
NC
BP
resi
den
ts15
2115
3233
4332
4154
5752
5344
3643
20B
yC
oun
try
...
Aust
ria
00
03
35
53
513
1410
72
33
...
Bel
gium
00
00
02
01
32
11
510
113
...
Fin
land
00
01
02
17
75
23
23
51
...
Fra
nce
612
96
521
2024
2729
2723
2323
314
...
Ger
man
y1
23
22
83
78
2017
1620
1225
7...
Gre
ece
00
01
26
710
1015
75
11
24
...
Irel
and
00
01
33
54
52
49
410
82
...
Ital
y15
1911
127
99
710
2423
1824
1515
7...
The
Net
her
lands
1911
413
136
34
76
71
23
00
...
Por
tuga
l0
21
21
10
20
00
99
812
3...
Spai
n0
00
16
73
57
2116
1119
40
0
27