The Oceanography Report Oceanography...The Oceanography Report: The focal point for physical,...
9
Eos, Vol. 70, No. 18, May 2, 1989 The Oceanography Report The Oceanography Report: The focal point for physical, chemical, geological and biological ocean- ographers. Editor: Robin D. Muench, SAIC, 13400B Northrup Way, Suite 36, Bellevue, WA 98005; tel. 206-747-7152 Storm Response in the Coastal Ocean The Oceanographic Component of the Canadian Atlantic Storms Program (CASP) PAGES 562-563, 570-572 Introduction The Canadian Atlantic Storms Program (CASP) is a joint oceanographic and meteoro- logical research program to examine the me- soscale structure and dynamics of winter storms and the associated oceanic response on Canada's east coast. The mesoscale meteo- rology of these destructive storms is not well understood and presents great challenges to the meteorological forecaster. Likewise, the oceanic response is poorly documented and requires a more complete and quantitative understanding. Atmospheric and oceanic ob- servations made in the Canadian Maritime provinces during the CASP field program, in the winter of 1985-86, are now being ana- lyzed and modeled by investigators at the Bedford Institute of Oceanography (BIO) of the Government of Canada Department of Fisheries and Oceans, the Atmospheric Envi- ronment Service (AES) of the Department of the Environment, and several Canadian uni- versities. The meteorological component of CASP has been described by Stewart et al. [1987]. Here, we discuss the origins and ob- jectives of the 1985—86 oceanographic field program and present some of the salient sci- entific results and plans for further studies. 66' ^-V/.-^V*i-:-.-:-::vV" ' PERMANENT TIDE GAUGES CASP TEMPORARY TIDE GAUGES CASP CURRENT METER/BOTTOM PRESSURE GAUGE MOORINGS "lAXIS OF NOVA SCOTIA CURRENT J (AVERAGE POSITION) sr Fig. 1. Locations of the\CASP oceanographic field measurements, (a) Current me- ter-pressure gage moorings, SI-SI 1, on the Scotian Shelf and coastal tide gage locations along the Nova Scotia coast. (B) AES mesonet stations, Ml-M-17, on the Nova Scotia mainland. Mean currents observed during the CASP field program (December 1, 1985- March 1, 1986) are shown for current meter moorings S1-S4 and S6-S11 for the surface and middle of the water column, (c, on next page) Locations of surface wave buoys and the surface meteorological buoy, showing limits of the CODAR observations of surface current.
Transcript of The Oceanography Report Oceanography...The Oceanography Report: The focal point for physical,...

Eos , V o l . 70 , N o . 18, M a y 2 , 1989
The Oceanography Report
The Oceanography Report: The focal point for physical, chemical, geological and biological ocean-ographers.
Editor: Robin D. Muench, SAIC, 13400B Northrup Way, Suite 36, Bellevue, WA 98005; tel. 206-747-7152
Storm Response in the Coastal Ocean The Oceanographic Component of the Canadian Atlantic Storms Program (CASP) PAGES 562-563, 570-572
Introduction The Canadian Atlantic Storms Program
(CASP) is a joint oceanographic and meteorological research program to examine the me-soscale structure and dynamics o f winter storms and the associated oceanic response on Canada's east coast. The mesoscale meteorology o f these destructive storms is not well understood and presents great challenges to the meteorological forecaster. Likewise, the oceanic response is poorly documented and requires a more complete and quantitative understanding. Atmospheric and oceanic observations made in the Canadian Maritime provinces during the CASP field program, in the winter o f 1985-86, are now being analyzed and modeled by investigators at the Bedford Institute o f Oceanography (BIO) o f the Government o f Canada Department o f Fisheries and Oceans, the Atmospheric Environment Service (AES) o f the Department o f the Environment, and several Canadian universities. The meteorological component o f CASP has been described by Stewart et al. [1987]. Here, we discuss the origins and objectives o f the 1985—86 oceanographic field program and present some o f the salient scientific results and plans for further studies.
66' ^-V/.-^V*i-:-.-:-::vV" '
PERMANENT T IDE GAUGES
CASP TEMPORARY T I D E GAUGES
CASP C U R R E N T M E T E R / B O T T O M PRESSURE GAUGE MOORINGS
" l A X I S OF NOVA SCOTIA CURRENT J (AVERAGE POSIT ION)
sr
Fig. 1. Locations o f the\CASP oceanographic field measurements, (a) Current meter-pressure gage moorings, SI-SI 1, on the Scotian Shelf and coastal tide gage locations along the Nova Scotia coast. (B) AES mesonet stations, Ml-M-17, on the Nova Scotia mainland. Mean currents observed during the CASP field program (December 1, 1985-March 1, 1986) are shown for current meter moorings S1-S4 and S6-S11 for the surface and middle o f the water column, (c, on next page) Locations of surface wave buoys and the surface meteorological buoy, showing limits of the CODAR observations of surface current.

Eos , V o l . 70 , N o . 18, M a y 2 , 1989
63° 00'
N O V A S C O T I A
63°00" Fig. 1. (cont.) (c) Locations of surface wave buoys and the surface meteorological
buoy, showing limits o f the CODAR observations o f surface currents. Figure 1 (a) and (b) are on the preceding page.
Motivation The severe winter weather o f eastern Cana
da is due primarily to extratropical cyclonic storms that develop along the U.S. eastern seaboard and travel northeast along the Polar Front. These storms exhibit organization over a broad range o f horizontal length scales. The large (synoptic) scale is o f order 2000 km and corresponds to the classical model o f cyclonic storms. The extremes o f wind and precipitation, which in many cases have the most destructive impact on society, occur on the smaller "mesoscale," o f order 20-200 km. These phenomena are not resolved by operational meteorological networks and are not routinely forecast. Much remains to be learned before mesoscale storm features and the associated oceanic response can be accurately forecast.
Principal Objectives The working hypothesis o f the oceano
graphic component o f CASP is that the generation of currents and surface waves by storms is significantly influenced by the mesoscale structure o f the atmospheric forcing field. The oceanographic sampling strategy of CASP was thus designed to resolve the
structure o f the ocean current, subsurface pressure, and surface wave fields over horizontal length and time scales comparable to the anticipated mesoscale variability in the meteorological forcing field. These relatively high-resolution oceanographic measurements, coupled with similarly dense meteorological observations, are expected to improve our understanding o f how the coastal ocean responds to mesoscale atmospheric forcing. At the same time the larger-scale wind-driven circulation can also be examined using the high-resolution current measurements and sea level records from a much larger part o f the coast. The CASP surface waves experiment was designed to examine development o f the directional wave spectrum in fetch-limited situations, interaction between wind sea and swell, and transformation o f wave fields propagating into shallow water. Optimal relations among wave spectral parameters, particularly those that take wave direction into account, are also being sought.
Field Program The oceanographic field program was con
ducted on the Scotian Shelf (Figure la) between December 1985 and April 1986. The shelf is about 700 km long, 120-240 km wide, and has an average depth o f 90 m. Its
topography is characterized by a relatively uniform bottom slope near shore, a midshelf trough about 200 m deep, and a series o f shallow offshore banks separated by submarine channels. The residual circulation on the inner shelf is dominated by the Nova Scotian Current (Figure la), which transports water from the Gulf o f St. Lawrence along the coast to the southwest. Historical estimates o f the surface strength o f the current range from 0.06 to 0.12 m s" 1 based on drift bottle returns [Bumpus and Lauzier, 1965] and the ad-vection o f oil [Forrester, 1971], or on sea surface temperature anomalies [Sutcliffe et al., 1976]. Geostrophic calculations [Drinkwater et al., 1979] place the axis o f the current 50 to 70 km from the coast with a wintertime (December-March) alongshore transport o f from 0.2 to 0.5 x 10 6 m 3 s" 1. Within the current, the water column is least stratified during the late winter months (February-April), exhibiting a nearly homogeneous surface layer and weakly stratified deep layer separated by a pycnocline at 50-70 m.
Eleven moorings were deployed in CASP to measure current, bottom pressure and water properties on the inner shelf east o f Halifax (Figure lb) . Mooring locations were chosen to detect variability on horizontal scales o f 10 to 120 km, and the instruments on each mooring were concentrated around the pycnocline (40-70 m) with at least one instrument in the surface and bottom layers. Coastal sea level observations were made at ten sites regularly spaced along the Nova Scotia coast, and conductivity-temperature-depth (CTD) surveys were conducted on the eastern half o f the Scotian Shelf during the mooring deployment and recovery cruises (about December 1, 1985, and April 1, 1986). The surface wave field east o f Halifax was measured by three directional wave buoys and six conventional wave buoys (Datawell WAVEC and 0.9 m WAVERIDER, respectively) anchored shoreward o f the 100 m isobath (within 30 km o f shore; see Figure lc) . Water depth in the wave array ranged from 22 to 100 m, which is deep water for all fetch-limited offshore-propagating waves. The WAVEC buoys and two o f the WAVERIDERs were located on a line extending seaward normal to the coast, with the four remaining WAVERIDERs from 5 to 20 km on either side o f the line. Within the wave buoy array, high-frequency ground-wave radar (CODAR) was used to produce hourly maps o f the surface current field during selected storms.
Special efforts were also made to observe the mesoscale variability o f the surface wind field in the experimental area. A land-based mesonet, consisting o f seventeen 10-m anemometer masts in a triangular array (Figure lb), was deployed by AES during January-March, 1986 [Stewart et al., 1987]. The coastal leg of the mesonet array provided wind measurements about every 15 km adjacent to the wave buoy and current meter arrays. Surface meteorology buoys were placed on the Scotian Shelf to record wind, sea surface temperature, atmospheric pressure, and air temperature; low-altitude aircraft flights were used during cold air outbreaks following several storms to map the lateral variations in the planetary boundary layer near the coast [Smith and MacPherson, 1987].
The CASP subsurface oceanography and surface waves programs yielded remarkably complete data sets, considering the severe
Eos , V o l . 70 , N o . 18, M a y 2 , 1989
winter weather over the northwest Atlantic. More than 85% of the subsurface observations were successful; in 81 days (January 10-March 31, 1986) more than 5000 hourly directional wave spectra and 10,000 hourly nondirectional wave spectra were archived. Unfortunately, however, buoy failures limited the observations o f marine winds to those from a single meteorological buoy (Coastal Climate Co. Ltd. MINIMET) anchored at the 100 m isobath (Figure lb) near the outer WAVEC buoy.
Scientific Results
Mean F l o w
The CASP mean current measurements provide credible estimates o f the barotropic transport at Halifax and suggest that during the winter o f 1986 it was 1 to 2 times as large as the purely baroclinic transport estimated by Drinkwater et al. [1979]. During CASP, both the mean surface currents (0.10—0.29 m s - 1 at depths o f 5-15 m) and the mid-depth currents (0.05-0.20 m s" 1 at 40-70 m; Figure lb) in water deeper than 100 m were considerably higher than historical estimates. The maximum mean surface current was observed on the 150 m isobath (site S3), roughly 46 km from the coast. In addition, monthly mean transports at the Halifax mooring line (S1-S5), based on reasonable assignments o f cross-sectional areas to each current meter, were in the range o f 0.7 to 1.2 x 10 6 m 3 s" 1, exceeding the previous geostrophic transport estimates by about a factor o f three. Nevertheless, the shear o f the winter mean currents, calculated between 16 and 110 m at S3, appears to be in geostrophic balance (via the thermal wind relation) with the mean horizontal density gradient between S2 and S3 at 70 m. Moreover, direct comparisons o f monthly mean alongshore currents with the geostrophic shear from C T D data indicate a strong barotropic component in the Nova Scotian Current with bottom currents o f order 0.05-0.06 m s" 1 to the southwest between the 100 and 150 m isobaths.
L o w - f r e q u e n c y M o t i o n s
The oceanic response to synoptic-scale atmospheric forcing during CASP occurred primarily at periods o f 2-10 days, consistent with previous observations from the Scotian Shelf [Smith et al, 1978] and many other mid-latitude regions. Subsurface pressure (SSP(mb) = measured bottom pressure + atmospheric pressure) was highly coherent along the Nova Scotian coast and throughout the CASP mooring array at all frequencies and was well-correlated with alongshore wind stress [Schwing, 1989]. In contrast, the current field had a much smaller spatial coherence scale and was poorly correlated with direct atmospheric forcing at most locations.
SSP appears to respond directly to the local wind and to nonlocal forcing that causes energy to propagate westward along the shelf in a manner consistent with coastal-trapped wave (CTW) theory [Gill and Schumann, 1974]. Frequency-dependent linear regression [Jenkins and Watts, 1968] was applied to relate the SSP observations statistically to the cross- (r*) and alongshore (7 )̂ wind stress estimates from Sable Island and to Louisbourg
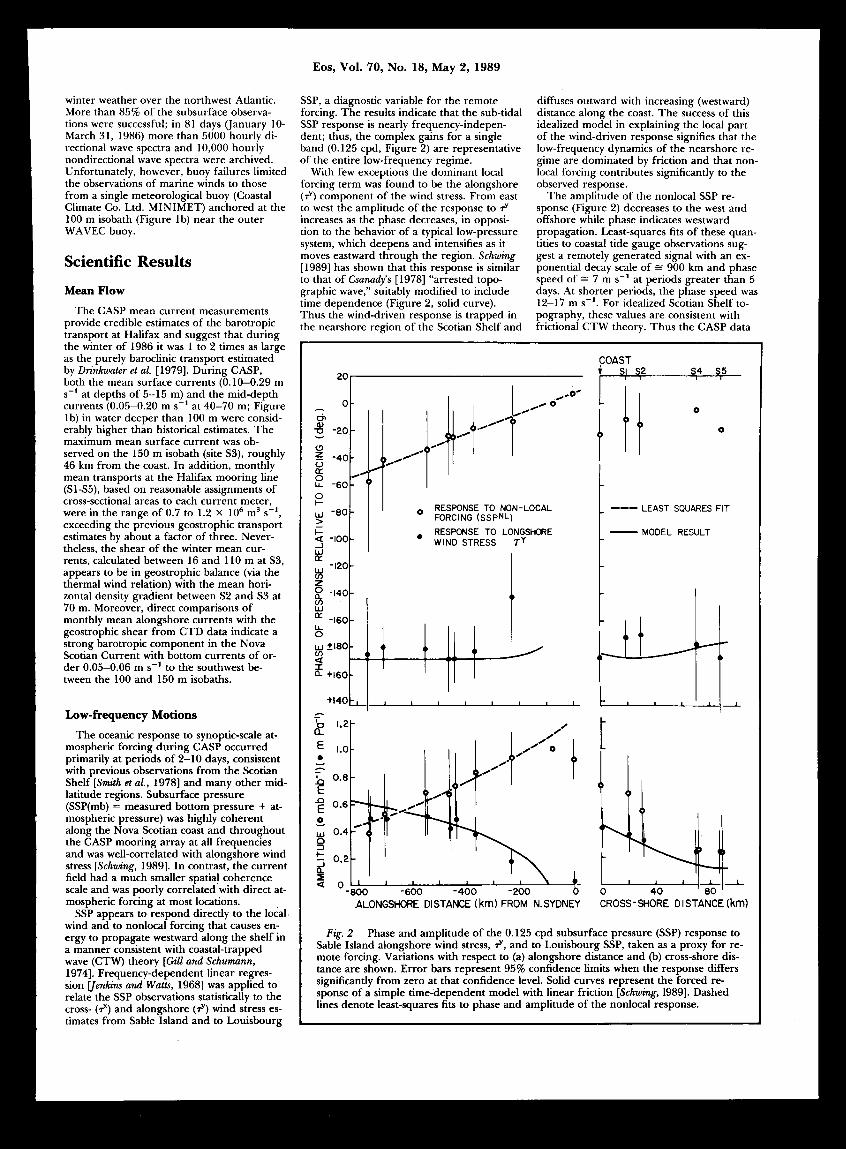
SSP, a diagnostic variable for the remote forcing. The results indicate that the sub-tidal SSP response is nearly frequency-independent; thus, the complex gains for a single band (0.125 cpd, Figure 2) are representative of the entire low-frequency regime.
With few exceptions the dominant local forcing term was found to be the alongshore (T 5 ') component o f the wind stress. From east to west the amplitude o f the response to increases as the phase decreases, in opposition to the behavior o f a typical low-pressure system, which deepens and intensifies as it moves eastward through the region. Schwing [1989] has shown that this response is similar to that o f Csanady's [1978] "arrested topographic wave," suitably modified to include time dependence (Figure 2, solid curve). Thus the wind-driven response is trapped in the nearshore region o f the Scotian Shelf and
diffuses outward with increasing (westward) distance along the coast. The success o f this idealized model in explaining the local part o f the wind-driven response signifies that the low-frequency dynamics o f the nearshore regime are dominated by friction and that nonlocal forcing contributes significantly to the observed response.
The amplitude o f the nonlocal SSP response (Figure 2) decreases to the west and offshore while phase indicates westward propagation. Least-squares fits o f these quantities to coastal tide gauge observations suggest a remotely generated signal with an exponential decay scale o f = 900 km and phase speed o f = 7 m s" 1 at periods greater than 5 days. At shorter periods, the phase speed was 1 2 - 1 7 m s - 1 . For idealized Scotian Shelf topography, these values are consistent with frictional C T W theory. Thus the CASP data
COAST S4 S5
LEAST SQUARES FIT
MODEL RESULT
-800 -600 -400 -200 ALONGSHORE DISTANCE (km) FROM N.SYDNEY CROSS-SHORE DISTANCE (km)
Fig. 2 Phase and amplitude o f the 0.125 cpd subsurface pressure (SSP) response to Sable Island alongshore wind stress, and to Louisbourg SSP, taken as a proxy for remote forcing. Variations with respect to (a) alongshore distance and (b) cross-shore distance are shown. Error bars represent 95% confidence limits when the response differs significantly from zero at that confidence level. Solid curves represent the forced response o f a simple time-dependent model with linear friction [Schwing, 1989]. Dashed lines denote least-squares fits to phase and amplitude o f the nonlocal response.

E o s , V o l . 7 0 , N o . 18 , M a y 2 , 1989
provide the first direct evidence for coastal-trapped waves on the Scotian Shelf.
The regression model containing local wind stress and nonlocal forcing accounts for over 90% of the SSP variance at all locations and frequencies. The relative contributions o f the forcing terms (Figure 3) indicate that at Sambro (near Halifax) local and nonlocal forcing are o f nearly equal importance at periods greater than 2 days, while nonlocal effects are enhanced at snorter periods. The secondary role o f cross-shelf stress is also evident. The relative importance o f local alongshore stress with respect to nonlocal forcing increases from east to west along the coast as the local response grows and the remotely forced signal decays.
Unlike the pressure field analysis, the interpretation o f the multiple regression o f the CASP currents on atmospheric and remote forcing is not nearly as clear. Nonlocal contributions to the alongshore current were substantial, particularly at periods o f 5 days and greater. This signal propagated and decayed to the west at scales similar to those o f the SSP field. At shorter periods, however, the amplitude o f the velocity response to nonlocal forcing was substantially smaller. Furthermore the response to local wind forcing was generally small at all frequencies and varied greatly over scales o f only 20—50 km. While T 3 ' was the dominant forcing for SSP, r* was shown to be an important contributor to alongshore velocity in many instances. Nevertheless, there is some measure o f consistency between SSP and current results in that estimates o f the cross-shelf pressure gradient from the average current gain at the S1-S4 moorings are comparable to those inferred from the differences between the SSP responses at S5 and the coast. This indicates that the integrated current response to and nonlocal forcing is nearly geostrophic. In addition, statistically significant velocity responses at individual moorings are relatively independent o f depth; that is, the current response seems to be barotropic. Nevertheless, the multiple regression model that explains SSP variability so well accounts for only 5 0 -80% of the alongshore current variance. The poor correlation o f the velocity field and large variability o f the response within the mooring array suggest that the dynamics that control low-frequency currents are much more complex than those for pressure.
Inertial M o t i o n s Spectral analysis o f the CASP data reveals
that the dominant current variability in waters deeper than 100 m is found in the inertial frequency band. However, the structure, strength and timing o f the intermittent bursts of inertial wave energy are governed in a complex manner by the character o f the mesoscale wind forcing, the background density and mean velocity fields, and the nearshore geometry (coastline shape and bottom topography). The intermittency o f inertial wave energy is most clearly revealed by complex demodulation o f the current velocity components at the inertial frequency (Figure 4c, d). Peak amplitudes o f the cross-shore component reach 0.20 m s _ 1 in the surface layer on the 150 m isobath and are only slightly smaller at depth. "Coastal inhibition" o f the inertial waves [Kundu, 1986] is also evident by comparing the very weak energy levels on the 60-m isobath (SI(12m), Figure 4c) with those further offshore.
.05 0.1 0.5 1.0 u ( c p d )
Fig. 3 Distribution o f variance in Sambro SSP due to Sable Island wind stress components (T*, T 7 ) and nonlocal forcing (SSP N L ) . Each level o f shading represents the variance accounted for by the indicated independent variable in the multiple regression model. Area labelled e at bottom denotes residual error.
N 0.6
(n o.4 < 0.2 U 0.0 w < -0.2 ^ -0.4
S - 0 . 6
E 0 6
W 0.4 < 0.2 O 0.0 in < -0.2 ^ -0.4 W - ° - 6
1 i i i . . 1 .-
J i
-. 1 . 1 . . . . . . 1 1 •. 1
w w
w
0.20
0.15
0.10
S3(110m) J
S3(70m) f\S3(16m);
90.0 335.0 355.0 10.0 30.0 (1985) D A Y
Fig. 4 Time series o f Shearwater wind stress and the amplitude o f the inertial complex demodulate o f the cross-shore current component, (a) North-south wind stress component, (b) east-west wind stress component, (c) inertial current amplitude in the surface layer at moorings SI-S3 and SI 1, and (d) inertial current amplitude at the four depths at mooring S3. Sea surface wind stress is estimated according to Smith and Banke [1975]. The arrows mark the IOP 14 storm (0600Z, March 7-0600Z, March 10, 1986).

Eos , V o l . 70 , N o . 18, M a y 2 , 1989
80° 70° 60° 501
Examination o f the sea surface wind stress time series (Figure 4a, b) reveals that most o f the peaks in inertial wave energy are associated with strong wind events, but that the timing and amplitudes o f the responses are not very consistent. In an effort to understand some of the dynamics o f inertial wave generation in this nearshore environment, the response to storm forcing during CASP intensive observation period (IOP) 14 (0600Z, March 7-0600Z, March 10, 1986) has been studied in some detail. On March 7 the low pressure center associated with IOP 14 tracked northeast across Nova Scotia and into the Gulf o f St. Lawrence (Figure 5a). Between 0000Z and 1200Z, the low underwent
8 0 ° 7 0 ° 6 0 ° 5 0 °
"explosive deepening" (the central pressure falling faster than 1 mb h r _ 1 ) , and Nova Scotia felt the full fury o f the storm when it arrived at midday. The scattered synoptic wind vectors and local time series measurements from the AES mesonet indicate a rapid clockwise veering o f the wind behind the warm front, which was oriented roughly east-west as the system passed through the region. The frontal velocity was estimated to be 10 m s" 1
to the north by using a plane wave model to describe the movement o f the sharp direction change through the AES mesonet [Smith, 1989]. Since most o f that change at an individual station occurred in 20 minutes, the width o f the front was o f order 15 km, in
contrast to along-frontal scales in excess o f 500 km (see Figure 5a).
T o investigate the inertial response o f the current field during IOP 14, the tidal-residual current records were band-pass filtered at the inertial frequency. The complex correlations [Kundu, 1986] between the inertial oscillations at the near-surface instrument on the S3 mooring (S3(16 m)) and all others in the field were then evaluated over the 3-day interval commencing at 0600Z on March 7. The magnitude o f this quantity gives a weighted average correlation o f two vector time series, while the phase gives the average counterclockwise angle (looking downward) o f the second vector with respect to the first. The phase o f the correlation on the Halifax mooring line (Figure 6a) exhibits rapid clockwise turning with depth in the pycnocline (50-70 m deep) consistent with upward phase and downward energy propagation o f inertial waves. Near the shore, however, the sharp decline o f the correlation indicates coastal inhibition o f the waves, which appear to propagate onshore in the surface layer.
A plan view o f the vertically averaged correlation in the surface layer (depth ^ 40 m; Figure 6b) suggests that the contour lines o f both magnitude and phase o f the correlation are roughly parallel to the coast. However, closer inspection reveals that the inertial phase varies much more slowly on the Lis-comb mooring line (S9-S11) than along the Halifax line, implying that the component o f phase speed along the Liscomb line is about 5 times greater. From the Liscomb line plus 100-m isobath stations, the estimated propagation was directed onshore at a rate o f 8.1 ± 0.9 m s - 1 , comparable to the measured atmospheric frontal velocity (Figure 5b). This observation is consistent with Kundu and Thomson's [1985] description o f the "inertial wake" behind an idealized 2-D front moving at a speed U such that Ci <̂ U < Co, where Cq and Ci are characteristic speeds o f the barotropic and first baroclinic modes. On the other hand, the propagation speed estimate on the Halifax line, 1.6 ± 0.4 m s~\ is less certain and is inconsistent with such a response.
The inertial response o f temperature and salinity fields during IOP 14 appears to be in phase throughout the pycnocline (50—70 m), but the strongest oscillations at S3, for instance, are delayed by roughly 12 hours after the passage o f the front. With internal wave speeds o f order 1 m s~\ this suggests that the
m s
270
ESTIMATED PHASE VELOCITIES
LOW PRESSURE SYSTEM: AVERAGE FROM SURFACE PRESSURE ARRAY AND SYNOPTIC CHARTS
FRONTAL MOVEMENT FROM AES MESONET WINDS
INERTIAL CURRENTS IN THE SURFACE LAYER
BAROCLINIC INERTIAL OSCILLATIONS
-9.0°
180' Fig. 5 (a) Synoptic weather charts showing movement o f the CASP IOP 14 storm
across the region during 0600-1800Z, March 7, 1986. Selected surface wind measurements are shown, (b) Estimated phase velocities during CASP IOP 14, including motion o f the low pressure center from AES surface pressure measurements and synoptic charts, frontal velocity from mesonet winds, two estimates (see text) o f propagation velocity o f clockwise current oscillations in the surface layer, and estimate o f baroclinic phase velocity on the Liscomb mooring line (S9-S11).

Eos , V o l . 70 , N o . 18, M a y 2 , 1989
DISTANCE FROM SHORE (kilometres)
\L > i / •
63° 00" 62° 00'
Fig. 6 Contour plot o f magnitude and phase o f the squared complex correlation o f currents measured during CASP IOP 14. (a) Vertical section along the Halifax mooring line (S1-S4), and (b) plan view o f the average values in the surface mixed layer (depth < 40 m).
dominant baroclinic response was caused by passage o f an internal wave generated at the coast, but, as with the current oscillations, calculations o f the phase speed using 70 m temperatures, salinities, or densities gave ambiguous results. On the Liscomb line, the baroclinic waves propagate offshore at an estimated rate o f 1.8 ± 0.1 m s - 1 (Figure 5b), as expected. However, no significant estimates o f the baroclinic phase velocity could be obtained for the Halifax line, where the phase relationships were much more complex.
Gross - shore Var ia t ions in the Near -surface W i n d F ie ld
T o interpret and model the mesoscale variations in the oceanic response to wind forcing, it is essential to know the strength and distribution o f the wind at the sea surface on similar scales. When the wind blows from land to sea, the flow in the planetary boundary layer adjusts, over some length scale, from its terrestrial equilibrium to a new marine equilibrium profile that is characterized by lower roughness and generally by a different buoyancy flux at the sea surface. T o investigate cross-shore variations in the surface wind field near the coast o f Nova Scotia, the Twin Otter atmospheric research aircraft o f the National Aeronautical Establishment o f Canada flew airborne surveys o f the planetary boundary layer, primarily at altitudes o f 50-70 m, under conditions o f cold offshore advection [Smith and MacPherson, 1987]. In addition to other meteorological variables, the Twin Otter measures three orthogonal components o f gust velocity, air temperature, and wind speed and direction. The wind speed calculation is based on a ground speed measurement by a Doppler radar system that is biased over water by the "effective" motion o f the sea surface (itself a complicated function o f the phase and orbital speeds o f the surface waves). In CASP, this bias was accounted for by determining the difference between the actual displacement o f the aircraft over the water (from navigation) and that obtained from the integrated Doppler speed.
After correcting for the Doppler biases, intermediate averages o f wind speed and direction and the three components o f atmospheric turbulence were computed at 1- to 2-min-ute intervals along each flight path (horizontal resolution o f roughly 5 km). Then, assuming a straight coastline, the offshore distances along the flight path were converted to displacements from the coast along the fetch. Since atmospheric conditions were comparable on four o f the flights, these data were treated as an ensemble for estimating cross-shore variations versus fetch. In spite o f high spatial variability on individual transects, averaging o f all the 50-m-altitude data in 10-km overlapping bins and normalizing by marine equilibrium values (i.e., averages for fetches exceeding 40 km) produced reasonably smooth horizontal gradients o f mean wind speed and turbulence (Figure 7a-c). As a crude measure o f the cross-shore variations, the average transects were fit with exponential functions o f fetch that yielded length scales o f 9.3, 3.4 and 3.8 km for mean wind speed, turbulent kinetic energy and vertical gust velocity, respectively. These scales are o f the same order as the cross-shore di
mensions o f the CASP mooring and surface wave arrays, and thus have important implications for studies o f such processes as fetch-limited wave growth.
The vertical heat and downwind momentum fluxes were also computed from the 1-and 2-minute covariances o f high-pass filtered vertical velocity with temperature and downwind gust velocity. The 50-m momentum fluxes showed a consistent decrease with offshore distance, whereas the heat fluxes increased or decreased depending on conditions over the land. The downwind momentum flux was found to be nearly constant up to an altitude o f 300 m, but the heat flux diminished with height above 70 m. T o estimate the importance o f free convection in the
marine boundary layer at z = 50 m, the average stability parameter, z/L (where L is the Monin-Obukhov length), was computed for the over-water part o f each cross-shore leg. Values in the range - 1 . 2 ^ - z / L *s 0.3 indicate that buoyancy effects, though weak, are not negligible in the CASP 50-m aircraft data.
Surface W a v e Studies
Time series o f wind speed, wind and wave direction, and significant wave height (Figure 8) give an idea o f the conditions encountered during the CASP field program. Note the 6 m maximum in wave height near day 30, the sharp rise times and gentle decay times o f the

Eos , V o l . 70 , N o . 18, M a y 2 , 1989
5 0 m M E A N W I N D SPEED
4 | ~ b. 5 0 m V E R T I C A L GUST V E L
C- 5 0 m T U R B U L E N T K I N E T I C ENERGY
' - 4 0 -20 0 20 40 60 OFFSHORE DISTANCE ALONG F E T C H ( k m
Fig. 7 Ensemble average cross-shore distributions o f 50-m ratios o f local to offshore values o f (a) mean wind speed, (b) standard deviation o f vertical gust velocity, and (c) turbulent kinetic energy. Overlapping 10-km average data (solid squares) have been fitted by least squares to an exponential curve (solid). From Smith and MacPherson, [1987].
wave height, and the predominance o f southerly swell (wind from the north, waves from the south).
The Joint North Sea Wave Project (JONS-WAP) study [Hasselmann et al, 1973] and other similar experiments provide ample evidence that the growth o f fetch-limited wave spectra is governed by simple power laws. In CASP, the growth o f surface gravity waves as a function o f offshore wind fetch was examined by classifying the wave spectra at each wave buoy by wind direction, each direction representing a different effective fetch from the coast to the buoy [Dobson et al., 1989]. Determination o f the correct growth law, however, requires an accurate accounting o f the offshore variation o f wind velocity along the effective fetch (see Figure 7). The strong dependence o f the spectral energy level on wind speed means that the particular definition chosen for the wind speed is crucial, and comparisons o f the CASP results with past studies indicate that many o f the discrepancies among them may be attributed to differences in the wind definitions used. As a first
JULIAN DAY (1986)
5 0 55 6 0 6 5
JULIAN DAY (1986) 7 0 7 5
Fig. 8 Time series o f wave height H s , wind speed Ui 0 , wave direction 0(f m ) at maximum o f the wave spectrum, and wind direction 0 1 O observed in CASP (January 15-March 15, 1986); after Dobson et al. [1989]. The wind velocity shown is a shoreward extrapolation o f the wind at the MINIMET buoy, using the Taylor and Lee [1984] guidelines, except for the period January 15—30, when it is a seaward extrapolation o f the wind at AES mesonet site M3 (see Figure lb) . The wave observations are from the intermediate-depth WAVEC buoy (depth o f 50 m; see Figure lc) .
approximation, a linear spatial average was used to define the CASP fetch-averaged wind velocity. The correct fetch-averaged wind velocity, which represents the extent that waves remember wind forcing, remains unclear and is the subject o f further study.
During the North Atlantic winter, swell is always present with the wind sea; consequently, the CASP wave spectra always displayed peaks for both wind sea and swell. One-dimensional and directional wave spectra (see cover) demonstrate the sea/swell combination typical o f the CASP results; the wind sea in this case was generated by a strong offshore wind, which opposed the incoming southerly swell. T o eliminate the effect o f the often large swell energy from the fetch law calculations, an algorithm was developed to separate the frequency region occupied by the wind sea from that occupied by swell. The algorithm allows room for the "front face" o f the wind sea spectrum by dividing the wave spectrum at a frequency slightly below that at which the wind wave phase speed equals that o f the wind in the wave direction; below that frequency, all waves travel faster than the wind, and can be taken to be swell. Extensive quality control has shown that the algorithm
is equal to the task o f distinguishing wind sea from swell.
T o investigate the angular dependence o f the fetch-limited growth laws, the spectra were grouped in three "fetch windows" with angular widths o f ±5° , ±15° and ±30° relative to the offshore normal. This permitted comparison with the JONSWAP growth laws, where a ±30° window was standard, and with the Canada Centre for Inland Waters (CCIW) experiment o f Donelan et al. [1985], which specified the wind-wave angle explicitly. When the widest fetch window (±30°) was used and laboratory data were excluded, the CASP regressions are very close to the JONSWAP growth laws. When the ± 5 ° fetch window was used, the CASP results agree well with the CCIW laws. The differences in growth laws among the different fetch windows for a given experiment are thus found to be as large as the differences among the three experiments (JONSWAP, CCIW, and CASP). The closest agreements (e.g., Figure 9) are found with the CCIW regressions against inverse wave age U c / c m (the ratio o f wind speed in the wave direction U c to the wave phase speed c m ) , when explicit allowance is made for the slanting fetch.

E o s , V o l . 7 0 , N o . 18 , M a y 2 , 1989
Fig. 9 Dimensionless sea energy E Q
versus "inverse wave age" U c / c m (see text). Dashed line is the Lake Ontario result o f Donelan et al [1985]. Variables are scaled with the component o f the fetch-averaged MINIMET buoy wind and shoreline wind parallel to the wave direction at the wave spectral peak using a ±30° window with respect to the shoreline normal; after Dob-son et al, [1989].
One growth parameter (called "alpha") that is still very poorly known is the energy level o f the wave field at frequencies high enough above the wind sea spectral peak to be unaffected by nonlinear transfer o f energy from the waves at the peak. Alpha plays an essential role in predictions o f all but the most elementary wave forecast models and is the focus o f current efforts [e.g., Phillips, 1988] to understand the relationship between the wind and microwave backscatter from the sea surface (the basis for remote sensing o f wind velocity by satellite scatterometers). Previous attempts to estimate alpha from buoy observations have been frustrated by difficulties in accurately measuring the high-frequency wave energy. Earlier field programs employing Datawell buoys failed to take full account o f the combined effects o f ambient surface currents and o f buoy frequency response, both o f which have their strongest effects at high frequencies. The CASP spectra were corrected for both effects, which apparendy has never been done before. Surface current information came from nearby near-surface current meters and from the C O D A R data. The high-frequency parts o f the corrected CASP spectra exhibit an frequency dependence, as do the (higher-quality) CCIW spectra, rather than the f" 5 dependence found in JONSWAP. The CASP alpha values (the spectral level o f the P" 4 line), when regressed against inverse wave age, obey essentially the same power law as do the CCIW results. This power law differs significandy from that o f the JONSWAP spectra, even when the JONSWAP results are corrected for ambient currents (but not for buoy frequency response) and the energy assumed to vary a r 4 [Battjes et al, 1987].
Such close agreement among the three experiments (CASP, CCIW and JONSWAP) was unexpected. Although it is gratifying that the swell removal technique appears to be accurate, it is disappointing to find so little difference between open-sea (CASP) and closed-basin (CCIW) results. The presence o f oppos
ing swell was expected to have some effect on the growth laws. The results indicate that the CCIW growth laws can be safely extrapolated to the open sea for use in wave prediction and that all previously estimated growth curves from Datawell buoy observations can be corrected and added to the data base. Why the CCIW results, scaled with in situ wind, should agree with the CASP results, scaled with a fetch-averaged wind, is an interesting question.
Future Investigations Future research with the CASP data will be
directed largely toward developing and testing models o f the physical processes observed during the experiment. A barotropic model for the mean flow on the Scotian Shelf is now being calibrated against the measured mean currents and geostrophic calculations on the the cross-shelf sections at Halifax and Lis-comb. These results will be used to test more complicated three-dimensional models also under development.
Not surprisingly, the simple frictional time-dependent model developed by Schwing [1989] to interpret the low-frequency SSP results fails to replicate the complex velocity patterns observed in CASP. More physically complete models with realistic topography and spatially varying wind forcing are now being tested. The presence o f an isolated topographic feature, such as a shallow bank, induces substantial perturbations in the depth-averaged flow on scales o f order 10 km, while only marginally disturbing the pressure field. Thus the rather incoherent velocity field may be due to the extremely irregular topography o f the Scotian Shelf. These features do not appear to disturb the remotely generated velocity to nearly the same degree as they do the locally generated velocity response.
Although the IOP 14 inertial oscillations from the eastern side o f the CASP mooring array are reasonably consistent with the 2-D frontal generation models o f Kundu and Thomson [1985] and Kundu [1986], more complicated physics appears to govern the dynamics on the Halifax line. Further study of the inertial responses to other CASP storms is required before a detailed modeling strategy is developed. However, some important aspects o f such a model would include a more accurate definition o f the structure and movement o f the mesoscale features in the wind field; a realistic representation o f the stratification, bottom friction and bottom topography; and an accounting for the presence o f a sheared mean current near the surface.
The adjustment o f the planetary boundary layer to local topographic variations and a succession o f roughness changes representing transitions between forest, marshland, beach and sea surface near the Nova Scotian coast is being modeled with a simple 2-D theory for unstratified flow. These results will be o f use in interpreting the 50-m aircraft measurements, the observed differences between the MINIMET buoy wind measurements (30 km offshore) and nearby land stations, and the observations o f fetch-limited wave growth in the nearshore regime.
Through careful analysis o f the extensive CASP surface wave data base, the precision o f the parameters governing fetch-limited growth has been increased by an order o f
magnitude. This will provide an additional constraint on numerical wave models. With this basic work finished, attention will turn to understanding the more complex onshore wind cases. One o f the most important questions is how the wave field is modified as it propagates into shallow waters. The improvements in wind scaling instituted in CASP should produce improvements in the forecasting ability o f existing models.
A c k n o w l e d g m e n t s
Financial support for CASP is from the operating funds o f the principal investigators (BIO and AES) and from the Office o f Energy Research and Development (Government o f Canada, Department o f Energy Mines and Resources).
R e f e r e n c e s
Anderson, C. and P. C. Smith, Oceanographic observations on the Scotian Shelf during CASP, Atmos. Ocean, 27(1), 130, 1989.
Battjes, J. A., T . J. Zitman and L. H. Holth-uijsen, A reanalysis o f the spectra observed in JONSWAP, / . Phys. Oceanogr., 17, 1288, 1987.
Bumpus, D. F. and L. M. Lauzier, Surface circulation on the continental shelf off eastern North America between Newfoundland and Florida, Serial Atlas of the Marine Environment, Folio 7, American Geographical Society, New York, 1965.
Csanady, G. T., The arrested topographic wave,/ . Phys. Oceanogr., 8, 47, 1978.
Dobson, F. W., W. Perrie and B. Toulany, On the deep-water fetch laws for wind-generated surface gravity waves, Atmos. Ocean, 27(1), 210, 1989.
Donelan, M. A., J. Hamilton and W. H. Hui, Directional spectra o f wind-generated waves, Proc. R. Soc. Lond. A, 315, 509, 1985.
Drinkwater, K. F., B. D. Petrie, and W. H. Sutcliffe, Seasonal geostrophic volume transports along the Scotian Shelf, Estuarine Coastal Mar. Sci., 9, 17, 1979.
Forrester, W. D., Distribution o f suspended particles following the grounding o f the tanker Arrow, J. Mar. Res., 29, 151, 1971.
Gill, A. E. and E. H. Schumann, The generation o f long shelf waves by the wind, / . Phys. Oceanogr., 4, 83, 1974.
Hasselmann, K., T . P. Barnett, E. Bouws, H. Carlson, D. E. Cartwright, K. Enke, J. A. Ewing, H. Gienapp, D. E. Hasselmann, P. Krusemann, A. Meerburg, P. Muller, D. J. Olbers, K. Richter, W. Sell and H.Walden, Measurements o f wind-wave growth and swell decay during the Joint North Sea Wave Project (JONSWAP), Deutsch. Hy-drogr. Z., Reihe A (8°), Nr. 12, 1973.
Jenkins, G. M. and D. G. Watts, Spectral Analysis and its Applications, Holden-Day, Oakland, Calif., 525 pp., 1968.
Kundu, P., A two-dimensional model o f inertial oscillations generated by a propagating wind field,/. Phys. Oceanogr., 16, 1399, 1986.
Kundu, P., and R. E. Thomson, Inertial oscillations due to a moving front, / . Phys. Oceanogr., 15, 1076, 1985.
Phillips, O. M., Radar returns from the sea surface-Bragg scattering and breaking waves,/. Phys. Oceanogr., 18, 1065, 1988.
Schwing, F. B., Subtidal response o f the Sco-
Eos , V o l . 7 0 , N o . 18, M a y 2 , 1989
tian Shelf bottom pressure field to meteorological forcing, Atmos. Ocean, 27(1), 157, 1989.
Smith, P. C , Inertial oscillations near the coast o f Nova Scotia during CASP, Atmos. Ocean, 27(1), 181, 1989.
Smith, P. C , B. D. Petrie and C. R. Mann, Circulation, variability and dynamics o f the Scotian Shelf and Slope, / . Fish. Res. Board Can., 35, 1067, 1978.
Smith, P. C. and J . I . MacPherson, Cross-shore variations o f near-surface wind veloc-
News Oil Spill Shows on Satellite Image PAGE 564
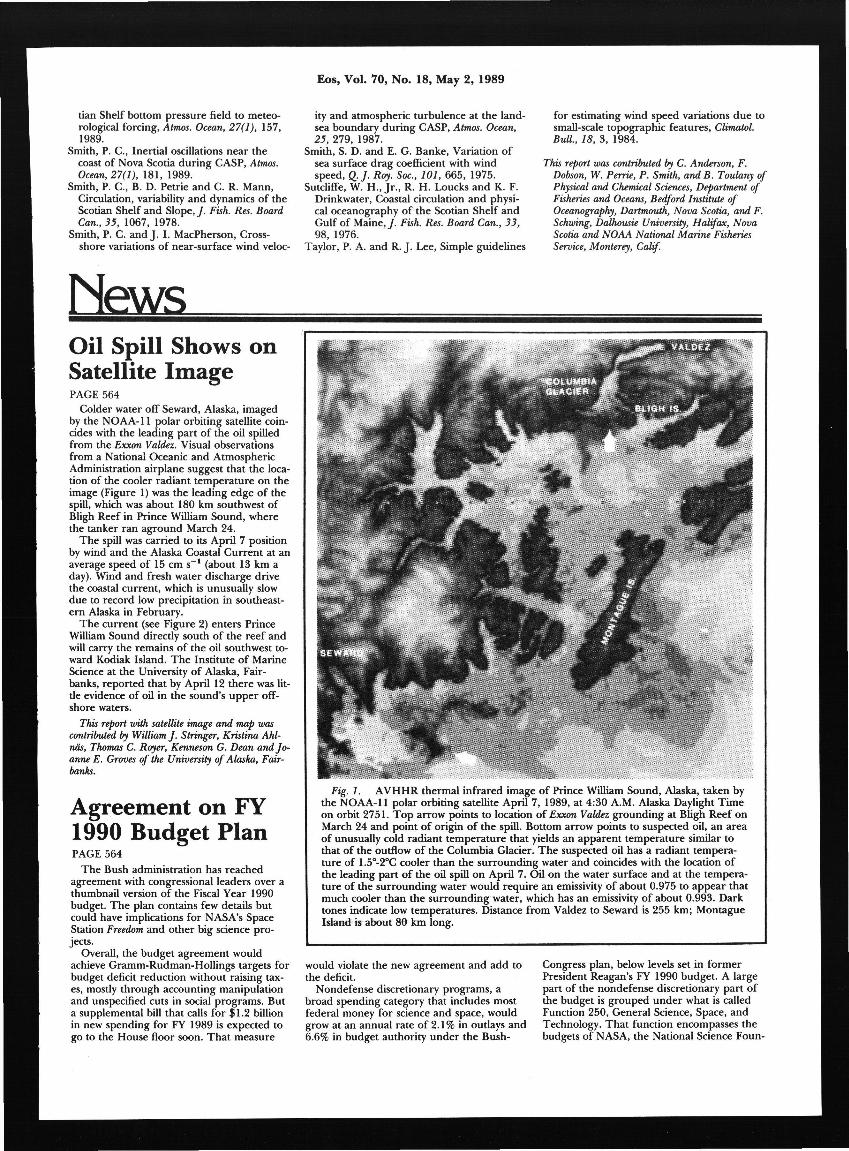
Colder water off Seward, Alaska, imaged by the NOAA-11 polar orbiting satellite coincides with the leading part o f the oil spilled from the Exxon Valdez. Visual observations from a National Oceanic and Atmospheric Administration airplane suggest that the location o f the cooler radiant temperature on the image (Figure 1) was the leading edge o f the spill, which was about 180 km southwest o f Bligh Reef in Prince William Sound, where the tanker ran aground March 24.
The spill was carried to its April 7 position by wind and the Alaska Coastal Current at an average speed o f 15 cm s" 1 (about 13 km a day). Wind and fresh water discharge drive the coastal current, which is unusually slow due to record low precipitation in southeastern Alaska in February.
The current (see Figure 2) enters Prince William Sound directly south o f the reef and will carry the remains o f the oil southwest toward Kodiak Island. The Institute o f Marine Science at the University o f Alaska, Fairbanks, reported that by April 12 there was little evidence o f oil in the sound's upper offshore waters.
This report with satellite image and map was contributed by William J. Stringer, Kristina Ahl-nas, Thomas C. Royer, Kenneson G. Dean and Joanne E. Groves of the University of Alaska, Fairbanks.
Agreement on FY 1990 Budget Plan PAGE 564
The Bush administration has reached agreement with congressional leaders over a thumbnail version o f the Fiscal Year 1990 budget. The plan contains few details but could have implications for NASA's Space Station Freedom and other big science projects.
Overall, the budget agreement would achieve Gramm-Rudman-Hollings targets for budget deficit reduction without raising taxes, mostly through accounting manipulation and unspecified cuts in social programs. But a supplemental bill that calls for $1.2 billion in new spending for FY 1989 is expected to go to the House floor soon. That measure
ity and atmospheric turbulence at the land-sea boundary during CASP, Atmos. Ocean, 25, 279, 1987.
Smith, S. D. and E. G. Banke, Variation o f sea surface drag coefficient with wind speed, Q.J. Roy. Soc, 101, 665, 1975.
Sutcliffe, W. H., Jr., R. H. Loucks and K. F. Drinkwater, Coastal circulation and physical oceanography o f the Scotian Shelf and Gulf o f Maine, / . Fish. Res. Board Can., 33, 98, 1976.
Taylor, P. A. and R. J. Lee, Simple guidelines
would violate the new agreement and add to the deficit.
Nondefense discretionary programs, a broad spending category that includes most federal money for science and space, would grow at an annual rate o f 2.1% in outlays and 6.6% in budget authority under the Bush-
for estimating wind speed variations due to small-scale topographic features, Climatol. Bull, 18, 3, 1984.
This report was contributed by C. Anderson, F. Dobson, W. Perrie, P. Smith, and B. Toulany of Physical and Chemical Sciences, Department of Fisheries and Oceans, Bedford Institute of Oceanography, Dartmouth, Nova Scotia, and F. Schwing, Dalhousie University, Halifax, Nova Scotia and NOAA National Marine Fisheries Service, Monterey, Calif.
Congress plan, below levels set in former President Reagan's FY 1990 budget. A large part o f the nondefense discretionary part o f the budget is grouped under what is called Function 250, General Science, Space, and Technology. That function encompasses the budgets o f NASA, the National Science Foun-
Fig. 1. A V H H R thermal infrared image o f Prince William Sound, Alaska, taken by the NOAA-11 polar orbiting satellite April 7, 1989, at 4:30 A.M. Alaska Daylight Time on orbit 2751. T o p arrow points to location o f Exxon Valdez grounding at Bligh Reef on March 24 and point o f origin o f the spill. Bottom arrow points to suspected oil, an area o f unusually cold radiant temperature that yields an apparent temperature similar to that o f the outflow o f the Columbia Glacier. The suspected oil has a radiant temperature o f 1.5°-2°C cooler than the surrounding water and coincides with the location o f the leading part o f the oil spill on April 7. Oil on the water surface and at the temperature o f the surrounding water would require an emissivity o f about 0.975 to appear that much cooler than the surrounding water, which has an emissivity o f about 0.993. Dark tones indicate low temperatures. Distance from Valdez to Seward is 255 km; Montague Island is about 80 km long.