THE OCEAN ENTERPRISE - National Oceanic and … · The purpose of this report is to provide a...
36
7 THE OCEAN ENTERPRISE A study of US business activity in ocean measurement, observation and forecasting Prepared by ERISS Corporation The Maritime Alliance
Transcript of THE OCEAN ENTERPRISE - National Oceanic and … · The purpose of this report is to provide a...

7
THE OCEAN ENTERPRISE A study of US business activity in ocean measurement, observation and forecasting
Prepared by ERISS Corporation
The Maritime Alliance

The Ocean Enterprise: A study of US business activity in ocean measurement, observation and forecasting
ERISS Corp | OCEAN ENTERPRISE STUDY 2
Foreword: Zdenka Willis, Director, US IOOS Program Office
“Measuring, observing and forecasting our oceans, coastal waters and Great Lakes is a crucial endeavor, supporting a wide range of safety, economic and environmental benefits. The ‘Ocean Enterprise’ – business activity that underpins making ocean measurements, observations and forecasts, and their subsequent use to deliver economic and societal benefits – is an important industry cluster, and one in which the U.S. is an acknowledged global leader. As the ‘Blue Economy’ – the use of the oceans - expands in the coming decades so too will the need for ocean data and information. As a part of the wider ‘Blue Tech’ industry, the Ocean Enterprise is set to be a growing sector, delivering increasing benefits to the U.S. economy and U.S. employment. The purpose of this report is to provide a measure of the scale and scope of the Ocean Enterprise, raising its profile and visibility, and supporting better understanding of future growth opportunities. It also sets out to explore the relationship between Ocean Enterprise businesses and the activities of the National Oceanic and Atmospheric Administration (NOAA) and the US Integrated Ocean Observing System (IOOS®). This will help NOAA and IOOS to better understand how they can facilitate the relationship between public and private sector activities to mutual advantage. This ground breaking study provides a baseline against which to measure the development of the Ocean Enterprise and a stimulus to its future development and direction.”
Foreword: Dr. Richard Spinrad, NOAA Chief Scientist “We are on the cusp of a new Blue Economy – the sustainable growth of existing ocean uses and the emergence of entirely new economic opportunities associated with our oceans, coasts and Great Lakes. Ocean information underpins this rapidly developing Blue Economy and is becoming a big business in its own right. This report is at the forefront of assessing this ocean information enterprise and demonstrating the value that lies in an ocean information-based activity like operational oceanography. NOAA produces 20 terabytes of data every day. We are data providers. At the other end are the information end-users like emergency managers, fisheries, shipping and tourism. There is a growing need for the intermediary enterprise that translates ocean data into tailored products and services supporting present end-user needs and an opportunity to build this emerging economic sector to meet the needs of the future. You don’t need an ocean at your back door to crunch data and create customized, tailored products for the general public, for state and local governments, and for the industries that rely on the oceans. This is vital information, not only for coastal communities but across the country. Creating the necessary tools and working with collected data are geographically untethered. This study identified companies working in Montana, Colorado, Utah and Nebraska with measureable contributions. This report is a first map of a key component of the new dynamic Blue Economy and it points us to the future of environmental intelligence as an exciting growth industry. The forecast is good.”

The Ocean Enterprise: A study of US business activity in ocean measurement, observation and forecasting
ERISS Corp | OCEAN ENTERPRISE STUDY 3
Foreword: Michael B. Jones, The Maritime Alliance
“This report, supported by NOAA and the U.S. IOOS Program office, represents a ground-breaking contribution to our understanding of the importance of the “Blue Economy” - and “BlueTech” - for the United States and, by extension, for countries around the world. At its core, this study is an investigation into the importance of ocean observation, measurement and forecasting business activity for the U.S. economy.
NOAA represents the “tip of the spear” for ocean observation in the U.S. and its efforts support directly and indirectly thousands of companies and millions of jobs with the potential for far more U.S. employment as the Blue Economy and BlueTech continue to expand.
This report provides details of the scale and scope of the businesses that work in ocean observation, measurement and forecasting and, in turn help facilitate Blue Economy sectors such as offshore oil and gas, aquaculture, biomedicines from the sea, desalination, fishing, ocean renewable energy, shipping, and many others. As we extrapolate from this “ocean observation” focused study we can begin to understand the current and future importance of the oceans for the U.S. and the need – and the opportunity – for the U.S. to be a leader in developing sustainable, science-based ocean industries globally.”
Acknowledgements: We would like to thank the following individuals for their contributions to this study and report.
Project Leads: • ERISS Corporation, Steven Tally. www.eriss.com • The Maritime Alliance, Michael B. Jones
Contributors from the U.S. IOOS Office: • Carl Gouldman • Ralph Rayner • Kate Bosley
Cover photo credit: Intergovernmental Oceanographic Commission - Global Ocean Observing System (IOC-GOOS) Artwork by Glynn Gorick depicting the Ocean Observing System
Cover art revised 2/25/2016 to reflect final version of artwork. Credit revised 12/12/2016 to show correct expanded name for IOC.

The Ocean Enterprise: A study of US business activity in ocean measurement, observation and forecasting
ERISS Corp | OCEAN ENTERPRISE STUDY 4
Table of Contents
SECTION I: EXECUTIVE SUMMARY ................................................................................................................ 5
Background ............................................................................................................................................... 5
Key Findings .............................................................................................................................................. 6
SECTION II: DETAILED STUDY FINDINGS ..................................................................................................... 10
Introduction ................................................................................................................................................ 10
Methodology ............................................................................................................................................... 11
Defining the Scope of the Ocean Enterprise ........................................................................................... 11
Initial Processes ....................................................................................................................................... 12
Data Collection Design ............................................................................................................................ 12
Outreach and Survey Administration ..................................................................................................... 12
Analysis of Survey Data ............................................................................................................................... 13
Background characteristics of respondents ............................................................................................ 13
Location Dynamics .................................................................................................................................. 15
Revenue and Employment Estimates ..................................................................................................... 19
Foreign Markets ...................................................................................................................................... 22
Business dynamics .................................................................................................................................. 22
IOOS Business Dynamics ......................................................................................................................... 26
Barriers and suggested improvements for working with IOOS .............................................................. 26
References .................................................................................................................................................. 29
Appendix 1: Survey Questions .................................................................................................................... 30
Appendix 2: Location of Targeted Businesses by State .............................................................................. 36

The Ocean Enterprise: A study of US business activity in ocean measurement, observation and forecasting
ERISS Corp | OCEAN ENTERPRISE STUDY 5
SECTION I: EXECUTIVE SUMMARY
Background This report describes the scale and scope of commercial activity in the “Ocean Enterprise”; defined as encompassing the for profit and not for profit businesses which support ocean measurement, observation and forecasting. The objective of its publication is to raise visibility and awareness of this important industry cluster, and understanding of its linkages with the National Oceanic and Atmospheric Administration (NOAA) and the U.S. Integrated Ocean Observing System (IOOS®) program.
The means to collect and use ocean data constitutes a significant business undertaking and one in which the United States is an acknowledged world leader. Ocean information is critical for delivering a range of safety, economic and environmental benefits underpinning the wider ocean economy. Beneficiaries who depend upon the Ocean Enterprise include the scientific research community and entire marine industry sectors, such as offshore oil and gas, ports, shipping, fisheries and aquaculture. They include coastal communities who depend on ocean information for their protection from natural hazards such as storms and coastal flooding. Even far inland ocean information delivers benefits to sectors such as agriculture, transportation and retailing through contribution to improved weather forecasting and climate prediction.
The businesses that enable ocean observation, measurement, and forecasting and deliver benefits through related products and services combine to create a unique industry cluster.
Two main categories of Ocean Enterprise firms1 were identified as the primary focus of study:
1) Providers of infrastructure for ocean observation, measurement, or forecasting.2 2) Intermediaries that make use of ocean, coastal, and Great Lakes measurements, observations,
and models as an input to the creation or enhancement of value-added information products in support of particular end-uses.
The study identified 410 firms that met the criteria of being part of the Ocean Enterprise. These 410 Ocean Enterprise organizations were invited to participate in the study by means of a web survey. Detailed responses were received from 159 firms.
1 Throughout this report, the term “business” or “firm” encompasses both commercial businesses and nonprofit private organizations working in this cluster. The study included nonprofit organizations which sell products and services for commercial or government use. Those organizations may not normally use the terms ‘business’ or ‘firm’ however, in this report, those terms are inclusive of all organizations surveyed. 2 Includes manufacture of sensors, instruments, platforms; those building, deploying and operating observing systems; providers of the data infrastructure that manages and communicates ocean data, and organizations that develop and maintain the technologies, data management systems, software tools and models that are used to turn these data into useful information.

The Ocean Enterprise: A study of US business activity in ocean measurement, observation and forecasting
ERISS Corp | OCEAN ENTERPRISE STUDY 6
Figure ES- 2. Location of targeted organizations
Key Findings
Scope of Ocean Enterprise The majority of respondent firms (65%) identified themselves solely as Providers, involved in developing infrastructure and equipment used in the Ocean Enterprise space. 20% of respondents identified themselves as solely performing activities as an Intermediary—using data and information within the Ocean Enterprise space to create or enhance value-added data product in support of specific end-uses. 16% indicated they performed both functions, yielding a combined 81% of respondents performing activities as a Provider and a combined 36% providing services as an Intermediary.
Organizations that provided any Ocean Enterprise-related function were eligible for the survey, regardless of the proportion of their total business that the Ocean Enterprise activities represented. Respondents tended to be maritime-focused rather than having only a small proportion of their business in maritime related products and services. Over two thirds (68%) of respondents indicated that maritime business represented over 50% of their activities. Some 53% of respondents reported that at least 50% of their maritime business is Ocean Enterprise related.
The overall pool of businesses identified as within scope and eligible for the survey were concentrated in metro areas in states with ocean access, dominated by the Boston Region, the California coast from San Francisco to San Diego, Florida (East and West coasts), Houston, and Seattle-Tacoma. Firms from 36 states were represented.
Boston
Houston
Portland
HartfordNewYork
Albany
Burlington
Washington
Virginia BeachRaleigh
New Bern
Wilmington
Palm Bay
Orlando
MiamiNorth Port
Tampa
Crestview
Pensacola
Gulfport
New OrleansLafayette
Austin
DallasTucsonSanDiego
LosAngeles
SanJose
Sacramento
Portland
SeattleMissoula
Salt Lake CityDenver
Lincoln
TraverseCity
Detroit
Anchorage
<1% 14%
key:
Santa Maria
Jacksonville
Chicago
Huntsville
Salinas
Cape Coral
Honolulu
Spokane
Baton Rouge
Columbus
Columbia
CollegeStation
Milwaukee
Gainesville
PanamaCityTallahasee
Atlanta
Hilo
KansasCity
Martin
Augusta
Jackson
Rochester
Dayton
Brookings
Roseburg
Charleston
SanAntonio
Logan
Richmond
Appleton
CordovaSeldovia
Mariposa King George
65%
20%
16%
16%
81%
36%
0% 20% 40% 60% 80% 100%
Provider
IntermediaryOnly provide this function
Provide both Provider andIntermediary functions
Figure ES- 1. Business function of respondent organization

The Ocean Enterprise: A study of US business activity in ocean measurement, observation and forecasting
ERISS Corp | OCEAN ENTERPRISE STUDY 7
Most Ocean Enterprise businesses are relatively mature, with 86% reporting they had been in businesses for more than 5 years.
Revenue and Employment Respondents were asked to report the total revenue of their business, what proportion of that total revenue was due to maritime activities and what subset of maritime revenue was due to Ocean Enterprise-related activities. Finally, they were asked to report what proportion of their Ocean enterprise-related sales was the result of foreign exports.
Over half of respondents (58%) reported that between 75% and 100% of their revenues were from maritime business. When asked to further report what proportion of their maritime revenue was due to activities specific to the Ocean Enterprise, 46% of businesses reported that Ocean Enterprise-related revenues accounted for 75% to 100% of their overall maritime activity.
The information described above was used to estimate revenue for each of these components of firms overall business. As shown in figure ES-3, Ocean Enterprise business lines are a subset of “Maritime” related business lines, and maritime business lines may only be a portion of a company’s overall business activity. Thus this report makes references to “Overall” activities of companies, “Maritime” activities, and “Ocean Enterprise” activities.
Using data from the survey sample and other public data sources, an estimate of total Ocean Enterprise revenue, exports and employment was calculated. This estimate represents a projection from the 159 survey respondents to all businesses that were estimated to represent the Ocean Enterprise.3
Figure ES – 3 displays the estimated revenues for all Ocean Enterprise related activities. The Overall revenue for businesses that provide Ocean Enterprise related products and services as part of their activity is estimated at $58 billion (gray portion). $14 billion of this Overall revenue is estimated to be due to Maritime related activities and half of this (~$7 billion) is from Ocean Enterprise business (as a subset of Overall and Maritime revenue). Finally, Ocean Enterprise exports are estimated to account for $1.4 billion, or 20% of overall Ocean Enterprise revenue.
3 For detailed methods regarding revenue and employment projections please see Detailed Findings (Section II), page 19.
Figure ES- 3. Revenue projections
Overall
Revenue $58b
Maritime Revenue
$14b
Ocean Enterprise Revenue
$7b
Ocean Enterprise
Exports $1.4b

The Ocean Enterprise: A study of US business activity in ocean measurement, observation and forecasting
ERISS Corp | OCEAN ENTERPRISE STUDY 8
Respondents were asked to report employment numbers for their organization. Total employment is estimated to be between 223,000 and 268,000 employees in the U.S. This employment estimate is for overall business of companies who have some Ocean Enterprise-related business activities.4
Business Perceptions While a majority (54%) of interviewed companies reported they expected their Ocean Enterprise business to grow in the next 12 months, the outlook differed slightly when examined by company function. Providers were more likely to report they anticipated growth, while Intermediaries were more likely to report staying the same or uncertainty regarding future business expectations.
Respondents reported supporting diverse market sectors related to the Ocean Enterprise. Three end-use sectors are a target for at least half of the respondents (environmental monitoring, academic research, and offshore oil/gas), and a further seven are foci for at least one-third of respondents. A full 25% of respondents were associated with twelve different end-use market sectors.
Respondents’ chief target market sectors were Environmental Monitoring, Academic Research, Offshore Oil/Gas, Ports/Harbors, and Hydrographic Surveying. It should be noted that these are percentages of respondents, not weighted by employment numbers or revenue.
Use of different data types Intermediaries generally used “in situ” (sources from within or upon the ocean) data (68%) versus “remotely sensed” data sources such as satellites, airplanes, or radar (41%).5 The most common in situ
4 Respondents were asked to report only total employment, and not employment related to specific maritime or ocean observation activities. 5 Respondents were permitted to choose as many categories as applied; therefore percentages can sum to more than 100%.
Growing
Staying the same
Decreasing
Unsureintermediaries
providersALL
key:
Figure ES- 4. Business expectations for the next 12 months for Ocean Enterprise-related business
Figure ES- 5. Top market sectors

The Ocean Enterprise: A study of US business activity in ocean measurement, observation and forecasting
ERISS Corp | OCEAN ENTERPRISE STUDY 9
data types cited as being used by Intermediaries were physical oceanographic, bathymetric, and geophysical data and the most commonly used remotely sensed data sources were shore and satellite observations.
Involvement with IOOS Involvement in the Ocean Enterprise does not necessarily mean that organizations are familiar with IOOS or interact with the associated system. However, 70% of respondents reported they recognized IOOS, 26% reported contributing to IOOS infrastructure, and 18% make use of IOOS coordinated data.
Working with IOOS Ocean Enterprise businesses report a growing level of interaction with IOOS. 40% plan on supporting the addition of new IOOS infrastructure, and 29% intend delivering additional services to the system. For use of IOOS data to support and develop products, 24% plan for new products that utilize IOOS data and 22% plan an expansion of existing products that utilize IOOS data.
Barriers to working with the IOOS were split by company function. Intermediaries were mostly concerned with data-related issues, such as geographical coverage of data, or structure/documentation of data sets. Providers were more concerned with developmental and systemic issues such as knowledge of future investment and development plans for the IOOS system, or acceptance of new technology.
Suggested areas for improvement included more opportunities for new innovation, and greater focus on the interests of small or new enterprises.
Next Steps This study represents a first attempt to assess the scale and scope of this important sector. As with all such early endeavors, the results create a new question for every one answered.
The limitations of the study must be recognized. The execution of the study revealed the inherent difficulties with even identifying all businesses involved in the Ocean Enterprise. Although there was considerable success identifying organizations through a concerted effort to compile lists from industry organizations, government sources, and though word of mouth from known businesses, there is little doubt that a meaningful proportion of primarily small to medium size companies will have been left unidentified. It is unknown if the identified businesses are a representative sample and projections of total Ocean Enterprise business activity should therefore be treated with caution. Other limitations of the study include possibly unreliable revenue reporting, lack of precision between reporting for entire organizations and subsidiaries, and the tendency of some respondents to omit critical information.
Next steps might include periodic resurvey to determine trends, a more in-depth economic impact study, as well as further study of the end-uses of ocean observation data streams leading to a better understanding of the potential for new products and services.
This report provides a baseline against which to measure the future development of the Ocean Enterprise endeavor and a catalyst for additional studies of the wider Blue Economy.
The Ocean Enterprise: A study of US business activity in ocean measurement, observation and forecasting
ERISS Corp | OCEAN ENTERPRISE STUDY 10
SECTION II: DETAILED STUDY FINDINGS
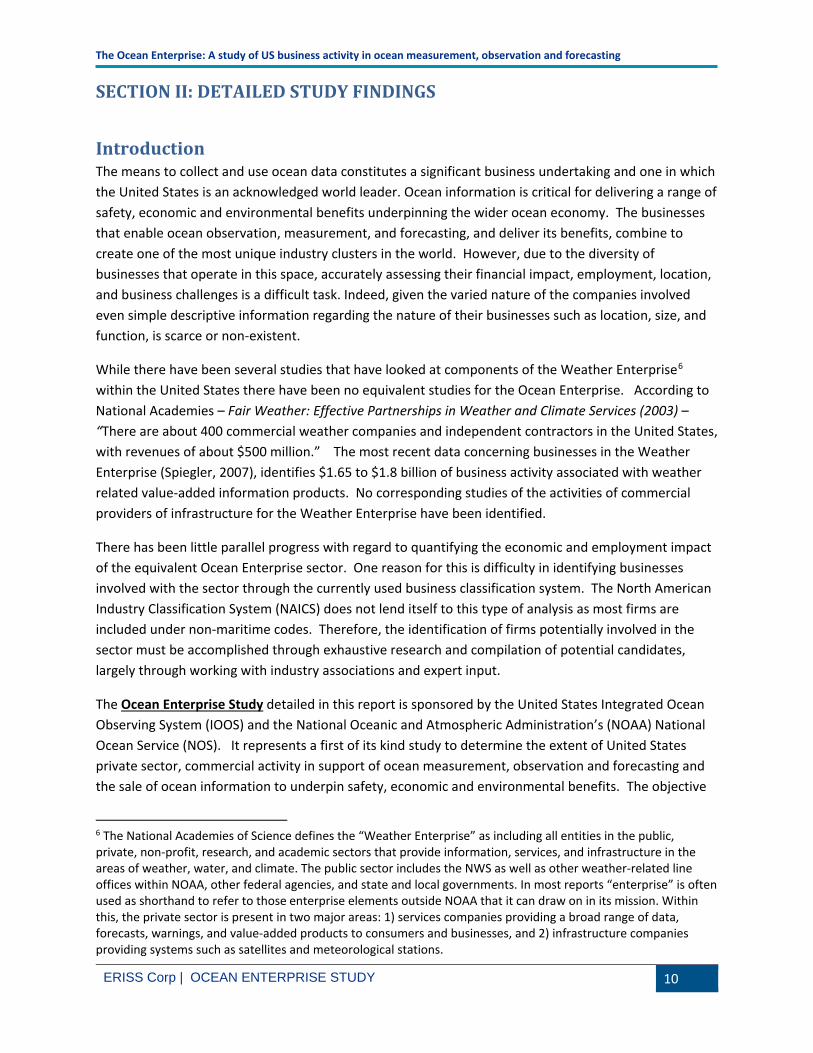
Introduction The means to collect and use ocean data constitutes a significant business undertaking and one in which the United States is an acknowledged world leader. Ocean information is critical for delivering a range of safety, economic and environmental benefits underpinning the wider ocean economy. The businesses that enable ocean observation, measurement, and forecasting, and deliver its benefits, combine to create one of the most unique industry clusters in the world. However, due to the diversity of businesses that operate in this space, accurately assessing their financial impact, employment, location, and business challenges is a difficult task. Indeed, given the varied nature of the companies involved even simple descriptive information regarding the nature of their businesses such as location, size, and function, is scarce or non-existent.
While there have been several studies that have looked at components of the Weather Enterprise6 within the United States there have been no equivalent studies for the Ocean Enterprise. According to National Academies – Fair Weather: Effective Partnerships in Weather and Climate Services (2003) – “There are about 400 commercial weather companies and independent contractors in the United States, with revenues of about $500 million.” The most recent data concerning businesses in the Weather Enterprise (Spiegler, 2007), identifies $1.65 to $1.8 billion of business activity associated with weather related value-added information products. No corresponding studies of the activities of commercial providers of infrastructure for the Weather Enterprise have been identified.
There has been little parallel progress with regard to quantifying the economic and employment impact of the equivalent Ocean Enterprise sector. One reason for this is difficulty in identifying businesses involved with the sector through the currently used business classification system. The North American Industry Classification System (NAICS) does not lend itself to this type of analysis as most firms are included under non-maritime codes. Therefore, the identification of firms potentially involved in the sector must be accomplished through exhaustive research and compilation of potential candidates, largely through working with industry associations and expert input.
The Ocean Enterprise Study detailed in this report is sponsored by the United States Integrated Ocean Observing System (IOOS) and the National Oceanic and Atmospheric Administration’s (NOAA) National Ocean Service (NOS). It represents a first of its kind study to determine the extent of United States private sector, commercial activity in support of ocean measurement, observation and forecasting and the sale of ocean information to underpin safety, economic and environmental benefits. The objective
6 The National Academies of Science defines the “Weather Enterprise” as including all entities in the public, private, non-profit, research, and academic sectors that provide information, services, and infrastructure in the areas of weather, water, and climate. The public sector includes the NWS as well as other weather-related line offices within NOAA, other federal agencies, and state and local governments. In most reports “enterprise” is often used as shorthand to refer to those enterprise elements outside NOAA that it can draw on in its mission. Within this, the private sector is present in two major areas: 1) services companies providing a broad range of data, forecasts, warnings, and value-added products to consumers and businesses, and 2) infrastructure companies providing systems such as satellites and meteorological stations.

The Ocean Enterprise: A study of US business activity in ocean measurement, observation and forecasting
ERISS Corp | OCEAN ENTERPRISE STUDY 11
of this study is to raise visibility and awareness of the sector’s importance and to determine the degree of engagement with NOAA and the U.S. IOOS program.
Methodology
Defining the Scope of the Ocean Enterprise The sector that is the focus of this report ultimately provides information and services that support the scientific study and use of the oceans – the Blue Economy. To further define the scope of the Ocean Enterprise we adapted a framework of IOOS stakeholders identified during the IOOS Summit in 2012 (Rayner, 2012) and the Society of Maritime Industries - Annual Review of UK Marine Scientific Industries (SMI, 2015) that reviews businesses operating in the Ocean Enterprise space in the United Kingdom in terms of market sector, market size, and business confidence, both current and forecast.
Two main categories of Ocean Enterprise firms were identified as the primary focus of study:
1. Providers of infrastructure for ocean observation, measurement, or forecasting.7
2. Intermediaries that make use of ocean, coastal, and Great Lakes measurements, observations, and models as an input to the creation or enhancement of value-added information products in support of a wide variety of end-uses.
Although they represent the driver for the Ocean Enterprise, the end-users of ocean information are not included in the scope of this study. End-users are the ultimate beneficiaries of ocean, coastal and Great Lakes information. They use value added products generated in whole or in part from this information as an input to their activities or businesses to derive specific scientific, societal or business benefits. End-users include the science community and entire marine industry sectors, such as offshore oil and gas, ports, shipping, fishing and aquaculture. They also include Federal, State and local government bodies and agencies who utilize ocean information for regulatory purposes, for ensuring the safety of life or property or for protection of the environment. By virtue of the contribution of the Ocean Enterprise to improved weather forecasting and climate prediction, end-user benefits extend far inland to include weather dependent activities such as agriculture, transportation and retailing. It is important to recognize that an organization can occupy multiple roles in this complex landscape. The delivery of end-user benefit is rarely a simple linear end-to-end service chain. More often, benefits are delivered by multiple organizations merging different sources of data to derive an information product useful for a particular purpose. It is more like a jigsaw puzzle with multiple intermediaries adding value in complex and ever changing ways as they compete to provide more beneficial or more cost effective products and services. Intermediary companies integrate many different “islands of
7 Includes manufacture of sensors, instruments, platforms; those building, deploying and operating observing systems; providers of the data infrastructure that manages and communicates ocean data, and organizations that develop and maintain the technologies, data management systems, software tools and models that are used to turn these data into useful information.

The Ocean Enterprise: A study of US business activity in ocean measurement, observation and forecasting
ERISS Corp | OCEAN ENTERPRISE STUDY 12
information” from different sources with data only being used if they know where to find it, are allowed to access it and can determine its fitness for purpose.
Initial Processes The first year of the study was devoted to obtaining and compiling lists of organizations who were potentially engaged in the Ocean Enterprise. This process spanned from October, 2013 to the start of the data collection period in April, 2015. The lists of companies were obtained from a variety of sources. These included lists from professional organizations, industry specific email and contact lists, and lists gathered at professional and industry conferences and meetings as well as lists provided by Federal agencies and IOOS stakeholders. Each list provided a variable amount of information ranging from only company name up to full contact information including a contact person, website URL, email, phone, and address. These lists also included companies identified by representatives from Federal agencies engaged with IOOS via the Interagency Ocean Observation Committee as well as from NOAA programs contributing to IOOS and the IOOS program office. It was recognized that these lists represented a “wide-net” approach and thus contained some organizations not involved in the Ocean Enterprise sector. The resulting master list was refined by reference to the content of the websites of each organization and through review by experts closely involved with the Ocean Enterprise industry space. The final, reviewed and compiled pool of target organizations comprised 410 businesses.
Data Collection Design In order to accomplish the goals of the study, a multi-method approach was employed using both quantitative and qualitative methodologies. Initial qualitative interviews were conducted with nine businesses representing both Provider and Intermediary companies, as well as varied company sizes and geographical locations. The results of these interviews were used to inform the content of the quantitative survey instrument, and additionally to provide context for the ultimate quantitative survey results. Interviews took place during the fall of 2014. For both interview and web-survey methodologies, respondents were assured that their company name or any other specific information collected would not be publically shared, and all survey results would only be reported at the aggregate level. The survey was certified was certified as compliant with the Paperwork Reduction Act through the Office of Management and Budget.8
Outreach and Survey Administration The questionnaire was executed by means of a web-survey. Initial outreach efforts designed to inform businesses of the upcoming survey were conducted through announcements in industry publications, information posted on the NOAA website, and attendance at industry association meetings. On April 1st, 2015, the web-survey announcement and link was sent to the first wave of targeted organizations. Reminder emails were sent out to non-responders two weeks after the initial survey mailing, and weekly after that point. The survey data collection period was concluded June 30th, 2015. The final survey database comprised 159 respondents which represented a response rate of 39% based on the master list of organizations.
8 OMB Control Number 0648-0712
The Ocean Enterprise: A study of US business activity in ocean measurement, observation and forecasting
ERISS Corp | OCEAN ENTERPRISE STUDY 13
Analysis of Survey Data
Background characteristics of respondents
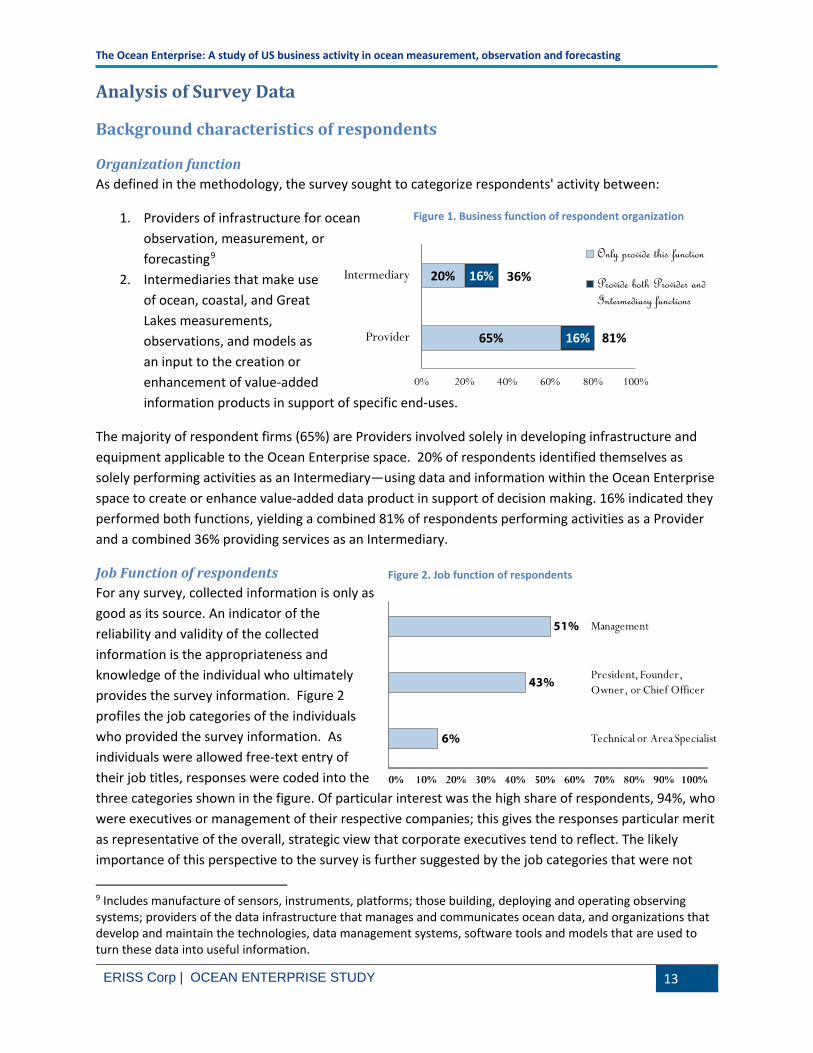
Organization function As defined in the methodology, the survey sought to categorize respondents' activity between:
1. Providers of infrastructure for ocean observation, measurement, or forecasting9
2. Intermediaries that make use of ocean, coastal, and Great Lakes measurements, observations, and models as an input to the creation or enhancement of value-added information products in support of specific end-uses.
The majority of respondent firms (65%) are Providers involved solely in developing infrastructure and equipment applicable to the Ocean Enterprise space. 20% of respondents identified themselves as solely performing activities as an Intermediary—using data and information within the Ocean Enterprise space to create or enhance value-added data product in support of decision making. 16% indicated they performed both functions, yielding a combined 81% of respondents performing activities as a Provider and a combined 36% providing services as an Intermediary.
Job Function of respondents For any survey, collected information is only as good as its source. An indicator of the reliability and validity of the collected information is the appropriateness and knowledge of the individual who ultimately provides the survey information. Figure 2 profiles the job categories of the individuals who provided the survey information. As individuals were allowed free-text entry of their job titles, responses were coded into the three categories shown in the figure. Of particular interest was the high share of respondents, 94%, who were executives or management of their respective companies; this gives the responses particular merit as representative of the overall, strategic view that corporate executives tend to reflect. The likely importance of this perspective to the survey is further suggested by the job categories that were not
9 Includes manufacture of sensors, instruments, platforms; those building, deploying and operating observing systems; providers of the data infrastructure that manages and communicates ocean data, and organizations that develop and maintain the technologies, data management systems, software tools and models that are used to turn these data into useful information.
Figure 1. Business function of respondent organization
Figure 2. Job function of respondents
65%
20%
16%
16%
81%
36%
0% 20% 40% 60% 80% 100%
Provider
Intermediary
Only provide this function
Provide both Provider andIntermediary functions

The Ocean Enterprise: A study of US business activity in ocean measurement, observation and forecasting
ERISS Corp | OCEAN ENTERPRISE STUDY 14
well represented among survey respondents: technical or area specialists. This is not to say that technical specialists' views would not have been of interest, only that the survey should be understood as reflecting an executive/managerial perspective rather than a technical one.
Company Size for Respondent Firms Figure 3 shows the distributions of firm count-by-employment size for both the survey respondents and the U.S. economy, as a whole.10 As shown, when compared with the U.S. distribution, mid-sized firms are more proportionally represented in the respondent distribution. From a practical standpoint, this does not mean that small firms are unimportant to the Ocean Enterprise universe.11 On the contrary, smaller firms still represent the largest proportion of the Ocean Enterprise economy, just as they do the overall national economy. However, the Ocean Enterprise constituency appears to be relatively more evenly distributed in its employment size composition. It is possible that one reason for the tendency for firms to be larger in the Ocean Enterprise sample is because smaller firms are inherently harder to find and contact, and have not been in business as long as larger firms, and therefore would often not be in the contact databases used as the source of the survey sample or did not respond.
10 National data for Graphic 2 come from the U.S. Bureau of the Census, Business Longitudinal Dynamics Statistics; national data is from the Year 2012 sample universe. 11 In many ways, the heart of the survey addresses two related but distinct concepts: the Ocean Observation, Forecasting, and Infrastructure (here…Ocean Enterprise) pool; and the segment of it that contributes to the Integrated Ocean Observation System (IOOS) pool. The latter can be viewed as a specific subset of the former.
Figure 3. Total employment of respondent firms compared to U.S. average
25%
19%
32%
4% 11%
4%
1% 3%
56%
20%
19%
2% 1% <1%
<1%
<1%
respondent firmsall U.S. firms
22%
18%
24%
14%
4%
12%
4%
1% 1%
29%
17%
13%
13%
8%
13%
2% 2% 4%
providersintermediaries
Figure 4. Employment of respondent firms by function

The Ocean Enterprise: A study of US business activity in ocean measurement, observation and forecasting
ERISS Corp | OCEAN ENTERPRISE STUDY 15
Examination of employment by company function (Figure 4) reveals that Intermediaries were more likely to be in both the very smallest and also largest employment categories as compared to Providers. For example, 29% of Intermediaries reportedly had between one and four employees, compared to 22% for Providers and, 4% of Intermediaries reportedly had greater than one thousand employees, compared to 1% for Providers.12
Location Dynamics
Number of locations Number of respondent locations is displayed in Figure 5. Similarly to the pattern previously seen in the discussion of the “firm/establishment” survey data, slightly less than half of all firms operate from a single establishment (45%). Not surprisingly two- and three-establishment firms are the next-most-common arrangements, with the exception of highly complex firms with ten or more locations. In the context of highly complex firms, the very small percentage of firms with 6-9 establishments merits attention. Had the survey response set been disaggregated such that the range 6-9 asked for the exact number of establishments, as was true for the 1-5 establishment range, the data would clearly exhibit a significant "U" shape—they do already, even when aggregated into the 6-9 range.
Respondents were also asked about employment in the particular establishment in which they worked. The distinction between an establishment and a firm is a critical one in economic analysis. As a hypothetical example, consider a manufacturer with two operational locations, one in New York and one in Los Angeles, and a headquarters in Chicago. This one firm would be considered to have three establishments.13
12 The information displayed in both Figures 3 and 4 has not been weighted by revenue.
13 In technical practice, the federal government can determine that a single location has more than one establishment, usually when distinct types of operations are collocated. However, for the survey, respondents were asked to treat all single locations as a single establishment.
Figure 6. Share of firms with only one establishment: survey respondents versus 2005 U.S. average
Figure 5. Number of locations operated by respondent firms

The Ocean Enterprise: A study of US business activity in ocean measurement, observation and forecasting
ERISS Corp | OCEAN ENTERPRISE STUDY 16
Although the vast majority of firms in the overall U.S. economy are small businesses, and are composed of a single establishment, this is not true to the same extent for Ocean Enterprise businesses. As shown in Figure 6,14 while 95% of U.S. firms had only one establishment in the latest available data, only 45% the Ocean Enterprise survey respondents indicated that their firm had only one establishment. It is worth noting that the latest available U.S. data is from a decade ago—firm-to-establishment connections are highly protected in federal surveys for reasons of confidentiality, and data about them are rarely made publicly available—however, the share of single-establishment firms has certainly not dropped 50 percentage points in the last ten years, if it has dropped at all. Similarly, the survey's request that respondents treat all single locations as one establishment may account for some of the differential, but certainly not 50 percentage points' worth. One possible implication of this pattern is that Ocean Enterprise firms are far more likely to be specialized subsidiaries of larger establishments that may have little to do with maritime or ocean observation activities. Another possibility is that businesses involved in Ocean Enterprise activities may have locations in specific coastal regions in order to be represented where their customer base is located.
Number of foreign locations Figure 7 shows the number of non-U.S. locations operated by respondents' firms. With 45% of respondents indicating they are one-establishment firms, it is not surprising that over half (58%) of respondents report their company operates solely within the U.S. However, among those firms that do have foreign operations, a marked "U" shape again reflects a characteristic distribution. A combined 16% of respondents report one or two foreign location within their firm. This drops to 2% with three foreign locations. Then, the percentage begins to rise—with the caveat that choices above six locations were associated with ranges—until 15% of respondents reported ten or more foreign locations. The results emphasize just how different the Ocean Enterprise community is from the general national economy. For all U.S. firms in the Business Dynamics Survey data cited above, six-tenths of one percent of firms had ten or more locations anywhere; in the Ocean Enterprise community, 15% had ten or more locations outside the United States.
14 U.S. data are from the Bureau of Labor Statistics, Business Dynamics Survey.
Figure 7. Number of foreign locations operated by respondent firms

The Ocean Enterprise: A study of US business activity in ocean measurement, observation and forecasting
ERISS Corp | OCEAN ENTERPRISE STUDY 17
Location of firm headquarters With this level of firm complexity, it is not surprising that a healthy share of respondents reported that their operations were a subsidiary of a larger corporate family. Nearly one-in-four (23%) indicated that they were such a subsidiary. Figure 8 depicts the national locations of these respondents' corporate headquarters. The most common response for these more complex firms, as would be expected, was the U.S., which hosts the headquarters of 45% of multi-country respondents' firms. The United Kingdom was the second most common host, with seven headquarters, while France, The Netherlands, and Sweden hosted three headquarters each. Finally, Denmark was the location of one of the respondents' headquarters. It is important to note that there were instances of multiple respondents belonging to the same, ultimate corporate parent. In those cases, the parent location for each subsidiary was counted in the analysis.
Location by region Figure 9 shows the metropolitan location of the businesses identified as the target population (identified as within scope and eligible to take part in the survey).15 The businesses spread over 36 States. The location distribution is markedly different from that for the U.S. Economy as a whole. Part of that explanation is an obvious one: proximity to the ocean—or other firms that require ocean access—is a distinct (but not necessarily required) advantage in the markets encompassed by the Ocean Enterprise. However, even aside from this general principle, there are interesting patterns within the location data. Major Ocean Enterprise hubs can be seen in the Boston and Houston regions, the Bay Area-to-San Diego corridor, Florida, and the Pacific Northwest (see Appendix 2 for number of businesses by State).
15 The metropolitan groupings combine both official Metropolitan Statistical Areas (MSA's) of the United States with a less common configuration, "Combined Statistical Areas," which can combine one or more MSA's. In other words, the most aggregated officially designated metropolitan region was used.
yes= 24% no = 76%
Figure 8. Subsidiary status and location of ultimate headquarters

The Ocean Enterprise: A study of US business activity in ocean measurement, observation and forecasting
ERISS Corp | OCEAN ENTERPRISE STUDY 18
Figure 9. Location of targeted organizations
Ocean of Access Figure 10 examines the location of respondents slightly differently, by ocean-of-access (or the lack thereof for 8% of the sample universe). This was determined by the respondent's state (or national) location as opposed to their metropolitan area. It should be noted that some respondents' oceans-of-access were the Mediterranean Sea and the Gulf of Mexico; this was treated as access to the Atlantic Ocean for the purposes of this analysis. The Ocean Enterprise community is heavily concentrated in states that border the Atlantic Ocean, with nearly two-of-three respondents in such states. Slightly more than one-fourth were in states bordering the Pacific Ocean. As above, 8% of respondents were from the interior of the nation in states that did not border an ocean.16
16 The "interior" category of Figure 10 does not necessarily mean that a respondent's state had no waterborne access to the ocean, at all, due to appropriate river systems or the Great Lakes-to-Saint Lawrence Seaway system. However, for the purposes of Figure 10, these states were considered interior.
Boston
Houston
Portland
HartfordNewYork
Albany
Burlington
Washington
Virginia BeachRaleigh
New Bern
Wilmington
Palm Bay
Orlando
MiamiNorth Port
Tampa
Crestview
Pensacola
Gulfport
New OrleansLafayette
Austin
DallasTucsonSanDiego
LosAngeles
SanJose
Sacramento
Portland
SeattleMissoula
Salt Lake CityDenver
Lincoln
TraverseCity
Detroit
Anchorage
<1% 14%
key:
Santa Maria
Jacksonville
Chicago
Huntsville
Salinas
Cape Coral
Honolulu
Spokane
Baton Rouge
Columbus
Columbia
CollegeStation
Milwaukee
Gainesville
PanamaCityTallahasee
Atlanta
Hilo
KansasCity
Martin
Augusta
Jackson
Rochester
Dayton
Brookings
Roseburg
Charleston
SanAntonio
Logan
Richmond
Appleton
CordovaSeldovia
Mariposa King George
63%
29%
7%
1%
0% 50% 100%
Atlantic
Pacific
Interior
Great Lakes
Figure 10. Ocean of access for survey respondents

The Ocean Enterprise: A study of US business activity in ocean measurement, observation and forecasting
ERISS Corp | OCEAN ENTERPRISE STUDY 19
Organizational Experience in Ocean Observation, Measurement, and Forecasting Firms largely reported relatively extensive experience in the ocean measurement, observation, and forecasting sector. Almost nine-in-ten respondents reported at least 5 years' experience in the market (Figure 11). A mere 2% were new to the market (1 year or less of experience). Providers tended to have been in Ocean Enterprise -related business longer than Intermediaries. Organizations that had been in business only a very short time would be less likely to be in the final contact lists and therefore would not know about the survey.
Revenue and Employment Estimates
Collection and Research of Revenue Information Respondents were asked to report the revenue of their organization. Respondents were permitted to omit any questions they did not feel comfortable answering and a proportion of respondents did not provide revenue information, nor provide the accompanying requested information regarding share of revenue attributable to maritime business, share of maritime revenue attributable to the Ocean Enterprise, and what proportion of Ocean Enterprise revenues was from sales outside the U.S. In these cases, every effort was made to obtain this information through secondary sources. These sources include web-searches for publically available information, or purchasing organizational information from data brokers. Estimates of the proportion of revenue attributable to the Ocean Enterprise were more difficult to obtain through secondary sources although attempts were made to estimate this proportion where information was available.
Process for Obtaining Estimates for the Overall Ocean Enterprise Using the Respondent Sample Although obtaining a true economic impact measure for the Ocean Enterprise is outside the scope of this initial study, one of the goals of the study was to provide estimates of revenues based on the self-reported data from our sample of survey respondents and other public sources of information. In order to accomplish this estimate, the process detailed below was followed.
4 to 5 years
1 to 3 years
1 year or less
unknown
5 or more years
Figure 11. Organizational experience in the Ocean Enterprise
The Ocean Enterprise: A study of US business activity in ocean measurement, observation and forecasting
ERISS Corp | OCEAN ENTERPRISE STUDY 20
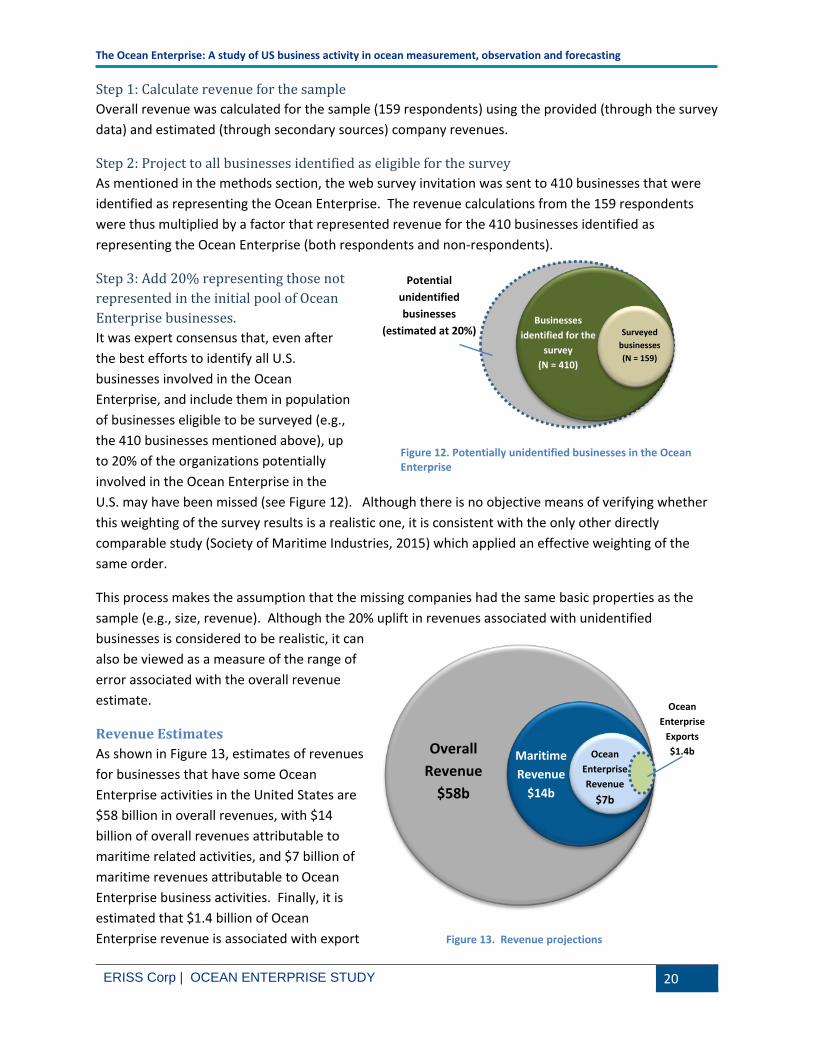
Step 1: Calculate revenue for the sample Overall revenue was calculated for the sample (159 respondents) using the provided (through the survey data) and estimated (through secondary sources) company revenues.
Step 2: Project to all businesses identified as eligible for the survey As mentioned in the methods section, the web survey invitation was sent to 410 businesses that were identified as representing the Ocean Enterprise. The revenue calculations from the 159 respondents were thus multiplied by a factor that represented revenue for the 410 businesses identified as representing the Ocean Enterprise (both respondents and non-respondents).
Step 3: Add 20% representing those not represented in the initial pool of Ocean Enterprise businesses. It was expert consensus that, even after the best efforts to identify all U.S. businesses involved in the Ocean Enterprise, and include them in population of businesses eligible to be surveyed (e.g., the 410 businesses mentioned above), up to 20% of the organizations potentially involved in the Ocean Enterprise in the U.S. may have been missed (see Figure 12). Although there is no objective means of verifying whether this weighting of the survey results is a realistic one, it is consistent with the only other directly comparable study (Society of Maritime Industries, 2015) which applied an effective weighting of the same order.
This process makes the assumption that the missing companies had the same basic properties as the sample (e.g., size, revenue). Although the 20% uplift in revenues associated with unidentified businesses is considered to be realistic, it can also be viewed as a measure of the range of error associated with the overall revenue estimate.
Revenue Estimates As shown in Figure 13, estimates of revenues for businesses that have some Ocean Enterprise activities in the United States are $58 billion in overall revenues, with $14 billion of overall revenues attributable to maritime related activities, and $7 billion of maritime revenues attributable to Ocean Enterprise business activities. Finally, it is estimated that $1.4 billion of Ocean Enterprise revenue is associated with export Figure 13. Revenue projections
Overall
Revenue $58b
Maritime Revenue
$14b
Ocean Enterprise Revenue
$7b
Ocean Enterprise
Exports $1.4b
Potential unidentified businesses
(estimated at 20%)
Businesses identified for the
survey (N = 410)
Surveyed businesses (N = 159)
Figure 12. Potentially unidentified businesses in the Ocean Enterprise
The Ocean Enterprise: A study of US business activity in ocean measurement, observation and forecasting
ERISS Corp | OCEAN ENTERPRISE STUDY 21
activity. The survey results indicate that businesses that functioned as both Provider and Intermediary accounted for the majority of export revenue ($1 billion) which accounted for almost 35% of their Ocean enterprise revenue ($3 billion). These dual role businesses tended to be larger and more diversified than those who only served one function.
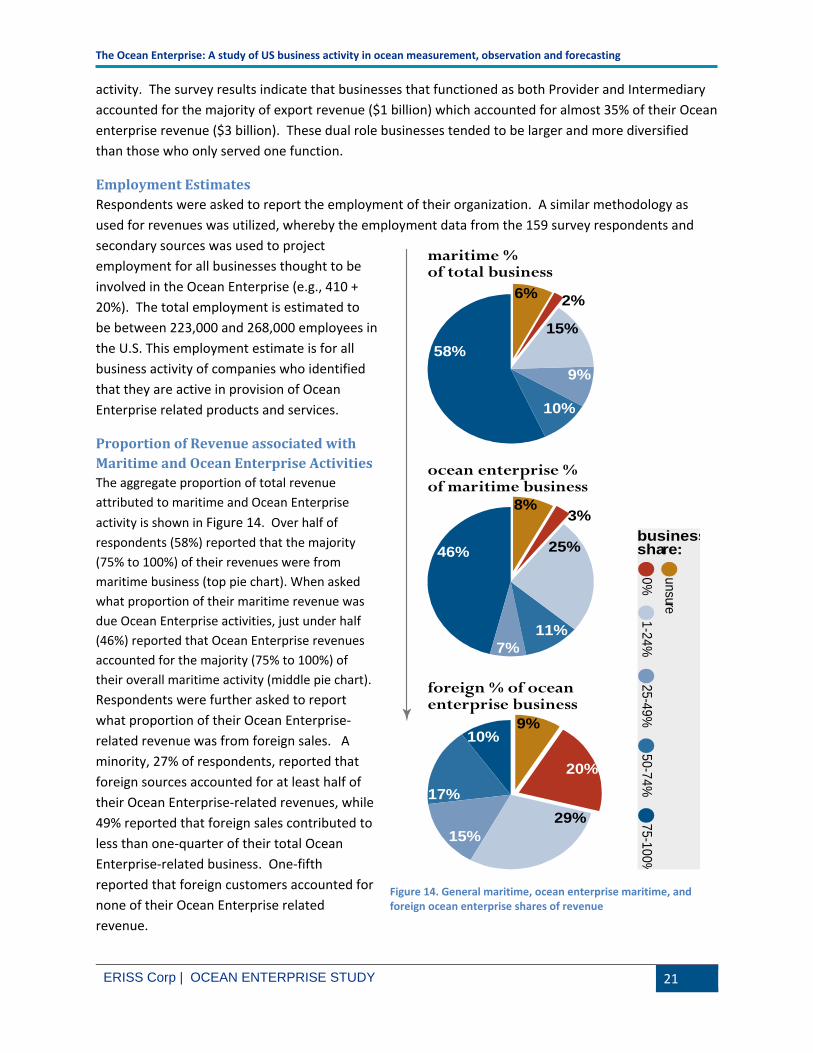
Employment Estimates Respondents were asked to report the employment of their organization. A similar methodology as used for revenues was utilized, whereby the employment data from the 159 survey respondents and secondary sources was used to project employment for all businesses thought to be involved in the Ocean Enterprise (e.g., 410 + 20%). The total employment is estimated to be between 223,000 and 268,000 employees in the U.S. This employment estimate is for all business activity of companies who identified that they are active in provision of Ocean Enterprise related products and services.
Proportion of Revenue associated with Maritime and Ocean Enterprise Activities The aggregate proportion of total revenue attributed to maritime and Ocean Enterprise activity is shown in Figure 14. Over half of respondents (58%) reported that the majority (75% to 100%) of their revenues were from maritime business (top pie chart). When asked what proportion of their maritime revenue was due Ocean Enterprise activities, just under half (46%) reported that Ocean Enterprise revenues accounted for the majority (75% to 100%) of their overall maritime activity (middle pie chart). Respondents were further asked to report what proportion of their Ocean Enterprise-related revenue was from foreign sales. A minority, 27% of respondents, reported that foreign sources accounted for at least half of their Ocean Enterprise-related revenues, while 49% reported that foreign sales contributed to less than one-quarter of their total Ocean Enterprise-related business. One-fifth reported that foreign customers accounted for none of their Ocean Enterprise related revenue.
0% unsure1-24%
25-49%50-74%
75-100%
businessshare:
58%15%
9%
10%
46% 25%
11%7%
17%29%
15%
10%
2%
3%
20%
9%
8%
6%
maritime %of total business
ocean enterprise %of maritime business
foreign % of oceanenterprise business
Figure 14. General maritime, ocean enterprise maritime, and foreign ocean enterprise shares of revenue

The Ocean Enterprise: A study of US business activity in ocean measurement, observation and forecasting
ERISS Corp | OCEAN ENTERPRISE STUDY 22
Foreign Markets Given the inherently international nature of a product suite focused on a maritime environment that extends beyond U.S. borders, the nature of foreign markets is an obvious interest. Respondents were asked to identify various foreign markets that are a source of at least 5% of revenues for their firms, and were allowed to select as many markets as applied. Unsurprisingly, given the inclusion of the U.S., the most mentioned market was North America. Nearly all firms (96%) report customers in North America, with 93% of those reporting customers in the U.S. (Figure 16). Of particular interest in the responses about foreign markets is the equal importance of Europe and Asia and the Pacific Rim, with 44% reporting sales in both regions. As discussed previously, respondents are more likely to be located in states or countries that border or have primary access to the Atlantic Ocean than in states that have a shoreline on the Pacific Ocean. These location dynamics have evidently not diminished the ability of eastern U.S. firms to conduct business in Asia and the Pacific Rim.17
Business dynamics The survey asked a series of questions that related to Ocean Enterprise firms' expectations about the future trajectory of their business, as well as an overall product profile of their business activity.
Business outlook Respondents were generally optimistic with regard to business growth in the next 12 months. As shown in Figure 15, a majority expect their company to grow. Less than one-in-twenty expect their company to shrink. Over one- third anticipate the status
17 Proportions are not weighted by company size or revenue.
Figure 16. Foreign markets that represent at least 5% of respondents' sales
Growing
Staying the same
Decreasing
Unsureintermediaries
providersALL
key:
Figure 15. Business expectations for the next 12 months
The Ocean Enterprise: A study of US business activity in ocean measurement, observation and forecasting
ERISS Corp | OCEAN ENTERPRISE STUDY 23
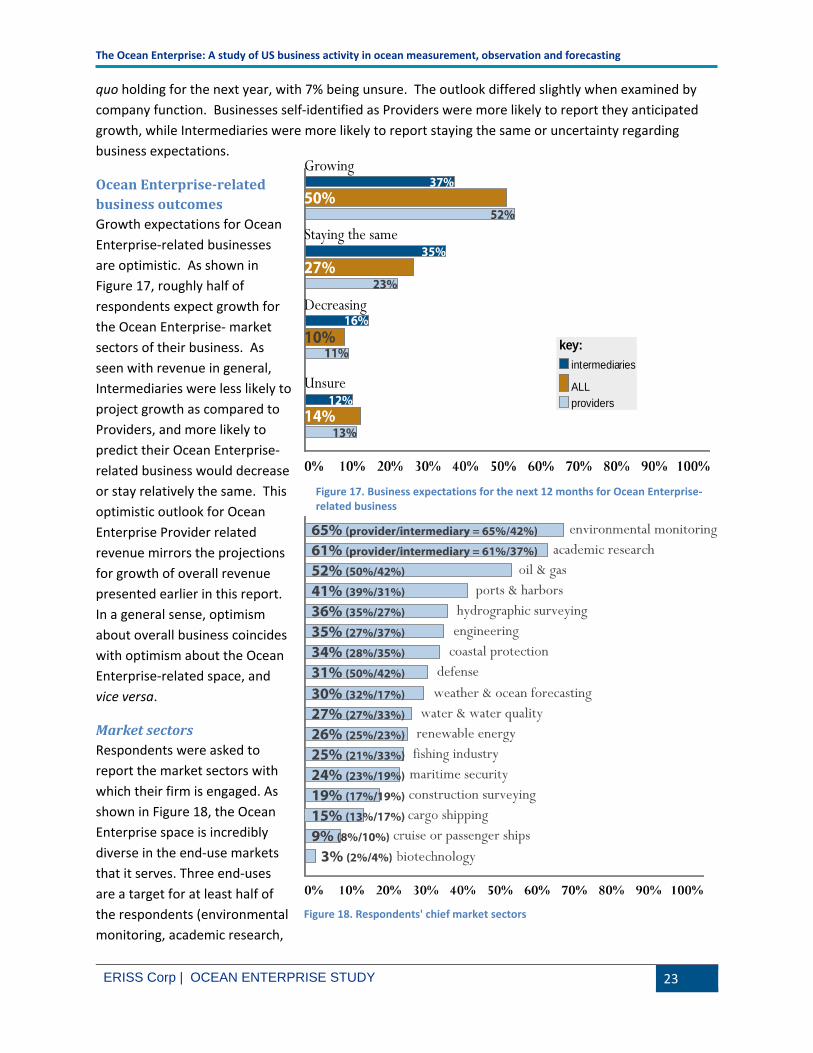
quo holding for the next year, with 7% being unsure. The outlook differed slightly when examined by company function. Businesses self-identified as Providers were more likely to report they anticipated growth, while Intermediaries were more likely to report staying the same or uncertainty regarding business expectations.
Ocean Enterprise-related business outcomes Growth expectations for Ocean Enterprise-related businesses are optimistic. As shown in Figure 17, roughly half of respondents expect growth for the Ocean Enterprise- market sectors of their business. As seen with revenue in general, Intermediaries were less likely to project growth as compared to Providers, and more likely to predict their Ocean Enterprise-related business would decrease or stay relatively the same. This optimistic outlook for Ocean Enterprise Provider related revenue mirrors the projections for growth of overall revenue presented earlier in this report. In a general sense, optimism about overall business coincides with optimism about the Ocean Enterprise-related space, and vice versa.
Market sectors Respondents were asked to report the market sectors with which their firm is engaged. As shown in Figure 18, the Ocean Enterprise space is incredibly diverse in the end-use markets that it serves. Three end-uses are a target for at least half of the respondents (environmental monitoring, academic research,
Growing
Staying the same
Decreasing
Unsureintermediaries
providersALL
key:
Figure 17. Business expectations for the next 12 months for Ocean Enterprise-related business
Figure 18. Respondents' chief market sectors

The Ocean Enterprise: A study of US business activity in ocean measurement, observation and forecasting
ERISS Corp | OCEAN ENTERPRISE STUDY 24
and offshore oil/gas), and a further seven are foci for at least one-third of respondents. The 25% threshold was associated with twelve different market sectors.
Analysis of the gross number of firms engaged in certain market activities does not necessarily reflect employment representation. For example, a hypothetical firm engaged in the “defense” market sector could potentially represent more gross employment than all firms engaged in environmental monitoring combined. And although fewer firms are engaged supporting “Cargo and Shipping,” it is possible that their employment representation has a far greater impact than some sectors that have more participation, but from many smaller firms.18
The number of market sectors chosen by respondents provides an indicator of diversity of function. As shown in Figure 19, 14% of respondents reported their firm was engaged in six of the listed market sectors. A combined 48% of respondents reported their firm was engaged in more than five of the listed market sectors. Only 8% of respondents reported their firm was engaged in only a single listed sector.
Types of Ocean Enterprise Infrastructure Sales Respondents who indicated they filled the role of a Provider of infrastructure for the IOOS were asked a question regarding the types of infrastructure (platforms, sensors, instruments, or systems) they sold. Nearly half (47%) provide physical oceanographic products of some type (Figure 20). Roughly one-third offer hydrographic survey products. These are percentages of respondents and are not weighted by employment numbers or revenue. These results are consistent with what one might expect from the more
18 Respondents were permitted to choose as many categories as applied; therefore percentages can sum to more than 100%.
Figure 20. Types of Ocean Enterprise infrastructure sold
8%
13%11%12%
8%
14%
6%
11%
6%
3% 3% 2% 3%1% 1%
0%
5%
10%
15%
20%
25%
1 2 3 4 5 6 7 8 9 10 11 12 13 14 15
% o
f Res
pond
ents
Number of Market Sectors Selected by Respondents
Figure 19. Number of market sectors

The Ocean Enterprise: A study of US business activity in ocean measurement, observation and forecasting
ERISS Corp | OCEAN ENTERPRISE STUDY 25
mature mission areas of this sector associated with mapping, charting, tide prediction, and general oceanography.
Use of Ocean Observation Data Organizations that had indicated they were Intermediaries (i.e., used ocean observation data to enhance or create a product or service) were asked a series of questions regarding their use of in situ and remotely sensed data types. In situ19 data are those data generated from observations or measurements conducted within or upon the ocean. Remotely sensed data are those utilizing remote sensors such as satellites, airplane observations, and high frequency radar.
As shown in Figure 21,20 nearly half use physical oceanographic data, with one-third using bathymetric data and one-quarter reliant on geophysical data streams.21 The widespread use of Physical Oceanographic data is not surprising given that most Intermediaries would need this general information to start, then would need to combine more specific data type(s) to serve their product purposes.
Use of remotely sensed data22 is less common than in situ data. Remotely sensed data is often not as easy to access or utilize, and often applies to more specialized versus general purposes as compared to in situ data. While approximately two-thirds rely on in situ data, 41% employ data that is remotely sensed. As shown
19 Data generated from observations or measurements conducted within or upon the ocean 20 Respondents were permitted to choose as many categories as applied; therefore percentages can sum to more than 100%. 21 The first set of data in Graphic 18…the general categories…do not sum to 100%. This is a reflection of the actual data and not an error. Respondents were asked to identify all specific use-cases (the green shaded options) OR an option indicating they did not use in situ data. This resulted in a number of instances in which no specific use case was selected, but neither was the option indicating no use of in situ data, at all. Presumably, this is associated with in situ use-types that respondents felt were associated with other use-types than the ones offered by the question. 22 Satellites, airplane observations, high frequency radar
Figure 21. Use of IN SITU data with use type
Figure 22. Use of remotely sensed data with use type

The Ocean Enterprise: A study of US business activity in ocean measurement, observation and forecasting
ERISS Corp | OCEAN ENTERPRISE STUDY 26
in Figure 22, shore and satellite observations are both used by one-third of respondents, while airborne observations are used by just less than one-fifth.23
IOOS Business Dynamics
Awareness of IOOS and future plans One purpose of this study was to assess respondents' awareness of the US Integrated Ocean Observing System (IOOS). 70% of respondents indicated they were familiar with the IOOS. These respondents were then asked to indicate their future plans relative to IOOS.
As shown in Figure 23, with regard to the provision of services and infrastructure, 40% plan on adding new infrastructure, and 29% intend additional services to the system. For use of IOOS data to support and develop products, 24% plan for new products that utilize IOOS data and 22% plan an expansion of existing products that utilize IOOS data. None of the respondents indicated that they planned to eliminate IOOS-related products and services. By default, the remaining 42% evidently plan to continue providing the same mix of IOOS-related products and services unchanged.
Barriers and suggested improvements for working with IOOS Reported barriers to working with IOOS are displayed in Figure 2424. It is immediately apparent that perceived barriers to working with IOOS differed greatly by company function. For example, Intermediary businesses were far more likely to report that the data they utilize did not adequately cover the needed geography, and that the structure of data streams limit their usability. This is not surprising given that the role of Intermediary companies is to use ocean observation data to enhance or create an information product. As would be expected, Providers were more likely to be concerned with development plans for the IOOS system itself. Respondents were also asked questions about access to qualified employees; none cited this as a barrier for their business.
23 Respondents were permitted to choose as many categories as applied; therefore percentages can sum to more than 100%. 24 Respondents were permitted to choose as many categories as applied; therefore percentages can sum to more than 100%.
Figure 23. Future plans for IOOS

The Ocean Enterprise: A study of US business activity in ocean measurement, observation and forecasting
ERISS Corp | OCEAN ENTERPRISE STUDY 27
Summary and Next Steps Although the Ocean Enterprise underpins much larger and higher profile industry sectors, such as shipping, offshore oil/gas and fishing, there have been no concerted efforts to capture the makeup of the organizations, their activities, business perceptions, and their revenue and employment impact in the U.S.
The results of this study indicate a diverse and dynamic sector, with large potential for growth and innovation. The revenues of Ocean Enterprise organizations in the U.S. could range as a high as $58 billion, with revenues due to maritime activities as high as $14 billion and revenues due to Ocean Enterprise activities as high as $7 billion. The employment impact may range as high as 223,000 to 268,000 employees in the U.S. The business outlook as reported by respondents – particularly Providers – is one of optimism, with many organizations reporting they will be developing new products and finding new uses for the ocean observation data. The potential for new business for existing firms, and for opportunities for new arrivals to the industry cluster is vast as expanding infrastructure needs and the need for new applications using ocean observation data become magnified in conjunction with the growth and demand from the sectors the Ocean Enterprise directly underpins.
This study represents a first attempt to capture the impact of this important industry cluster. As with all such early endeavors, the limitations of the study must be recognized. The execution of the study itself revealed the inherent issues with even identifying businesses involved in the Ocean Enterprise.
Figure 24. Barriers to working with IOOS
2%
3%
5%
4%
8%
14%
8%
3%
5%
6%
5%
9%
18%
8%
2%
6%
10%
8%
8%
17%
23%
0% 20% 40% 60% 80% 100%
Local regulations or restrictions
Limited access to data streams
Structure of IOOS data streams limitsusability
Lack of documentation on IOOS datastreams
Difficulties or limitations with adaptingnew technology into the existing ocean
observing system
Limited knowledge about futureinvestment and development plans for the
IOOS system
Data does not adequately cover thegeography needed
Intermediary Businesses
Primary Providers
ALL Businesses

The Ocean Enterprise: A study of US business activity in ocean measurement, observation and forecasting
ERISS Corp | OCEAN ENTERPRISE STUDY 28
Although there was some considerable success identifying organizations through a concerted effort to compile lists from industry organizations, government sources, and through word of mouth from known businesses, there is no doubt that a significant proportion will have been left unidentified. It is, therefore, unknown if the identified businesses are a representative sample and projections of total Ocean Enterprise business activity should be treated with caution. Other limitations of the study include possibly unreliable revenue reporting, lack of precision between reporting for entire organizations and subsidiaries, and the tendency of larger respondents to omit some critical information. Finally, although the response rate was acceptable, the sample size was barely adequate when stratifying the results by such factors as company function.
Next steps may include a more in-depth economic impact study, as well as further study regarding the uses of and access to ocean observation data streams. More study may also be warranted examining service-demand gaps regarding potential new products that could potentially utilize ocean observation data.
Important lessons were learned with regard to the design of future survey instruments for similar research. For example, asking respondents to provide more detailed employment breakdowns, such as employment by revenue source, would enable detailed estimates of specific maritime-related employment. This would help tease apart maritime and Ocean Enterprise activity levels even for firms that conduct business in many non-maritime related fields.
The task of compiling lists of companies also proved to be a unique challenge. Any attempt to identify all businesses that are involved in a specific industry cluster, especially one such as the Ocean Enterprise that involves such a wide variety of products and functions, can prove to be a daunting task. Future endeavors should involve increased research and outreach to identify all businesses relevant to the study. It is probable that, due to limited access to industry lists, some key sectors were under-represented in the current research. For example, the Ocean Enterprise related activities of coastal engineering consultancies are known to be underestimated because of limitations in outreach to this important group of Intermediaries.
More study may also be warranted to investigate the activities, function and nature of foreign companies with U.S. activities, and U.S. companies with primarily foreign markets.
In conclusion, this report provides a baseline against which to measure the future development of the Ocean Enterprise endeavor and a catalyst for additional studies of the wider Blue Economy.

The Ocean Enterprise: A study of US business activity in ocean measurement, observation and forecasting
ERISS Corp | OCEAN ENTERPRISE STUDY 29
References 1. National Academies – Fair Weather: Effective Partnerships in Weather and Climate Services
(2003). http://www.nap.edu/catalog/10610/fair-weather-effective-partnerships-in-weather-and-climate-services.
2. National Research Council’s report Weather Services for the Nation: Becoming Second to None. http://www.nap.edu/catalog/13429/weather-services-for-the-nation-becoming-second-to-none.
3. Rayner, R. F., 2012. US IOOS summit white paper – IOOS stakeholders and beneficiaries as part of the US IOOS. http://www.iooc.us/summit/white-paper-submissions/community-white-paper-submissions.
4. Society of Maritime Industries (SMI), 2015. Annual review of UK marine scientific industries. http://www.maritimeindustries.org/CoreCode/Admin/ContentManagement/MediaHub/Assets/FileDownload.ashx?fid=179875&pid=10160&loc=en-GB&fd=False.
5. San Diego Workforce Partnership, San Diego Regional Development Economic Development Corporation, The Maritime Alliance – San Diego Maritime Industry Report 2012, http://themaritimealliance.org/
6. Spiegler, D. B., 2007. Community: The Private Sector In Meteorology - An Update. Bulletin of the American Meteorological Society, 88(8):1272-1275.
The Ocean Enterprise: A study of US business activity in ocean measurement, observation and forecasting
ERISS Corp | OCEAN ENTERPRISE STUDY 30
Appendix 1: Survey Questions
1. Please select the answer choice(s) below that best describes your business: (select all that apply)
We provide infrastructure for ocean measurement, observation, or forecasting purposes (e.g., platforms, instruments, sensors, data communications, IT infrastructure, instruments for navigation and positioning, etc.)
We use ocean measurements, observations or forecasts to create or enhance a value added data product offered for commercial sale (e.g. to provide a survey product, power a weather or surf forecast service, evaluate ocean hazards, support fish locating, etc.)
We don’t provide ocean measurement, observation, or forecasting infrastructure or use ocean measurements, observations or forecasts <SURVEY WILL GO TO THANK YOU/EXIT SCRIPT>
2. How long has your business provided ocean measurement, observation or forecast
infrastructure or related value added services? Less than 1 year 1 through 3 years through 5 years More than 5 years Unknown
3. Currently, how many employees in your business are located in the U.S.?
1-4 5-9 10-24 25-49 50-99 100-249 250-499 500-999 1000 or more
4. Currently, how many employees in your business are at your current location?
We only have one location 1-4 5-9 10-24 25-49 50-99 100-249 250-499 500-999 1000 or more

The Ocean Enterprise: A study of US business activity in ocean measurement, observation and forecasting
ERISS Corp | OCEAN ENTERPRISE STUDY 31
5. In the next 12 months do you anticipate your company: Growing Staying the same Decreasing Not sure
6. Is your company a subsidiary, and if YES, what is the name of the holding company and
in which country is it registered? Not a subsidiary
Yes, we are a subsidiary of , and based in (Country) .
7. How many discrete locations does your company or your parent company have? (multiple buildings on a single campus counts as one location)
1 2 3 4 5 6-9 10 or more
8. How many of these locations are outside the U.S.?
All None 1 2 3 4 5 6-9 10 or more
9. What were your company’s gross revenues for the past year?
a) Subsidiary revenues (if subsidiary) b) Overall company revenues
10. What share of your revenue is due to Maritime activities or business? 0% or None 1% to 24% 25% to 49% 50% to 74% 75% to 100% Don’t Know
The Ocean Enterprise: A study of US business activity in ocean measurement, observation and forecasting
ERISS Corp | OCEAN ENTERPRISE STUDY 32
11. What share of your maritime revenues is due to business or activities associated with providing ocean observation, measurement or forecasting infrastructure or provision of value added data products based in whole or in part on ocean observation, measurement or forecast data? 0% or None 1% to 24% 25% to 49% 50% to 74% 75% to 100% Don’t Know
12. What percentage of your ocean observation, measurement or forecasting related revenues
from Question 10 is from sales outside the U.S.? 0% or None 1% to 24% 25% to 49% 50% to 74% 75% to 100% Don’t Know
13. In the next 12 months, do you anticipate your ocean observation, measurement and
forecasting related business revenue: Growing Staying the same Decreasing Not sure
14. From which of these market areas does your company, or your parent company (if it is
U.S. registered) receive significant ocean observation, ocean measurement or ocean forecasting business related revenue (greater than 5%) (Select all that apply): Australia/New Zealand Other Asia-Pacific Japan China Taiwan South Korea Africa Middle East East Europe/Russia Continental Europe UK/Ireland USA Canada Mexico/Central America Non-U.S. Caribbean South America Other:
The Ocean Enterprise: A study of US business activity in ocean measurement, observation and forecasting
ERISS Corp | OCEAN ENTERPRISE STUDY 33
15. What are your main market sectors? (select all that apply) Academic research Defense Maritime Security Ports/harbors Coastal protection Environmental monitoring Renewable energy Oil/gas Maritime security Fishing industry Hydrographic Surveying Construction Surveying Water and water quality Biotechnology Engineering Weather and ocean forecasting Cargo shipping Cruise ships/passenger ships
Other:
16. (Providers only) What kind of ocean measurement, observation, or forecasting infrastructure (e.g., platforms, instruments, sensors, data communications, Information Technology infrastructure etc.) do you sell? (select all that apply) Hydrographic survey sensors/instruments/systems Shallow geophysical survey sensors/instruments/systems Geotechnical measurement/sampling, sensors/instruments/systems Physical oceanographic sensors/instruments/systems Chemical oceanographic sensors/instruments/systems Biological oceanographic sensors/instruments/systems Navigation and positioning sensors/instruments/systems Platforms such as towed systems, remote or autonomous underwater vehicles Data communications and Information Technology infrastructure Other
17. (Intermediaries only) If you utilize “IN SITU” ocean observations or measurements in your data products (ie data generated from observations or measurements conducted within or upon the ocean) what kind of data do you use? (select all that apply) Bathymetric data Geophysical data Geotechnical data Physical oceanographic data Chemical oceanographic data Biological oceanographic data
The Ocean Enterprise: A study of US business activity in ocean measurement, observation and forecasting
ERISS Corp | OCEAN ENTERPRISE STUDY 34
Other We do not utilize IN SITU data
18. (Intermediaries only) If you utilize “REMOTELY SENSED” ocean observations in your
product (e.g., satellites, airplane observations, high frequency radar), what kind of data do you use? (select all that apply) Aircraft observations Satellite observations Shore observations Other We do not utilize REMOTELY SENSED data
The following questions relate specifically to your interaction with the US Integrated Ocean Observing (IOOS).
19. Are you aware of the Integrated Ocean Observing System (IOOS) and, if so, do you contribute to IOOS infrastructure or utilize IOOS coordinated data? (Select all that apply) We are unaware of the IOOS <SURVEY WILL GO TO THANK YOU/EXIT
SCRIPT> We are aware of IOOS We contribute to IOOS infrastructure We make use of IOOS coordinated data
20. Which of the following do you consider issues or barriers to working with IOOS that impact your business? (select all that apply) Local regulations or restrictions Limited access to data streams Structure of IOOS data streams limits usability Lack of documentation on IOOS data streams Difficulties or limitations with adapting new technology into the existing ocean
observing system Limited knowledge about future investment and development plans for the IOOS
system Data does not adequately cover the geographical needed Hard to find employees who can work with the IOOS data Hard to find employees who can work with the IOOS infrastructure Other: None of the above Don’t know
21. In the future, we plan to: (select all that apply)
Develop new products that utilize IOOS data Expand the capabilities of our current product that utilizes IOOS data Provide additional infrastructure for IOOS Provide additional services for IOOS

The Ocean Enterprise: A study of US business activity in ocean measurement, observation and forecasting
ERISS Corp | OCEAN ENTERPRISE STUDY 35
Eliminate some products or services we provide None of the above
22. What areas do you think could be improved with regard to working with IOOS? (select
all that apply) Better information and data stream standardization More openness to opportunities for new innovations Greater focus on the interests of small or new enterprises engaged in ocean
observation, measurement, and forecasting or the use of ocean data Greater focus on the interests of large or established enterprises Other: (please describe) None of the above
23. Do you feel your current or future workforce could benefit from specific training related
to working with IOOS data or providing IOOS infrastructure? Yes: please explain: No Don’t know
24. Is there anything that would make it easier to provide services, products, or infrastructure
to NOAA and the IOOS system? Yes: please explain: No Don’t know
25. Is there anything that would make it easier to utilize the IOOS data and incorporate it into a product? Yes: please explain: No Don’t know
OPTIONAL RECOMMENDATION QUESTION: Can you recommend other recipients for this survey? These could be subsidiaries of your company, or other qualified companies? If yes, please list below (name of company and contact if available):

The Ocean Enterprise: A study of US business activity in ocean measurement, observation and forecasting
ERISS Corp | OCEAN ENTERPRISE STUDY 36
Appendix 2: Location of Targeted Businesses by State
State Number of Businesses
Alaska 4 Alabama 2 Arizona 3 California 76 Colorado 6 Connecticut 5 Florida 49 Georgia 1 Hawaii 3 Idaho 1 Illinois 3 Kansas 1 Kentucky 1 Louisiana 10 Massachusetts 37 Maryland 13 Maine 3 Michigan 4 Mississippi 1 Montana 1 North Carolina 6 Nebraska 1 New Hampshire 10 New Jersey 8 New York 7 Ohio 3 Oregon 5 Pennsylvania 3 Rhode Island 6 South Carolina 3 Texas 42 Utah 5 Virginia 13 Vermont 2 Washington 34 Wisconsin 3 Unknown State (not mapped) 35