The Occupational Wages around the World (OWW) Database ... Updated Occupational Wages around the...
55
May 2012 The Occupational Wages around the World (OWW) Database: Update for 1983-2008 1 Remco H. Oostendorp VU University Amsterdam Tinbergen Institute Amsterdam Institute for International Development
-
Upload
nguyentram -
Category
Documents
-
view
219 -
download
4
Transcript of The Occupational Wages around the World (OWW) Database ... Updated Occupational Wages around the...

May 2012
The Occupational Wages around the World (OWW) Database:
Update for 1983-20081
Remco H. OostendorpVU University Amsterdam
Tinbergen InstituteAmsterdam Institute for International Development

Introduction
This document describes the standardization procedure for the 1983-2008 ILO
October Inquiry data. Earlier standardization procedures were those applied to the 1983-2003
data (Oostendorp 2005) and the 1983-1998 data (Freeman and Oostendorp 2000). The
current standardization procedure for the 1983-2008 ILO October Inquiry data expands the
earlier databases by including the most recent data available on the ILO website
(http://laborsta.ilo.org) as well as data for 1983-1984 that are only available in hardcopy
format (see below). The wages are standardized on both an hourly and monthly basis unlike
the two previous standardizations which were on a monthly basis only.
We will discuss the main characteristics of the 1983-2008 ILO October Inquiry
database first, and next we give a detailed account of each of the steps of the standardization
procedure.
The 1983-2008 ILO October Inquiry data
The ILO October Inquiry is the most far-ranging survey of wages by occupation
around the world. It was started initially in 1924 in 15 countries (or rather capital cities) for 18
occupations, and it has been conducted on an annual basis up till 2008.2 Over time the number
of occupations covered was increased in 1929 (30 occupations), 1951 (41 occupations), 1953
(48 occupations) and finally in 1983 (161 occupations) (see Freeman and Oostendorp 2000).3
The 1983-2008 ILO October Inquiry is mostly available in electronic format
(http://laborsta.ilo.org), except for data for 45 occupations which are only available in
hardcopy format.4 We have therefore scanned the 1983-1984 ILO October Inquiry data which
was not available in electronic format, creating a complete electronic version of the ILO
October Inquiry for the 1983-2008 period.
The electronic version of the ILO October Inquiry poses a number of challenges.
First, many of the pay observations have been reported throughout the period with additional
footnotes (contained in the variable 'NOTES'), such as "Average per hour", "Auckland",
"Both sexes" or "Large hotels". We have coded these footnotes as much as possible, using the
variables y0 (year), y1 (country code), y2 (city or region code), y3 (industry code), y4
(occupation code), y6 (pay or hours of work concept code such as wages versus earnings, and
normal versus average hours of work), y7 (sex code), y8 (range code), y9 (period concept
2
code such as monthly versus hourly pay) and y10 (averaging concept code such as mean
versus minimum pay) (see Appendix A for the coding of the variables that were ultimately
retained in the standardized data set).
Second, the electronic version available on http://laborsta.ilo.org has a variable
(TIME) which indicates both the time period as well as the averaging concept used (for
instance 'Per Month. Minimum' or 'Per Week. Average'). It is straightforward to recode this
variable separating the period and averaging concept by using two variables, one indicating
the time period (y9) and another indicating the averaging concept (y10). However, it is more
problematic to note that in the electronic version of the ILO October Inquiry the TIME
variable is time-invariant as it has been reported for each country and each occupation but not
for each year. In the published version of the ILO October Inquiry5, this variable does change
over time and has been reported for each year (in the heading of the column). Therefore, we
have consulted all issues of the published version of the ILO October Inquiry to make the
variables y9 and y10 time-variant.
Third, the variable indicating the footnote ('NOTES') sometimes indicates whether the
data are 'Minimum' or 'Maximum'. However, this is insufficient to determine whether the data
refer to minimum respectively maximum wages, or to a range of, say, average wages. For
instance, the reported minimum wage for a miner in Belgium in 1993 is 387.34-444.22. And
the reported minimum-maximum wage for an automobile mechanic in Barbados in 1993 is
306-333. It is clear that for Belgium a range of (minimum) wages are reported, while for
Barbados the minimum and maximum wage are reported respectively. Nevertheless, in the
electronic version of the ILO October Inquiry they are reported in exactly the same manner -
the first wage is reported as 'Minimum' and the second wage as 'Maximum'. Because of this
ambiguity, we have consulted all issues of the published version again to verify whether
'Minimum' and 'Maximum' refers to minimum and maximum wages or rather a range of
wages (which could be otherwise average, minimum, etc. wages).6
Figure 1 reports the number of countries that report pay data for each year and all
years cumulatively for at least one of the 161 occupations in the 1983-2008 period. The
number of countries that report pay data for at least one occupation varies between 26 and 78
countries in the years 1983-2008. The number of countries reporting for 2008 is rather low at
26 and this may be partly due to some countries having reported late. However, there is also a
clear downward trend in the number of countries reporting. In terms of cumulative number of
countries reporting, a total number of 171 countries reported pay at least one time in this
period.
3

Figure 1. Number of countries reporting in the 1983-2008 ILO October Inquiry
Table 1 below gives a detailed description of the information in the 1983-2008 ILO
October Inquiry. It should be noted that these numbers reflect the raw data before extensive
cleaning (the data cleaning procedure is described below). Also if a range has been reported
for pay, we found the midpoint of the range and use it as the reported pay for the category.
Panel A gives information on the size of the samples. It shows the maximum
conceivable number of observations that the Inquiry would contain if each country reported a
single pay statistic for each occupation yearly: over 715,000 pieces of data for the 1983-2008
period.7 The actual number of observations is smaller, largely because most countries do not
report statistics in many years. On average, countries report wages for 9.3 years out of 26
possible years for the period 1983-2008. This implies that about two-thirds of country year
observations are empty. In addition, countries do not report data for every occupation in the
years when they do report. The bottom line is that there are 125,811 country x year x
occupation cells with wage data in the 1983-2008 data files.
However, many countries report more than one wage for a single occupation. Some
give hourly wage rates and average earnings. Others give wages for men and wages for
women. Others give wages for one gender and for both genders. Nearly one- half of the
observations (51.4%) contain multiple wage figures. While this will help us to calibrate the
data into a standardized format, it makes the raw data difficult to use in cross-country
comparisons, particularly since different countries report pay differently. Including multiple
wages, there are 241,240 pieces of data for the 1983-2008 period.
4

Panel B shows the frequency distribution of countries by the number of occupations
they report; and the frequency distribution of occupations by the number of countries that
report statistics on them. The distribution of countries by number of occupations shows that
in most countries there are sufficient occupations with wage data to get a good measure of the
overall wage structure. It also shows, however, that different countries report on different
numbers of occupations, which creates problems in comparing wage structures across
countries. The distribution of occupations by country shows that many occupations have
wage data for large numbers of countries, which will allow us to contrast labor costs and
living standards for workers in the same occupation around the world.
Panel C shows the diverse way in which countries report wages. Most countries
report wage rates, presumably from employer surveys or collective bargaining contracts or
legislated pay schedules. However, many report earnings, which may come from household
surveys. For the 1983-2008 period, most pay statistics are in the form of means but 16
percent are reported as minimum wages, some from collective bargaining contracts. Some
countries report maximum wages. Others give prevailing wages. The US reports median
weekly earnings for most occupations (from individual reports on the Current Population
Survey).
The time period to which the pay refers also varies, with the most common period
being the month, followed by the hour, but some countries report weekly pay, others give
daily rates for some occupations, and so on. There is also variation by gender, with forty
percent of the observations relating to male workers, 38 percent to all workers, and 23 percent
to female workers.
Finally, in terms of coverage, most pay figures in the 1983-2008 period are for the
whole country (84%). When the country coverage is for only part of the country, the reported
pay is virtually always for the dominant economic regions where most of the (formal)
employment is located. This implies that the pay figures may not be that different from those
for the entire country. Also if they are actually different, this may be less of an issue if one
analyzes within-country wage inequality.
5

Table 1. Types of observations contained in the October Inquiry computer files, 1983-2008 No. of observations
A. SAMPLE SIZEMaximum conceivable observations (excl multiple observations) 715,806
Missing because country did not report in given year 460,782Missing because occupation missing in year country reported 129,213
Actual year/country/occupation observations (excl multiple observations) 125,811Observations with multiple figures 64,697Multiple figures 115,429
Total, including all multiple observations 241,240B. COUNTRIES AND OCCUPATIONS WITH AT LEAST ONE REPORTED WAGE STATISTIC
Countries with reported wage statistic for different numbers of occupations No. of occupations No. of countries (total=171)
<=29 14 30-59 17 60-79 16
80-99 15 100-119 33 120-139 23 140+ 53
Occupations with one reported wage statistic for different numbers of countriesNo. of countries reporting on occupations No. of occs (total=161)
<=79 22 80-99 30 100-119 39
120-139 46140+ 24
C. ACTUAL OBSERVATIONSPay concept (y6)
Wage rates 142,163Earnings 99,077
Averaging concept (y10)Mean 182,682Minimum 38,358Maximum 5,640Average of min-max 21Prevailing 7,193Median 6,821Missing 515
Period concept (y9)Monthly 155,079Hourly1 43,325Daily 10,541Weekly 27,247Per 8 days 4Per 12 days 32Fortnight 1,299Per 15 days 56Annual 3,592Other 44Missing 21
Sex (y7)Male workers 95,349Male and female workers 54,913Female workers 90,978
Coverage (y2)Whole country 202,435Part of country 38,805
Notes: Tabulated from the ILO October Inquiry computer files, 1983-2008, and from the hardcopy tables, 1983-1984. The total number of countries is 171. 1The hourly figures under “period concept” include a small number of observations which concern hours paid for, and another small number which concern wages relating to hours worked.
6

Standardization procedure for the 1983-2008 ILO October Inquiry data
Because of the nonstandard nature of the database we use a standardization procedure
to make the data comparable across occupations, countries and time. This procedure is similar
to the standardization procedure that was applied to the 1983-2003 ILO October Inquiry
(Oostendorp 2005). In the 1983-2003 standardization procedure, the data were normalized as
mean monthly male wages. For the 1983-2008 standardization, the data will be standardized
both on an hourly as well as a monthly basis. Also the data will be standardized for adult
wages (i.e. the mean wage for both sexes) rather than male wages. In the 1983-2003
standardization procedure it was noted that the data are most frequently reported in terms of
male wages and hence it was chosen as the basis for the standardization. However, the
frequency of wages reported in terms of both sexes is only slightly lower (see Table 1).
Standardization in terms of adult wages is now preferred, because adult wages are more
representative of the actual wages earned by all workers. The remainder of this section
provides a detailed account of each of the steps in the standardization procedure.
Step 1.Data cleaning of hours of work data
Initially, the data for hours of work were inspected for whether they were out of
bound and/or whether there was a typo in the raw data. In a number of cases the reported
hours of work per week did indeed exceed the total of 168 hours in the week and this was due
to an incorrect coding of the period concept (for instance monthly hours were reported as
weekly hours).8 Also a number of obvious typos in the hours of work data was found and
these were corrected.
No further cleaning of the hours of work data was done, because measurement error
in hours of work and pay figures often appear to be negatively correlated, with low (high)
reported hours of work appearing in combination with high (low) hourly pay figures. Hence,
in these cases the implied actual monthly wages may still be reasonable. Also apparently low
numbers for hours of work may reflect gender differences (with much lower hours of work
reported for female workers in some instances) or the difference between normal hours of
work and the hours actually worked. Therefore the more extensive cleaning was applied to the
derived hourly and monthly wages (see step 3 below)
7

Step 2. Construction of hourly and monthly data
Hourly data
The wage observations have been recalculated on a hourly basis using the reported
(and cleaned) hours of work data from step 1. In case hours of work have been reported using
the same period concept as wages (for instance both are reported per week or per day), this is
straightforward. However, in a number of cases dimensional analysis was applied if the hours
of work were reported but for a different time period than for wages.9 For instance, if wages
were reported on a monthly basis and hours of work on a weekly basis, then the hourly wages
were calculated as wages/(hours*52/12).
However, the number of hours was not always reported for the given occupation (y4),
pay concept (y6), sex (y7), year (y0), city/region (y2) and country (y1). In this case the next
best alternative hours of work was assigned. The following table reports the different hours of
work data that have been used successively in lexicographic order for the 1983-2008 data.
Table 2. Lexicographic assignment of hours of work for 1983-2008 data
Lexicographic
order
Hours of work assigned from
1 same occupation (y4), pay concept (y6), sex (y7), year (y0) city/region (y2) and
country (y1)2 average of any city/region (y2) for given occupation (y4), pay concept (y6), sex
(y7), year (y0) and country (y1)3 average of any sex (y7) for given occupation (y4), pay concept (y6), year (y0),
city/region (y2) and country (y1)5 other pay concept (y6) for given occupation (y4), sex (y7), year (y0), city/region
(y2) and country (y1)4 closest other year (y0) for given occupation (y4), pay concept (y6), sex (y7), year
(y0), city/region (y2) and country (y1)6 average of any occupation (y4) for given pay concept (y6), sex (y7), year (y0),
city/region (y2) and country (y1)7 average of any occupation/pay concept/sex/year/city/region (y4, y6, y7, y0, y2)
for given country (y1)8 average of any country/ pay concept/sex/year/city/region (y0,y1,y2,y6,y7) for
given occupation (y4)
The above lexicographic ordering has been chosen because the variation in hours of
work in the 1983-2008 period can be attributed in decreasing order of magnitude to variation
in city/region (y2), sex (y7), pay concept (y6), year (y0) and occupation (y4). In the few
remaining cases where the lexicographic assignment rules 1 to 6 did not yield an estimate of
8

hours of work, the country-average (assignment rule 7) or, if not available, the world-average
of hours of work by occupation (assignment rule 8) was used.
Monthly data
The same procedure has been applied to construct monthly wage data. However,
wage observations that are reported on a daily basis could not be converted into monthly pay
figures, because the number of working days per month is not reported. Therefore, the
observations are either on a monthly or daily basis, and data correction factors for daily wages
will need to be estimated to convert them into monthly pay figures (see step 4 below).
Step 3. Data cleaning of wage data
The data cleaning of the wage data was undertaken in five different steps. First, a
number of wage observations were removed from the data set because their exact data type
was unspecified or too idiosyncratic. For the period concept, wage observations with a
missing or ‘other’ period concept (such as per shift, per piece) were dropped. For the
averaging concept, wage observations with missing averaging concept were also dropped. We
also removed the wage observations that were reported as the average of minimum and
maximum wages because there are only few of them (see Table 1) and it is not a common
averaging concept.
Second, data plots with hourly wages (in local currency units or in US$) on the
vertical axis and year of reporting on the horizontal axis for each country x occupation pair
were inspected. The following figure shows one example of a plot for the occupation “Shoe
sewer (machine)” (y4=35) for Austria in LCU (note that the pay is converted into Austrian
Shillings from 1999 when the Euro was introduced).
9

40
60
80
100
1985 1990 1995 2000 2005y0
Minimum Mean/Median/Prevailing (lowest)Mean/Median/Prevailing (highest) Maximum
y1=AT y4=35
The plot clearly shows that the wage observations for 1984 and 1994-96 are potential
outliers. Further inspection of the raw data showed that this problem was not caused by
variation in the averaging concept (e.g. maximum wage reported instead of minimum wage),
(obvious) miscoding in the period concept (e.g. annual wages reported instead of monthly
wages), gender wage differences, or differences in location (i.e. regions within the country)
from which wages were reported. In this case it was therefore decided to drop these outliers in
order to preserve the obvious time pattern in the data.
The following figure shows a similar plot for the occupation “Deep-sea fisherman”
(y4=9) for Suriname in LCU. The plot clearly shows that the hourly wages for 1990 are
potential outliers, and further inspection of the raw data showed that this was due to an
obvious miscoding of the period concept for 1990 (the raw wages were reported as weekly
rather than monthly). Therefore the period concept was recoded to monthly wages for 1990
and the obvious time pattern in the constructed hourly wages was restored.
05
10
15
1986 1988 1990 1992 1994y0
Minimum Mean/Median/Prevailing (lowest)Mean/Median/Prevailing (highest) Maximum
y1=SR y4=9
10

As final example we show a figure for the occupation “labourer” in manufacture of
machinery (except electrical) (y4=70) for Costa Rica. Because this occupation was also
reported in the 1953-1982 period, we plot the hourly wage figures in US$ rather than LCU for
the entire 1953-2008 period. The observation for 2008 is a potential outlier, and further
inspection of the raw data shows that this is caused by a typo leading to a misplaced digit.0
.51
1.5
2
1957 1962 1967 1972 1977 1982 1987 1992 1997 2002 2007y0
Minimum Mean/Median/Prevailing (low)Mean/Median/Prevailing (high) Maximum
y1=CR y4=70
In total 18,302 country x occupation pairs were inspected. For a few country x
occupation pairs it was obvious that there was no logical time pattern in the reported data and
all the observations of the country x occupation pair were deleted from the database. The
following plot for “Motor bus driver” (y4=111) for Puerto Rico illustrates this case. Here only
minimum wages are reported for the period 1980-1995, but both minimum wages and
maximum wages are reported for the 1996-2008 period. However, there is no logical time
pattern in the reported minimum wage, even accounting for the fact that the low figures in
2007 and 2008 are probably due to a misplaced digit. One may speculate that the reported
05
10
15
1960 1970 1980 1990 2000 2010y0
Minimum Mean/Median/Prevailing (lowest)Mean/Median/Prevailing (highest) Maximum
y1=PR y4=111
11

wages for the period 1980-1995 are actually maximum wages, creating a smooth time pattern
in maximum wages for the period 1980-2008. Or else they could be mean/prevailing (no
median wages were reported), creating a smooth time pattern in mean/prevailing wages for
the 1960-1995 period. Hence, whatever is true is not obvious here, and it was therefore
decided to drop all the observations from this country x occupation pair.
As a third step in the cleaning procedure, hourly wages were inspected across
occupations for each country x year pair. In case occupational wages were a tenfold smaller or
a tenfold larger than the average occupational wage within a country x year pair, then this
wage observation was further checked and corrected if necessary.
Fourth, the average hourly wage within a country x year pair was compared to GDP
per capita for that country and year. In case the ratio of the average wage and GDP per capita
was very low or high (in the lower or upper 1% of the distribution) , then these wage
observations were further checked and corrected if necessary.
In the fifth and final step of the cleaning procedure the monthly wages were also
cleaned. In principle hourly and monthly wages will show the same time patterns unless the
hours of work changed significantly for a given country-occupation pair across time. We
calculated the range in hours of work for each country-occupation pair and repeated the
second step of the cleaning procedure but now for monthly wages in case the range in hours
of work standardized by the mean hours of work exceeded 0.25 (2,069 country-occupation
pairs).10
As a consequence of the above cleaning steps, the number of year/country/occupation
observations dropped from 125,811 (Table 1) to 125,018 (a 0.6% reduction). In the cleaned
dataset, there are two pay concepts (58.9% wage rates, 41.1% earnings), five averaging
concepts (76.0% mean, 15.8% minimum, 2.3% maximum, 3.0% prevailing, 2.8% median)
and 3 sex concepts (39.5% male, 37.7% male and female, 22.8% female). In the following
section we discuss the procedure to standardize these data with these different concepts.
Step 4. Estimation of data type correction factors
The next step is to estimate data correction factors for the 1983-2008 ILO October
Inquiry data following the procedure discussed in Freeman and Oostendorp (2000) which was
further improved in Oostendorp (2005). Note first that because data concepts can occur in
combination with each other, this gives potentially 30 data correction factors for hourly
wages: 2 types of pay concepts (wage and earnings), 5 types of averaging concepts (mean,
12
minimum, maximum, prevailing and median) and 3 types of sex concepts (male, female, both
sexes) (2 x 5 x 3 = 30). For monthly wages we also have 2 types of period concepts (monthly
and daily) and therefore there will be 60 potential data correction factors. Furthermore, the
impact on wages of each of these (combinations of) data concepts could vary across countries
(and even across regions within countries), occupations, and years. Hence, there are a large
number of potential correction factors that need to be estimated.
This problem of heterogeneity of the data correction factors was discussed in
Freeman and Oostendorp (2000). It was noted that the variation in the October Inquiry is too
‘thin’ to estimate all potential data correction factors for all data types and that it is necessary
to simplify the procedure. Also here we will assume that the different data types affect wages
separately rather than interactively (reducing the number of combinations of data concepts
from 30 to 10 for hourly wages and 60 to 12 for monthly wages). Also we will not estimate
data correction factors that vary across occupation, assuming for instance that the gender
wage gap is constant across occupations within a country.11 The reason we do make these
simplifying assumptions is that we think that the largest source of variation in the data
correction factors can be found across countries rather than across occupations.
In Freeman and Oostendorp (2000, 2001) data correction factors were estimated that
varied by region or income rank of the country but not by country. In Oostendorp (2005)
country-specific data correction factors were estimated as much as possible. Because data
correction factors turned out to be highly variable across countries, this country-specific
standardization procedure can be seen as an important refinement of the original procedure.
Apart from the introduction of country-specific data correction factors, also country-specific
occupational dummies were introduced to allow the occupational wage structure or ranking
to vary across countries. Therefore we will follow the same procedure as in Oostendorp
(2005) to standardize the data with country-specific data correction factors and occupational
wage structures, but we will impose more plausibility checks on the estimated correction
factors (see below).
A number of issues need to be addressed when estimating country-specific data
correction factors. First, for a number of countries some or none of the data correction factors
can be estimated because they are not identified for lack of variation in the data at the country
level. If wages in one country are only reported as minimum wages, then it will not be
possible to estimate the average wage in this country. Or if average wages are only reported
for female workers, and prevailing wages for male workers, then it is not possible to identify
separately the data correction factors for the averaging and sex concept. Second, there might
13

be variation in the data but some of the data types are reported sparsely. For instance in some
countries wages are mostly reported as minimum wages and only in a few instances as
average wages. Third, the estimated data correction factor may be implausible. If wages have
been reported as median wages in some instances, and if the estimated data correction factor
for the averaging concept implies that median wages are higher than average wages, then this
is not plausible.
Taking these issues into account, we therefore distinguish between three types of
standard(ized) wages. First, there are wages that are reported in a standard format and that do
not need to be standardized. The standard format is here defined as mean hourly or monthly
wage rates for adult workers. Second, there are wages that are reported at least partly in non-
standard format and for which plausible data country-specific correction factors can be
identified on non-sparse data types. The definition of non-sparse data types is arbitrary and
we have chosen as cut-off point at least 10 wage observations of the given data type. Third,
there are wages that are reported at least partly in non-standard format for which no plausible
country-specific estimates on non-sparse data types for all correction factors can be identified.
In this case we substitute the estimated data correction factors for the pooled sample of all
countries for the correction factors that could not be estimated plausibly on non-sparse data
for a given country.
We have applied the following rules to determine whether an estimated data
correction factor is plausible: (1) minimum pay should be below average pay, (2) maximum
pay should be above average pay, (3) median pay should be below average pay, (4) prevailing
wages should be within 25% of average pay, (5) earnings should be above wages, and (6) the
number of working days per month is at least 20 and at most 30.4 days (the average number
of days in a month).12 If any of the estimated data correction factors is deemed implausible
according to the above rules, then it is replaced by the estimated data correction factor for the
pooled sample of all countries and the remaining data corrections factors were reestimated.13.
Next we applied two additional rules taking into account that the reestimated data
correction factor for both sexes should be a weighted average of the data correction factors for
males and females and that female wages are typically lower than male wages. In particular, if
both female and male wages are estimated to be below the adult wages (wages for both
sexes), then the (implausible) negative data correction factor for male wages (relative to adult
wages) is set equal to zero (which would be a lower bound). And if both female and male
wages are estimated to be above adult wages, then the (implausible) positive data correction
14

factor for female wages (relative to wages for both sexes) is set equal to zero (which would be
an upper bound).
We also distinguish a fourth type of standard(ized) wage namely wages which are
corrected using exclusively the estimated data correction factors for the pooled sample of all
countries (hence not country-specific). This type of standardized wages corresponds to the
standardization variant 2 in Freeman and Oostendorp (2000, Table A.1) and is therefore
included for comparison.
It should be noted that for each of the standardized data there is an issue of how to
treat multiple wage observations within a given country, occupation, and year. Countries
often report wages in different format (for instance male and female wages or for different
regions) and therefore we have often multiple estimated standard wages for a given country,
occupation and year. Following Freeman and Oostendorp (2000) and Oostendorp (2005), we
use two types of weighting schemes. First, we use uniform weighting which gives an equal
weight of the reciprocal of the number of wage observations reported within a country,
occupation and year. Second, we use lexicographic weighting, which gives weight equal to
one to the wage observation that is reported in standard format and zero to others.14 If no
standard wage is reported, then uniform weights are assigned. It can be shown that
lexicographic weighting is most efficient if there is much uncertainty in the data type
correction terms and uniform weighting is most efficient if there is much measurement error
in the reported wage data. Table 4 summarizes the different standardized data that we have
calculated.
Table 4. Sources of data for different types of standardized data
type 1 type 2 type 3 type 4data reported in standard format yes yes yes yesdata corrected with country-specific correction factors no yes yes nodata corrected with average correction factors no no yes yes
Tables B1 and B2 in Appendix B report the estimated data correcting factors for
respectively hourly and monthly wages for the different countries in the 1983-2008 ILO
October Inquiry. Naturally no correction factor was estimated for data types that were not
reported (indicated by a dot). Correction factors in italics are imputed data correction factors,
either because the country-specific correction factor could not be estimated, the data type was
sparsely reported, or because the estimate was implausible.
15
We have not attempted to estimate data correction factors for the coverage of the
wage data to estimate the difference in wages reported for the whole country and for part of
the country. The reason for this omission is that regional coverage varies mostly across time,
and therefore its impact on wages is mostly unidentified.
Because the data correction factors were estimated for log wages, they indicate that
the reported wages of the corresponding data type deviate from the standard data type by the
factor exp(estimated data correction factor) or by (exp(estimated data correction factor)-
1)x100%.
As an example, the first row of Table B1 shows that for Antigua and Barbuda
(y1=AG) it is estimated that hourly earnings are 5 percent higher than wage rates, that males
earn 3 percent more than adult workers (both sexes) while female workers earn 5 percent less,
that minimum wages are 27 percent below average wages, that prevailing wages are 1 percent
lower than average wages, and that maximum wages are 30 percent higher than average
wages in the 1983-2008 period. For Antigua and Barbuda all data correction factors could be
estimated, but for instance for Anguilla (y1=AI, see the second row of Table B1) only the
data correction factor for female wages could be plausibly estimated. The estimated data
correction factor for male wages was negative and therefore implausible (given that the
estimated data correction factor for female wages was also negative) and set equal to zero
(and in italics). The data correction factors for minimum, prevailing and maximum wages
could not be estimated because of lack of variation in the data and were set equal to the data
correction factors as estimated across all countries is reported (in italics).
It is clear that the estimated correction factors vary widely across countries,
underlining the need for estimating country-specific correction factors unlike in Freeman and
Oostendorp (2000, 2001).
16

The standardized data
Appendix A provides the codes for the variables in the standardized data set. The
standardized data set includes wage observations both in local currency units (LCUs) and in
US dollars. Also the dataset includes a conversion factor for countries that have revalued their
currency (e.g. because of hyperinflation) or which have introduced a new currency in the
1983-2008 period. For instance, for countries that have adopted the Euro, a conversion factor
is included which can be used to multiply the wage observations in LCUs to create a smooth
series in Euros throughout the 1983-2008 period.
The means, standard deviation, minimum and maximum of the standardized data of
four types is reported in Panels A and B (respectively hourly and monthly wages) in Table 5.
The reported numbers are for lexicographic weighting but the numbers are virtually the same
if uniform weighting is applied.
The first type of standardized data consists of only those wage observations that have
been reported in the standard format.15 Panels A and B show that there are around 24,000
standard hourly and monthly wage observations (in 124 countries) with mean wage rates
equal to 4.45 US $ respectively 739 US$.
The second type of standardized data also includes the wages that could be corrected with
(only) country-specific data correction factors. This increases the number of wage
observations to around 65,000 and 55,000 observations (in 129 countries) for respectively
hourly and monthly wages, with mean wage rates equal to 4.86 US $ respectively 903 US$.
Table 5. Descriptive statistics of standardized data (lexicographic weighting).
Number of observations
Mean wage(in US $)
Standard deviation
Minimum Maximum
Panel A: Hourly wages type 1 24,620 4.45 6.35 0.03 124.52 type 2 65,502 4.86 6.54 0.02 124.52 type 3 125,018 4.88 6.70 0.02 205.39 type 4 125,018 4.87 6.63 0.02 195.38
Panel B: Monthly wages type 1 24,087 739.48 983.49 6.36 21583.96 type 2 55,608 902.63 1119.25 4.42 21583.96 type 3 125,018 821.45 1085.52 3.02 27625.98 type 4 125,018 821.59 1073.47 3.02 26157.25Note: the mean wages in US $ have been calculated on slightly smaller number of observations because of non-available exchange rates (for hourly respectively monthly wages: 23,641 and 23,108 for type 1, 63,989 and 54,095 for type 2, and 123,464 and 123,464 for types 3 and 4; )
17

The third type of standardized data also includes wage observations that could only be
corrected using average (non-country-specific) data correction factors (next to country-
specific data correction factors). This gives around 125,000 hourly and monthly wage
observations (in 171 countries) with mean hourly and monthly wages of 4.88 US $
respectively 821 US $. The fourth and last type of standardized data is based on average data
correction factors which gives also around 125,000 hourly and monthly wage observations
with mean hourly and monthly wages of 4.87 US $ respectively 822 US$.
The following table gives the pairwise correlations of the four types of standardized
wages across all countries / occupations / years for hourly wages.
Table 6. Pairwise correlations of standardized hourly wages.
type 1 type 2 –wu type 3 –wu type 4 –wu type 2 –wl type 3 –wl type 4 –wltype 1 1.0000type 2 –wu 0.9998 1.0000type 3 –wu 0.9998 1.0000 1.0000type 4 –wu 0.9997 0.9999 0.9999 1.0000type 2 –wl 1.0000 0.9998 0.9998 0.9997 1.0000type 3 –wl 1.0000 0.9998 0.9998 0.9997 1.0000 1.0000type 4 –wl 1.0000 0.9998 0.9998 0.9997 1.0000 1.0000 1.0000Note: wu = uniform weighting, wl = lexicographic weighting.
The above table shows that the different standardization methods give similar results,
with correlations above 0.99. Similar strong correlations are found between wages converted
to US$ and for monthly wages. This is reassuring as a high correlation suggests that the
choice of the exact standardization procedure has little effect on the outcome.
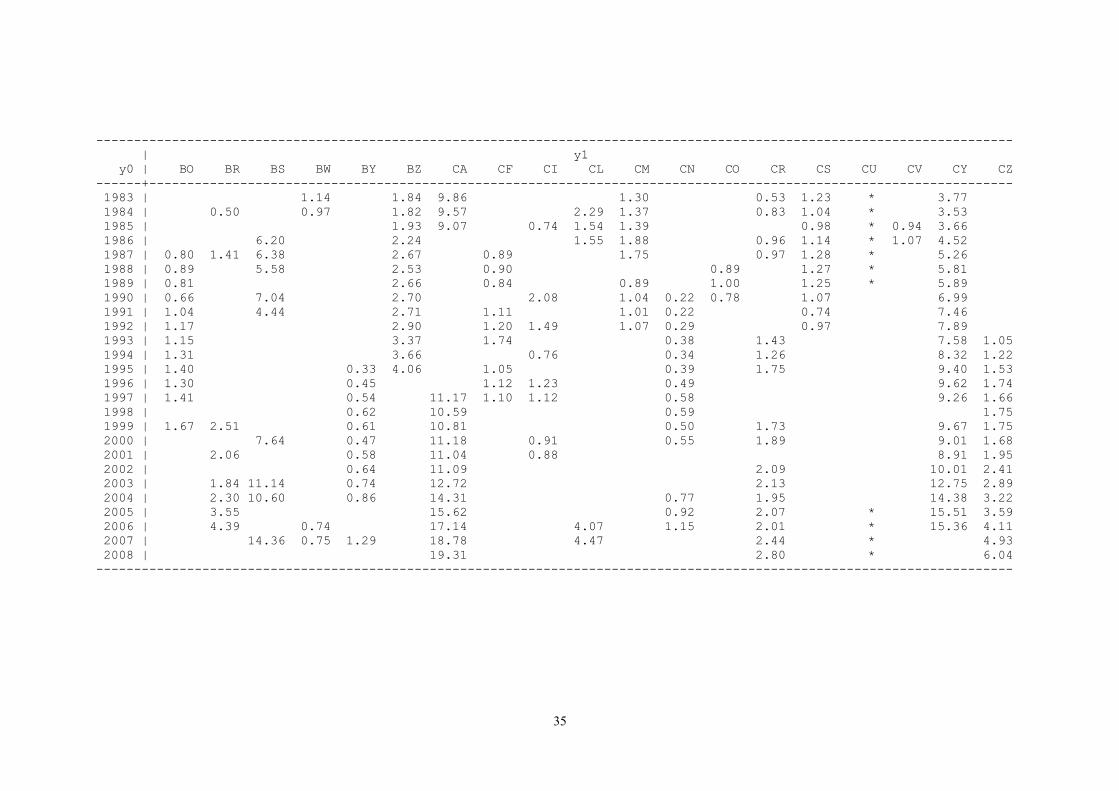
Tables C1 and C2 in appendix C summarize the data for each country and year for
respectively hourly and monthly wages. The reported wages are expressed in US $ and based
on the type 3 standardization. In a few instances we were unable to transform the wages in US
$ because of missing exchange rates in the IMF IFS (indicated by *). It should be noted that
part of the reason why average wages vary across time within a country is that wages have
been reported for different occupations at different points in time.
18

References
Freeman, R.B. and R.H. Oostendorp (2000): “Wages Around the World: Pay Across
Occupations and Countries”, NBER Working Paper no. 8058.
Freeman, R.B. and R.H. Oostendorp (2001): “The Occupational Wages around the World
Data File”, ILO Labour Review, 2001, Fall Issue.
Oostendorp, R.H. (2005): "The Standardized ILO October Inquiry 1983-2003', http://www.nber.org/oww/Technical_document_1983-2003_standardizationv3.pdf
Oostendorp, R.H (2009): “Globalization and the Gender Wage Gap”, World Bank Economic Review, 23(1), pp.141-61.
19

Appendix A. Codes for standardized ILO October Inquiry Database 1983-2003
y0: year
y1: country code (from ILO October Inquiry)AG Antigua and Barbuda AI Anguilla AN Netherlands Antilles AO Angola AR Argentina AS American Samoa AT Austria AU Australia AZ Azerbaijan BB Barbados BD Bangladesh BE Belgium BF Burkina Faso BG Bulgaria BH Bahrain BI Burundi BJ Benin BM Bermuda BN Brunei BO Bolivia BR Brazil BS Bahamas BW Botswana BY Belarus BZ Belize CA Canada CF Central African Republic CI Ivory Coast CL Chile CM Cameroon CN China CO Colombia CR Costa Rica CS Czechoslovakia CU Cuba CV Cape Verde CY Cyprus CZ Czech Republic DC Dominica DE Germany DJ Djibouti DK Denmark DO Dominican Republic DZ Algeria EE Estonia EG Egypt ER Eritrea ET Ethiopia FI Finland FJ Fiji FK Falkland Islands (Malvinas) FR France GA Gabon GB United Kingdom GD Grenada GF French Guyana GH Ghana GI Gibraltar GP Guadeloupe GQ Guinea Ecuatorial GR Greece GT Guatemala GU GuamGX Gambia GY British Guyana HK Hong Kong HN Honduras HR Croatia HT Haiti HU Hungary
20

ID Indonesia IE Ireland IL Israel IM Isle of Man IN India IR Iran, Islamic Republic of IS Iceland IT Italy JO Jordan JP Japan KE Kenya KG Kyrgyzstan KH Cambodia KM Comoros KN St Kitts and Nevis KR Korea, Republic of KW Kuwait KZ Kazachstan LC St Lucia LK Sri Lanka LR Liberia LS Lesotho LT Lithuania LU Luxembourg LV Latvia MD Moldova MG Madagascar ML Mali MM Myanmar MN Mongolia MO Macau, China MQ Martinique MT Malta MU Mauritius MV Maldives MW Malawi MX Mexico MY Malaysia MZ Mozambique NA Namibia NC New Caledonia NE Niger NG Nigeria NI Nicaragua NL Netherlands NO Norway NP Nepal NZ New Zealand PE Peru PF French Polynesia PG Papua New Guinea PH Philippines PK Pakistan PL Poland PM St Pierre and Miquelon PR Puerto Rico PS West Bank and Gaza strip PT Portugal RO Romania RU Russian Federation (before 9.91: USSR) RW Rwanda SB British Solomon Islands SC Seychelles SD Sudan SE Sweden SG Singapore SH Saint Helena SI Slovenia SK Slovakia SL Sierra Leone SM Samoa SN Senegal SR Surinam SV El Salvador SW Switzerland SY Syria (United Arab Republic) SZ Swaziland
21

TD Chad TG Togo TH Thailand TJ Tajikistan TN Tunisia TO Tonga TR Turkey TT Trinidad and Tobago TW Taiwan TZ Tanzania UA Ukraine UG Uganda US United States UY Uruguay VC St Vincent and the Grenadines VE Venezuela VG Virgin Islands (British) VI Virgin Islands (US) YA Yemen YU Yugoslavia ZA South Africa ZM Zambia ZR Zaire ZW Zimbabwe
country: country code (from World Development Indicators)
y3: industry codeAA Agricultural production (field crops)AB PlantationsAC ForestryAD LoggingAE Deep-sea and coastal fishingBA CoalminingBB Crude petroleum and natural gas productionBC Other mining and quarryingCA Slaughtering, preparing and preserving meatCB Manufacture of dairy productsCG Grain mill productsCH Manufacture of bakery productsDA Spinning, weaving and finishing textilesDB Manufacture of wearing apparel (except footwear)DC Manufacture of leather and leather products (except footwear)DD Manufacture of footwearEA Sawmills, planing and other wood millsEB Manufacture of wooden furniture and fixturesFA Manufacture of pulp, paper and paperboardFB Printing, publishing and allied industriesGA Manufacture of industrial chemicalsGB Manufacture of other chemical productsGC Petroleum refineriesIA Iron and steel basic industriesJA Manufacture of metal products (except machinery and equipment)JB Manufacture of machinery (except electrical)JC Manufacture of electronic equipment, machinery and suppliesJD Shipbuilding and repairingKA Electric light and powerLA ConstructionMA Wholesale trade (grocery)MB Retail trade (grocery)MC Restaurants and hotelsNA Railway transportNB Passenger transport by roadNC Freight transport by roadND Maritime transportNE Supporting services to maritime transportNF Air transportNG Supporting services to air transportNH CommunicationOA BanksOB InsuranceOC Engineering and architectural servicesPA Public administrationPB Sanitary servicesPC Education servicesPD Medical and dental services
22
PF Repair of motor vehicles
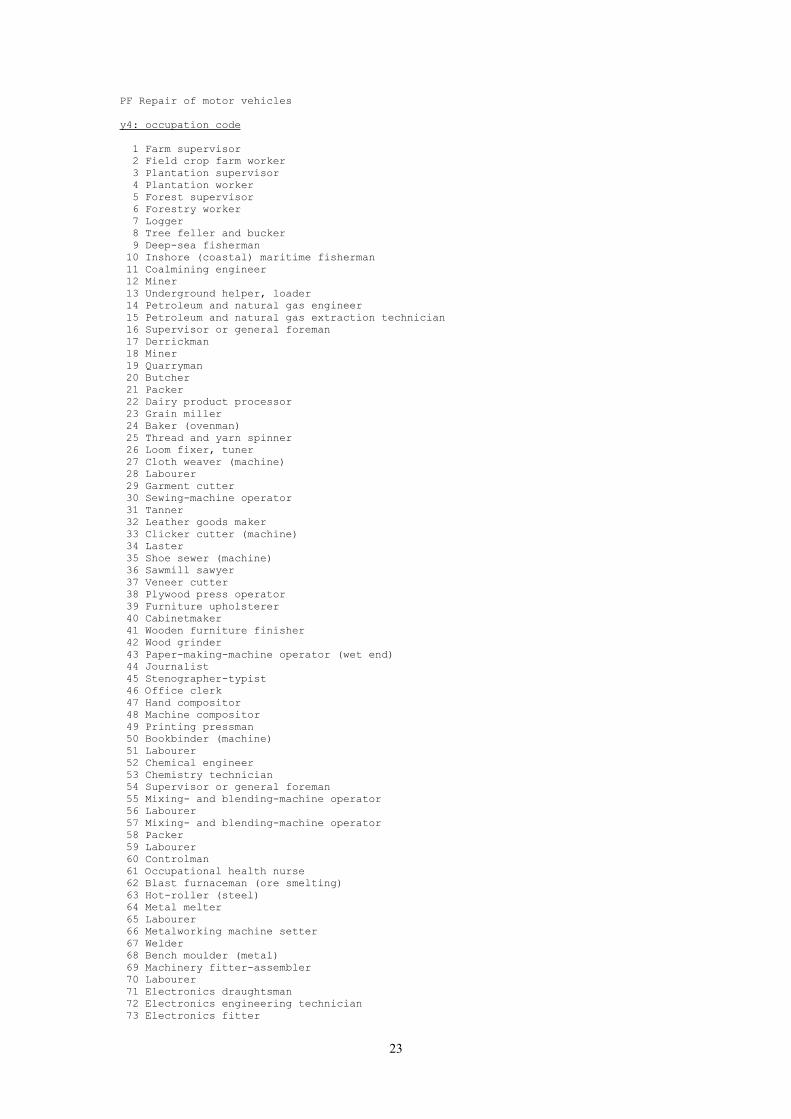
y4: occupation code
1 Farm supervisor 2 Field crop farm worker 3 Plantation supervisor 4 Plantation worker 5 Forest supervisor 6 Forestry worker 7 Logger 8 Tree feller and bucker 9 Deep-sea fisherman 10 Inshore (coastal) maritime fisherman 11 Coalmining engineer 12 Miner 13 Underground helper, loader 14 Petroleum and natural gas engineer 15 Petroleum and natural gas extraction technician 16 Supervisor or general foreman 17 Derrickman 18 Miner 19 Quarryman 20 Butcher 21 Packer 22 Dairy product processor 23 Grain miller 24 Baker (ovenman) 25 Thread and yarn spinner 26 Loom fixer, tuner 27 Cloth weaver (machine) 28 Labourer 29 Garment cutter 30 Sewing-machine operator 31 Tanner 32 Leather goods maker 33 Clicker cutter (machine) 34 Laster 35 Shoe sewer (machine) 36 Sawmill sawyer 37 Veneer cutter 38 Plywood press operator 39 Furniture upholsterer 40 Cabinetmaker 41 Wooden furniture finisher 42 Wood grinder 43 Paper-making-machine operator (wet end) 44 Journalist 45 Stenographer-typist 46 Office clerk 47 Hand compositor 48 Machine compositor 49 Printing pressman 50 Bookbinder (machine) 51 Labourer 52 Chemical engineer 53 Chemistry technician 54 Supervisor or general foreman 55 Mixing- and blending-machine operator 56 Labourer 57 Mixing- and blending-machine operator 58 Packer 59 Labourer 60 Controlman 61 Occupational health nurse 62 Blast furnaceman (ore smelting) 63 Hot-roller (steel) 64 Metal melter 65 Labourer 66 Metalworking machine setter 67 Welder 68 Bench moulder (metal) 69 Machinery fitter-assembler 70 Labourer 71 Electronics draughtsman 72 Electronics engineering technician 73 Electronics fitter
23
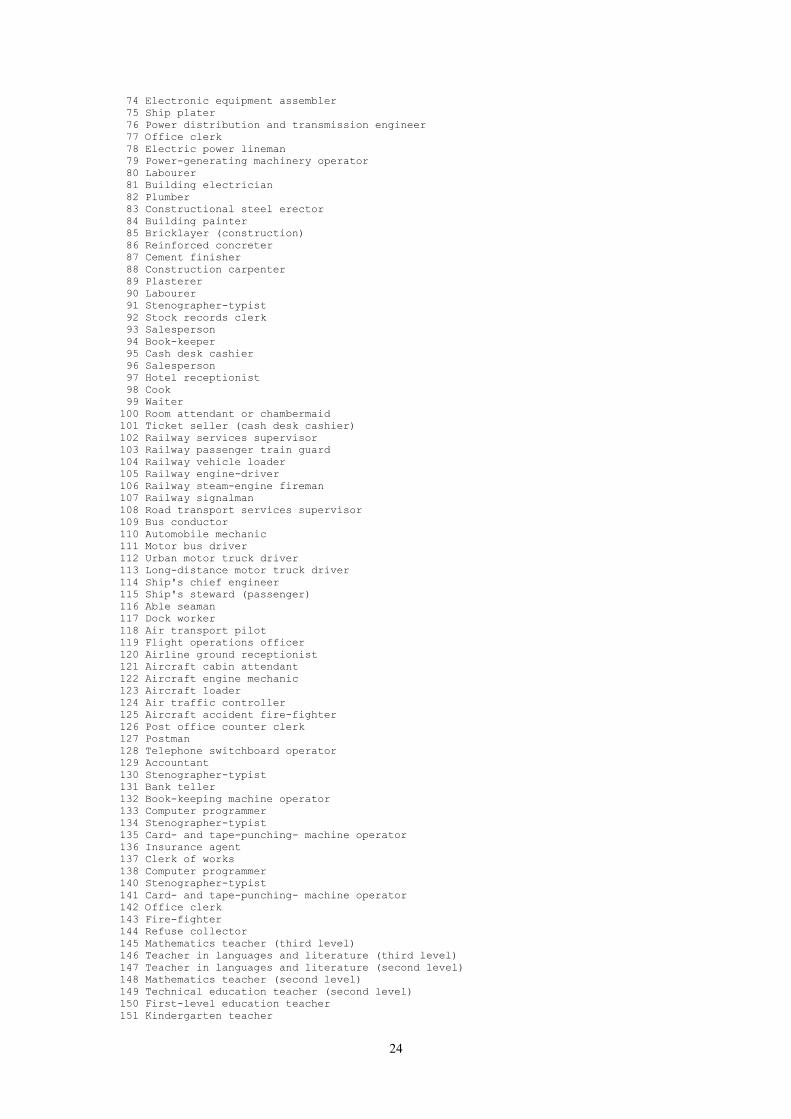
74 Electronic equipment assembler 75 Ship plater 76 Power distribution and transmission engineer 77 Office clerk 78 Electric power lineman 79 Power-generating machinery operator 80 Labourer 81 Building electrician 82 Plumber 83 Constructional steel erector 84 Building painter 85 Bricklayer (construction) 86 Reinforced concreter 87 Cement finisher 88 Construction carpenter 89 Plasterer 90 Labourer 91 Stenographer-typist 92 Stock records clerk 93 Salesperson 94 Book-keeper 95 Cash desk cashier 96 Salesperson 97 Hotel receptionist 98 Cook 99 Waiter100 Room attendant or chambermaid101 Ticket seller (cash desk cashier)102 Railway services supervisor103 Railway passenger train guard104 Railway vehicle loader105 Railway engine-driver106 Railway steam-engine fireman107 Railway signalman108 Road transport services supervisor109 Bus conductor110 Automobile mechanic111 Motor bus driver112 Urban motor truck driver113 Long-distance motor truck driver114 Ship's chief engineer115 Ship's steward (passenger)116 Able seaman117 Dock worker118 Air transport pilot119 Flight operations officer120 Airline ground receptionist121 Aircraft cabin attendant122 Aircraft engine mechanic123 Aircraft loader124 Air traffic controller125 Aircraft accident fire-fighter126 Post office counter clerk127 Postman128 Telephone switchboard operator129 Accountant130 Stenographer-typist131 Bank teller132 Book-keeping machine operator133 Computer programmer134 Stenographer-typist135 Card- and tape-punching- machine operator136 Insurance agent137 Clerk of works138 Computer programmer140 Stenographer-typist141 Card- and tape-punching- machine operator142 Office clerk143 Fire-fighter144 Refuse collector145 Mathematics teacher (third level)146 Teacher in languages and literature (third level)147 Teacher in languages and literature (second level)148 Mathematics teacher (second level)149 Technical education teacher (second level)150 First-level education teacher151 Kindergarten teacher
24

152 General physician153 Dentist (general)154 Professional nurse (general)155 Auxiliary nurse156 Physiotherapist157 Medical X-ray technician158 Ambulance driver159 Automobile mechanic160 Government executive official – central161 Government executive official – regional or provincial 162 Government executive official – local authority
Hourly wages in local currency units (LCUs):
hw1: wage reported in standard format in raw data (type 1)hw2wu: wage with country-specific calibration (type 2, uni weighting)hw3wu: wage with country-specific and uniform calibration (type 3, uni weighting)hw4wu: wage with uniform calibration (type 4, uni weighting)hw2wl: wage with country-specific calibration (type 2, lex weighting)hw3wl: wage with country-specific and uniform calibration (type 3, lex weighting)hw4wl: wage with uniform calibration (type 4, lex weighting)
Hourly wages in US $:
hw1us: wage reported in standard format in raw data (type 1)hw2wuus: wage with country-specific calibration (type 2, uni weighting)hw3wuus: wage with country-specific calibration (type 3, uni weighting)hw4wuus: wage with country-specific and uniform calibration (type 4, uni weighting)hw2wlus: wage with country-specific and uniform calibration (type 2, lex weighting)hw3wlus: wage with uniform calibration (type 3, lex weighting)hw4wlus: wage with uniform calibration (type 4, lex weighting)
Monthly wages in local currency units (LCUs):
mw1: wage reported in standard format in raw data (type 1)mw2wu: wage with country-specific calibration (type 2, uni weighting)mw3wu: wage with country-specific and uniform calibration (type 3, uni weighting)mw4wu: wage with uniform calibration (type 4, uni weighting)mw2wl: wage with country-specific calibration (type 2, lex weighting)mw3wl: wage with country-specific and uniform calibration (type 3, lex weighting)mw4wl: wage with uniform calibration (type 4, lex weighting)
Monthly wages in US $:
mw1us: wage reported in standard format in raw data (type 1)mw2wuus: wage with country-specific calibration (type 2, uni weighting)mw3wuus: wage with country-specific calibration (type 3, uni weighting)mw4wuus: wage with country-specific and uniform calibration (type 4, uni weighting)mw2wlus: wage with country-specific and uniform calibration (type 2, lex weighting)mw3wlus: wage with uniform calibration (type 3, lex weighting)mw4wlus: wage with uniform calibration (type 4, lex weighting)
currency: currency as reported in ILO October Inquiry
exrt: exchange rate (LCU per US$)
conv: conversion factor for wages in LCUs
curr_conv: currency used for conversion factor
25

Appendix B. Estimated data correction factors
Table B1. Estimated data correction factors for 1983-2008, hourly wagesCountry Earnings Males Females Median Minimum Prevailing MaximumAG 0.05 0.03 -0.05 . -0.31 -0.01 0.26AI . 0.00 -0.06 . -0.16 -0.01 0.25AN 0.08 0.01 -0.15 . -0.16 -0.01 .AO . . . -0.06 -1.04 -0.01 .AR 0.36 0.03 . . -0.06 0.01 .AS 0.13 0.00 -0.37 . -0.16 . 0.25AT 0.16 0.00 -0.03 . -0.10 0.06 0.11AU 0.05 0.08 -0.05 . -0.13 . .AZ 0.14 0.00 -0.30 . . . .BB . 0.00 -0.01 . -0.19 0.00 0.17BD 0.40 0.02 -0.25 . -0.16 . .BE . 0.03 -0.12 . -0.06 -0.11 .BF 0.23 -0.01 0.03 . -0.16 -0.12 0.25BG 0.00 0.01 -0.06 . . . .BH . 0.04 0.00 . . 0.17 .BI 0.19 -0.04 . . . . .BJ 0.18 0.06 0.00 . -0.03 0.09 0.36BM 0.13 0.03 -0.12 -0.16 -0.16 0.00 0.00BN 0.04 0.06 -0.05 . . . .BO 0.18 0.00 -0.19 . . -0.18 .BR 0.29 0.05 -0.14 . . . .BS 0.13 0.12 -0.01 . -0.16 . 0.43BW 0.13 . . . -0.16 . .BY 0.36 0.00 -0.13 . . . .BZ . 0.00 -0.14 . -0.34 0.05 0.19CA 0.13 0.03 -0.12 . . -0.01 .CF 0.13 0.03 -0.12 . -0.19 -0.08 .CI 0.13 0.03 . . -0.16 . 0.23CL 0.13 0.00 -0.08 . . . .CM . -0.01 0.00 . -0.12 0.01 .CN . 0.03 -0.12 . . . .CO . 0.21 0.00 . -0.52 -0.20 .CR 0.06 0.00 -0.12 . -0.21 0.07 .CS 0.08 0.00 -0.08 . . . .CU 0.22 0.02 0.00 . -0.25 -0.01 .CV . 0.03 -0.12 . . -0.01 .CY 0.03 0.09 -0.13 . . . .CZ 0.13 0.07 -0.10 . . . .DC . 0.03 -0.12 . . . .DE 0.16 0.04 -0.07 . -0.16 . .DJ . 0.03 -0.12 . -0.16 -0.01 .DK 0.09 0.03 -0.06 . . -0.06 .DO . 0.03 -0.12 . -0.16 -0.01 .DZ 0.13 1.05 -0.12 . -0.16 . 0.25EE 0.05 0.00 -0.17 . . 0.01 .EG 0.13 0.24 0.00 . . . .ER 0.03 0.00 -0.26 -0.06 -0.16 . 0.25ET . -0.18 . . . -0.01 .FI 0.13 0.00 -0.13 . . -0.01 .FJ 0.02 0.03 . . . -0.01 .FK 0.13 0.03 0.00 . -0.16 0.08 0.27
26

FR 0.13 0.03 -0.12 . . . .GA 0.20 0.02 -0.06 . -0.16 -0.27 0.25GB 0.02 0.03 -0.11 . -0.16 -0.01 .GD . 0.00 -0.10 . -0.16 . 0.15GF . . . . -0.04 -0.04 0.25GH 0.07 0.03 -0.12 . . . .GI 0.01 0.01 -0.23 . . . .GP . 0.03 -0.12 . -0.16 -0.01 .GQ . 0.03 -0.12 . -0.16 . .GR . 0.03 -0.12 . . . .GT 0.22 0.02 -0.15 . . . .GU 0.00 0.03 -0.12 . . 0.00 .GX . 0.03 -0.12 . . -0.01 .GY 0.05 0.02 -0.01 . -0.16 -0.01 0.25HK 0.20 0.03 -0.06 . -0.16 . 0.25HN 0.06 0.02 -0.09 . -0.16 -0.26 .HR 0.13 . . . . . .HT 0.14 -0.02 0.01 . . . .HU 0.08 0.03 -0.12 . . . .ID 0.13 0.05 -0.23 . -0.61 . .IE 0.13 0.00 -0.09 . -0.16 -0.01 .IL . 0.03 -0.12 . -0.16 -0.01 .IM 0.01 0.00 -0.07 . -0.23 -0.03 0.04IN 0.13 0.02 -0.12 . -0.26 -0.01 0.40IR . . . . . . .IS 0.12 0.06 -0.12 . -0.22 . .IT . 0.03 -0.12 . -0.06 -0.07 .JO 0.13 0.02 -0.11 . . . .JP 0.13 0.02 -0.37 . . . .KE . 0.03 -0.12 . . . .KG 0.10 0.00 -0.04 . . . .KH . 0.03 . . -0.16 . .KM 0.32 0.12 -0.06 . -0.16 -0.11 0.95KN . 0.00 -0.04 . -0.15 -0.07 0.32KR 0.19 0.13 -0.27 . . . .KW 0.08 0.03 -0.12 . . . .KZ . 0.07 -0.09 . . . .LC 0.13 0.00 -0.08 . -0.24 0.00 0.22LK 0.13 0.00 -0.27 . . . .LR 0.00 0.16 -0.12 . . . .LS 0.13 0.29 0.00 . -0.16 0.05 0.25LT 0.03 0.06 -0.06 . . . .LU 0.04 0.03 -0.11 . . . .LV 0.01 0.04 -0.08 . . . .MD 0.30 0.03 -0.12 . . . .MG 0.13 0.06 0.00 . -0.16 . 0.25ML 0.14 0.04 0.00 . -0.10 -0.12 0.25MM . -0.02 . . -0.16 0.05 .MN 0.13 . -0.12 . . . .MO 0.17 0.01 -0.14 . . . .MQ . 0.03 . . -0.16 . .MT . 0.03 -0.12 . . . .MU 0.03 0.00 -0.13 . -0.34 . 0.16MV 0.13 0.03 -0.12 . -0.16 -0.01 0.15MW 0.07 0.00 -0.11 . -0.16 . .
27

MX 0.24 0.44 0.00 . 0.00 . .MY 0.17 0.11 -0.08 . -0.20 -0.03 0.87MZ . 0.03 -0.12 . -0.16 0.07 .NA . 0.03 -0.12 . -0.16 -0.01 0.25NC 0.00 0.03 -0.12 . -0.16 . .NE . 0.04 -0.12 . -0.16 -0.25 0.25NG 0.32 0.00 -0.19 . -0.16 -0.01 .NI . 0.18 -0.12 . . . .NL . 0.00 -0.02 . -0.16 -0.14 0.05NO 0.39 0.06 -0.00 . . . .NP . 0.00 -0.14 . -0.57 -0.01 0.25NZ . 0.00 -0.08 . -0.16 -0.14 0.25PE 0.08 0.06 -0.04 . -0.15 -0.09 .PF . 0.06 . . -0.32 . .PG 0.03 0.00 -0.03 . -0.16 -0.01 .PH . 0.02 -0.10 . -0.16 0.03 0.18PK 0.10 0.03 -0.12 . -0.16 0.13 0.25PL 0.13 0.03 -0.10 . . . .PM 0.13 0.04 -0.12 . -0.16 -0.01 .PR 0.00 0.02 -0.04 . -0.26 . 0.01PS . 0.08 -0.11 . . . .PT 0.17 0.03 -0.09 . . . .RO 0.01 0.09 0.00 . . -0.01 .RU 0.30 0.08 -0.06 . . -0.01 .RW . 0.03 -0.12 . -0.16 . .SB 0.04 0.03 -0.12 . . . .SC 0.13 0.00 -0.02 . -0.16 0.07 .SD 0.05 -0.14 . -0.06 -0.45 0.05 0.10SE 0.15 0.04 -0.05 . -0.22 -0.01 0.25SG . 0.05 -0.09 . . . .SH . 0.04 -0.28 . -0.16 . 0.25SI 0.13 0.07 -0.00 . . . .SK 0.44 0.06 -0.09 . . . .SL . 0.09 0.00 . -0.22 0.03 .SM . . . . . -0.01 .SN . 0.03 -0.12 . -0.16 . .SR . 0.07 0.00 . -0.42 -0.20 0.22SV 0.06 0.08 0.00 -0.06 -0.23 -0.01 0.17SW . 0.03 -0.12 . -0.04 . 0.25SY . 0.03 . . . . .SZ . 0.00 -0.49 . -0.16 0.15 0.25TD 0.13 0.00 -0.01 . -0.05 -0.01 0.25TG . -0.01 0.14 . -0.66 -0.17 .TH 0.18 0.00 -1.19 . . . .TJ 0.40 0.03 -0.12 . -0.16 . .TN 0.13 0.03 . . -0.16 . 0.41TO 0.08 0.04 -0.11 . -0.16 -0.01 .TR 0.15 0.00 -0.24 . . . .TT . 0.00 -0.09 . -0.16 -0.01 .TW 0.13 . . . . . .TZ . . . . . -0.01 .UA . . . . . . .UG . 0.03 -0.12 . -0.16 -0.01 0.25US 0.04 0.08 -0.08 -0.10 . . .UY 0.19 . . . . . .
28

VC . . . -0.06 -0.38 . 0.05VE 0.19 0.00 -0.21 . -0.38 -0.20 .VG . 0.03 -0.12 . -0.16 -0.01 .VI . 0.03 -0.12 . . . .YA . 0.03 -0.12 -0.06 -0.16 -0.01 .YU 0.00 . . . . . .ZA 0.13 . . . . . .ZM . 0.06 0.00 . -0.18 0.13 0.26ZR 0.13 0.03 -0.12 . -0.16 -0.01 .ZW 0.19 0.00 -0.03 . -0.09 -0.01 .
29

Table B2. Estimated data correction factors for 1983-2008, monthly wagesCountry Earnings Males Females Daily Median Minimum Prevailing MaximumAG 0.05 0.03 -0.05 -3.27 . -0.31 -0.01 0.26AI . 0.00 -0.08 -3.27 . -0.16 -0.02 0.25AN 0.08 0.05 -0.11 . . -0.16 -0.02 .AO . . . . -0.05 -0.88 -0.02 .AR 0.36 0.03 . -3.22 . -0.04 0.00 .AS 0.14 0.00 -0.38 . . -0.16 . 0.25AT 0.20 0.01 -0.03 . . -0.10 0.02 0.12AU 0.10 0.09 -0.06 . . -0.14 . .AZ 0.13 0.00 -0.31 . . . . .BB . 0.00 -0.01 -3.11 . -0.20 -0.01 0.16BD 0.41 0.00 -0.28 -3.27 . -0.16 . .BE . 0.03 -0.13 . . -0.06 -0.10 .BF 0.23 0.00 -0.05 . . -0.16 -0.08 0.25BG 0.01 0.01 -0.07 . . . . .BH . 0.04 0.00 . . . 0.18 .BI 0.19 -0.05 . . . . . .BJ 0.18 -0.03 0.03 -3.27 . -0.07 0.09 0.32BM 0.14 0.03 -0.13 . -0.05 -0.16 -0.07 0.25BN 0.06 0.05 -0.05 . . . . .BO 0.18 0.10 0.00 . . . -0.23 .BR 0.26 0.05 -0.14 . . . . .BS 0.14 0.15 -0.02 . . -0.16 . 0.40BW 0.14 . . . . -0.16 . .BY 0.39 0.00 -0.14 . . . . .BZ . 0.00 -0.12 -3.39 . -0.35 -0.01 0.18CA 0.14 0.07 -0.15 . . . -0.02 .CF 0.14 0.03 -0.13 -3.27 . -0.15 -0.04 .CI 0.14 0.00 . -3.27 . -0.16 . 0.24CL 0.14 0.00 -0.08 . . . . .CM . 0.00 -0.04 . . -0.13 0.00 .CN . 0.03 -0.13 . . . . .CO . 0.19 0.00 -3.27 . -0.54 -0.22 .CR 0.02 0.01 -0.20 -3.27 . -0.20 0.05 .CS 0.08 0.01 -0.07 . . . . .CU 0.19 0.02 0.00 . . -0.14 -0.01 .CV . 0.03 -0.13 . . . -0.02 .CY 0.06 0.09 -0.13 . . . . .CZ 0.14 0.07 -0.10 . . . . .DC . 0.03 -0.13 . . . . .DE 0.18 0.05 -0.05 -3.13 . -0.16 . .DJ . 0.03 -0.13 . . -0.16 -0.02 .DK 0.10 0.00 -0.11 . . . -0.09 .DO . 0.03 -0.13 . . -0.16 -0.02 .DZ 0.14 1.04 -0.13 . . -0.16 . 0.25EE 0.14 0.00 -0.20 . . . 0.16 .EG 0.14 0.06 -0.12 . . . . .ER 0.03 0.00 -0.30 -3.03 -0.05 -0.16 . 0.25ET . -0.17 . . . . -0.02 .FI 0.13 0.00 -0.11 -3.27 . . -0.02 .FJ 0.02 0.03 . . . . -0.02 .FK 0.14 0.06 0.00 . . -0.16 0.08 0.30FR 0.14 0.03 -0.13 . . . . .GA 0.18 0.02 -0.09 . . -0.16 -0.24 0.25
30

GB 0.09 0.04 -0.13 . . -0.16 -0.02 .GD . 0.00 -0.08 -3.11 . -0.17 . 0.14GF . . . -3.27 . -0.02 -0.02 0.25GH 0.07 0.03 -0.13 -3.27 . . . .GI 0.01 0.01 -0.23 . . . . .GP . 0.03 -0.13 . . -0.16 -0.02 .GQ . 0.03 -0.13 . . -0.16 . .GR . 0.03 -0.13 . . . . .GT 0.11 0.04 -0.14 . . . . .GU 0.00 0.03 -0.13 . . . 0.00 .GX . 0.03 -0.13 . . . -0.02 .GY 0.03 0.05 0.00 -3.26 . -0.16 -0.02 0.25HK 0.20 0.04 -0.07 -3.24 . -0.16 . 0.25HN 0.06 0.01 -0.10 -3.15 . -0.16 -0.25 .HR 0.14 . . . . . . .HT 0.14 0.00 -0.18 . . . . .HU 0.08 0.03 -0.13 . . . . .ID 0.14 0.06 -0.29 -3.27 . -0.60 . .IE 0.14 0.01 -0.08 . . -0.16 -0.02 .IL . 0.03 -0.13 -3.27 . -0.16 -0.02 .IM 0.08 0.01 -0.05 . . -0.17 -0.02 0.10IN 0.14 0.05 -0.13 -3.32 . -0.20 -0.02 0.46IR . . . . . . . .IS 0.28 0.06 -0.12 . . -0.21 . .IT . 0.03 -0.13 . . -0.06 -0.13 .JO 0.14 0.02 -0.15 . . . . .JP 0.14 0.02 -0.37 -3.14 . . . .KE . 0.03 -0.13 . . . . .KG 0.19 0.00 -0.05 . . . . .KH . 0.03 . . . -0.16 . .KM 0.35 0.13 -0.05 -3.27 . -0.16 -0.09 0.96KN . 0.00 -0.03 -3.27 . -0.16 -0.08 0.30KR 0.31 0.13 -0.28 . . . . .KW 0.08 0.03 -0.13 . . . . .KZ . 0.07 -0.09 . . . . .LC 0.14 0.02 -0.05 -3.04 . -0.21 -0.01 0.25LK 0.14 0.00 -0.25 . . . . .LR 0.01 0.15 -0.13 -3.27 . . . .LS 0.14 0.29 0.00 -3.19 . -0.16 0.05 0.25LT 0.04 0.06 -0.07 . . . . .LU 0.04 0.03 -0.11 . . . . .LV 0.02 0.05 -0.08 . . . . .MD 0.28 0.03 -0.13 . . . . .MG 0.14 0.00 -0.05 . . -0.16 . 0.25ML 0.13 0.07 0.00 . . -0.04 -0.11 0.25MM . -0.02 . . . -0.16 0.06 .MN 0.14 . -0.13 . . . . .MO 0.17 0.01 -0.14 -3.27 . . . .MQ . 0.03 . -3.27 . -0.16 . .MT . 0.03 -0.13 . . . . .MU 0.09 0.01 -0.11 -3.27 . -0.28 . 0.23MV 0.14 0.03 -0.13 -3.27 . -0.16 -0.02 0.25MW 0.07 0.00 -0.13 . . -0.16 . .MX 0.22 0.42 0.00 -3.27 . -0.16 . .MY 0.13 0.12 -0.06 -3.27 . -0.23 -0.06 0.85
31

MZ . 0.03 -0.13 . . -0.16 0.07 .NA . 0.03 -0.13 . . -0.16 -0.02 0.25NC 0.14 0.03 -0.13 . . -0.16 . .NE . 0.06 -0.13 . . -0.13 -0.22 0.25NG 0.35 0.00 -0.21 -3.27 . -0.16 -0.02 .NI . 0.18 -0.13 . . . . .NL . 0.00 -0.01 . . -0.16 -0.14 0.06NO 0.38 0.06 -0.00 . . . . .NP . 0.00 -0.15 -3.27 . -0.54 -0.02 0.25NZ . 0.00 -0.08 -3.27 . -0.16 -0.14 0.25PE 0.10 0.05 -0.06 -3.27 . -0.11 -0.09 .PF . 0.19 . . . -0.27 . .PG 0.08 -0.08 0.06 . . -0.05 -0.02 .PH . 0.03 -0.10 -3.16 . -0.16 0.12 0.18PK 0.10 0.03 -0.13 -3.27 . -0.16 0.08 0.25PL 0.14 0.03 -0.11 . . . . .PM 0.01 0.03 -0.13 . . -0.03 -0.02 .PR 0.00 0.02 -0.04 . . -0.27 . 0.00PS . 0.08 -0.11 -3.27 . . . .PT 0.20 0.03 -0.09 -3.27 . . . .RO 0.04 0.09 0.00 . . . -0.02 .RU 0.31 0.09 -0.06 . . . -0.02 .RW . 0.03 -0.13 . . -0.16 . .SB 0.14 0.03 -0.13 . . . . .SC 0.14 0.01 -0.01 . . -0.16 0.07 .SD 0.21 -0.19 . . -0.05 -0.45 0.03 0.10SE 0.14 0.05 -0.03 . . -0.22 -0.02 0.25SG . 0.05 -0.09 . . . . .SH . 0.05 -0.10 -3.27 . -0.16 . 0.25SI 0.14 0.07 -0.00 . . . . .SK 0.31 0.07 -0.10 . . . . .SL . 0.09 0.00 -3.17 . -0.22 0.01 .SM . . . . . . -0.02 .SN . 0.03 -0.13 . . -0.16 . .SR . 0.09 0.00 -3.27 . -0.42 -0.19 0.23SV 0.14 0.06 0.00 -3.27 -0.05 -0.13 0.04 0.31SW . 0.03 -0.13 . . -0.04 . 0.25SY . 0.03 . -3.27 . . . .SZ . 0.00 -0.46 -3.27 . -0.16 0.18 0.25TD 0.07 -0.13 0.02 -3.27 . -0.13 -0.02 0.25TG . -0.05 0.11 . . -0.65 -0.17 .TH 0.18 0.00 -1.17 . . . . .TJ 0.39 0.03 -0.13 . . -0.16 . .TN 0.14 0.03 . -3.27 . -0.16 . 0.43TO 0.03 0.00 -0.20 . . -0.16 -0.02 .TR 0.17 0.00 -0.24 . . . . .TT . 0.00 -0.05 -3.27 . -0.16 -0.02 .TW 0.14 . . . . . . .TZ . . . . . . -0.02 .UA . . . . . . . .UG . 0.03 -0.13 -3.27 . -0.16 -0.02 0.25US 0.04 0.08 -0.08 . -0.10 . . .UY 0.19 . . . . . . .VC . . . -3.10 -0.05 -0.37 . 0.06VE 0.14 0.00 -0.18 -3.28 . -0.30 -0.02 .
32

VG . 0.03 -0.13 . . -0.16 -0.02 .VI . 0.03 -0.13 . . . . .YA . 0.03 -0.13 -3.27 -0.05 -0.16 -0.02 .YU 0.00 . . . . . . .ZA 0.14 . . . . . . .ZM . 0.06 0.00 -3.06 . -0.14 0.16 0.27ZR 0.14 0.03 -0.13 . . -0.16 -0.02 .ZW 0.19 0.00 -0.03 . . -0.07 -0.02 .
33

Appendix C
Table C1. Average hourly wage rates for adult workers in US $
------------------------------------------------------------------------------------------------------------------------- | y1 y0 | AG AI AN AO AR AS AT AU AZ BB BD BE BF BG BH BI BJ BM BN------+------------------------------------------------------------------------------------------------------------------ 1983 | 1.98 3.45 3.80 8.02 2.99 4.85 0.70 9.65 1984 | 6.14 5.21 2.69 3.55 8.34 3.31 0.14 4.68 4.63 0.53 0.61 9.59 1.41 1985 | 6.15 1.91 3.77 7.11 3.77 4.33 1.13 4.35 0.74 0.68 9.41 1986 | 0.66 3.52 4.56 5.40 7.13 4.17 0.22 5.77 1.42 0.75 1987 | 6.40 5.78 6.89 7.82 4.53 0.13 7.06 1.64 6.39 0.85 0.97 13.09 1988 | 3.99 6.51 7.17 7.22 9.38 4.95 0.22 7.33 1.26 8.37 0.79 0.61 15.47 1989 | 3.78 4.93 2.18 7.02 9.69 4.86 0.23 7.17 1.18 5.09 0.72 17.87 1990 | 3.28 4.11 8.54 9.32 4.98 0.22 8.86 1.34 1.03 5.36 0.65 1.03 17.70 1991 | 4.48 1.45 8.65 10.71 5.20 0.29 9.11 1.16 5.59 0.62 1.23 20.73 1992 | 3.72 3.59 9.70 10.25 5.27 0.29 10.06 5.24 0.54 21.53 1993 | 4.17 3.63 2.60 9.52 9.83 5.45 0.29 9.65 5.14 18.79 1994 | 4.33 3.96 2.67 10.06 10.94 5.46 10.23 5.47 21.60 1995 | 4.94 4.73 2.72 11.94 11.44 5.54 0.50 11.71 5.65 21.30 1996 | 4.62 4.92 2.16 11.58 12.71 0.29 0.49 11.35 5.56 22.03 1997 | 5.14 1.21 10.17 0.43 0.61 10.04 0.54 23.08 1998 | 5.14 0.75 10.28 11.06 0.46 0.58 10.10 0.54 6.24 1999 | 5.24 0.27 9.99 0.45 9.84 0.57 20.57 2000 | 5.50 8.75 11.02 0.42 8.79 0.49 7.04 25.61 2001 | 8.76 0.42 8.88 6.44 1.62 2002 | 3.18 3.99 8.80 11.14 0.61 9.61 0.78 7.27 1.60 2003 | 4.49 9.18 8.05 2004 | 4.93 16.52 0.83 13.28 2005 | 6.00 1.14 4.67 2006 | 7.12 19.08 1.55 4.36 2007 | 8.53 2.18 0.29 2008 | 10.29 2.82 --------------------------------------------------------------------------------------------------------------------------
34
------------------------------------------------------------------------------------------------------------------------- | y1 y0 | BO BR BS BW BY BZ CA CF CI CL CM CN CO CR CS CU CV CY CZ------+------------------------------------------------------------------------------------------------------------------ 1983 | 1.14 1.84 9.86 1.30 0.53 1.23 * 3.77 1984 | 0.50 0.97 1.82 9.57 2.29 1.37 0.83 1.04 * 3.53 1985 | 1.93 9.07 0.74 1.54 1.39 0.98 * 0.94 3.66 1986 | 6.20 2.24 1.55 1.88 0.96 1.14 * 1.07 4.52 1987 | 0.80 1.41 6.38 2.67 0.89 1.75 0.97 1.28 * 5.26 1988 | 0.89 5.58 2.53 0.90 0.89 1.27 * 5.81 1989 | 0.81 2.66 0.84 0.89 1.00 1.25 * 5.89 1990 | 0.66 7.04 2.70 2.08 1.04 0.22 0.78 1.07 6.99 1991 | 1.04 4.44 2.71 1.11 1.01 0.22 0.74 7.46 1992 | 1.17 2.90 1.20 1.49 1.07 0.29 0.97 7.89 1993 | 1.15 3.37 1.74 0.38 1.43 7.58 1.05 1994 | 1.31 3.66 0.76 0.34 1.26 8.32 1.22 1995 | 1.40 0.33 4.06 1.05 0.39 1.75 9.40 1.53 1996 | 1.30 0.45 1.12 1.23 0.49 9.62 1.74 1997 | 1.41 0.54 11.17 1.10 1.12 0.58 9.26 1.66 1998 | 0.62 10.59 0.59 1.75 1999 | 1.67 2.51 0.61 10.81 0.50 1.73 9.67 1.75 2000 | 7.64 0.47 11.18 0.91 0.55 1.89 9.01 1.68 2001 | 2.06 0.58 11.04 0.88 8.91 1.95 2002 | 0.64 11.09 2.09 10.01 2.41 2003 | 1.84 11.14 0.74 12.72 2.13 12.75 2.89 2004 | 2.30 10.60 0.86 14.31 0.77 1.95 14.38 3.22 2005 | 3.55 15.62 0.92 2.07 * 15.51 3.59 2006 | 4.39 0.74 17.14 4.07 1.15 2.01 * 15.36 4.11 2007 | 14.36 0.75 1.29 18.78 4.47 2.44 * 4.93 2008 | 19.31 2.80 * 6.04-------------------------------------------------------------------------------------------------------------------------
35

------------------------------------------------------------------------------------------------------------------------- | y1 y0 | DC DE DJ DK DO DZ EE EG ER ET FI FJ FK FR GA GB GD GF GH------+------------------------------------------------------------------------------------------------------------------ 1983 | 6.90 7.82 3.90 2.27 2.69 3.69 1984 | 2.35 6.37 7.32 1.15 5.83 2.14 1.27 1985 | 6.67 8.19 3.01 6.32 3.84 0.17 1986 | 9.39 10.94 3.30 8.27 2.59 4.64 2.09 1987 | 11.73 14.37 3.23 0.85 10.14 2.02 7.27 6.59 1988 | 12.34 14.46 2.64 0.93 11.81 1.68 8.55 6.57 1989 | 11.96 13.95 2.07 12.38 2.84 8.72 6.59 1990 | 14.65 17.28 2.03 0.40 15.15 10.22 7.80 1991 | 15.23 17.17 1.15 15.12 11.49 2.94 11.17 6.76 1992 | 16.99 18.67 1.26 0.33 13.60 10.26 3.97 11.85 1993 | 16.58 0.64 0.51 11.05 10.52 2.75 0.53 1994 | 17.28 0.92 0.37 0.74 12.39 10.76 2.75 1995 | 20.24 1.09 1.41 0.38 16.07 2.32 11.55 2.89 1996 | 19.55 3.00 1.08 1.00 1.54 0.34 13.96 11.77 1997 | 17.18 2.36 1.14 1.69 0.39 0.73 12.49 12.89 1998 | 17.26 1.28 0.37 12.52 13.68 1999 | 16.00 0.46 0.50 12.58 13.83 2000 | 15.08 0.57 0.43 11.21 18.18 13.36 2001 | 14.89 0.91 11.36 13.26 2002 | 16.00 1.13 12.48 14.88 2003 | 15.28 30.42 0.78 12.06 16.70 2004 | 21.63 33.51 0.85 17.53 18.82 2005 | 22.14 35.36 0.88 17.23 19.41 2006 | 22.75 37.56 0.88 18.06 20.52 0.20 2007 | 24.50 42.27 2.19 21.17 22.70 0.23 2008 | 26.88 2.35 21.84 -------------------------------------------------------------------------------------------------------------------------
36

------------------------------------------------------------------------------------------------------------------------- | y1 y0 | GI GP GQ GR GT GU GX GY HK HN HR HT HU ID IE IL IM IN IR------+------------------------------------------------------------------------------------------------------------------ 1983 | 4.80 1.72 0.48 1.10 2.26 1.22 0.37 4.64 3.05 4.62 0.31 1984 | 4.42 1.59 7.67 0.76 1.10 1.67 1.32 0.83 4.19 3.41 0.34 1985 | 4.16 0.30 1.27 8.00 1.93 1.53 0.35 4.29 0.25 1986 | 1.06 1.54 0.27 0.27 3.85 1987 | 5.62 8.58 2.93 1.63 0.87 0.21 6.72 0.29 1988 | 6.38 8.38 0.71 3.34 1.85 0.94 0.22 8.79 0.29 1989 | 6.17 5.23 8.75 3.86 0.21 0.34 1990 | 7.25 7.53 3.71 0.90 10.33 0.40 1991 | 7.64 7.38 4.26 0.73 0.36 0.32 1992 | 4.80 0.88 0.37 1.05 1993 | 5.25 0.64 0.26 1994 | 0.56 7.19 0.55 0.33 1995 | 0.40 7.79 0.64 1.62 0.38 1996 | 0.46 8.55 2.03 1.66 0.29 1997 | 1.01 0.54 9.48 1.11 1.54 0.37 1998 | 1.00 0.99 10.69 1.62 0.35 1999 | 1.00 9.99 1.79 0.36 2000 | 1.16 10.20 1.71 0.38 2001 | 10.23 1.89 0.16 2002 | 9.87 2.36 2003 | 1.94 9.98 3.13 2004 | 2.10 10.12 3.75 2005 | 9.58 4.12 0.59 2006 | 2.08 9.65 4.14 0.65 2007 | 3.37 9.49 5.28 0.36 2008 | 10.04 0.53 -------------------------------------------------------------------------------------------------------------------------
37

------------------------------------------------------------------------------------------------------------------------- | y1 y0 | IS IT JO JP KE KG KH KM KN KR KW KZ LC LK LR LS LT LU LV------+------------------------------------------------------------------------------------------------------------------ 1983 | 3.94 4.20 1.71 7.95 0.66 1.56 1.98 0.20 1.38 1984 | 4.10 1.68 5.58 1.13 1.94 1.50 2.23 0.22 1985 | 3.82 4.58 1.51 5.73 0.87 0.60 1.76 1.52 2.16 0.22 1986 | 4.78 6.14 1.74 8.52 0.71 1.59 2.23 0.16 1.18 1987 | 7.18 7.61 2.04 10.05 0.80 1.82 2.43 0.22 1988 | 8.66 8.05 1.73 10.96 2.38 2.65 0.30 1989 | 7.38 8.36 11.50 3.20 2.92 0.19 1.06 1990 | 7.77 9.80 11.63 3.64 3.20 0.21 1.30 1991 | 8.03 10.32 13.02 3.66 3.29 0.27 1992 | 8.58 11.64 0.95 13.92 0.85 3.72 0.29 1993 | 7.35 9.50 0.96 15.72 0.09 1.25 4.19 0.29 1994 | 7.07 9.42 1.05 0.22 0.10 4.66 0.36 1995 | 8.01 10.08 1.07 19.00 0.11 1.08 5.73 0.40 0.94 18.65 1996 | 8.22 11.05 16.49 0.10 1.18 6.08 0.37 1997 | 10.37 0.92 14.67 0.43 0.94 5.68 0.40 1.33 1998 | 10.66 10.44 1.18 13.90 0.28 0.34 1.09 3.88 0.40 1.51 1999 | 10.77 9.62 15.74 0.17 0.33 1.18 3.92 4.43 0.46 1.56 2000 | 10.23 8.95 16.77 0.33 4.13 5.28 0.43 1.57 1.59 2001 | 8.06 8.60 1.34 14.95 0.19 0.32 4.95 1.61 2002 | 10.36 9.31 1.23 13.78 0.20 5.65 0.88 1.68 15.29 1.72 2003 | 14.01 8.95 1.16 15.25 6.33 1.03 2.13 2004 | 16.20 12.94 16.27 6.73 6.50 1.26 2.48 2005 | 13.46 1.52 15.87 8.40 2.84 2006 | 20.33 13.89 1.64 15.11 9.84 3.50 22.26 3.40 2007 | 24.79 15.15 15.10 2008 | 18.84 16.61 17.15 -------------------------------------------------------------------------------------------------------------------------
38

------------------------------------------------------------------------------------------------------------------------- | y1 y0 | MD MG ML MM MN MO MQ MT MU MV MW MX MY MZ NA NC NE NG NI------+------------------------------------------------------------------------------------------------------------------ 1983 | 0.54 0.77 1.16 0.59 1.25 7.11 2.33 1984 | 1.79 0.98 0.56 0.66 1.24 0.62 1.44 1985 | 0.52 0.25 1.74 0.88 1.52 1986 | 0.68 0.30 1.13 2.08 0.64 1987 | 0.23 0.78 0.34 5.12 1.52 0.60 0.31 0.74 1988 | 0.77 0.41 1.52 0.99 0.36 1.60 1989 | 0.72 0.80 1.44 1.07 0.47 1990 | 0.80 0.85 2.29 1.62 0.66 1991 | 0.88 2.71 1.66 0.75 0.94 1992 | 0.91 2.10 1.77 0.75 0.61 1993 | 1.11 2.33 1.98 0.45 0.81 1.15 0.47 0.81 1994 | 0.19 0.23 1.13 0.11 4.56 2.21 0.29 0.80 0.54 1995 | 0.22 0.24 1.22 0.16 3.81 2.45 0.42 0.46 1.34 0.56 0.76 1996 | 0.25 1.17 2.55 0.63 0.47 5.40 0.79 1997 | 0.31 1.14 4.60 2.45 0.67 0.53 5.75 1.02 0.85 1998 | 0.27 0.23 1.12 4.36 2.31 0.53 0.53 3.43 0.79 1999 | 0.19 0.22 1.15 4.43 2.39 0.49 1.09 0.84 2000 | 0.19 0.22 4.83 4.20 2.31 0.56 1.34 0.86 2001 | 0.21 4.64 4.24 2.24 0.22 1.54 0.89 2002 | 0.30 4.82 4.31 2.25 0.33 1.62 0.90 2003 | 0.37 5.23 4.63 2.68 1.53 2004 | 0.53 5.52 5.20 2.86 1.52 2005 | 0.63 0.25 6.63 2.78 1.43 2006 | 0.75 41.81 7.49 2.73 1.48 2007 | 0.97 43.50 8.42 2.80 3.16 1.53 2008 | 1.30 8.36 3.46 3.98 1.56 -------------------------------------------------------------------------------------------------------------------------
39

------------------------------------------------------------------------------------------------------------------------- | y1 y0 | NL NO NP NZ PE PF PG PH PK PL PM PR PS PT RO RU RW SB SC------+------------------------------------------------------------------------------------------------------------------ 1983 | 5.36 5.50 0.37 4.19 0.51 1.92 0.39 0.39 4.11 4.50 0.78 2.05 1984 | 4.79 5.28 4.36 0.49 2.21 0.36 7.14 4.71 0.86 1.72 1985 | 4.91 5.42 4.31 0.49 0.17 7.72 7.28 0.67 0.77 0.85 1.81 1986 | 6.87 6.83 5.46 0.40 9.81 6.01 0.91 0.81 0.87 1987 | 8.47 7.81 7.40 1.47 9.91 0.40 12.22 6.58 1.12 1.08 1988 | 8.79 8.89 8.69 0.66 12.53 0.49 12.34 8.64 1.24 3.35 1.13 1989 | 8.36 8.73 8.30 12.22 0.57 10.33 6.62 1.30 2.93 1.08 1.83 1990 | 10.05 10.06 0.30 8.79 15.01 0.55 7.16 1.65 0.79 1.04 2.16 1991 | 10.02 8.64 1.55 0.57 14.36 7.65 1.90 0.91 * 0.69 2.32 1992 | 10.66 0.66 7.97 2.29 0.69 0.22 1993 | 9.43 1.17 3.87 0.67 8.02 2.04 0.96 0.70 1994 | 9.64 1.36 0.75 9.17 2.05 0.90 0.90 1995 | 11.15 2.02 2.61 0.85 9.10 0.94 0.94 1996 | 11.37 2.27 2.56 0.48 1.58 9.93 5.04 0.96 1997 | 10.76 2.29 1.23 8.81 4.51 0.83 1998 | 11.02 2.11 0.37 2.03 9.39 4.71 1.00 1999 | 10.72 1.85 1.11 0.39 2.44 9.84 4.71 0.89 0.39 2000 | 10.21 1.81 0.38 0.37 9.73 4.11 0.91 0.48 2001 | 11.57 1.88 1.11 0.32 2.63 10.67 0.94 2002 | 13.14 2.26 1.07 0.53 2.73 10.42 4.38 1.01 2003 | 14.54 1.04 0.58 10.09 4.20 1.22 1.21 2004 | 15.91 2.36 0.95 0.59 3.61 10.49 6.00 1.51 1.36 2005 | 18.26 2.30 1.03 10.69 6.28 2.02 1.58 2006 | 19.13 2.48 1.11 4.86 11.01 6.51 2.32 2007 | 22.63 2.57 1.72 11.58 2.17 7.45 3.23 2.52 2008 | 24.72 3.42 1.60 12.23 2.17 3.89 -------------------------------------------------------------------------------------------------------------------------
40

------------------------------------------------------------------------------------------------------------------------- | y1 y0 | SD SE SG SH SI SK SL SM SN SR SV SW SY SZ TD TG TH TJ TN------+------------------------------------------------------------------------------------------------------------------ 1983 | 5.82 1.77 0.61 2.72 8.02 0.74 0.62 0.46 1984 | 6.04 0.65 3.33 7.85 0.67 1.00 1985 | 5.57 2.38 0.95 1986 | 0.50 7.36 2.59 0.13 0.43 0.78 1.17 1987 | 9.08 2.72 0.12 4.02 0.47 0.81 1988 | 10.05 2.95 0.21 3.83 0.91 1989 | 1.09 10.52 3.38 3.88 1.42 0.87 0.80 1990 | 0.98 13.02 3.82 4.22 1.31 0.98 1.78 0.97 1991 | 1.03 12.92 3.89 3.15 3.24 1.08 1.08 1.50 1.02 1992 | 14.28 4.35 0.19 1.60 3.48 1.09 3.07 1.57 1.17 1993 | 2.28 20.15 4.60 3.41 0.21 4.04 1.37 3.26 1.82 2.02 0.15 1.10 1994 | 11.77 5.08 0.24 4.12 1.03 2.03 1.16 1995 | 13.07 5.83 4.45 0.78 0.28 0.48 1.88 4.30 1.15 2.36 0.05 3.58 1996 | 6.16 0.92 0.26 1.03 1.97 1.76 0.08 3.73 1997 | 4.32 6.13 4.44 0.99 1.53 1.94 1.57 1.08 3.54 1998 | 6.02 1.07 1.95 1.55 1.07 1999 | 5.57 3.38 0.97 2.11 1.49 2000 | 5.48 1.35 0.97 2.18 2001 | 5.24 1.42 1.15 2.44 2002 | 5.14 1.79 1.32 2.90 2.40 2003 | 5.35 1.80 3.73 2.42 2004 | 5.53 2.11 4.10 2.72 2005 | 5.95 4.44 2.43 4.56 2.36 2.09 2006 | 5.89 4.53 2.68 2.50 2.50 2007 | 6.73 5.09 3.42 2.60 2008 | 2.59 -------------------------------------------------------------------------------------------------------------------------
41
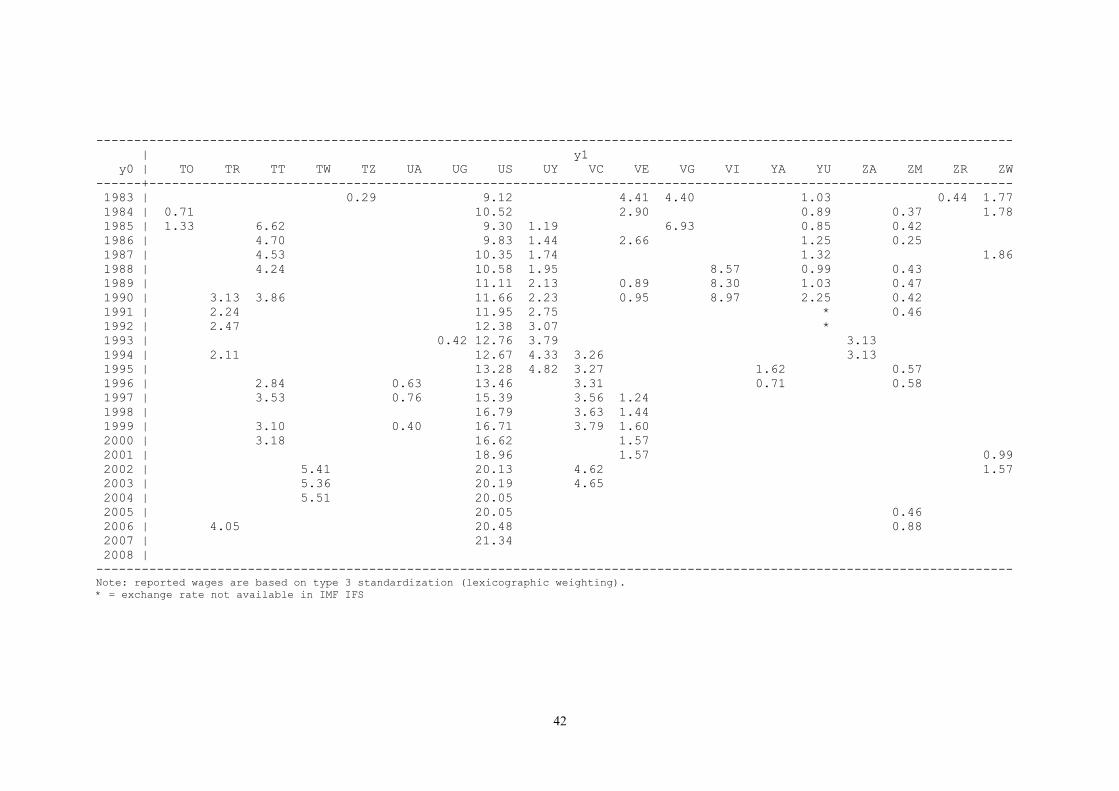
------------------------------------------------------------------------------------------------------------------------- | y1 y0 | TO TR TT TW TZ UA UG US UY VC VE VG VI YA YU ZA ZM ZR ZW------+------------------------------------------------------------------------------------------------------------------ 1983 | 0.29 9.12 4.41 4.40 1.03 0.44 1.77 1984 | 0.71 10.52 2.90 0.89 0.37 1.78 1985 | 1.33 6.62 9.30 1.19 6.93 0.85 0.42 1986 | 4.70 9.83 1.44 2.66 1.25 0.25 1987 | 4.53 10.35 1.74 1.32 1.86 1988 | 4.24 10.58 1.95 8.57 0.99 0.43 1989 | 11.11 2.13 0.89 8.30 1.03 0.47 1990 | 3.13 3.86 11.66 2.23 0.95 8.97 2.25 0.42 1991 | 2.24 11.95 2.75 * 0.46 1992 | 2.47 12.38 3.07 * 1993 | 0.42 12.76 3.79 3.13 1994 | 2.11 12.67 4.33 3.26 3.13 1995 | 13.28 4.82 3.27 1.62 0.57 1996 | 2.84 0.63 13.46 3.31 0.71 0.58 1997 | 3.53 0.76 15.39 3.56 1.24 1998 | 16.79 3.63 1.44 1999 | 3.10 0.40 16.71 3.79 1.60 2000 | 3.18 16.62 1.57 2001 | 18.96 1.57 0.99 2002 | 5.41 20.13 4.62 1.57 2003 | 5.36 20.19 4.65 2004 | 5.51 20.05 2005 | 20.05 0.46 2006 | 4.05 20.48 0.88 2007 | 21.34 2008 | -------------------------------------------------------------------------------------------------------------------------Note: reported wages are based on type 3 standardization (lexicographic weighting).* = exchange rate not available in IMF IFS
42
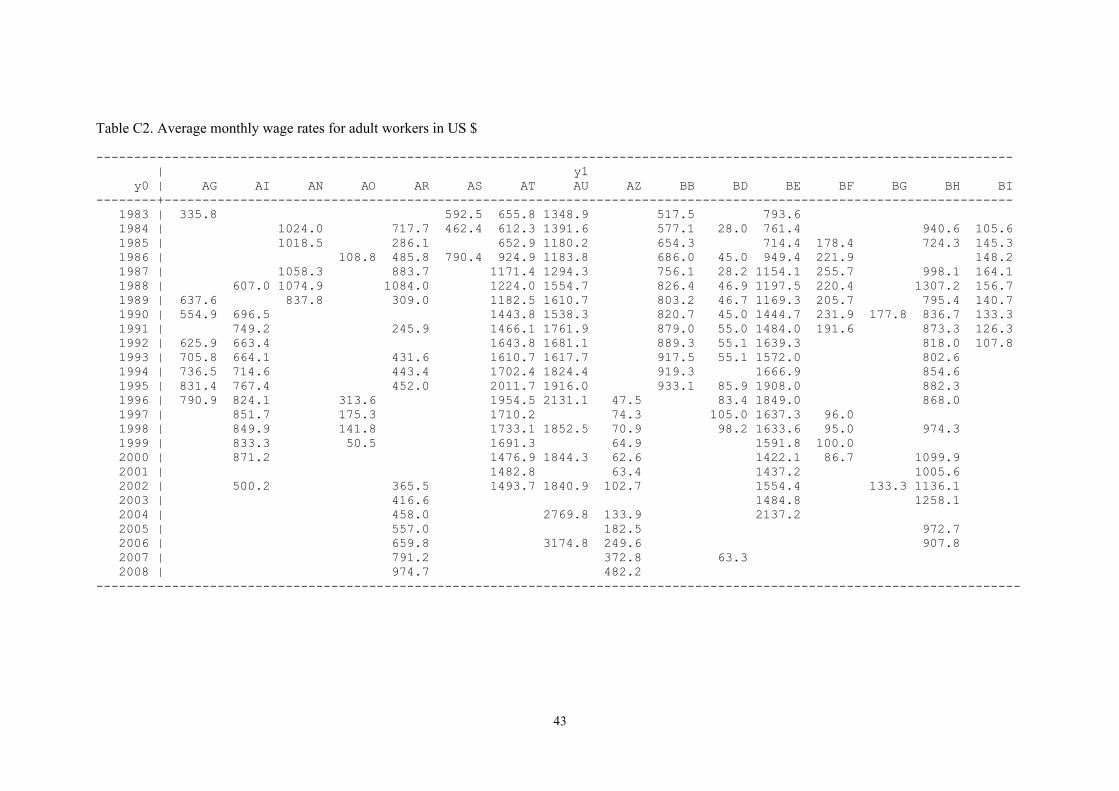
Table C2. Average monthly wage rates for adult workers in US $
------------------------------------------------------------------------------------------------------------------------- | y1 y0 | AG AI AN AO AR AS AT AU AZ BB BD BE BF BG BH BI--------+---------------------------------------------------------------------------------------------------------------- 1983 | 335.8 592.5 655.8 1348.9 517.5 793.6 1984 | 1024.0 717.7 462.4 612.3 1391.6 577.1 28.0 761.4 940.6 105.6 1985 | 1018.5 286.1 652.9 1180.2 654.3 714.4 178.4 724.3 145.3 1986 | 108.8 485.8 790.4 924.9 1183.8 686.0 45.0 949.4 221.9 148.2 1987 | 1058.3 883.7 1171.4 1294.3 756.1 28.2 1154.1 255.7 998.1 164.1 1988 | 607.0 1074.9 1084.0 1224.0 1554.7 826.4 46.9 1197.5 220.4 1307.2 156.7 1989 | 637.6 837.8 309.0 1182.5 1610.7 803.2 46.7 1169.3 205.7 795.4 140.7 1990 | 554.9 696.5 1443.8 1538.3 820.7 45.0 1444.7 231.9 177.8 836.7 133.3 1991 | 749.2 245.9 1466.1 1761.9 879.0 55.0 1484.0 191.6 873.3 126.3 1992 | 625.9 663.4 1643.8 1681.1 889.3 55.1 1639.3 818.0 107.8 1993 | 705.8 664.1 431.6 1610.7 1617.7 917.5 55.1 1572.0 802.6 1994 | 736.5 714.6 443.4 1702.4 1824.4 919.3 1666.9 854.6 1995 | 831.4 767.4 452.0 2011.7 1916.0 933.1 85.9 1908.0 882.3 1996 | 790.9 824.1 313.6 1954.5 2131.1 47.5 83.4 1849.0 868.0 1997 | 851.7 175.3 1710.2 74.3 105.0 1637.3 96.0 1998 | 849.9 141.8 1733.1 1852.5 70.9 98.2 1633.6 95.0 974.3 1999 | 833.3 50.5 1691.3 64.9 1591.8 100.0 2000 | 871.2 1476.9 1844.3 62.6 1422.1 86.7 1099.9 2001 | 1482.8 63.4 1437.2 1005.6 2002 | 500.2 365.5 1493.7 1840.9 102.7 1554.4 133.3 1136.1 2003 | 416.6 1484.8 1258.1 2004 | 458.0 2769.8 133.9 2137.2 2005 | 557.0 182.5 972.7 2006 | 659.8 3174.8 249.6 907.8 2007 | 791.2 372.8 63.3 2008 | 974.7 482.2 --------------------------------------------------------------------------------------------------------------------------
43
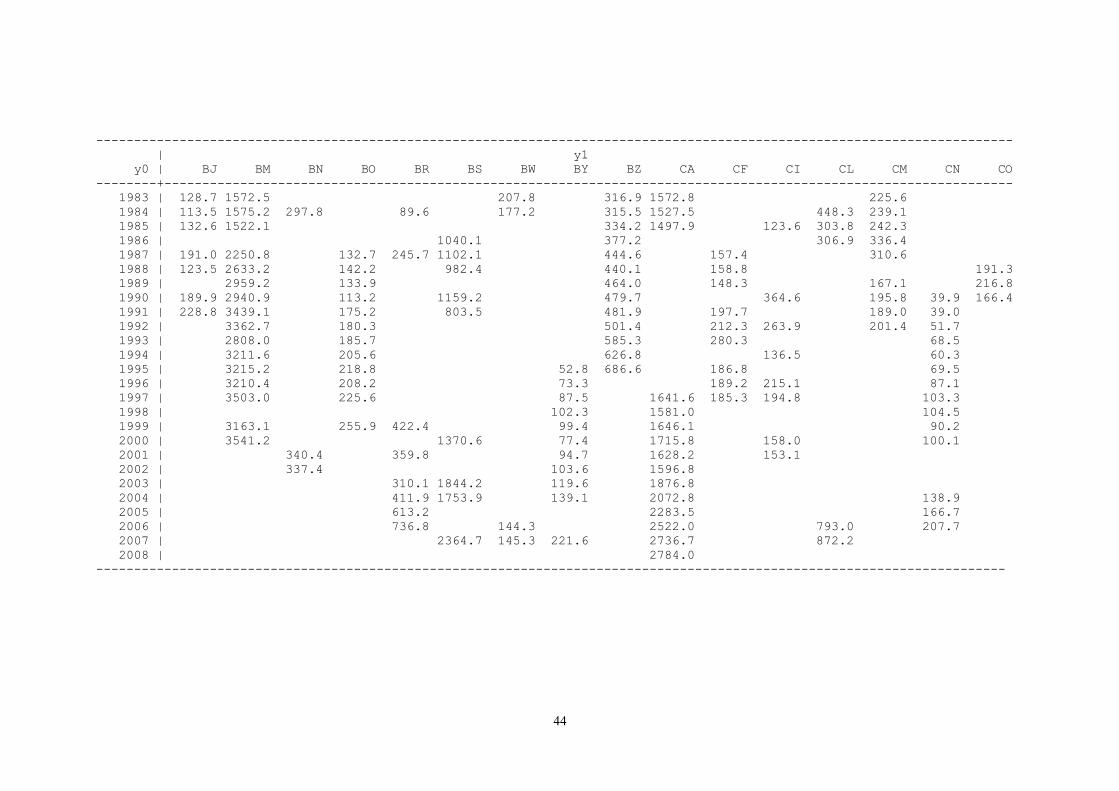
------------------------------------------------------------------------------------------------------------------------- | y1 y0 | BJ BM BN BO BR BS BW BY BZ CA CF CI CL CM CN CO--------+---------------------------------------------------------------------------------------------------------------- 1983 | 128.7 1572.5 207.8 316.9 1572.8 225.6 1984 | 113.5 1575.2 297.8 89.6 177.2 315.5 1527.5 448.3 239.1 1985 | 132.6 1522.1 334.2 1497.9 123.6 303.8 242.3 1986 | 1040.1 377.2 306.9 336.4 1987 | 191.0 2250.8 132.7 245.7 1102.1 444.6 157.4 310.6 1988 | 123.5 2633.2 142.2 982.4 440.1 158.8 191.3 1989 | 2959.2 133.9 464.0 148.3 167.1 216.8 1990 | 189.9 2940.9 113.2 1159.2 479.7 364.6 195.8 39.9 166.4 1991 | 228.8 3439.1 175.2 803.5 481.9 197.7 189.0 39.0 1992 | 3362.7 180.3 501.4 212.3 263.9 201.4 51.7 1993 | 2808.0 185.7 585.3 280.3 68.5 1994 | 3211.6 205.6 626.8 136.5 60.3 1995 | 3215.2 218.8 52.8 686.6 186.8 69.5 1996 | 3210.4 208.2 73.3 189.2 215.1 87.1 1997 | 3503.0 225.6 87.5 1641.6 185.3 194.8 103.3 1998 | 102.3 1581.0 104.5 1999 | 3163.1 255.9 422.4 99.4 1646.1 90.2 2000 | 3541.2 1370.6 77.4 1715.8 158.0 100.1 2001 | 340.4 359.8 94.7 1628.2 153.1 2002 | 337.4 103.6 1596.8 2003 | 310.1 1844.2 119.6 1876.8 2004 | 411.9 1753.9 139.1 2072.8 138.9 2005 | 613.2 2283.5 166.7 2006 | 736.8 144.3 2522.0 793.0 207.7 2007 | 2364.7 145.3 221.6 2736.7 872.2 2008 | 2784.0 ------------------------------------------------------------------------------------------------------------------------
44

------------------------------------------------------------------------------------------------------------------------- | y1 y0 | CR CS CU CV CY CZ DC DE DJ DK DO DZ EE EG ER ET--------+---------------------------------------------------------------------------------------------------------------- 1983 | 112.6 219.0 * 617.0 1176.5 1349.7 1984 | 173.5 185.1 * 581.6 407.1 1085.1 1279.8 212.3 1985 | 177.4 * 160.7 601.3 1145.9 1438.9 572.4 1986 | 187.9 206.8 * 182.8 742.3 1611.6 1925.4 626.6 1987 | 184.8 229.6 * 863.4 2010.0 2491.6 612.6 215.3 1988 | 220.4 * 952.3 2108.7 2429.6 501.6 235.0 1989 | 210.1 * 969.7 2013.8 2342.8 393.9 1990 | 181.0 1149.2 2441.0 2827.7 385.4 102.9 1991 | 125.3 1222.6 2530.4 2809.9 219.3 1992 | 164.5 1295.3 2820.6 3054.2 240.2 79.4 1993 | 331.2 1245.3 186.5 2739.4 103.0 104.4 1994 | 284.7 1365.4 218.5 2846.9 130.8 93.7 123.7 1995 | 398.6 1544.9 273.6 3325.0 199.9 200.8 98.8 1996 | 1575.3 310.4 3207.2 519.2 198.4 191.5 216.7 89.3 1997 | 1512.3 296.1 2817.3 430.6 198.3 239.1 99.5 121.6 1998 | 311.5 2828.6 221.1 95.0 1999 | 369.9 1560.4 311.6 2620.5 116.4 104.4 2000 | 426.0 1468.1 298.2 2469.3 146.9 88.5 2001 | 1458.6 326.8 2438.2 160.8 2002 | 453.4 1619.9 402.8 2617.8 208.7 2003 | 456.2 2080.8 477.6 2500.2 5092.7 135.5 2004 | 416.0 2357.6 538.2 3569.4 5599.8 146.2 2005 | 416.8 * 2551.5 594.7 3640.1 5921.1 151.4 2006 | 411.2 * 2517.1 692.0 3750.6 6281.6 152.7 2007 | 492.6 * 832.4 4037.8 7077.6 378.7 2008 | 583.6 * 1032.8 4435.3 406.3 ------------------------------------------------------------------------------------------------------------------------
45
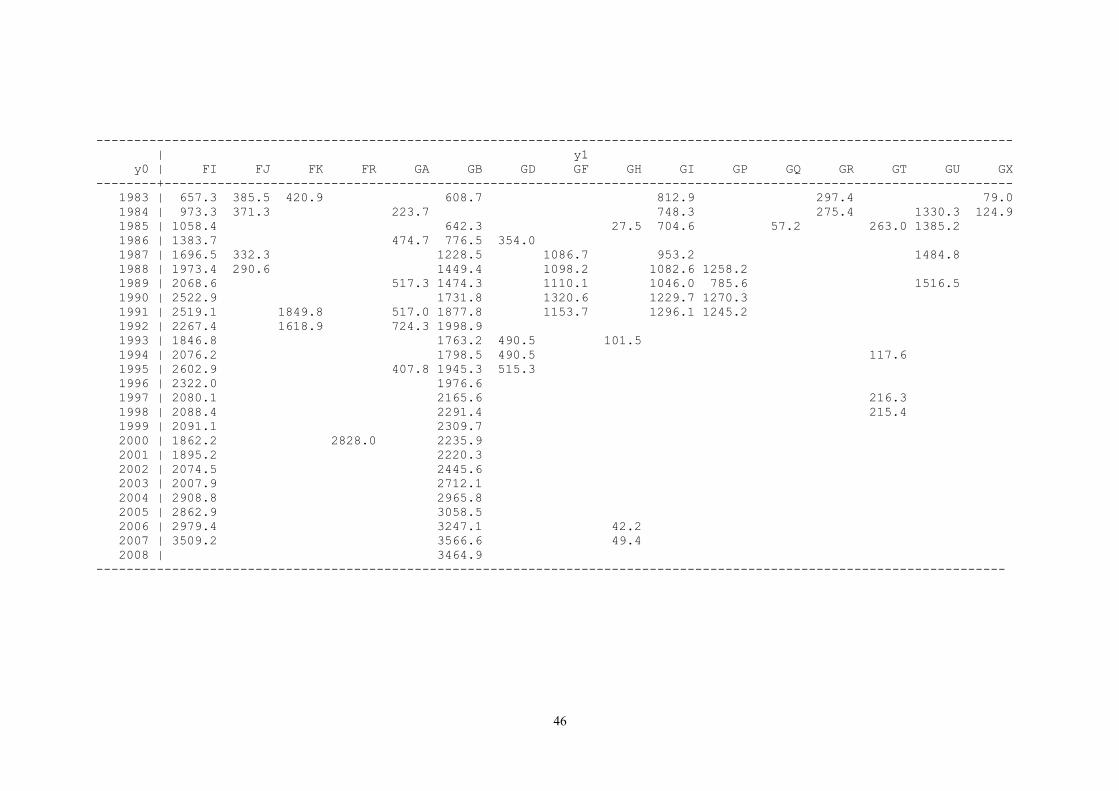
------------------------------------------------------------------------------------------------------------------------- | y1 y0 | FI FJ FK FR GA GB GD GF GH GI GP GQ GR GT GU GX--------+---------------------------------------------------------------------------------------------------------------- 1983 | 657.3 385.5 420.9 608.7 812.9 297.4 79.0 1984 | 973.3 371.3 223.7 748.3 275.4 1330.3 124.9 1985 | 1058.4 642.3 27.5 704.6 57.2 263.0 1385.2 1986 | 1383.7 474.7 776.5 354.0 1987 | 1696.5 332.3 1228.5 1086.7 953.2 1484.8 1988 | 1973.4 290.6 1449.4 1098.2 1082.6 1258.2 1989 | 2068.6 517.3 1474.3 1110.1 1046.0 785.6 1516.5 1990 | 2522.9 1731.8 1320.6 1229.7 1270.3 1991 | 2519.1 1849.8 517.0 1877.8 1153.7 1296.1 1245.2 1992 | 2267.4 1618.9 724.3 1998.9 1993 | 1846.8 1763.2 490.5 101.5 1994 | 2076.2 1798.5 490.5 117.6 1995 | 2602.9 407.8 1945.3 515.3 1996 | 2322.0 1976.6 1997 | 2080.1 2165.6 216.3 1998 | 2088.4 2291.4 215.4 1999 | 2091.1 2309.7 2000 | 1862.2 2828.0 2235.9 2001 | 1895.2 2220.3 2002 | 2074.5 2445.6 2003 | 2007.9 2712.1 2004 | 2908.8 2965.8 2005 | 2862.9 3058.5 2006 | 2979.4 3247.1 42.2 2007 | 3509.2 3566.6 49.4 2008 | 3464.9 ------------------------------------------------------------------------------------------------------------------------
46

------------------------------------------------------------------------------------------------------------------------- | y1 y0 | GY HK HN HR HT HU ID IE IL IM IN IR IS IT JO JP--------+---------------------------------------------------------------------------------------------------------------- 1983 | 184.4 429.2 231.5 73.2 788.5 579.8 712.9 58.1 678.9 734.8 313.6 1377.7 1984 | 185.2 330.3 246.1 149.6 713.7 673.2 64.5 717.9 324.9 992.1 1985 | 384.6 287.4 74.0 673.9 48.1 679.9 738.6 305.8 1018.7 1986 | 180.6 289.3 55.6 52.4 801.1 852.1 990.9 349.6 1512.8 1987 | 555.1 311.1 150.5 44.9 999.7 56.6 1263.7 1222.5 415.2 1785.4 1988 | 119.8 637.3 355.9 169.5 46.2 1349.7 57.0 1489.2 1287.6 353.6 1953.0 1989 | 735.8 44.0 64.1 1266.1 1324.8 2040.9 1990 | 732.6 173.6 1589.6 67.7 1353.1 1646.9 2065.7 1991 | 836.2 140.8 75.7 53.6 1393.1 1733.3 2313.2 1992 | 939.7 169.3 76.6 142.6 1488.5 1877.1 219.3 2474.8 1993 | 1047.7 122.9 45.6 1301.3 1532.9 225.8 2795.3 1994 | 1420.5 106.5 60.4 1249.4 1525.7 248.7 1995 | 76.2 1536.1 123.7 279.4 70.4 1394.7 1591.0 250.6 3374.3 1996 | 87.1 1682.6 358.7 286.3 56.7 1454.0 1743.2 2928.5 1997 | 102.2 1860.3 212.1 265.2 69.1 1632.9 216.4 2609.2 1998 | 168.6 2093.8 279.3 65.6 1843.8 1642.5 280.7 2469.3 1999 | 172.7 1973.1 308.8 67.8 1863.3 1510.1 2804.2 2000 | 205.9 2016.5 293.7 72.8 1769.5 1404.4 2986.5 2001 | 2026.3 324.6 34.5 1399.0 1352.4 306.2 2655.5 2002 | 1956.6 405.5 1770.4 1462.9 301.2 2449.2 2003 | 304.9 1983.0 539.7 2417.4 1405.4 279.5 2712.1 2004 | 329.6 2041.1 645.8 2814.9 2034.3 2891.2 2005 | 1928.9 710.0 113.7 2111.9 364.3 2820.1 2006 | 344.2 1934.9 714.4 127.2 3567.3 2180.9 391.8 2683.8 2007 | 545.1 1909.0 910.8 74.1 4346.6 2379.4 2685.6 2008 | 2022.5 117.3 3266.4 2610.2 3046.2------------------------------------------------------------------------------------------------------------------------
47

------------------------------------------------------------------------------------------------------------------------- | y1 y0 | KE KG KH KM KN KR KW KZ LC LK LR LS LT LU LV MD--------+---------------------------------------------------------------------------------------------------------------- 1983 | 105.1 302.1 342.9 43.4 291.9 1984 | 196.2 342.6 290.9 376.3 47.8 1985 | 148.1 95.6 319.4 286.3 345.1 51.9 1986 | 118.1 303.0 375.0 35.6 248.8 1987 | 138.6 351.9 413.6 47.8 1988 | 457.5 442.8 66.3 1989 | 606.7 480.5 41.3 189.7 1990 | 671.5 528.5 47.0 242.4 1991 | 655.7 544.5 56.5 1992 | 147.2 694.6 62.7 1993 | 19.4 207.3 788.3 61.0 1994 | 31.3 21.3 870.5 76.2 25.0 1995 | 22.1 174.3 1062.8 84.4 159.0 3187.8 31.0 1996 | 20.6 190.7 1091.3 78.0 37.9 1997 | 88.7 152.2 1019.6 83.1 211.9 48.0 1998 | 44.7 69.8 176.5 704.7 84.1 232.1 44.0 1999 | 26.6 68.6 190.7 689.8 842.9 91.8 242.1 31.6 2000 | 68.1 725.6 971.4 90.3 266.1 247.1 31.6 2001 | 29.9 66.7 902.7 257.8 35.9 2002 | 31.5 1013.1 148.6 282.9 2731.1 274.9 50.1 2003 | 1146.2 173.7 322.2 61.7 2004 | 1269.9 1212.0 217.4 394.1 84.7 2005 | 1526.1 455.3 101.0 2006 | 1746.1 592.0 3875.9 583.5 122.9 2007 | 161.2 2008 | 216.5------------------------------------------------------------------------------------------------------------------------
48
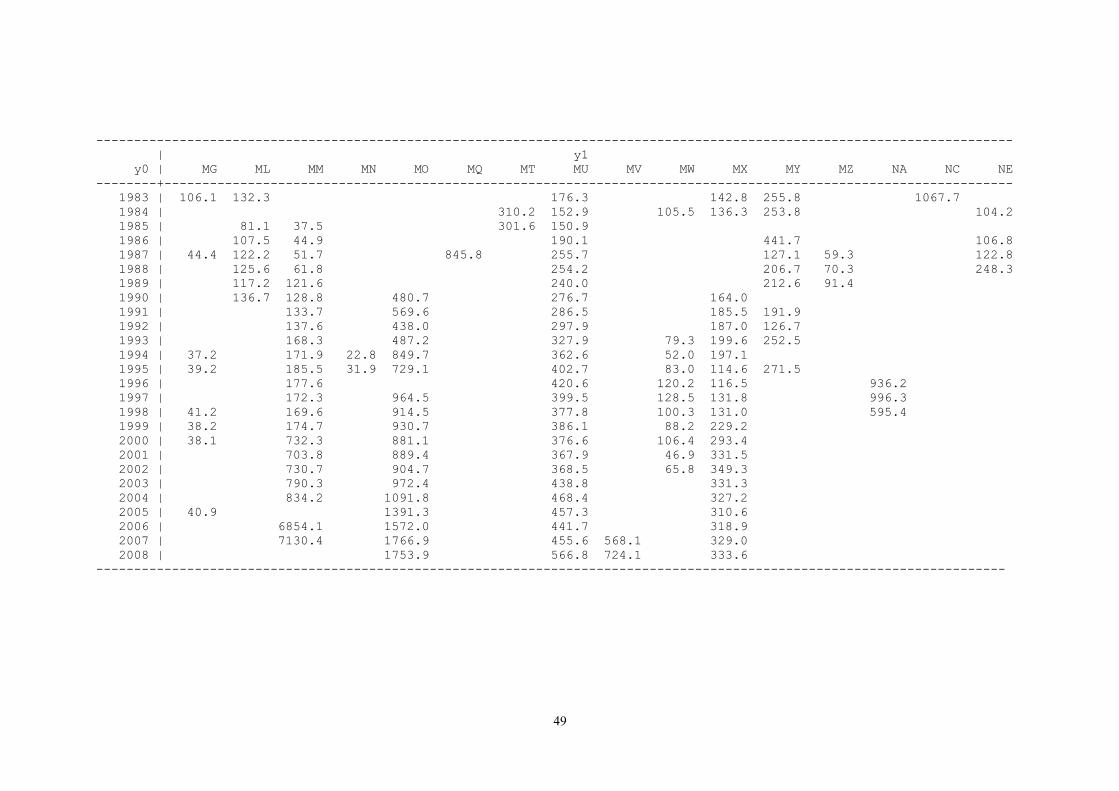
------------------------------------------------------------------------------------------------------------------------- | y1 y0 | MG ML MM MN MO MQ MT MU MV MW MX MY MZ NA NC NE--------+---------------------------------------------------------------------------------------------------------------- 1983 | 106.1 132.3 176.3 142.8 255.8 1067.7 1984 | 310.2 152.9 105.5 136.3 253.8 104.2 1985 | 81.1 37.5 301.6 150.9 1986 | 107.5 44.9 190.1 441.7 106.8 1987 | 44.4 122.2 51.7 845.8 255.7 127.1 59.3 122.8 1988 | 125.6 61.8 254.2 206.7 70.3 248.3 1989 | 117.2 121.6 240.0 212.6 91.4 1990 | 136.7 128.8 480.7 276.7 164.0 1991 | 133.7 569.6 286.5 185.5 191.9 1992 | 137.6 438.0 297.9 187.0 126.7 1993 | 168.3 487.2 327.9 79.3 199.6 252.5 1994 | 37.2 171.9 22.8 849.7 362.6 52.0 197.1 1995 | 39.2 185.5 31.9 729.1 402.7 83.0 114.6 271.5 1996 | 177.6 420.6 120.2 116.5 936.2 1997 | 172.3 964.5 399.5 128.5 131.8 996.3 1998 | 41.2 169.6 914.5 377.8 100.3 131.0 595.4 1999 | 38.2 174.7 930.7 386.1 88.2 229.2 2000 | 38.1 732.3 881.1 376.6 106.4 293.4 2001 | 703.8 889.4 367.9 46.9 331.5 2002 | 730.7 904.7 368.5 65.8 349.3 2003 | 790.3 972.4 438.8 331.3 2004 | 834.2 1091.8 468.4 327.2 2005 | 40.9 1391.3 457.3 310.6 2006 | 6854.1 1572.0 441.7 318.9 2007 | 7130.4 1766.9 455.6 568.1 329.0 2008 | 1753.9 566.8 724.1 333.6 ------------------------------------------------------------------------------------------------------------------------
49

------------------------------------------------------------------------------------------------------------------------- | y1 y0 | NG NI NL NO NP NZ PE PF PG PH PK PL PM PR PS PT--------+---------------------------------------------------------------------------------------------------------------- 1983 | 412.9 916.0 929.0 66.3 723.0 104.6 302.7 73.9 70.3 730.3 780.7 129.2 1984 | 262.5 816.1 890.6 753.6 101.2 335.2 74.2 1052.0 818.8 1985 | 271.5 822.9 920.7 741.9 94.6 31.4 1205.3 1190.7 141.7 1986 | 1148.3 1154.2 935.2 75.7 1521.6 1034.1 191.6 1987 | 1411.7 1276.0 1268.7 295.0 1562.3 75.4 1851.9 1118.3 237.3 1988 | 1462.1 1453.7 1491.0 129.5 1756.8 92.7 1868.6 1458.8 262.4 1989 | 1388.5 1427.6 1413.8 1726.1 119.0 1635.6 1137.2 274.0 1990 | 1669.9 1645.8 60.6 1495.5 2101.6 113.9 1228.6 349.3 1991 | 1639.9 1469.9 321.5 118.1 2083.1 1283.6 401.6 1992 | 1743.2 136.9 1363.7 484.8 1993 | 80.8 169.4 1542.6 239.5 628.7 139.8 1364.4 431.1 1994 | 92.9 1576.7 264.4 155.6 1557.1 432.4 1995 | 111.5 158.8 1825.2 450.7 448.4 176.7 1554.0 1996 | 163.8 1861.6 475.3 440.4 91.8 276.5 1668.3 808.2 1997 | 196.4 177.3 1762.1 481.2 255.6 1506.9 723.5 1998 | 164.6 1805.0 444.8 70.3 347.5 1608.0 748.7 1999 | 174.2 1760.0 391.8 231.0 81.6 416.0 1688.0 747.0 2000 | 179.7 1675.1 379.7 71.0 76.4 1675.0 657.8 2001 | 186.1 1898.0 394.6 229.4 66.2 457.5 1829.9 2002 | 187.6 2153.8 467.3 222.0 108.1 470.6 1795.8 713.0 2003 | 2386.3 216.0 118.7 1737.4 684.9 2004 | 2614.4 478.2 198.0 122.7 601.8 1795.2 980.4 2005 | 2999.5 470.3 213.0 1832.7 1029.8 2006 | 3142.5 519.3 230.1 804.5 1879.6 1064.1 2007 | 3718.1 536.3 356.8 1988.3 448.8 1224.9 2008 | 4061.1 719.2 333.2 2098.7 457.7 ------------------------------------------------------------------------------------------------------------------------
50

------------------------------------------------------------------------------------------------------------------------- | y1 y0 | RO RU RW SB SC SD SE SG SH SI SK SL SM SN SR SV--------+---------------------------------------------------------------------------------------------------------------- 1983 | 332.7 1000.2 272.7 105.5 440.1 1984 | 167.4 283.7 1019.6 112.3 522.8 1985 | 152.8 164.3 300.0 946.4 419.6 1986 | 162.1 142.8 113.4 1260.4 457.2 24.8 1987 | 208.8 1553.9 480.9 21.9 636.8 1988 | 537.1 218.4 1717.0 520.7 38.6 671.6 1989 | 480.3 208.6 318.7 212.4 1798.3 594.7 680.9 246.0 1990 | 136.6 * 202.0 365.2 196.5 2223.2 673.4 731.5 225.4 1991 | 157.8 133.3 398.3 195.8 2208.2 686.9 559.7 577.0 197.2 1992 | 118.0 36.9 2433.8 766.7 35.8 276.7 617.4 222.3 1993 | 165.3 112.0 452.7 3399.9 812.4 595.2 39.2 701.9 237.0 1994 | 154.4 145.6 2001.5 898.1 43.6 1995 | 161.7 155.5 2233.3 1027.9 784.1 163.1 51.3 83.1 318.5 1996 | 165.3 1087.3 194.4 47.9 178.6 338.0 1997 | 142.6 958.6 1085.1 777.2 208.8 266.9 352.7 1998 | 171.7 1061.1 225.6 339.5 1999 | 151.5 62.5 984.9 533.4 203.8 419.1 2000 | 157.7 79.3 984.1 205.1 203.0 451.3 2001 | 160.7 942.2 215.9 190.9 466.9 2002 | 173.6 923.8 280.4 217.3 488.0 444.7 2003 | 209.7 210.3 961.9 287.1 573.6 452.4 2004 | 251.2 230.1 993.8 344.2 630.9 448.9 2005 | 335.7 268.1 1069.9 692.1 403.1 673.9 474.9 2006 | 401.1 1061.2 704.6 451.8 467.9 2007 | 586.2 429.2 1212.6 804.0 576.4 496.0 2008 | 707.2 528.0------------------------------------------------------------------------------------------------------------------------
51
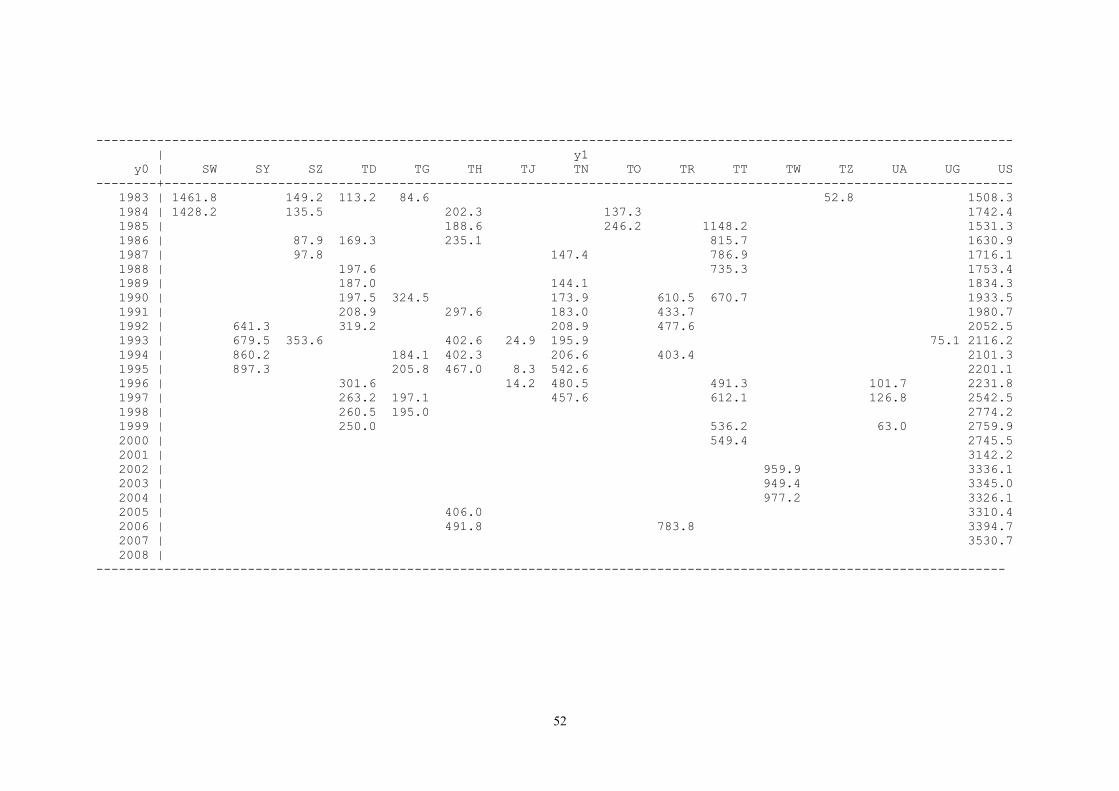
------------------------------------------------------------------------------------------------------------------------- | y1 y0 | SW SY SZ TD TG TH TJ TN TO TR TT TW TZ UA UG US--------+---------------------------------------------------------------------------------------------------------------- 1983 | 1461.8 149.2 113.2 84.6 52.8 1508.3 1984 | 1428.2 135.5 202.3 137.3 1742.4 1985 | 188.6 246.2 1148.2 1531.3 1986 | 87.9 169.3 235.1 815.7 1630.9 1987 | 97.8 147.4 786.9 1716.1 1988 | 197.6 735.3 1753.4 1989 | 187.0 144.1 1834.3 1990 | 197.5 324.5 173.9 610.5 670.7 1933.5 1991 | 208.9 297.6 183.0 433.7 1980.7 1992 | 641.3 319.2 208.9 477.6 2052.5 1993 | 679.5 353.6 402.6 24.9 195.9 75.1 2116.2 1994 | 860.2 184.1 402.3 206.6 403.4 2101.3 1995 | 897.3 205.8 467.0 8.3 542.6 2201.1 1996 | 301.6 14.2 480.5 491.3 101.7 2231.8 1997 | 263.2 197.1 457.6 612.1 126.8 2542.5 1998 | 260.5 195.0 2774.2 1999 | 250.0 536.2 63.0 2759.9 2000 | 549.4 2745.5 2001 | 3142.2 2002 | 959.9 3336.1 2003 | 949.4 3345.0 2004 | 977.2 3326.1 2005 | 406.0 3310.4 2006 | 491.8 783.8 3394.7 2007 | 3530.7 2008 | ------------------------------------------------------------------------------------------------------------------------
52

-------------------------------------------------------------------------------------- | y1 y0 | UY VC VE VG VI YA YU ZA ZM ZR ZW--------+----------------------------------------------------------------------------- 1983 | 757.0 721.3 187.1 87.6 333.6 1984 | 538.1 162.8 67.9 323.8 1985 | 186.2 1197.3 155.1 77.5 1986 | 224.3 497.1 227.1 45.0 1987 | 269.1 239.5 334.4 1988 | 295.8 1483.1 180.6 75.3 1989 | 310.9 174.9 1438.1 187.3 83.4 1990 | 317.7 187.5 1454.2 409.1 74.8 1991 | 405.1 * 80.3 1992 | 452.0 * 1993 | 567.5 551.9 1994 | 653.9 566.3 550.4 1995 | 738.6 569.9 334.9 102.2 1996 | 577.6 145.8 103.1 1997 | 620.0 235.1 1998 | 630.9 281.8 1999 | 659.4 284.1 2000 | 279.2 2001 | 328.4 189.3 2002 | 780.7 303.0 2003 | 786.1 2004 | 2005 | 81.7 2006 | 157.6 2007 | 2008 | -------------------------------------------------------------------------------------Note: reported wages are based on type 3 standardization (lexicographic weighting).* = exchange rate not available in IMF IFS
53

54
1 We gratefully acknowledge the financial support for this research from the VU University Amsterdam, the ILO and the World Bank. We also like to thank Davin Chor and Fujin Zhou for their assistance during the Herculean task of cleaning an earlier version of the database.2 The ILO October Inquiry is currently being revised and therefore more recent data are not yet available.3 The ILO actually asks for information on 159 occupations since 1983 but it differentiates occupation 139, executives in the government into three sectors; national, regional or provincial, and local governments. 4 The Bulletin of Labour Statistics, issues 1984-2 and 1985-2. Actually the hardcopy data is for the 48 occupations that were reported since 1953 before the extension to 161 occupations in 1983. However, only 45 of the 48 occupations were retained among the 161 reported occupations since 1983. 5 The Bulletin of Labour Statistics (issues 1984-2 and 1985-2), Bulletin of Labour Statistics. October Inquiry Results (1986-1991), Statistic on Occupational Wages and Hours of Work and on Food Prices. October Inquiry Results. Special Supplement to the Bulletin of Labour Statistics (1992-2009).6 It can be noted that in previous releases of the electronic data a variable was included to indicate whether the data was reported as a 'range' (apart from whether it applied to minimum, average or other types of pay). 7 The maximum is the multiplicand of the number of countries (171) times the number of occupations (161) times the number of years (26).8 In case the reported hours of work were not on a weekly basis, weekly hours of work were calculated through dimensional analysis (for instance by dividing reported monthly hours of work by 52/12). Only reported hours of work on a daily basis could not be converted but no obvious problems with these data were found.9 By dimensional analysis we mean simply changing the time units in well-determined ways, such as obtaining weekly pay by dividing annual pay by 52.10 We multiplied all daily wages by 25 to make them comparable with monthly wages during the cleaning procedure.11 See Oostendorp (2009) on the variation of the gender wage gap across occupations and time.12 In Oostendorp (2005) only the following plausibility checks where made: (1) number of working days per month more than 31, (2) minimum wage more than average wage, (3) prevailing wage deviates from average wage by more than 25%, and (4) maximum wage less than average wage.13 For a few countries the data correction factors for minimum or maximum wages became implausible after reestimation. In these instances we replaced the implausible reestimated data correction factors by the estimated data correction factors for the pooled sample (without reestimating the remaining data correction factors again).14 In case there are multiple observations for wages in the standard format (this is possible if mean hourly or monthly wage rates for adult workers have been reported for different cities/regions within a country), we use lexicographic weighting for these standard wage observations as well – giving a weight equal to one to the standard wage that has been reported for the entire country and zero to the other standard wages . In case none of the standard wages have been reported for the entire country, we use uniform weighting for the standard wages with weights equal to the reciprocal of the number of standard wage observations reported within a country, occupation and year.15 After wages were converted onto an hourly or monthly basis as described in step 2 of the standardization procedure. The smaller number of standard observations for monthly wages reflects the fact that wages reported on a daily basis could not be converted on a monthly basis because the number of days worked per week (or, say, month) is not known.