the nutritional profile of high- performance junior soccer players in ...
123
I THE NUTRITIONAL PROFILE OF HIGH- PERFORMANCE JUNIOR SOCCER PLAYERS IN WESTERN CAPE, SOUTH AFRICA Thesis presented in partial fulfilment of the requirements for the degree Master of Nutrition at the University of Stellenbosch Supervisor: Dr Amanda Claassen Co-supervisor: Mrs Sunita Potgieter Statistician: Prof Daniel Nel Faculty of Medicine and Health Sciences Department of Interdisciplinary Health Sciences Division of Human Nutrition by Fatima Hoosen March 2013
Transcript of the nutritional profile of high- performance junior soccer players in ...

I
THE NUTRITIONAL PROFILE OF HIGH-PERFORMANCE JUNIOR SOCCER PLAYERS IN
WESTERN CAPE, SOUTH AFRICA
Thesis presented in partial fulfilment of the requirements for the degree Master of Nutrition at the University of Stellenbosch
Supervisor: Dr Amanda Claassen Co-supervisor: Mrs Sunita Potgieter
Statistician: Prof Daniel Nel
Faculty of Medicine and Health Sciences Department of Interdisciplinary Health Sciences
Division of Human Nutrition
by Fatima Hoosen
March 2013

II
DECLARATION OF AUTHENTICITY
By submitting this thesis electronically, I declare that the entirety of the work
contained therein is my own, original work, that I am the owner of the copyright
thereof and that I have not previously in its entirety or in part submitted it for
obtaining any qualification.
Signature
Fatima Hoosen
Date: 1 December 2012
Copyright @ 2012 Stellenbosch University
All rights reserved
Stellenbosch University http://scholar.sun.ac.za
III
ABSTRACT
Background: Very little data exists regarding the nutritional status of adolescent soccer
players and there is no national data regarding this population.
Aim: The aim of this study was to investigate the dietary intake and anthropometric profile of
N=39 male, high-performance, adolescent soccer players who are of mixed race (14 -18
years of age), during the competitive season.
Methods: The study design was a descriptive, observational study with an analytical
component. A quantified food frequency questionnaire (QFFQ), which has been validated for
athletes, was used to characterise their nutritional intake in terms of energy (kCal),
macronutrient as well as micronutrient intake. Interpretation of anthropometric data included
plotting and interpreting growth indicators such as height-for-age, body mass index (BMI)-
for-age, tricep skinfold-for-age, subscapular skinfold-for-age, sum of skinfolds-for-age, arm
muscle area (AMA)–for-age, arm muscle circumference (AMC)-for-age, arm fat area (AFA)-
for-age and percentage body fat.
Results: The anthropometric data showed that most of the players had an adequate height-
for-age (100%, N=39) and BMI-for-age (87.2%, N=34). The mean percentage body fat was
10.9±3.5%. The majority of players’ skinfold thickness measurements were above the 85th
percentile for triceps (56.4%, N=22), subscapular (59.0%, N=23) as well as the sum of two
skinfolds (triceps and subscapular), (72.0%, N=28), AMA (82.1%, N=32), AMC (56.4%,
N=22) and AFA (56.4%, N=22). Daily minimum and maximum mean energy expenditure was
between 3146.9±213.4 and 3686.4±250.0 kcal while daily mean energy intake was
4374.0±1462.4 kcal. Protein (156±53 g/day), carbohydrate (CHO) (557±172 g/day), total fat
(149±67.8 g/day) and cholesterol (546±230 mg/day) intake were all above levels
recommended for athletes. The mean micronutrient intake met the estimated average
requirement (EAR) or adequate intake (AI) for all nutrients. Players who were more
physically active displayed more favourable anthropometric indices which included body
weight, BMI, body fat indices as well as muscle mass indices, despite having a greater total
energy intake (TEI). This difference did however not reach statistical significance. Supper
was the most regularly consumed meal (97.4%, N=38). The majority of players (61.5%,
N=24) ate breakfast daily with only 5.1% (N=2) who never ate breakfast. However, 20.5%
(N=8) of the players only ate breakfast 3 days a week.
Conclusion: Although most of the players had a normal body weight and BMI, they were
predominantly categorised as above average according to indices of body fat. Body muscle
indices was categorised as above average for most players suggesting a beneficial finding in
terms of sporting performance. The mean TEI, CHO, protein intake and fat intake were all
Stellenbosch University http://scholar.sun.ac.za

IV
above the recommended levels for athletes. The mean intake of all vitamins and minerals
met the EAR/AI. Players who were more physically active displayed more favourable
anthropometric indices, despite having a higher TEI.
Although this study population exhibited no evidence of stunting, indicating that the players
were well nourished (in terms of sufficient macronutrients and micronutrients), they are at
risk of being over-nourished which may negatively impact sporting performance as well as
overall health.
Stellenbosch University http://scholar.sun.ac.za

V
OPSOMMING
Agtergrond: Daar is baie min studies wat die dieetinname van adolosent-sokkerspelers
ondersoek het en daar is sover die navorser se kennis strek, geen nasionale data rakende
dieetinname in hierdie studie populasie nie.
Doel: Die doel van die studie was om die dieetinname en antropometriese profiel van N=39
manlike hoë-prestasie adolosent-sokkerspelers van gemengde ras (14-18 jaar) gedurende
die kompeterende seisoen te bepaal.
Metodes: ‘n Kwantitatiewe voedselfrekwensie vraelys was gebruik om die totale energie
(kcal), makronutriënt- en mikronutrientinname te bepaal. Die antropometriese data was
geïnterpreteer met behulp van die volgende groei indikatore; lengte-vir-ouderdom,
liggaamsmassa indeks (LMI)-vir-ouderdom, trisep velvou-vir-ouderdom, subskapulêre
velvou-vir-ouderdom, som van velvoue-vir-ouderdom, arm spier area (ASA)-vir-ouderdom,
arm spier omtrek (ASO)-vir-ouderdom, arm vet area (AVA)-vir-ouderdom en persentasie
liggaamsvet.
Resultate: Die antropometriese data het getoon dat meeste van die spelers toepaslike
lengte-vir ouderdom (100%, N=39) en LMI-vir-ouderdom (87.2%, N=34) het. Die gemiddelde
persentasie liggaamsvet was 10.9±3.5%. Die meerderheid van die spelers se velvou
metings was bo die 85ste persentiel vir die trisep (56.4%, N=22), subskapulêr (59.0%, N=23)
sowel as die som van twee velvoue (trisep en subscapulêr), (72.0%, N=28), ASA (82.1%,
N=32), ASO (56.4%, N=22) en AVA (56.4%, N=22). Die daaglikse maksimum en minimum
gemiddelde energie verbruik was 3146.9±213.4 tot 3686.4±250.0 kcal en daaglikse energie
inname was 4757.9±2121.2 kcal. Proteïen (155.6±53.3 g/day), koolhidraat (556.8±172.1
g/day), totale vet (148.8±67.8 g/day) en cholesterol (545.5±230.1 mg/day) inname was bo
die aanbevelings. Die gemiddelde mikronutriënt inname was binne die geskatte gemiddelde
aanbeveling of toereikende inname vir al die mikronutriënte. Die gemiddelde vloeistof
inname gedurende ‘n sokker wedstryd en ‘n twee uur oefen sessie was 479.1±163 ml en
597.7±281 ml, onderskeidelik. Die meer aktief spelers het ‘n meer geskikte antropometriese
profiel, soos laer gewig, LMI en liggaamsvet waardes en hoër spiermassa waardes beskik,
ten spite van ‘n hoër energie inname. Die maal wat die mees gereeld geëet was is aandeete
(97.4%, N=38). Meeste (61.5%, N=24) van die spelers het ontbyt daagliks geëet met net
5.1% (N=2) wat nooit ontbyt geëet. Alhoevel daar nogsteeds 20.5% (N=8) van spelers was
wat net ontbyt 3 keer per week geëet het. Die maaltyd wat die minste ingeneem was, was
ontbyt, met net 20.5% (N=8) wat onybyt 3 dae per week eet.
Slot: Alhoewel meeste van die spelers ‘n normale gewig en LMI getoon het, is die meeste
spelers gekatogoriseerd as bo gemiddeld in terme van liggaamlike vet waarde. Die meeste
Stellenbosch University http://scholar.sun.ac.za
VI
van die spelers kan ook gekatogoriseer word as bo gemiddeld in term van spiermassa, wat
voordelig is vir sport prestasie. Die gemiddlede energie, koolhidraat, proteïen, en vet
innames was bo die aanbevole reikwydtes. Die gemiddelde mikronutriënt inname was binne
die geskatte gemiddelde aanbeveling of toereikende inname vir al die mikronutriënte. Meer
aktief spelers het ‘n meer geskikte antropometriese profiel getoon, ten spite van ‘n hoër
energie inname.
Alhoewel hierdie populasie wel gevoed is, in terme van makronutriënt en micronutrient, draar
hulle ‘n risiko om oor gevoed to wees. Dit mag hulle sport prestasie en algehele gesondheid
negatief beïnvloed.
Stellenbosch University http://scholar.sun.ac.za

VII
ACKNOWLEDGEMENTS
I would like to thank the management and medical division of the Ajax Cape Town Football
Club for allowing me the opportunity to work with their players. I would also like to thank my
study leaders, Sunita Potgieter and Amanda Claassen, for their continued encouragement,
support and advice. It is also necessary to thank the Division of Human Nutrition at the
University of Cape Town for allowing me the time to complete this study, for access to their
resources, and for encouraging me to continue when I felt like giving up.
Finally, I must thank my family for all the sacrifices they have made for me.
Everyone’s assistance has been invaluable.
Stellenbosch University http://scholar.sun.ac.za
VIII
DEDICATIONS
I would like to dedicate this study to my loving and supportive husband and my children M
Ashraf, Ruwayda and Imaan.
Stellenbosch University http://scholar.sun.ac.za

IX
CONTRIBUTIONS BY PRINCIPAL AND FELLOW RESEARCHERS
The principal researcher (Fatima Hoosen) developed the idea and the protocol. The principal
researcher planned the study, undertook data collection, captured the data for analyses,
analysed the data with the assistance of a statistician (Prof DG Nel), interpreted the data and
drafted the thesis. Dr Amanda Claassen and Mrs Sunita Potgieter (study leaders) provided
input at all stages and revised the protocol and thesis.
Stellenbosch University http://scholar.sun.ac.za
X
Table of Contents
Page:
Declaration of authenticity II
Summary III
Opsomming V
Acknowledgements VII
Dedications VIII
Contributions by principal and fellow researchers IX
List of figures XIII
List of tables XIV
List of abbreviations XV
List of appendices XVII
CHAPTER 1: LITERATURE REVIEW AND STATEMENT OF THE
RESEARCH QUESTION
1.1 Introduction 1
1.2 The physiological and nutritional needs of children and adolescents 2
1.3 The nutritional demands of adolescent athletes 2
1.4 The nutritional habits of adolescents 3
1.5 The body composition of adolescents 4
1.5.1 Measurement of body composition 4
1.5.2 Body composition status of adolescents 5
1.6 Nutritional considerations of adolescent athletes 7
1.6.1 The role of fluid and hydration in adolescent athletes 7
1.6.2 The role of energy in adolescent athletes 8
1.6.3 The role of carbohydrate in adolescent athletes 10
1.6.4 The role of protein in adolescent athletes 12
1.6.5 The role of fat in adolescent athletes 13
1.6.6 The role of micronutrients in adolescent athletes 15
1.6.6.1 Vitamins 16
1.6.6.2 Minerals 16
1.7 Dietary supplement intake in adolescent athletes 17
1.9 Statement of the research question 19
CHAPTER 2: METHODOLOGY
2.1 Aim 20
2.2 Objectives 20
2.3 Study design 20
Stellenbosch University http://scholar.sun.ac.za

XI
2.4 Study population 20
2.5 Inclusion criteria 20
2.6 Exclusion criteria 21
2.7 Methods of data collection 21
2.7.1 Socio-demographic information 22
2.7.2 Anthropometric measurements 22
2.7.3 Skinfold thickness measurements 23
2.7.4 Dietary intake 24
2.7.5 Training nutrition, fluid intake and nutritional supplement
intake 25
2.8 Data Analysis 25
2.8.1 Socio-demographic information 25
2.8.2 Anthropometric and skinfold thickness measurements 25
2.8.3 Determining AMC, AMA and AFA from skinfold
prediction equations 26
2.8.4 Dietary intake 26
2.8.5 Nutritional supplement intake 27
2.8.6 Training nutrition and fluid intake 27
2.8.7 Statistical analysis 27
CHAPTER 3: RESULTS
3.1 Socio-demographic data 28
3.2 Anthropometry and skinfold thickness data 29
3.3 Dietary energy and macronutrient intake data 30
3.3.1 Consumption of meat and meat products 31
3.3.2 Consumption of milk 31
3.3.3 Consumption of fruit and vegetables 31
3.3.4 Consumption of sweets and added sugar 31
3.3.5 Consumption of beverages 31
3.4 Dietary micronutrient intake data 33
3.5 Training nutrition data 34
3.6 Fluid intake data 37
3.7 Dietary supplement intake data 39
3.8 Exploration of possible association between macronutrient intake and
anthropometric data 40
3.9 Sub-group analysis 41
CHAPTER 4: DISCUSSION
4.1 Anthropometry and skinfold thickness 42
Stellenbosch University http://scholar.sun.ac.za

XII
4.2 Dietary energy and macronutrient intake 47
4.3 Dietary micronutrient intake 53
4.4 Training nutrition 54
4.5 Fluid intake 55
4.6 Dietary supplement intake 57
4.7 Exploration of possible association between macronutrient intake
and anthropometric data 58
4.8 Sub-group analysis 58
4.9 Shortcomings and limitations of the study 59
CHAPTER 5: CONCLUSION AND RECOMMENDATIONS
5.1 Conclusion 61
5.2 Recommendations 61
LIST OF REFERENCES 63
Stellenbosch University http://scholar.sun.ac.za

XIII
LIST OF FIGURES
Figure 3.5.1: Meal pattern of high-performance adolescent soccer players
Figure 3.5.2: Subjective rating by adolescent athletes of their concern regarding their food
intake before, during and after exercise
Figure 3.6.1: The main reasons for fluid intake of high-performance adolescent soccer
players before, during and after exercise
Figure 3.6.2: The main reasons high-performance adolescent soccer players select specific
fluid to drink during a match
Stellenbosch University http://scholar.sun.ac.za

XIV
LIST OF TABLES
Table 2.8.1: The cut-off values of various anthropometric indices
Table 3.1.1: Socio-demographic status of high-performance adolescent soccer players
Table 3.1.2: Playing history and training load of high-performance adolescent soccer players
Table 3.2.1: Weight classification according to BMI percentiles
Table 3.2.2: Skinfold classification according to percentiles of high-performance adolescent
soccer players
Table 3.3.1: Mean energy and macronutrient intake of high-performance adolescent soccer
players
Table 3.3.2: The frequency of intake of specific meat, milk, fruit and vegetables.
Table 3.3.2: The frequency of intake of sweets, added sugar and beverages
Table 3.4.1: The vitamin and mineral intake of high-performance adolescent soccer players
Table 3.5.1: Intake of a specific meal or food item of high-performance adolescent soccer
players before, during and after exercise
Table 3.5.2: The main reasons high-performance adolescent soccer players select a specific
meal/food item before, during and after exercise
Table 3.6.1: Subjective rating by adolescent soccer players regarding their concern of fluid
intake /hydration
Table 3.7.1: The use of supplements amongst high-performance adolescent soccer players
Table 3.9.1: The mean age, weight, height and percentage body fat per sub-group
Table 3.9.2: The anthropometrical distribution per sub-group
Table 3.9.3: Energy and macronutrient energy per sub-group
Stellenbosch University http://scholar.sun.ac.za

XV
LIST OF ABBREVIATIONS
SD: Standard deviation
WHO: World Health Organisation
FM: Fat mass
FFM: Fat-free mass
TBW: Total body water
FFDM: Fat-free dry mass
BMI-for-age: Body mass index-for-age
YRBS: Youth risk behaviour survey
EER: Estimated energy requirement
EAR: Estimated average requirement
PAL: Physical activity level
CHO: Carbohydrates
Kcal: Kilocalories
RDA: Recommended dietary intake
GI: Glycemic index
AMDR: Adequate macronutrient distribution range
EFA: Essential fatty acids
AI: Adequate intake
IOC: International Olympic committee
WADA: World anti-doping agency
UK: United Kingdom
SADHS: South African Demographic and Health Survey
HREC: Health Research Ethics Committee
Stellenbosch University http://scholar.sun.ac.za

XVI
ISAK: International Society for the Advancement of Kinanthropometry
BMI: Body mass index
MUAC: Mid-upper arm circumference
AMA: Arm muscle area
QFFQ: Quantitative food frequency questionnaire
DAEK: Dietary Assessment and Education Kit
% BF: Percentage body fat
AMC: Arm muscle circumference
AFA: Arm fat area
MRC: Medical Research Council
REE: Resting Energy Expenditure
TE: Total energy
DRI: Dietary Reference Intake
MUFA: Monounsaturated fatty acids
PUFA: Polyunsaturated fatty acids
SFA: Saturated fatty acids
PAL: physical activity level
FBDG: Food based dietary guidelines
Stellenbosch University http://scholar.sun.ac.za

XVII
LIST OF APPENDICES
Appendix 1: Participant information leaflet
Appendix 2:Informed consent
Appendix 3 : Socio-demographic questionnaire
Appendix4: Anthropometric questionnaire
Appendix5: BMI-for-age WHO reference chart (156)
Appendix6: Height-for-age WHO reference chart (156)
Appendix7: Quantitative Food Frequency Questionnaire
Appendix8: Nutrition practice and nutritional supplement intake questionnaire
Appendix9: Percentile charts for triceps of adolescent males (176)
Appendix10: Percentile charts for subscapular of adolescent males (176)
Appendix11: Percentile charts for sum of two skinfolds (162)
Appendix12: Percentile charts for AMC of adolescent males (160a)
Appendix13: Percentile charts for AMA and AFA of adolescent males (160a)
Stellenbosch University http://scholar.sun.ac.za
1
CHAPTER 1: LITERATURE REVIEW AND STATEMENT OF THE RESEARCH QUESTION
1.1 Introduction
There have previously been many studies which have reported on the dietary practices and
habits of high-performance adult soccer players (1, 2, 3, 4). There are however few studies
which have investigated the nutritional status and dietary habits of developing soccer players
and youth soccer players (<18 years of age).
During a soccer match, the players perform intermittent, high-intensity exercise (5). Further
metabolic demands are placed on the players by accelerating and stopping, turning, jumping
and tackling, and irregular movements (6). Thus the nutritional needs of these athletes will
vary considerably depending on the level of their participation and position within the team.
Mohr et al., (2003), also found that within each playing position, there were significant
differences in the physical demands which were dependent on physical performance as well
as the playing style of players (7).
During adolescence, the body experiences a period of rapid growth and development which
results in a marked increase in energy- and nutrient requirements (8). Adolescent athletes
therefore require an even higher energy supply in order to maintain adequate growth and
maturation as well as perform optimally in their respective sporting activities. An inadequate
nutritional intake in adolescents may delay pubertal development, alter growth and muscle
development and affect exercise performance (9, 10, 11). It has been shown that regular
physical activity increases the demand for energy resulting in additional protein, mineral and
vitamin requirements (particularly those which are important for growth such as zinc, copper,
iron, and folate) (12).
To our knowledge, there are no data available on nutritional intake and status of youth
participating in soccer in South Africa. This is of a great concern if one considers the huge
risks associated with young, high-performance players who have poor nutritional knowledge,
dietary behaviour and practices (13) coupled with how popular soccer is in the South African
setting. It is thus imperative to understand the nutritional needs of these athletes to enable
one to develop effective programs that will improve the athlete’s dietary intakes and
ultimately their growth and development, health and sporting performance.
Stellenbosch University http://scholar.sun.ac.za

2
1.2 The physiological and nutritional needs of children and adolescents
After birth, the human body grows most rapidly during childhood and adolescence, with the
exception of infancy (14). Children may gain up to 20% of their final adult height during early
puberty (14). Researchers estimate that approximately 45% of adult skeletal volume is
formed during adolescence (15). This rapid rate of growth during childhood and adolescence
exerts a profound effect on nutritional requirements. If children and adolescents are unable
to meet their nutritional requirements, they may suffer irreversible, harmful effects on growth
and development (16). Some of these harmful effects may include a depressed immune
system, greater disease severity and permanent disability due to the physical and mental
effects of a poor nutritional intake during the initial stages of life (17, 18, 19, 20). Mild and
moderate under-nutrition before the age of two years can cause irreversible physical and
cognitive damage which adversely impacts on future health. The consequences can thus
continue into adolescence and adulthood (17, 18, 19, 20).
Undernutrition is manifested by underweight (weight-for-age below -2SD), wasting (weight-
for-height below -2SD) and stunting (height-for-age below -2SD), as classified on the World
Health Organisation (WHO) growth charts, as well as specific micronutrient deficiencies (19,
21). The most prevalent micronutrient deficiencies in South African adolescents, according
to the 2003 South African Health and Demographic Survey (SADHS), include calcium,
magnesium, folate, iron, niacin, Vitamin E and thiamine, where more than 50% of
adolescents were shown to have an intake of below 67% of the recommended dietary intake
(RDA) (153). There is unfortunately limited data regarding the macronutrient intake of South
African adolescents, especially those engaged in high levels of physical activity.
1.3 The nutritional habits of adolescents
The (WHO) has globally recognised adolescents as a nutritionally at-risk group (31). Thus
the combination of poor eating behaviour during adolescence and the increased nutritional
requirements for adequate growth and development as well as an inclination for risk-taking
behaviour are all threats to an adequate nutritional intake (31, 32, 33). Inadequate nutrition
at this stage of the lifecycle, which is characterised by the adolescent growth spurt, can be
associated with stunting (chronic undernutrition), underweight (chronic negative energy
balance) or being overweight or obese (chronic positive energy balance) (31).
The food consumption patterns of learners in Cape Town were investigated by Temple et al.
(2006) and found that 77% had breakfast before school, 70% of learners who bought food at
Stellenbosch University http://scholar.sun.ac.za
3
school did not buy any healthy items, with 73% purchasing two or more unhealthy items
(41)). Interestingly only 47-61% of learners knew that cola drinks, pies and samosas were
unhealthy snacks. Also, the knowledge the learners had about healthy food was unrelated to
whether they purchased healthy food items or not (41). Packed lunches were twice as likely
in schools of higher socio-economic status (64% vs. 31% in lower socio-economic schools)
(41). In summary, the large majority of foods eaten by adolescent students in Cape Town
are considered unhealthy, irrespective of whether it was brought to school or purchased at
school. The knowledge the students had regarding healthy and unhealthy options did not
influence their choices.
Another study performed on adolescent learners in the Cape Town area in 2010 found that
most of the learners (61%) followed a high fat diet (40). This study was in contrast to the
findings from Temple et al., (2006), where the learners’ interest in nutrition and their reliable
knowledge regarding fat intake (which was obtained in a subject at school), positively
affected their fat intake (40).
International data investigating the intake of adolescents found similar findings to the South
African studies. The diets of French and American adolescents where shown to lack variety
with a high intake of fast foods which are typically rich in fat and low in carbohydrates (34,
35, 36). There is a high intake of sweetened beverages and energy-dense nutrient-poor
foods as well as frequent meal skipping, breakfast in particular (33, 37, 38, 39). The dietary
habits of South African adolescents appear to be no different (40, 41).
1.4 The nutritional demands for adolescent athletes
Physical activity during childhood and adolescence is widely recommended for short- and
long-term physiological, sociological and psychological benefits (22). Healthy, well-nourished
children require regular physical activity for normal skeletal and muscle growth as well as for
the development of cardiovascular fitness, neuromuscular co-ordination and cognitive
function (22).
The level of physical activity greatly influences nutritional requirements, at any age. Higher
intensity and volume of physical activity, increases nutritional demands (23). Participating in
and training for any type of sport adds additional stress to the already existing high
nutritional demands of rapid growth, such as during childhood and adolescence (14). When
young athletes are exposed to exercise and diet regimes which are too rigorous for their
Stellenbosch University http://scholar.sun.ac.za

4
age, their individual capabilities or their level of maturation, the benefits of participating in
sport can be reduced and the effects can even be negative (24).
Individuals may also vary in the tempo and timing of maturation (25). This explains why
some children who are at the same chronological age but at a different stage of maturation
have different abilities to train and compete (25). During puberty, the rapid increase in sex
hormones and growth factors accelerates the development of physiological characteristics,
leading to increased trainability for athletic potential (26). Consequently, the many
anthropometric changes that occur during puberty directly influence the sporting
performance of young athletes. It is thus plausible that a player’s nutritional intake during this
vital period may be an important factor in determining whether optimal sporting ability is
attained (27, 28).
It has been found that many young athletes are unable to meet the nutritional requirements
for normal growth and development, maturation as well as the rigors of an intense training
programme (29). Largo, (1993), showed that puberty, a period of accelerated growth, may
be largely influenced by poor nutrition (30).
1.5 Body composition of adolescents
1.5.1 Measurement of body composition
Body composition can be described as a 2-, 3- or 4- compartment model. The 2-
compartment model divides the body into fat-free mass (FFM) and fat-mass (FM). A
limitation of this model is that the FFM includes water, protein, glycogen and mineral in bone
and soft tissue. The 3-compartment model consists of FM and FFM which is separated into
total body water (TBW) and fat-free dry mass (FFDM). The 4-compartment model further
divides FFDM into bone mineral and the residual (42). Thus FM is a constant in each model.
Skinfold measures, the thickness of a double fold of skin and compressed subcutaneous fat
tissue, is the most commonly used indirect method to estimate body fat percentage (42).
This method has been validated in adolescents, it is inexpensive, it is easy and quick to take
the measurements and if the measurements are taken correctly it correlates well with
estimates of body composition derived from body density measurements (accuracy within 2-
3%) (43). The accurate measurement of skinfolds is dependent on careful site selection and
using standardised techniques (43). Lohman et al., (1984) investigated 5 skinfold sites on
athletes and found that the triceps and subscapular skinfolds measured with a Harpenden
skinfold calliper showed the least amount of variation among investigators (44). Slaughter
Stellenbosch University http://scholar.sun.ac.za

5
and Lohman (1988) have recommended a multi-component body composition model to
evaluate the body composition of children and youth (45). The formulas which they have
developed use the triceps and subscapular skinfold measures and have been validated for
these specific populations. However, it must be remembered that these equations have not
been validated against high-performance athletes.
According to the WHO guidelines, the recommended measures for the evaluation of growth
in adolescents include height-for-age, body mass index (BMI)-for-age, triceps-for-age and
subscapular-for-age (46).
1.5.2 Body composition status of adolescents
In a developing country such as South Africa, one is faced with the “double burden of
malnutrition” where both over- and under-nutrition are common (47). In the 2003 South
African Human Development Report, it was estimated that almost 50% of the population
lived in poverty, with the largest numbers of the poor being the African population group (48).
The relationship between poverty, undernutrition and under-development in terms of
milestone development has been acknowledged and understood for many years (49, 18).
The THUSA BANA study found that in schoolchildren (10-15 years) in the Western Province,
South Africa, smaller households and physical inactivity were determinants which influenced
the development of overweight/obesity (50).
Results from the (SADHS) (2003), for adolescent males (15-19 years) for the Western
Province, found the mean BMI to be 20.4±0.43 kg/m2, with 21.6% being underweight, 73.8%
of normal weight, 2.3% were overweight and 2.3% were obese. The mean weight was
56.9±1.58 kg and the mean height was 1.67±0.01 m.
The South African National Youth Risk Behaviour Survey (YRBS) in 2002, 2008 and 2012
showed that during adolescence, overnutrition was more of a concern than undernutrition
(51, 52, 188). There was a national increase in the prevalence of overweight and obesity
from 2002 to 2008 (21% to 25%). The increase was especially marked in the mixed ancestry
population group (17% to 22%) (51, 52). Interestingly, the prevalence of overweight and
obesity was higher in females nationally, in the Western Cape Province as well as the mixed
ancestry population group (51, 52).
Naude et al., (2011) investigated the nutritional status of adolescents (ages 12 to 16 years)
from schools within a 25 km radius of Tygerberg Hospital, located in the greater metropolitan
Stellenbosch University http://scholar.sun.ac.za

6
area of Cape Town, South Africa. The sample consisted of English or Afrikaans speaking
adolescents of low socio-economic status (53). The results of this study showed that the
prevalence of stunting (8.9%) was similar to the 2008 YRBS prevalence in the Western
Cape Province (9.7%). When the results from Naude et al., (2011) was further compared to
the 2008 YRBS, the prevalence of stunting (8.9%) and underweight (7.6%) in the Western
Cape, was somewhat lower than the national prevalence (13.1% and 8.4%, respectively). In
addition to this, Naude et al., (2011) also found a lower prevalence of stunting and
underweight in the mixed ancestry population (13.6% and 9.4%, respectively). The
prevalence of overweight and obesity (22.8%) was similar to the YRBS (25.0%) with a higher
prevalence in females in both surveys (52, 53). Results from the YRBS, 2008 and Naude et
al., (2011) are consistent with the global trend where the prevalence of overweight
adolescent females exceeds that of underweight adolescent females in more than half of the
world’s developing countries (54).
A study was done in Gran Canaria (Spain) which investigated the effects of extracurricular
physical activities on fat mass accumulation and physical fitness during growth in 42 early
pubertal males (9.4±1.4 years). Results showed that without any dietary intervention,
children who participate regularly in sports activities (at least 3 hours per week), are more
protected against total and regional fat mass accumulation than those who are more
inactive. In addition, physically active children increase their total lean and bone mass and
are able to maintain their fitness during growth while it deteriorates in the non-physically
active children (55). The above is of particular importance if one considers the increasing
obesity rates world-wide as well as in the South African setting (47).
A cross-sectional study which focused on the body composition and the nutritional profile of
44 male adolescent tennis players (aged 10 -13 years and 14-18 years) in Brazil found that
32% of the participants in the study had an inadequate energy intake, which was obtained
from a non-consecutive 4-day food record (56). Body fat was shown to be appropriate in
71% of these participants and BMI was appropriate in 89% of participants. (56). The
discrepancy between the number of players with an inadequate energy intake (32%) and the
number of players with an inappropriate BMI (11%) was explained by under-reporting which
seems to be common amongst athletes (57, 58, 59).
Rico-Sanz et al., (1998) considered the characteristics of male junior soccer players from
various developing countries and found that the mean body weight and body fat of players
aged between 14 and 18 years are between 62.5 to 72.3 kg and 7.6 to 12.1%, respectively.
It has been found that there is a negative correlation between percentage body fat and
sporting performance, where body mass has to be moved against gravity (60). Thus the
Stellenbosch University http://scholar.sun.ac.za

7
energy demands of an athlete during exercise will be progressively reduced as his
percentage body fat decreases. However, a percentage body fat which is too low may
adversely affect the overall health, growth and development as well as performance of
young athletes (61).
A study performed on under-14 year-old youth soccer players in Hong Kong demonstrated a
physiological benefit for players based on key anthropometric analysis (183). The study
showed that players with a higher BMI were able to shoot a soccer ball at a greater speed
and run faster over 30 metres. This is due to a high BMI with an equivalent higher lean body
mass and thus higher muscular mass. The study also indicated that taller players were able
to jump higher (superior performance in vertical jump tests), perform better at high intensity
intermittent bouts of exercise and had greater endurance. Interestingly, goalkeepers were
found to be heavier and taller than players in other positions (defender, midfielder and
forward) and had the fastest 10 metre running times (183).
1.6 Nutritional considerations for adolescent athletes
1.6.1 The role of fluid and hydration in adolescent athletes
Soccer is an intermittent-, endurance-type team sport which results in large increases in
metabolic heat production, an elevation in body temperature and sweating (62). The length
of a soccer match varies with each age group. The U-14 teams play for 50 minutes, the U-15
and U-16 teams play for 60 minutes, the U-17 teams play for 70 minutes and the U-18 teams
play for 80 minutes. Dehydration may adversely affect performance by affecting the
cardiovascular system, thermoregulation and central fatigue (perception of effort) (63, 64). A
decrease in body weight from dehydration of 2% in adults (65) and 1% in children (67) have
been shown to decrease endurance performance. The extent of dehydration which affects
endurance performance of adolescents remains unclear but it is expected to follow a pattern
similar to that of the adult (67).
Fluid balance may be affected by many factors which can include clothing, differences in
body composition, physical activity, drinking palatability and the intensity and duration of
exercise (73, 74). In addition to this, environmental factors such as temperature, humidity
and wind speed significantly affect the sweating response (75).
Young athletes have been advised to follow fluid intake recommendations which are similar
to that given to adult athletes (68). Athletes should be encouraged to drink at regular
intervals during exercise (69). For intense or intermittent activity lasting more than an hour,
Stellenbosch University http://scholar.sun.ac.za
8
athletes are advised to consider a carbohydrate energy drink which also contains
sodium/electrolytes, during as well as after exercise (69).
The US Soccer Federation issued guidelines in 2002 to prevent young soccer players
suffering from heat illness (181). Before an activity, players should be well hydrated. During
an activity, they should commence drinking early on, sports drinks are better than water and
for every 20 minutes they should consume between 150ml to 260ml, regardless of thirst.
After an activity players should drink every 20 minutes, for one hour. Drinks which should be
avoided during as well as post-exercise include alcoholic beverages, carbonated beverages
and caffeinated energy drinks (181).
During a match, players have few drinking opportunities to replace fluid lost and it is not
uncommon to observe body mass losses of more than 1-3% (71, 72). Thus, fluid intake
rarely matches fluid lost. In 2007, Noakes postulated that meeting fluid recommendations
during exercise, where fluid intake meets fluid lost, held no benefit over drinking to thirst
(184). He therefore recommended that athletes could avoid dehydration by drinking to thirst,
with no adverse effects on sporting performance.
A post-exercise meal or snack, which consists of a savoury component as well as a portion
of fruit or vegetables, should contain an adequate amount of electrolytes to replace losses.
Water intake should be encouraged along with the post-exercise meal (99).
In summary, dehydration of as little as 1-2% has been shown to negatively affect sporting
performance. Players are encouraged to pre-hydrate and drink at regular intervals during
exercise. For activity lasting more than an hour, players should preferably use a
carbohydrate (CHO)-containing energy drink which also contains sodium or electrolytes.
1.6.2 The energy requirements of adolescent athletes
‘The Estimated Energy Requirement (EER), a new term, which is similar to the Estimated
Average Requirement (EAR), was defined as the average dietary energy intake that is
predicted to maintain energy balance in a healthy adult of a given age, gender, weight,
height and level of physical activity, consistent with good health’ (76). In addition to the
above, the EER of children includes the deposition of tissues consistent with good health
(76). The EER of adolescent males (14-18 years) who are considered to have an active
physical level of activity (PAL) is 3152 kcal/day (76). An active PAL equates to 60 minutes of
daily moderate intensity activity (76).
Stellenbosch University http://scholar.sun.ac.za

9
There have been very few studies which have specifically addressed the energy- and
nutrient intakes of young soccer players. An inadequate nutritional intake can have both
short- and long-term consequences such as delayed pubertal development, disturbed
growth and muscle development and it can affect exercise performance (14, 67, 82, 83, 84).
The energetic demands of training and competition at the elite level require that athletes,
both youth and adults, ingest a well-balanced diet sufficient in energy, particularly rich in
carbohydrates (CHO) as well as adequate amounts of protein and fat (85). This ensures that
energy balance is achieved and maintained resulting in the maintenance of lean tissue and
immune function and the promotion of optimal athletic performance (85).
The estimated mean daily energy requirement for senior male players has been estimated at
approximately 4000 kcal on training days and 3800 kcal on match days (61, 86). The limited
available data regarding the nutritional status of adolescent athletes has shown that the
estimated mean daily energy demand for 13 to 16 year old male soccer players range
between 3819 and 5185 kcal/day (87). A French study was carried out on young male
athletes who underwent intensive elite sports training at a facility in France. There were 180
male subjects with ages ranging from 13 to 16 years participating in a 3-year dietary survey.
The volunteers were weekly boarders and therefore ate breakfast and supper at the centre
while lunch was eaten in the school canteen. On the weekends, all meals were eaten at
home (87). The total energy intake of the players was found to be below the estimated
energy demand level ranging from 2352±454 to 3395±396 kcal/day (87). It is unfortunate
that the impact that the insufficient energy intake may have had on training and performance
ability and body composition of the participants was not investigated.
Ruiz et al., (2005) investigated the nutritional intake of 81 young soccer players who played
for a soccer club in Getxo, Spain (81). Four teams of different age categories were selected.
The mean age of each team was 14.0, 15.0, 16.6 and 20.9 years. The three younger teams
trained 3 times a week while the older team trained 4 times a week. Each training session
lasted 90 minutes and each athlete played one match a week in addition to the training
sessions. The caloric intake per kilogram body mass (BM) was found to be significantly
higher among the younger players than the adult players. The intake in the 14.0, 15.0, 16.6
and 20.9 year old groups were 3456±309, 3418±182, 3478±223 and 3030±141 kcal/day,
respectively. The average energy intake in all the age groups was below the recommended
range of 3819 to 5185 kcal as recommended by Leblanc et al. (2002), (87).
From the limited data it has been found that adolescent soccer players do have higher
energy requirements than their non-active counterparts, but these requirements are not
always met when looking at the data obtained from the few available dietary survey studies.
Stellenbosch University http://scholar.sun.ac.za
10
It must be remembered that determining dietary intake data is quite complex and can be
difficult. The studies above differed in the methods used to determine dietary intake. Each
method has its own limitations, which may include under-reporting or over-reporting. A
recent study in 2011, investigated the relative validity of reported energy intake derived from
multiple 24-hour recalls against estimated energy expenditure, in South African adolescents
(182). This study demonstrated that the 24-hour recalls offered poor validity between energy
intake and estimated energy expenditure (182). In addition to this, there is limited data on
the actual energy intake of South African adolescents as well as the energy requirements for
high-performance adolescent athletes.
1.6.3 The role of carbohydrate (CHO) in adolescent athletes
The EAR for CHO in adolescent males (14 to 18 years) is 100 g/day while the recommended
dietary allowance (RDA) is 130 g/day (76). The RDA value was derived from the average
amount of glucose utilised by the brain (76). It is advised that these recommendations be
increased according to the extended periods of exercise, as experienced by high-
performance athletes (76).
Literature from adults has shown that soccer is a glycogen-depleting activity and therefore it
is imperative to ensure an adequate CHO supply to support and maintain exercise capacity
(88, 89).
During an adult soccer match intramuscular glycogen can be depleted by halftime which
may translate into a decrease in speed and distance covered during the second half of a
match (92). Rico-Sanz et al., (1999) investigated muscle glycogen stores in adolescent
athletes and reported 35% depletion in glycogen stores after a simulated soccer match of
approximately 42 minutes. A positive association was also found between the glycogen
utilised and time to exhaustion (61). Thus, the quicker glycogen stores became depleted, the
quicker exhaustion would occur. A subsequent study then reported that a CHO intake of 4.8
g/kg BM/day was sufficient to almost restore glycogen levels to pre-exercise values (93).
The suggestion from these studies is that in young athletes, CHO plays an important role in
optimizing athletic performance as well as in recovery. Petrie et al., (2004) recommended
that adolescent athletes consume a diet where at least 50% of total energy intake comes
from CHO (67).
Stellenbosch University http://scholar.sun.ac.za

11
When muscle glycolytic enzymes in adolescents were compared to those of adults, there
was very little or no difference seen (91), which may indicate that the difference in muscle
enzymatic capacity between the two groups may disappear in the adolescent period (67).
Generally, CHO-containing foods are important to include in the diet of young athletes as it
maintains general health (67). Complex carbohydrates are also associated with a lower risk
of chronic diseases of lifestyle. Burke et al., (2007) reported that the ingestion of refined
CHO (e.g. sports drinks, bars and gels) to support energy intake during training and
competition may be useful for young athletes as well as adults (94).
The study of Ruiz et al., (2005), investigated the dietary intake of 81 adolescent players at a
soccer club in Spain (81). This study found that the contribution of CHO to total energy
intake (44%) was below the recommended 50% of total energy intake per day to maintain
muscle glycogen stores during intense training (5, 71, 95).
Studies investigating the effect of consuming CHO drinks during exercise are not as well
studied in children as it is in adults. Riddell et al., (2000) found that adolescents can utilise
as much as 1–1.5 g/kg BM/hour of CHO during heavy exercise (96). It has been found that
as the duration of exercise increases, there is a greater reliance upon blood glucose, with a
gradual decline in blood glucose levels (96). Riddell et al., (2001a) investigated the effect of
intermittent exogenous glucose ingestion on substrate utilization during prolonged exercise
on adolescent boys between the ages of 13 and 17 years (97). The amount of glucose
solution provided was approximately equal to the amount of CHO expended by the subjects
during the exercise session. The glucose solution was found to have a sparing effect on
endogenous CHO by 16% and endogenous fat by 45%. The glucose solution contributed to
about 25% of the total energy demand of the exercise session and lowered the rating of
perceived exertion of the subjects (97). In other words, the use of an exogenous glucose
solution was associated with a reduction in exercise-induced fatigue during prolonged
exercise, which could be beneficial to exercise performance. Another study by Riddell et al.,
(2001b) showed that CHO ingestion during exercise can improve performance of boys aged
10-14 years by 40% (98). Both studies were performed on athletes while cycling in an
exercise laboratory setting (98).
The American College of Sports Medicine (2009) recommended that adults ingest a 6-8%
CHO drink during exercise lasting more than an hour (99). Meyer et al., (2007)
recommended that adolescents limit the concentration of the CHO drink they ingest to 6%
concentration as evidence shows it may be better tolerated than an 8% concentration drink
(69). When 18 adolescents were given an 8% CHO drink during intermittent high-intensity
Stellenbosch University http://scholar.sun.ac.za

12
exercise, it was associated with a higher prevalence of gastrointestinal discomfort when
compared to a 6% drink (100).
Investigations regarding post-exercise CHO intake in youth athletes are limited. Studies in
adults show that the amount of CHO consumed is a major factor involved in post-exercise
refuelling (101). The studies in adults show that during the first few hours post-exercise,
recovery can be optimised by ingesting 1–1.2 g/kg BM/hour of moderate to high CHO-rich
foods (towards 5-10 g CHO/kg BM/24 hour) (101). Burke et al., (1993) demonstrated that
when recovery time is limited to less than 12-24 hours, food with a higher glycemic index
(GI) may promote glycogen synthesis better than food with a lower GI (102). Thus, the
ingestion of CHO, particularly high GI CHO, immediately post-exercise is of particular benefit
when recovery time between exercise sessions is limited (4–8 hours). When the recovery
time is not limited, the immediate timing or type of CHO is of less importance, as long as the
total daily CHO requirement (5-10 g/kg BM/day) is met (103). Therefore, the immediate
consumption of CHO in the post-exercise period appears to be most beneficial where young
athletes have a limited (<24 hours) recovery period. This typically occurs during tournaments
where the duration between matches are usually short. Whilst this study appears to shed
light on the potential benefit of CHO in the immediate post-exercise period, its direct
applicability to young athletes should be taken with caution due to the physiological
differences that exists between the two groups.
1.6.4 The role of protein in adolescent athletes
An adequate protein intake for children and adolescents is imperative to ensure the provision
of essential amino acids to support growth and development (67). The EAR of protein for
male adolescents is 0.73 g/kg BM/day while the RDA is 0.85 g/kg BM/day (76).In order to
maintain a positive nitrogen balance it is essential to have adequate intakes of both protein
and energy. An inadequate energy intake causes protein to be used as a substrate for
energy and thus cannot be used to synthesise lean tissues (104). Data regarding the protein
intake of South African adolescents are limited. The 2008 YRBS did however find that 66.6%
of male high school learners in the Western Cape consumed meat frequently (four or more
days in the week preceding the study) of which 64.8% consumed one or more cups at a time
(52). Although the national percentage of male adolescent learners consuming meat
frequently (51.6%) was lower than the Western Cape, the national portion size was slightly
higher (66.0%) (52). As meat alternatives were not investigated, it is difficult to comment on
their total protein intake.
Stellenbosch University http://scholar.sun.ac.za

13
Limited data exist regarding the protein requirements of young athletes. One of the few
studies available investigated protein turnover in non-athletic children who walked 45-60
min/day for 6 weeks (105). The exercise training resulted in a decrease in protein synthesis
and breakdown to conserve protein. This could perhaps be an attempt to meet the increased
requirements due to the training as the children did not adequately increase intake to meet
requirements (105).
Meyer et al., (2007) postulated that if energy requirements are met, it is likely that protein
requirements will also be met (69). Bass and Inge (2006) researched the intake of young
athletes in Western countries and found that young athletes who typically restricted energy
intake still managed to have adequate protein intakes (106). Tipton et al., (2007)
recommended that adult athletes ingest 1.2-1.7 g/kg BM/day of protein (104) and Meyer et
al., (2007) recommended this amount to be sufficient for physically active children and
adolescents as well (69).
The study of 81 adolescent male soccer players by Ruiz et al. (2005), found that players met
their protein requirements in their respective age group of 14.0, 15.0, 16.6 and 20.9 years
(2.0, 2.1, 2.0 and 1.8 g/kg BM/day) (81). In 2007, Boisseau et al., performed a study on 14
year old male soccer players to determine protein requirements in a nitrogen balance study.
The diets provided proteins ranging from 1.4, 1.2 and 1.0 g/kg BM/day. It was found that
nitrogen balance increased with both protein intake and energy balance. The EAR required
to balance nitrogen losses for the athletes was 1.2 g/kg BM/day and the RDA was 1.4 g/kg
BM/day. This study therefore suggests that the RDA for 14 year old male soccer players is
higher than for non-active 14-year old males (0.8–1.0 g/kg BM/day) (107).
In summary, it seems that a level of 1.2-1.7 g/kg BM/day should be sufficient to meet protein
needs in active adolescents.
1.6.5 The role of fat in adolescent athletes
Fat is necessary for good health as it provides a store of energy, it insulates, it is required for
the transportation of fat-soluble vitamins and stored fat can provide energy during endurance
events (87). Currently there is no EAR or RDA for fat intake. There is however an adequate
macronutrient distribution range (AMDR) which is 25 to 35% for 14- to 18-year-old males
(76). It has been reported that during exercise, children oxidise relatively more fat than
carbohydrates compared to adults (108). Studies in children have found that during periods
of prolonged exercise, there is an increase in plasma free glycerol (109) and free fatty acid
Stellenbosch University http://scholar.sun.ac.za

14
concentrations (110), indicating a higher degree of fat oxidation. It has consistently been
shown that lactate levels are lower in children than adults after exercise (111, 112, 113).
Lactate is a by-product of carbohydrate metabolism and an inhibitor of fatty acid mobilisation
and uptake (114). Evidence from Stephens, Cole & Mahon (2006) support the theory that
adult-like metabolic patterns begin between mid- to late-puberty and completes by the end of
puberty. Thus, by the end of puberty, adolescents have similar fat oxidation as adults (115).
Burke et al., (2007) found that there is no evidence to support the theory that young athletes
involved in sport may benefit from a higher fat intake in their diet, despite children relying
more on fat as an energy source during exercise (94). In fact, Galassetti et al., (2006) found
that children who ingested a lipid-rich shake (0.8 g fat/kg BM) 45 min before cycling
intermittently for 30 min, had a reduced magnitude (by 40%) of growth hormone secretion
during exercise (116). Meyer et al., (2007) postulated that a reduction in growth hormone
secretion during exercise, in response to a high fat intake, will negatively affect muscle
growth and adaptation (69). Thus a fat intake which is too high will negatively affect sporting
performance.
The current recommendation for fat intake during adolescence is in accordance with adult
dietary guidelines (67). Wolmarans and Oosthuizen (2001) recommended a fat intake of
30% of total energy intake (TEI) of which saturated fats should not provide more than 10%
TEI/day (117, 118). Unsaturated fats should provide most of the fat-derived energy with
monounsaturated fats providing >10% TEI/day and polyunsaturated fats providing no more
than 10% TEI/day (117). Dietary guidelines further emphasize that trans fats (<1% TEI) and
cholesterol (<300 mg/day) should also be limited (117). Healthy non-obese children and
young athletes should not overly restrict energy and fat intake as it may impair growth and
development (119). Fat restriction may also negatively affect nutritional status due to an
insufficient intake of essential fatty acids (EFA) and fat-soluble vitamins (67).The two main
EFA are linoleic and alpha-linolenic acids. The fat recommendation for adolescents (30%),
according to Petrie et al., (2004) is less than the upper limit of the AMDR (25 to 35%
TEI/day) (67).
International studies investigating dietary intake of adolescent athletes have shown that fat
intake typically more than meets requirements (80, 81, 87). Ruiz et al., (2005) reported on
the dietary intake of 81 adolescent soccer players at a soccer club in Spain. The participants
were divided into 4 age groups with a mean age of 14.0, 15.0, 16.6 and 20.9 years. The
respective age groups had an excess amount of fat in their diet namely, 38.3%, 39.1%,
38.4% and 38.0% TEI/day, when compared to the RDA of 30% TEI/day (81). Leblanc et al.,
(2002) performed a study on 180 male adolescent soccer players (13–16 years) living at a
Stellenbosch University http://scholar.sun.ac.za
15
training facility in France (87). They found that their participants had a fat intake above the
recommendation (35% TEI/day vs. the recommended 30% TEI/day). Eglesias-Gutierrez et
al., (2005) performed a study in Spain investigating the dietary intake of 33 adolescent male
soccer players (14-16 years) while living in their home environment (87). This study too
found that the players had too high a fat intake which contributed 38% TEI/day. These
studies showed that adolescent athletes had a fat intake which exceeded their requirements
(87). However, it was performed in developed countries and results could differ in a
developing country, such as South Africa. In the SADHS (2003), the quality of the fat intake
of sedentary adolescent males in the Western Cape was rated as low (2.2±0.1), which
indicated a low fat intake but the actual intake in grams was not assessed (153).
1.6.6 The role of micronutrients in adolescent athletes
The functions of micronutrients are the same for athletes as they are for non-athletes (67).
Readers are referred to the following references for more comprehensive literature on the
functions of micronutrients and the importance for health (120, 121, 122,). The role of
specific micronutrients in the production of energy, reduction of oxidative stress and the
maintenance of haemoglobin, bone mass and immune function has been well documented
(125, 83). There are no specific recommendations for athletes and thus it is assumed that
their intake should be the same as for non-athletes (56).
In the 2003 SADHS, the quality of the micronutrient intake of adolescent males in the
Western Cape was investigated and was rated as being average (26.0±1.41).(153). The
findings of specific micronutrients in the 2003 SADHS are discussed below.
The 2008 YRBS investigated the frequency of consumption of fruit, uncooked and cooked
vegetables amongst male adolescent learners in the Western Cape (52). The data showed
that amongst the learners 61.5%, 45.2% and 49.6%, consumed fruit, uncooked and cooked
vegetables, respectively, on four or more days of the week preceding the study (52). This
could result in a compromised micronutrient status as fruit and vegetables are a major
source of vitamins and minerals and the current recommendation is 5 fruit and vegetables a
day (117).
Stellenbosch University http://scholar.sun.ac.za
16
1.6.6.1 VITAMINS
Current literature on the dietary intake of young athletes has showed that most ingest an
intake that meets or comes close to meeting daily requirements. Athletes have been found to
meet vitamin requirements when compared to non-active adolescents (14, 126). Typically,
studies have showed that athletes have an increased energy intake and thus the intake of
most of the vitamins is also increased (67). There is therefore no evidence to support the
theory that there are increased vitamin requirements to meet the exercise demands of young
athletes (67). There are however specific vitamins which are of a concern in the South
African adolescent population as discovered in the 2003 SADHS. This included folate,
thiamine, Vitamin E and niacin (153). It is therefore important to assess the vitamin intake of
adolescents to identify those who may be deficient in order to allow for intervention and thus
improve intake.
1.6.6.2 MINERALS:
Literature on adults have shown that an elevated metabolism due to exercise does not
increase mineral requirements (127, 128, 129). The exception to this are the minerals lost in
high amounts of sweat such as sodium, potassium, calcium and magnesium (127, 128, 129).
Petrie et al., (2004) reported the same to be true in children (67). They too may need to
replace those electrolytes lost during sweating to ensure that a deficiency does not develop
(67). Children and adolescents have been identified as having diets deficient in iron and
calcium which can adversely affect health and physical performance (129). In addition to the
minerals mentioned above, the 2003 SADHS found that magnesium may also be a concern
for South African adolescents (153). Calcium intake was found to be inadequate as more
than 60% of the study participants had an intake less than 33% of the RDA for Calcium
(153). It must be remembered that this study occurred before the mandatory fortification of
maize and wheat flour. It is expected that the mean intakes of folate, niacin, thiamine,
vitamin B6, riboflavin, iron, vitamin A and zinc will have improved at the next SADHS.
Adult athletes are often found to have an inadequate iron intake as well as an iron deficiency
(130). Adolescent females are at a particularly high risk as this is when their menstrual cycle
starts (69). An inadequate intake of iron in youth can decrease physical and mental
performance without resulting in anaemia (131). A chronically inadequate intake leads to low
stores which have been shown to impair muscle metabolism (132) and cognitive ability
(133). The RDA for adolescent males (14-18 years) of iron is 11 mg/day and the EAR is 7.7
mg/day (76). The recommendation for iron is therefore to ensure an intake which meets
Stellenbosch University http://scholar.sun.ac.za

17
requirements and to include forms of iron that are readily absorbable (67). Iron deficiency
cannot be diagnosed on serum ferritin levels alone as this can be affected by an increased
plasma volume which is associated with a growth spurt and possibly also as an acute
response to exercise (69). Deakin (2006), has provided adequate approaches to detect and
clinical manage iron deficiency (130).
The recommended calcium intake is that amount which maintains calcium balance and
promotes optimum bone accretion rates (69). To obtain an optimal peak bone mass, it is
essential to meet calcium requirements during childhood and adolescence (67). There is no
EAR or RDA for calcium intake for youth. However, an adequate intake (AI) has been
recommended at 1300 mg/day for adolescent males (14-18 years) (76). An intake of
calcium of less than 400 mg/day is considered very low and negatively impacts on bone
development and health (134). During puberty, 26% of bone mineral is accrued (135). Many
studies have demonstrated the positive impact of activity, especially high impact activity, on
bone accrual (136). Goulding et al., (1998) found that in girls, bone fractures resulted from
poor bone quality and an increased rate of bone fracture was associated with lower bone
mineral density. Bone fractures have been shown to be associated with a low calcium intake
(137, 138) and lower levels of activity (138). The frequency of milk intake amongst male
adolescent learners in the Western Cape was investigated in the 2008 YRBS. This study
found that 55.1% consumed milk on four or more days of the week (52). The SA FBDG
recommended that milk and milk products be consumed daily (117). Although the intake of
additional milk products was not assessed, one might expect the calcium intake to be
compromised, as milk is a major source of calcium (117).
1.7 Dietary supplement intake in adolescent athletes
A dietary supplement is defined by Alves and Lima (2009), as “orally administered
substances used with the purpose of resolving a specific nutritional deficiency” (139). Dietary
supplements are often sold as ergogenic aids which can enhance athletic performance
(139). In 2009, the dietary supplement industry had an estimated worth of US$ 61 billion to
the US economy (140). The media has also played a huge role in stimulating the use of
dietary supplements as in 2001, US$ 46 billion was spent worldwide in advertisements to
promote its use (140, 141). Current evidence indicates that dietary supplementation may be
beneficial in only a small group of adults, including athletes, who have an unbalanced dietary
intake (140). Despite this, there seems to be an increased use amongst adolescent athletes,
regardless of whether an adequate diet was ingested (141). It has been found that the
Stellenbosch University http://scholar.sun.ac.za
18
prevalence of dietary supplementation usage varies to type of sports, cultural aspects, age
groups (higher prevalence in adolescents), and gender (more common in males) (142, 143).
In a survey in the UK among adolescent track and field athletes, 62% were found to be using
supplements, mainly vitamins and minerals, with the expectation of improved health,
immune system and exercise performance (144). In a Korean study of 1355 adolescent
athletes, it was found that 36% of males and females used vitamin and mineral supplements
(145). In the United States of America, supplement usage among adolescent athletes is
estimated to be 46% (146). A most recent study in 2012, in Germany, investigated dietary
supplement use among elite adolescent athletes and found that 91% reported dietary
supplement use in the previous month (189).
Although vitamin and mineral supplementation may be beneficial for adolescents consuming
inadequate diets, there is no evidence to support the view that general supplementation may
improve performance (69). Petrie et al., (2004) recommended that young athletes generally
increase their energy intake (through eating a varied diet) to meet their increased
requirements and thus should have an adequate intake of vitamins and minerals. Routine
supplement use is therefore not needed, unless a specific deficiency is diagnosed (67).
Factors which need to be considered when deciding to use a supplement include its efficacy,
safety and legality (147). Studies which have investigated the safety and performance-
enhancing effects of the majority of supplements on the market are limited. This is more so
in subpopulations, like young athletes (147). Safety issues regarding supplement use include
the possibility of taking toxic doses and medical conditions which may conflict with sports
nutrition goals and advice (147). Another safety issue is the purity of the products and the
risk of ingesting contaminants which can be harmful or banned by the anti-doping codes
under which the sport is organised (147). In 2000 to 2001, the International Olympic
Committee (IOC) funded a project in Cologne to analyse 634 supplements randomly
obtained over-the-counter and via the internet in 13 countries. This study found that 94 of the
supplements (15%) contained steroids which were undeclared on the product label and
banned by the World Anti-Doping Agency (WADA) (148). HFL Sports Science, a WADA
experienced laboratory, in the United Kingdom (UK) analysed 58 supplements purchased
over-the-counter in the USA in 2007. It found that 11% contained prohibited stimulants and
25% contained prohibited steroids (149). This was then followed up the following year, 2008,
on 152 products purchased in the UK, where it was found that 10% of the selected
supplements were contaminated with steroids/or stimulants (150).
Very often the information obtained when deciding to use a supplement is inaccurate. This
information usually originates from classmates, coaches, magazines, internet websites or
Stellenbosch University http://scholar.sun.ac.za

19
fellow gym partners (151). Furthermore, supplements are commonly sold at gyms or
pharmacies as over-the-counter products without any credible nutritional assessment or
advice being provided (141, 151, 152). Young athletes are thus widely exposed to
supplements which are easily accessible, potentially dangerous and which may be
contaminated by banned substances.
1.8 Statement of the Research Question
With the ever-increasing professionalism of football, the pressure placed on aspiring young
football players to perform has never been greater. However, many of the players in the
South African setting (and other developing countries) come from communities where a high
incidence of childhood and adolescent malnutrition exists (51, 52, 153). As previously
mentioned, South Africa is faced with a problem of the “double burden of malnutrition” where
both over- and under-nutrition are common (47). This is supported by the findings from the
2003 SADHS as well as the YRBS studies in 2002 and 2008 (51, 52, 153). Rosenbloom et
al., (2006) recommend that adolescents should be educated about nutrition at an early age
with the goal of improving their nutritional intake and thus their nutritional status as they get
older (25). Thus adopting this approach would address both issues of under- and over-
nutrition.
Limited data currently exist on nutritional intake and status of youth athletes, and youth
soccer players in particular. Information regarding nutritional status as well as training and
competition nutrition practices will assist clinicians and dietitians in implementing intervention
strategies aimed at optimising nutritional status of these players. This will ultimately support
them in realising their athletic potential as well as ensuring optimal development during this
critical growth phase, which already has increased nutritional demands. The researcher
decided to use a group of high-performance youth soccer players to investigate aspects of
anthropometry and nutritional intake to profile their nutritional status. It is important to
understand the nutritional needs of these athletes to enable the development of effective
programs that will improve the athlete’s dietary intakes and thus improve their performance.
Stellenbosch University http://scholar.sun.ac.za

20
CHAPTER 2: METHODOLGY
2.1. Aim
The aim of this study was to investigate the dietary intake and anthropometric profile of high-
performance adolescent soccer players (14-18 years of age) during the competitive season.
2.2. Objectives
To obtain anthropometric data on junior players (14-18 years of age) at a local
professional soccer club in the Western Cape (South Africa).
To obtain information regarding the dietary intake of junior players at the club (i.e.
total energy, macro- and micronutrient intake).
To determine nutrition practices of these junior players before, during and after
matches.
To determine fluid intake practices of these junior players before, during and after
matches.
To determine the use, if any, of dietary supplements amongst these junior
players.
To explore possible associations between macronutrient intake and the
anthropometric data obtained.
2.3. Study Design
The study design was a descriptive, observational study with an analytical component.
2.4. Study Population
The study population included junior players with an age range of 14-18 years, who played
for the Ajax Cape Town soccer club at the time of the study. All players who met the entry
criteria had the opportunity to participate in the study. A convenient sampling technique was
used. All athletes who attended the soccer training sessions upon the scheduled days of
data collection were approached to participate in this study.
2.5. Inclusion Criteria
All players who fulfilled the following criteria were included in the study:
Stellenbosch University http://scholar.sun.ac.za

21
Junior players who were playing for the Ajax Cape Town football club at the time
of data collection.
Players with an age range from 14-18 years old at the time of being interviewed.
Junior players who were willing to answer interviewer-administered questions.
Junior players who were willing to undergo anthropometric measurements
including weight, height, skinfold and circumference measurements.
Informed consent had to be provided by the guardian/parent of the participant.
2.6. Exclusion Criteria
There were no exclusion criteria.
2.7. Methods of Data Collection
The study was approved by the Health Research Ethics Committee (HREC), Faculty of
Health Sciences, Stellenbosch University on 10 October 2009 (reference number:
N09/03/089).
The Ajax Cape Town Football Club has a reputation for being progressive and always
striving to maximise their players’ development and potential. The head of the medical team
of the club was approached with the study proposal which was then presented to the rest of
the management team in order to obtain approval. Once approval was obtained from the
HREC and Ajax Cape Town Football Club, the researcher presented information sessions to
prospective study participants as well as provided written information regarding the study to
the parents of the players. All players, as well as their parents/guardians, signed a consent
form once they agreed to participate in the study. The researcher collected data at the Ajax
Cape Town Football Club premises. The parents/guardians were contacted if certain facts
needed to be clarified.
Data was collected as follows:
Each participant received verbal and written information about the purpose and procedures
of the study (Appendix 1). Prospective participants were provided with written information for
their parents/guardians (Appendix 2). The researcher, along with two other trained dietitians,
collected the data. Two soccer practice sessions of each team (U15, U17 and U19) were
utilised to collect data. Socio-demographic and anthropometrical data was collected in a
single session while the remaining questionnaires were self-administered by the participants
Stellenbosch University http://scholar.sun.ac.za

22
in the final session (Appendices 3, 4, 5). This session had at least three facilitators and the
participants were split into groups of no more than six per facilitator. The facilitator of each
group guided the participants through the questionnaire and assisted with answering any
queries. Each group had a set of food models, measuring equipment and utensils in front of
them to assist with quantifying food items in the food frequency questionnaire. The
questionnaire of each participant was checked by the facilitator at the end of the session to
ensure that there were no discrepancies. The anthropometrical data collected included
weight (kg), height (m), mid-arm circumference (cm) and the triceps and subscapular
skinfold (mm) measurements of each participant. A single measurer, who has been
accredited by Stellenbosch University, collected all the skinfold measurements.
2.7.1. Socio-demographic information
The socio-demographic (Appendix 3) information obtained from the participants included
date of birth, gender, ethnicity, age group in which they played, level of education and their
address.
2.7.2. Anthropometric measurements
All equipment used to obtain anthropometric data was supplied by Stellenbosch University,
Division Human Nutrition. Anthropometric measurements were obtained according to the
International Society for the Advancement of Kinanthropometry (ISAK) (154). A single, ISAK
accredited dietitian, collected all the skinfold measurements. To ensure privacy, all
anthropometric measurements were conducted and recorded in a private area (Appendix 4).
Body weight was measured with a digital scale (AND Precision Health Scale UC-300, USA)
to the nearest 0.1 kg. It was calibrated for accuracy by an accredited company (Lasec SA
(PTY) Ltd. Ndabeni, Cape Town). The scale was placed on an even, uncarpeted area and
the researcher zero calibrated the scale. The participants were weighed barefoot, wearing
training shorts and t-shirts and in an orthostatic position, before training. This procedure was
repeated and the average of the two readings was recorded. If the two readings varied by
more than 0.1 kg, a third reading was taken and the median was recorded.
Height measurements were done barefoot and read to the nearest 0.5cm from a fixed
standard stadiometer (Seca Leicester Height Measure, Deutschland) placed on an even,
uncarpeted area.
Participants were positioned facing the researcher. The shoulder blades, buttocks and heels
had to touch the measuring board. Their arms had to be relaxed at their sides with their legs
Stellenbosch University http://scholar.sun.ac.za

23
straight and knees together. Their heels were also together with their feet flat on the ground.
The participant had to look straight ahead and the head was maintained in the Frankfurt
plane position. The head piece was lowered to the crown of the head and the measurement
taken. An average of two measurements was used. If they differed by more than 0.5 cm, a
third reading was taken and the median was used.
Once the weight and height were established, the body mass index (BMI), using Quetelets’s
index (kg/m²), was calculated (155). The BMI-for-age was plotted on the World Health
organization (WHO) reference charts (156) and the z-score and percentile readings recorded
(Appendix 5). Height-for-age was plotted on the WHO reference charts (156) and the
corresponding z-score and percentile readings were recorded (Appendix 6).
2.7.3. Skinfold thickness measurements
Skinfold thickness measurements were taken with a Dial Gauge Harpenden Calliper to the
nearest 0.1mm. The skinfold thickness at the triceps and subscapular skinfold site was
measured as it is the most common approach used to assess body composition for young
people (157). These specific sites are advantageous because it is highly comparable to
other measures assessing body fatness, measurements taken are more reliable and
objective than other sites and there are international norms to interpret the measurements
(158). Standardised techniques were used to measure these skinfold measurements as
described by ISAK (154). Once the anatomical landmark and subsequent skinfold site was
identified it was marked with a pen. Two measurements at each site were taken in a
rotational order. The skin had to be dry and lotion-free as this may influence the
measurements. The measurements were taken before exercise as fluid shifts post-exercise
may alter the measurements (159). The average of two measurements was used but if the
measurements differed by more than 0.1mm, a third reading was taken and the median was
used. Assumptions made when using skinfold thickness include the fact that skinfolds
predict non-subcutaneous fat and more than 50% of the body’s fat is subcutaneous, the
thickness of skin is considered negligible, the compressibility of fat between subjects is
similar and the selected sites represent the average thickness of all subcutaneous fat (43).
Indices of fat mass and fat free mass were calculated. Mid-upper Arm circumference
(MUAC) is an indicator of muscle and subcutaneous adipose tissue (160). It is used to
determine arm muscle area (AMA) which is an index of muscle protein reserves and arm fat
area (AFA) which is an index of fat stores. Both measurements are therefore considered a
measure of nutritional status (160). The AMA and AFA, as described by Heymsfield et al.,
(1982), were calculated (161) and the percentiles determined and interpreted as
Stellenbosch University http://scholar.sun.ac.za

24
recommended by Frisancho AR, (160a, 160b, 162). MUAC is measured at the same site as
the tricep skinfold with the arm relaxed at the side of the participant and the palm facing up.
A non-stretchable tape measure was used and the measurement was taken to the nearest
0.1cm (43).
2.7.4. Dietary intake
The eating pattern of the soccer players was assessed with a question regarding the
frequency of intake of breakfast, lunch, supper as well as snacks in between. The options
ranged from 0-7 times per week.
Total energy, macronutrient and micronutrient intake was assessed using a quantified food
frequency questionnaire (QFFQ) (163) (Appendix 7). The Dietary Assessment and
Education Kit (DAEK) food list was used to create a food list of all foods which may be part
of an athlete’s diet (163). The food list was adapted to suit the South African population,
including ethnic diversity, and was reviewed by a panel of experts in the field of sport and
nutrition, (Eksteen et al., (2007), (163). Although this list was initially developed for marathon
runners, it was felt that it would still be applicable to the population of this study.
Respondents reported their usual intake over the past month. The frequency of intake was
categorised as 1-3 per month, 1-3 per week, 4-6 per week, 1 per day, 2 per day or 3/more
per day. The QFFQ estimates food portion size using household measures, food models as
well as line drawings of actual food models. A standard portion was described and the
players had to indicate if 1 x standard (std), ½ std, 1 ½ std, 2 x std or 3 x std was consumed.
The limitations of this method are that it may over- or under-estimate dietary intake and may
not be as accurate as the recall method. It does not allow one to identify day-to-day
variations in the diet. The actual food list can actually influence the results. If a food
frequency questionnaire was developed for a particular population it may not be applicable
to another (43). However, after careful consideration of a few factors, the QFFQ was
considered the method of choice for this study. It could be self-administered with minimum
respondent burden. It could be performed in a group with an experienced interviewer to
assist and further explain any concepts if required. A food diary would require a few days to
complete and considering the age of the respondents it may not have been well suited. A 24-
hour recall needs administration by an experienced interviewer and resources were limited in
staff and time with players.
Stellenbosch University http://scholar.sun.ac.za
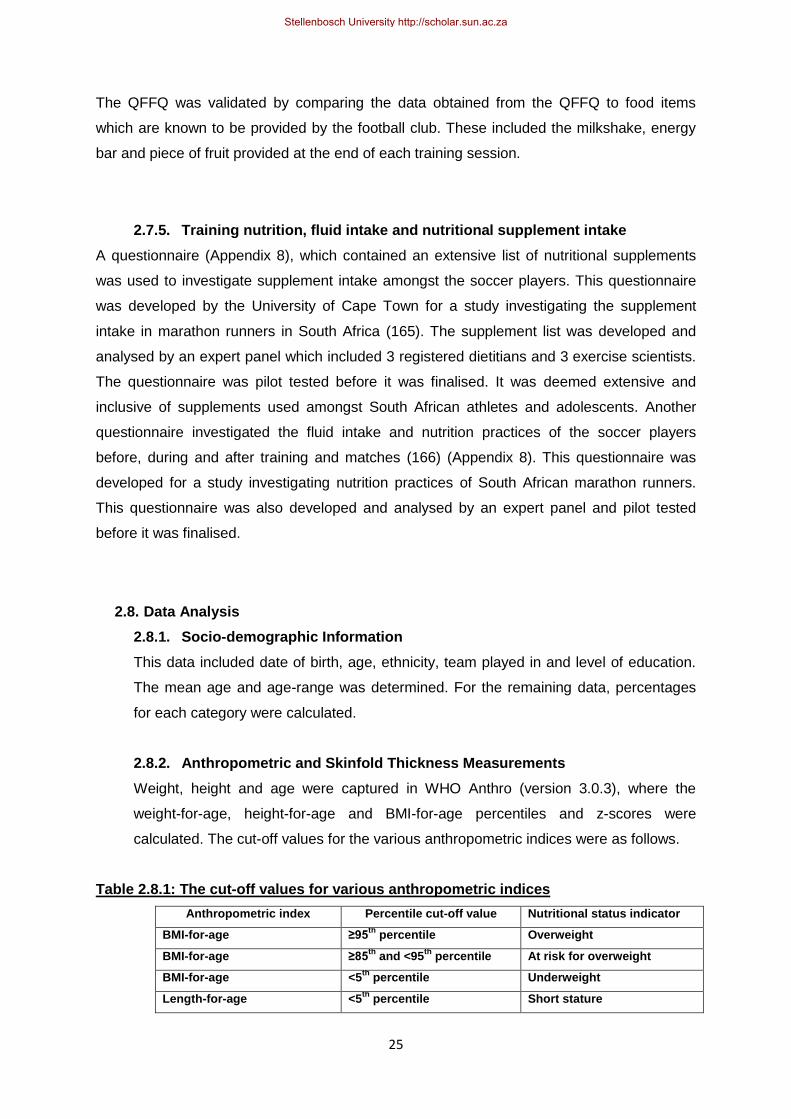
25
The QFFQ was validated by comparing the data obtained from the QFFQ to food items
which are known to be provided by the football club. These included the milkshake, energy
bar and piece of fruit provided at the end of each training session.
2.7.5. Training nutrition, fluid intake and nutritional supplement intake
A questionnaire (Appendix 8), which contained an extensive list of nutritional supplements
was used to investigate supplement intake amongst the soccer players. This questionnaire
was developed by the University of Cape Town for a study investigating the supplement
intake in marathon runners in South Africa (165). The supplement list was developed and
analysed by an expert panel which included 3 registered dietitians and 3 exercise scientists.
The questionnaire was pilot tested before it was finalised. It was deemed extensive and
inclusive of supplements used amongst South African athletes and adolescents. Another
questionnaire investigated the fluid intake and nutrition practices of the soccer players
before, during and after training and matches (166) (Appendix 8). This questionnaire was
developed for a study investigating nutrition practices of South African marathon runners.
This questionnaire was also developed and analysed by an expert panel and pilot tested
before it was finalised.
2.8. Data Analysis
2.8.1. Socio-demographic Information
This data included date of birth, age, ethnicity, team played in and level of education.
The mean age and age-range was determined. For the remaining data, percentages
for each category were calculated.
2.8.2. Anthropometric and Skinfold Thickness Measurements
Weight, height and age were captured in WHO Anthro (version 3.0.3), where the
weight-for-age, height-for-age and BMI-for-age percentiles and z-scores were
calculated. The cut-off values for the various anthropometric indices were as follows.
Table 2.8.1: The cut-off values for various anthropometric indices
Anthropometric index Percentile cut-off value Nutritional status indicator
BMI-for-age ≥95th
percentile Overweight
BMI-for-age ≥85th
and <95th
percentile At risk for overweight
BMI-for-age <5th
percentile Underweight
Length-for-age <5th
percentile Short stature
Stellenbosch University http://scholar.sun.ac.za
26
Skinfold measurements included triceps and subscapular skinfolds. The percentiles for
both were determined using the NHANES, 2003-2006, data (Appendices 9 and 10).
The sum of the triceps and subscapular skinfolds was also calculated and its
percentile was determined using the tables from Frisancho, AR, 1990 (Appendix 11).
The percentage body fat (%BF) was determined by the following equations which have
been validated for pubescent white males:
%BF= 1.21(TC+SS) - .008(TC+SS)2 - 3.4
and pubescent black males:
%BF= 1.21(TC+SS) - .008(TC+SS)2 - 5.2 (where SS = subscapular skinfold) (45)
(where TC = tricep skinfold)
As there were only 3 Caucasian players and there are no equations specific to the
mixed ancestry population, it was decided to use 1 equation for all the players
(pubescent black males).
2.8.3. Determining AMA, AMC, AFA from Skinfold Prediction Equations
The following equations were used to determine arm muscle circumference (AMC),
arm muscle area (AMA) and arm fat area (AFA).
AMC (mm) = MUAC – [π x TSF/10]
AMA (mm²) = (AMC)²/ (π x 4)
AFA (mm²) = MUAC²/(π x 4) - AMA
The percentiles for arm muscle area and arm fat area were determined using the
tables from Frisancho, AR, 1981 (Appendices 12 and 13).
2.8.4. Dietary Intake
Each item of food on the QFFQ was converted to consumed item in g/day. This
information was then captured and analysed in Medical Research Council (MRC)
Foodfinder III for Windows® (www.wamsys.co.za) to determine macronutrients and
micronutrients consumed. The usual intake of the players was thus determined from
the QFFQ. The nutritional requirements of each participant had to be calculated in
order to compare their usual intake to their recommended daily requirements. The
Schofield equation (167) was used to calculate the resting energy expenditure (REE)
of each player. As suggested by Carlsohn et al. (2011), a physical activity level (PAL)
of 1.75 to 2.05 was used to calculate total energy requirements (TER) (167). This
equation considers that players with varying levels of activity will have a difference in
their total energy expenditure (TEE) and therefore their (TER). The adequacy of the
players’ micronutrient intake was assessed by comparing it to the Dietary Reference
Stellenbosch University http://scholar.sun.ac.za

27
Intake (DRI). Players were regarded as having an inadequate micronutrient intake if
their intake was 67% below the DRI.
Energy requirement equation: TEE = REE x 1.75 – 2.05
2.8.5. Dietary Supplement Intake
Players were provided with an extensive list consisting of 27 dietary supplements. The
frequency of the use of supplements was assessed as players indicated whether or
not a particular supplement was used and how many days per week or month it was
used.
2.8.6. Training nutrition and fluid intake
The frequency of meals was assessed as well as the number of players who
consumed a specific meal at particular times. The mean fluid intake for matches as
well as training sessions was calculated. Assessment further involved the main
reasons players chose particular liquids at specific times as well as their subjective
rating of their concern regarding their fluid intake at specific times.
2.8.7. Statistical Analysis
The data obtained from the questionnaires were captured in MS Excel (version 2007)
and then analysed with STATISTICA version 9 [StatSoft Inc. (2009) STATISTICA (data
analysis software system), www.statsoft.com].
Summary statistics were used to describe the variables. Data was presented as
means ± standard deviation (SD), unless otherwise indicated. The distributions of
variables are presented with histograms and or frequency tables. Medians or means
were used as the measures of central location for ordinal and continuous responses.
The relationships between continuous response variables and nominal input variables
were analysed using ANOVA. Correlations among continuous and/or ordinal variables
were expressed using Spearman’s or Pearson’s correlation coefficients. Relations
between nominal variables were investigated with contingency tables and likelihood
ratio chi-square tests. A p-value of p<0.05 represents statistical significance in
hypothesis testing and 95% confidence intervals were used to describe the estimation
of unknown parameters.
Stellenbosch University http://scholar.sun.ac.za

28
CHAPTER 3: RESULTS
3.1. Socio-Demographic data
The total sample included N=39 high-performance adolescent soccer players currently
playing for the Ajax Cape Town Football Club. Their socio-demographic profile is
summarised in Table 3.1.1. The mean age is 16.26±1.27 years. The majority of the players
are of mixed ancestry ethnicity (66.6%, N=26) and currently in high school (89.7%, N=35).
Only one player admitted to smoking and has 4 cigarettes per day.
Table 3.1.1: Socio-demographic status
Demographic category N (of 39 total) Percentage (%)
Age
14 15 16 17 18
4 8 8 12 7
10.3 % 20.5 % 20.5 % 30.8 % 18.0 %
Ethnicity
Black (African) Caucasian Mixed ancestry
10 3 26
25.6 % 7.7 % 66.6 %
Education
Secondary1
Tertiary2
35 4
89.7 % 10.3 %
Smoking
Yes No
1 (4cigarettes/day) 38
2.6 % 97.4 %
1
High-school, Grade 8-12
2 College/Technicon
The soccer-playing history and record of additional physical activity sessions of the study
population is depicted in Table 3.1.2. Each player in all the teams has 4 training days per
week and each training session lasts 2 hours. Some players participate in as many as three
additional physical activity sessions every week. There are 56.4% of players who participate
in one additional activity, 23.1% participated in two additional activities and 12.8%
participated in three additional activities per week.
Table: 3.1.2: Playing history and training load
N (of 39 total) Mean±SD
Years of playing soccer a
39 10.4±2.5
Soccer training sessions
Days per week Hours per session Hours per week
39
4 2 8
Soccer Matches
Minutes played per match
39
63.0±20.9
1 additional activityb
Stellenbosch University http://scholar.sun.ac.za

29
aTotal years of playing soccer, not only years playing for a club
bAdditional activities were regarded as any physical activities which players participated in besides
the specified soccer training and matches at the club
3.2. Anthropometric and skinfold thickness data
The weight and skinfold thickness classifications of the high-performance adolescent soccer
players are depicted in Tables 3.2.1 and 3.2.2 respectively. The mean weight is 64.4±7.2 kg.
Height-for-age z-score (stunting index), is all between -1.99 and 1.99 and therefore all within
the normal range. The mean height is 172.0±5.4 cm. Based on their BMI-for-age, most of the
players (87.2%, N=34) are classified as normal weight, and none of the players are
classified as underweight. The mean BMI is 21.7±2.0 kg/m2. The mean BMI-for-age falls on
the 65th percentile.
Table 3.2.1: Weight classification according to WHO BMI percentiles
Overweight
>95th
percentile
Risk for overweight
85th
– 95th
percentile
Normal weight
5th
to 85th
percentile
Underweight
< 5th
percentile
%
2.56 % (N=1) 10.26 % (N=4) 87.18 % (N=34) 0 %
Most of the players fall into the above-average classification for all of the skinfold
measurements. This includes triceps (56.4%, N=22), subscapular (59.0%, N=23), sum of
two skinfolds (71.8%, N=28), AMA (82.1%, N=32), AMC (56.4%, N=22) and AFA (56.4%, N
=22). The mean percentage body fat is 10.9±3.5%, within the recommended range of 7.6-
12.1%.
Table 3.2.2: Skinfold classification according to percentiles (NHANES 2003-2006 and
Frisancho, AR 1990)
Percentile categories Classification (sedentary adolescents)
%
Triceps
≤5
th
>5th
but ≤15th
>15th
but ≤85th
>85th
but ≤95th
>95th
Lean Below average Average Above average Excess fat
0% 5.1 % (N=2) 38.5 % (N=15) 56.4 % (N=22) 0 %
Hours per week 13 2.0±1.7
2 or more Additional activities
b
Hours per week
9
6.9±3.1
Stellenbosch University http://scholar.sun.ac.za

30
Subscapular
≤5
th
>5th
but ≤15th
>15th
but ≤85th
>85th
but ≤95th
>95th
Lean Below average Average Above average Excess fat
0 % 10.3 % (N=4) 30.8 % (N=12) 59.0 % (N=23)
0 %
Sum of skinfolds
≤5th
>5
th but ≤15
th
>15th
but ≤75th
>75th
but ≤85th
>85th
Lean Below average Average Above average Excess fat
0 % 5.1 % (N=2) 18.0 % (N=7) 71.8 % (N=28) 5.1 % (N=2)
Arm muscle area
≤5th
>5
th but ≤15
th
>15th
but ≤85th
>85th
but ≤95th
>95th
Wasted Below average Average Above average High muscle
0 % 2.6 % (N=1) 7.7% (N=3) 82.1 % (N=32) 7.7% (N=3)
Arm muscle circumference
≤5
th
>5th
but ≤25th
>25th
but ≤75th
>75th
but ≤95th
>95th
Wasted Below average Average Above average High muscle
0 % 2.6 % (N=1) 28.2% (N=11) 56.4 % (N=22) 12.8% (N=5)
Arm fat area
≤5
th
>5th
but ≤25th
>25th
but ≤75th
>75th
but ≤95th
>95th
Lean Below average Average Above average Excess fat
0 % 5.1 % (N=2) 33.3% (N=13) 56.4 % (N=22) 5.1% (N=2)
3.3. Energy expenditure, dietary energy and macronutrient intake data
The total energy expenditure (TEE) for this group (as calculated from resting energy
expenditure and a PAL range of 1.75 – 2.05) is 3146.9±213.4 to 3686.4±250.0 kcal/day.
The energy- and macronutrient intake of high-performance adolescent soccer players is
depicted in Table 3.3.1. The mean energy intake is 4374.0±1462.4 kcal and exceeds the
maximum TEE by 118.7%. The macronutrient intake also exceeds recommendations for
athletes. The mean protein intake is 155.6±53.3 g/day (14.2% TEI, 2.4 g/kg BM/day), the
mean carbohydrate intake is 556.8±172.1 g/day (50.9% TEI, 8.6 g/kg BM/day) and the mean
fat intake is 148.8±67.8 g/day (30.6% of TEI, 2.3 g/kg BM/day). The percentages of SFA
(9.9% of TEI) and PUFA (7.2% of TEI) are in line with recommendations, whilst the
percentage MUFA is slightly below recommendations (9.6% of TEI). The mean intake of
cholesterol is 545.5±230.1 mg/day which is above the recommended level. There are 4
players who admitted to drinking alcohol once a week with amounts ranging from 6.1-48.9
Stellenbosch University http://scholar.sun.ac.za

31
g/week. The mean intake of fibre is 44.0±14.6 g/day, therefore exceeding recommendations
by 115.8%.
3.3.1 Consumption of meat and meat products
In table 3.3.2 the frequency of consumption of specific food items is investigated. The
majority of players eat meat 1 to 3 times per week, of which 48.7% (N=19) eat low-fat red
meat, 51.3% (N=20) high-fat red meat, 33.3% (N=13) hamburgers and 51.3% (N=20)
sausage. Meat stew was not very common with two thirds never eating it (66.7%, N=26).
3.3.2 Consumption of milk
Almost half of the players (43.6%, N=17), drink full cream milk more than 4 times per week.
Although most players (76.9%, N=30) do not report the regular consumption of low fat milk,
Ajax CT does provide a low-fat flavoured milk drink to all players at each training session,
which was reported separately.
3.3.3 Consumption of fruit and vegetables
Fruit which are not consumed by the majority of the players includes peaches/apricots
(51.3%, N=20), Melons (61.5%, N-24), Guavas (51.3%, N=20), Mangos/paw paw (51.3%,
N=20), grapes (51.3%, N=20) and strawberries (51.3%, N=20).
The most regularly consumed vegetable is mixed vegetables where 33.3% (N=13) of players
consume it 1-3 times per week.
3.3.4 Consumption of sweets and added sugar
More than half of the players consume energy bars 4 or more times a week (51.3%, N=20)
and added sugar 4 or more times a week (53.8%, N=21).
3.3.5 Consumption of beverages
Coke®/Pepsi® were the most regularly consumed carbonated drinks with 51.3% (N=20)
consuming it at least 1-3 times per week. Sport drinks were also regularly consumed (1-3
times per week) by 48.7% (N=19) of players. Orange juice and other juice were both
consumed by more than a third (35.9%, N=14) of players 1-3 times per week.
Table 3.3.1: Energy and macronutrient intake of high-performance adolescent soccer
players
Mean intake ±SD From QFFQ
Recommendation % intake of recommendation
% players below recommendation
Energy (kcal/day) 4374.0±1462.4
REE x 1.75 a
– 2.05 b
3146.9±213.4 -3686.4±250.0
118.7%f 23.1 % (N=9)
Stellenbosch University http://scholar.sun.ac.za
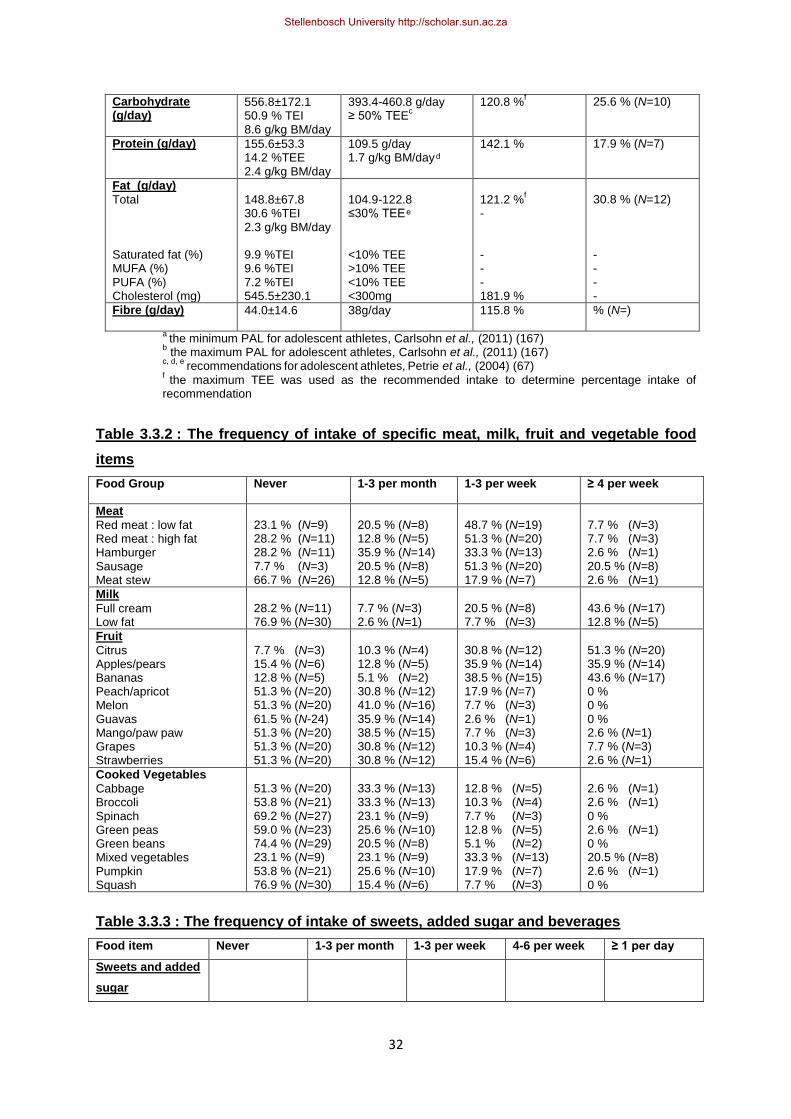
32
Carbohydrate (g/day)
556.8±172.1 50.9 % TEI 8.6 g/kg BM/day
393.4-460.8 g/day ≥ 50% TEE
c
120.8 %f
25.6 % (N=10)
Protein (g/day) 155.6±53.3 14.2 %TEE 2.4 g/kg BM/day
109.5 g/day 1.7 g/kg BM/day
142.1 %
17.9 % (N=7)
Fat (g/day)
Total Saturated fat (%) MUFA (%) PUFA (%) Cholesterol (mg)
148.8±67.8 30.6 %TEI 2.3 g/kg BM/day 9.9 %TEI 9.6 %TEI 7.2 %TEI 545.5±230.1
104.9-122.8 ≤ 0% TEE <10% TEE >10% TEE <10% TEE <300mg
121.2 %
f
- - - - 181.9 %
30.8 % (N=12) - - - -
Fibre (g/day) 44.0±14.6 38g/day 115.8 % % (N=)
a
the minimum PAL for adolescent athletes, Carlsohn et al., (2011) (167) b the maximum PAL for adolescent athletes, Carlsohn et al., (2011) (167)
c, d, e recommendations
for
adolescent
athletes,
Petrie et al., (2004) (67)
f the maximum TEE was used as the recommended intake to determine percentage intake of
recommendation
Table 3.3.2 : The frequency of intake of specific meat, milk, fruit and vegetable food
items
Food Group Never 1-3 per month 1-3 per week ≥ 4 per week
Meat
Red meat : low fat Red meat : high fat Hamburger Sausage Meat stew
23.1 % (N=9) 28.2 % (N=11) 28.2 % (N=11) 7.7 % (N=3) 66.7 % (N=26)
20.5 % (N=8) 12.8 % (N=5) 35.9 % (N=14) 20.5 % (N=8) 12.8 % (N=5)
48.7 % (N=19) 51.3 % (N=20) 33.3 % (N=13) 51.3 % (N=20) 17.9 % (N=7)
7.7 % (N=3) 7.7 % (N=3) 2.6 % (N=1) 20.5 % (N=8) 2.6 % (N=1)
Milk
Full cream Low fat
28.2 % (N=11) 76.9 % (N=30)
7.7 % (N=3) 2.6 % (N=1)
20.5 % (N=8) 7.7 % (N=3)
43.6 % (N=17) 12.8 % (N=5)
Fruit
Citrus Apples/pears Bananas Peach/apricot Melon Guavas Mango/paw paw Grapes Strawberries
7.7 % (N=3) 15.4 % (N=6) 12.8 % (N=5) 51.3 % (N=20) 51.3 % (N=20) 61.5 % (N-24) 51.3 % (N=20) 51.3 % (N=20) 51.3 % (N=20)
10.3 % (N=4) 12.8 % (N=5) 5.1 % (N=2) 30.8 % (N=12) 41.0 % (N=16) 35.9 % (N=14) 38.5 % (N=15) 30.8 % (N=12) 30.8 % (N=12)
30.8 % (N=12) 35.9 % (N=14) 38.5 % (N=15) 17.9 % (N=7) 7.7 % (N=3) 2.6 % (N=1) 7.7 % (N=3) 10.3 % (N=4) 15.4 % (N=6)
51.3 % (N=20) 35.9 % (N=14) 43.6 % (N=17) 0 % 0 % 0 % 2.6 % (N=1) 7.7 % (N=3) 2.6 % (N=1)
Cooked Vegetables
Cabbage Broccoli Spinach Green peas Green beans Mixed vegetables Pumpkin Squash
51.3 % (N=20) 53.8 % (N=21) 69.2 % (N=27) 59.0 % (N=23) 74.4 % (N=29) 23.1 % (N=9) 53.8 % (N=21) 76.9 % (N=30)
33.3 % (N=13) 33.3 % (N=13) 23.1 % (N=9) 25.6 % (N=10) 20.5 % (N=8) 23.1 % (N=9) 25.6 % (N=10) 15.4 % (N=6)
12.8 % (N=5) 10.3 % (N=4) 7.7 % (N=3) 12.8 % (N=5) 5.1 % (N=2) 33.3 % (N=13) 17.9 % (N=7) 7.7 % (N=3)
2.6 % (N=1) 2.6 % (N=1)
0 % 2.6 % (N=1) 0 % 20.5 % (N=8) 2.6 % (N=1) 0 %
Table 3.3.3 : The frequency of intake of sweets, added sugar and beverages
Food item Never 1-3 per month 1-3 per week 4-6 per week ≥ 1 per day
Sweets and added
sugar
Stellenbosch University http://scholar.sun.ac.za

33
Boiled Sweets
Energy sweets
Chocolate
Energy bar
Added sugar
(tea/coffee)
41.0 % (N=16)
38.5 % (N=15)
20.5 % (N=8)
17.9 % (N=7)
15.4 % (N=6)
15.4 % (N=6)
25.6 % (N=10)
10.3 % (N=4)
10.3 % (N=4)
7.7 % (N=3)
23.1 % (N=9)
17.9 % (N=7)
38.5 % (N=15)
20.5 % (N=8)
23.1 % (N=9)
2.6 % (N=1)
7.7 % (N=3)
12.8 % (N=5)
30.8 % (N=12)
7.7 % (N=3)
17.9 % (N=7)
10.3 % (N=4)
17.9 % (N=7)
20.5 % (N=8)
46.2 % (N=18)
Beverages
Carbonated
(Coke®/Pepsi®)
Carbonated (other)
Sports drink
Orange juice
Other juice
Cordial
20.5 % (N=8)
64.1 % (N=25)
15.4 % (N=6)
28.2 % (N=11)
23.1 % (N=9)
43.6 % (N=17)
7.7 % (N=3)
20.5 % (N=8)
15.4 % (N=6)
12.8 % (N=5)
25.6 % (N=10)
17.9 % (N=7)
51.3 % (N=20)
10.3 % (N=4)
48.7 % (N=19)
35.9 % (N=14)
35.9 % (N=14)
30.8 % (N=12)
7.7 % (N=3)
5.1 % (N=2)
7.7 % (N=3)
10.3 % (N=4)
10.3 % (N=4)
5.1 % (N=2)
12.8 % (N=5)
0 %
12.8 % (N=5)
12.8 % (N=5)
5.1 % (N=2)
2.6 % (N=1)
3.4. Dietary micronutrient data
The vitamin and mineral intake of high-performance adolescent soccer players is presented
in Table 3.4.1. The mean vitamin and mineral intake for the group as a whole meets the
EAR/AI for all vitamins and minerals. There are however a few individual players who have
intakes less than 67% of the EAR/AI for the following vitamins and minerals: vitamins A
(307.4±70.3 µg, 10.3%, N=4), D (2.4±0.7 µg, 15.4%, N=6), E (2.8±1.7 mg, 5.1%, N=2) and K
(25.3±15.3 µg, 20.5%, N=8), calcium (719.7±135.8 mg, 7.7%, N=3), chromium (16.6 µg,
2.6%, N=1), and iodine (46.4±14.3 µg, 30.8%, N=12). The calcium:protein ratio is 4.6:1
which is significantly below the recommended ratio (20:1). The mean intake of sodium is
4041.5±1226.7 mg/day which is nearly double the recommended 2300mg. The dietary
intake data did not consider dietary supplement intake, except for energy bars and CHO
energy drinks, as it was part of the QFFQ. The usage of other sporting supplements was
very low in this cohort and thus not included in the dietary intake analysis.
Table : 3.4.1: The vitamin and mineral intake of high-performance adolescent soccer
players
Micronutrient Mean ± SD DRIa % of DRI % players < 67%
EAR/AI
Water soluble vitamins
Thiamine (mg) Riboflavin (mg) Niacin (mg) Vitamin B6 (mg) Folic acid (µg)
2.7±0.7 4.5 ±2.2 41.6±13.8 3.2±1.1 577.2±185.6
1.0mg 1.1mg 12.0mg 1.1mg 330.0µg
270.0 % 409.1 % 346.7 % 291.0 % 174.9 %
0 % 0 % 0 % 0 % 0 %
Stellenbosch University http://scholar.sun.ac.za

34
Vitamin B12 (µg) Pantothenic acid (mg) Vitamin C (mg)
11.3±7.8 12.8±4.8 278.4±181.7
2.0µg 5.0mg 63.0mg
565.0 % 256.0 % 441.9 %
0 % 0 % 0 %
Fat soluble vitamins
Vitamin A (µg) Vitamin D (µg) Vitamin E (mg) Vitamin K (µg)
1947.4±1344.5 8.6±4.5 24.5±12.6 95.2±71.1
630.0µg 5.0µg 12.0mg 75.0µg
309.1 % 172.0 % 204.2 % 126.9 %
10.3 % (N=4)
15.4 % (N=6) 5.1 % (N=2) 20.5 % (N=8)
Minerals
Calcium (mg) Phosphorous (mg) Magnesium (mg) Iron (mg) Zinc (mg) Iodine (µg) Chromium (µg)
1604.5±604.3 2480.8±795.2 571.4±189.0 22.1±6.5 19.7±6.5 81.7±30.8 128.7±59.3
1300.0mg 1055.0mg 340.0mg 7.7mg 8.5mg 95.0µg 35.0µg
123.4 % 235.1 % 168.1 % 287.0 % 231.8 % 86.0 % 367.7
7.7 % (N=3) 0 % 0 % 0 % 0 % 30.8 % (N=12) 2.6 % (N=1)
aDRI, 2006 (76)
3.5. Training nutrition data
The frequency of consumption of specified meals or snacks by high-performance adolescent
soccer players is depicted in Figure 3.5.1. The majority (61.5%, N=24) eat breakfast
everyday while 5.1% (N=2) never eat breakfast. Similarly, 66.7% (N=26) of the players
always have lunch while 10.3% (N=4) never have a midday meal. Supper is definitely the
most regularly eaten meal by players with 97.4% (N=38) eating supper daily. Daily snacking
is not common with only 15.4% (N=6) having a mid-morning snack, 35.9% (N=14) having a
mid-afternoon snack and 18.0% (N=7) having an after-dinner snack. Mid-afternoon snacking
on at least 4 or more days of the week is reported by 69.2% (N=27) of players. The number
of players having a morning as well as a mid-afternoon snack is 15.4% (N=6), a mid-morning
and an evening snack is 12.8% (N=5) and a morning and an evening snack is 10.3% (N=4).
The club provides a snack after training (4 days of the week) which includes a flavoured milk
drink, citrus fruit and an energy bar. The intake of these snacks are reflected in the QFFQ as
follows, 100% (N=39) consume the milk drink, 85.0% (N=33) the energy bar and 97.4%
(N=38) the citrus fruit.
Stellenbosch University http://scholar.sun.ac.za

35
Figure 3.5.1: Meal pattern of high-performance adolescent soccer players
Figure 3.5.2 presents the data regarding how players subjectively rate their concern
regarding their food intake pre-, during and post-exercise. There seems to be an equal
number of players who always have concerns (25.6%, N=10) vs. those who never have
concerns (30.8%, N=12) 24 hours prior to a match.
Stellenbosch University http://scholar.sun.ac.za

36
Figure 3.5.2: Subjective rating by high-performance adolescent soccer players of their
concern regarding their food intake before, during and after exercise
Table 3.5.3 depicts the preference for taking a specific meal or drink before, during or after
exercise. The data shows that the majority of players do not have or only occasionally have
a specific meal or drink 24 hours prior to a match, during a match and during recovery.
However, most players (51.3%, N=20) will have a specific meal or drink during training.
Table 3.5.3: Dietary intake before, during and after exercise
Almost never
(%)
Sometimes
(%)
Often
(%)
Almost always
(%)
During training
10.3 % (N=4)
28.2 % (N=11) 10.3 % (N=4)
51.3 % (N=20)
24 hours prior to a
match
46.2 % (N=18)
20.5 % (N=8)
5.1 % (N=2)
28.2 % (N=11)
During a match
65.8 % (N=25/38 a
)
23.7 % (N=9/38 a
)
5.3 % (N=2/38 a
)
5.3 % (N=2/38 a
)
During recovery
33.3 % (N=13) 25.6 % (N=10) 5.1 % (N=2) 35.9 % (N=14)
a there was 1 non-responders in this question, therefore N=38
Stellenbosch University http://scholar.sun.ac.za

37
Table 3.5.4 presents the main reasons that study participants provided for selecting a
specific meal or drink before, during or after exercise. It is interesting to note that at least half
of the participants (56.4%, N=22) have a specific meal or drink during training as it is
provided by the Ajax Football Club.
Table 3.5.4: The main reasons for selecting a specific meal or food item before, during
and after exercise
To provide energy
(%)
To carbo-load
(%)
To provide
protein
(%)
Provided by Ajax
(%)
During training
35.9 % (N=14/39)
7.7 % (N=3/39)
0.0 % (N=0/39)
56.4 % (N=22/39)
24 hours prior
to a match
35.7 % (N=10/28 a
)
35.7 % (N=10/28 a
)
14.3 % (N=4/28 a
)
14.3 % (N=4/28 a
)
During a match
62.5 % (N=10/16 b
)
0.0 % (N=0/16 b
)
6.3 % (N=1/16 b
)
31.3 % (N=5/16 b
)
During
recovery
40.6 % (N=13/32 c)
6.3 % (N=2/32 c
)
15.6 % (N=5/32 c
)
37.5 % (N=12/32 c
)
a there were 11 non-responders in this question, therefore N=28
b there were 23 non-responders in this question, therefore N=16
c there were 7 non-responders in this question, therefore N=32
3.6. Fluid intake data
The mean fluid intake during a 60-80-minute match is 479.1±163.1 ml and during a 2-hour
training session is 597.7±281.0 ml. The subjectively rated concern regarding fluid intake pre-
, during and post-exercise is presented in Table 3.6.1. The majority of players only consider
their fluid intake during a match (51.3%, N=20). This is interesting to note as their fluid intake
(ml/minute) during a match and a training session is similar.
Table 3.6.1: Subjective rating by high-performance adolescent soccer players
regarding their concern of fluid intake before, during and after exercise
Almost never
(%)
Sometimes
(%)
Often
(%)
Always
(%)
During training 28.2 % (N=11)
33.3 % (N=13)
12.8 % (N=5)
25.6 % (N=10)
24 hours prior
to a match
15.4 % (N=6)
30.8 % (N=12) 15.4 % (N=6)
38.5 % (N=15)
During a match 15.4 % (N=6) 23.1 % (N=9) 10.3 % (N=4)
51.3 % (N=20)
Stellenbosch University http://scholar.sun.ac.za

38
During
recovery
28.2 % (N=11)
18.0 % (N=7) 20.5 % (N=8)
33.3 % (N=13)
The main reasons high-performance adolescent soccer players drink specific amounts of
fluid at specified times is depicted in Figure 3.6.2. Most players drink to thirst during training
(71.1%, N=27), 24-hours before a match (39.4%, N=13), during a match (86.8%, N=33) as
well as during recovery (47.4%, N=18). Interesting to note that 36.4% (N=12) of players drink
according to a predetermined schedule 24 hours prior to a match.
Figure 3.6.1: The main reasons provided for fluid intake of high-performance
adolescent soccer players before, during and after exercise
Figure 3.6.3 presents the main reasons high-performance adolescent soccer players drank
water, a CHO sports drinks, Coca-Cola®/Pepsi® or any other drink during a match. A sports
drink was classified as a drink containing fluid, electrolytes and carbohydrates while any
other drink would be any beverage which was not water, a sports drink or Coca-
Cola®/Pepsi®. The percentage of players drinking water to quench thirst was 59.0% (N=23),
and 64.1% (N=25) drank a CHO sports drink to provide energy.
Stellenbosch University http://scholar.sun.ac.za

39
Figure 3.6.1: The main reasons provided by high-performance adolescent soccer
players for selecting a specific fluid to drink during a match
3.7. Dietary supplement intake data
The data regarding the use of supplements amongst high-performance adolescent soccer
players is presented in Table 3.7.1. From the table it is clear that apart from energy bars and
CHO energy drinks, supplement usage amongst players is not common. Thus the two most
widely used supplements by far are energy bars (100%, N=39) and CHO energy drinks
(92.3%, N=36), with its respective use ranging from daily, weekly to monthly.
Table 3.7.1: The use of supplements amongst high-performance adolescent soccer
players
Supplement types Pattern of usage
Do not use
Daily
Weekly
Monthly
Multivitamin and mineral Vitamin C Vitamin E Vitamin B complex Energy tonic Immune Support
71.8 % (N=28)
59.0 % (N=23) 84.6 % (N=33)
87.2 % (N=34) 61.5 % (N=24)
89.7 % (N=35)
12.8 % (N=5)
23.1 % (N=9) 5.1 % (N=2)
5.1 % (N=2) 7.7 % (N=3)
0 %
10.3 % (N=4)
7.7 % (N=3) 7.7 % (N=3)
5.1 % (N=2) 20.5 % (N=8)
2.6 % (N=1)
5.1 % (N=2)
10.3 % (N=4) 2.6 % (N=1)
2.6 % (N=1) 10.3 % (N=4)
7.7 % (N=3)
Stellenbosch University http://scholar.sun.ac.za

40
Zinc Magnesium Calcium Iron Antioxidant mix CHO Energy drinks Energy bars Carboloader Protein supplement Amino acids Meal replacement Recovery drink Creatine HMB Cramp attack Endurox Carnitine Glutamine Testosterone enhancers DHEA Caffeine
94.9 % (N=37) 87.2 % (N=34 ) 82.1 % (N=32) 82.1 % (N=32) 100 % (N=39) 7.7 % (N=3) 0 % 71.8 % (N=28) 76.9 % (N=30) 94.9 % (N=37) 84.6 % (N=33) 76.9 % (N=30) 97.4 % (N=38) 100 % (N=39)
97.4 % (N=38) 100 % (N=39)
97.4 % (N=38) 100 % (N=39)
100 % (N=39) 97.4 % (N=38)
76.9 % (N=30)
0 % 2.6 % (N=1) 5.1 % (N=2) 7.7 % (N=3) 0 % 20.5 % (N=8) 82.1 % (N=32)
5.1 % (N=2) 2.6 % (N=1) 0 7.7 % (N=3) 10.3 % (N=4) 0 % 0 % 0 % 0 % 0 % 0 % 0 % 0 % 10.3 % (N=4)
2.6 % (N=1) 5.1 % (N=2) 7.7 % (N=3) 5.1 % (N=2) 0 % 69.2 % (N=27)
15.4 % (N=6) 15.4 % (N=6) 10.3 % (N=4) 2.6 % (N=1) 5.1 % (N=2) 7.7 % (N=3) 0 % 0 % 2.6 % (N=1) 0 % 0 % 0 % 0 % 0 % 12.8 % (N=5)
2.6 % (N=1) 5.1 % (N=2) 5.1 % (N=2) 5.1 % (N=2) 0 % 2.6 % (N=1) 2.6 % (N=1) 7.7 % (N=3) 10.3 % (N=4) 2.6 % (N=1) 2.6 % (N=1) 5.1 % (N=2) 2.6 % (N=1) 0 % 0 % 0 % 2.6 % (N=1) 0 % 0 % 2.6 % (N=1)
0 %
3.8. The exploration of possible associations between macronutrient intake and
anthropometric data
Correlation studies were performed on dietary intake data against specific anthropometric
measures. The Spearman Rank Order Correlation coefficient (r) was negative for all tests.
For total energy intake vs. weight, r = -0.15 (p=0.36); total energy vs. BMI, r = -0.17 (p=0.30);
total fat intake vs. AFA, r = -0.37 (p=0.02); total fat intake vs. percentage body fat, r = -0.31
(p=0.05); total protein intake vs. AMA, r = -0.14 (p=0.39) and total protein intake vs. AMC, r =
-0.14 (p=0.40). The observed correlation therefore implies that as total energy intake
increased, weight and BMI decreased. In addition, as fat intake increased, AFA and
percentage body fat decreased. Also, as protein intake increased, AMA and AMC
decreased. None of the correlations reached significance, except for total fat intake vs. AFA.
Stellenbosch University http://scholar.sun.ac.za

41
3.9 Sub-group analysis
There were large SD variations in the dietary intake data, especially with the regards to the
macronutrient intake. In addition to this, a negative correlation was detected between dietary
intake data and specific anthropometric data. The data was therefore further statistically
analysed by dividing the participants according to their level of physical activity. They were
divided into two groups where group 1 (43.6%, N=17) included players who participated in
the mandatory soccer training sessions and soccer matches and group 2 (56.4%, N=22)
included players who participated in the mandatory soccer activities as well as additional
physical activities. There were no specific criteria for group 2 regarding the minimum number
of hours per week spent during additional physical activities. Some players participated in
one additional activity (33.3%, N=13) with a mean duration spent on this activity of 2.0±1.7
hours/week. Others participated in 2 or more activities (23.1%, N=9) with a mean duration of
6.9±3.1 hours spent per week. The mean age, weight and height of the 2 groups are
displayed in table 3.9.1 and is comparable between the groups. Although the mean BMI
(p=0.21) and percentage body fat (p=0.32) is lower in the group with a higher PAL, it is not
significant.
The categorical anthropometrical data per sub-group is displayed in table 3.9.2. The
percentage of players who fall into the above average category for the triceps (p = 0.37),
subscapular (p = 0.69), sum of two skinfolds (p = 0.85) and AFA (p = 0.16) is also lower in
the group with a higher level of activity but this is also not significant. In contrast, the
percentage of players who fall into the above average category for the AMC (p = 0.31) and
AMA (p = 0.38) is higher in the group with a higher level of activity. This is also not
significant.
The dietary intake per sub-group is displayed in table 3.9.3. The TEI (p = 0.34), CHO (p =
0.47) intake, protein intake (p = 0.37) and fat intake (p = 0.63) increases with a higher level
of activity. However this is not significant.
Table 3.9.1:Mean age, weight, height and percentage body fat per sub-group
Mean All groups
N=39
Soccer only
N=17
Soccer +
additional
activities
N=22
p-value*
Age 16.3±1.3 16.4±1.3 16.2±1.3 0.68
Weight 64.4±7.2 65.5±6.7 63.6±7.7 0.42
Height 172.0±5.4 171.7±5.8 172.3±5.2 0.75
BMI 21.7±2.0 22.2±1.9 21.4±2.1 0.21
Stellenbosch University http://scholar.sun.ac.za

42
Percentage body
fat
10.9±3.5 11.5±3.6 10.4±3.4 0.32
* t-test
The main finding in table 3.9.1 is that although weight, BMI and percentage body fat is
slightly lower in the group which participates in additional physical activities – this difference
did not reach significance.
Table 3.9.2: The anthropometrical distribution per sub-group
Classification All groups
N=39
Soccer only
N=17
Soccer +
additional
activities
N=22
p-value*
Weight-for age
Underweight Normal weight Risk of overweight Overweight
N=0 N=34 N=4 N=1
N=0 N=13 N=4 N=0
N=0 N=21 N=0 N=1
0.01
Triceps
Lean Below average Average Above average Excess fat
N=0 N=2 N=15 N=22 N=0
N=0 N=0 N=6 N=11 N=0
N=0 N=2 N=9 N=11 N=0
0.37
Subscapular
Lean Below average Average Above average Excess fat
N=0 N=4 N=12 N=23 N=0
N=0 N=2 N=4 N=11 N=0
N=0 N=2 N=8 N=12 N=0
0.69
Sum of Skinfolds
Lean Below average Average Above average Excess fat
N=0 N=2 N=7 N=28 N=2
N=0 N=1 N=2 N=13 N=1
N=0 N=1 N=5 N=15 N=1
0.85
AMA
Wasted Below average Average Above average High muscle
N=0 N=1 N=3 N=32 N=3
N=0 N=1 N=2 N=12 N=2
N=0 N=0 N=1 N=20 N=1
0.38
AMC
Wasted Below average Average Above average High muscle
N=0 N=1 N=11 N=22 N=5
N=0 N=1 N=6 N=7
N=3
N=0 N=0 N=5 N=15 N=2
0.31
AFA
Lean Below average Average Above average Excess fat
N=0 N=2 N=13 N=22 N=2
N=0 N=1 N=3 N=11
N=2
N=0 N=1 N=10 N=11 N=0
0.16
*Pearson’s Chi square
Stellenbosch University http://scholar.sun.ac.za

43
The main finding in table 3.9.2 is that the majority of players (N=21) who participate in
additional physical activities are categorised as normal weight. There is a statistical
significance between the two groups for the weight-for-age classification (p=0.01). Although
not statistically significant, the body fat indices decrease with a greater PAL while the body
muscle indices increase with a greater PAL.
Table 3.9.3: Energy and macronutrient intake per sub-group
All groups
N=39
Soccer only
N=17
Soccer +
additional
activities
N=22
p-value
TEI(kcal/day)
TEE (kcal/day)
4374.0±1462.4
3146.9±213.4 -
3686.4±250.0
4164.0±1326.5 4536.3±1570.4 0.44
CHO intake(g/day)
CHO requirement
(g/day)
556.8±172.1
441.2-535.8
528.4±143.7
578.6±191.5
0.37
Protein intake(g/day)
Protein requirement
(g/day)
155.6±53.3
109.5
146.7±50.3 162.5±55.7 0.37
Total fat intake(g/day)
Fat Requirement
(g/day)
148.8±67.8
104.9-122.8
142.8±73.5 153.5±64.5 0.63
Fibre intake (g/day) 44.0±14.6 42.4±14.4 45.2±15.0 0.55
The mean total energy, CHO, protein and fat intake is higher in the group that participates in
additional activities, although not significant.
Stellenbosch University http://scholar.sun.ac.za

44
CHAPTER 4: DISCUSSION
The aim of this study was to investigate the dietary intake and anthropometric profile of high-
performance adolescent soccer players (14-18 years of age) during the competitive season.
The group of male adolescent soccer players included in this study are from the Ajax Cape
Town Football Club with the majority of players being of coloured ethnicity and currently
attending high school.
4.1. Anthropometry and skinfold thickness
Most of the players fall within the normal range for the BMI-for-age (5th to 85th percentile)
(87.2%, N=34), with a small percentage being categorised as ‘at risk’ of being overweight
(85th to 95th percentile) (10.3%, N=4) or overweight (≥95th percentile) (2.6%, N=1). The mean
height-for-age and BMI-for-age of this study population falls on the 91.8 and 63.1 percentiles
of the WHO growth charts, respectively. None of the players are classified as underweight
(BMI-for-age ≤ 5th percentile) or stunted (height-for-age ≤ -2SD). This is in contrast to results
from the South African YRBS that found that in adolescent males in the Western Cape
Province, 9.8% were stunted, 8.0% were underweight and 13.7% were overweight and
obese (52). A more recent study by Naude et al., (2011) found that 8.8% of the adolescent
males in Cape Town (SA) were stunted, 11.8% were underweight and 17.7% were
overweight and obese (53). The trend from these studies showed that stunting and
underweight is declining whereas overweight and obesity are increasing amongst
adolescents in South Africa and more specifically, Cape Town. This local trend is in keeping
with the findings from international studies which indicate an increasing prevalence of
overweight amongst adolescents (186). The results of the weight, height and BMI of the
present study also appear to be in agreement with the national as well as the international
trend, where a higher proportion of the population exhibit signs of overnutrition rather than
undernutrition.
The study population of the present study are heavier (64.4±7.2 kg BM vs 57.9±2.32 kg BM),
taller (172.0±5.4 cm vs 1.57±0.01 cm) and therefore have a greater BMI (21.7±2.0 vs
20.4±0.43) than the adolescent male participants in the Western Cape from the SADHS.
(153). The difference in weight in high-performance adolescent athletes vs. their sedentary
counterparts may be explained by the additional muscle mass (and hence BMI), which one
would expect in athletes (56). The higher muscle mass, and hence weight and BMI could
result in a misclassification as overweight or obese. It is therefore recommended that BMI be
combined with other means of anthropometric assessment. It is unfortunate that data
Stellenbosch University http://scholar.sun.ac.za

45
regarding player positioning was not collected as part of the present study. A study in 2009
found a relationship between anthropometric characteristics and the positions in which
players were selected, by their coaches (183). This same study found that players who are
heavier have a greater ball shooting speed and 30 m sprinting ability. Taller players have a
greater vertical jumping height, 10 and 30 m sprinting ability, maximal oxygen uptake during
running and distance covered during intermittent running (183). Whilst physiological
parameters were not collected in the present study, an association between anthropometric
data and player positioning may have been significant.
Rico-Sanz et. al., (1998), recommended a mean body weight and percentage body fat for
junior soccer players (14-18 years) to be 67.2 kg (62.5-72.3 kg) and 10.1% (7.6-12.1%),
respectively (61). The results of the present study (64.4±7.2 kg BM and 10.9±3.5% body fat)
fall within this recommended range. It is interesting to note that a study performed on French
adolescent soccer players in 2002 by Leblanc et al., demonstrated a lower mean body
weight than the present study as well as the recommendation by Rico-Sanz et al. (1998)
(57.2±10 kg). However, the French players had a higher percentage body fat than both the
present study and the recommended range by Rico-Sanz et al., (1998) (13.0±2.5%) (87). It
should be remembered that different studies employ different methods to determine
percentage body fat and this could be a possible explanation for the disparities in the results
from these studies. Rico-Sanz et al., (1998) determined percentage body fat by using a
regression equation which incorporated the sum of 6 skinfold measurements and the
participants’ age (61). Leblanc et al., (2002) used an equation which was specifically
designed for soccer players and required the measurements of 4 skinfold sites (87). The
present study used an equation which only requires the sum of 2 skinfold measurements.
This equation has been shown to be the most accurate in adolescents, when it was
evaluated in a study against 13 other equations, where DXA was used as a reference
method (190). This study was however performed on sedentary adolescents which has to be
considered when interpreting data. In addition, when comparing the results of different
studies, a more accurate interpretation is obtained if the studies employ the same methods
for data collection and analysis. Ideally, all studies investigating the body fat indices of
soccer players should be using the equation which was specifically designed for this
population, as used by Leblanc et al., (2002) (87), when DXA is unavailable.
Additional indices of body fat have also been investigated in the present study. The triceps,
subscapular, sum of two skinfolds and AFA percentiles classify the majority of the
participants of this study into the ‘above average’ category. This implies they have a higher
body fat compared to the NHANES 2003-2006, Frisancho 1981 and Frisancho 1990
Stellenbosch University http://scholar.sun.ac.za

46
reference norms. The reference population are however based on a non-athletic population.
One would expect physically active individuals such as this study population to have a lower
body fat when compared to their non-active counterparts. There are no studies which have
investigated the triceps, subscapular, sum of 2 skinfolds or AFA of adolescent soccer
players. Thus, there is no data which provides a recommended range of these indices for
this specific population.
Interestingly, the present study yielded different body classification when using percentage
body fat results (calculated from 2 skinfold equation) compared to the indices of fat mass
(triceps, subscapular and AFA). The mean percentage body fat was classified as falling
within the normal range whilst the skinfold indices resulted in above average classifications.
Limiting factors in determining percentage body fat included using only 2 SKF sites and it is
also more difficult to calculate percentage body fat in adolescents than adults. Also, the
equation which was used to calculate percentage body fat is specific for adolescent males,
but not for high-performance athletes. An additional limitation is that at present, there are no
equations available for the mixed ancestry population, which comprised more than half the
study population. Hence, one must be absolutely careful when interpreting these results.
Methods such as underwater weighing or neutron activation analysis are considered the
‘gold standard’ and would therefore provide more accurate data. An athlete with a body fat
which is too high, has an increased physiological load imposed when training and playing
(60). A negative correlation has also been observed between percentage body fat and
performance in activities where the body mass has to move against gravity (60). This
ultimately emphasises the importance of ensuring an adequate body composition in order for
athletes to maximise their performance. It is important to ensure those categorised as having
‘below average’ fat stores seek dietary intervention to increase their energy intake and those
categorised as ‘above average’ fat stores seek intervention to decrease energy and/or fat
intake as well as increase their level of activity.
Indices of muscle mass investigated in the present study include AMA and AMC. Most of the
players fall into the ‘above average’ muscle mass category. Again, the tables used to
interpret this data came from a sedentary reference population. Considering that the present
study population has a higher PAL than the reference population (Frisancho, 1981), this is
an expected finding.
Again, it must be mentioned that adolescent athletes are a special population and there is no
national data for this population to compare the present study data to. An interesting finding
from the anthropometrical data is that it supports the recommendation that when classifying
Stellenbosch University http://scholar.sun.ac.za
47
athletes according to their anthropometrical distribution, weight and BMI cannot be used
exclusively. One should ideally also include skinfolds and circumferences in order to
accurately classify athletes.
4.2. Dietary energy and macronutrient intake
The mean TEI (4374.0±1462.4 kcal/day) of the soccer players in the present study exceeds
the DRI (3152 kcal/day) for adolescent males (14-18 years), with an active PAL, as well as
the recommended energy intake (3146.9±213.4 to 3686.4±250.0 kcal/day) for adolescent
athletes as suggested by Carlsohn et al., (2011) (76, 166). The TEI of the present study was
compared to another equation suggested by the Institute of Medicine, 2005, and is above
this recommendation (3525.2 kcal/day) as well (177). This may therefore explain why the
players are heavier and have increased indices of fat mass. During adolescence it is
important to maintain an adequate energy intake to ensure optimal growth, development and
performance. Literature has also shown that exercise results in increased energy and
nutrient requirements (67, 69). In this special population of high-performance adolescent
athletes it is thus desirable to have an energy intake above the DRI (3152 kcal/day) but not
above the TEE (3146.9±213.4 to 3686.4±250.0 kcal/day). It is therefore imperative to
accurately determine energy requirements based on the level of activity of athletes.
However, athletes who exceed this energy requirement could have an excess weight and
therefore excess body fat which negatively affects performance. In this study we find that the
mean TEI (4374.0±1462.4 kcal) exceeds the TEE (3686.4±250.0 kcal) by 118.7%, as
calculated from the equation provided by Carlsohn et al. (2011) (166). The anthropometrical
data is in agreement with an excess energy intake as there are a number of players who fall
into the above average category for body fat indices which include triceps, subscapular, sum
of two skinfolds and AFA measurements.
The TEI data from this study (4374.0±1462.4 kcal/day) is not in keeping with the data from a
recent study by Naude et al. (2011), which found the mean energy intake of adolescent
males in Cape Town to be 2252.6 kcal (53), which is nearly 1000kcal below the DRI (3152
kcal/day). The mean intake of the athletes of the present study exceeds this amount by
194.2%. One should keep in mind that the participants from the Naude et al., (2011) study
were not athletes. Due to the higher TEE of the participants in the present study, it is not
surprising to see a higher TEI. However, the mean intake of this study also exceeds the TEI
reported in other studies on adolescent soccer players. These studies include Iglesias-
Stellenbosch University http://scholar.sun.ac.za
48
Gutierrez et al., (2005) (3003 kcal), Ruiz et al., (2005) (3030 to 3478 kcal), Leblanc et al.,
(2002) (2352 - 3395 kcal) and Rico-Sanz et al., (1998) (3952 kcal) (80, 81, 87, 61).
The CHO intake of this study (556.8±172.1 g/day) exceeds the DRI (130 g/day), as set for
healthy American adolescents who are not high-performance athletes by the Institute of
Medicine (2006) (76). There is no national data regarding the CHO intake of adolescents to
compare our data to. Physically active adolescents, as in the present study population, will
require additional carbohydrates (178). Petrie et al., (2007) recommended that the CHO
intake for adolescent athletes should be 50% of TEI (67). The mean CHO intake of the
present study is 120.8% above the recommended range. An energy intake which exceeds
energy expenditure may once again result in additional body fat stores, which are evident in
the anthropometrical data of this study, regardless of which macronutrient is in excess. The
2009 position statement from the American Dietetic Association state that athletes require
additional energy and macronutrient intake in proportion to their BM, which should be
expressed in kg, in comparison to sedentary individuals (99). They further suggest that
energy and macronutrient requirements be expressed in terms of g/kg BM (99). In following
this practical method of expressing CHO requirements, the present study has a CHO intake
of 8.6 g/kg BM/day. Zehnder et al., (2001) postulate that high-performance adult soccer
players required 4.8 g/kg BM CHO/day. The intake of the adolescents of the present study
significantly exceeds this recommendation. Thus the excess intake may contribute to excess
body weight and body fat indices, as observed in the anthropometrical data of the present
study.
The results of the CHO intake of the present study (50.9% TEI) are in contrast to previous
studies investigating the intake of adolescent soccer players, where the players had an
inadequate CHO intake. The study by Ruiz et al., (2004) had a CHO intake of 44% of TEI
(81). The same was true for studies by Leblanc et al., (2002) and Iglesias-Gutierrez et al.,
(2005) where CHO intakes were 49 - 57% and 45% of TEI, respectively (87, 80). In 1998,
Rico-Sanz et al., investigated young soccer players and found that they had a mean CHO
intake of 53% of TEI, which met requirements (61). The degree of how high the present
study CHO intake is further emphasised when it is compared to the same studies mentioned
above but in g/kg BM/day. The present study CHO intake (8.6 g/kg BM/day) is much higher
than in the studies by Leblanc et al., (2002) (5.1-6.9 g/kg BM/day), Iglesias-Gutierrez et al.,
(2005) (5.6 g/kg BM/day) and Ruiz et al., (2004) (5.6 g/kg BM/day) who found a more
moderate CHO intake and was closer to the recommended 4.8 g/kg BM/day (87, 81, 80).
The only study which was similar to the present study was by Rico-Sanz et al., (1998) (8.3
g/kg BM/day) (61).
Stellenbosch University http://scholar.sun.ac.za

49
The importance of CHO as a substrate in high intensity exercise is well recognised even
though its benefits specifically in this population remain unclear (67). Players may have had
previous input from the club providing advice regarding their CHO intake and thus
encouraging players to increase their CHO intake. This is also in line with the South African
FBDG which advises that starch should be the basis of all meals (117). This is the advice
which is taught at school level as well. Another contributing factor to the CHO intake may be
the high frequency of intake of energy bars (51.03%, N=20, ≥ 4 times per week), added
sugar (46.2%, N=18, ≥ 4 times per week), Coke®/Pepsi® (71.8%, N=28, ≥ 1-3 times per
week) and sports drinks (69.2%, N=27, ≥ 1-3 times per week).
The protein intake of the adolescent soccer players of this study (2.4 g/kg BM/day) exceed
the DRI (0.85 g/kg BM/day), which has been set for healthy adolescents. Considering this
study population is a group of high-performance athletes, this is expected as a study by
Boisseau et al., (2007) demonstrated that 14 year old soccer males had a higher protein
requirement than their non-active counter-parts to maintain their nitrogen balance (107).
Both Petrie et al., (2004) and Meyer et al., (2007), agree on a protein requirement in active
adolescents of 12-15% TEI amounting to 1.7 g/kg BM/day (67, 69). These articles all agree
that although this needs to be better defined, as current literature regarding protein
requirements in adolescent athletes is limited, this recommendation should be adequate.
When comparing the data from the present study to this recommendation, the players have
an intake 142.1% greater than the estimated requirement. Meyer et al., (2007) also found
that protein intake was rarely inadequate if the energy intake was adequate (69). So
although this intake is inappropriate, it is not unexpected in view of the TEI. The level of
protein intake is also in agreement with that found in other studies done in adolescent
athletes such as Leblanc et al., (2002) (1.3 to 2.3 g/kg BM/day), Ruiz et al., (2004) (1.8 to
2.14 g/kg BM/day), Rico-Sanz et al., (1998) (2.3 g/kg BM/day) (87, 81, 61).The only study
which had an intake which was lower than the present study was by Iglesias-Gutierrez et al.,
(2005) (1.9 g/kg/day) (80).
The percentage fat intake (30.6%) of the adolescent players in the present study falls within
the AMDR for healthy adolescents (25-35% relative percentage fat intake) (76). Meyer et al.,
(2007) recommended the fat intake for adolescent athletes be in accordance with public
health guidelines (69). Based on the prudent dietary guidelines this level is ≤ 0% of TEI, of
which saturated fatty acids (SFA) and polyunsaturated fatty acids (PUFA) should not exceed
10% of TEI and saturated fatty acids (SFA) should be more than 10% TEI (187). Although
our results are in accordance with the guidelines in terms of relative percentage fat intake
Stellenbosch University http://scholar.sun.ac.za

50
(30.6%), the TEI (i.e. number of dietary calories) exceeds the requirements and therefore the
absolute level of fat intake (148.8±67.8 g/day) is above recommendations (122.9 g/day). The
above recommended fat intake of the present study population may therefore contribute to
an excess of body fat stores, as is evident in the anthropometrical data.
The fat intake in the present study was also higher compared to that found in the SADHS
(2003), where the quality of fat intake of non-athletic adolescents was investigated based on
the frequency of eating selected foods (153). The fat intake was scored from 1 to 6 with a
low score indicating a low fat intake (153). In the Western Cape, the fat intake was found to
be low (2.2) based on the subjects’ reported frequency of eating selected foods.
Unfortunately this study did not specify the amount of fat consumed. In a study investigating
the dietary fat intake of adolescent athletes, Leblanc et al., (2002) found an intake exceeding
recommendations (29.1±2.8 to 34.1±3.1% TEI (87). Similar results were found by Rico-Sanz
et al. (1998), where adolescent soccer players had a fat intake of 32.4±4.0% of TEI as well
as by Iglesias-Gutierrez et al. (2005), where players had a fat intake of 29-47% of TEI (61,
80).
The qualitative distribution of fats, namely SFA:MUFA:PUFA in a <1:>1:<1 ratio has been
shown to be of particular importance as this constitutes a healthy diet (80). The fat
distribution in this study meets the recommended ratio for SFA, MUFA and PUFA. Two
studies reported on the dietary fat quality in adolescent soccer players. Boisseau et al.,
(2002) reported a remarkably high intake of SFA (25.6%) and Iglesias-Guteirraz et al.,
(2005) reported a 9% SFA, 13% MUFA and 5% PUFA intake (179, 80). The cholesterol
intake of the present study is more than 1.5 times above the recommended value (<300
mg/day). In summary, the total fat intake does not comply with the prudent guidelines and
furthermore, cholesterol levels are also too high, thus classifying the intake of the adolescent
players as an unhealthy diet.
Although there are no data regarding the protein intake of adolescents in SA, the 2008
YRBS investigated the frequency of meat intake amongst male adolescents and found that
66.6% of the study population ate meat 4 or more times a week (52). The QFFQ used in the
present study investigated the intake of 5 different types of meat products which included
high-fat red meat, low-fat red meat, sausage, hamburgers and meat stew. The majority of
players ate each option 1-3 times a week. The frequency of consumption of processed
meats was particularly high, especially sausage which was consumed by 51.3% (N=20) of
players at least 1-3 times per week. Meat stew was not consumed regularly at all (17.9%,
N=7, 1-3 times per week. This leads one to assume that the consumption of high-fat fast
Stellenbosch University http://scholar.sun.ac.za

51
foods is quite high in comparison to healthier meals. Thus, contributing to the high energy
and fat intake. In the 2008 YRBS it was found that 66.6% of male adolescents consumed
milk on 4 or more days of the week (52). In the present study, 56.4% consume milk on 4 or
more days of the week. The majority of players therefore do not consume milk regularly.
Most of the players do however use full fat milk which contributes to the high total energy
intake as well as the fat intake. In addition to the milk consumption, 94.9% (N=37) consume
the low-fat flavoured milk drink ≥ 1-3 times per week, which is provided by the club at the
end of each training session (4 days per week). The high protein intake in the present study
may therefore be explained by the high meat intake as well as the high low-fat flavoured milk
drink intake.
The percentage amongst male adolescents in the 2008 YRBS who consume fruit 4 or more
times a week was 61.5% (52). Citrus fruits (30.8%, N=12), apples/pears (35.9%, N=14) and
bananas (38.5%, N=15) are the most regularly consumed fruit, 1-3 times per week, in the
present study. Citrus fruits are provided to players at the end of each training session which
may be reasons why it is so popular. The fruits which are not regularly consumed include
melons, strawberries, grapes, mangoes and guavas. These are the most expensive fruits
and since this group mainly comes from lower socio-economic status, financial constraints
may explain why it is eaten less frequently. Another explanation might be the seasonality of
fruit availability – the collection date of the QFFQ occurred during December and some fruit
(e.g. guavas) are readily available only in winter. The intake of cooked vegetables seems
more sporadic as the majority still do not include it regularly. More than half of the study
population do not include any of the vegetables in the list except for mixed vegetables
(33.3%, N=13) which is the most regularly eaten vegetable, 1-3 times per week. The
recommendation of 5 fruit and vegetables portions per day (117) would be more difficult to
achieve if fruit was not supplied by the soccer club.
The DRI for fibre is 38 g/day (76). The fibre intake in the current study (44.0±14.6 g/day)
exceeds this recommendation by nearly 1.5 times, which is inconsistent with previous
international studies that showed an inadequate fibre intake (80, 179). Data reported by
Boisseau et al., (2002) showed a mere 17.1 g/day in active adolescents while Iglesias-
Guteirraz et al., (2005) showed 24 g/day (179, 80). There is no national data regarding the
fibre intake of adolescents. A possible reason for the high fibre intake may be the portion
sizes which were selected for the fruit intake. Although the frequency of consumption was
moderate, players indicated large portion sizes. This can further be explained by the fact that
the club did not limit players with the fruit provided at training sessions.
Stellenbosch University http://scholar.sun.ac.za

52
The percentage of players who smoke and use alcohol in the present study is much lower
than the results from the SADHS (153). In the Western Cape, 32.5% of adolescents
admitted to smoking daily while 52.5% reported that they abstained from alcohol (153). The
SADHS is not specific to athletes and it may also be that players are more aware of the
health risks associated with smoking and alcohol use and the effects it may have on
performance, therefore making a conscious decision not to smoke or use alcohol.
There are large differences in the nutritional intake of the present study when comparing it to
other studies investigating the nutritional intake of adolescents in SA as well as
internationally. The profile of the study population in the SADHS included sedentary
individuals. As already explained, high-performance athletes require additional energy and
macronutrients to ensure adequate growth and development as well as optimal playing
performance. This suggests that although it is good to compare the data of this study to
current literature in SA, it may not be applicable. It is however recommended that adolescent
athletes should aim to at least meet these requirements. SADHS had a very large sample
size which was representative of the population it was investigating. The sample size of the
present study was not representative of all adolescent soccer players in SA, making it
difficult to extrapolate the data.
Comparing the data to international studies which investigated the nutritional intake of
adolescents presents a different set of challenges. These studies differ from each other as
well as the present study, in their age ranges, their place of origin (developing vs. developed
countries) including socio-economic status, the number of subjects as well as the method
used to obtain dietary intake information. The study by Rico-Sanz et al. (1998), consisted of
80 players with a mean age of 17±2 years in South America, a developing country. The
nutritional intake data was obtained with a 12-day food diary where players quantified the
amount eaten with a combination of weighing, spoon size, size (small, medium, large) and
number of pieces consumed (61). The study by Iglesias-Gutierrez et al., (2005) consisted of
33 players with an age range of 14-16 years in Spain, a developed European country. The
nutritional intake data was obtained with a 6-day weighed food diary (80). The study by Ruiz
et al., (2004) consisted of 81 Spanish players with ages 14.0-20.9 years. The nutritional
intake data was obtained from a 3-day weighed food diary (81). The study by Leblanc et al.,
(2002) consisted of 180 players with an age range of 13-16 years from a very prestigious
training centre in east France. The nutritional intake was obtained with a 5-day dietary record
quantifying amounts with household measures (87). In addition to this, they all differed in the
type of programs used to analyse the nutritional intake. It is therefore important to consider
all these varying factors when comparing data of different studies.
Stellenbosch University http://scholar.sun.ac.za

53
In summary, the mean total energy intake, CHO intake, fat intake and protein intake are
above the recommended levels and can therefore explain why the majority of players fall into
the above average category for the body fat indices. Based on these findings, the players
will require counselling regarding practical advice to meet, but not exceed, energy as well as
macronutrient requirements. A decrease in processed meat alone would decrease TEI,
protein intake, fat intake as well as sodium and cholesterol intake. The benefits of selecting
low fat food items, such as low fat milk, should also be encouraged. Convenience foods
must be limited while a greater emphasis should be placed on healthier meals.
4.3. Dietary micronutrient intake
The mean intake of vitamins and minerals in this study meet the EAR/AI for all the
micronutrients. There are however a few individual players who have intakes less than 67%
of the EAR/AI for the following vitamins and minerals: vitamins A (307.4±70.3 µg, 10.3%,
N=4), D (2.4±0.7 µg, 15.4%, N=6), E (2.8±1.7 mg, 5.1%, N=2) and K (25.3±15.3 µg, 20.5%,
N=8), calcium (719.7±135.8 mg, 7.7%, N=3), chromium (16.6 µg, 2.6%, N=1), and iodine
(46.4±14.3 µg, 30.8%, N=12). The mean intake of sodium is 4041.5±1226.7 mg/day which is
above the recommended 2300 mg.
The Vitamin and mineral intake of adolescent athletes can be compared to the EAR/AI as
there is consensus that unless a specific deficiency has been diagnosed, athletes do not
have increased requirements (67, 69).
The 2003 SADHS demonstrated that the nutrient intake of adolescents in South Africa is of a
poor nutrient quality (153). However, the micronutrient intake for male adolescents in the
Western Province was better than the national findings where an average intake was
observed with the following data: more than 50% of adolescents had less than 67% of the
recommended dietary intake (RDA) for vitamin E, thiamine, folic acid, niacin, iron, calcium
and magnesium. Calcium intake was a huge concern as more than 60% of the population
had an intake of less than 33% of its RDA. Caucasian adolescents had a lower rate of
deficiency than their African counterparts for all nutrients except for calcium and magnesium
which was a concern in all groups (153). As most of the players from the current study are of
coloured and African ethnicity, one would therefore expect the vitamin and mineral intake of
the current study to be less adequate. However, the findings of the present study are in
contrast to this. Players are provided with fruit at each training session and this may
contribute to their vitamin and mineral intake. Athletes drink energy drinks which contains
Stellenbosch University http://scholar.sun.ac.za

54
vitamins and minerals and may also therefore contribute to their micronutrient intake. The
SADHS also occurred before the national fortification policy of maize and wheat flour. As this
study occurred 9 years ago, it is expected that the national micronutrient status would have
improved, as seen in the present study.
As previously mentioned, calcium intake was a big concern in the 2003 SADHS. In the
present study group only 3 players had an intake less than 67% of the RDA. The Ajax soccer
club provides a flavoured low-fat milk drink to each player after their training session which
provides 439.7 mg of calcium per 350ml serving which is 33.8% of the RDA. A third of the
recommended intake is therefore provided by the club and may explain why the calcium
intake of the players is mostly adequate. However, the calcium:protein ration is 4.6:1 which
is far below the recommended 20:1. This is a particular concern for adolescents as they are
in a prime bone mineral density accrual phase (135). This is especially important for athletes
as a high fracture rate is associated with a low bone mineral density (137, 138). The present
study population may therefore be at risk for developing fractures.
Very little data about micronutrient intake in adolescent soccer players is available. Iglesias-
Gutierrez et al., (2005) found inadequate intakes in folic acid, vitamin E, calcium, magnesium
and zinc. Rico-Sanz et al., (1998) demonstrated inadequate intakes of calcium and iron (80,
61). Again the only vitamin which is inadequate in this study as well as the 2003 SADHS
which investigated the intake of adolescent soccer players, is vitamin E. The Foodfinder®
program which analyses the dietary intake does not take sunlight exposure into account and
in countries with a high percentage of sunlight such as South Africa, vitamin D deficiency is
rarely seen (188).
4.4. Training nutrition
Although the majority of players eat breakfast, lunch and supper daily, there are still a
number of players who do not eat meals regularly. A total of 5.1% of players reported never
eating breakfast whilst 20.5% ate breakfast 3 days per week. For lunch, this number
increased to 10.3% and 23.2% respectively of players either missing the meal completely or
eating lunch 3 days a week. If one considers the huge physiological demands of adolescent
growth and development as well as being a high-performance athlete, this irregular eating
pattern may negatively impact on their physiological and sporting abilities (22). These
negative outcomes may be more prominent in lower socio-economic environments which
have a higher prevalence of underweight children (153, 53).
Stellenbosch University http://scholar.sun.ac.za

55
The data of this study is consistent with a study, by Temple et al., (2006), which investigated
food items consumed by adolescents (12-16 years) in Cape Town (41). It was found that
22% of adolescents did not eat breakfast before school (41). This is consistent with data
from previous South African studies where 15-20% of children did not eat anything before
school (180). This data is particularly important in Cape Town where a recent study by
Naude et al., (2011) found that adolescents (12-16 years) had a prevalence of 8.9% for
stunting and 7.6% for underweight (53), although this is not the case with the current study.
A concern for this group may be more an impaired scholastic potential and suboptimal
performance of the players, due to fluctuating blood glucose levels caused by irregular
eating patterns.
Daily snacking between meals is not common amongst the players, where only 15.4% have
a mid-morning snack, 35.9% have a mid-afternoon snack and 18.9% have a late evening
snack. The most common snack was the mid-afternoon snack where 69.2% (N=27) of
players had it at least 4 times per week. This coincides with the snack provided by the club
at the end of each training session (4 days per week). Snacking by the high-performance
athlete should be encouraged to ensure an adequate intake of their high nutritional
demands. However, it should be an appropriate item such as fruit or dairy or even CHO if
taken before a training session or match and it should form part of a healthy diet. In the
study by Temple et al., (2006), it was found that adolescents were twice as likely to bring
‘unhealthy’ items from home and 70% of those who did purchase items at school bought
‘unhealthy’ items (41). An interesting point to note from the same study was that the
knowledge that adolescents had about healthy vs. unhealthy foods did not influence the
choices they made (41). This is a fact to consider if nutritional education is recommended to
the players. Incentives may be useful as well as educating the players about the
consequences of not following a healthy diet, especially those impacting on playing
performance.
4.5. Fluid intake
The majority of players subjectively reported being more concerned about their fluid intake
during a match than they were during training sessions. This data is in agreement with the
actions of the players as they consume more fluid per minute in a 60-80 minute match
(479.1±163.1 ml) vs. a training session (597.7±281.0 ml). The US soccer federation
guideline states that players should consume between 150ml to 260ml for every 20 minutes
during an activity (183). The majority of the players indicated they only drink during a training
session or a match when they are thirsty. This goes against what the US Soccer Federation
Stellenbosch University http://scholar.sun.ac.za

56
guidelines recommended, which states players should drink according to a pre-determined
schedule and not rely on thirst alone. Noakes TD in 2007 found that there was no evidence
that full fluid replacement was superior to drinking to thirst (184). Young athletes may benefit
from incorporating a combination of the two findings into their practice as they may not
immediately respond to thirst. This might imply that the optimal guideline, especially for
young athletes who may not recognise thirst or necessarily realise a prompt action is needed
in response to it, may be to employ a combination of the two recommendations. Thus
ensuring adequate hydration by using a pre-determined drinking schedule, in conjunction
with thirst recognition. The US Soccer Federation specifically issued guidelines to avoid
dehydration in response to athletes who died from it. Although soccer is a winter sport, the
professional league in SA runs alongside the European league. It is therefore played in
summer when the risk of becoming dehydrated is greater. As a result, athletes in SA have to
be more diligent in rehydrating to avoid the consequences of dehydration. Regarding the
type of fluid replacement of the players during a match, the majority of players (59%)
selected water to combat thirst with a smaller percentage (31%) selecting Coca-
Cola®/Pepsi®. However, most players (64%) select a CHO sports drink as their preferred
beverage to provide energy during a match. The intake of coke®/Pepsi® in the present
study was quite high with 71.8% (N=28) of players consuming it ≥ 1-3 times per week in
addition to a CHO sports drinks where 69.2% (N=27) of players consumed it ≥ 1-3 times
per week. The US Soccer Federation suggested that sports drinks are a better choice than
water and carbonated and caffeine beverages should be avoided. However, since the
participants of this study have above average body fat indices, water may be the better
option for this specific group to rehydrate. CHO sports drinks provide lots of additional
energy which may be converted to fat if not utilised and will contribute to the already high fat
stores (185). The same is true for the Coca-Cola®/Pepsi® beverages which are high in
simple CHO.
A study by Nichols et al., (2005) found that despite being aware of the recommendations,
players did not always adhere to the advice or were unsure of the specific fluid amounts they
were meant to consume (70). The soccer club should therefore not only ensure that players
are well educated regarding the importance of hydration status, they should also provide
specific, practical advice to ensure it is followed through. Clubs could even further assist by
providing a specific drinking schedule for each player to utilise as a guide before, during and
after training sessions and matches. It is also important for the parents as well as the
coaches to be educated about the importance of hydration, the quantities which should be
consumed and the preferred type of fluid to consume. They can play an important role in
encouraging, assisting and allowing the players to adhere to the advice.
Stellenbosch University http://scholar.sun.ac.za

57
The majority of players subjectively rated themselves as not concerned about their overall
intake pre-, during as well as post-exercise. Interesting to note that the majority of players
only ingested a specific meal or food item during their training sessions and the most
common reason provided for this was because it was supplied by the club. At each training
session, players were provided with a fruit, Parmalat Steri-Stumpie® flavoured low-fat milk
drink and a Jungle Oats® energy bar. This information is supported in the data of the
completed QFFQs. Fresh fruit is a good source of fibre, natural sugar and important
micronutrients and is therefore an excellent snack. A mineral which is a big concern in
national adolescent population, as found in the 2003 SADHS, is calcium (67, 69). Thus the
low fat flavoured milk drink is appropriate as it provides 125.6 mg of calcium per 100 ml. The
portion size may have to monitored, especially in players who are at risk of or already
overweight. The Jungle Oats® bar is high in calories and more specifically CHO. These
items are usually provided at the end of a training session. Although it will contribute to the
TEI, it is needed for the recovery phase post exercise. According to Leblanc et al., (2002)
snacks should provide 10% of TEI (87). It is thus very important that clubs are providing the
correct food items which send out the correct health messages. Snacks should form part of a
healthy, well balanced diet and good options should be low calorie and low fat. From the
above data, it seems that the energy intake of the players is appropriate around the training
sessions as well as the recovery phase. However, the overall energy intake is excessive.
This implies that the TEI and macronutrient intake may not be appropriate outside of training
sessions. Players may therefore benefit from education regarding healthy food choices
during the rest of the day as well as smaller, more regular meals throughout the day.
4.6. Dietary supplement intake
In this study, CHO energy drinks (69.2%, N=27, ≥ 1-3 times per week) and energy bars
(84.6%, N= , ≥ 1-3 times per week) are the only two supplements which are used by a
significant number of players. It is interesting to note that these two items are provided to the
players by the club. As most of the players come from lower socioeconomic status, the
energy levels of players may have been a previous concern. Petrie et al., (2005) stated that
dietary supplements have become attractive to adolescents as they are being touted as
performance enhancing (67). The use of vitamin and mineral supplementation may be useful
in improving the nutritional status of players who have an inadequate intake from their diet
(67, 69). The participants of the present study do not demonstrate an inadequate intake and
the use of vitamins and mineral supplementation would therefore not be indicated. There is
also no scientific evidence to support its general use to improve performance (67, 69). More
Stellenbosch University http://scholar.sun.ac.za

58
importantly, most of the participants of this study are in the above average category for fat
stores and their TEI, macronutrient and micronutrient intake is above recommended values.
Unless players exhibit specific nutrient deficiencies, this group would not benefit from the
use of nutritional supplements.
4.7. The exploration of possible associations between macronutrient intake and
anthropometric data
The mean energy intake of the players was negatively correlated to weight (r= -0.15, p=0.36)
as well as BMI (r= -0.17, p=0.30). Total fat intake was negatively correlated to AFA (r= -0.37,
p=0.02) and percentage body fat (r= -0.31, p=0.05). Also, total protein intake was negatively
correlated to AMA (r= -0.14, p=0.39) and AMC (r= -0.14, p=0.40). However, none of these
were significant except for AFA, which may lead one to question its use in high-performance
adolescent athletes. This correlation is an unexpected finding as it goes against current
literature, which clearly states that these parameters should be positively correlated with
each other (67). Although diet is a significant determinant of anthropometric status, it is not
the only determinant. Factors which may assist in explaining this data may include the
varying stages of maturation of the players. Those undergoing a growth spurt may require
more energy than those not experiencing a growth spurt in order to support this growth and
development. Players undergoing a growth spurt may therefore exhibit more favourable
anthropometric indices compared to players who are not undergoing a growth spurt, even if
they are ingesting the same amount of calories. Another factor may include the genetic
predisposition to obesity which may be relevant in certain players. Studies have found that
the body’s response to overfeeding or a negative energy balance may be influenced by
genetics. This implies that some individuals may be prone to excessive fat accumulation
while others are protected against it, based on genetic make-up (191). Finally, physical
activities, including activities of daily living, may vary between players which may affect
energy expenditure. Since the physical level of activity of the players was the only factor
which was investigated, this was used to perform additional sub-group analysis.
4.8. Sub-group analysis
There is a large spread in the data regarding the energy and macronutrient intake of the
players. This is evident by the large SD expressed in the statistical analysis. The data was
then further analysed by separating the players into 2 groups namely: those who only attend
soccer training sessions and matches, and those who participate in soccer trainings session,
Stellenbosch University http://scholar.sun.ac.za

59
matches as well as additional physical activities. This data was then tested against each
other to explore any significant differences between the groups.
The weight, BMI and percentage body fat was lower in the more active group than the group
who only participated in soccer, although not statistically significant. This is an expected
finding as literature tells us that individuals who are more physically active have a lower body
weight, and therefore BMI, and percentage body fat than their more sedentary counterparts
(9). In addition to this finding, all of the players in the more active group are classified as
normal for weight-for-age, except for one player who is classified as overweight. Interesting
to note that this difference in weight-for-age classification between the groups was
statistically significant (p = 0.01). This displays that a greater physical activity is not only
associated with a lower body weight but more importantly, a normal body weight range. It
may have been interesting to collect data regarding player positioning as a study in 2011
found that goalkeepers were often heavier than players in other positions (9).
Further investigations were also done on the fat and muscle indices. With regards to the
triceps, subscapular, sum of two skinfolds and AFA, the percentage of players who fell into
the above average category was lower in the physically more active group, although this was
not statistically significant. Again, literature shows that fat indices are lower in individuals
who are more physically active (9). This finding is therefore in agreement with current
evidence. With regards to the muscle indices, the more physically active group had a higher
percentage of players in the above average category, again this was not statistically
significant. This finding is also in agreement with current literature which states that physical
activity increases muscle mass (9).
The TEI, CHO intake, protein intake and fat intake was higher in the more physically active
group. It is expected that TEE and therefore requirements, are higher in individuals who
have a higher PAL (167).
The sub-group analysis data puts the association analysis into perspective. It seems that the
more physically active players had a lower body weight, BMI and body fat, despite having a
higher energy intake. Thus explaining why there was a negative correlation between energy
intake and weight and BMI.
Although this analysis displays interesting findings, no statistically significant data was
generated between the 2 groups except for the difference in weight-for-age classification.
This may however be attributed to the small sample size of the study population which
Stellenbosch University http://scholar.sun.ac.za
60
makes detecting associations difficult. A larger sample size may be thus be more sensitive in
detecting associations.
4.9. Shortcomings and limitations of the study
Various methods exist with which one can determine dietary intake. However, they all come
with strengths and limitations. The researcher will usually select a method according to what
is best suited to the research design, participant characteristics, resources available and the
type of intake one is trying to determine. Some of the most common methods to determine
intake include food diaries, food records, 24-hour recalls, diet histories and food frequency
questionnaires (175). Limitations of a QFFQ include the following: respondents may choose
foods or portion sizes which are not representative of their usual intake, it is dependent on
the subject’s ability to describe their diet and respondents may be influenced by the list of
multiple foods. During the information sessions, players were sitting next to each other and
their responses may have been influenced by each other. At one point, one player mocked
another for having a limited food selection and others seemed to copy what their friends
selected or had a discussion before making their choices. This behaviour was stopped but at
times the boys were difficult to control. It is therefore probable that respondents were
influenced by other players within their group. Although the QFFQ used in this study has
been validated in athletes it’s use has not been validated in adolescents and is therefore
another limitation. Validation is important to determine reliability and precision. Respondent
fatigue must also be considered as the QFFQ took ± 45 minutes to complete and the players
appeared to lose concentration/interest. It is unfortunate that the nutritional content of the
snacking was not investigated as well as whether it was brought from home or bought at
school. This would have provided a greater insight and perhaps a better understanding
regarding snacking and thus make intervention more targeted.
Another limitation included the small sample size which is not representative of all
adolescent soccer players in SA. Previous studies which investigated the nutritional status of
adolescent soccer players had a sample size of 33, 8, 180 and 81 (80, 61, 87). There is
therefore quite a range and better quality data may be obtained with a bigger sample size.
More or stronger statistically significant data may be obtained with a larger sample size.
The equation which was used to determine percentage body fat was that by Slaughter et al.,
(1988), (45) which requires the triceps and subscapular skinfold measurements. However,
this equation has only been validated in non-athletic adolescents and may therefore not be
suitable for use in adolescent athletes. There are equations which are better suited and
Stellenbosch University http://scholar.sun.ac.za
61
validated for athletes which require additional skinfold measurements which could be used
for better accuracy. In addition, this equation is specific to the Caucasian and black
population but there is no equation for the mixed ancestry population, which made up the
majority of the study population. The reference population against which the skinfold
measurements were compared to are for the general population which considers age and
sex but not physical activity. This too may not be appropriate to use for adolescent athletes.
Stellenbosch University http://scholar.sun.ac.za

62
CHAPTER 5: CONCLUSIONS AND RECOMMENDATIONS
5.1. Conclusions
The majority of the high-performance adolescent soccer players considered in this study fall
into the normal weight category and all are of a normal height. Using a regression equation,
the majority of players have an appropriate percentage of body fat. However, upon further
analyses of their body composition, most of the players fall into a category placing them in
an ‘above average’ range for their triceps, subscapular, sum of two skinfolds, AMC, AMA
and AFA. The implication of this finding is that the players are considered to have an excess
of body fat stores, which is not desirable for soccer players. However, the majority of players
also have an ‘above average’ muscle mass which is beneficial for soccer players.
The diet of the adolescent soccer players is considered to be in excess of their
requirements. The reported mean energy, CHO, protein and fat exceeds recommendations.
The mean micronutrient intake met the EAR/AI for all of the vitamins and minerals. Players
who participated in additional physical activities had a lower weight, BMI and percentage
body fat, despite having a higher TEI. The group who had a higher PAL had significantly
more players in the normal weight range for the weight-for-age classification. The players
who have a higher PAL also tended to have higher indices of body muscle mass.
The importance of regular meal patterns should be emphasised to the players, especially
breakfast which was the most poorly eaten meal. Appropriate snacks which are low calorie
and low fat should be encouraged. Clubs need to advocate for adequate hydration and
equip players with the necessary knowledge about why it is needed, what should be used,
how much and how often it should be used for training and matches. The only dietary
supplements which the players have on a regular basis are those provided by the club which
is primarily an energy drink and an energy bar. These items are consumed during the
recovery phase which is appropriate to restore glycogen stores. Since the use of
supplements, especially in adolescents, may have negative health implications and have not
shown to improve or enhance performance, its use should not be encouraged.
5.2. Recommendations
Future studies should consider the use of validated methods to determine dietary intake
such as repeated 24-hour recall and weighed food diaries which are more accurate. The
validity and accuracy of the QFFQ should be determined with the doubly labelled water
technique and indirect calorimetry which are very accurate indicators of energy expenditure.
Stellenbosch University http://scholar.sun.ac.za

63
A bigger sample size for future studies is recommended. Although trends were detected in
the present study, a larger sample size may detect more associations. The collection of data
in group sessions is very difficult and when done, strict supervision is required with no
discussion or interaction between participants. Participants should not be allowed to see
each other’s responses and they should therefore be spaced far apart (as per exam-writing
rules). Coaching staff may be able to assist with supervision. When interpreting micronutrient
adequacy, micronutrient supplementation should also be included in the data. Alternative
methods to determine body composition include underwater weighing and neutron activation
analysis. These methods are considered the ‘gold standard’ and thus much more accurate
than the methods employed in this study. The findings of this study is in agreement with
recommendations and evidence of previous studies which state that in addition to weight
and BMI, athletes should be classified with additional anthropometrical measurements such
as skinfolds and circumferences.
Dietetic professionals should use the findings of this study to implement targeted intervention
for this population. By providing accurate and evidence-based data, they will help to ensure
healthy adolescent soccer players with optimal nutritional status and development which will
result in maximal training and playing performance. Providing education to the players as
well as the coaches, biokineticists and all involved staff about the importance of meeting, but
not exceeding, energy, macronutrient, micronutrient and fluid requirements is imperative.
Players may benefit from personalised drinking schedules to assist them with meeting their
fluid requirements during training sessions as well as during matches. Players should also
be coached how to recognise thirst and take the appropriate action. A constant fluid supply
should always be available during training sessions and matches and players should be
allowed the opportunity to drink. Education is essential, to players, parents and staff alike,
regarding what a healthy diet constitutes and what the benefits of it are. The consequences
of unhealthy diets must be emphasised, especially the implications it may have on sporting
performance. Players should also be educated regarding types of fat and its sources, with
special attention to processed meats (hamburgers and sausage) as well as practical advice
to reduce total fat intake (such as using low fat milk). Focus should also be around healthy
snacking, especially outside of training sessions. Although nutritional supplement use is not
common amongst these players, education regarding its use and lack of evidence to support
its use is still important.
Stellenbosch University http://scholar.sun.ac.za

64
LIST OF REFERENCES
1. Bangsbo J, Norregaard L, Thorsoe F. The Effect of Carbohydrate Diet on Intermittent
Exercise Performance. International Journal of Sports Medicine. 1992; 13(2): 152-157.
2. Maughan RJ. Energy and macronutrient intake of professional football players. Br J
Sports Med. 1997; 31(1): 45-7.
3. Rico-SanzJ,FronteraWR,MolePA,Rivera-Brown A, Meredith CN. Dietary and performance
assessment of elite soccer players during a period of intense training. Int J Sport Nutr.
1998;8:230-240.
4. Schokman CP,Rutishauser IH & Wallace RJ. Pre- and postgame macronutrient intake of
a group of elite Australian football players. Int J Sport Nutr. 1999; 9(1): 60-9.
5. Coyle EF. Effects of Diet on Intermittent High Intensity Exercise. In: McLeod DAD,
Maughan RJ, Williams C, Madeley CR, Sharp JCM &Nutton RW, editor. Intermittent High
Intensity Exercise. London: E & FN Spon; 1993. p. 101-116.
6. Reilly T. Energetics of High Intensity Exercise (soccer) with particular reference to fatigue.
Journal of Sports Science. 1997; 15: 257-263.
7. Mohr M, Krustrop P &Bangsbo J. Match Performance of High-Standard Soccer players
with special reference to development of fatigue. Journal of Sport Sciences. 2003;
21:439-449.
8. National Research council food and nutrition board. 1989;
9. Rankinen T, Fogelholm M, Kujala U, Rauramaa R, Uusitupa M. Dietary intake and
nutritional status of athletic and non-athletic children in early puberty. Int J Sport Nutr.
1995;5:136-50.
10. Weimann E, Blum WF, Witzel C, Schwidergall S &Bohles HJ. Hypoleptinemia in female
and male elite gymnasts. Eur J Clin Invest. 1999; 29(10): 853-60.
11. Bernadot D, Schwarz M, Heller DW. Nutrient intake in young, highly competitive
gymnasts. J Am Diet Assoc. 1989; 3: 401.
12. Guilland JC, Margaritis I, Melin B, Peres G, Richalet JP, Sabatier PP. Sportsman and
subjects with a high physical activity. In Martin A. (ed): “French population recommended
dietary allowance,” rd ed. Paris: Tec & Doc, pp337-394, 2001.
13. Nativ A, Puffer JC, Green GA. Lifestyles and health risks of collegiate athletes: a
multicentre study. Clinical Journal of Sport Medicine. 1997;7:262-272.
14. Rankinnen T, Fogelholm M, Kujala U, Rauramaa R &UUsitupa M. Dietary intake and
nutritional status of athletic and nonathletic children in early puberty. Int J Sport Nutr.
1995; 5(2): 136-50.
15. Matkovic V. Calcium intake and peak bone mass.NEngJ Med. 1992;327:119-120.
16. Rankinen, Weiman, Bernadot, 1989
Stellenbosch University http://scholar.sun.ac.za

65
17. Allen L& Gillespie S. What works? A review of the efficacy and effectiveness of Nutrition
interventions. ACC/SCN Nutrition Policy paper 19. ABD Nutrition and Development
Series. 2001; No5.
18. UNICEF (United Nations Childrens’ Fund). Strategy for Improved Nutrition of Children
and women in developing countries. Policy review paper. New York: UNICEF. 1990
19. Black RE & Hopkins Bloomberg J. The Lancet series on Maternal and Child
Undernutrition. Executive Summary. Lancet. 2008; 371: 1-10.
20. Black RE, Allen LH, Bhutta ZA, Caulfield LE, De Onis M, Ezzati M & Rivera J. Maternal
and Child Undernutrition: Global and regional exposures and health consequences.
Lancet. 2008; 371: 243-257.
21. Nannan N, Norman R, Hendricks M, Dhansay M, Bradshaw D & South African
Comparative Risk Assessment Collaborating Group. Estimating the burden disease
attributable to childhood and maternal undernutrition in South Africa. SAMJ. 2007; 97(8):
733-739.
22. Malina RM. Physical growth and biological maturation of young athletes. Exerc Sport Sci
Rev. 1994;22:389-433.
23. Reilly T. Energetics of high-intensity exercise (soccer) with particular reference to fatigue.
J Sports Sci. 1997; 15(3): 257-63.
24. American Academy of Pediatrics. Organised sports for children and preadolescents.
Committee on sports medicine and fitness and committee on school health. Pediatrics.
2001; 107: 1459-1462.
25. Rosenbloom CA, Loucks AB &Ekblom B. Special populations: The female player and the
youth player. J Sports Sci. 2006; 24(7): 783-793.
26. Rowland TW. The ‘trigger hypothesis’ for aerobic trainability: a 14year follow-up.
PediatrExerc Science. 1997;9:1-9.
27. Malina RM, Bouchard C. Growth, maturation and physical activity. Champaign, Illinois:
Human Kinetics. 1991.
28. RogalAD,Clark PA, Roemmich JN. Growth and pubertal development in children and
adolescents: Effects of diet and physical activity. American Journal of Clinical Nutrition.
2000;72:S521-S528.
29. Daly RM, Bass S, Caine D & Howe D. Does training affect growth? Answers to common
questions. PhysSportsmed. 2002; 30(10): 21-9.
30. Largo RH. Catch-up growth during adolescence. Horn Res. 1993;39:S41-S48.
31. World Health Organisation. Obesity. Preventing and managing the global epidemic.
Report 894. Geneva: World Health Organisation. 2000.
Stellenbosch University http://scholar.sun.ac.za

66
32. Kerr MA, RennieKL, McCaffrey TA, Wallace JM, Hannon-Fletcher MP & Livingstone MB.
Snacking patterns among adolescents : a comparison of type, frequecny and portion size
between Britain in 1997 and Northern Ireland in 2005. Br J Nutr. 2009; 101: 122-131.
33. Moreno LA, Rodriguez G, Fleta J, Bueno-Lozano M, Lazaro A, Bueno G. Trends of
dietary habits in adolescents.Crit Rev Food SciNutr. 2010; 50: 106-112.
34. Michaud C &Baudier F. Food habits and consumption of French adolescents: Synthesis
of recent surveys. Archive Francoise Pediatrique. 1991; 48:475-479.
35. Serra-Majem L, Garcia-Closas R, Perez-Rodrigo C, Aranceta J. Food patterns of Spanish
schoolchildren and adolescents: The enKid study. Public Health and Nutrition. 2001;
4(6A):1433-1438.
36. Story M, Newmark-Sztainer D, French S. Individual and environmental influences on
adolescent eating behaviours. J Am Diet Assoc. 2002; 102: S40-S51.
37. Briefel RR, Wilson A, Gleeson PM. Consumption of low-nutrient, energy-dense foods and
beverages at school, home and other locations among school lunch participants and
nonparticipants. J Am Diet Assoc. 2009; 109: S79-S90.
38. Burgess-Champoux TL, Larson N, Newmark-Sztainer D, Hannan PJ, Story M. Are family
meal patterns associated with overall diet quality during the transition from early to middle
adolescence? J NutrEducBehav. 2009; 41: 79-86.
39. Li M, Dibley MJ, Sibbritt DW, Yan H. Dietary habits and overweight/obesity in adolescents
in Xi’an City, China. Asia Pac J ClinNutr. 2010; 19: 76-82.
40. Venter I, Winterbach A. Dietary fat knowledge and intake of mid-adolescents attending
public schools in the Bellville/Durbanville area of the Western Cape Province. South
African Journal of Clinical Nutrition. 2010; 23: 75-83.
41. Temple NJ, Steyn NP, Myburgh NG, Nel JH. Food Items Consumed by Students
Attending Schools in Different Socioeconomic Areas in Cape Town, South Africa.
Nutrition. 2006; 22(3): 252-258.
42. Malina RM. Body composition in athletes: Assessment and estimated fatness. 2007; 26:
37-68.
43. Lee RD, Nieman DC. Nutritional Assessment, Fifth Edition. McGraw Hill. 2010.
44. LohmanTG, Pollock ML, Slaughter MH, Brandon LH, Boileau RA. Methodological factors
and the prediction of body fat in female athletes. Medicine and Science in Sports and
Exercise.1984; 16(1): 92-6.
45. Slaughter MH, Lohman TG, BoileauRA, Horswill CA, Stillman RJ, Van Loan MD, Bemben
DA. Skinfold equations for estimation of body fatness in children and youth. Human
Biology. 1988; 60(5): 709-723.
46. World Health Organisation. WHO expert committee on physical status: The use and
interpretation of anthropometry. Report 854. Geneva: World Health Organisation. 1995.
Stellenbosch University http://scholar.sun.ac.za
67
47. Goedecke JH, Lambert EV, Jennings CL. Obesity in South Africa. In: Steyn K, Fourie J,
Temple N, eds. Chronic Diseases of Lifestyle in South Africa:1995-2005. Medical
Research Council – Technical Report. Tygerberg: Western Cape: MRC. 2006: 65-79.
48. Adelzadeh, A. South Africa Human Development Report 2003. Oxford Press. 2004.
49. Berg A. The nutrition factor: Its role in national development. Washington, DC: The
Brookings Institution, 1973: 1-290.
50. Kruger R, Kruger HS, Macintyre UE. The Determinants of Overweight and Obesity among
10 to 15-year-old Schoolchildren in the North West Province, South Africa – the THUSA
BANA study. Public Health Nutrition. 2006; 9(3): 351-358.
51. Reddy SP, Panday S, Swart D, Jinabhai CC, Amosun SL, James S, Monyeki KD,
Stevens G, Morojele N, Kambaran NS et al. UmthentheUhlabaUsamila – the South
African Youth Risk Behaviour Survey 2002. Cape Town, South African Medical Research
Council. 2003.
52. Reddy SP, James S, Sewpaul R, Koopman F, Funani NI, Sifunda S, Josie J, Masuka P,
Kambaran NS, Omerdien RG. UmthentheUhlabaUsamila – the South African Youth Risk
Behaviour Survey 2008. Cape Town, South African Medical Research Council. 2010.
53. Naude CE, Senekal M, Laubscher R, Carey PD, Fein G. Growth and weight status in
treatment naive 12-16 year old adolescents with alcohol use disorders disorders in Cape
Town, South Africa. Nutrition Journal. 2011; 10: 87-99.
54. Mendez MA, Monteiro CA, Popkin BM. Overweight exceeds underweight among women
in most developing countries. Am J ClinNutr. 2005; 81(3): 714-21.
55. Ara I, Vincente-Rodriguez G, Perez-Gomez J, Jimenez-Ramirez J, Serrano- Sanchez JA,
Dorado C, Calbet JA. Influence of extracurricular sport activities on body composition and
physical fitness in boys: a 3-year longitudinal study. Int J Obes. 2006; 30(7): 1062-71.
56. Juzwiak CR, Amancio OMS, Vitalle MSS, Pinheiro MM, Szejnfeld VL. Body composition
and nutritional profile of male adolescent tennis players. J Sports Sci. 2008; 26(11): 1209-
1217.
57. Ambler C, Eliakim A, Brasel J, Lee WN, Burke G, Cooper DM. Fitness and the effect of
exercise training on the dietary intake of healthy adolescents. International Journal of
Obesity and Related Metabolic Disorders. 1998; 22: 354-363.
58. Hill RJ & Davies PSW. The validity of self reported energy intake as determined using the
doubly labelled water technique. British Journal of Nutrition. 2001; 85: 415-430.
59. Thompson JL. Energy balance in young athletes. International journal of Sports Nutrition.
1998; 8: 161-174.
60. Wilmore J. Training for Sport and Activity: The physiological basis of the conditioning
Process. (2nd Ed). Boston: Allyn& Bacon, 1982.
Stellenbosch University http://scholar.sun.ac.za
68
61. Rico-Sanz. Frontera WR, Mole PA, Rivera MA, Rivera-Brown A, Meredith CN. Dietary
and performance assessment of elite soccer players during a period of intense training.
International Journal of Sport Nutrition. 1998; 8: 230-240.
62. Bangsbo J, Mohr M, Krustrup P. Physical and metabolic demands of training and match-
play in the elite football player. Journal of Sports Sciences. 2006; 24(7): 665-674.
63. Edwards AM, Mann ME, Marfell-Jones MJ, Rankin DM, Noakes TD, Shillington DP,
Influence of moderate dehydration on soccer performance: Physiological responses to
45 min of outdoor match-play and the immediate subsequent performance of sport-
specific and mental concentration tests. British Journal of Sports medicine. 2007; 41: 385-
391.
64. Sawka MN & Coyle EF. Influence of body water and blood volume on thermoregulation
and exercise performance in the heat. Exercise and Sport Sciences Reviews. 1999;27:
167-218.
65. Sawka MN &Pandolf KB. Effects of body water loss in physiological function and exercise
performance. In: Lamb DR, Gisolfi CV, eds. Perspectives in exercise science and sports
medicine: fluid homeostasis during exercise. Indianapolis: Benchmark press, 1990: 1.
66. Wilk B, Yuxiu H, Bar-Or O. Effect of hypohydration on aerobic performance of boys who
exercise in the heat. Med Sci Sports Exerc. 2002; 34:S48.
67. Petrie HJ, Stover EA, Horswill CA. Nutritional concerns for the child and adolescent
competitor. Nutrition. 2004; 20: 620-631.
68. Shirreffs SM, Casa DJ, Carter R. Fluid needs for training and competition in athletics.
Journal of Sports Sciences. 2007;25: S83-S91.
69. Meyer F, O’Connor H, Shirreffs SM. Nutrition for the young athlete. Journal of Sports
Sciences. 2007;25(S1): S73-S82.
70. Shirreffs SM. Post-exercise rehydration and recovery. In: Maughan RJ & Murray R, eds.
Sports drinks: Basic and practical aspects. Boca Raton, FL: CRC press, 2001: 183-195.
71. Maughan RJ, Watson P, Evans GH, Broad N, Shirreffs SM. Water balance and salt
losses in competitive football. International Journal of Sport Nutrition and Exercise
Metabolism. 2007;17:583-594.
72. Aragon-Vargas LF, Moncada-Jimenez J, Hernandez-Elionzo J, Barrenechea A, Monge-
Alvarado M. Evaluation of pre-game hydration status, heat stress and fluid balance during
professional soccer competition in the heat. European Journal of Sport Science. 2009;9:
269-276.
73. Sawka MN, Burke LM, Eichner ER, Maughan RJ, Montain SJ, Stackenfeld NS. American
college of sports medicine position stand: Exercise and fluid replacement. Medicine and
Science in Sports and Exercise. 2007;39:377-390.
Stellenbosch University http://scholar.sun.ac.za
69
74. Silva RP, Altoe JL, Marins JCB. Relevance of temperature and gastric emptying of fluids
consumed by individuals who practice physical activities. Brazilian Journal of Nutrition.
2009;22: 755-765.
75. Shirreffs SM, Aragon-Vagas LF, Chamorro M, Maughan RJ, Serratosa L, Zachwieja JJ.
The sweating response of elite professional soccer players to training in the heat.
International Journal of Sports Medicine. 2005; 26:90-95.
76. Otten JJ, Helwig, JP, Meyers LD, editors. Dietary reference intakes: The essential guide
to nutrient requirements. The National Academies Press; 2006.
77. American Dietetic Association. Timely statement of the American Dietetic Association:
Nutrition guidelines for adolescent athletes in organised sports. Journal of the American
Dietetic Association. 1996;96:611-612.
78. Cotunga N, Vickery CE, McBee S. Sports nutrition for young athletes.Journal of School
Nursing. 2005;21:323-328.
79. Spear B. Sports nutrition. In: Stang J & Story M, eds. Guidelines for adolescent nutrition
services. Minneapolis, MN: University os Minnesota Press. 2005:199-208.
80. Iglesias-Gutierrez E, Garcia-Roves PM, Rodriguez C, Braga S, Garcia-Zapico P,
Patterson AM. Food habits and nutritional status assessment of adolescent soccer
players. A necessary and accrate approach. Can J Appl Physiol. 2005;30(1): 18-32.
81. Ruiz F, Irazusta A, Gil S, Irazusta J, Casis L, Gil J. Nutritional intake in soccer players of
different ages. Journal of sport sciences. 2005; 23(3):235-242.
82. Croll JK, Newmark-Sztainer D, Story M, Wall M, Perry C, Harnack L. Adolescents
involved in weight-related and power team sports have better eating patterns and nutrient
intakes than non-sport-involved adolescents. Journal of the American Dietetic
Association. 2006;106:709-717.
83. Volpe SL. Micornutrient requirements for athletes. Clinics in Sports Medicine.
2007;26:119-130.
84. Ziegler P, Nelson J, Barratt-Fornell A, Fiveash L, Drenowski A. Energy and macronutrient
intakes of elite figure skaters. American Journal of the Dietetic Association.
2001;101:319-325.
85. Clark M, Reed DB, Crouse SF, Armstrong RB. Pre- and post-season dietary intake, body
composition, and performance indices of NCAA division 1 female soccer players.
International Journal of Sport Nutrition and Exercise Metabolism. 2003;13:303-319.
86. Reilly T & Thomas V. Estimated daily energy expenditure of professional association
footballers. Ergonomics. 1979;22:541-548.
87. Leblanc JC, LeGall F, Grandjean V, Verger P. Nutritional intake of French soccer players
at Clairefontaine Training Centre.Int J Sport NutrExercMetab. 2002;12:268-280.
Stellenbosch University http://scholar.sun.ac.za
70
88. Balsom PD, Wood K, Olsson B , Ekblom B, Carbohydrate intake and multiple sprint
sports: with special reference to football. International Journal of Sports Medicine.
1999;20:48-52.
89. Leatt PB & Jacobs I. Effects of glucose polymer ingestion on glycogen depletion during a
soccer match. Can J Sports Sci. 1989;14:112-116.
90. Eriksson O & Salting B. Muscle metabolism during exercise in boys aged 11-16 years
compared to adults. ActaPaediatr Belg. 1974;28:257.
91. Haralambie G. Enzyme activities in skeletal muscle of 13-15 years old adolescents. Bull
EurPhysiopathol Resp. 1982;18:65.
92. Saltin B. Metabolic fundamentals in exercise, Medicine and Science in Sport. 1973;5:137-
146.
93. Zehnder M, Rico-Sanz J, kuhne G, Boutellier U. Resynthesis of muscle glycogen after
soccer specific performance examined by 13C-magnetic resonance spectroscopy in elite
players. European Journal of Applied Physiology. 2001;84:443-447.
94. Burke LM, Millet G, Tarnopolsky MA. Nutrition for distance events. Journal of Sports
Sciences. 2007;25:S29-S38.
95. Clark K. Nutritional guidance to soccer players for training and competition. Journal of
Sports Sciences. 1994;12:S43-S50.
96. Riddell MC, Bar-Or O, Schwarz HP, Heigenhauser GJ. Substrate utilization in boys during
exercise with 13C-glucose ingestion. European Journal of Applied Physiology. 2000;
83:441-448.
97. Riddell MC &Iscoe KE. Physical activity, sport and pediatric diabetes. Pediatric Diabetes.
2006;7:60-70.
98. Riddell MC, Bar-Or O, Wilk B, Parolin ML, Heigenhauser GJ. Substrate utilization during
exercise with glucose and glucose plus fructose ingestion in boys aged 10-14 yr. Journal
of Applied Physiology. 2001;90:903-911
99. American College of Sports Medicine. Position stand: Nutrition and Athletic Performance.
Medicine and Science in Sports and Exercise. 2009;39:709-731.
100. Shi X, Horn MK, Osterberg KL, Stofan JR, Zachwieja JJ, Horswill CA et al.
Gastrointestinal discomfort during intermittent high-intensity exercise: Effect of
carbohydrate-electrolyte beverage. International Journal of Sport Nutrition and Exercise
Metabolism. 2004;14:673-683.
101. Jentjens R &Jeukendrup AE. Determinants of post-exercise glycogen synthesis
during short-term recovery. Sports Medicine. 2003;33:117-144.
102. Burke LM, Collier GR, Hargreaves M. Muscle glycogen storage after prolonged
exercise: the effect of the glycemic index of carbohydrate feedings. Journal of Applied
Physiology. 1993;75:1019-1023.
Stellenbosch University http://scholar.sun.ac.za

71
103. Parkin JAM, Carey MF, Martin IK, Stojanovska L, Febbraio MA. Muscle glycogen
storage following prolonged exercise: Effect of timing of ingestion of high glycemic index
food. Medicine and Science in Sports and Exercise.1997;29:220-224.
104. Tipton KD, Jeukendrup AE, Hespel P. Nutrition for the sprinter. Journal of Sports
Sciences. 2007;25:S5-S15.
105. Bolster DR, Pikosky MA, McCarthy LM, Rodriguez NR. Exercise affects protein
utilization in healthy children. J Nutr. 2001;131:2659.
106. Bass S &Inge K. Nutrition for special populations: Children and young athletes. In
Burke LM &Deakin V, eds. Clinical Sports Nutrition. Sydney, NSW:McGraw-Hill, 589-632.
107. Boisseau N, Vermorel M, Rance M, Duche P, Patureau-Mirand P.
Proteinrequirements in male adolescent soccer players. European Journal of
AppliedPhysiology. 2007 ;100(1) :27-33.
108. Duncan GE &Howley ET. Substrate metabolism during exercise in children and the
crossover concept. Pediatric Exercise Science. 1999;11:12-21.
109. Macek M &Vavra J. Prolonged exercise in 14-year old girls. International Journal of
Sports Medicine. 1981;2:228-230.
110. Delamarche PM, Monnier A, Gratas-Delamarche HE, Koubi MH, Favier R. Glucose
and free fatty acid utilization during prolonged exercise in prepubertal boys in relation to
cathecolamine responses. European Journal of Applied Physiology and Occupational
Physiology. 1992;65:66-72.
111. Hebestrait H, Mimura K, Bar-Or O. Recovery of muscle power after high intensity
short-term exercise: Comparing boys and men. 1993;74:2875-2880.
112. Mahon AD, Duncan GE, Howe CA, Del Corrall P. Blood lactate and perceived
exertion relative to ventilatory threshold: Boys versus men. Medicine and Science in
Sports and Exercise. 1997;29:1332-1337.
113. Martinez LR &Haymes EM. Substrate utilization during treadmill running prepubertal
girls and women. Medicine and Science in Sports and Exercise. 1992;24:975-983.
114. Brooks GA & Mercier J. Balance of carbohydrate and lipid utilization during exercise:
the crossover concept. Journal of Applied Physiology. 1994;76:2253-2261.
115. Stephens BR, Cole AS, Mahon AD. The influence of biological maturation on fat and
carbohydrate metabolism during exercise in males. International Journal of Sports
Nutrition and Metabolism. 2006;16:166-179.
116. Galassetti P, Larson J, Iwanga K, Salsberg SL, Eliakim A, Pontello A. Effect of a
high-fat meal on the growth hormone response to exercise in children. Journal of
Pediatric Endocrinology and Metabolism. 2006;19:777-786.
117. Wolmarans P &Oosthuizen W. Eat fats sparingly: Implications for health and disease.
SAJCN. 2001;14(3):S48-S55.
Stellenbosch University http://scholar.sun.ac.za

72
118. National Research Council. Recommended dietary allowances, 10th Ed. Washington
DC: National Academy Press, 1989.
119. Butte NF. Fat intake of children in relation to energy requirements. Am J ClinNutr.
2000;72:S1246.
120. Committee on Nutrition, American Academy of Pediatrics. Pediatric Nutrition
Handbook, 3rd ed. Elk Grove,IL: American Academy of Pediatrics, 1993.
121. Garrow JS, James WP, Ralph T. Human Nutrition and Dietetics, 10thed. New York:
Churchill Livingstone, 2000.
122. Wardlaw GM, Hampl JS, DiSilvestro RA. Perspectives in Nutrition, 6th ed. Boston:
McGraw-Hill Higher Education, 2004.
123. Pike RL & Brown ML. Nutrition. An Integrated Approach, 3rded. New York: MacMillan
Publishing Co, 1984.
124. Volpe SL. Micronutrient requirements for athletes. Clin Sports Med. 2007;26:119-
130.
125. American dietetic association. Position of the American Dietetic Association,
Dietitians of Canada and the American College of Sports Medicine: Nutrition and athletic
performance. Journal of the American Dietetic Association. 2000;100: 1543-1556.
126. Cupisti A, D’Alessandro C, Castrogiovanni S, Barale A, Morelli E. Nutrition
knowledge and dietary composition in Italian adolescent female athletes and non-
athletes. Int J Sport NutrExercMetab. 2002; 12: 207.
127. Fogelholm M, Ruokonen I, Laakso J, Vuorimaa T, Himberg J. Lack of association
between indices of vitamin B1, B2 and B6 status and exercise-induced blood lactate in
young adults. Int J Sport Nutr. 1993;3: 165.
128. McDonald R & Keen C. Iron and magnesium nutrition and athletic performance.
Sport Med. 1988; 5: 171.
129. Clarkson PM &Haymes EM. Exercise and mineral status of athletes: calcium,
magnesium, phosphorous and iron. Med Sci Sports Exerc. 1995; 27: 831.
130. Deakin V. Iron depletion in athletes. In Burke LM and Deakin V (eds). Clinical Sports
Nutrition. Sydney, NSW: McGraw-Hill, 2006; 263-312.
131. Rowland TW, Stagg L, Kelleher JF. Iron deficiency in adolescent girls: Are athletes at
increased risks? Journal of Adolescent Health. 1991; 12: 22-25.
132. Beard JL. Iron biology and immune function, muscle metabolism and neuronal
functioning. Journal of Nutrition. 2001; 131: S568-S580.
133. Grantham-McGregor S &Ani C. A review of studies on the effect of iron deficiency on
cognitive development in children. Journal of Nutrition. 2001; 131: S649-S668.
Stellenbosch University http://scholar.sun.ac.za

73
134. Lanou AJ, Berkow SE, Barnard ND. Calcium, dairy products and bone health in
children and young adults: A re-evaluation of the evidence. Pediatrics. 2005;115: 736-
743.
135. Bailey DA, McKay HA, Mirwald RL, Crocker PR, Faulkner RA. A six year longitudinal
study of the relationship of physical activity to bone mineral accrual in growing children:
The University of Saskatchewan bone mineral accrual study. Journal of Bone Mineral
Research. 1999; 14: 1672-1679.
136. MacKelvie JK, Khan KM, McKay HA. Is there a critical period for no response to
weight-bearing exercise in children and adolescents? A systematic review. British Journal
of Sports Medicine. 2002; 36: 250-257.
137. Goulding A, Cannan R, Williams SM, Gold EJ, Taylor RW, Lewis-Barned NJ. Bone
mineral density in girls with forearm fractures. Journal of Bone Mineral Research.
1998;13: 143-148.
138. Pires LA, Souza AC, Laitano O, Meyer F. Bone mineral density, milk intake and
physical activity in boys who suffered forearm fractures.Jornal de Pediatria. 2005; 81:
332-336.
139. Alves C & Lima RV. Dietary supplement use by adolescents. Jornal de Pediatria.
2009;85(4): 287-94.
140. Scofield DE & Unruh S. Dietary supplement use among adolescent athletes in central
Nebraska and their sources of information. J Strength Cond Res. 2006; 20: 452-5.
141. Calfee R &Fadale P. Popular ergogenic drugs and supplements in young athletes.
Pediatrics. 2006; 117:e577-89.
142. Maughan RJ, King DS, Lea T. Dietary supplements. J Sports Sci. 2004;22:95-113.
143. Pereira RF, Lajolo FM, Hirschbruch MD. Consumo de
supplementosporalunosdeacademias de ginasticaemSauPaulo.RevNutr. 2003 ;16 :265-
72.
144. Nieper A. Nutritional supplement practices in UK junior national track and field
athletes.Bristish Journal of Sports Medicine. 2005;39:645-649.
145. Kim SH& Keen CL. Patterns of vitamin/mineral supplement usage by adolescents
attending athletic high schools in Korea. International Journal of Sports Nutrition. 1999;
9(4): 391-405.
146. SobelJ&MarquartLF. Vitamin/mineral supplement use among athletes: A review of
the literature. International Journal of Sports Nutrition.1994; 4(4): 320-334.
147. Burke LM, Castell LM, Stear SJ. BJSM reviews: A-Z of supplements: dietary
supplements, sports nutrition foods and ergogenic aids for health and performance Part
1. Br J Sports. 2009;43(10): 728-729.
Stellenbosch University http://scholar.sun.ac.za

74
148. Geyer H, Parr MK, Mareck U et al. Analysis of non-hormonal nutritional supplements
for anabolic-androgenic steroids: results of an international study. Int J Sports Med.
2004;25:124-9.
149. Judkins C, Hall D, Hoffman K. Investigation into supplement contamination levels in
the US market. HFL Sport Science. 2007
150. Judkins C. Investigation into supplementation contamination levels in the UK market.
HFL Sport Science. 2008.
151. Petroczi A, Naughton DP, Mazanov J, Holloway A, Bingham J. Limited agreement
exists between rationale and practice in athletes supplement use for maintenance of
health: a retrospective study. Nutr J. 2007;6:34.
152. Carvalho T, ed. Guidelines of the Brazilian society of sports medicine: dietary
changes, fluid replacement, food supplements and drugs: demonstration of ergogenic
action and potential health risks. Rev Bras Med Esporte. 2003;9:57-68.
153. Department of Health, Medical Research Council, OrcMacro. 2007. The South
African Demographic and Health Survey 2003. Pretoria: Department of Health.
154. Marfell-Jones, M., Olds, T., Stewart, A. and Carter, L., International standards for
anthropometric assessment (2006). ISAK: Potchefstroom, South Africa.
155. Willet WC, Dietz WH, Colditz GA. Guidelines for Healthy Weight. The New England
Journal of Medicine. 1999; 341(6): 427-434.
156. WHO Child Growth Standards based on length/height, weight and age. ActaPediatria
Suppl. 2006; 450: 76-85.
157. Lohman TG. The use of skinfold to estimate body fatness on children and youth.
Journal of Physical Education, Recreation and Dance. 1987; 58(9): 98-102.
158. Lohman TG. Assessment of body composition in children. Pediatric Exercise
Science. 1989; 1(1):19-30.
159. Heyward VH. Practical body composition assessment for children, adults and older
adults. International Journal of Sports Nutrition. 1988; 8(3):285-307.
160. a: Frisancho AR. New norms of upper limb fat and muscle areas for assessment of
nutritional status.American Journal of Clinical Nutrition. 1981; 34(11):2540-2545.
b: Frisancho AR. Triceps skinfold and upper arm muscle size norms for
assessment of nutritional status. American Journal of clinical nutrition. 1974; 27: 1052-
1058.
161. Heymsfield SB, McManus C, Smith J, Stevens V, Nixon DW. Anthropometric
Measurement of muscle mass: Revised equations for calculating bone-free-arm-muscle
area. American Journal of Clinical Nutrition.1982; 36(4): 680-690.
Stellenbosch University http://scholar.sun.ac.za

75
162. Frisancho AR. Anthropometric Standards for the evaluation of growth and nutritional
status. 1990. Ann Arbor MI: University of Michigan Press.
163. Steyn BP, Senekal M. Dietary Assessment and Education Kit (DAEK). Chronic
diseases of lifestyle unit MRC ed Cape Town: South African Medical Research Council;
2004.
164. Van der Merwe S. A comparison of dietary supplement use and associated factors
between young (21- 0 years old) and older (≥ 45 years old) men exercising in commercial
gyms. A cross-sectional comparative study. [Honours Thesis] University of Cape Town,
South Africa; 2010.
165.
166. Schofield WN. Predicting basal metabolic rate, new standards and review of previous
work.Human Nutrition. Clinical Nutrition. 1985; 39 Suppl1 : 5-41.
167. CarlsohnA, Scharhag-Rosenberger F, Cassel M et al. Physical activity levels to
estimate the energy requirement of adolescent athletes. Pediatric Exercise Science.
2011; 23: 261-269.
168. CostillDL. Carbohydrates for exercise: Dietary demands for optimal performance.
International Journal of Sports Medicine. 1988; 9(1): 1-18.
169. Nemet A, Eliakom A. Current opinion in clinical nutrition and metabolic care. Pediatric
Sports Nutrition: an update. 2009; 12: 304-309.
170. Almquist J, Valovich McLeod TC, CavannaA et al. Summary Statement: appropriate
medical care for the secondary school-aged athlete. J Athl Train. 2008; 43 :416-427.
171. Maughan R. Role of micronutrients in sport and physical activity. British Medical
Bulletin. 1999; 55(3): 683-690.
172. Rodriguez NR, DiMarco NM, Langley S, ADA, DC, ACSM. Position of the American
Dietetic Association, Dietitians of Canada, and the American College of Sports Medicine:
Nutrition and Athletic performance. Nutrition and athletic performance. Journal of the
American Dietetic Association. 2009; 109 (3): 509-527.
173. Gallagher ML. Nutrients and their metabolism. In: Mahan KL, Escott-Stump S,
editors. Krause’s Food and Nutrition Therapy. Ed. St Louise: Saunders Elsevier; 2008.
174. Jonnalaqadda SS, Skinner R, Moore L. Overweight athlete: Fact or fiction. Current
Sports Medicine reports. 2004; 3(4): 198-205.
175. Trabulsi J, Schoeller DA. Evaluation of dietary assessment instruments against
doubly-labelled water, a marker of habitual energy intake. American Journal of
Physiology, Endocrinology and Metabolism. 2001; 281(5):E891-899.
176. McDowell MA, Ogden CL, Flegal KM. Anthropometric reference data for children and
adults: United States, 2003-2006. National Health Statistics Report. 2008; 10: 1-45.
Stellenbosch University http://scholar.sun.ac.za

76
177. Institute of Medicine, Food and Nutrition Board: Dietary reference intakes for energy,
carbohydrate, fiber, fat, fatty acids, cholesterol, protein and amino acids, Washington,
DC, 2002. The National Academies Press.
178. Mahan LK, Escott-Stump S & Raymond J. Krause’s Food and the Nutrition Care
Process, 13th Ed. 2012, Elsevier Saunders.
179. Boisseau N, Le Creff C, Loyens M and Poortman JR. Protein intake and nitrogen
balance in male non-active adolescents and soccer player. Eur Journal of Applied
Physiology. 2002;88: 288-293.
180. Wolmaran P, Jooste P, Oelofse A, Albertse EC and Charlton D. Breakfast patterns of
South African primary school children in low socioeconomic areas. S Afr J Food Sci Nutr.
1995;7: 103-106.
181. Bar-Or M and Prentice WE. US Soccer federation youth soccer heat stress
guidelines. 2002.
182. Rankin D, Ellis SM, MacIntyre UE, Hanekom SM and Wright HH. Dietary intakes
assessed by 24-hour recalls in peri-urban African adolescents: validity of energy intake
compared with estimated energy intake. European Journal of Clinical Nutrition. 2011;65:
910-919.
183. Wong PL, Chamari K, Dellal A and Wisloff U. The relationship between
anthropometric and physiological characteristics in youth soccer players. Journal of
strength and conditioning research. 2009;23(4): 1204-1210.
184. Noakes TD. Drinking guidelines for exercise: What evidence is there that athlete
should drink “as much as tolerable”, “to replace the weight lost during exercise” or “ad
libitum”? Journal of Sport Science. 2007;25: 781-96.
185. Cheng G, Libuda L, Karaolis-Dankert N, Alexy U, Bolzenius K, Remer T and Buyken
AE. Trends in dietary carbohydrate quality during puberty from 1988 to 2007: a cause for
concern. British Journal of Nutrition. 2010;104(9): 1375-83.
186. Bessesen DH. Update on obesity. Journal of Clinical Epidemiology and Metabolism.
2008;93(6): 2027-34.
187. Krauss RM, Deckelbaum RJ, Ernst N, Fisher E, Howard BV, Knopp RH, et al. Dietary
guidelines for healthy American adults. A statement for health professionals from the
Nutrition Committee, American Heart Association. Circulation. 1996;94(7):1795-800.
188. Hollick MF. Vitamin D deficiency in 2010: Health benefits of vitamin D and sunlight: a
D-bate. Nature Reviews Endocrinology. 2011;7: 73-75.
189. Diehl K, Thiel A, Mayer J, Schnell A and Schneider S. Elite adolescent athletes’ use
of dietary supplements. International Journal of Sport Nutrition and Exercise Metabolism.
2012;22 (3): 165-174.
Stellenbosch University http://scholar.sun.ac.za
77
190. Rodriguez G, Moreno LA, Blay MG, Blay VA, Fleta J, et al. Body fat measurement in
adolescents: comparison of skinfold thickness equations with dual-energy X-ray
absorptiometry. European Journal of Clinical Nutrition. 2005;59: 1158-1166.
191. Bouchard Claude. Childhood Obesity: are genetic differences involved. American
Journal of Clinical Nutrition. 2009;89 (5): 1494S-1501S.
Stellenbosch University http://scholar.sun.ac.za

78
PARTICIPANT INFORMATION LEAFLET APPENDIX 1
THE NUTRITIONAL PROFILE OF HIGH PERFORMANCE JUNIOR
FOOTBALL PLAYERS IN WESTERN CAPE, SOUTH AFRICA
PARTICIPANT INFORMATION LEAFLET
This study will be conducted by Fatima Hoosen from the University of Stellenbosch. The aim
of this study is to investigate the dietary intake and anthropometric profile of club / provincial-
level adolescent soccer players (13-19 yrs of age) during the competitive season. All the
junior players who currently play for Ajax Cape Town football club will have the opportunity
to participate in this study, provided they meet the inclusion criteria.In order to meet the
objectives of the study information regarding the participants’ dietary intake practices, use of
dietary supplements and nutrition and fluid intake practices before, during and after matches
will be required. A few anthropometrical measurements will also have to be performed. The
data will be obtained in an interview with the researcher and the participant at the Ajax
football club at a pre-arranged time convenient for the participant. .
Your consent means that you agree to provide the following information:
1. Basic demographic information: eg age, sex, address 2. Participants will also be asked to provide information about their use of nutritional
supplements as well as any nutrition and fluid practices before, during and after matches.
3. Food frequency questionnaire: the participant is provided with a list of foods and they are asked to indicate how often and how much is eaten.
Your consent also means that the researcher is allowed to perform anthropometrical
measurements on you. These measurements include the following:
1. Weight: this will be measured in light training clothing 2. Height: this will be measured without shoes 3. Mid-arm circumference: the top half of the arm is measured with a tape measure 4. Triceps skinfold measurement: the top half of the arm is measured with a calliper
(metal instrument which measures fat) 5. Subscapular skinfold measurement: a calliper(metal instrument) is used to measure
body fat on the back below the scapular.
Once the study is completed, it will be presented to the Ajax Cape Town football club and
the players who have participated in the study. All information provided during this study
remains confidential.
The information gathered from this study will enable the researcher to provide guidance to
players and their families on how to improve nutritional habits and thus ensure optimal
development as well as optimal athletic performance.
Stellenbosch University http://scholar.sun.ac.za

79
If you require further information regarding this study please contact the researcher, Fatima
Hoosen, on 084 849 3607.
INFORMED CONSENT APPENDIX 2
Title of project: The nutritional profile of high performance junior football players in
Western Cape, South Africa.
Principal researcher: Fatima Hoosen
Declaration by participant and parent/guardian:
By signing below, I …………………………………………….. agree to participate in the
abovementioned research study entitledThe nutritional profile of high performance junior
football players in Western Cape, South Africa. I understand that this study aims to
investigate the dietary intake as well as the anthropometric profile of club / provincial-level
adolescent soccer players (13-19 yrs of age). I declare that I have attended an information
session where the study was fully explained and I was provided with an opportunity to ask
questions which have been adequately answered. I understand that taking part in this study
is voluntary and that I may choose to leave the study at any time. I also understand that I am
allowing the researcher to take anthropometrical measurements (weight, height, skinfold
measurements) on me as well as obtain dietary information regarding usual intake,
supplement intake as well as match-day fluid and nutrition practices. All information
obtained during this study remains confidential. If you require further information please
contact the researcher on the following number: 084 849 3607.
Signed at (place)…………………………………. On (date)……………………..2009
………………………………. …………………………..
Signature of participant Signature of parent
.............................................
Stellenbosch University http://scholar.sun.ac.za

80
Signature of researcher
SOCIO-DEMOGRAPHIC QUESTIONNAIRE APPENDIX 3
The nutritional profile of high performance junior football players in
Western Cape, South Africa.
Subject Number: Date:
Subject Name: _________________________________________
Parent/Guardian Name: _________________________________
Address: _____________________________________________
_________________________________________________________
_________________________________________________
Contact Number: _______________________________________
Birth Date:
Age:
Gender: male
female
Stellenbosch University http://scholar.sun.ac.za

81
Ethnicity: black white coloured
indian other, specify _________
Education: primary school secondary school
tertiary institution
Team: U13 U15 U17
U19
_____________________________________________________
Stellenbosch University http://scholar.sun.ac.za
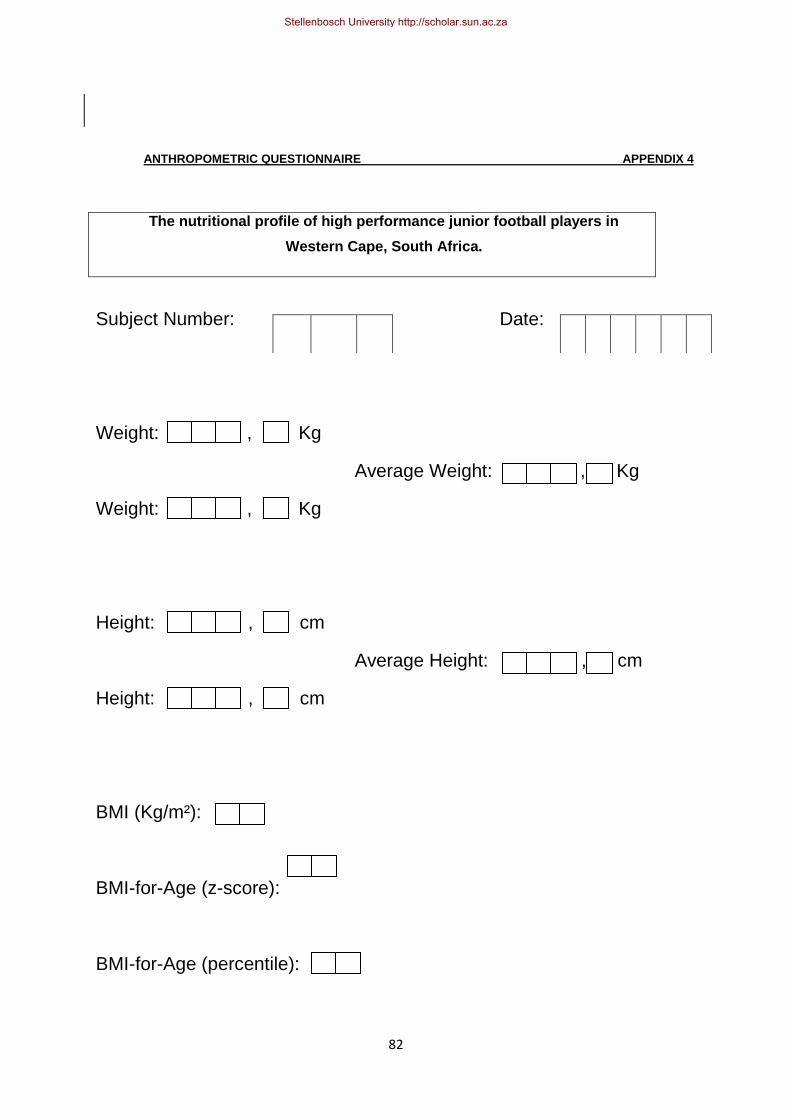
82
ANTHROPOMETRIC QUESTIONNAIRE APPENDIX 4
The nutritional profile of high performance junior football players in
Western Cape, South Africa.
Subject Number: Date:
Weight: , Kg
Average Weight: , Kg
Weight: , Kg
Height: , cm
Average Height: , cm
Height: , cm
BMI (Kg/m²):
BMI-for-Age (z-score):
BMI-for-Age (percentile):
Stellenbosch University http://scholar.sun.ac.za

83
Height-for-Age (z-score):
Height-for-Age (percentile):
Triceps: , mm
Average Triceps: , mm
Triceps: , mm
Percentile of triceps-for-age:
Sub-scapular: , mm
Average Sub-scapular: , mm
Sub-scapular: , mm
Percentile of subscapular-for-age:
Sum of two skinfolds: , mm
Percentile of sum of skinfold thickness(mm):
Stellenbosch University http://scholar.sun.ac.za
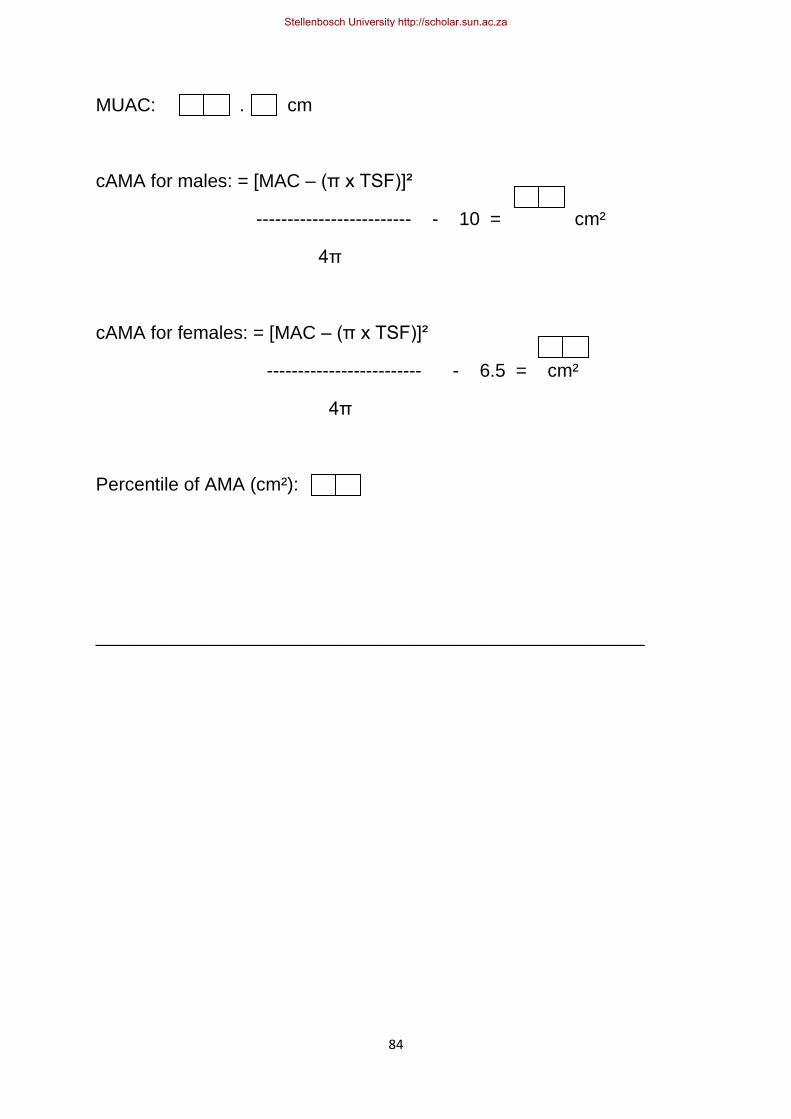
84
MUAC: . cm
cAMA for males: = [MAC – (π x TSF)]²
------------------------- - 10 = cm²
4π
cAMA for females: = [MAC – (π x TSF)]²
------------------------- - 6.5 = cm²
4π
Percentile of AMA (cm²):
_____________________________________________________
Stellenbosch University http://scholar.sun.ac.za

85
Stellenbosch University http://scholar.sun.ac.za

86
Stellenbosch University http://scholar.sun.ac.za

87
Stellenbosch University http://scholar.sun.ac.za

88
FOOD FREQUENCY QUESTIONNAIRE APPENDIX 7
The nutritional profile of high performance junior football players in Western Cape, South
Africa.
Subject Number:
Date:
For the completion of this section of the questionnaire we would like you to think carefully what you ate (including fruit in season) and drank during the last week. In the table below you will find a list of foods and drinks (Column 1). We would like you to tick off:
How often you ate or drank the specified item during the last week(Column 2); and
On average, how much (or portion size) you ate/drank of the specified item if you did eat it
(Column 3).
Guidelines are given in Column 3 to help you with portion size estimation. The standard (Std) portion size of each food item/drink is indicated in Column 3 in household measures (e.g. cups, spoons, grams) or a unit (e.g. a hamburger). Where possible the Std portion size is also shown in terms of visual aids, including a matchbox, a tennis ball and a sketch of half a cup of dished up food. Sketches of these aids are attached to the questionnaire (next page). Once you are sure about the size of the Std portion, tick one of the following options in Column 3:
If the portion you ate/drank of the specified item on average is ± the same as the Std portion size, tick the 1X Std column; OR
If the portion you ate/drank of the specified item on average is less than the Std portion size, tick the ½X Std column; OR
If the portion you ate/drank of the specified item on average is a little more than the Std portion size, tick the 1½X Std; OR
If the portion you ate/drank of the specified item on average is much more than the Std
portion size, tick the 2X or 3X Std column.
Explanation of abbreviations/symbols used:
Teaspoon: tsp
Table spoon: Tbs
Gram: g
Milliliters: ml
Etc - whatever is necessary
Tennis ball:
½ cup of dished up food:
Matchbox:
Stellenbosch University http://scholar.sun.ac.za

89
Please make sure that you tick every line. If you did not eat/drink a particular item in the last week ,
make sure that you tick the “NO” column. Remember that if you ticked the “NO” option in Column 2,
you do not have to complete Column 3 (portion size).
EXAMPLE (see first highlighted portion of questionnaire): During Jimmy’s training period, one of the
foods he eats is brown bread. He eats brown bread every day for breakfast and for lunch. At each
meal he eats about 2 slices of bread.
Usual intake during the LAST WEEK
Column 1 Column 2 Column 3
NO 1-3 per month
1-3 per
week
4-6 per
week
1 per day
2 per day
3 or more per day
Std portion
1X std
½ X std
1½ X std
2X std
3X std
EXAMPLE This person eats 2 slices of brown bread twice a day.
BREAD/ROLLS: brown
√ 1 roll or 1 med slice
√
1
RED MEAT: low fat cuts (no visible fat) e.g. Steak, lean minces, roast, ham (beef, veal mutton, pork, venison, ostrich)
90g/ 3X
2
RED MEAT: high fat cuts e.g. Regular mince, ribs chops with fat (beef, pork, mutton)
90g/ 3X
3 HAMBURGER
1
4 SAUSAGE: viennas, russians, frankfurt, boerewors etc.
10cm sausage
5 MEAT STEW: e.g. chuck, neck (with or without vegetables)
1 cup or 2X
6 CHICKEN/TURKEY: with skin
90g/ 3X
7 CHICKEN/TURKEY: without skin
90g/ 3X
8 FRIED CHICKEN/ SCHNITZEL: Kentucky or homemade
90g/ 3X
9 FISH: fried in fat/oil
90g/ 3X
10 FISH: steamed, grilled, braaied (fire)
90g/ 3X
11 FISH: tinned sardines, pilchards, salmon, tuna
90g/ 3X or ½ small tin
12 ORGAN MEATS: liver, kidney, heart, tripe (beef, sheep, chicken)
90g/ 3X
Stellenbosch University http://scholar.sun.ac.za

90
13 SMOKED/CURED: meat, fish, poultry
90g/ 3X
14 BACON
1 rasher
15 PROCESSED MEATS: e.g. Polony, salami
1 thin slice
16 MEAT PIE/SAUSAGE ROLL
1X or 1 med
NO 1-3 per month
1-3 per
week
4-6 per
week
1 per day
2 per day
3 or more per day
Std portion
1X std
½ X std
1½ X std
2X std
3X std
17 MARGERINE/OIL/FAT IN PREPARATION (added to chicken/ beef/fish)
1 tsp
18 EGGS (WITHOUT FAT): boiled/ poached
1 egg
19 EGGS (WITH FAT): scrambled/ baked/ omelette
1 egg
20 BREAD/ROLLS: white
1 roll or 1 med slice
21 BREAD/ROLLS: brown
1 roll or 1 med slice
22 BREAD/ROLLS: whole wheat/health/low GI
1 roll or 1 med slice
23 PROVITA/ RYVITA
2 biscuits
24 PIZZA: commercial/ homemade
4 slices
25
BREAKFAST CEREAL: high fibre e.g. All bran, highbulk, muesli, weet-bix, Pro-nutro
½ cup or 1 weet-bix or 1X
26 BREAKFAST CEREAL: other e.g. cornflakes, rice crispies, special K
½ cup or 1X
27 OATS/OAT BRAN: cooked porridge
½ cup or 1X
28 MAIZE PORRIDGE: stiff/crumbled
½ cup or 1X
29 RICE: white
½ cup or 1X
30 RICE: brown
½ cup or 1X
31 MEALIE RICE/SAMP
½ cup or 1X
32 CORN: e.g. mealie, sweetcorn
½ cup/1 med/ 1X
33 POPCORN
1 cup or 2X
34 LEGUMES (tinned or dry beans) e.g. baked beans, lentils
½ cup or 1X
Stellenbosch University http://scholar.sun.ac.za

91
35 PASTA: e.g. Macaroni, spaghetti, noodles
1 cup or 2X
36 PASTA SAUCE: white or cheese sauce
½ cup
37 POTATO: boiled, mashed, baked
½ cup or 1X or 1 med
38 POTATO: roasted/fried in any fat/oil (includes french-fries/slap chips)
½ cup or 1X or 1 med
NO 1-3 per month
1-3 per
week
4-6 per
week
1 per day
2 per day
3 or more per day
Std portion
1X std
½ X std
1½ X std
2X std
3X std
39 MARGERINE/OIL/FAT IN PREPARATION: (added to pasta, potato, rice)
1 tsp
40
FULL CREAM (FRESH/ POWDERED): milk, sour milk (Maas) on porridge/cereal or to drink (excluding milk blends)
½ cup or ½ std glass
41
LOW FAT (FRESH/ POWDERED): milk, sour milk (Maas) on porridge/cereal or to drink (excluding milk blends)
½ cup or ½ std glass
42
SKIMMED (FRESH/ POWDERED): milk, sour milk (Maas) on porridge/cereal or to drink (excluding milk blends)
½ cup or ½ std glass
43 MILK IN TEA/COFFEE: full cream/low fat/skimmed
3 Tbs
44 COFFEE CREAMER IN TEA/COFFEE: e.g. Cremora
1 tsp
45 YOGHURT: full cream
½ cup or 125ml serving
46 YOGHURT: low fat
½ cup or 125ml serving
47 YOGHURT: fat free
½ cup or 125ml serving
48 DRINKING YOGHURT
½ cup or 125ml serving
49 FLAVOURED MILK 1 cup
Stellenbosch University http://scholar.sun.ac.za

92
DRINKS: milo, nesquick, horlicks, sterri-stumpie
50
ICE-CREAMS (DAIRY): ice-cream, milkshakes, smoothies, frozen yoghurt
1 cup
51 ICE-CREAM (NON-DAIRY): sorbet, milkshakes, smoothies
1 cup
52 SMOOTHIES (WITHOUT ICE-CREAM): fruit and ice blend only
1 cup
53 CUSTARD, MILK PUDDINGS
½ cup
NO 1-3 per month
1-3 per
week
4-6 per
week
1 per day
2 per day
3 or more per day
Std portion
1X std
½ X std
1½ X std
2X std
3X std
54 CHEESE: on bread or in dishes (excluding cottage/cream cheese)
1 slice or 1X
55 COTTAGE CHEESE 1 Tbs
56 CREAM CHEESE 1 Tbs
57 REGULAR SALAD DRESSING/ MAYONNAISE
1 Tbs
58 LOW FAT/LIGHT SALAD DRESSING/ MAYONNAISE
1 Tbs
59 SAUCES: tomato, chutney, mustard, sweet chilli
1 Tbs
60 PEANUT BUTTER:
1 Tbs
61 PEANUTS:
30g or 1X
62 OTHER NUTS:
30g or 1X
63 RAISINS:
30g or 1X
64 OTHER DRIED FRUIT:
30g or 1X
65 CITRUS FRUIT: e.g. Oranges, grapefruit, naartjies, minolas etc.*
1 med or 1X
66 APPLES/PEARS:
1 med or 1X
67 BANANAS:
1 med or 1X
68 PEACH/APRICOT:*
1 med or 1X
69 WATERMELON/ SWEET MELON:*
1 large slice
Stellenbosch University http://scholar.sun.ac.za

93
70 GUAVAS:*
1 med or 1X
71 MANGO/ PAW-PAW/ PINEAPPLE:*
1 large slice
72 GRAPES:*
8-10 grapes
73 STRAWBERRIES:*
½ cup or 1X
74 AVOCADO:*
½ med
75 FRUIT SALAD: tinned/ fresh
½ cup or 1X
*IF A PARTICULAR FRUIT WAS NOT IN SEASON DURING YOUR LAST MONTH OF TRAINING, YOU CAN MARK THE ‘NO’ COLUMN.
NO 1-3 per month
1-3 per
week
4-6 per
week
1 per day
2 per day
3 or more per day
Std portion
1X std
½ X std
1½ X std
2X std
3X std
76 CABBAGE: (raw/ cooked)
½ cup or 1X
77
BROCCOLI, CAULIFLOWER, BRUSSEL SPROUTS: (raw/cooked)
½ cup or 1X
78 SPINACH/MAROG/ IMIFINO: (raw/ cooked)
½ cup or 1X
79 CARROTS (raw/cooked)
½ cup or 1X
80 BEETROOT:
½ cup or 1X
81 TOMATO: (raw/cooked)
½ cup or 1X
82 ONIONS: (raw/cooked)
½ cup or 1X
83 TOMATO AND ONION: stewed
½ cup or 1X
84 GREEN PEAS: (raw/ cooked)
½ cup or 1X
85 GREEN BEANS: (raw/ cooked)
½ cup or 1X
86
MIXED VEGETABLES: carrots, peas, mealies, beans (in any combination)
½ cup or 1X
87 PUMPKIN, HUBBARD, BUTTERNUT
½ cup or 1X
88 GEM SQUASH, MARROWS, PATTY-PANS
1 med/ ½ cup or 1X
89 MIXED SALAD: lettuce, cucumber, tomato,
½ cup or 1X
Stellenbosch University http://scholar.sun.ac.za

94
peppers, onions in any combination
90 SWEET POTATOES:
1 med/ 1/2 cup or 1X
91 MARGERINE/OIL/FAT IN PREPARATION: (added to vegetables)
1 tsp
92 SUGAR: (white and/or brown added to vegetables)
1 tsp (heaped)
93 MUFFIN/SCONE (bran, whole wheat only)
1 med or 1X
94 MUFFIN/SCONE (all other) chocolate/ poppy-seed etc
1 med or 1X
95 RUSKS: any
1 med or 2X
NO 1-3 per month
1-3 per
week
4-6 per
week
1 per day
2 per day
3 or more per day
Std portion
1X std
½ X std
1½ X std
2X std
3X std
96
VETKOEK, DOUGHNUTS, SAMOOSAS, KOEKSISTER
1 med or 1X
97 SALTY CRISPS: Simba chips, Lays etc.
1 small packet
98 SALTY BISCUITS: Salty Crax etc.
2 biscuits
99 ICED CAKES, TARTS, COOKIES with filling
1 med piece or 2 cookies or 1X
100 CAKE: commercial, homemade cakes/ tarts
1 med piece or 2 cookies or 1X
101 JAM/SYRUP/HONEY 1 tsp
102 SWEETS: boiled sweets, jellies, toffee
4 sweets
103 SWEETS: super C’s, energy sweets
4 sweets
104 CHOCOLATE
1 small bar/2-3 blocks
105 ENERGY/HEALTH/BREAKFAST BARS
1 small bar
106 TEA NORMAL (excluding rooibos)
1 cup
107 TEA ROOIBOS
1 cup
Stellenbosch University http://scholar.sun.ac.za

95
108 COFFEE: instant/ground (excluding decaffeinated)
1 cup
109 COFFEE: decaffeinated 1 cup
110 SUGAR: (white & brown in tea/coffee)
1 tsp (heaped)
111 ORANGE/GUAVA JUICE 1 std glass
112 OTHER FRUIT JUICE 1 std glass
113 MIXED JUICES/ CORDIALS : e.g. Oros, powdered mixes etc
1 std glass
114 ENERGY DRINKS: Energade, Poweradeetc
500ml
115 CAFIENATTED ENERGY DRINKS: Red-Bull, Play etc.
250ml or 1 Tin
116 WINE: red/white
1 wine glass or ± 200ml
117 PORT/SHERRY/ LIQUEUR etc.
1 sherry glass
NO 1-3 per month
1-3 per
week
4-6 per
week
1 per day
2 per day
3 or more per day
Std portion
1X std
½ X std
1½ X std
2X std
3X std
118 REGULAR BEER/ CIDERS/COOLERS
340ml (1X can/ bottle)
119 LIGHT BEER/ CIDERS/COOLERS
340ml (1X can/ bottle)
120 SPIRITS: brandy, whiskey,rum,vodka,gin
1 tot/ shot
121 NON-DIET FIZZY SOFT DRINKS: coke, fanta
1 std glass/can
122 DIET FIZZY DRINKS: e.g. Coke zero, coke light, sprite zero etc.
1 std glass/can
123 OTHER SOFT DRINKS OR FIZZY FRUIT SQUASH
1 std glass/can
Stellenbosch University http://scholar.sun.ac.za
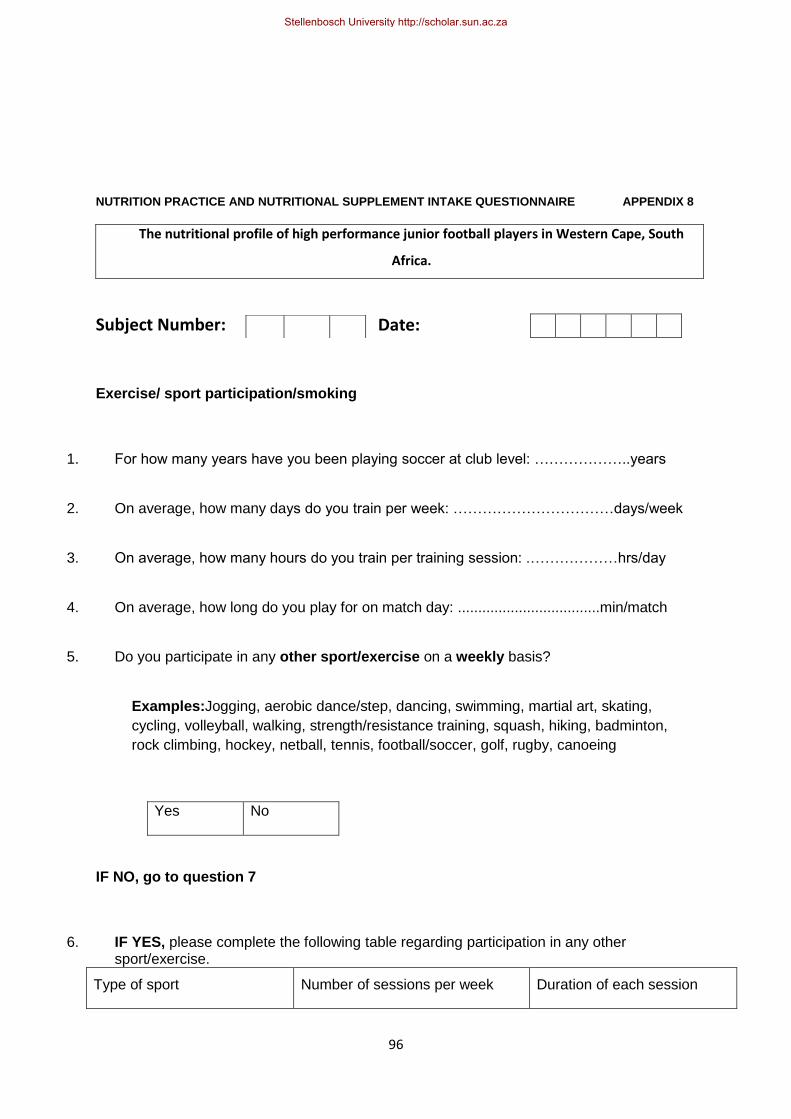
96
NUTRITION PRACTICE AND NUTRITIONAL SUPPLEMENT INTAKE QUESTIONNAIRE APPENDIX 8
The nutritional profile of high performance junior football players in Western Cape, South
Africa.
Subject Number: Date:
Exercise/ sport participation/smoking
1. For how many years have you been playing soccer at club level: ………………..years
2. On average, how many days do you train per week: ……………………………days/week
3. On average, how many hours do you train per training session: .………………hrs/day
4. On average, how long do you play for on match day: ...................................min/match
5. Do you participate in any other sport/exercise on a weekly basis?
Examples:Jogging, aerobic dance/step, dancing, swimming, martial art, skating,
cycling, volleyball, walking, strength/resistance training, squash, hiking, badminton,
rock climbing, hockey, netball, tennis, football/soccer, golf, rugby, canoeing
Yes No
IF NO, go to question 7
6. IF YES, please complete the following table regarding participation in any other sport/exercise.
Type of sport Number of sessions per week Duration of each session
Stellenbosch University http://scholar.sun.ac.za
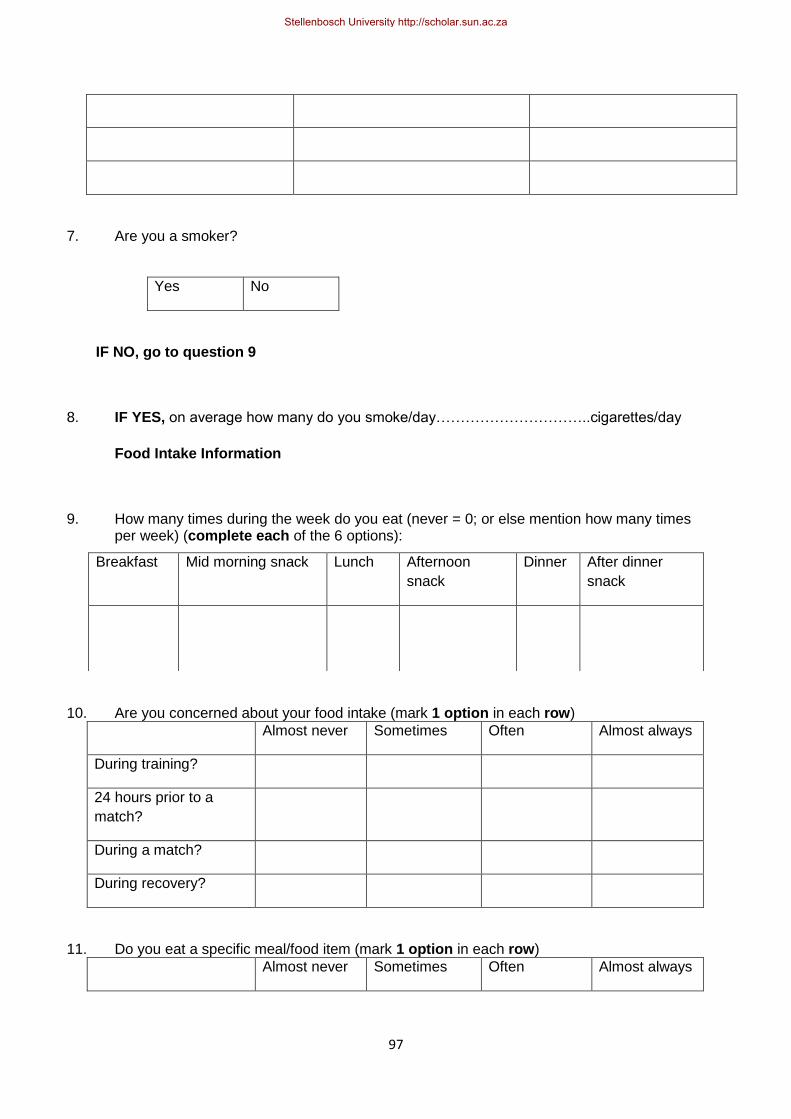
97
7. Are you a smoker?
Yes No
IF NO, go to question 9
8. IF YES, on average how many do you smoke/day…………………………..cigarettes/day
Food Intake Information
9. How many times during the week do you eat (never = 0; or else mention how many times per week) (complete each of the 6 options):
10. Are you concerned about your food intake (mark 1 option in each row)
Almost never Sometimes Often Almost always
During training?
24 hours prior to a
match?
During a match?
During recovery?
11. Do you eat a specific meal/food item (mark 1 option in each row)
Almost never Sometimes Often Almost always
Breakfast Mid morning snack Lunch Afternoon
snack
Dinner After dinner
snack
Stellenbosch University http://scholar.sun.ac.za
98
During training?
24 hours prior to a
match?
During a match?
During recovery?
12. Indicate the main reason when eating a meal/food item during the specified times (mark 1 option in eachrow):
To provide
energy
To carbo-load To provide
protein
Ajax provides
the meal/food
item
During training?
24hrs prior to a
match?
During a match?
During recovery?
Fluid intake (hydration)
13. Do you control OR are you concerned about your fluid intake/hydration (mark 1 option in each row)
Almost never Sometimes Often Almost always
During training?
24 hours prior to a
match?
During a match?
During recovery?
14. Indicate the 1 most important reason for fluid intake during the specified times (mark 1 option in eachrow):
I drink to thirst I drink as much as
tolerable
I drink according to predetermined
fluid intake schedule
Stellenbosch University http://scholar.sun.ac.za
99
During training
24hrs prior to a
match
During a match
During recovery
15. What is the main reason for drinking a particular drink/fluid during a match (mark only 1 option per drink)?
Never use Thirst Replace Fluid Provide Energy Other
Water
Sports
drink
Coke/pepsi
Other
16. What would your usual total fluid intake during a match be? ______ml
17. What would your usual total fluid intake during a training session be? _____________ml
Supplement use
18. Mark the supplements you used during the past 6 months
Supplements Do not
use
Daily Weekly, not
every day
Monthly,
not every
week
Brand if known
Multi vitamin and mineral
Stellenbosch University http://scholar.sun.ac.za

100
Vitamin C
Vitamin E
Vitamin B complex
Energy tonic (egbioplus)
Immune support (eg viral
guard)
Zinc
Magnesium
Calcium
Iron
Anti-oxidant mix
Energy drinks
Energy bars
Carboloader
Protein supplement
Amino acids
Meal replacement
(egmyoplex)
Recovery drink (eg recovery
max)
Creatine
HMB
Cramp attack/cramp stop
Endurox/Enduraid
Carnitine
Glutamine products
Testosterone enhancers
DHEA
Caffeine/ guarana
Stellenbosch University http://scholar.sun.ac.za

101
NHANES 1999-2002 APPENDIX 9
Stellenbosch University http://scholar.sun.ac.za

102
NHANES 1999-2002 APPENDIX 10
Stellenbosch University http://scholar.sun.ac.za

103
FRISANCHO, 1990 APPENDIX 11
Stellenbosch University http://scholar.sun.ac.za
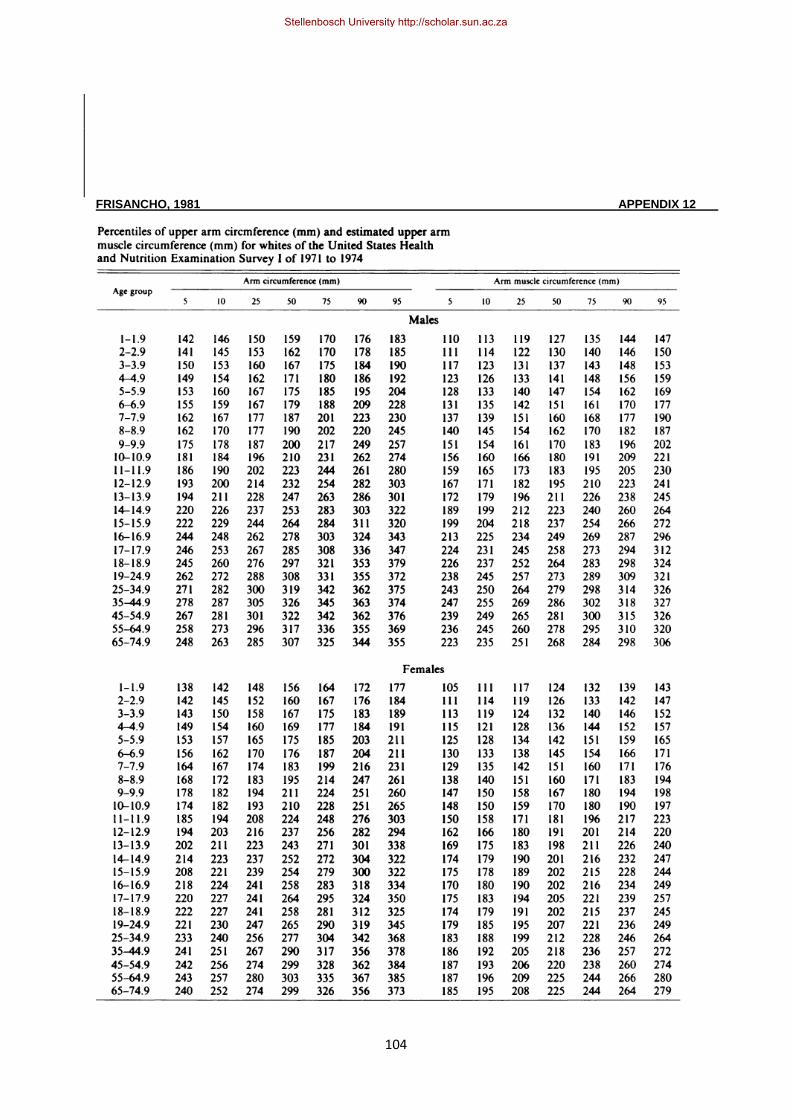
104
FRISANCHO, 1981 APPENDIX 12
Stellenbosch University http://scholar.sun.ac.za

105
FRISANCHO, 1981 APPENDIX 13
Stellenbosch University http://scholar.sun.ac.za

106
Stellenbosch University http://scholar.sun.ac.za