
The Nutritional Evaluation of Dried Poultry Waste as a ...
148
THE NUTRITIONAL EVALUATION OF DRIED POULTRY WASTE AS A FEED INGREDIENT FOR BROILER CHICKENS JOSEPHINE |NAMBI •NIYBRSmr OF umnA*' A THESIS SUBMITTED IN FULFILMENT FOR THE DEGREE OF DOCTOR OF PHILOSOPHY IN ANIMAL PRODUCTION OF THE UNIVERSITY OF NAIROBI 1987.
Transcript of The Nutritional Evaluation of Dried Poultry Waste as a ...

THE NUTRITIONAL EVALUATION OF DRIED POULTRY
WASTE AS A FEED INGREDIENT FOR
BROILER CHICKENS
JOSEPHINE |NAMBI
•NIYBRSmr OFumnA*'
A THESIS SUBMITTED IN FULFILMENT FOR THE
DEGREE OF DOCTOR OF PHILOSOPHY IN ANIMAL
PRODUCTION OF THE UNIVERSITY OF NAIROBI
1987.

(ii)
DECLARATION
This thesis is my original work and has not been
presented for a degree in any other University.
_____ _________________JOSEPHINE NAMBI
This thesis has been submitted for examination with
our approval as University Supervisors.
DEPT. OF ANIMAL PRODUCTION.
DR. B.N. MITARU DEPT. OF ANIMAL PRODUCTION.

(iii)ABSTRACT
Studies were carried out to determine the chemical
and bacteriological compositions of variously dried poultry
waste (DPW), and to evaluate DPW as a feed ingredient for
broiler chickens. Poultry waste was collected every three
days from caged laying hens, and immediately subjected to:
(i) oven drying at 60°C; (ii) sun drying followed by
autoclaving at 1.05 kg/cm^, 121°C, for 15 minutes or
(iii) solar drying at 50-70°C. The differently dried
poultry waste showed remarkable similarities in proximate
composition, minerals, and amino acid contents, but differed
quite significantly in metabolizable energy content, true
protein digestibility, and gross protein value. The oven
dried waste had a higher metabolizable energy content,
true protein digestibility, and gross protein value than
the sun dried-autoclaved or the solar dried wraste. Most
of the bacteria isolated from the dried poultry waste were
believed to be normal inhabitants of the chickens' intestinal
tract.
The dietary inclusion of 5, 10, and 15$ oven dried,
sun dried-autoclaved, or the solar dried poultry waste
gave no significant differences in growth rate or feed
intake of broiler chicks. The 15% level of DPW gave a
poorer (P< 0,05) feed efficiency than the 5% level, probably
due to the lower dietary metabolizable energy content.
In another experiment, lard was included in isonitrogenous
diets containing 5, 10, 15 and 20% oven or solar dried poultry’
waste to make the diets isocaloric with the control diet.

(iv)
No significant differences were obtained in growth rate or
feed intake of broilers, but feed efficiency was depressed
at the 20$ level of DPW inclusion. The dietary inclusion
of up to 20$ DPW in broiler diets had no significant
effects on carcass yield and meat composition of broilers.
No significant differences were observed in broiler
performance, carcass yield, or meat composition of broilers
fed diets containing 10$ oven or solar dried poultry waste
with various dietary energy and protein levels. However,
it was cheaper to feed diets with the lowest dietary
energy and protein levels.
The inclusion of up to 12$ lard in broiler starter
diets containing 10$ solar dried poultry waste had no
significant effects on broiler performance, or calcium and
phosphorus utilization, but the 12$ level of lard caused
a significant reduction in magnesium retention. The diet
containing 3$ lard gave a significantly higher fat retention
than the diet without lard.
From the results of this study, it can be concluded
that the oven or solar dried layer waste may be safely
included up to 15$ of properly balanced diets. Nonethe
less, under conditions of this study, the 10$ level of
poultry waste appeared to be the most economical maximum
limit of inclusion in broiler diets.

(V)
DEDICATION
This thesis is dedicated to my parents, brothers
and sisters, for their support and encouragement.

ACKNOWLEDGEMENTS
I am very grateful to Dr. P.N. Mbugua for his advice
and encouragement throughout the research, and for his
tireless efforts in reading through this work. I also
thank Dr. B.N. Mitaru for his constructive criticisms during
the research and during the writing of this thesis. Thanks
are also due to Mercy Surtan of the University of Nairobi,
and Mr. Ambani of Veterinary Laboratories, Kabete for
their technical assistance.
I gratefully acknowledge the financial assistance
provided by the German Academic Exchange Service (DAAD.),
and the Department of Animal Production, University of
Nairobi. I am very appreciative to the Director of the
National Animal Husbandry Research Station (N.A.H.R.S.)
Naivasha, for allowing me to use the facilities of the
Poultry Unit at the Research Station. Thanks are also due
to Rahab Muinga who provided me with accommodation during
my stay at the Research Station. I am indebted to the
National Poultry Development Frogranme (N.P.D.P.)
co-ordinators, Messrs Templeman and F. Itunga, for
providing the broiler chicks used in the experiments.
Thanks also to the staff of the Poultry Units of the N.A.H.R.S.
Naivasha and of the Department of .Animal Production,
University of Nairobi for their co-operation during the
feeding trials. Last but not least, I am grateful to
Jolin Gitau for typing this thesis.
(vi)
7

(vii)
LIST OF
LIST OF
LIST OF
SECTION
SECTION
TABLE OF CONTENTS
TABLES
1. INTRODUCTION
Page
(xi)
(xiii)
(xiv)
1
2. LITERATURE REVIEW ------------ 4 ^
2.1 Poultry population in Kenya andneed for alternative poultry feedstuffs ---------------------- 4
2.2 Chemical composition of DPW ---- 5
2.2.1 Nitrogen content --------------- 5
2.2.2 Ash composition---------------- 8
2.2.3 Crude fibre content ------------ 8
2.2.4 Fat content------------------- 9
2.2.5 Metabolizable energy content ofD P W ----------------------------- 9
2.3 Effects of DPW containing dietson broiler performance --------- 10
2.3.1 Effects of DPW containing dietson carcass yield and quality -- 11
2.4 Human and animal health aspectsof feeding poultry waste to livestock and poultry----------- 12
2.4.1 Pathogenic organisms ----------- 13

(viii)
2.4.2 Mineral hazards------------------- 162.4.3 Medicinal drug residues and
metabolites---------------------- 17
2.4.4 Mycotoxins----------------------- 18
2.5 Economic value of feeding poultryexcreta to animals--------------- 18
SECTION 3. MATERIALS AND METHODS ------------ 20
3.1 Source and processing of poultryw a s t e ----------------------------- 20
3.2 Chemical analyses of DPW and layerm a s h ------------------------------ 21
3.2.1 Amino acid composition of DPW ---- 21
3.3 True metabolizable energy (TME) content of DPW and layer mash andtrue protein digestibility of DPW— 22
3.4 Bacteriological and aflatoxinexamination of DPW --------------- 23
3.5 Experiment 1 ----------------------- 23
3.5.1 Objective ------------------------- 23
3.5.2 Experimental procedure ------------ 24
3.5.3 Data collection-------------------- 26
3.5.4 Chemical analyses of experiment 1diets ------------------------------ 27
3.5.5 Statistical analysis -------------- 27
3.6 Experiment 2 ----------------------- 27
3.6.1 Objectives------------------------- 27
3.6.2 Experimental procedure ------------ 28
3.6.3 Data collection-------------------- 303.6.3.1 Description of GOT and GPT
determinations ---------------- 31
3.7 Experiment 3 ----------------------- 363.7.1 Objectives----------------------- 36
Page

Page(ix)
3.7.2 Experimental procedure ----------- 363.7.3 Data collection----------------- 37
3.8 Experiment 4 --------------------- 413.8.1 Objective’ ----------------------- 413.8.2 Experimental procedure ----------- 413.8.3 Data collection------------------ 42
3.9 Experiment 5 --------------------- 453.9.1 Objectives----------------------- 453.9.2 Experimental procedure ---------- 453.9.3 Data collection------------------ 46
SECTION 4. RESULTS AND DISCUSSION ---------- 494.1 Chemical composition of dried
poultry waste (DPW) ------------- 494.1.1 Amino acid composition of DPW --- 54
4.2 Bacteriological and aflatoxin composition of DPW ---------
4.3 Experiment 1 -------------------- 604.3.1 Chemical analyses of the diets --- 604.3.2 Chick performance and gross
protein values (GPV) of driedpoultry waste ------------------- 61
4.4 Experiment 2 -------------------- 644.4.1 Chemical analyses of the diets - 644.4.2 Broiler chick performance ------- 65

(So ' . ~
Page
4.4.3 Effect of level and type of DPW and age of broiler chicks onhepatic GOT and GPT activities--- 68
4.4.4 Tibia a s h ------------------------ 72
4.5 Experiment 3 --------------------- 7 5
4.5.1 Chemical analyses of the diets — 75
4.5.2 Broiler performance ------------- 76
4.5.3 Carcass yield, abdominal fat padweight, and meat composition of broilers fed experiment 3 diets — 80
4.6 Experiment 4 --------------------- 83
4.6.1 Chemical analyses of the diets --- 83
4.6.2 Broiler performance -------------- 83
4.6.3 Carcass yield and meat compositionof broilers fed experiment 4 diets - 86
4.7 Experiment 5 ---------------------- 89
4.7.1 Chemical analyses of the diets ---- 89
4.7.2 Effect of dietary fat level onbroiler performance --------------- 89
4.7.3 Effect of dietary fat level, on fatand mineral utilization by broiler chicks------------------------------ 91
SECTION 5 GENERAL DISCUSSION ---------------- 95 ^
SECTION 6 CONCLUSIONS----------------------- 100
SECTION 7 SCOPE FOR FURTHER W O R K -------------- 102
SECTION 8 REFERENCES --------------------------- 103s
SECTION 9 * APPENDICES------------------------- 130
' 1
I 4

25
29
38
39
43
44
47
50
55
58
62
66
69
73
77
81
(xi )
LIST OF TABLES
Composition of diets used in Experiment 1
Composition of diets used in Experiment 2
Composition of starter diets used in Experiment 3 -----------------------------
Composition of finisher diets used in Experiment 3 ----------------------------
Composition of starter diets used in Experiment 4 ----------------------------
Composition of finisher diets used in Experiment 4 -----------------------------
Composition of diets used in Experiment 5
Chemical composition of dried poultry waste -------------------------------------
Amino acid composition of dried poultry waste -------------------------------------
Bacteriological composition of dried poultry waste ----------------------------
Average feed consumption, weight gain per chick, and gross protein values (GPV) of DPW ------------------------------
Effect of level and type of DPW on growth rate, feed intake and feed efficiency of broiler chicks from 2 to 30 days ofa g e ---------------------------------------
Effect of level and type of DPW on mean hepatic GOT and GPT activities of broiler chicks between 16 and 30 days of age ----
Effect of dietary level and type of DPW on tibia ash content of broiler chicks between 9 and 30 days of age ------------
Effect of level of oven or solar dried poultry waste on broiler performance from 4 to 53 days of age ---------------Effect of level of oven or solar dried poultry waste on carcass yield, abdominal fat pad weight and meat composition------

(xii)
17. Effect of dietary level of energy and protein in diets containing 10% DPW, on broiler performance from day old 54 days of age ------------------------
18 Effect of dietary levels of energy and protein in diets containing 10% DPWon carcass yield, and meat composition of broilers ---------------------------
19 Effect on broiler performance, ofgraded levels of fat in diets containing 10% solar driedpoultry waste -------------------------
20 Effect of dietary fat level on fatand mineral utilization by broiler chicks ---------------------------------
Page
84
87
90
92

(xiii)
LIST OF FIGURES
Figure Page
1 Standard curve for GOT activity ------ 33
2 Standard curve for GPT activity ------- 34
3 Effect of age on hepatic GOT activity of broiler chicks fed diets containingD P W --------------------------------------- 70
4 Effect of age on hepatic GPT activity of broiler chicks fed diets containingD P W ---------------------------------------- 71

fxiv)
LIST OF APPENDICES
Appendix ' Page
1 True protein analysis in D P W ---------- 130
2 True metabolizable energy determinationin DPW and layer m a s h ------------------ 1 3 1
3 Apparent profit per broiler fed Experiment 4 diets from day oldto 54 days of a g e --------------------- . 1 3 3

1
Proteins of animal origin such as poultry meat and
eggs provide a concentrated source of readily assimilable
amino acids in suitable proportions for human needs. However,
poultry production is greatly affected by the feed costs,
which account for about 75% of the total cost of production
(Kekeocha, 1984). The high feed costs are partially
attributed to the increasing competition between man and
animals for similar feed resources. Insufficiency of feed
frequently imposes a major constraint on development of
animal production in many developing countries. This is
particularly the case during the dry season which in certain
areas may extend over nine months. The shortage and cost
of conventional food ingredients for poultry diets is forcing
producers to look for alternative raw materials. Presently
a lot of emphasis is being laid on research into the use of
agro-industrial by-products and animal wastes which do not
offer much competition as food for man and animals.
Poultry waste (excreta) contains nitrogen, calcium,
phosphorus, vitamins, and energy that are capable of being
utilized when the material is recycled by feeding (NRC,
1983). These nutrients arise from undigested feed,
metabolic excretory products and residues from microbial
synthesis. A chicken farm with 100,000 layers will
provide 12 tons of manure a day, containing about 25% dry
matter (Card and Nesheim, 1972). Hie best method of
disposal, if conditions allow, is to spread the manure on
1. INTRODUCTION

2
cropland. However, poultry waste has also drawn attention
as a feed ingredient due to its nutrient composition. Pure
poultry droppings can be collected from birds kept in cages,
wire floors, or slatted floors. After appropriate heat
treatment, poultry waste could be used as a source of nutrients
for various classes of poultry. Dried poultry waste (DPW)
as described here, refers to air and high temperature
dried droppings from laying hens. DPW remains stable for
long periods of time (Chang et al., 1974). Nonetheless,
DPW has some nutritional limitations, namely:- low
metabolizable energy content (600-1800 Kcal/kg), high ash
content (25-35 percent), high crude fibre content (10-15
percent), and 5.7-7.1 percent uric acid (Biely et al., 1980).
It is therefore necessary to balance dietary formulations
carefully when poultry waste is used, to ensure good
performance of the flock.
A limited amount of research has been done on the
nutritive value of DPW as a feed ingredient for poultry.
However, studies on collecting systems and alternative ways
of reducing dehydration costs are required. Research
aimed at improving uniformity and maintaining the nutritional
value of poultry waste is also required. Further work needs
to be done on the effect of waste recycling on the health of
the animal and on carcass quality.
The objectives of this study were:- (i) to determine
the effect of method of processing on the nutritive value and
bacteriological content of poultry waste. The processing
methods were:- (a) oven drying at 60°C, (b) sun drying

3
followed by autoclaving at 1.05 kg/cm2, 121°C for 15 minutes,
and (c) solar drying at 50-70°C; (ii) to study the effects of
graded levels of the variously dried poultry waste on broiler
performance, carcass yield, and meat composition, and
(iii) to identify any nutritional limitations in dried poultry
waste and devise ways of improving its nutritive value. In
order to fulfil the specified objectives, work reported in
section 3 was carried out.

4
2.1 Poultry population in Kenya and the need foralternative poultry feedstuffs_______________
Poultry populations in Kenya during tjie years 1974-76,
1981, and 1982 were estimated at 16, 17 and 18 million birds
respectively (FAO, 1984). According to the Ministry of
Agriculture and Livestock Development, Livestock Development
Division Annual Report (1984), the poultry population in
Kenya was estimated at 15.3 million birds, compared with
1983 population which stood at 19.6 million. The population
of broilers and layers was 2.2 million and 1.6 million,
respectively. The poultry industry was adversely affected
by the shortage of poultry feeds which came about as a result
of the drought prevalent throughout 1984, culminating in
minimum supply of cereals for inclusion in poultry rations.
Although no poultry population estimates were available for
the year 1980, a similar situation was experienced due to the
drought period during that year. Non-conventional feedstuffs
could be very useful in animal feeds during such periods
when competition between man and animals for similar feed
resources is at a climax.
Abate (1979), Ngige (1981), and Nambi (1981) studied
the nutritive values of millets, cocoyam and pigeon peas
respectively as potential ingredients in poultry feeds.
.Although considerable levels of these feedstuffs could be
safely included in poultry feeds, production levels
of these feedstuffs are not yet adequate to cater for the
needs of both man and animals. Therefore there is need to
2. LITERATURE REVIEW

5
continue searching for less competitive ingredients for
poultry. Unlike other commercial feed ingredients, poultry
waste is available on the farm. A laying hen produces 30 g
of manure per day on dry matter basis (Card and Nesheim,
1972). Therefore Kenya would expect about 17,520 tons of
dried poultry waste per year from 1.6 million layers.
2.2 Chemical composition of DPW
Dried poultry waste is variable in composition, even
on dry matter basis. The main causes of variability are
probably variation in the composition of the feed, age and
type of birds to which the diet is fed, collection interval,
environmental temperature under which the droppings are kept,
and the nature of the dehydrating process (Flegal and Zindel,
1970; Biely et al. , 1972; Kubena et al., 1973; Blair, 1974;
Biely and Stapleton, 1976; Biely et_ al., 1980; Kese and
Donkor, 1980).
2.2.1 Nitrogen content
Dried poultry waste (DPW) has a high nitrogen content,
containing about 25°& crude protein, but only half of this is
true protein, the other half being non-protein nitrogen
(NPN), Uric acid is the major non-protein nitrogenous
substance (Biely et_ al., 1980). The uric acid nitrogen in
DPW, which ranges from 30 to 60% of the NPN in DPW is not
utilized by poultry (Blair, 1972b; Martindale, 1974). DPW
from cockerels from Canada was reported to contain 7.1%
uric acid, while that from layers from United Kingdom

contained 5.7°d uric acid (Biely et al., 1980). The variation
in uric acid levels could be due to differences in quality
of feed fed to the two types of birds,- and to the dehydrating
process of poultry waste. Couch (1974) reported a uric acid
content of 6.3°a for DPW from layers. Most of the variation
in crude protein of DPW has been attributed to the NPN, as
opposed to the true protein nitrogen which is not too dissimilar
(Bhargava and O ’neil, 1975).
The true protein content of DPW is similar to that of
cereal grains such as barley. Biely et al. (1980) presented
a summary of the chemical analysis of DPW from four different
sources, namely:- Netherlands, USA, United Kingdom and
Canada. Samples from Netherlands, USA, and United Kingdom
were obtained from layers, while the sample from Canada
was obtained from cockerels. There were remarkable similarities
in the composition of all four samples, with the exception of
calcium in the sample from Canada (Stapleton and Biely, 1975),
which was obtained from four week old cockerels, the other
samples being obtained from layers. These remarkable similarities
are due to the modifying action of hindgut micro-organisms on
non-digested feed. The protein values were fairly similar
to those reported for dehydrated layer waste by Wehunt et al.
(I960),Lee and Blair 0.973), Trakulchang and Balloun (1975),
Ichhponani and Lodhi (1976), Blair and Herron (1982) and
Reddy et al. (1983).
Manoukas et al. (1964) and Sheppard et al. (1971)
showed that the total nitrogen content of DPW was inversely
related to the temperature and duration of the drying process.

7
The protein nitrogen was found to be less variable than
non-protein nitrogen. Loss of excreta nitrogen in a forced
air oven increased in a stepwise fashion from 4.6 to 10.6%
as the drying temperature was increased from 60 to 120°C
(Shannon and Brown, 1969). This is in agreement with Parker
et al. (1959) who found that 17.61 of the nitrogen in
poultry waste was lost when dried at 105°C. Blair (1972b)2
found that autoclaving poultry manure at 1.10 kg/cm for
30 minutes caused a 20% reduction in uric acid content.
Caswell et al. (1975) reported that uric acid nitrogen
in broiler litter was lowered significantly by dry heat,
alone or in combination with paraformaldehyde (PFA).
Autoclaving and PFA addition followed by dry heat lowered
the non-protein nitrogen. Ammonia nitrogen was reduced by
most of the pasteurizing treatments except autoclaving at 2
1.05 kg/cm for 10 minutes.
The amino acid levels of DPW compare well with the
amino acid levels in a cereal grain like barley (Biely
et. al., 1980). Fairly similar amino acid levels were
reported by Flegal and Zindel (1970), Couch (L974X Ichhponani
and Lodhi 0.976), El-Boushy and Vink 0.977), and Blair and Herron
0982). This confirms the observations made by Manoukas et_ al.
(1964), Sheppard et al. (1971), and Blair, (1974) that
protein nitrogen is less variable than non-protein nitrogen.
Results of the above workers showed that methionine is
the most limiting amino acid in DPW. This is expected because
cereals on which most poultry feeds are based are low in
methionine. Nonetheless DPW was reported to contain all the

8
other essential amino acids that are normally limiting in
conventional feedstuffs (El Boushy and Roodbeen, 1984). This
is due to the fact that DPW is a by-product of digestion of
compounded feeds.
2.2.2 Ash composition
The ash content of DPW from layers is high (24-35°g)
and is extremely rich in calcium (7-11°$), and phosphorus
(2-3°0 (Flegal and Zindel, 1970; Blair and Knight, 1973;
Couch, 1974; Bhattacharya and Taylor, 1975; Lee and Yang,
1975; Lee and Ling, 1977; El Boushy and Vink, 1977; Blair and
Herron, 1982). The high calcium and phosphorus levels in
DPW are due to the high content of both minerals in layer
feeds. DPW ash also contains considerable levels of
potassium, copper, iron, manganese, zinc and magnesium
(Biely et al., 1980).
2.2.3 Crude fibre content
Fibre in DPW is fairly high, with a content of 10-15°e>
(Flegal and Zindel, 1970, Blair and Knight, 1973; Couch,
1974; Bhattacharya and Taylor, 1975; Lee and Yang, 1975;
El Boushy and Vink, 1977; Blair and Herron, 1982; Reddy
et_ al., 1983). The high crude fibre levels in DPW originate
from the feed since poultry cannot digest crude fibre
(Kekeocha, 1984). However, a certain amount is necessary
in poultry feeds because:- a) crude fibre activates
peristaltic movements and enzyme production in the intestine
thereby resulting in better digestion, b) The bacteria in

9
the caecum digest cellulose and produce vitamins K and
which pass out of the intestine in the faeces. These vitamins
could be utilized by the chickens when poultry waste is
recycled through feeding.
2.2.4 Fat content
The fat content of DPW is generally low, ranging from
2-41 (Flegal and Zindel, 1970; Blair and Knight 1973; Lee and
Yang 1975; El Boushy and Vink, 1977; Blair and Herron, 1982).
The low fat content in DPW is due to the low fat level in
layer feeds.
2.2.5 Metabolizable energy content of DPW
Little information is available regarding the actual
metabolizable energy (ME) level of DPW. However, it is
safe to say that the ME values for DPW are low since the
fat content is low while the fibre, ash and uric acid
levels are relatively high. Metabolizable energy is one of
the most variable items in DPW, and a lot of energy losses
are said to occur during dehydration(Manoukas et al. , 1964;
Shannon and Brown, 1969). The ME content of DPW has been
estimated to range from 792 to 1350 kcal/kg (Pryor and
Connor, 1964; Polin et al,, 1971; Young and Nesheim, 1972;
Shannon, et al., 1973; McNab et al., 1974). However, Blair
and Lee (1973) found that the ME content of the DPW varied
from 670 to 1270 kcal/kg while Couch (1974) reported an ME
value of 660 kcal/kg. Yoshida and Oshii (1965) found that
DPW had an NE content of 1840 kcal/kg for chicks, while Blair

10
(1974) reported an ME value of 850 kcal/kg, Processed
poultry waste (PPW) previously dried in a forced air oven
and chemically extracted with potassium hydroxide to remove
uric acid was reported to have an ME content of 1225 kcal/kg
(Coon et al_., 1978). Umeda et al. (1974) reported the
available energy of DPW by chicks to be 1560 kcal/kg. Most
of this variation in metabolizable energy could probably be
due to variation in the composition of the feed and to the
nature of the dehydration process.
2.3 Effects of DPW containing diets on broilerperformance__________________ • 'v N_____
Fuller (1956) reported dried poultry manure to be as
effective as fishmeal in commercial type rations when fed
under practical conditions, while Wehunt et al. (1960)
reported improved growth rates of chicks when DPW was added
to diets suboptimal in protein. This indicates that DPW
could be an effective protein supplement in poultry diets.
Flegal and Zindel (1970) and Lee and Blair (1973) found
that broiler chicks could tolerate DPW in the diets
with only a slight effect on feed efficiency (feed:gain).
However, feed efficiency was adversely affected when the level
of DPW was increased beyond 10°&. This adverse effect was
attributed to the low metabolizable energy content of DPW,
which resulted in increased consumption of diets containing
DPW. Similar observations were made by Cenni et al. (1971),
Rinehart et al. (1973) and Sloan and Harms (1973). El Boushy
and Vink (1977) suggested that uric acid could be toxic at
levels beyond 1.07°6 in the diet. However, Mart indale and

11
Lee (1976) reported increased rates of effective renal plasma
flow and increased tubular secretion of uric acid in the hens
fed diets containing 20$ DPW for a period of one year. Renal
hypertrophy was not detected in these birds. This indicates
an increased efficiency of uric acid excretion in birds fed
diets containing DPW.
Biely and Stapleton (1976) and Blair and Herron (1982),
found that chicks fed on 10$ DPW in isocaloric and isonitrogenous
diets grew and utilized feed as well as those fed the basal
diet, McNab et al. (1972) and Bhargava and O'neil (1975)
reported that chicks fed diets containing up to 20$ DPW in
properly balanced diets performed as well as those fed a standard
broiler ration.
2.3.1 Effects of DPW containing diets oncarcass yield and quality_________
In feeding a new ingredient such as dehydrated poultry
waste, there is need to be concerned about certain possible
problems that may arise, including changes in the physiological
state of the bird, decreased growth rate, poor feed efficiency,
flavour changes in the flesh, or changes in the carcass
composition and quality (Cunningham and Lillich, 1975).
Rhee et al. (1974) reported non-significant effects of
DPW content on dressing percentage, or the composition and
organoleptic properties of broiler meat when DPW was included
up to 30$ of the diet. Similar observations were made by Lee
and Yang (1975), Bhargava and O'neil (1975), Kese and Donkor
(1980), and Reddy et al. (1983) when DPW was included up to

12
20% of the diet. However, Ogunmodede and Aninge (1978)
found that birds fed diets containing 10 or 15% DPW yielded
meat containing more fat and less water than those fed diets
containing 5% DPW. This could possibly be attributed to
a decrease in dietary protein level as the DPW content in
the diets was increased, replacing part of groundnut cake.
Cunnigham and Lillich (1975) found no detectable differences
in flavour between 0% and 38.2% DPW fed birds. They concluded
that under conditions of the study DPW had no noticeable
effects on carcass quality, but depressed growth at the
highest level.
2.4 Human and animal health aspects of feedingpoultry waste to livestock and poultry
According to Fontenot and Webb (1975), and McCaskey and
Anthony (1979), no indication has been obtained of harmful
effects in humans consuming meat, milk and eggs from
animals fed animal waste. The only documented evidence of
deleterious effects on animal health was copper toxicity in
sheep fed broiler litter containing high levels of copper
(Fontenot ejt al., 1971). This is not a serious problem with
other farm animals since they are not as sensitive to high
dietary copper.
Potential hazards from recyling animal wastes by
feeding include: pathogenic bacteria, moulds, harmful
residues of pesticides, medicinal drugs, and heavy metals
(National Research Council, NRC, 1983).

13
2.4.1 Pathogenic organisms
There is no doubt that raw material may.contain
pathogenic organisms. However, adequate processing renders
the waste free of pathogens or with a much reduced profile
of organisms capable of causing disease. No disease
problems have been reported with poultry’ wastes in
practical diets for beef cattle, dairy cattle or sheep
(Drake et al., 1965; El-Sabban et al., 1970). Even calves,
which are well known to be susceptable to digestive upsets,
remained healthy when fed diets containing wret cage layer
waste (Smith et d,, 1978). Feedlot cattle also remained
healthy when fed diets containing cage layer wraste treated
with organic acids (Smith et al., 1979), and the researchers
concluded that potential health problems were no more serious
than with conventional feeds. Moreover, under practical
conditions, poultry and cattle inoculate themselves many times
daily with all the organisms present in the faecal matter.
This may provide sufficient immunity to the animal for some
of the most common organisms present in the faecal matter
(Ichhponani and Lodhi, 1976).
Nonetheless, animal wastes commonly contain pathogenic
organisms (Caswell et al., 1975; Knight et al., 1977; Smith
et ad., 1978, 1979) and should be processed before being
fed. Alexander et al. (1968) isolated 10 species of
Clostridium two species of Corynebacterium, three species
Salmonella and two species of Mycobacteria isolates from
44 samples of poultry litter fed to livestock. All 44
samples of litter yielded species of Bacillust Staphylococcus,

14
Streptococcus t and members of the Enterobacteriaceae other
than Salmonella. These researchers, however, noted that
most of the organisms found in poultry litter were normal
inhabitants of the intestinal tract of animals.
A number of reports indicate the beneficial effects of
heat processing on microbial content of poultry waste.
McCaskey and Anthony (1979) pointed out that heat and
pelleting and other methods may minimize health hazards.
Fontenot et al. (1970) found no adverse effects in sheep
fed for 80 days on diets containing up to 75°a poultry litter
that had been sterilized by dry heat at 150°C for four hours.
Caswell e t al. (1975) evaluated several methods of processing
broiler litter, and found the following to be effective for
pasteurization:- i) dry heating at 150°C for 20 minutes;
ii) autoclaving at 121°C and 1.05 kg/cm^ pressure for 10
minutes or longer; iii) dry heating at 150°C at depths of
0.6 or 2.5 cm following addition of 1 to 4 g of paraforma
ldehyde (PFA) per 100 g of litter;- iv) ethylene oxide
(ETO) fumigation for a minimum of 30 minutes. Total bacterial
counts in broiler litter treated by the above methods were
approximately 20,000/g.
Messer ert al. (1971) found that four potential
pathogens were destroyed by heat (Salmonella typhimurium,
Salmonella pullorum, Arizona species, and E. Coli). Arizona
species were destroyed by heat at 47.2°C for 30 minutes.
S. pullorum survived the temperature but was destroyed by
heat at 62.8°C for 50 minutes. On the other hand, 62.8°C
for 60 minutes was required for the destruction of S.
typhimurium. In the case of E. Coli, 68.5°C for 30 minutes

15
was effective. Blair and Herron (1982) reported that dehy
drated broiler litter and layer waste showed low to scant
contamination with E. Coli and no Salmonella. In their
study, Hacking et al. (1977) did not detect any Salmonella
in samples of dried poultry manure; however, the researchers
found Coliform bacteria in 26% of the samples, and anaerobic
spore formers in 76% of the samples.
Under the California quality control standards for
processed waste products, the criteria for effectiveness
of pasteurization require not more than 20,000 bacteria/g
dried product, and freedom from Salmonellae (Helmer, 1980).
In assessing the risk of pathogenic organisms associated with
processed waste, it is fair to point out that regular feed
ingredients are commonly contaminated. Singh (1974) found
that all ingredients tested contained a minimum total
microbial count of 12 x 10 /g and a mould count of at least
3 x lO'Vg. Allred et al. (1967) reported that the incidence
of Salmonellae in 12,770 samples of feed and feed ingredients
was 4,2%. The incidence in animal by-products was 31.07%,
5.23% in poultry feed, 4.721 in fishmeal, 3.13% in swine
feed, 2,28% in oilseed meals, and 0.66% in grains.
Mortality among chickens fed diets containing up to
20% DPW was negligible (Biely et al., 1972; Biely, 1974;
Stapleton and Biely, 1975; Tanabe et. al., 1977). This
indicates that the inclusion of low levels of properly
dried poultry waste in poultry diets does not pose a health
hazard to the chickens. It may be concluded that the health
risks from pathogenic organisms associated with feeding of
adequately processed animal wastes are probably no greater

16
than those associated with feeding of meat meal tankage,
blood meal, poultry by-products meal, hydrolyzed poultry
feathers, offal meal, or processed paunch product, all of
which are approved for use in feed (NRC, 1983). Biely
et al. (1980) noted that information available so far
suggests that waste material can be safely and profitably
recycled, by feeding, without hazard to animal health.
2.4,2 Mineral hazards
As previously mentioned, DPW is very rich in
calcium and phosphorus, both of which are essential in
poultry diets. However, there is need to ensure proper
mineral balance in DPW containing diets in order to avoid
cases of slipped tendons (perosis) resulting from un
favourable calcium:phosphorus ratio (Biely et al., 1972)
Depending upon the source, DPW may contain some
heavy minerals which may be harmful to the animal to which
DPW is fed. The mineral content of animal wastes could
lead to at least two potential problems; toxicity, and
accumulation in tissues. Presently, there is no evidence
that heavy metal contamination is a serious deterrent
to recycling animal wastes through feeding. There is,
however, need to collect more information about the
mineral content of DPW and its effect on animal health
(NRC, 1983). Copper is usually added in trace amounts
to layer diets to meet the chickens’ requirements. The
copper content of DPIV from layers has been reported to be
less than 100 ppm (Biely et al,, 1972; Blair and Knight

17
1973; Couch, 1974). Therefore inclusion in poultry diets,
of low levels of DPW from layers is not likely to cause
copper toxicity.
Elements other than copper are probably of much less
significance in terms of likely hazards in any recycling
systems. Thomas £t al. (1972) reported that calcium,
phosphorus, sodium, potassium, magnesium, zinc, iron,
copper and manganese levels in liver and kidney of sheep fed
diets containing 0, 25 and 50$ dehydrated poultry waste were
within normal range. There is not much information regarding
the effect of DPW minerals on toxicity and accumulation in
tissues of chickens. However, work done on cattle and
sheep shows that residues do not appear to be a demonstrable
problem.
2.4.3 Medicinal drug residues and metabolites
Various drugs are used in animal production for
medicinal purposes and to improve growth and feed efficiency.
Many require a withdrawal period before slaughter to
avoid harmful residues in the carcass. However, DPW obtained
from layers contains little, if any, drug residues since
drugs are not normally included in feed formulations for
layers (Couch, 1974). Therefore the use of DPW from layers
is not likely to cause a problem of drug residues in the
carcass. Helmer (1980) reported that monitoring of
processed animal wastes in California has suggested that
drug residues have not yet posed a problem.

18
2.4.4 Mycotoxins
Mycotoxins are metabolites of fungi and are produced
by a variety of species. Many have been found in animal
feeds due to the presence of fungi. Little research has
been done on the occurrence or formation of mycotoxins in
animal wastes. Lovett (1972) suggested that poultry litter
may be no more of a problem than feed. Blair and Herron
(1982) tested dehydrated layer waste for mycotoxins, and were
unable to detect aflatoxin, ochratoxin, or zearalenone.
Hesseltine (1976) advocated the prevention of mycotoxin
formation in foods and feeds rather than detoxification
once the toxins have been formed. It would seem sensible
to apply the same principle to animal wastes. Since the
fungi do not grow on dry substrates, the wastes should be
dehydrated rapidly after collection. Rapid dehydration
would counteract the effect of Aspergillus flavus which
does not produce aflatoxins for 48 hours after spore
germination under most favourable conditions. Quick
collection and rapid efficient dehydration of poultry
waste is therefore likely to prevent aflatoxin formation.
Hamblin (1980) compiled some work on commercial processing
and selling poultry waste as a feed ingredient for livestock
and poultry, and concluded that aflatoxin, pesticides,
pathogens, and antibiotics were not a problem.
2.5 Economic value of feeding poultryexcreta to animals______________
Very little information is available on the economic
value of using dried poultry waste as a feed ingredient in

19
animal diets. Nonetheless, several workers have stressed
the need to find alternative ways of reducing dehydration
costs involved in drying poultry waste. Smith and Wheeler ■
(1979) studied the nutritional and economic value of animal
excreta and concluded that animal excreta products are three
to ten times more valuable as protein sources for various
classes of ruminant animals than as plant nutrient sources.
In both nutritional and economical terms, poultry litter
had the highest value and cattle excreta the lowest. Chicken
excreta has been reported to be superior over sheep and
cow's excreta in replacing up to 15% of maize in diets for
starter broiler and pullet replacement chicks and for
laying pullets (Oluyemi. et al., 1979).
As previously mentioned, DPW is quite variable in
composition, with variation in feed composition and method
of waste dehydration being the main factors causing
/■'variability. Therefore, it is essential to know its exact
composition in order to formulate valid balanced diets.
Dehydration costs must be considered when evaluating the
economics of using DPW in poultry diets. In the United States,
a system of dehydration has been developed by which manure
with an original moisture content of 75% can be dried to 9%
moisture automatically at a cost of less than $4 per ton
for electricity and fuel (Bressler, 1969). Young and
Nesheim (1972) found that the use of DPW in poultry diets
was economical up to $26.00 a ton. In Africa, however,
more effort should be directed towards efficient utilization
of solar energy since the sun is a relatively cheap source
of energy in the tropics.

20
3. MATERIALS AND METHODS
3.1 Source and processing of poultry waste
Poultry waste used in the experimental diets was
obtained by placing trays underneath the cages of laying
hens reared in the Poultry Unit of the Department of
Animal Production, Kabete, It was collected every three
days, spread out into 2 cm thickness and subjected to
three different methods of processing viz: a) oven drying
at 60°C (DPW1); b) sun drying followed by autoclaving
at 1.05 kg/cm^, 121°C, for 15 minutes (DPW2); c) solar
drying in a simple box type solar drier having a polythene
roof (DPW3). The hens from which the waste was collected
were fed on layer mash from the same feed company throughout
the collection period. Variations in poultry waste composition
due to diet composition were therefore minimal. The layer
mash was found to contain 90.80Vdry matter, 14.751 crude
protein, 12.03% ash, 9.84% crude ifibre, and had a true
metabolizable energy content of 3045 kcal/kg DM. The three
day collection interval and the immediate dehydration of
poultry waste were intended to reduce nutrient losses that
occur in wet manure, and to prevent mould growth. Collection
and drying of poultry waste were carried out during the dry
season, and consequently there was plenty of sunshine on
most days.
The three types of poultry waste were dried to moisture
contents below 10%. On average, poultry waste placed in the
oven took two days to dry while that placed in the sun or

21
solar drier took three to six days to dry depending upon
the environmental temperature. Temperature in the solar
drier was approximately 50-70°C on hot days. Extraneous
materials such as feathers and spilled feed were carefully
removed before milling the dried poultry waste. Milling
was done in a Wiley mill* equipped with a 2 mm sieve, prior
to mixing in the diets. Dried poultry waste was stored
in large polythene bags until the time of use.
3.2 Chemical analyses of DPW and layer mash
Moisture, ash, ether extract, crude fibre, crude
protein and nitrogen free extract contents of dried
poultry waste and of layer mash fed to layers from which
the waste was collected, were determined according to the
standard procedures of the Association of Official Analytical
Chemists (AOAC, 1984). Calcium, phosphorus, magnesium, copper,
and iron in dried poultry waste were also determined according
to the procedures of (AOAC, 1984). Calcium and phosphorus
solubility in water and in 0.4% HC1 were determined according
to the method of Watson et_ al. (1970). True protein in the
three differently dried poultry waste was determined according
to the method of Ekman et al. (1949), as described in
Appendix 1.
3.2.1 Amino acid composition of DPW
Amino acid contents of the oven dried; the sun dried
and autoclaved, and the solar dried poultry waste were
determined using a single column Biotronic amino acid analyser
*Standard model, No. 3. Wiley Mill, Made in U.S.A. Arthur H. Thomas Co. Philadelphia U.S.A.

22
LC 2000*, after hydrolysis of the samples with 6N hydrochloric
acid at 110°C for 24 hours. Results were expressed in mg/g of
the sanple.
3.3 True metabolizable energy (1ME) content of DPW and layer mash and true protein digestibility of DPW_________________________________________
True metabolizable energy contents of the poultry waste
dried in the three different ways, and of layer mash were
determined according to the method of Sibbald (1976, as
updated, Sibbald, 1981). The methodology of true metabolizable
energy determination is described in Appendix 2. TME values
determined by the Sibbald procedure are normally higher than
the apparent metabolizable energy (AME) values because TME
accounts for the endogenous and metabolic energy losses, while
AME does not.
True protein digestibility (°0 was determined in a
similar way as true metabolizable energy. Excreta from the
fed and unfed birds, together with samples of test materials
were analysed for true protein according to the method of
Ekman et al. , (1949). The method of calculation was as
follows:
TPt - (TPf - TP )True protein digestibility % = --------------- — x 100
TPj
Where: TPj = true protein intake (g).
TPf = true protein voided as excreta by the fedbird (g).
TP = true protein voided as excreta by the unfed U bird (g).
*Biotronic Wissenshaftliche Gerate Gmbh 6000 Frankafurt a.m. Borsaigalee 22.

23
3.4 Bacteriological and aflatoxin examination of DPW
Identification and counting of bacteria in the oven
dried; the sun dried autoclaved; and the solar dried types
of poultry waste were carried out by direct culture, sub
culture, and biochemical tests according to the procedures
described by Cowan (1974).
DPW samples were screened for aflatoxins using the thin
layer chromatography (TLC) method applied in Swiss Control
Laboratories (1977). Aflatoxins were extracted with
methanol/water mixtures. Lipids were separated from the
extract by shaking out with petroleum ether. The
aflatoxins were shaken out with chloroform, and the
chloroform phase was concentrated by evaporation almost
to dryness. The residue was transferred to a small flask
and the solvent was removed by nitrogen gas. A known
volume of solvent (Benzene acetonitrile) was added and a
definite amount of the sample and standard solutions were
investigated by thin layer chromatography under 365 nm
UV light.
3.5 Experiment 1
Gross protein value (GPV) as a method of assessing
quality of DPW.
3.5.1 Objective
To establish the relative nutritive values of the
oven dried; the sun dried-autoclaved; and the solar dried
types of poultry waste in comparison to casein when used as
protein supplements to a particular basal ration.

24
The method of IXickworth et al. (1961) was adopted. Day
old Shaver "Starbro" broiler type chicks obtained from a
commercial hatchery were fed on a commercial broiler starter
feed for a period of one week. Ch the seventh day, one hundred
and fifty chicks of approximately similar body weights were
selected, and were fed on a depletion diet for two weeks. The
depletion diet contained approximately 8$ protein of which 6.5$
was provided by cereals and the remainder by yeast and dried
skimmed milk. The depletion period was designed to assist in
standardizing the chicks for the experimental period. Chicks
receiving the depletion diet grew slowly, but mortality was
negligible (2.67$) and the chicks were otherwise healthy and
act ive.
On the fourteenth day, a representative sample of the chicks
was individually weighed and the mean weight determined. One
hundred and twenty chicks were selected and divided into twenty
groups of six chicks each, ensuring approximately the same
initial total body weight for each group. The chicks were placed
in electrically heated floor pens allowing a floor area of2approximately 0.10 m per chick, and wrere fed on five experimental
diets shown in Table 1. The five diets included a control or
cereal diet, which had the same composition as the depletion
diet, and four other diets which consisted essentially of the
control diet supplemented with 3$ protein from casein, the
reference protein, or from poultry’ waste, the test protein.
Diets were formulated to contain approximately 1.1$ calcium,
3.5.2 Experimental procedure

25
Table 1: Composition of diets used in Experiment 1
D i e t sDepletion Control Casein DPW1* DPW2** DPW3***
Ingredients 7 _____
Maize meal 12.30 12.30 12.30 12.30 12.30 12.30
Ground barley 17.60 17.60 17.60 17.60 17.60 17.60Ground oats 1.69 1.69 1.69 11.18 9.85 9.85Oatfeed 21.32 21.32 21.32 1.30 4.09 4.09Wheat bran 17.60 17.60 17.60 17.60 17.60 17.60Skim milk 1.46 1.46 1.46 1.46 1.46 1.46Yeast 2.25 , 2.25 2.25 2.25 2.25 2.25Salt 0.30 0.30 0.30 0.30 0.30 0.30Vitamin/mineralpremix 0.15 0.15 0.15 0.15 0.15 0.15Dicalcium phosphate 3.06 3.06 2.86 - - -Limestone 0.78 0.78 0.84 - - -Starch 21.49 21.49 17.96 2.71 4.73 5.41Casein - - 3.67 - - -DPW - - - 33.15 29.67 28.99
Chemical analyses Dry matter (DM, %) 91.69 91.69 92.52 92.33 92.32 92.27TME (Kcal/kg DM) 3310.00 3310.00 3344.00 2766.00 2619.00 2737.00
Percent of DMCrude protein 9.44 9.44 12.78 16.44 15.88 15.47True protein 8.54 8.54 11.31 11.71 11.67 11.57Ash 6.25 6.25 6.10 10.14 10.06 9.26Ether extract 2.13 2.13 1.53 2.62 2.47 2.56Crude fibre 10.50 10.50 11.15 11.32 11.21 10.99Nitrogen free extract 63.37 63.37 60.96 51.81 52.70 53.99
DPW1* is oven dried (60°C) poultry wasteDPW2** is sun dried, autoclaved (1.05 kg/cm2, 121 C, 15 minutes) poultry waste DPW3*** is solar dried (50-70°C) poultry waste^Vitamin/mineral premix provided the following per kilogram of diet: vitamin A, 10,500 IU; vitamin D^, 2250 IU; vitamin E, 1.5 IU; vitamin K, 3 mg;riboflavin, 6 mg; pantothenic acid, 7.5 mg; nicotinic acid, 12 mg; choline chloride, 150 mg; vitamin B^» 0.045 mg; iron, 25.5 mg; manganese, 60 mg; copper, 2.4 mg; cobalt, 0.3 mg; zinc, 49.5 mg; iodine, 1.2 mg; BHT, 112.5 mg.

26
0.72$ phosphorus and 10$ crude fibre. Dietary formulations
for protein in the test diets were based on the true protein
values of poultry waste. Calcium and phosphorus levels in
poultry waste that were soluble in 0.4$ hydrochloric acid were
assumed to be available to the chicks. The experiment was
conducted in a completely randomized design by random
allocation of the replicates to twenty pens. Each diet was
fed to four groups of six chicks each. Feed and water were
offered ad libitum.
3.5.3 Data collection
Records of feed consumption and body weights of chicks
per replicate were taken on the 3rd, 7th, 10th and 14th day
of the two week test period, the intermediate weighings
being designed to make possible corrections for any chicks
dying during the period. Weight gain per replicate was
calculated as the difference in body weight between two
consecutive weighings. Feed consumption was obtained from
the difference between feed offered and feed left over at
the end of every weighing. Mortality was also recorded.
Gross protein value per replicate was calculated as
follows
Gross protein value (GPV)Weight gain/g of supplementaryprotein in test diet (g)_____Weight gain/g of supplementary protein in casein diet (g)
Weight gain/g of _ Extra weight gain (g)*v ______ 100_____supplementary protein Food eaten/chick (g) $ supplemetary
protein+
'Extra weight gain = lVeight 8ain/chick of test group - weight g g gain/chick of corresponding control group

- 27 -
True protein content of test diet % supplementary protein = by analysis - true protein
content of control diet by analysis.
The gross protein value for each type of DPW was calculated as
the mean result from the four replicates used per diet.
3.5.4 Chemical analyses of experiment 1 diets
Proximate composition of the experimental diets were
determined according to the standard procedures (AOAC, 1984).
True metabolizable energy (TME) contents were determined
according to the method of Sibbald (1981).
3.5.5. Statistical analysis
Gross protein values were subjected to analysis of
variance, and means compared using Tukey’s test (Steel and
Torrie, 1980).
3.6 Experiment 2
Effects of feeding graded levels of variously dried
poultry waste on broiler chick performance.
3.6.1 Objectives
Results of the chemical analyses of DPW, and the
gross protein values obtained in Experiment 1 showed that
dried poultry waste contained some nutrients useful to
poultry. Therefore, Experiment 2 was designed to determine
effects of DPW inclusion in practical broiler starter diets
on: (a), growth rate of broilers, (b) feed intake and
conversion efficiency, (c) hepatic GOT and GPT activities,
and (d) tibia ash.

- 28
Poultry waste collected and processed as described
in 3.1 was included in broiler starter diets at levels of 5,
10, and 15$. The increasing levels of DPW replaced some
of the meat and bone meal and maize meal in the diets. Every
additional 5$ DPW replaced 1$ meat and bone meal in the diets.
This was based on the fact that the protein content of meat
and bone meal is about five times the true protein content
of DPW. The dietary protein and energy contents were within
the levels recommended for broiler starter chicks by Scott
et al. (1976). However, both energy and protein levels
decreased slightly with the increasing levels of DPW in
the diets because no attempt was made to make the diets
isocaloric or isonitrogenous.
Day old Shaver "Starbro" broiler type chicks obtained
from a comnercial hatchery were used in the experiment. They
were fed on a conmercial broiler starter feed for one day.
On the second day, two hundred and sixteen chicks of
approximately uniform weights were selected, weighed, and
randomly allocated to nine experimental diets. Each diet
was fed to four groups of six chicks each. Hie chicks were
placed in electrically heated floor pens, allowing a floor2area of approximately 0.10 m per chick, and were fed on
diets shown in Table 2 for a period of four weeks. The
experiment was conducted in a completely randomized design.
Feed and water were offered ad libitum.
3.6.2 Experimental procedure

___________________________ Table 2:____Composition of diets used in Experiment 2Type of DPW Oven dried (DPW1) Sun dried, autoclaved (DPW2) Solar dried (DPW3)Diets 1 2 3 4 5 6 7 8 9Level of DPW (%) 5 10 15 5 10 15 5 10 15
Ingredients -------------------------------------- % ------------------------------------------
Maize meal 56.55 54.55 50.55 56.55 54.55 50.55 56.55 54.55 50.55Lard 3.00 3.00 3.00 3.00 3.00 3.00 3.00 3.00 3.00Sunflower seed meal 16.00 16.00 16.00 16.00 16.00 16.00 16.00 16.00 16.00Blood meal 2.00 2.00 2.00 2.00 2.00 2.00 2.00 2.00 2.00DPW 5.00 10.00 15.00 5.00 10.00 15.00 5.00 10.00 15.00Fish meal 7.00 7.00 7.00 7.00 7.00 7.00 7.00 7.00 7.00Meat and bone meal 8.00 7.00 6.00 8.00 7.00 6.00 8.00 7.00 6.00Wheat bran 2.00 - - 2.00 — — 2.00 —Salt Vitamin/mineral premix
0.30 0.30 0.30 0.30 0.30 0.30 0.30 0.30 0.300.15 0.15 0.15 0.15 0.15 0.15 0.15 0.15 0.15
Chemical analysesDry matter (DM %) 91.32 91.29 91.47 91.16 91.12 91.12 90.79 90.95 91.40TME (Kcal/kg DM) 3939.00 3672.00 3624.00 3900.00 3896.00 3859.00 3790.00 3748.00 3524.00
Percent of DMCrude protein 25.05 23.78 23.49 24.33 24.02 23.47 24.68 24.08 23.16Ash 7.84 8.47 8.54 7.38 7.46 7.74 8.50 8.93 9.32Ether extract 7.57 7.38 7.11 7.57 7.51 7.32 7.89 7.45 7.63Crude fibre 7.73 7.80 8.20 7.34 7.53 8.81 7.54 8.03 8.53Nitrogen free extract 43.13 43.86 44.13 44.54 44.60 43.78 42.18 42.46 42.76^Vitamin/mineral provided the same levels of minerals and vitamins as given in Table 1 footnote

- 30
3.6.3 Data collection
Records of feed consumption and body weight of
chicks per replicate were taken every week until 30 days
of age. Body weight gain per week was obtained as the
difference in body weights per replicate between
consecutive weeks. Mean body weight gain per treatment
was calculated as a mean of the four replicates. Weekly
feed consumption per replicate was obtained from the
difference between feed offered and left over at the end
of every week. Mean feed consumption per treatment was
calculated as a mean of the four replicates. Feed
efficiency was calculated as a ratio of feed consumption
to body weight gain. Mortality was also recorded. Mortality
rate was calculated as the number of dead chicks expressed
as a percentage of the total number of chicks on the
experiment. GOT and GPT activities in the liver were
determined from two randomly selected chicks aged two
days, according to the method of Reitman and Frankel
(1957). This was carried out before chicks were fed on
the experimental diets. Similar enzyme determinations
were carried out from one chick per dietary treatment at
the end of the 2nd, 3rd, and 4th week of the experiment,
as described in 3.6.3.1.
The left and right tibiae were obtained from one chick
per treatment at the end of the 1st week of the experiment,
and from chicks used for liver GOT and GPT determinations
at the end of the 2nd, 3rd and 4th week of the experiment.
The tibiae were boiled in water for six minutes to remove
the flesh. They were then dried in the oven, and later

extracted in diethyl ether to remove fat. The fat free
tibiae were again dried in the oven at 105°C, cooled and
the dried weights recorded. The dried bones were ashed in
a muffle furnace at 600°C, and percentage tibia ash
determined according to the method of A 0 A C (1984).
The procedure given in 3.5.4 was followed for chemical
analyses of the diets. Data were subjected to analysis of
variance, and means compared using the f-test (Steel and Torrie
1980).
3.6.3.1 Description of GOT and GPT determinations
The enzymes GOT and GPT catalyse the transfer of
a-amino groups from specific amino acids toa-ketoglutaric
acid to yield glutamic acid and oxaloacetic- acid or
pyruvic acid as shown below:
GOTAspartic acid + orketoglutaric acid ------- oxaloaceticacid + glutamic acid
Alanine + o-ketoglutaric acid — --- pyruvic acid + glutamic acid.
In some recent books, GOT is called Aspartate aminotransferase,
while GPT is called Alanine aminotransferase. Unfortunately,
they both have the same acronym (AAT) so that the older
nomenclature with the acronyms GOT and GPT is often retained
(Ottaway and Apps, 1984). The oxaloacetic or pyruvic acid
formed in the above reactions is reacted with 2, 4 dinitro-
phenylhydrazine. The absorbance of the resultant colour of
phenylhydrazones is measured at a wavelength of 505 nm
(Reitman and Frankel, 1957).
Ihe chicks selected for liver GOT and GPT determinations
were killed by cervical dislocation. The livers were immediately
- 31 -

32
excised, blotted dry, wrapped in aluminium foils covered
with ice, and stored in a refrigerator until the time of
analysis. At the time of analysis, the liver was cut into
small pieces, after which one gram was weighed and finely
ground using a small mortar and pestle. 9 mis of 0.25 M
sucrose solution was added to the liver in the mortar
and thoroughly mixed to form a homogenate. 5 ml of the
homogenate was transferred into 5 ml tubes and centrifuged
at a relative centrifugal force of 1300 x g for 30 minutes
to obtain the supernatant. Before measurement of GOT and
GPT activities in the liver, standard curves for the two
enzymes were prepared.
The GOT standard curve was prepared as follow's: 0.2 ml
of distilled water was added to each of six test tubes. This
was followed by additions of 1.0, 0.9, 0.8, 0.7, 0.6 and
0.5 ml of aspartate a-ketoglutarate, and then 0.0, 0.1, 0.2,
0.3, 0.4 and 0.5 ml of pyruvate to each of the six tubes
respectively. 1 ml of 2, 4 dinitrophenylhydrazine was added
to each tube, mixed, and left to stand for 20 minutes at
room temperature. 10 ml of 0.4 N sodium hydroxide solution
was added to each of the tubes, mixed, and left to stand
for 5 minutes. Absorbance for each tube contents was read
on a Beckman uv Spectrophotometer set at 505 nm, using 1 cm
cuvettes. Water was used as reference. A standard curve
was plotted for Absorbance against GOT activities (SF units/
ml), and is presented in Figure 1. The GPT standard shown
in Figure 2 was similarly determined. The only variation
was alanine a-ketoglutarate being used instead of aspartate
a-ketoglutarate.

Abs
orba
nce
Figure 1: Standard curve for GOT a c t iv i t y
010 30 60 90 120 150 18 210 240GOT Activity (SF units/ml)

Abs
orba
nce
read
at
50
5 nm
j-1.9u.re_Li Standard curve for GPT a c t i v i t y

35
Enzyme determinations in the liver supernatant were
carried out within a maximum of two days after obtaining
the livers from the chicks in order to avoid activity
losses. GOT and GPT measurements were based on the
reactions mentioned above. In determining hepatic GOT
activity, 1 ml of aspartate a-ketoglutarate in a phosphate
buffer (pH 7.5) was pipetted into a test tube and incubated in
a water bath at 37°C for five minutes. 0.2 ml of the liver
supernatant was added, mixed, and incubated at 37°C for 1
hour. 1 ml of 2, 4 dinitrophenylhydrazine was added, mixed,
and left to stand for 20 minutes at room temperature. 10 ml
of 0.4 N sodium hydroxide solution was added, mixed, and
left to stand for five minutes. Absorbance was measured
under conditions identical to those used for the standard
curve. GPT was similarly determined. The only variations
were that: (i) alanine a-ketoglutarate was used instead
of aspartate a-ketoglutarate, and (ii) after addition of
the liver supernatant to the alanine a-ketoglutarate, incubation
at 37 C was done for 30 minutes. GOT and GPT activities were
derived directly from the standard curves. Results were
converted from Sigma-Frankel (SF) Units/ml to y moles/
minute/g liver by multiplying by 0.48 (Sigma Technical
Bulletin No. 505, 1982). In cases where GOT or GPT activity
exceeded the highest calibration point, the specimen was
diluted 5 fold with saline. Hie assay was then repeated
and the results multiplied by 5.

36
3.7 Experiment 3
Effects of fat supplementation to broiler diets
containing oven or solar dried poultry waste.
3.7.1 Objectives
True metabolizable energy contents of experiment 2
diets revealed that energy in the diets decreased with the
increasing levels of DPW, which necessitates supplementation
of such diets with high energy ingredients like lard. In
feeding a new ingredient such as poultry waste, it is
important to consider not only weight gain and feed
efficiency of broilers, but also their carcass composition.
Therefore Experiment 3 was designed to study the effects
of various levels of lard supplementation to broiler diets
containing 0, 5, 10, 15, and 20% oven or solar dried poultry
waste on (i) growth performance, (ii) feed intake and
conversion efficiency, (iii) dressed weight, (iv) abdominal
fat pad weight, and (v) meat composition.
3.7.2 Experimental procedure
Nine approximately isonitrogenous isocaloric broiler
starter and finisher diets were formulated to contain 0, 5,
10, 15 and 20% oven or solar dried poultry waste which were
collected and dried as described in 3.1. Various amounts
of lard were included in the diets to bring the energy to
approximately the same level in all diets (2915 Kcal AMEn/kg)
of starter diets, and 2945 Kcal AMEn/kg of finisher diets).

- 3 7
The starter and finisher diets were formulated to contain
approximately 21.60$ and 18.40$ crude protein respectively.
The composition of the diets used is shown in Tables 3
and 4.
Day old Shaver "Starbro" broiler type chicks obtained
from a commercial hatchery were fed on commercial broiler
starter feed for a period of three days. On the fourth
day, two hundred and sixteen chicks of approximately uniform
weights were selected, weighed, and randomly allocated to
nine dietary treatments. Each diet had four replicates of
six chicks each. The chicks were placed in electrically
heated floor pens, and were fed on broiler starter diets ip
to 28 days of age, and on finisher diets till 53 days of
age. The experiment was conducted in a completely randomized
design. Feed and water were offered ad-libitum.
3.7.3 Data collection
Records of body weights and feed consumption of chicks
per replicate were taken every week until 53 days of age.
Mean body weight gain, feed consumption, and feed efficiency
per treatment were determined according to the procedure
described in 3.6.3. Mortality was also recorded, and one
of the dead chicks was immediately subjected to a post
mortem examination to establish the cause of death.
At 53 days of age, one broiler of the same sex was
randomly selected from each treatment replicate and
slaughtered. Dressed weights of the slaughtered broilers
were recorded. The abdominal fat pad from each of
slaughtered broilers was carefully removed and weighed.

Table 3:____ Composition of starter diets used in Experiment 3Type of DPW Oven dried poultry waste Solar dried poultry wasteDiets 1 2 3 4 5 6 7 8 9Level of DPW (%) 0 5 10 15 20 5 10 15 20
<7to
Maize meal 64.05 58.55 51.55 44.55 36.10 57.90 50.43 42.85 33.70Lard - 1.65 3.75 5.90 8.45 2.30 4.97 7.70 10.95Sunflower seed meal 16.00 17.35 19.25 21.10 23.00 17.35 19.15 21.00 22.90DPW - 5.00 10.00 15.00 20.00 5.00 10.00 15.00 20.00Wheat bran 4.00 2.00 1.00 - - 2.00 1.00 _ —Fish meal 8.00 8.00 8.00 8.00 8.00 8.00 8.00 8.00 8.00Meat and bone meal 7.50 7.00 6.00 5.00 4.00 7.00 6.00 5.00 4.00SaltVitamin/mineral premix
0.30 0.30 0.30 0.30 0.30 0.30 0.30 0.30 0.300.15 0.15 0. 15 0. 15 0.15 0.15 0.15 0.15 0.15
Chemical analyses
Dry matter (DM %) 89.72 90.07 90.45 91.30 90.88 90.02 90.07 90.07 90.62TME (Real/kg DM) 3761.00 3630.00 3641.00 3662.00 3764.00 3589.00 3615.00 3716.00 3839.00
Percent of DM
Crude protein 24.52 24.02 24.46 23.99 23.70 24.42 23.98 24.20 24.11Ash 6.51 7.12 7.62 8.11 9.18 6.85 7.73 7.83 8.43Ether extract 6.43 7.71 9. 15 10.66 11.15 6.97 8.82 10.87 12.82Crude fibre 5.88 6.45 8.70 10.26 11.06 8.16 9.22 9.95 10.11Nitrogen free extract 46.38 44.77 40.52 38.28 35.79 43.62 40.32 37.22 35.15
Vitamin/mineral premix provided the same levels of minerals and vitamins as given in Table 1 footnote.

Table 4: Composition of finisher diets used in Experiment 3Type of DPW Oven dried poultry waste Solar dried poultry wasteDiets 1 2 3 4 5 6 7 8 9Level of DPW (%) 0 5 10 15 20 5 10 15 20
Ingredients
Maize meal 69.35 63.45 57.20 50.80 44.00 62.80 56.15 49.20 41.70Lard - 1.80 3.70 5.65 7.70 2.45 4.90 7.45 10. 15Sunflower seed meal 15.50 16.80 18.75 20.70 22.35 16.80 18.70 20.60 22.20DPW - 5.00 10.00 15.00 20.00 5.00 10.00 15.00 20.00Wheat bran 5.70 4.00 2.40 0.90 - 4.00 2.30 0.80 —Fish meal 4.00 4.00 4.00 4.00 4.00 4.00 4.00 4.00 4.00Meat and bone meal 5.00 4.50 3.50 2.50 1.50 4.50 3.50 2.50 1.50Salt Vit./mineral premix
0.30 0.30 0.30 0.30 0.30 0.30 0.30 0.30 0.300.15 0.15 0.15 0.15 0.15 0.15 0.15 0.15 0.15
Chemical analysesDry matter (DM,%) 89.90 90.08 90.90 90.85 90.44 89.64 90.87 91.02 91.54TME (Kcal/kg DM) 3707.00 3718.00 3787.00 3771.00 3678.00 3579.00 3667.00 3759.00 3769.00Percent of DMCrude protein 20.63 20.45 21.03 20.47 20.27 20.94 19.89 20.18 20.66Ash 5.11 6.26 6.46 7.47 8.14 6.17 6.42 7.10 7.68Ether extract 5. 15 5.97 7.13 10.18 12.17 7.54 9.71 10.82 13.03Crude fibre 8.29 8.24 9.08 9.54 10.57 8.53 9.11 9.57 10.09Nitrogen free extract 50.72 49.16 47.20 43.19 39.29 46.46 45.74 43.35 40.08
^Vitamin/mineral premix provided the same levels of minerals and vitamins as given in Table 1 footnote.

40
The abdominal fat that was removed and weighed was the fat
that sorrounded the gizzard and lay between the abdominal
muscles and the intestines. Thigh meat from the dressed
broilers was removed from the bones, cut into small
pieces, and thoroughly minced in a blender. Samples of
the minced meat from each broiler were then analysed for
water, crude protein, and crude fat according to the
standard procedures (AOAC, 1984). Proximate composition and
TME contents of the diets were determined as mentioned in
3.5.4. Maize meal used in the diets was screened for
aflatoxins as described in 3.4. Data were analysed
statistically as given in 3.5.5.

41
3.8 Experiment 4
Effect of dietary energy and protein levels of DPW
containing diets, on broiler performance.
3.8.1 Objective
Energy and protein sources are the most expensive
items in poultry rations and should be economically used
through formulation of the best utilizable diets. Results
of Experiment 3 showed that broiler chicks fed lard
supplemented diets containing 5, 10, and 15$ oven or solar
dried poultry waste performed as well as those fed the control
diet containing no poultry waste and no lard. However lard
is an expensive energy source and is rather difficult to
mix uniformly in feed when included at levels beyond 5-6$.
Therefore Experiment 4 was designed to identify the most
efficiently utilized energy and protein levels in diets
containing 10$ oven or solar dried poultry waste and less
than 6$ lard. The level of DPW was limited to 10$ to
avoid the use of uneconomically high levels of lard in
diets containing 15$ DPW.
3.8.2 Experimental procedure
Poultry waste collected and dried in the oven or
solar drier as described in 3.1 was included at a level of
10$ in broiler starter diets formulated to contain 2750,
2860 and 2970 Kcal. AMEn/kg, and 20.80, 21.70, and 22.50$
crude protein respectively. Finisher diets were formulated
to contain the same energy levels but with crude protein
contents of 18.20, 19.20 and 20.00$ respectively. These

42
protein and energy levels were designed to meet the
requirements of broiler chickens (Scott et al., 1976). The
compositions of the starter and finisher diets used in
Experiment 4 are presented in Tables 5 and 6 respectively.*
One hundred and fourty four day old Shaver "Starbro"
broiler chicks wrere obtained from a commercial hatchery.
The chicks were weighed and divided into twrenty four groups
of six chicks each. Four groups of six chicks were
allocated to each of the six dietary treatments. The chicks
were raised in identical electrically heated floor pens
allowing a floor area of approximately 0.10 m per chick.
The chicks were brooded for 28 days. Feed and water were
offered ad libitum throughout the experimental period of
54 days. Starter diets were fed for the first 28 days,
and finisher diets for 26 days.
3.8.3 Data collection
Weekly body weights,feed consumption, and mortality
per replicate were recorded. At the end of the experiment
at 54 days of age, one male broiler was randomly selected
from each treatment replicate and weighed individually.
The selected broilers were slaughtered and their dressed
weights were recorded. Thigh meat was carefully removed
from each of the slaughtered broilers, minced in a blender
and analysed for water, fat and protein contents as in
3.7.3. Data were analysed statistically as indicated in
3.5.5.

Table 5: Composition of starter diets used In Experiment 4Type of DPW Oven dried poultry waste Solar dried poultry wasteLevel of DPW (%) 10.00 10.00 10.00 10.00 10.00 10.00Level of energy and protein Low Medium High Low Medium HighIngredients <7
/o
Maize meal 56.50 50.40 44.50 59.00 52.90 47.00Maize gluten meal 0.70 2.05 3.40 1.00 2.35 3.70Lard 0.20 2.95 5.70 0.30 3.05 5.80Sunflower seed meal 16.20 18.20 20.00 16.10 18.10 19.90DPW 10.00 10.00 10.00 10.00 10.00 10.00Wheat bran 2.80 2.80 2.80 - - -Fish meal 8.00 8.00 8.00 8.00 8.00 8.00Meat and bone meal 5.00 5.00 5.00 5.00 5.00 5.00Salt Vitamin/mineral premix
0.30 0.30 0.30 0.30 0.30 0.300.30 0.30 0.30 0.30 0.30 0.30
Chemical analyses
Dry matter (DM, %) 92.24 92.52 92.74 91.83 92.34 92.58TME (Kcal/kg DM) 3628.00 3702.00 3824.00 3568.00 3688.00 3748.00
Percent of DM
Crude protein 22.91 23.50 23.73 22.96 23.32 23.88Ash 7.43 7.61 7.69 7.47 7.46 7.51Ether extract 7.59 9.78 12.28 9.04 10.18 12.84Crude fibre 7.14 7.53 7.68 7.44 7.57 7.79Nitrogen free extract 47.17 44.10 41.36 44.92 43.81 40.56
Vitamin/mineral premix provided the following per kilogram of diet:- vitamin A, 12,000 IU; vitamin D^> 2,400 IU; vitamin E, 9.6 IU; vitamin K, 2.4 mg; vitamin 7.2 mg; vitamin B.^, 0.012 mg; folic acid, 1.2 mg; copper, 16.8 mg nicotinic acid, 36 mg; pantothenic acid, 12 mg; cobalt, 1.2 mg; iodine, 2.4 mg; iron, 28.8 rag; manganese, 80.4 mg; zinc, 80.4 mg; selenium, 0.12 mg: BHT, 144 mg.Choline chloride was included at a rate of 0.70 g per kilogram of feed.

Table 6: Composition of finisher diets used in Experiment 4Type of DPW Level of DPW (%)Level of energy and protein
Oven idried poultry waste Solar dried poulry waste10.00Low
10.00Medium
10.00High
10.00Low
10.00Medium
10.00High
Ingredients °r . _ .. _ .../o
Maize meal 59.20 53.65 48.10 61.70 56.15 50.60Maize gluten meal 1.90 2.70 3.70 2.00 2.80 3.80Lard 0.20 2.95 5.70 0.30 3.05 5.80Sunflower seed meal 16.50 18.50 20.50 16.40 18.40 20.40DPW 10.00 10.00 10.00 10.00 10.00 10.00Wheat bran 4.34 4.34 4.14 1.74 1.74 1.54Kish meal 4.00 4.00 4.00 4.00 4.00 4.00Meat and bone meal 3.00 3.00 3.00 3.00 3.00 3.00Salt 0.30 0.30 0.30 0.30 0.30 0.30Vitamin/mineral premix 0.30 0.30 0.30 0.30 0.30 0.30Lysine HC1 0.26 0.26 0.26 0.26 0.26 0.26
Chemical analyses
Dry matter (DM, %) 89.94 90.29 90.59 90.53 90.49 90.96TME (Real/kg, DM) 3573.00 3687.00 3805.00 3494.00 3619.00 3773.00
Percent of DM
Crude protein 20.47 21.59 22.14 19.93 20.83 21.83Ash 6.45 6.49 6.59 5.99 6.38 6.23Ether extract 6.95 10.69 12.89 6.51 10.34 12.82Crude fibre 8.38 8.64 9.32 8.68 9.03 8.84Nitrogen free extract 47.69 42.88 39.65 49.42 43.91 41.24
Vitamin/mineral premix provided the same levels of minerals and vitamins as given in Table 5 footnote.

3.9 Experiment 5
Effects of dietary fat levels on performance and
mineral retention of broiler chicks.
3.9.1 Objectives
Although no statistically significant differences
in body weight gains and feed efficiency were observed
between treatment groups in Experiment 4, broilers
fed the diets with medium energy and protein levels resulted
in slightly better growth rates than the rest of the diets.
The broiler chicks fed the diets with high energy and
protein levels did not perform as well as would have been
expected. This relatively poor performance could be
attributed to interactions of dietary components. Consi
derable evidence indicate that addition of fat to poultry
diets interferes with mineral metabolism, thereby reducing
calcium retention and in some cases bone ash and calcium
contents. Experiment 5 was designed to determine the effects
of widely varying dietary levels of fat, energy, and
protein on calcium, phosphorus, magnesium and fat utilization
of broiler chicks from day old to 28 days of age,
3.9.2 Experimental procedure
Lard was included at levels of 0, 1.5, 3.0, and 12.0%
of diets containing 10% solar dried poultry waste. The diets
were formulated to have a constant nitrogen corrected
apparent metabolizable energy (Kcal/kg) to percentage crude
protein ratio (132:1). Calculated AMEn in the diets ranged
from 2635 Kcal/kg in the diet containing 0% lard to 5191
Kcal/kg in the diet containing 12.0% lard, while calculated
- 45 -

I
4 $
crude protein ranged from 19.93% to 24.139o. The diets used
in Experiment 5 are shown in Table 7. Seventy two day old
Shaver "Starbro" broiler chicks obtained from a commercial
hatchery were used in the experiment. Three replicate
groups of six chicks each were allotted to each of the four
diets. The experiment was conducted in a completely
randomized design. The chicks were placed in an electrically
heated brooder, allowing a floor area of approximately 20.10 m per chick. Feed and water were provided ad libitum
throughout the four week experimental period.
3.9.3 Data collection
Weekly body weights, feed intake, and mortality
were recorded up to 28 days of age. Mean body weight
gain, feed intake, and feed efficiency per dietary treatment
were obtained as described in 3.6.3. Total excreta per
treatment replicate was collected for a 72 hour period between
the 24th and 27th day of the experiment. Feed intake during
this period was recorded. The excreta samples were dried in
the oven at 60°C and the dry weights ;vere recorded. The
dried excreta and feed samples were finely ground in a
laboratory mill and analysed for fat, calcium, phosphorus and
magnesium, according to the standard procedures (AOAC, 1984).
Apparent nutrient retention was calculated as follows:
Wt. of nutrientApparent nutrient _ Wt. of nutrient ingested - in excretaretention (°s) u, . , „ r . . . .height of nutrient ingested
X 100
Faecal soap was determined through two stages of ether
extraction as described by Atteh and Leeson (1985). The
first extraction to remove neutral fat and fatty acids was

- 47
Table 7: Composition of diets used in experiment 5Level of DPW3*** 10.00 10.00 10.00 10.00
Level of lard (%) 0.00 1.50 3.00 12.00
Ingredients .... 7
Maize meal 56.50 51.40 52.10 33.93
Maize gluten meal - - 3.00 5.50
Lard - 1.50 3.00 12.00
Sunflower seed meal 14.80 14.50 17.96 25.90
DPW3 10.00 10.00 10.00 10.00
Wheat bran 6.10 10.00 1.30 -
Fish meal 7.00 7.00 7.00 7.00
Meat and bone meal 5.00 5.00 5.00 5.00
Vitamin/mineral premix* 0.30 0.30 0.30 0.30
Salt 0.30 0.30 0.30 0.30
Lysine HC1 - - 0.04 0.07
Chemical analyses
Dry matter (DM, %) 90.25 90.76 91.76 92.64
TME (Kcal/kg DM) 3313.00 3433.00 3645.00 3976.00
Percent of DM
Crude protein 22.17 21.99 23.32 25.52
Ash 7.40 7.44 7.75 7.34
Calcium 1.44 1.49 1.53 1.30
Phosphorus 1.04 1.04 1.04 1.01
Magnesium 0.30 0.28 0.28 0.30
Ether extract 6.66 8.46 10.00 18.71
Crude fibre 8.81 9.44 9.96 10.25
Nitrogen free extract 45.21 43.43 40.74 30.82***DPW3 is solar dried (50-70°C) poultry Vitamin/mineral premix supplied the same
waste levels of minerals and vitamins
as given in Table 5 footnote.

43
carried out according to the standard procedures (AOAC,
1984). Thimbles containing the residues of the first
extraction were placed in 25$ hydrochloric acid (specific
gravity 1.13) for two hours at room temperature. This was
done to liberate fatty acids present as soap. The thimbles
were then dried in the oven at 60°C for 24 hours, and the
process of ether extraction repeated to give an estimate of
fatty acids released from faecal soap. Samples of feed were
subjected to similar two stage ether extraction to act as
standards. At the end of the experiment at 28 days of age,
one chick was randomly selected from each treatment replicate
and killed to obtain the tibiae. Tibiae ash contents were
determined as described in 3.6.3. Data were analysed statistically
as given in 3.5.5

4. RESULTS AND DISCUSSION
4.1 Chemical composition of dried poultry waste (DPW)
The proximate, true protein, minerals, and true '
metabolizable energy contents of the oven dried, the sun
dried and autoclaved, and the solar dried types of poultry
waste are shown in Table 8. Calcium and phosphorus solubility
in water and in 0A% HC1, and the true protein digestibility
of the oven dried, the sun dried-autoclaved, and the solar
dried poultry waste are presented in the same table. The
three differently dried types of poultry waste showed
little variation in true protein and proximate composition.
However, the waste differed quite significantly in the true
metabolizable energy content and true protein digestibility.
The energy content of the oven dried poultry waste was over
twice that of the solar dried poultry waste. Differences in
energy values of the three differently dried poultry waste
confirm an earlier finding of Shannon and Brown (1969) that
the loss of energy increased with decreasing temperature
and with increasing duration of the drying process. .Although
temperatures in the forced air oven and in the solar drier
were approximately the same (60°C and 50-70°C), poultry
waste placed in the solar dried took a longer time to dry
due to inefficient air circulation and moisture accumulation
in the solar drier. Some of the starch and sugars in
the poultry waste possibly dissolved in the moisture formed
in the solar drier, and were utilized by the bacteria present

50
Table 8: Chemical composition of dried poultry waste (dry_________ matter basis)_______________
Type of dried poultry waste (DPWDPW1* DPW2** DPW3***
Dry matter, % 92.16 92.37 93.10
Ash, % 28.75 28.99 26.69
Crude protein, % 21.76 17.55 22.59
True protein 9.82 10.95 11.13
Crude fibre, % 15.95 15.29 15.56
Ether extract, % 2.94 3.85 3.06
Nitrogen free extract % 22.76 26.69 25.11
Calcium, % 7.27 7.15 7.31
Ca soluble in 0.4% HC1, % 3.91 3.57 4.19
Ca soluble in water, % 0.71 0.76 0.75
Phosphorus, % 2.65 2.50 2.42
P soluble in 0.4% HC1, % 2.12 1.84 1.94
P soluble in water, % 1.05 0.78 0.97
Magnesium, % 1.25 1.28 1.05
Copper, ppm 48.00 43.00 45.00
Iron, ppm 1200.00 1300.00 1400.00
True metabolizable energy, Kcal/kg, DM 1152.00 624.00 506.00
True protein digestibility, % 76.08 62.64 51.14
*0ven dried (60°C) poultry waste**Sun dried, autoclaved (1.05 kg/cm , 121°C, 15 minutes) poultry waste
***Solar dried (50-70°C) poultry waste

51
in the waste, thereby reducing the final energy content of
the dried product. The energy content of the oven dried
poultry waste (1152 kcal/kg) is in agreement with the
finding of Pryor and Connor (1964) who showed that chicken
faeces had metabolizable energy of approximately 30% of
the feed from which it originated (3045 kcal/kg). The
slightly higher energy value of the sun dried-autoclaved
waste in comparison to that of the solar dried poultry
waste could be attributed to a reduction in uric acid,
and an increase in available carbohydrate as a result of
the autoclaving process (Blair, 1972a, 1974).
The true protein digestibility of the oven dried
poultry waste was 24.94% higher than that of the solar
dried poultry waste. The protein digestibility value of
the solar dried poultry waste (51.14%) was fairly similar
to that reported by Yoshida and Oshii (1965) for air dried
excreta (53%). The relatively lower true protein digesti
bility of the solar dried, and the sun dried-autoclaved
poultry waste could be due to the detrimental effect of
extensive heating on protein quality. Extensive heating
can result in impairment of protein quality by the Maillard
or browning reaction (Maynard et al. , 1979). In this
reaction, free amino groups of the peptide chain react
with the aldehyde group of reducing sugars such as glucose
or lactose to yield an amino-sugar complex that is no
longer available to the animal.
The crude protein content of the oven dried; the sun
dried-autoclaved, and the solar dried poultry waste were
lower than those reported for dehydrated layer waste by

Flegal and Zindel (1970), Blair and Knight (1973), Blair
0.974); Bhargava and O'neil (1975), Ichhponani and Lodhi
(1976), El Roushy and Vink (1977), and Muller (1982). The
relatively lower crude protein contents of the three
differently dried poultry waste used in this study could
be attributed to:- i) the rather low crude protein content
(14.75$) of layer mash fed to hens from which the excreta
was collected, and (ii) the methods used in drying the
waste were slow. Total nitrogen content of dried poultry
waste was reported to be inversely related to the temperature
and duration of the drying process (Parker et al., 1959;
Sheppard et_ al., 1971).
The remarkable similarity in the true protein contents
of the three differently dried poultry waste material is
in agreement with the observation made by Manoukas et al.
(1964), Sheppard et al. (1971), Blair (1974), and
Bhargava and O'neil (1975), that protein nitrogen was less
variable than non-protein nitrogen. The true protein
contents of the oven dried; the sun dried-autoclaved; and
the solar dried poultry waste were 45.13, 62.39, and 49.27$
of the crude protein contents in the three samples,
respectively. These results are in agreement with the
findings of Biely et al. (1980) and Muller (1982) that
true protein is about 50$ of crude protein in DPW. The
non-protein nitrogen contents (crude protein - true protein)
of the oven dried, the sun dried-autoclaved; and the solar
dried poultry waste were 11.94, 6.60, and 11.46$, respectively.
The relatively lower crude protein and non-protein nitrogen
contents of the sun dried-autoclaved poultry waste confirm

53
earlier findings of Blair (1972a) and Caswell £t aL
(1975) that autoclaving causes a reduction in non-protein
nitrogen content of poultry manure.
The three differently dried poultry waste samples
contained high percentages of ash, calcium, and phosphorus.
The major and trace mineral contents of poultry manure
consist of the endogenous fraction and the fraction of
the diet which is not absorbed (Maynard et al., 1979).
The high crude fibre levels in dried poultry waste are
expected since poultry do not efficiently utilize fibre
(Fontenot £t al., 1983), although its presence in feeds
is essential to aid digestion (Kekeocha, 1984). The
high ash and crude fibre levels partly explain the low
metabolizable energy content of DPW.
Calcium solubility of the oven dried; the sun dried-
autoclaved and the solar dried poultry waste in 0.4$ HC1
(soluble calcium expressed as a percentage of total
calcium) were found to be 53.78, 49.93, and 57.32$
respectively, while phosphorus solubility of the three
poultry waste samples were 80.00, 73.60, and 80.17$
respectively. Calcium solubility of the oven dried;
the sun dried-autoclaved; and the solar dried poultry
waste in water were found to be 9.77, 10.63, and 10.26$
respectively, while phosphorus solubility of the three
poultry waste samples in water were 39.62, 31.20, and
40.08$ respectively. The relatively higher solubility
of calcium and phosphorus in 0.4$ HC1 compared to that
in water is not surprising because of the ability of

54
acids to combine with bases. These results showed that
method of drying had no significant effect on calcium
and phosphorus solubility in 0.4% HC1 or water. Loosli
(1972) observed that feed processing had little influence
on calcium availability. A positive, but inconsistent
correlation between mineral solubility in 0.4% HC1 and
availability to chicks was reported by Gillis et al.
(1948) and Watson et al. (1970). There is little
information on the availability of calcium and
phosphorus in dried poultry waste. However, Parker
et al. (1959) showed that 88% of the phosphorus is
available, while Blair (1974) and Cuca (1984) indicated
that calcium and phosphorus in dried poultry waste are
highly available for poultry. McNab ejt al. (1974)
reported that at least 45.3% of the calcium and 46.2%
of the phosphorus in dried poultry manure were digested
by laying hens. The relatively higher solubility of
phosphorus in both water and 0.4% HC1 possibly indicates
that the DPW phosphorus is more available than calcium.
The absorption of calcium and phosphorus is dependent
upon their solubility at the point of contact with the
absorbing membranes (Maynard et al., 1979).
4.1.1 .Amino acid composition of DPW
.Amino acid composition of the oven dried; the sun
dried-autoclaved; and the solar dried types of poultry waste
are presented in Table 9. The remarkable similarity in
amino acid composition of the three differently dried
poultry’ waste confirms earlier observations by Manoukas

. 55 .
Table 9: Amino acid composition of dried poultry waste
Amino acid (mg/ g) DPW1* DPW2** *** DPW3*
Alanine 9.23 7.78 10.15
Arginine 2.19 2.21 2.51
Aspartic acid 5.33 5.20 5.80
Cystine 6.98 7.43 8.26
Glutamic acid 5.96 5.78 7.64
Glycine 1.49 1.70 1.55
Histidine 1.21 1.18 1.47
Isoleucine 1.79 1.76 2.76
Leucine 2.90 2.89 3.85
Lysine 2.63 2.41 3.17
Methionine 1.26 1.06 1.68
Phenylalanine 1.83 1.77 2.52
Serine 1.84 1.99 2.14
Threonine 2.07 2.15 2.63
Tyrosine 3.33 3.34 4.12
Valine 2.39 2.38 3.28
* DPW1 is oven dried (60°C) poultry waste.** DPW2 is sun dried-autoclaved (1.05 kg/cni , 121°C, 15 minutes)
poultry waste.***DPW3 is solar dried (50-70°C) poultry waste.

56
et al. (1964), Sheppard et al. (1971), Blair (1974) and
Bhargava and O ’neil (1975) that protein nitrogen is less
variable than non-protein nitrogen. The slightly lower
amino acid levels in the oven dried poultry waste could
be attributed to a limited destruction of amino acids
during oven drying (Dale et al., 1985). The amino acid
composition of the three differently dried poultry waste
were lower than those reported by Flegal and Zindel
(1970), Blair and Knight (1973), Couch (1974), £1 Boushy
and Vink (1977), and Blair and Herron (1982). The amino
acid composition of the dried poultry waste could reflect
that of feed fed to layers from which the waste was
collected. Although the amino acid composition of layer
mash was not determined, the crude protein content of
14.75% is less than 16.0-17.10% which is reconmended for
laying hens by Blair et al. (1983).

57
Results of the direct culture determination of the
bacteriological composition of dried poultry waste are
shown in Table 10. Culture in selenite broth showed
that none of the three types of dried poultry waste was
contaminated with Salmonella spp. Further examination by
subculture and biochemical tests to classify the bacteria in
dried poultry waste revealed the presence of Staphylococcus
epidermidis, Streptococcus faecalis, and Escherichia coli
in the oven dried, the sun dried-autoclaved, and the solar
dried poultry waste. Citrobacter freundii was detected in
the oven dried and the sun dried-autoclaved samples, while
poor growths of Clostridium welchii were observed in the
sun dried-autoclaved, and the solar dried poultry waste.
These results showed that the three types of dried poultry
waste were not completely sterile. However, complete
sterility of animal feeds is almost impossible as observed
by Singh (1974) who found that all ingredients tested3
contained a minimum total microbial count of 12 x 10 /g, 33
and a mould count of at least 3 x 10 /g. The bacterial
counts in the three types of dried poultry waste showed
that method of processing had a significant effect on
the number of bacteria. The relatively smaller number
of bacteria in the sun dried autoclaved poultry waste
could be attributed to the effect of autoclaving in
destroying bacteria (Caswell et al., 1975). Solar drying
of poultry waste was not as effective as oven drying or
autoclaving, in destroying bacteria. This could be due
4.2 Bacteriological and aflatoxin composition of DPW

58
Sample type Total bacteria/g Bacteria type and number/g__________________________sample____________________________________
______ Table 10: Bacteriological composition of dried poultry waste
Oven dried at 7 760°C (DPW1) 1.44 x 10 Staphylococcus spp., 1.12 x 10
Non-lactose fermenters, 3.2x10^4Streptococcus spp., 1.12 x 10
Sun-dried and autoclaved at 1.05 k.g/cm2, for 15 min. (DPW2)
121°C, 2.64 x 10' Non-lactose fermenters, 2.56x10^ E. Coli, 8 x 10³
Solar dried at 50-70°C (DPW3) 7.28 x 10⁷
E. coli, 1.04 x 10⁷ Non-lactose fermenters, 5.2xl07 Anthracoides, 3.2 x 10^ Streptococcus spp., 7.2 x 10⁷

59
to the temperature fluctuations and poor air circulation
inside the solar drier which led to the slow drying of the
sample, and to possible multiplication of the existing
bacteria. The presence of Staphylococcus epidermidis,
Streptococcus faecalis t and Escherichia coli in each of the
three differently dried poultry waste samples showed that
oven drying at 60°C; sun drying (24-29°C) followed by
autoclaving at 1.05 kg/cm^, 121°C, for 15 minutes; or solar
drying at 50-70°C were not adequate to get rid of these
bacteria. The 2 cm thickness to which the poultry waste
was spread in drying, possibly did not allow thorough pene
tration of heat to get rid of these bacteria. Nonetheless,
most of these bacteria are normal inhabitants of the intestinal
tract of animals (Gwilym, 1957; Jawetz et al., 1972). Poor
growths of Clostridium welchii observed in the sun dried-
autoclaved, and the solar dried types of poultry waste could
be due to the inconsistent drying temperatures which probably
encouraged putrefaction. The absence of Salmonellae in the
dried poultry waste samples is not surprising because the
waste was collected from healthy hens, and if any Salmonellae
had been present in the fresh excreta, they would have been
destroyed during the drying process. Although in some cases,
the temperatures used for drying the poultry waste were less
than the 62.8°C recommended by Messer et al. (1971) for
destroying S. pullomm and S. typhimurium, the durations for
drying were much longer than 60 minutes and could adequately
destroy any Salmonellae present.
Thin layer chromatography examination of the oven dried,
the sun dried-autoclaved, and the solar dried poultry’ waste
showed no aflatoxin contamination. This is in agreement with

6 0
Hesseltine (1976) who reported that rapid dehydration
would counteract the effects of Aspergillus flavus, and
that fungi do not grow on dry substrates.
4.3 Experiment 1
4.3.1 Chemical analyses of the diets
Results of the chemical analyses of the diets
used in experiment 1 were presented in Table 1. The true
protein content of the depletion and control diet was
8.54%, while that of the test diets ranged from 11.31 to
11.71%. These values were close to those prescribed by
Heiman et al. (1939) and Duckworth et al. (1961) (8%
and 11% respectively), in the determination of gross
protein values of protein supplements. Crude fibre
contents of the diets (10.50-11.32%) were achieved
through the use of oatfeed. Diets were made nearly
isofibrous. The true metabolizable energy content of
the control diet and that of the casein diet were approxi
mately 700 kcal/kg DM higher than the energy content of
the diets containing poultry waste. This is because no
attempt was made to make the diets isocaloric. Although
Duckworth et al_. (1961) did not specify the level of
dietary metabolizable energy to be used in the gross
protein value determination, chickens can to a certain
extent adjust their feed intake to meet their energy
requirements (Scott et_ al_. , 1976) . The energy content
of the diet containing the oven dried poultry waste was
slightly higher than that of the diets containing the sun
dried-autoclaved or the solar dried poultry waste. This
is a reflection of the differences in energy content of

61
the variously dried poultry waste, since the other ingre
dients were approximately the same for the three diets.
4.3.2. Chick performance and gross protein values(GPV) of dried poultry waste______________
Mean feed consumption, and body weight gain of
chicks fed experiment 1 diets between three and five weeks
of age are presented in Table 11. The gross protein
values of the differently dried poultry waste are shown
in the same table. Chicks grew slowly due to the low
dietary protein contents (8.54% true protein in the control
diet, and 11.31-11.71% true protein in the test diets).
However, the chicks were quite healthy and active.
Mortality was 0.83%. The only chick which died at the
age of four weeks had been feeding on the diet containing
the solar dried poultry waste. The low feed intake by
chicks fed the cereal (control) diet could be due to the
high dietary energy level. The diet containing casein
gave the highest feed intake of all diets although it
had the highest metabolizable energy content. This
indicates that protein quality and quantity, being
the most limiting factors in these diets, influenced
feed intake. Low dietary protein has been reported
to increase feed intake (NRC, 1984). Body weight
gains of the chicks also showed a similar trend to that
of feed intake in that the casein diet resulted in the
highest weight gains, while the control diet gave the
lowest weight gains. The extra weight gains resulting
from the casein or the dried poultry waste containing
diets, over the control diet are due to the supplementary
protein from these sources. Although chicks fed the diet

Table 11: Average feed consumption, weight gain per chick, and gross protein values (GPV) of DPWKind of diet
Avg. true protein in diets (%)
Avg. supplementary protein in diets
(%)
Avg. body wt. at 3 weeks (g)
Avg. body weight at 5 weeks
(g)
Avg. wt. gain
(g)
Avg. wt. gain over control
(g)
Avg. feed intake
(g)
Avg. supplementary protein intake
(g)
GPV1
(%)
Cereal(control) 8.54 156±4 237±8 81 0 452±12 0 —
Cereal + case in 11.31 2.77 156±4 383±8 227 146 687±19 19 100.00
Cereal + DPW 1 * * 11.71 3. 17 152±2 323±6 171 90 648±16 21 56.88a±2.35
Cereal +DPW2** 11.67 3. 13 161±4 296±9 135 54 583±25 18 38.82 ±2.82
Cereal +DPW3*** 11.57 3.03 154±4 269±4 115 34 521±9 16 28. 16 ±3.48
Mean of four observations ± standard error of the mean* Oven dried poultry waste** Sun dried autoclaved poultry waste***Solar dried poultry waste a, bMeans within a column bearing different superscripts are significantly different (P<0.05)

63
containing casein or the differently dried poultry waste had
approximately the same supplementary protein intake, these
chicks gave different weight gains because of the differences
in protein quality of casein and dried poultry waste.
The oven dried; the sun dried-autoclaved; and the solar
dried types of poultry waste had gross protein values of
56.88, 38.82, 28.161 respectively, as compared to casein
which was given an arbitrary value of 100$. The GPV of the
oven dried poultry waste was significantly higher than that
of the sun dried-autoclaved, or the solar dried poultry waste.
The differences in GPV of the variously dried poultry waste
could be attributed to the differences in protein digestibility
values of the three samples of poultry waste. Both the GPV
and the true protein digestibility values of the three types
of poultry waste showed similar sequences. This is an indication
of a positive relationship between the protein digestibility and
the gross protein values of dried poultry waste. The oven
dried poultry waste gave the highest GPV despite its slightly
lower amino acid content compared to the sun dried-autoclaved
or the solar dried poultry waste. This suggests that the
GPV was not directly related to the amino acid content of
DPW. GPV measures the value of a protein concentrate as a
supplement to a basal ration of mixed cereals (Carpenter et al.,
1952; Duckworth et al., 1961; Yoshida, 1976). Therefore it
may be concluded that the oven dried poultry waste provided a
better protein supplement to the basal ration, than the sun
dried-autoclaved or the solar dried poultry waste. However,
DPW would not necessarily have the same GPV if a different
basal mixture was used.

64
Calculations of GPV were based on the true protein
contents of the diets. However, the role played by the non
protein nitrogen should not be disregarded. Although it is
commonly felt that non-protein nitrogen is of little
significance in the nutrition of birds, there is ample
evidence indicating that under carefully defined conditions,
non-protein nitrogen supplied in form of urea or ammonium
salts can be utilized in lieu of non-essential amino acids
(Featherston et al., 1962; McGinnis, 1967; and Blair, 1972b).
With the exception of uric acid which has been described
as useless to poultry (Bare et al., 1964; Blair, 1974;
Martindale, 1974; Biely et al., 1980 and Fontenot et al.,
1983), the rest of the non-protein nitrogen components such
as ammonium nitrogen and urea in dried poultry waste probably
provided non-essential amino acids to the chicks. McNab
et al. (1974) reported a true protein digestibility value
of 90.5°$ for total nitrogen in the sample of DPW while that
of true protein was 64.2$. From these digestibility values,
it appears that some non-protein nitrogen is apparently
absorbed.
4.4 Experiment 2
4.4.1 Chemical analyses of the diets
The results of the chemical analyses of diets used in
experiment 2 were shown in Table 2.
Crude protein, ether extract, and true metabolizable
energy contents of the diets decreased slightly as the level
of dried poultry waste were increased from 5 to 15$. This
is because the DPW was of lower protein, ether extract and
metabolizable energy contents than those of maize meal, meat

65
and bone meal and wheat bran which were partially replaced
with DPW. Crude fibre and ash contents in the diets increased
with the increasing levels of dried poultry waste, due to the
relatively high ash and crude fibre levels in DPW.
4.4.2 Broiler chick performance
The effects of feeding graded levels of the oven dried,
the sun dried-autoclaved, and the solar dried poultry waste on
broiler chick performance are shown in Table 12. No sign-
ficant differences were observed in body weight gain or feed
intake of chicks fed the different diets. At 30 days of age,
broiler chicks fed diets containing 5%, 10%, and 15% oven dried
poultry waste weighed an average of 696 g, 706 g, and 667 g,
respectively; those fed diets containing 5%, 10%, and 15% sun
dried-autoclaved poultry waste weighed 670, 660, and 659 g ,
while those fed diets containing 5%, 10%, and 15% solar dried
poultry waste weighed 696 g, 653 g and 651 g, respectively.
These body weights are within the range prescribed by NRC
(1971) which states that broiler chicks of mixed sexes should
weigh 550 to 750 g between 3.7 and 4.7 weeks of age. Mean
body weight gain of chicks decreased, while feed intake
increased with the increasing level of dried poultry waste
in the diets. As a result of this trend, feed efficiency
became poorer with the increasing level of DPW in the diets.
No significant differences were observed in feed efficiency
of chicks fed the diets containing 5% or 10% oven dried, sun
dried-autoclaved or solar dried poultry waste. However, the
mean feed efficiency of chicks fed diets containing 15% dried
poultry' waste was depressed by 9.63% and 5.29% respectively,
compared to that of chicks fed the diets containing 5% or 10%

66
Table 12: Effect of level and type of DPW on growth rate,feed intake, and feed efficiency of broiler chicks from 2 to 30 days of age_________________________
Level of DPW
Mean body weight gain (g)
MeanDPW1*
Types of DPW
DPW2** DPW3***
5% 6541 628 654 645210% 664 618 611 63115% 625 617 609 617Mean 648 621 625
Meanl feed intake _l£>_
5% 1361 1425 1439 140810% 1454 1403 1441 143315% 1431 1469 1520 1473Mean 1415 1432 1467
Mean feed efficiency (feed:gain)
5% 2.08 2.27 2.20 2.18a10% 2.19 2.27 2.36 2.27ab15% 2.29 2.38 2.50 2.39bMean 2.19a 2.31ab 2.35b
* Oven dried poultry waste** Sun dried-autoclaved poultry waste***Solar dried poultry waste
^Each value is the average of four replicate pens of six chicks each.
2Standard errors of the means were: 23 for gain; 34 for feedintake; and 0.08 for feed efficiency.
ci j bMeans for feed efficiency bearing different superscripts in a row or column are significantly different (P<0.05).

67
dried poultry waste. The mean feed efficiency of chicks fed
diets containing the solar dried poultry waste was significantly
poorer (P<0.05) than that of chicks fed diets containing the
oven dried poultry waste.
The significant decline in feed efficiency as the level
of dried poultry waste in the diets was increased beyond 10$
could be attributed to the low energy content of DPW which
caused a decrease in the dietary energy contents. Similar
observations were made by Flegal and Zindel (1970), Cenni
et al. (1971), Lee and Blair (1973), Rinehart et al.
(1973), and Sloan and Harms (1973). However, the increasing
levels of dried poultry waste in the diets also resulted
in higher ash and crude fibre contents, which could also
affect feed efficiency. The diets containing the oven dried
poultry waste gave the best overall body weight gain and
feed efficiency of chicks. This could be attributed to
the relatively higher energy level and true protein
digestibility of the oven dried poultry waste compared to
the sun dried-autoclaved or the solar dried poultry waste.
Mortality for the whole experiment was 6.94$. Giicks fed
the diets containing 5$ or 10$ oven dried poultry waste, or
15$ sun dried autoclaved poultry waste survived throughout
the experimental period. Chicks fed diets containing the
solar dried poultry waste had the highest mortality rate of
3.70$. Most of the deaths occurred during the third week
of the experiment. Although the solar dried poultry waste
gave the highest number of bacteria, it is not safe, at this
stage, to conclude that the method of drying had a direct

68
effect on mortality of chicks. The number and type of
bacteria in the solar dried poultry waste did not differ
much from that in the oven dried poultry waste, and most
of the bacteria isolated in the dried poultry waste were
believed to be normal inhabitants of the intestinal tract
(Jawetz et al., 1972). On individual diet basis, highest
mortality (2.31%) came from chicks fed the diet containing
101 sun dried-autoclaved poultry waste, even though this
type of poultry waste had the least number of bacteria.
4.4.3 Effect of level and type of DPW and age ofbroiler chicks on hepatic GOT and GPT activities
Mean hepatic GOT and GPT activities in broiler chicks
aged two days were found to be 159, and 27 \i moles/min/g
liver, respectively. Mean hepatic GOT and GPT activities
between 16 and 30 days of age of broiler chicks fed diets
containing S%, 10°&, and 15°s oven dried, sun dried-autoclaved
or solar dried poultry waste are presented in Table 13.
No significant differences were observed in mean hepatic GOT or
GPT activity of chicks fed the different diets. In all
cases, however, GOT activity was considerably higher than
GPT activity. Significant differences were observed in GOT
and GPT activities determined at different ages of chicks
(Figures 3 and 4). GOT activity at 23 days of age wras
significantly higher (P<0.05) than at 16 or 30 days of age,
while GPT activity at 30 days of age was significantly lower
(P< 0.05) than at 16 or 23 days of age. Bell and Freeman
(1971) also reported an age-dependant decrease in GPT %
activity in pullets.
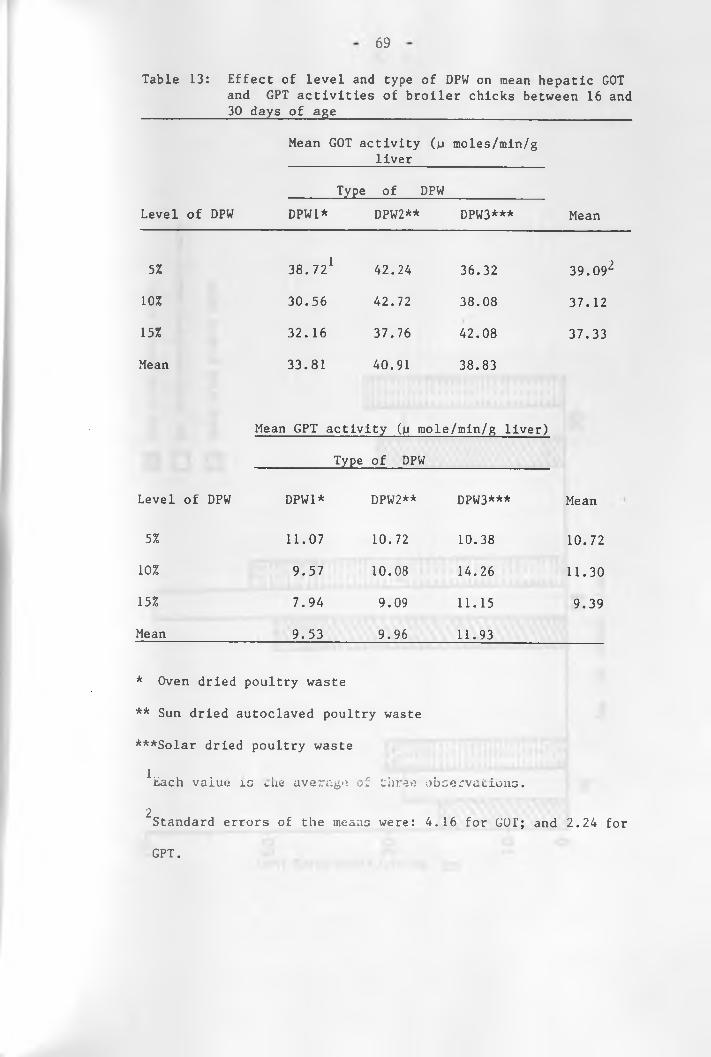
69
Table 13: Effect of level and type of DPW on mean hepatic GOTand GPT activities of broiler chicks between 16 and
__________ 30 days of age _____________________________
Mean GOT activity (p moles/rain/g liver
Type of DPWLevel of DPW DPW1* DPW2** DPW3*** Mean
5% 38.721 42.24 36.32 39.092
10% 30.56 42.72 38.08 37.12
15% 32.16 37.76 42.08 37.33
Mean 33.81 40.91 38.83
Mean GPT activity (jj mole/min/g liver)
_________ Type of PPM_______________
Level of DPW DPW1* DPW2** DPW3*** Mean
5% 11.07 10.72 10.38 10.72
10% 9.57 10.08 14.26 11.30
15% 7.94 9.09 11.15 9.39
Mean 9.53 9.96 11.93
* Oven dried poultry waste
** Sun dried autoclaved poultry waste
***Solar dried poultry waste
^Each value is lie average o 2 three observations.
^Standard errors of the means were: 4.16 for GOT; and 2.24 for
GPT.

GOT
acti
vity
p m
oles
/min
/g l
iver
Figure 3; Effect of age on hepatic GOT activity of broiler chicks fed diets containg UPW

Figure 4: Effect of age on hepatic GPT acti ity of
Age of chicks (days)
I I I
11 I I
I I I
| | 1
11 11
l~T7
I i
» 11
I 1
1 |
111
|' I
111
l|

broiler chicks fed diets containing DPW
E3 Oven dried poultry waste| Sun dried-autoclaved poultry waste
O Solar dried poultry waste

72
The lack of significant differences in mean hepatic
GOT or GPT activities of chicks fed diets containing 5%, 10%
and 15% oven dried, sun dried-autoclaved, or solar dried
poultry waste apparently suggests that the level and type of
dried poultry waste did not affect protein utilization by
chicks fed the different diets, h’irthgen et al. (1967)
reported that GPT activity decreased linearly with the
increasing biological value of the protein fed, wrhereas the
GOT enzyme showed the highest activity with high quality
protein, and decreased with proteins of poorer quality.
Nonetheless, GOT and GPT activities are sensitive measures
of protein quality because several other conditions have been
associated with changes in these enzymes. For instance,
Bell and Freeman (1971) reported that high GOT activities
may result from muscular dystrophy, while McDaniel and
Dempsey (1962) found that deprivation of fowls of water and/
or food resulted in an increase in plasma GOT activity.
Therefore these enzymes should preferably be used for
comparison purposes of the differences between similar
animals fed different diets in the same experiment rather
than attempting to draw conclusions from the absolute values
one may have obtained.
4.4.4 Tibia ash
The effect of feeding graded levels of the oven
dried, the sun dried-autoclaved, and the solar dried poultry'
waste on tibia ash content of broiler chicks between 9 and
50 days of age is presented in Table 14. No significant

73
Table 14: Effect of dietary level and type of DPW on tibiaash content of broiler chicks between 9 and 30 days of age__________________________________
Level of DPW
Mean tibia ash content (%)
Mean
Typ<2 of DPW
DPW1* DPW2** DPW3***
1 ?5% 48.03 48.44 49.72 48.73
10% 48.18 49.01 48.48 48.56
15% 50.28 48.54 51.00 49.94
Mean 48.83 48.66 49.73
* Oven dried poultry waste
** Sun dried autoclaved poultry waste
***Solar dried poultry waste
Each v«.i.ue is the average of four observations.
Standard error of the means was 1.05.2

74
differences were observed in percentage tibia ash content of
broiler chicks fed diets containing various levels of the
differently dried poultry waste. This possibly indicates
that the level and type of dried poultry waste did not
affect bone mineralization. Increases in the level of
dried poultry waste resulted in slight increases in both
calcium and phosphorus in the diets. However, the calcium:
phosphorus ratio remained within the range recommended by
Scott et al. (1976). Calculated calcium:phosphorus ratio
in the diets ranged from 1.83:1 for the diet containing 5%
oven dried poultry waste to 1.94:1 for the diet containing
15% solar dried poultry waste. Lameness among chicks on
the experiment was negligible (0.46%). The only chick that
was noted to have a lame leg at the age of two vreeks was
feeding on the diet containing 15% solar dried poultry
waste. Leg abnormality at such an early age could be due
to injury rather than dietary origin.

75
4.5 Experiment 5
4.5.1 Chemical analyses of the diets
The chemical analyses presented in Tables 3 and 4
showed that the diets containing 0% or levels of up to 20%
oven or solar dried poultry waste were approximately
isonitrogenous. This was made possible through proper
adjustments of meat and bone meal, sunflower seed meal,
and wheat bran with the increasing levels of poultry waste
in the diets. Increasing DPW resulted in increased ash
and crude fibre contents in the diets. Ether extract
content increased with the increasing levels of lard in
the diets. The true metabolizable energy values in the
starter diets ranged from 3589 to 3839 kcal/kg DM. Although
the diets were formulated to be isocaloric, this was not
achieved. The TSE values in starter diets containing 15%
or 20% solar dried poultry waste were 127-250 kcal/kg CM higher
than the diet containing 5% solar dried poultry waste. The
differences in dietary energy levels could be attributed to
the effects of diet composition on fat utilization by poultry'
(Sibbald and Kramer 1980). The differences could also be due
to the interaction of fat to make the energy of other dietary
components more available (Sibbald and Price, 1977). Several
workers (Touchbum and Naber, 1966; Jensen et al., 1970;
Horani and Sell, 1977; and 'iatecs and Sell, 1981) observed
that the generally recognized metabolizable energy values
of feed grade fat underestimates fat's tine energy contri
bution to practical rations. The true metabolizable energy
content of the diets containing the oven dried poultry
waste were more uniform than those of the diets containing

76
the solar dried poultry waste. This is probably due to the
constant drying temperature and good air circulation in the
oven which gave a more uniform product than the solar dried
waste which was affected by temperature flactuations and
poor air circulation.
4.5.2 Broiler performance
The effect of level of oven or solar dried poultry
waste on broiler performance is shown in Table 15. No
significant differences were observed in body weight gain
or feed intake of broilers fed the different diets. However,
the diets containing 20% oven or solar dried poultry waste
gave significantly poorer (P < 0.05) feed efficiencies than
the diet without poultry waste. The lack of significant
differences in broiler performance between broiler chicks
fed diets containing 0% to 15% oven or solar dried poultry
waste indicates that with proper adjustments of energy and
protein to meet the broilers’ requirements, the oven or
solar dried poultry wraste can be safely included up to
15% of broiler diets.
Feed efficiencies of chicks fed diets containing
20% oven or solar dried poultry waste were depressed by
10.29% and 9.56% respectively, compared to that of chicks
fed the diet without poultry waste. The diicks fed the
diets containing 20% oven or solar dried poultry waste
had a relatively higher feed intake compared to the rest
of the diets. Although feed intake is normally associated
with inadequate dietary energy (Farrel and Gumming, 1973;

77
Table 15: Effect of level of oven or solar dried poultry wasteon broiler performance from 4 to 53 days of age
Dietary treatment
Mean body weight gain (g)
Mean feed intake
(g)
Feedefficiency(feedrgain)
0 % DPW 1499 4078 2.72a
5% DPW1* 1457 4137 2.84ab
10% DPW1 1485 4107 2.77ab
15% DPW1 1562 4299 2.75ab
20% DPW1 1429 4291 3.00b
5% DPW3*** 1497 4266 2.85ab
10% DPW3 1493 4178 2.80ab
15% DPW3 1405 4171 2.97ab
20% DPW3 1496 4461 2.98b
SE1 39 84 0.05
*Oven dried (60°C) poultry waste
***Solar dried (50-70°C) poultry waste
Means in a column with different superscripts are significantly different (P < 0.05).
^Standard error of means.

78
Velu and Baker, 1974; NRC, 1984), H E levels revealed that
energy was not limiting in the diets containing 201 oven
or solar dried poultry waste. Therefore, the poor feed
efficiency of chickens fed the two diets was probably due
to wider calorie to protein ratios. Disproportionate
increases in energy in relation to other nutrients have
been reported to adversely affect chicken performance
(Morris, 1969). The poor feed conversion efficiency of
the diets containing the high level of dried poultry waste
could also be due to the effect of the crude fibre and
uric acid present in DPW. The starter diets containing
20% oven or solar dried poultry waste had crude fibre
contents of 11.06% and 10.11% respectively, while the diet
without poultry waste contained 5,88% crude fibre. Hie
crude fibre contents in the finisher diets also increased
with the increasing levels of DPW in the diets. Low levels
of crude fibre (3-5%) are essential in poultry diets to aid
digestion (Titus and Fritz, 1971; Kekeocha, 1984). Often
the crude fibre level of 3-5% is exceeded because most of
the common poultry feedstuffs contain considerable levels
of crude fibre. High dietary fibre levels have been reported
to cause increased feed intake and reduced weight gain of
cliickens (Moran and Evans, 1977; Bayer et al., 1978). It
has also been shown that crude fibre increases endogenous
losses of amino acids and reduces ivailability of dietary
amino acids (Parsons, 1985). Increased endogenous amino
acid losses result mainly from sloughing of intestinal
mucosal cells and elevated mucous production. Crude fibre

79
may reduce availability of dietary amino acids by forming
gels around the amino acids and by interfering with digestive
enzymes. In some cases, however, feed may contain as much
as 10-12$ crude fibre without having any markedly detrimental
effect on production (Titus and Fritz, 1971). Chickens can
tolerate higher levels of cellulose and hemicellulose fibres
than lignin.
Blair (1972b) reported that uric acid nitrogen content
in DPW ranged between 30 and 60$ of the NPN. El-Boushy and
Vink (1977) suggested that uric acid could be toxic beyond
1.071 in the diet, while Bare et al. (1964) proposed that
uric acid depresses growth by acting as an irritant and
thus interfering with the absorption of nutrients from the
intestinal tract. However, Lee and Blair (1972) reported
no growth depression when uric acid was added to diets
containing crystalline amino acids, while Martindale and
Lee (1976) reported an increased efficiency of uric acid
excretion in birds fed diets containing DPW. More research
is needed into the effect of dietary uric acid on chicken
performance.
The relatively poor feed efficiencies of chickens fed
the diets containing 201 DPW supplemented with lard could
further be explained by the interaction of fat with minerals
such as calcium, and magnesium. Such an interaction which
occurs at high levels of dietary saturated fats and calcium,
has been reported to cause decreased utilization of energy,
fat and calcium (Atteh and Leeson, 1985).
Total mortality of broiler chicks fed experiment 3
diets during the seven week experimental period was 8.801.
The occurrence of mortality did not appear to be related to
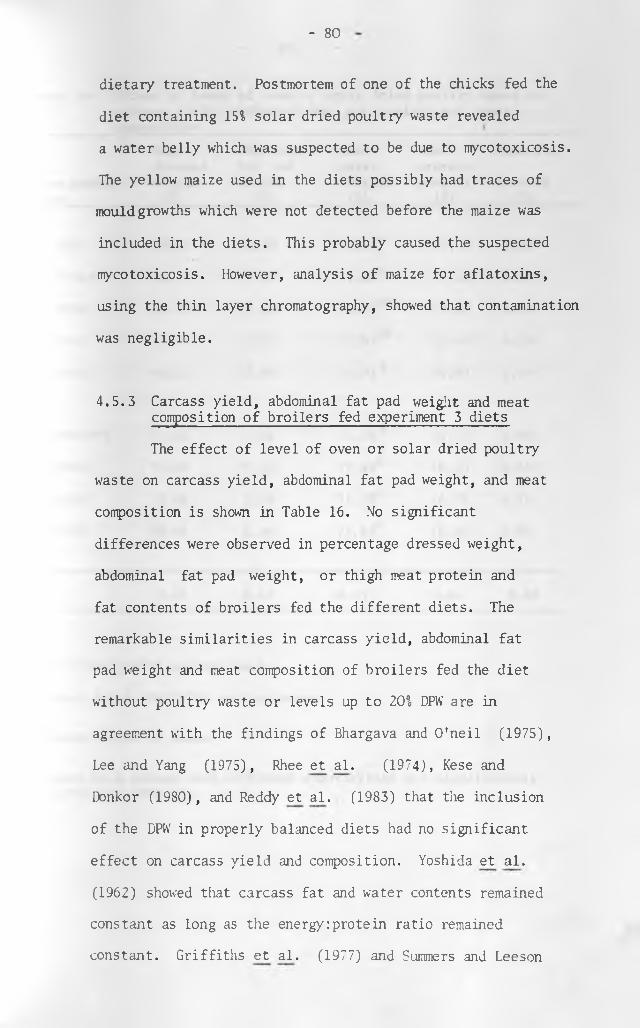
- 80
dietary treatment. Postmortem of one of the chicks fed the
diet containing 15$ solar dried poultry waste revealed
a water belly which was suspected to be due to mycotoxicosis.
The yellow maize used in the diets possibly had traces of
mould growths which were not detected before the maize was
included in the diets. This probably caused the suspected
mycotoxicosis. However, analysis of maize for aflatoxins,
using the thin layer chromatography, showed that contamination
was negligible.
4.5.3 Carcass yield, abdominal fat pad weight and meatcomposition of broilers fed experiment 3 diets
The effect of level of oven or solar dried poultry
waste on carcass yield, abdominal fat pad weight, and meat
composition is shown in Table 16. No significant
differences were observed in percentage dressed weight,
abdominal fat pad weight, or thigh meat protein and
fat contents of broilers fed the different diets. The
remarkable similarities in carcass yield, abdominal fat
pad weight and meat composition of broilers fed the diet
without poultry waste or levels up to 20$ DPW are in
agreement with the findings of Bhargava and O ’neil (1975),
Lee and Yang (1975), Rhee et al. (1974), Kese and
Donkor (1980), and Reddy et al. (1983) that the inclusion
of the DPW in properly balanced diets had no significant
effect on carcass yield and composition. Yoshida et al.
(1962) showed that carcass fat and water contents remained
constant as long as the energy:protein ratio remained
constant. Griffiths et al. (1977) and Summers and Leeson

81
Table 16: Effect of level of oven or solar dried poultry waste oncarcass yield, abdominal fat pad weight and meat composition_______________________________________
Experimentaldiets
Meandressedweight(%)
Abdominal fat pad weight
(%)
Meatwatercontent(%)
Meatproteincontent
(Z)
Meat fat
content(%)
OZ DPW 76.61 2.43 72.34a 17.23 5.80
5Z DPW1* 72.72 2.33 71.86a 17.25 5.16
10Z DPW1 70.79 2.24 72.97ah 17.23 6.35
15Z DPW1 72.74 2.29 72.91ab 16.45 6.39
20Z DPW1 68.41 2.04 75.05 b 16.87 5.14
5Z DPW3*** 71.61 2.61 71.04a 16.70 8.00
10Z DPW3 72.99 2.26 71.94a 16.55 6.60
15Z DPW3 70.90 2.39 71.70a 16.76 6.74
20Z DPW3 69.69 2.34 71.89a 16.40 5.84
SE1 2.41 0. 18 0.53 0.36 0.66
*Oven dried (60°C) poultry waste
***Solar dried (5O-70°C) poultry waste
^Standard error of means
3. b* Means in a column with different superscripts are significantly different (P<0.05).

82
(1979) reported that abdominal fat pad of broilers was not
significantly influenced by the metabolizable energy content
of the diet, but decreased with the decreasing calorie:
protein ratio. The true metabolizable energy to crude
protein ratio in the starter diets ranged from 149:1 to
159:1, while that in the finisher diets ranged from 171:1
to 184:1. These differences in calorie:protein ratio were
not large enough to affect carcass yield and meat composition.
The relatively high water content and low fat content of
broilers fed the diet containing 20% oven dried poultry waste
could probably be due to the interaction of dietary fat with
other dietary components such as calcium, which possibly reduced
fat retention by broilers. Broilers fed this diet also had
a relatively lower abdominal fat pad weight compared to the
rest of the diets.

83
4.6 Experiment 4
4.6.1 Chemical analyses of the diets
The chemical analyses presented in Tables 5 and 6
showed that the four diets were nearly similar in crude
protein, ash and crude fibre contents. The crude protein
levels were within the recommended protein requirements
for broilers (Scott et al., 1976). The ether extract
content in the starter diets ranged between 7.591 and
12.841, while that in the finisher diets ranged between
6.95$ and 12.89$ due to the various levels of lard included
in the diets to attain the required energy levels. The
true metabolizable energy contents in the diets containing
the oven dried poultry waste were slightly higher than those
of the diets containing the solar dried poultry waste.
This can be attributed to the relatively higher availability
of energy in the oven dried poultry waste in comparison to
that of the solar dried poultry waste.
4.6.2 Broiler performance
The effect on broiler performance of various dietary
levels of energy and protein in diets containing 10$ oven
or solar dried poultry waste is shown in Table 17. The
non-significant difference in growth rate, feed intake,
and feed efficiency of broilers fed the different diets
is in agreement with the observations made by Hill and
Dansky (1954), Vondell and Ringrose (1958), Bartov et al.
(1974), and Pesti (1982) that broiler performance will not
vary with different energy concentrations (provided that

34
Table 17: Effect of dietary levels of energy and protein in dietscontaining 10% DPW, on broiler performance from day old to 54 days of age_____________________________________
Dietary treatments
Mean body weight gain (g)
Mean feed intake
(g)
Mean feedefficiency(feedrgain)
10% DPW1* * (Low ME, CP) 1682 4627 2.75
10% DPW1 (Medium ME, CP) 1750 4950 2.83
10% DPW1 (High ME, CP) 1668 4764 2.86
10% DPW3*** (Low ME, CP) 1624 4638 2.86
10% DPW3 (Medium ME, CP) 1744 4816 2.76
10% DPW3 (High ME, CP) 1698 4996 2.94
SE1 60 120 0.11
*0ven dried poultry waste
***Solar dried poultry waste
^Standard error of means

85
the energy:protein ratio is kept constant), because of
the birds’ ability to adjust the weight of food eaten
to keep metabolizable energy intake reasonably constant.
The diets used in experiment 4 were not exactly in a
constant true metabolizable energy:crude protein ratio
(155:1 to 161:1 in the starter diets, and 171:1 to 175:1
in the finisher diets). However, the differences in the
calorie to protein ratio were not large enough to cause
significant changes in broiler performance. Nonetheless,
the diets containing 10% oven or solar dried poultry waste
with medium dietary levels of energy and protein (3702 or
3688 kcal TME/kg DM, 23.50% or 23.32% crude protein in the
starter diets, and 3687 or 3619 kcal T>E/kg EM, 21.59% or
20.83% crude protein in the finisher diets) gave slightly
better growth rates than the rest of the diets. The
relatively better performance of broilers fed the two diets
could possibly be due to a better balance of nutrients in
these diets. Morris (1969) indicated that when the energy
content of a poultry diet is increased, corresponding increases
in the proportion of most other nutrients should be done.
However, due to the large number of nutrients required in
poultry diets, it is not always possible to balance out
each specific nutrient in relation to energy. This causes
the minor differences observed in the performance of broilers
fed diets with a constant or approximately constant energy:
protein ratio.
Feed intake by broilers fed the diets containing
the solar dried poultry waste increased slightly with
the increasing levels of energy and protein in the diets.

86
This trend was probably caused by the reduction in bulk
density of the feed and the improvement in feed palatability
due to the various levels of lard included in the diets.
Total mortality of broilers throughout the 54 day experimental
period was 3.47%. This low mortality shows that the dietary
inclusion of 10% oven or solar dried poultry waste in broiler
diets is not detrimental to broilers.
The apparent profit obtained from feeding experiment
4 diets to broilers is shown in Appendix 3. However, the
exact net profit per broiler would be slightly less than
what is given in Appendix 3 because labour, transport, and
other minor miscellaneous costs were not included in the
calculation. From the economic point of view, the diets
with the lowest levels of energy and protein were relatively
cheaper than the rest of the diets. The increased costs in
the diets containing higher levels of energy and protein were
mainly due to the high cost of lard.
4.6.3 Carcass yield and meat composition ofbroilers fed experiment 4 diets______
The carcass yield and meat composition are shown in
Table 18. Results showed no significant differences in
dressed weight or meat composition of broilers fed the
different diets. This showed that the dietary energy and
protein levels had little influence on carcass yield and
composition of edible meat. Similar observations were
made by Summers et al. (1985). However, several earlier
workers (Fraps, 1943; Danoldson et al. , 1956; Newell et
al., 1956; Rand et al., 1957; Spring and Wilkinson, 1957;

87
Table 18: Effect of dietary levels of energy and protein indiets containing 10% DPW, on carcass yield and meat composition of broilers___________________________
Dietary treatments
Dressedweight
(%)
Meatwatercontent
(%)
Meatproteincontent
(%)
Meat fat
content(%)
10% DPW1* * (Low ME, CP) 71.11 73.20 17.97 7.51f t f t (Medium ME, CP) 71.55 72.46 18.45 8.02i i f t (High ME, CP) 72.94 71.39 18.08 7.76
10% DPW3*** (Low ME, CP) 72.59 71.52 18.41 7.86f t t i (Medium ME, CP) 72.03 71.55 17.48 7.58f t i i (High ME, CP) 75.66 73.78 17.30 7.60
SE1 1.66 0.89 0.46 0.82
* Oven dried poultry waste
***Solar dried poultry waste
^Standard error of means

88
Sibbald et al., 1961; Carew et al., 1964; Essary and
Dawson, 1965; Summers et al., 1965; Kubena et al., 1972;
Nlbugua, 1983) reported that specific changes in either
dietary protein, fat, or energy levels produced changes in
the total body composition of chickens. Therefore it
appears that variations in dietary energy and protein levels
of experiment 4 diets were probably too narrow to cause any
significant changes in carcass yield and composition.

89
4.7 Experiment 5
4.7.1 Chemical analyses of the diets
The chemical analysis presented in Table 7 showed
that the four diets were approximately similar in ash,
calcium, phosphorus, and magnesium contents. The ether
extract content in the diets ranged from 6.66$ in the diet
without lard, to 18.71$ in the diet containing 12$ lard.
Protein content in the diets ranged between 21.99 and
25.52$, while true metabolizable energy content ranged
from 3313 to 3976 kcal/kg EM. The TME:CP ratio in the
diets ranged from 149:1 to 156:1. Inspite of the wide
variation in protein content in the diets, the protein
levels were within the recommended requirements for
broiler chicks (Scott et al., 1976). Crude fibre increased
slightly with the increasing levels of sunflower seed meal
included in the diets to attain the required protein
levels. Nitrogen free extract decreased with the
increasing level of lard in the diets.
4.7.2 Effect of dietary fat level on broilerperformance___________________________
The effect on broiler performance of graded levels
of fat in diets containing 10$ solar dried poultry waste,
is shown in Table 19. The non-significant differences in
growth rate, feed intake, and feed efficiency confirms
that within a certain range of energy and protein, broiler
performance will not vary with different energy concentrations
provided that the energy:protein ratio is kept approximately

90
Table 19: Effect on broiler performance, of graded levels of__________ fat In diets containing 10% solar dried poultry waste
Dietary treatments
Mean body weight gain (g)
Mean feed intake (g)
Mean feedefficiency(feedrgain)
10% DPW3*** + 0% lard 560 1211 2.16
" +1.5% lard 558 1213 2.17
" + 3.0% lard 577 1262 2.19
" + 12.0% lard 589 1158 1.97
SE1 40 69 0.08
***Solar dried (50-70°C) poultry waste
^Standard error of means

91
constant. Nonetheless, body weight gain and feed efficiency
improved slightly with the increase in nutrient density. This
is in agreement with the observation made by Yacowitz and
Chamberlain (1954), Arscott and Santher (1958), Rand et al.
(1958), Carew et al. (1964), Schaible (1970), De Groote et
al. (1971), Waldroup et al. (1976), Griffiths et al.
(1977), Pesti (1982), and Harms (1986) that fat supplementation
improves feed efficiency. However, it is apparent that
increases in growth rate and feed efficiency obtained with
the diet containing 12% lard are not sufficient to warrant
the higher cost of the concentrated diet. Results of this
experiment also showed that solar dried poultry waste can
be used up to 10% of broiler starter diets without fat
supplementation. Total mortality throughout the four week
experimental period was 2.78%. The two chicks died during
the first week of the experiment as a result of injury in
the cage.
4.7.3 Effect of dietary fat level on fat and mineralutilization by broiler chicks_________________
The effect of dietary fat level on fat and mineral
utilization by broiler chicks is shown in Table 20. The
significant decrease in magnesium retention as the level of
lard in the diets was increased above 3% is in agreement
with Griffith et al. (1961), Sibbald and Price (1977),
and Atteh and Leeson (1985) who indicated that dietary
fat especially the saturated type interferes with mineral
retention. Other factors may exist that affect utilization
of high levels of lard supplementation to poultry diets,

Table 20: Effect of dietary fat level on fat and mineral! utilization by broiler chicksDietarytreatments
Faecal soaps 1 (%)
Fatretention
(%)
Calciumretention
(%)
Magnesiumretention
(%)
Phosphorusretention
(%)
Tibiaash(%)
Tibiacalcium
(%)
Tibiamagnesium
(%)
Tibiaphosphorus
(%)
10% DPW3 + 0% lard
38.67 66.68a 45.28 43.74a 47.92 48.55 42.54 0.82 15.06 '
10% DPW3 + 1.5% lard
A0.37• ■ * )i
71.10ab 49.20 44.67a 48.94 48.58 38.59 0.57 16.16
10% DPW3 + 3.0% lard
38.18 78.03b 51.63 41.34a 50.80 47.35 37.58 0.65 16.61
10% DPW + 12% lard
A2.95 73.36ab 41.49 28.47b 38.83 46.22 37.32 0.66 16.95
SE* 2 1.45 2.10 3.30 2.34 3.52 1.44 1 1.16 0.05 0.54
a,b Means within the same column with different superscripts are significantly different (P<0.05) ^Faecal ether extract 2 as a proportion of Extracts 1 and 2.2Standard error of means

93
but reduction in magnesium retention appears to be important.
The lack of significant differences in calcium retention
between treatment groups is in agreement with Whitehead
et al. (1972) who noted that the decrease in calcium
retention, due to addition of fat in the diets, is less
at lower dietary calcium levels than at higher levels. The
calcium, phosphorus, and magnesium contents were approximately
the same in experiment 5 diets. Therefore, it is not
surprising that no significant differences were observed
in calcium and phosphorus retention,tibia ash and mineral
content, and faecal soap contents between treatment groups.
Fat retention of the diet containing 3% lard was
significantly higher (P< 0.05) than that of the lard-free
diet. The diet containing 3% lard (10.0C& ether extract)
gave the highest fat, calcium and phosphorus retention and
the least faecal soap content of all diets used in the
experiment. There is no established optimum level of fat
inclusion in broiler diets. Edward Jr. (1969) suggested
that a level of 6-8% total fat in broiler rations gives the
most desirable overall results, while Pnnd et al. (1958)
observed that best overall performance was obtained when fat
contributed between 20 and 38% of the total metabolizable
energy’ content of the diet. Nonetheless, the utilization of
fat by poultry is affected by diet composition (Mateos and
Sell, 1980; Sibbald and Kramer, 1980; Fuller and Dale, 1982),
and by the calorie:protein ratio (Sibbald, et al., 1961;
Kubena et al., 1972; Horani and Sell, 1977; Nakhata, 1980).

94
Results of experiment 5 showed that the level of lard
included in diets containing 10$ solar dried poultry waste
should preferably be limited to 3$ in order to avoid the
reduction in magnesium retention which occurs at higher
levels of fat supplementation.

95
5. GENERAL DISCUSSION
There has been much attention drawn to the possible use
of poultry waste as one of the potential alternative
feedstuffs for livestock and poultry. This is because
of its availability, low cost, and nutritive value.
Poultry waste is generally of two types, with or
without litter material. Waste without litter
material is the one most suitable for feeding to
chickens because poultry cannot tolerate the high
crude fibre levels present in the litter material.
Dried poultry waste is variable in composition due to
the composition of the feed, age and type of birds to
which the diet is fed, collection interval, environ
mental temperature under which the droppings are kept,
and the nature of the dehydrating process (Flegal and
Zindel, 1970; Kubena et aJL. , 1973; Biely et al. , 1980;
Kese and Donkor, 1980). In this study, layer waste
was used in preference to broiler waste because it
is more uniform in composition, since laying hens
are normally fed on one type of feed, whereas broilers
are fed on starter and then finisher diets. Besides,
laying hens being older birds, are less efficient in
feed utilization than broilers.
Results of the chemical analyses of the oven dried
(60°C), the sun dried-autoclaved (1.05 kg/cm^, 121°C,
15 minutes), and the solar dried (5O-70°C) poultry
waste used in the study showed that the method of
processing had no significant effects on proximate,

96
true protein, amino acids, and mineral composition of
dried poultry waste, but had a considerable effect on
the metabolizable energy, protein digestibility, and
gross protein values of the dried waste. The oven
dried poultry waste had relatively higher metabolizable
energy, protein digestibility, and gross protein values
than the sun dried-autoclaved, or the solar dried waste.
This suggests a need to dry the fresh waste rapidly
in order to maintain the protein quality and to prevent
excessive energy losses. A lot of energy losses are
said to occur during dehydration (Manoukas et aj.. , 1964;
Shannon and Brown, 1969). Oven drying is expensive due
to the high cost of electricity. Solar energy is a
relatively cheaper source of energy in the tropics.
Therefore, a more efficient solar drier with adequate
air circulation should be devised for rapid drying of
the poultry waste.
Layer waste is rich in nitrogen (protein and non
protein) , ash, calcium, phosphorus, and crude fibre.
Nutrients in poultry waste arise from undigested feed,
endogenous and metabolic excretory products, and
residues of microbial synthesis (NRC, 1983). The
hen is only about 55% efficient in utilization of
dietary protein (Scott et a l ., 1976). Consequently,
a considerable amount of the protein nitrogen in the
waste originates from the feed. Nearly 50% of the
nitrogen in poultry waste is non-protein nitrogen.
Chickens do not efficiently utilize non-protein
nitrogen. Therefore, the true protein content of

97
dried poultry waste should be used in the formulation
of chicken diets. The high calcium content of layer
waste originates mainly from the feed since a high
level of this mineral is used in layer feeds for egg
shell formation. Calcium and phosphorus in dried
poultry waste appear to be highly available to the
chickens. This was shown by the high solubility of
the two minerals in 0.4% HC1. The solubility in 0.4%
HC1 of calcium in the differently dried poultry waste
used in this study was 49.93 - 57.32%, while that of
phosphorus was 73.60 - 80.17%. Blair (1974) and
Cuca (1984) also reported that calcium and phosphorus
in dried poultry manure were highly available to
poultry. Parker (1959) showed that 88% of the
phosphorus in dried poultry waste is available, while
McNab e_t a_l. (1974) reported that at least 45.3%
of the calcium and 46.2% of the phosphorus in dried
poultry manure were digested by laying hens. Therefore,
the contribution of the two minerals by dried poultry
waste should be considered when the waste is used as a
feed ingredient. The magnesium, copper, and iron
contents of dried poultry waste used in this study
were fairly similar to those reported by Blair (1974)
for dehydrated layer waste. The levels of the three
minerals were low, and are not likely to have any
adverse effects on the health of chickens if dried
poultry waste is used in properly balanced diets.
Fontenot et. al. (1971) reported a problem of excess
copper in sheep fed diets containing dried poultry waste.

9 8
This was due to the high copper content of the dried
poultry waste used by the researchers, and the high
sensitivity of sheep to copper toxicity. The mineral
content of animal wastes will vary with the amount
added to the diet of the host animal. Therefore, it
would be of advantage to know the chemical composition
of the feed fed to the chickens from which the waste
is collected.
Fresh poultry waste may contain pathogenic organisms
if obtained from diseased birds. However, adequate
processing renders the waste free of pathogens or with a
much reduced profile of organisms capable of causing
disease (Caswell et al., 1975). Most of the bacteria
isolated in dried poultry waste used in this study were
believed to be normal inhabitants of the chickens'
intestinal tract, and were not hazardous to the chickens
to which the waste was fed. Waste should be collected
from disease-free chickens in order to avoid the risks of disease transmission through recycling by feeding.
Feed intake records of broilers used in this study
showed that there was no problem of acceptability of
diets containing up to 20% oven or solar dried poultry
waste. Broilers fed diets containing the dried waste
looked healthy and active. Mortality was generally low
(less than 10% in each of the five feeding experiments).
No symptoms of calcium or phosphorus deficiencies were
observed in broilers fed diets containing the dried
waste. This confirms that most of the calcium and
phosphorus that were soluble in 0.4% HC1 were available

99
to the chickens. The inclusion of up to 20% dried
poultry waste in properly balanced broiler diets had
no adverse effects on carcass yield and quality. Similar
findings were reported by Bhargava and O'neil (1975), and
Reddy et al. (1983) . Carcass composition is mainly
affected by the calorie to protein ratio in the diets
(Yoshida et a_l. , 1962). Therefore, the protein and
energy sources in diets formulated to contain dried
poultry waste should be properly adjusted to obtain the
recommended calorie:protein ratio.
The low metabolizable energy content is one of the
limiting factors in the use of dried poultry waste in
chicken rations. Flegal and Zindel (1970) and Lee and
Blair (1973) showed that dietary levels of dried poultry
waste beyond 10% have an adverse effect on the growth
performance and feed efficiency of broilers. In this study,
however, the supplementation of diets containing dried
poultry waste with lard to obtain the recommended energy
levels, showed that the oven or solar dried poultry waste
could be included up to 15% of the diet without adverse
effects on broiler performance. High energy ingredients
such as lard are currently expensive. Therefore the
level of dried poultry waste to be included in broiler
diets should preferably be limited to 10% unless other
cheaper oils are found. Besides, dried poultry waste
is rather high in crude fibre and minerals, and excess
levels of these two components in the diet can be avoided
through the limitation of the level of dried poultry waste
included in broiler diets to 10%.

100
The following conclusions can be made from the results
of the study:
1. Waste obtained from laying hens at three day intervals
and dried in the oven at 60°C, or sun dried and
autoclaved at 1.05 kg/cm^, 121°C, for 15 minutes, or
solar dried at 50-70°C, does not differ significantly
in proximate, true protein, minerals and amino acid
composition, but differs quite considerably in
metabolizable energy and bacteriological contents.
Oven drying of poultry waste causes less energy losses
than sun drying and autoclaving, or solar drying.2
Autoclaving the sun dried poultry waste at 1.05 kg/cm ,
121°C for 15 minutes is more efficient in reducing the
number of bacteria than oven drying at 60°C or solar
drying at 50-70°C of the fresh waste.
2. Rapid drying of poultry waste soon after collection
prevents aflatoxin formation in the waste.
3. The oven dried poultry waste has a higher protein
digestibility and a higher gross protein value than
the sun dried-autoclaved, or the solar dried poultry
waste.
4. Dietary inclusions of up to 10% oven dried, sun dried-
autoclaved or solar dried poultry waste, to partially
replace maize meal, meat and bone meal, and wheat bran in
broiler starter diets, have no adverse effects on
broiler chick performance.
6. CONCLUSIONS

101
With proper adjustments of dietary energy and protein
to meet the recommended broiler requirements, the oven
dried and the solar dried poultry waste can be included
at levels up to 1S% of broiler starter and finisher diets
without adverse effects on growth rate, feed intake,
feed efficiency, carcass yield and meat composition of
broilers.
Use of lard to attain the required energy levels in
diets containing dried poultry waste reduces feed
dustiness, improves palatability, and results in
improved broiler performance. However, inclusion of
lard at levels beyond 31 in diets containing 101
solar dried poultry waste reduces magnesium retention
and is rather uneconomical.
Finally it can be concluded that a level of 101 oven
or solar dried poultry waste is the most appropriate
maximum level that can be included in broiler diets
without the necessity of high levels of lard to meet
the broilers’ energy requirement.

102--
More work needs to be conducted into the use of
solar energy for fast dehydration of poultry waste with
minimum nutrient losses. Work should be done on the total
elimination of the possibility of disease transmission
through waste recycling. Risks that may arise from
medicinal drug residues and metabolites, mycotoxins, and
mineral elements should be investigated further, and if
necessary, withdrawal periods to ensure freedom from
residues should be recommended. Methods should be devised
to break down uric acid to nitrogen that can be utilized by
chickens. Studies should be carried out on the improvement
of amino acids in dried poultry waste by grading it up
with micro-organisms, housefly larvae, or earth worms.
Research is needed on the availability to chickens of
mineral elements in dried poultry w aste. The overall
economic benefits of feeding poultry wastes to chickens
should be determined.
7. SCOPE FOR FURTHER WORK

103
Abate, A.N. (1979). The value of substituting finger
millet (Eleusine coracana) and bulrush millet
(Pennisetum typhoides) for maize in broiler
feeds.
M.Sc. thesis, Faculty of Agriculture, University
Nairobi.
Alexander, D.C., J.A.J. Carriere, and K .A. Mckay
(1968). Bacteriological studies of poultry
litter fed to livestock.
Can. Vet. J. 9: 127-131.
Allred, J.N., J.W. Walker, V.C. Beal, and F.W. Germaine
(1967). A survey to determine the salmonella
contamination rate in livestock and poultry
feeds.
J. Am. Vet. Med. Assoc. 151: 1857-1360.
8. REFERENCES
Arscott, G.H., and L .A. Santher (1958). Performance
data and flavour evaluation of broilers fed
diets containing varying amounts of animal fat.
Poultry Sci., _37: 844-850.
Association Q-f Of ficial Analytical Chemists (1984).
Official Methods of analysis 14th ed. AOAC,
Washington, D.C.

104
Atteh, J.0. and S. Leeson (1985). Effects of dietary
fatty acids and calcium levels on performance
and mineral metabolism of broiler chickens.
Animal Nutrition Highlights 4/85. American
Soybean Association, Madrid, Spain.
Bare, L.N., Wiseman, R.F. and Abbot, O.J. (1964).
Effects of dietary antibiotics and uric acid on
the growth of chicks.
J. Nutr., 8_3: 27-33.
Bartov, I., S. Bornstein, and B. Lipstein (1974). Effect
of calorie to protein ratio on the degree of fat
ness of broilers fed on practical diets.
Br. Poult. Sci. 1J5: 107-117./
Bayer, R.C., Hoover, W.H., and Muir, F.V. (1978).
Dietary fibre and meal feeding influence on
broiler growth and crop fermentation.
Poultry Sci. 51456-1459.
Bell, D.J., and B.M. Freeman (1971). Physiological
and Pathological findings. A. Plasma (or Serum)
Transaminases. In: Physiology and Biochemistry
of the Domestic Fowl. Vol. 2.
Academic Press, London, pp. 964.

105
Bhargava, K.K., and J.B. O'neil (1975). Evaluation of
dehydrated poultry waste from cage reared broilers
as a feed ingredient for broilers.
Poultry Sci., 1506-1511 .
Bhattacharya, A.N., and Taylor, J.C. (1975). Recycling
animal waste as a feedstuff.
J. Anim. Sci. 4_1 : 1438-1457.
Biely, J., Soong, R., Seir, L., and Pope, W.H. (1972).
Dehydrated poultry waste in poultry rations.
Poultry Sci., 51 : 1502-1511.
Biely, J. (1974). The effects of dehydrated poultry waste
in chick growing rations.
Poultry Sci., 5_3: 1902. (Abstr.).
Biely, J. and Stapleton, P. (1976). Recycled dried poultry
manure in chick starter diets.
Br. Poult. Sci. 17: 5-12.
Biely, J., Kitts, W.D., and Bulley, N.R. (1980). Dried
poultry waste as a feed ingredient.
World Anim. Rev. 3_4: 35-42 .
Blair, R. (1972a). Non-amino nitrogen in poultry nutrition.
In: Proceedings of the Sixth Nutrition Conferencefor Eeed Manufacturers. Edited by Swan, H. and D.
Lewis. University of Nottingham, pp. 128-144.

106
Blair, R. (1972b). Utilization of ammonium compounds
and certain non-essential amino acids by poultry.
World's Poultry Sci. J. _28s 189-200.
Blair, R. and D.W. Knight (1973). Feeding recycled
wastes to poultry and livestock.
Feedstuffs 4_5: 31-33.
Blair, R. and D.J.W. Lee (1973). The effects on egg
production and egg composition of adding
supplements of amino acids and/or urea or dried
autoclaved poultry manure to a low protein layer
diet.
Br. Poultry Sci. L4: 9-16.
Blair, R. (1974). Evaluation of dehydrated poultry waste
as a feed ingredient for poultry.
Federation Proceedings 3_3: 1934-1936.
Blair, R. and Kathleen, M. Herron (1982). Growth
performance of broilers fed on diets containing
processed poultry waste.
Br. Poult. Sci. 2_3 : 279-287 .
Blair, R., N.J. Daghir, H. Morimoto, V. Peter, and
T.G. Taylor (1983). International nutrition
standards for poultry. Nutrition Abstracts
and Reviews - Series B. Vol. 53, No. 11
Commonwealth Bureau of Nutrition.

- 107
Bressler, G.O. (1969) . Solving the poultry manure problem
economically through dehydration.
Poultry Sci., 4_8: 1789-1790..
Card, L.E., and M.C. Nesheim (1972). Poultry Production.
Eleventh edition. Lea and Febiger, Philadelphia. Chapter 6.
Carew, L.B. (Jr.), D.T. Hopkins, and M.C. Nesheim (1964).
Influence of amount and type of fat on metabolic
efficiency of energy utilization by the chick.
J. Nutr. 8_3_: 300-306.
Carpenter, K.J., J. Duckworth, G.M. Ellinger, and D.H.
Shrimpton (1952). The nutritional evaluation of
protein concentrates obtained from the alkali
digestion of herrings.
J. Sci. Fd. Agric. 3_: 278-288.
Caswell, L.F., J.P. Fontenot, and K.E. Webb, Jr. (1975).
Effect of processing method on pasteurization and
nitrogen components of broiler litter and on
nitrogen utilization by sheep.
J. Anim. Sci. 4_0: 750-759.
Cenni, B. Jannella, G. and Colombani, B. (1971). Poultry
litter for feeding table poultry.
Nutr. Abstrs. Rev. 41: 1823.

108
Chang, T.S., Dorn, D., and Zindel, H.C. (1974). Stability
of poultry anaphage.
Poultry Sci., 53: 2221-2224.
Coon, C.N., J.P. Nordheim, D.C. McFarland, and D.E. Gould
(1978). Nutritional quality of processed poultry
waste for broilers.
Poultry Sci. 5_7 : 1002-1007.
Couch, J.R. (1974). Evaluation of poultry manure as a
feed ingredient.
World's Poultry Sci. J. 30: 279-289.
Cowan, S.T. (1974). Cowan and Steel's manual for the
Identification of Medical Bacteria. Second Edition.
Cambridge University Press, chapters 6 and 7.
Cuca, M. (1984). Potential for better utilization of crop
residues and agro-industrial by-products by mono-
gastric animals in Central America. In: Guidelines
for research on the better utilization of crop
residues and agro-industrial by-products in animal
feeding in developing countries. Proceedings of
FAO/ILCA Expert Consultation 5-9 March 1984 ILCA
Headquaters, Addis Ababa, Ethiopia, pp. 54.

109
Cunningham, F.E., and Lillich, G.A. (1975). Influence of
feeding dehydrated poultry waste on broiler growth
and meat flavour and composition.
Poultry Sci. 5_4 : 860-865.
Dale, N.M., H.L. Fuller, and G.M. Pesti (1985). Freeze
drying versus oven drying of excreta in true
metabolizable energy, nitrogen corrected true
metabolizable energy and true amino acid availa
bility bioassays.
Poultry Sci. 6j4: 362-365.
De Groote, G., N. Reyntens, and J. Amich-Gali (1971). Fat
studies. 2. The metabolic efficiency of energy
utilization of glucose, soybean oil and different
animal fats by growing chicks.
Poultry Sci. 50: 808-819.
Donaldson, W.E., G.F. Combs, and G.L. Romoser (1956).
Studies on energy levels in poultry rations.
I. The effect of calorie to protein ratio . of
the ration on growth, nutrient utilization and
body composition of chicks.
Poultry Sci. 3_5; 1100-1105.
Drake, C.L., W.H. McClure, and J.P. Fontenot (1965).
Effects of level and kind of broiler litter for
fattening steers.
J. Anim. Sci. 2_4 : 879 (Abstr.).

110
Duckworth, A., A. Woodham, and I. McDonald (1961). The
assessment of nutritive value in protein
concentrates by the gross protein value method.
J. Sci. Food Agric., 12: 407-417.
Edwards, H.M. Jr. (1969). Factors influencing the
efficiency of energy utilization of growing
chickens with special reference to fat
utilization. In: Proceedings of the Third
Nutrition Conference for Feed Manufacturers.
Edited by H. Swan and D. Lewis. University of
Nottingham, pp. 92-101.
Ekman, P., H. Emanuelson, and A. Fransson (1949) .
Investigations concerning the digestibility of
protein in poultry. The Annals of the Royal
Agricultural College of Sweden 16_: 749-777.
El Boushy, A.R., and F.W.A. Vink (1977). The value of
dried poultry waste as a feedstuff in broiler diets.
Feedstuffs _49: 24-26.
El Boushy, A.R. and A.E. Roodbeen (1984). Amino acid
availability in dried poultry waste in comparison
with relevant feedstuffs.
Poultry Sci. 6J3: 583-585.

Ill
El-Sabban, F.F., J.W. Bratzler, T.A. Long, D.E.H. Frear
and R.F. Gentry (1970). Value of processed
poultry waste as a feed for ruminants.
J. Anim. Sci. 3_1: 107-111.
Essary, E.O., and L.E. Dawson (1965). Quality of fryer
carcasses as related to protein and fat levels
in the diet. 1. Fat deposition and moisture
pick up during chilling.
Poultry Sci. 4_4: 7-15.
Farrel, D.J., R.B. Cumming (1973). The effects of dietary
energy concentration on growth rate and conversion
of energy to weight gain in broiler chickens.
Poultry Sci. _14: 329-340.
Featherston, W.R., Bird, R.H., and Harper, A.E. (1962).
Effectiveness of urea and ammonium nitrogen for
the synthesis of dispensable amino acids by the
chick. J. Nutr. ]_S: 198-206.
Flegal, C.J. and Zindel, H.C. (1970). The utilization of
poultry waste as a feedstuff for growing chicks.
Research report No. 117, pp. 21-28. East Lansing,
Michigan State Agricultural Experiment Station.
Fontenot, J.P., R.E. Tucker, B.W. Harmon, K.G. Libke,
and W.E. Moore (1970). Effect of feeding different
levels of broiler litter to sheep.
J. Anim. Sci. 30: 319 (Abstr.).

112
Fontenot, J.P.,
(1971) .
litter.
K.E. Webb, Jr., K.G. Libke, and J.R. Bueler
Performance and health of ewes fed broiler
J. Anim. Sci. 33: 283 (Abstr.).
Fontenot, J.P., and K.E. Webb (1975). Health aspects of
recycling animal wastes by feeding.
J. Anim. Sci. 40: 1267-1277.
Fontenot, J.P., L.W. Smith, and A.L. Sutton (1983).
Alternative utilization of animal wastes.
J. Anim. Sci. 5_7: 221-233.
Food and Agricultural Organization of the United Nations
Rome (1984). FAO statistics series No. 55 pp. 222.
Fraps, G.S. (1943). Relation of the protein, fat andenergy of the rations to the composition of chickens.
Poultry Sci. 2_2 : 421-424 .
Fuller, H.L. (1956). The value of poultry by-products
as sources of protein and unidentified growth
factors in broiler rations.
Poultry Sci., 2_2 : 421-424 .
Fuller, H.L., and Dale, N.M. (1982). Effect of ratio
of basal diet fat to test fat on the true metabo
lizable energy of the test diet.
Poultry Sci. 6_1: 914-918.

113
Gillis,M.B., L.C. Norris, and G.F. Heuser (1948). The
utilization by the chick of phosphorus from
different sources.
J. Nutr. 35.: 195.-207.
Griffith, F.D., R.B. Grainger, and J.J. Begin (1961). The
effect of dietary fat and cellulose on apparent
calcium digestibility in growing chickens.
Poultry Sci. _40: 1492-1497.
Griffiths, L.S., S. Leeson, and J.D. Summers (1977)./
Influence of energy system and level of various
fat sources on performance and carcass composition
of broilers. Poultry Sci., 5j6: 1018-1026.
Gwilym, 0. Davies (1957). Gaiger and Davis Veterinary
Pathology and Bacteriology. Bailliere Tindall
and Cox. 7 and 8 Henrietta Street, Covent Garden,
W.C. Chapter X.
Hacking, A., M.T. Dervish, and W.R. Rosser (1977).
Available amino acid content and microbiological
condition of dried poultry manure.
Br. Poult. Sci. 443-448 .
Hamblin, D.C. (1980). Commercially processing and selling
poultry waste as a feed ingredient.
J. Anim. Sci. 50: 342-344.

- 114
Harms, R.H. (1986). Benefits of added fat in poultry diets
examined. Feedstuffs, USA 5_8: 22-24.
Heiman, V. , J.S. Carver, and J.W. Cook. (1939). A method
for determining the gross value of protein concen
trates. Poultry Sci., 1Q_: 464-474.
Helmer, J.W. (1980). Monitoring the quality and safety
of processed animal waste products sold commercially
as feed. J. Anim. Sci. _50: 349-355.
Hesseltine, C.W. (1976) . Conditions leading to mycotoxin
contamination of foods and feeds. p. 1-22
In: Mycotoxins and other Fungal Related Food
Problems. J.W. Rodricks, ed. Adv. Chem. Ser. 149
Washington, D.C. American Chemical Society.
Hill, F.W. and Dansky, L.M.* (1954) . Studies on energy
requirements of chickens. 1. The effect of dietary
energy level on growth and feed consumption.
Poultry Sci. 3_3: 112-119.
Horani, F., and Sell, J.L. (1977). The modifying effect
of calorie:protein ratio on laying hen performance
and on the extra metabolic effect of added fat.
Poultry Sci. 5j6 : 1981-1988 .
115
Ichhponani, J.S. and G.N. Lodhi (1976). Recycling of
animal wastes as feed. A review.
Indian J. Anim. Sci. 4_6 : 234-243.
Jawetz, E., J.L. Melnick, and E.A. Adelbergy (1972).
Medical Microbiology. Lange Medical Publications
Los Altos, California. Chapter 3.
Jensen, L.S., G.W. Schumaier, and J.D. Latshaw (1970).
"Extra Caloric" effect of dietary fat for developing
turkeys as influenced by calorie-protein ratio.
Poultry Sci., 49: 1697-1704.
Kekeocha, C.C. (1984) . Poultry Production Handbook.
Published by Pfizer Corporation, Nairobi, in
association with MacMillan Publishers London
and Basingstoke. Chapters 1 and 6.
Kese, A.G. and Donkor, A. (1980). Evaluation of methods
of processing poultry waste and their effect on
broiler performance.
Poultry Sci. 5_9: 1627 (Abstr.).
Knight, E.F., T .A. McCaskey, W.B. Anthony and J.L.
Walters (1977) . Microbial population changes
and fermentation characteristics of ensiled
bovine manure blended rations.
J. Dairy Sci., ^0: 416-423.

116
Kubena, R.F., B.D. Lott, J.W. Deaton, F.N. Reece, and J.D.
May (1972). Body composition of chicks as
influenced by environmental temperature and
selected dietary factors. Poultry Sci.5^: 517-522.
Kubena, R.F., Reece, F.N. , and May, J.D. (1973). Nutritive
properties of broiler excreta as influenced by
environmental temperature, collection interval, age
of broilers and diet. Poultry. Sci. j 2: 1700-1703.
Lee, D.J.W., and R. Blair (1972). Effects on chick growth
of adding various non-protein nitrogen sources or
dried autoclaved poultry manure to diets containing
crystalline essential amino acids.
Br. Poult. Sci. 1_3: 243-249.
Lee, D.J.W., and R. Blair (1973). Growth of broilers fed on
diets containing dried poultry manure.
Br. Poult. Sci. Ij4: 379-388.
Lee, P.K., and Yang, Y.F. (1975). Sun dried chicken droppings
as a feed for broilers.J. Taiwan Livestock Research Sz 27-41.
Lee, P.K., and Ling, S.S. (1977). Study on digestibility
of sun dried chicken manure by chicks.
J. Taiwan Livestock Research JJ): 87-103.
Loosli, J.K. (1972). Effect of processing on the availability and nutritional value of calcium, phosphorus,
and magnesium supplements. In: Effect of proce
ssing on the nutritional value of feeds. Proceedings
of a symposium Gainesville, Florida, Jan. 11-13,
1972 pp. 91-108.

117
Lovett, J. (1972). Toxigenic fungi from poultry feed
and litter. Poultry Sci. 5_1 : 309-313 .
Manoukas, A.G., N.F. Colovos, and H .A. Davis (1964).
Losses of energy and nitrogen in drying excreta
of hens. Poultry Sci. 4_3: 547-549.
Martindale, L. (1974). The fate of recycled urate in
hens fed on a diet containing dried poultry manure.
Br. Poult. Sci. _1(>: 389-393.
Martindale, L., and D.J.W. Lee (1976). Renal function
changes in laying hens fed on dried poultry
manure. Br . Poult. Sci. 17; 195-197.
Mateos, G.G., and J.L. Sell (1980). True and apparent
metabolizable energy value of fat for laying hens.
Influence of level of use.
Poultry Sci. 5_9: 369-373.
Mateos, G.G., and Sell, J.L. (1981). Metabolizable energy
of supplemental fat as related to dietary fat level
and methods of estimation.
Poultry Sci. 6j): 1509-1515.
Maynard, L.A., J.K. Loosli, H.F. Hintz, and R.G. Warner
(1979). Animal Nutrition. Seventh edition.
Tata McGraw-Hill Publishing Company Limited
New Delhi. Chapters 8 and 10.

113
Mbugua, P.N. (1983). Effect of feed restriction on
production performance, lipogenesis, and protein
utilization in replacement pullets (Gallus
Domesticus). Ph.D. Thesis, Cornell University.
McCaskey, T.A., and W.B. Anthony (1979). Human and animal
health aspects of feeding livestock excreta.
J. Anim. Sci. ^8: 163-177.
McDaniel, L.S., and H.A. Dempsey (1962). The effects of
fasting upon plasma enzyme levels in chickens.
Poultry Sci. _4_1 : 994-998.
McGinnis, J. (1967). Relationship of dietary amino acids
to the other nutrient components of poultry diets.In: Protein utilization by poultry. Edited by
R.A. Morton and E.C. Amoroso. Oliver and Boyd Ltd.
Publishers, Edinburgh and London pp. 167-173.
McNab, J.M., Lee, D.J.W., and Shannon, D.W.F. (1972). The
growth of broiler chickens fed low protein diets
containing triammonium, citrate, diammonium hydrogen citrate, and autoclaved dried poultry manure.
Br. Poult. Sci. 357-364 .
McNab, J.M., Shannon, D.W.F., and Blair, R. (1974). The
nutritive value of a sample of dried poultry
manure for the laying hen.
Br. Poult. Sci. 15: 159-166.

119
Messer, J.W., J. Lovett, K. Gopala, Murthy, A., J. Wehby,
M.L. Schafer, and R.B. Read, Jr. (1971). An
assessment of some public health problems
resulting from feeding poultry litter to animals.
Microbiological and chemical parameters.
Poultry Sci., _50: 874-881.
Ministry of Agriculture and Livestock Development, Livestock
Development Division Annual Report (1984). Republic
of Kenya.
Moran, E.T. Jr., and Evans, E. (1977). Performance and
nutrient utilization by laying hens fed practical
rations having extremes in fibre content.
Can. J. Anim. Sci. 57: 433-438.
Morris, T.R. (1969). Nutrient density and the laying hen .
In: Proceedings of the Third Nutrition Conference
for Feef Manufacturers. Edited by H. Swan and
D. Lewis. University of Nottingham, pp. 103-114.
Muller, Z.O. (1982). Poultry manure. In: Feed from
Animal Wastes - Feeding Manual. FAO Animal
Production and Health Paper. Food and Agricul
tural Organization of the United Nations, Rome
1982 pp. 11.

120
Nakhata, N. (1980). Mathematical equations describing
chick performance and carcass composition as a
function of diet, protein and energy levels.
Dessertation Abstracts. International, B
40: 2918.
Nambi, J. (1981). Studies on the nutritive evaluation
of pigeon peas (Cajanus cajan) as a protein
supplement in broiler starter feeds. M.Sc.
Thesis, Faculty of Agriculture, University of
Nairobi.
National Research Council (1971). Nutrient requirements
of poultry. National Academy of Sciences,
Washington D.C.
National Research Council (1983) . Animal wastes. In:
Underutilized resources as animal feedstuffs.
Committee on Animal Nutrition. Board of Agriculture.
National Academic Press, Washington D.C. pp. 121-177
National Research Council (1984) . Nutrient requirements of
poultry. • Eighth revised edition. Subcommittee on
Poultry Nutrition. Committee on Animal Nutrition.
Board of Agriculture National Academy Press
Washington, D.C. 1984.
t

121
Newell, G.W., J.L. Fry, and R.H. Thayer (1956). The
effect of fat in the ration on fat deposition in
broilers. Poultry Sci. 35: 1162-1163.
Ngige, R.W. (1981). The feeding value of cocoyam (Colocasia
esculenta) meal as a substitute for traditional
energy sources in broiler diets and estimation
of its metabolizable energy value.
M.Sc. Thesis. Faculty of Agriculture, University
of Nairobi.
Ogunmodede, B.K., and A.J. Aninge (1978). Utilization of
dried poultry manure by growing chickens fed on a
practical diet.
Br. Poult. Sci. 19_: 137-141.
Oluyemi, J.A., Biodune Longe and R. Esubi (1979). Replacing
corn with sun dried manure of laying pullet,
mature pig, sheep or cow.
Poultry Sci. 5_8: 852-857.
Ottaway, J.H. and D.K. Apps (1984). Biochemistry. Fourth
edition. Published by Bailliere, Tindall, East
Sussex, Great Britain, pp. 125-129.
Parker, M.B., H.F. Perkins, and H.L. Fuller, (1959). Nitrogen
phosphorus, and potassium content of poultry manure
and some factors influencing its composition.
Poultry Sci. 3_8 : 1154-1158.

122 -
Parsons, C.M. (1985). Amino acid availability in poultry
feeds. In: An International Magazine on Poultry
Vol. 1, No. 6 . October, 1985, pp. 20-21.
Published by Misset International - Elsevier - NDU
Group. Amsterdam.
Pesti, G.M. (1982) . Characterization of the response of
male broiler chickens to diets of various protein
and energy contents.
Br. Poult. Sci. 2_3: 527-537.
Polin, D. , S. Varghese, M. Neff, M. Gomez, C.J. Flegal,
and H.C. Zindel (1971). The metabolizable energy
value of dried poultry waste.
Res. Rep. Mich. St. Univ. Agric. Exp. Stn.
152: 1154-1158.
Pryor, W.J., and J.K. Connor (1964). A note on the
utilization by chickens of energy from faeces.
Poultry Sci. 4_3: 833-834 .
Rand, N.T., F.A. Kummerow, and H.M. Scott (1957). The
relationship of dietary protein, fat, and energy
on the amount, composition, and origin of chick
carcass fat. Poultry Sci. 3_6.: 1151-»1152.
Rand, N.T., H.M. Scott, and F.A. Kummerow (1958). Dietary
fat in the nutrition of the growing chick.
Poultry Sci. 31_: 1075-1085.

123
Reddy, P.V.S., C.V. Reddy, V. Ravindra Reddy and N.V.
Ramana Rao (1983). Utilization of dried poultry
manure in broiler diets.
Indian J. Poult. Sci. 179-185.
Reitman, S. and Frankel, S. (1957). A colorimetric method
for the determination of serum glutamic oxaloacetic
and glutamic pyruvic transaminase.
Am. J. Clin. Pathol. 2Q_: 56-63.
Rhee, Y.C., Kim, C.I., and Hong, B.J. (1974). Study on
the nutritive value of dehydrated poultry waste in
poultry rations.Korean Journal of Animal Science 336-343.
Rinehart, K.E., D.C. Snetsinger, W.W. Ragland, and R.A.
Zimmerman (1973). Feeding value of dehydrated
poultry waste. Poultry Sci. 5_2: 2078 (Abstr.).
Schaible, P.J., (1970). Fats. In: Poultry: Feeds and
Nutrition. The Avi Publishing Company, Inc.
Westport, Connecticut. Chapter 18.
Scott, M.L., Nesheim, M.C., and Young, R.J. (1976).
Nutrition of the chicken. M.L. Scott and
Associates Publishers, Ithaca, New York. Chapter 9.
Shannon, D.W.F., and W.O. Brown (1969). Losses of energy
and nitrogen on drying poultry excreta.
Poultry Sci. _£8: 41-43.

124
Shannon, D.W.F., Blair, R., and Lee, D.J.W. (1973). Chemical
and bacteriological composition and metabolizable
energy value of eight samples of dried poultry waste
produced in the United Kingdom. Proc. 4th Eur. Poult.
Conf., London, England, pp 487-494.
Sheppard, C.C., Flegal, C.J., Dorn, D., and Dale, J.L. (1971).
The relationship of drying temperature to crude
protein in dried poultry waste. Res. Rep. Mich. St.
Univ. Agric. Exp. Stn. 151; 12-16.
Sibbald, I.R., S.J. Slinger, and G.C. Ashton (1961). Factors
affecting the metabolizable energy content of poultry
feeds. Poultry Sci., 4_0: 303-313.
Sibbald, I.R. (1976). A bioassay for true metabolizable energy
in feedingstuf f s . Poultry Sci. 5j>: 303-308.
Sibbald, I.R. (1977). A test of the additivity of true meta
bolizable energy value of feedingstuffs.
Poultry Sci. 5_6 : 363-366.
Sibbald, I.R., and K. Price (1977). The effects of level of
dietary inclusion and of calcium on the true metabo
lizable energy values of fats.
Poultry Sci. 5_6 : 2070-2078.
Sibbald, I.R., and J.K.G. Kramer (1980). The effect of the
basal diet on the utilization of fat as a source of
true metabolizable energy, lipid and fatty acids.
Poultry Sci. 5_9 : 316-324 .
Sibbald, I.R. (1981). Bioassays based on precision feeding
of poultry. Animal Research Centre Technical
Bulletin No. 3. Ottawa, Ontario, Canada.

125
Sigma
Singh
Sloan
Smith
Smith
Smith
Technical Bulletin No. 505 (1982). The quantitative
colorimetric determination of glutamic oxaloacetic
and glutamic pyruvic transaminases at 490-520 nm
in serum, plasma or cerebrospinal fluid.
Sigma Chemical Company, Saint Louis, Missouri, USA.
S.P. (1974). Microbiology of common feed ingredients
used by the poultry industry.
Feedstuffs _4<5 : 30-33.
D.R., and Harms, R.H. (1973). The effect of
incorporating hen manure into the diet of young
chicks.
Poultry Sci. 5_2: 803-805.
O.B., G.K. Macleod, D.N. Mowat, C.A. Fox, and
E.T. Moran, Jr. (1978). Performance and health of
calves fed wet caged layer excreta as a protein
supplement. J. Anim. Sci. _£7: 833-842.
O.B., G.K. Macleod, D.N. Mowat, and E.T. Moran, Jr.
(1979). Effect of feeding organic acid treated hen
excreta upon performance, carcass merit, and health
of feedlot cattle. J. Anim. Sci. 4_9 : 1183-1189 .
L.W., and W.E. Wheeler (1979). Nutritional and
economic value of animal excreta.
J. Anim. Sci. 48: 144-156,

126
Spring, J.L., and W.S. Wilkinson (1957). The influence of
dietary protein and energy level on body composition
of broilers. Poultry Sci. 3j>: 1159 (Abstr) .
Stapleton, P. and Biely, J. (1975) . Utilization of dried
poultry waste in chick starter rations.
Can J. Anim. Sci. 55: 595-607.
Steel, R.G.D., and Torrie, J.H. (1980). Principles and
Procedures of Statistics with Special Reference
to Biological Sciences. A Biometrical Approach
McGraw-Hill, Kogakusha, Ltd. Chapter 7 and 8.
Summers, J.D., S.J. Slinger, and G.C. Ashton (1965). The
effect of dietary energy and protein on carcass
composition with a note on a method for estimating
carcass composition. Poultry Sci. _4: 501-509.
Summers, J.D. and S. Leeson (1979). Composition of poultry
meat as affected by nutritional factors.
Poultry Sci. 5_8: 536-542.
Summers, J.D., S. Leeson, M. Bedford, and Diane Spratt
(1985). Influence of dietary protein and energy
on performance and carcass composition of heavy
turkeys. Poultry Sci. 6_4 : 1921-1933.

127
Tanabe, Y. , Nakamura, T., Tanaka, K., Kamiyoshi, M., and
Tanabe, H. (1977). Utilization of dried poultry
waste (DPW) as a feedstuff of domestic animals.
2. Feeding DPW to white Leghorn pullets.
Japanese Poultry Sci. 14; 45-51.
Thomas, J.W., Y.Yu, P. Tinnimit, and H.C. Zindel, (1972).
Dehydrated poultry waste as feed for milking cows
and growing sheep. J. Dairy Sci. 5j>: 1261-1265.
Titus, H.W., and Fritz, J.C. (1971). The Scientific
Feeding of chickens. Fifth edition. The Interstate
Printers and Publishers. Inc. Dancille, Illinois. Chapter 3.
Touchburn, S.P. and E.C. Naber (1966). The energy value
of fats for growing turkeys.
Proc. 13th World's Poultry Congress, Kiev. Russia
pp. 190-195.
Trakulchang, N. and S.L. Balloun (1975). Effects of
recycling dried poultry waste on young chicks.
Poultry Sci. _54: 615-618.
Umeda, J., H. Mekada, S. Ebisawa, and K. Fatumura (1974).
Study of nutritional value of poultry waste and
the effect of feeding poultry waste on the growth
rate of chicks.
Japanese Poultry Sci. II: 69-71.

128
Velu, J.G. and D.H. Baker (1974). Body composition and
protein utilization of chicks fed graded levels
of fat. Poultry Sci. 5_3 : 1831-1838.
Vondell, R.M., and R.C. Ringrose (1958). The effect of
protein and fat levels and calorie to protein
ratio upon performance of broilers.
Poultry Sci. 3_7: 147-151.
Waldroup, P.W., Mitchell, R.J., Payne, J.R. and Johnson,
Z.B. (1976) . Characterization of the response
of broiler chickens to diets varying in nutrient
density content. Poultry Sci. ^5: 130-145.
Watson, L.T., C.B. Ammerman, S.M. Miller, and R.H. Harms
(1970). Biological assay of inorganic manganese
for chicks. Poultry Sci. _49: 1548-1554.
Wehunt, K.E., Fuller, H.L., and H.M. Edwards, Jr. (1960).The nutritional value of hydrolysed poultry manure
for broiler chickens. Poultry Sci. 39: 1057-1064.
Whitehead, C.C., W.A. Deevar, and J.N. Downie (1972).
Factors affecting the retention of calcium by the
chick. Br. Poult. Sci. 197-200.
Wirthgen, B., Bergner, H. and Munchow, H. (1967). Enzymes
in blood or liver. In: Protein Metabolism and
Nutrition. Edited by D.J.A. Cole, K.N. Boorman,
P.J. Buttery, D. Lewis, R.J. Neale, and H. Swan. Univ. Nottingham, Sch. of Agric. pp. 252.

- 129 -
Yacowitz, H., and V.D. Chamberlain (1954). Further
s t u d i e s o n t h e s u p p l e m e n t a t i o n o f b r o i l e r r a t i o n s
w i t h f a t s . P o u l t r y Sci. 3 _ 3 ; 1 0 9 0 ( A b s t r . ) .
Yoshida, M., Hizikuro, S., Hoshi, H. and Morimoto, H.
(1962). Effect of dietary protein and energy
levels on the growth rate, feed efficiency, and
carcass composition of chicks.
Agricultural and Biological Chemistry 2_6: 640-647.
Yoshida, M., and H. Oshii (1965). Nutritive value of
poultry manure. Japanese Poultry Sci. j>: 37-39.
Yoshida, M. (1976). Improvement of the procedure to
determine gross protein value with growing chicks.
5. Comparison of gross protein value from carcass
protein retention and body weight gain.
Japanese Poultry Sci. 13: 197-202.
Young, R.J., and Nesheim, M.C. (1972). Dehydrated poultry
waste as a feed ingredient.
Proc. 1972 Cornell. Nutr. Conf. p. 46.

130
9. APPENDICES
Appendix 1: True protein analysis in DPW
One gram of dried finely ground poultry waste was
weighed into a 250 ml glass beaker, and wetted with a few
ml of ethanol to aid dispersion. To this was added 50 ml
distilled water, 40 ml of a boric acid/sodium hydroxide
buffer solution with a pH of about 8.0, and 10 ml of 0.1 M
potassium permanganate solution to oxidise the uric acid
to break-down products with greater solubility. The beaker
was placed in a water bath at a temperature of 50°C + 0.5°C
and stirred mechanically for 35 minutes. Immediately after
this, 25 ml of 0.16 M uranyl acetate solution was added to
precipitate the true protein. The sample was boiled up and
left overnight to cool and allow the precipitate to settle.
The following day, the sample was filtered through a rapid
filter paper (Whatman 91, 15 cm), and the residue was
washed with 250 ml of 1% uranyl acetate solution at room
temperature. The filter paper with residue were then
transferred to a 500 ml kjeldahl flask and digested with
sulphuric acid, using a selenium tablet as a catalyst,
after which the nitrogen content was determined according
to the standard procedure (AOAC, 1984).

131
Appendix 2: True metabolizable energy determination inDPW and layer mash________________________
The oven dried, the sun dried-autoclaved, and the solar
dried poultry waste were each mixed with an equal amount of
ground maize. Eighteen adult cockerels (over six months of
age) were fasted for 24 hours. Three fasted cockerels were
each force-fed 30 g of ground maize, maize plus each type
of dried poultry waste, or layer mash alone. Maize was
used as a carrier to reduce dustiness of DPW. The purpose
of force feeding (precision feeding) was to ensure that a
known quantity of a feedstuff entered the alimentary
canal of a bird at a known time. The procedure avoids the
need to recover waste feed, prevents feed selection and
eliminates variation in intake among birds. The force-
feeding devices consisted of a stainless steel funnel and
an aluminium plunger. The steel funnel used was 40 cm
long, and had an external diameter of 1.3 cm and an internal
diameter of 1.1 cm. The plunger consisted of a 1 cm diameter
aluminium rod to which a 3.0 cm diameter spherical knob
was attached. A plastic sleeve was rivetted to the rod
to prevent the plunger from projecting more than 0.5 cm
beyond the end of the funnel. Force feeding was carried out
by inserting the stem of the funnel through the opened beak
of the cockerel, and moving it down the oesophagus into the
crop, peed was poured into the funnel and pushed down into
the crop using a plunger. After feeding, the funnel was
removed with a rotary action, pressure being applied to the
oesophagus with the left hand to dislodge feed particles

132
adhering to the stem of the funnel. Each cockerel was placed
in a wire cage over an excreta collection tray and the time
was recorded. Water was provided ad libitum. Three cockerels
were not fed and served as the negative control for the
measurement of metabolic plus endogenous energy. The excreta
voided during the 24 hours after placing the cockerels in
cages was collected, dried in the oven at 60°C, and allowed
to cool and equilibrate with the atmospheric moisture.
Weight of the dried excreta from each cockerel was recorded.
Samples of test materials, and excreta from the fed and
unfed birds were assayed for gross energy using an adiabatic
oxygen bomb calorimeter. Calculation was done as follows
El - (EEf - EEu)TME (Kcal/kg DM) = ------------------
Feed CM input (kg)
Where El = the gross energy input (kilocalories)
EEf = the energy voided as excreta by the fed birds (kilocalories)
EEu = the energy voided as excreta by the unfed birds (kilocalories)
Since DPW was fed with an equal amount of maize, TME of DPW
was calculated as follows
B E of DPW (kcal/kg CM) = 2 (BE of maize + DPW) - TME of maize
The above method of calculation was based on the finding of
Sibbald (1977) that the true metabolizable energy values of
feedingstuffs are approximately additive.

Appendix 3: Apparent profit per broiler fed Experiment 4 diets from day old to 54 days of ageExperimental diets
Level of DPW Level of ME, CP
110% DPW1*
Low
210% DPW1 Medium
310% DPW1
High
410% DPW3***
Low
510% DPW3 Medium
610% DPW3 High
Cost/day old chick (Kshs.) 6.70 6.70 6.70 6.70 6.70 6.70
Feed cost/broiler (Kshs.) 14.64 18.22 19.98 14.95 18.00 21.25
Total cost (Kshs.) 21.34 24.92 26.68 21.65 24.70 27.95
Broiler weight at 54 days (g) 1722 1790 1708 1664 1784 1738
Value* 2/broiler (Kshs.) 29.27 30.43 29.04 28.29 30.33 29.55
Apparent profit/broiler (Kshs.) 7.93 5.51 2.36 6.64 5.63 1.60
Apparent profit - Cost of broiler at marketing - (Cost of a day old broiler chick + Cost of feed consumedper broiler).
2Each broiler was valued at KShs. 17.00 per kilogram live weight at 54 days of age.


