Quantitative analysis of rat liver nucleolar and nucleoplasmic ...

THE NUCLEOLAR ORGANIZER OF THE SALIVARY GLAND POLYTENE CHROMOSOMES AS A MEASURE OF RECENT GROWTH IN
LABORATORY-REARED AND FIELD-COLLECTED CHIRONOMUS SPP. (DIPTERA: CHIRONOMIDAE) LARVAE
by
Joshua P. Martin
A Thesis Submitted to the Faculty of Graduate Studies
through the Department of Biological Sciences in Partial Fulfillment of the Requirements for
the Degree of Master of Science at the University of Windsor
Windsor, Ontario, Canada
2010
© 2010 Joshua P. Martin

AUTHOR’S DECLARATION OF ORIGINALITY
I hereby certify that I am the sole author of this thesis and that no part of this thesis has been published or submitted for publication.
I certify that, to the best of my knowledge, my thesis does not infringe upon anyone’s copyright nor violate any proprietary rights and that any ideas, techniques, quotations, or any other material from the work of other people included in my thesis, published or otherwise, are fully acknowledged in accordance with the standard referencing practices. Furthermore, to the extent that I have included copyrighted material that surpasses the bounds of fair dealing within the meaning of the Canada Copyright Act, I certify that I have obtained a written permission from the copyright owner(s) to include such material(s) in my thesis and have included copies of such copyright clearances to my appendix.
I declare that this is a true copy of my thesis, including any final revisions, as approved by my thesis committee and the Graduate Studies office, and that this thesis has not been submitted for a higher degree to any other University or Institution.
iii

ABSTRACT
Midge larvae possess giant polytene chromosomes. Genes on these chromosomes
undergoing transcription are visible as puffs. The nucleolar organizer (NOR), an
especially large puff, shrinks when a larva is stressed. Two feeding experiments were
conducted to examine how NOR size changes as a function of Chironomus riparius
growth. NOR size was linearly related to an individual’s recent growth rate, independent
of its body size.
Chironomids were collected from wetlands constructed with oil sands mine water
and tailings (OSPM), and reference wetlands to evaluate the utility of the NOR as a field-
based measure of larval growth and condition. Small larvae (< 9mm) did not yield
sufficient quality preparations. Five karyotypes were identified, revealing cryptic
diversity in the wetlands. NOR size was measured in a single karyotype; no measures
were obtained from OSPM-affected wetlands. NOR size has potential as a surrogate
growth measure that can facilitate estimation of chironomid secondary production.
iv

ACKNOWLEDGEMENTS
I would like to thank several people who have helped in one way or another with
this project. I would first like to thank my supervisor, Dr. Jan Ciborowski, who gave me
an opportunity early on to be involved in research as an undergraduate field-assistant.
Throughout the duration of this project he gave me guidance, support, and
encouragement. I would like to extend special thanks to Carla Wytrykush for all the
guidance she has given me over the last few years, helping me grow as a student, a
researcher, and a person. I would also like to thank Dr. Dan Mennill for his advice, and
guidance over the course of my undergraduate and Masters degree. Thank you to my
committee Dr. Andrew Swan, Dr. Brian Fryer, and Terry Van Meer.
I would like to thank Jesse Gardner-Costa, the ying to my yang, who was always
willing to help and ready to talk research; he was also always ready to have a good time
and share some laughs. Kurt Frederick, Carsten Slama, Misun Kang, Mary Sebastian,
Nicole Barker, Mirna Jajo, Li Wang, and everyone in the Ciborowski lab helped in more
ways than one. Thank you to Nadia Qureshi, Nicole Bloschinsky, Hao Chen, Andrew
Nelson, Melanie Martin, Jennifer Thoms, and Dr. Lee Foote for all their help in the field.
Thank you to Danielle Milani from Environment Canada for sending the egg
masses used for the laboratory experiments. Thank you to all the great staff working for
the oil sands companies involved with this project including Neil Rutley, Terry Van
Meer, Clara Qualizza, Chris Beierling, Dr. Mike Mackinnon, Lori Cyprien (Syncrude),
Richard Kavanagh (CNRL), Wayne Tedder, Christine Daly, John Hornung (Suncor),
Xiao Tan, Fred Kuzmic (Albian sands). I would like to thank Malcolm Butler from North
Dakota State University for teaching me how to dissect and stain the polytene
chromosomes. I would like to thank Steve Budinsky and Windsor TSC for constructing
the “X-Press”. Thank you to my mom (Lori), dad (Pete), and sister (Chrissy) for
everything they have done for me over the years. Thank you to Craig, Lyn, and Jennifer
for treating and supporting me like one of their own. Finally, thank you to my beautiful
wife Melanie for her encouragement and support.
v

This research was supported by grants from Syncrude Canada Ltd., Suncor
Energy Ltd., Canadian Natural Resources Ltd., Albian Sands Energy, Total E&P Canada,
Ltd., the Natural Sciences and Engineering Research Council of Canada (NSERC)
through a Collaborative Research and Development Grant, and the Canadian Water
Network to Jan Ciborowski and coinvestigators involved in the “Carbon Dynamics, Food
Web Structure and Reclamation Strategies for Alberta Oilsands Constructed Wetlands
(CFRAW)” research project. In kind support and logistic assistance from Syncrude
Canada Limited and Suncor Energy Incorporated, are also gratefully acknowledged.
University of Windsor graduate assistantships, postgraduate scholarships, travel awards,
and an NSERC Industrial Postgraduate Scholarship were received by Joshua P. Martin.
vi

TABLE OF CONTENTS
AUTHOR’S DECLARATION OF ORIGINALITY…...…………….………
ABSTRACT………………………………………...…...………………………
ACKNOWLEDGEMENTS……………........................……………………….
LIST OF TABLES………………………………………………………….......
LIST OF FIGURES…………………………………………………………….
CHAPTER ONE: GENERAL INTRODUCTION…………………......…….
POLYTENE CHROMOSOMES AND CHROMOSOMAL PUFFS……
THE NUCLEOLAR ORGANIZER…..………………………………….
NOR SIZE AND CHIRONOMID GROWTH………………………......
OIL SANDS CONSTRUCTED WETLANDS…...………………….......
OIL SANDS PROCESS MATERIALS AND CHIRONOMIDS………..
LITERATURE CITED………………………………………………......
CHAPTER TWO: THE RELATIONSHIP BETWEEN NUCLEOLAR ORGANIZER SIZE AND GROWTH IN FOOD-LIMITED CHIRONOMUS RIPARIUS LARVAE (DIPTERA: CHIRONOMIDAE)...... INTRODUCTION……………….……………………………………….
MATERIALS AND METHODS……………...…………………………
Organism collection and maintenance…………………………...
Experimental design………………………………………...........
Experimental procedures………………………………………...
Biomass and growth rate measurements…………………………
Polytene chromosome extraction and staining………………......
Measurements of NOR size………………………………………
Statistical analyses……………………………………………….
RESULTS……………………………………………………………......
Uniform ration experiment……………………………………….
Variable ration experiment………………………………………
DISCUSSION……………………………………………………………
Uniform ration experiment………………………………………
iii
iv
v
x
xi
1
2
2
3
4
5
6
10
10
11
11
11
12
13
14
15
17
17
17
26
36
36
vii
Variable ration experiment……………………………………...
NOR size as an indicator of stress………………………………
LITERATURE CITED………………………………………………..
CHAPTER THREE: NUCLEOLAR ORGANIZER (NOR) SIZE AS A FIELD-BASED MEASURE OF CHIRONOMINI GROWTH IN OIL SANDS CONSTRUCTED WETLANDS…………………………………….. INTRODUCTION…………………….…………………………………
MATERIALS AND METHODS……………...…………………………
Study design………………………………………………………
Study site…………………………………………………………
Sample collection………………………………………………...
Laboratory procedures..................................................................
Statistical analyses…………………………………………….…
RESULTS………………………………………………………………..
Water chemistry………………………………………………….
Taxa collected……………………………………………………
Chromosomal puffing……………………………………………
DISCUSSION……………………………………………………………
Chironomids in oil sands constructed wetlands…………………
NOR size in oil sands constructed wetlands……………………..
Measuring NOR size in the field…………………………………
Summary, Conclusions, and Recommendations………………….
LITERATURE CITED…………………………………………………..
CHAPTER FOUR: GENERAL DISCUSSION AND CONCLUSIONS……
CHIRONOMID SECONDARY PRODUCTION……………………….
NOR SIZE AS A SURROGATE MEASURE OF SECONDARY PRODUCTION…………………………………………………………..
UTILITY OF THE NOR IN OIL SANDS CONSTRUCTED WETLANDS……………………………………………………………..
IMPLICATIONS AND CONCLUSIONS……………………………….
38
39
42
46
46
47
47
47
48
49
52
52
52
54
54
57
57
60
61
63
64
66
66
67
70
71
viii

LITERATURE CITED………………………………………………......
APPENDIX I: A COMPARISON OF METHODS FOR MEASURING NUCLEOLAR ORGANIZER SIZE………………………………………….. INTRODUCTION…………………….…………………………………
METHODS……………...………………………….……………………
RESULTS…………………………………………………………..........
DISCUSSION……………………………………………………………
LITERATURE CITED…………………………………………………..
APPENDIX II: ENVIRONMENTAL CHARACTERISTICS AND CONSTRUCTION OF THE STUDY WETLANDS……..…………………..
GOLDEN POND WETLAND………………………………………….. HIGH SULPHATE WETLAND………………………………………... NATURAL WETLAND………………………………………………… 4-M CT WETLAND……………………………………………………..
APPENDIX III: WATER CHEMISTRY OF THE STUDY WETLANDS – NAPHTHENIC ACIDS, MAJOR ION, AND MINOR ELEMENTS ANALYSES……….……………………………………………………………. APPENDIX IV: POLYTENE CHROMOSOME KARYOTYPES OF CHIRONOMUS LARVAE COLLECTED FROM THE STUDY WETLANDS…………………………….……………………………………… APPENDIX V: RAW DATA – CHIRONOMID LARVAE SORTED BY TAXON……………………………………………………………………..…... VITA AUCTORIS………………………………………………………………
72
74 74
75
77
77
83
85
85
85
85
86
91
94
99
100
ix

LIST OF TABLES
CHAPTER TWO Table 1. Mean (± SE) values of water chemistry parameters during the variable ration and uniform ration experiments……………………………………………. Table 2. Percentage of Chironomus riparius larvae (from which NOR size measurements were obtained) at the end of the uniform ration experiment assigned to each of three developmental classes based on the development of their imaginal discs……………………………………………………………….. Table 3. Percentage of Chironomus riparius larvae (from which NOR size measurements were obtained) at the end of the variable ration experiment assigned to each of three developmental classes based on the development of their imaginal discs……………………………………………………………….. CHAPTER THREE Table 1. Summary of water chemistry parameters of each study wetland during the sampling period……………………………………………………………….. Table 2. Number of chironomid larvae exhibiting a given karyotype for each wetland……………………………………………………………………………. APPENDIX I Table 1. Mean and standard deviation of NOR size estimates (diameter, µm; and area, µm2)………………………………………………………………………….
18
22
32
53
56
80
x

LIST OF FIGURES
CHAPTER TWO Fig. 1. Chromosomal map and digital image taken at 400X magnification of the IVth chromosome (G arm) of Chironomus riparius……………………………… Fig. 2. Mean survival at the end of the uniform ration experiment………………. Fig. 3. Biomass of midge larvae (mg dry mass) at the end of the uniform ration experiment………………………………………………………………………… Fig. 4. NOR size at the end of the uniform ration experiment as a function of chromosome size at each of four different ration qualities……………………….. Fig. 5. Scatterplot showing the relationship between NOR size and larval size (biomass) at the end of the uniform ration experiment…………………………… Fig. 6. Scatterplot showing the relationship between chromosome size and larval size (biomass) at the end of the uniform ration…………………………………… Fig. 7. NOR size as a function of chromosome size for larvae ‘early’, ‘intermediate’, and ‘late’ in their development at the conclusion of the uniform ration experiment…………………………………………………………………. Fig. 8. Adjusted mean NOR size for larvae at different stages of development………………………………………………………………………. Fig. 9. Mean survival at the end of the variable ration experiment………………. Fig. 10. Biomass of midge larvae (mg dry mass) at the end of the variable ration experiment………………………………………………………………………… Fig. 11. Mean instantaneous growth rate of midge larvae (mg/d) during the late period (day 8-14) of the variable ration experiment……………………………… Fig. 12. NOR size at the end of the variable ration experiment as a function of chromosome size for larvae provided with a uniform ration of low quality or high quality and for larvae switched from one to the other at the midpoint of the experiment………………………………………………………………………… Fig. 13. Adjusted mean NOR size of larvae provided with either a uniform or variable ration during variable ration experiment………………………………… Fig. 14. Scatterplot showing the relationship between instantaneous growth rate (from day 8-14; ‘late’ period) and NOR size at the end of the variable ration experiment…………………………………………………………………………
16
19
21
23
24
25
27
28
29
30
33
34
35
37
xi

xii
CHAPTER THREE Fig. 1. Photograph of the polytene chromosomes of an individual collected from Golden Pond in July 2008 classified as “karyotype H”…………………………... Fig. 2. Percentage of chironomid larvae collected belonging to each taxon in reference and OSPM-affected wetlands…………………………………………... Fig. 3. Relationship between puff size and chromosome size for larvae collected from High Sulphate and Golden Pond……………………………………………. APPENDIX I Fig. 1. The “X-Press” designed and employed to standardize the amount of pressure applied to squash the salivary glands……………………………………. Fig. 2. Chromosomal map and digital image taken at 400X magnification of the IV chromosome (G arm) of Chironomus riparius………………………………... Fig. 3. NOR diameter was a significant predictor of NOR area in both Experiment One and Experiment Two……………………………………………. APPENDIX II Fig. 1. Photographs of Golden Pond in May 2008 and July 2008………………... Fig. 2. Photographs of High Sulphate Wetland in May 2008 and July 2008…….. Fig. 3. Photographs of Natural Wetland in May 2008 and July 2008……………. Fig. 4. Photographs of 4-m CT Wetland in May 2008 and July 2008……………. APPENDIX IV Fig. 1. Karyotype A………………………………………………………………. Fig. 2. Karyotype C……………………………………………………………….. Fig. 3. Karyotype F……………………………………………………………….. Fig. 4. Karyotype H………………………………………………………………. Fig. 5. Karyotype J………………………………………………………………..
51
55
58
76
78
79
87
88
89
90
94
95
96
97
98

CHAPTER ONE: GENERAL INTRODUCTION
Chironomids (Diptera: Chironomidae) are an especially important component of
benthic aquatic communities. They are one of the most dominant, widespread, and
diverse aquatic invertebrate taxa in freshwater systems (Armittage 1995). Chironomids
are an important food source to larger predatory invertebrates, fishes, and birds (e.g.,
Winfield and Winfield 1994; Hudson et al. 1995; Benke et al. 2001), and are important
contributors of carbon and energy flow to higher trophic levels (Benke and Wallace
1997).
Chironomids are holometabolous insects. Their life cycle includes three aquatic
developmental stages (egg, larva, and pupa) and a terrestrial reproductive stage (winged
adult). Although the duration and attributes of each life stage are species-specific,
chironomids spend most of their lives as benthic larvae living and feeding in or on the
sediment [or macrophytes] (Oliver 1971). Because of their close association with the
benthic zone, easily identifiable life stages, ease of culture, and sensitivity to chemical
and environmental stressors, chironomid larvae are commonly used as indicator species in
laboratory and field-based toxicity tests (e.g., Lindegaard 1995; Environment Canada
1997). They exhibit both developmental (e.g., Timmermans et al. 1992; Dube and Culp
1996) and teratogenic (e.g., Hudson and Ciborowski 1996b; Groenendijk et al. 1998;
Martinez et al. 2001) responses to a wide range of chemical contaminants. Chironomid
larvae also reflect chemical stress by exhibiting structural (Michailova et al. 1998; 2001a,
b; 2003; 2006) and functional changes in the polytene chromosomes of their salivary
glands (Aziz et al. 1991; Bentivegna and Cooper 1993; Hudson and Ciborowski 1996;
Michailova et al. 1998; 2001a, b; 2003; 2006; Planello et al. 2007).
The purpose of this thesis was to determine if chironomid larval growth can be
estimated by measuring functional changes in the salivary gland polytene chromosomes.
This was achieved by conducting two growth experiments in the laboratory using
Chironomus riparius larvae, as well by collecting chironomid larvae from constructed
wetlands located in the oil sands region of northeastern Alberta, Canada.
1

POLYTENE CHROMOSOMES AND CHROMOSOMAL PUFFS
Polytene chromosomes are present in several dipteran tissues, including the
salivary glands, malpighian tubules, and the epithelium of the midgut and hindgut
(Staiber and Behnke 1985; Michailova 1989). They form when chromatids are replicated
several times with no subsequent nuclear or cellular division (Case and Daneholt 1977).
The number of chromatid strands can approximate 3000-4000 (Michailova 1989), with
the degree of polyteny reaching as high as 213 in the salivary glands of some chironomid
species (Daneholt and Edström 1967). Polytene chromosomes are very large and are
visible using a compound microscope. When properly stained, the alternating light/dark
banding pattern of heterochromatin is visible. The banding pattern is species-specific and
permits the identification of otherwise morphologically indistinguishable reproductively
isolated species (Martin 1979; Michailova 1989).
Like other chromosomes, the salivary gland polytene chromosomes carry genetic
information, most of which is found in heavily coiled and condensed chromomeric
regions (Zhimulev et al. 1981). When genes in these regions are actively undergoing
transcription, the highly condensed chromatid strands uncoil and characteristic puffs
appear. Puffs are sites of RNA synthesis (reviewed by Daneholt 1975), and the degree of
puffing is related to the rate of transcription. Larger puffs produce more RNA (Pelling
1964 cited by Grossbach 1977; Daneholt et al. 1969). The pattern of puff activation is
reversible (Beermann 1956) and is tissue- and time-specific (Ashburner 1969; Grossbach
1977); certain genes, in certain tissues, at certain times are turned on or off depending on
whether a given gene product needs to be up- or down-regulated. Depending on the
function of their associated gene product, some polytene chromosomal puffs also respond
functionally to stress (any unfavorable change that leads to reduced fitness) by increasing
or decreasing in size (e.g., Yamamoto 1970; Ashburner 1970).
THE NUCLEOLAR ORGANIZER
The nucleolar organizer (NOR) is an especially large, continuously active puff
that is responsible for the synthesis of preribosomal RNA (reviewed by Case and
Daneholt 1977). Its ultrastructure and morphological appearance differs from that of
2

typical puffs, but it behaves similarly (Pelling and Beermann 1966). In addition to the
gross banding pattern of the polytene chromosomes, the number (as many as three) and
location of the NOR(s) provide a criterion on which to base taxonomic classifications
(Michailova 1989).
Several studies have demonstrated that the NOR exhibits functional changes when
chironomid larvae are exposed to chemical stress by becoming reduced in size. Hudson
and Ciborowski (1996) found that the proportion of larvae exhibiting regression of the
NOR increased with increasing degree of contamination of the sediment in which larvae
were reared. Field-collected Chironomus riparius larvae living in a heavy-metal polluted
river containing elevated levels of chromium, copper, and zinc showed reduced NOR size
(Michailova 1998). Chironomus riparius larvae exposed to chromium (Michailova
2001a), lead (Michailova 2001b), aluminium (Michailova 2003), copper (Michailova
2006), and cadmium (Planello et al. 2007) in the laboratory exhibited reduced NOR size.
Since puff regression is indicative of reduced RNA synthesis (Pelling 1964 cited by
Grossbach 1977; Daneholt et al. 1969), reduced NOR size is assumed to represent at least
a transient reduction in overall metabolic function.
NOR SIZE AND CHIRONOMID GROWTH
Previous research suggests that NOR size may also be related to chironomid
growth. Pelling and Beermann (1966) reported that “condensed [nucleolar] organizers
appear almost exclusively under conditions when metabolic activity is at a minimum” and
that “in rapidly growing Chironomus larvae, the nucleolar organizer regions are most
frequently found in an extremely puffed condition.” However, the relationship between
NOR size and growth rate has not been quantitatively evaluated. Thus, an experiment was
designed and conducted to examine how NOR size changes as a function of chironomid
growth under controlled laboratory conditions (Chapter Two).
The demonstration of a relationship between NOR size and chironomid growth
rate would validate the assumption that NOR size is an indicator of sublethal stress by
relating it to an ecologically relevant endpoint (growth). It would also have potential to
provide a method for obtaining field-based measures of chironomid growth and
3

secondary production. In its simplest form, secondary production is the formation of new
biomass by an individual or population over time. Production (P) is calculated as the
product of the mean density (D, individuals m-2) and change in biomass (∆B, g dry mass)
over a given sampling interval (P = D x ∆B). In order to estimate the change in biomass
over time, repeated samples must be taken. Thus, methods traditionally used to estimate
zoobenthic secondary production are usually labor-intensive (Waters 1977). Although
midge larvae are easy to collect in the field, they often have multiple generations per year,
non-recognizable cohorts, and rapid growth rates (e.g., Benke 1998), which make it
difficult to obtain credible production estimates (Waters 1979). If NOR size can serve as
a measure of an individual chironomid’s growth rate at the time of collection,
instantaneous growth estimates of multiple larvae could potentially be determined from a
single field-collected sample, facilitating the estimation of chironomid secondary
production.
OIL SANDS CONSTRUCTED WETLANDS
In the Athabasca region of northeastern Alberta, wetlands are constructed using
oil sands process materials (OSPM; mine water and fine tailings) as part of a strategy to
reclaim the landscape following mining activities (OSWWG 2000). During the extraction
process, salts (sulphates and chlorides), naphthenic acids (saturated acyclic and cyclic
carboxylic acids), and residual bitumen rich in polycyclic aromatic hydrocarbons, which
are natural constituents of oil sands, become concentrated in OSPM (van den Heuvel et
al. 1999). Consequently, wetlands constructed with OSPM have elevated levels of both
water soluble (salts and naphthenic acids) and hydrophobic (polycyclic aromatic
hydrocarbons) compounds of concern that are toxic to a variety of organisms (e.g.,
Rhodes et al. 2004; Hassell et al. 2006; Clemente and Fedorak 2005).
According to the Alberta Environmental Protection and Enhancement Act
(AEPEA), oil sands companies must reclaim all leased land to a state of production
approximating that of the environment present prior to mining operations (EPEA, section
32, 1993). As a result, oil sands companies have been constructing wetlands for over 20
years to study the effects of OSPM on wetland succession and stability (Daly and
4

Ciborowski 2008). Oil sands constructed wetlands therefore provide a model system in
which to study the effects of stress on natural chironomid populations.
OIL SANDS PROCESS MATERIALS AND CHIRONOMIDS
Previous research on the chironomid community in oil sands wetlands has found
that species composition and abundance differ between OSPM-affected and reference
constructed wetlands (Whelly 1999; Ganshorn 2002; Leonhardt 2003). Overall,
chironomid genus richness is reduced in the presence of OSPM (Whelly 1999; Leonhardt
2003). With respect to toxicity, OSPM have been shown not to be teratogenic in both the
laboratory and field (Whelly 1999). However, they do reduce chironomid survival and
growth. Whelly (1999) found that, while survival and growth of Chironomus riparius
larvae reared in oil sands process water in the laboratory was unaffected, Chironomus
tentans growth was reduced by 25 %. In the field, Ganshorn (2002) found that
Chironomini annual production/biomass ratio (a measure of individual growth rate;
Benke 1996) was 75 % lower in OSPM-affected wetlands than in reference wetlands.
Thus, despite their presence and persistence, chironomid populations in OSPM-affected
wetlands appear to be stressed.
In Chapter Three, results are presented from field-collections of larvae conducted
to investigate the relationship between OSPM and NOR size and examine the utility of
the NOR as a measure of chironomid growth and condition in oil sands constructed
wetlands. Preliminary research suggests that NOR size is reduced in both Chironomus
and Derotanypus spp. growing in OSPM-affected wetlands relative to reference wetlands
with otherwise similar environmental characteristics (Hum and Ciborowski 2000). The
practicality of obtaining field-based measures of NOR size is also discussed. Because it
may serve as an individual-based indicator of stress, a measure of recent growth, and
facilitate the measure of secondary production, the NOR could provide an important
ecological tool useful in developing monitoring programs to track wetland reclamation
success.
5

LITERATURE CITED Ashburner, M. 1970. Patterns of puffing activity in salivary gland chromosomes of
Drosophila. V. Responses to environmental treatments. Chromosoma 31:356-376. Armittage, P. D. 1995. Introduction. Pages 1-6 in P. D. Armittage, P. S. Cranston, and L. C. V. Pinder (editors). The Chironomidae: The Biology and Ecology of Non- Biting Midges. Chapman and Hall, New York. Aziz, J. B., N. M. Akrawi and G. A. Nassori. 1991. The effect of chronic toxicity of
copper on the activity of Balbiani rings and nucleolar organizing region in the salivary gland chromosomes of Chironomus ninevah larvae. Environmental Pollution 69:125-130.
Beermann, W. 1956. Nuclear differentiation and functional morphology of chromosomes. Cold Spring Harbor Symposia on Quantitative Biology 21:217-232.
Benke, A. C. 1996. Secondary production of aquatic insects. Pages 557-578 in F. R. Hauer and B. Lamberti (editors) Methods in Stream Ecology. Academic Press, New York. Benke, A. C. 1998. Production dynamics of riverine chironomids: Extremely
high biomass turnover rates of primary consumers. Ecology 79:899-910. Benke, A. C. and J. B. Wallace. 1997. Trophic basis of production among riverine
caddisflies: Implications for food web analysis. Ecology 78:1132-1145. Benke, A. C., J. B. Wallace, J. W. Harrison and J. W. Koebel. 2001. Food web
quantification using secondary production analysis: predaceous invertebrates of the snag habitat in a subtropical river. Freshwater Biology 46:329-346.
Bentivegna, C. S. and K. R. Cooper. 1993. Reduced chromosomal puffing in Chironomus tentans as a biomarker for potentially genotoxic substances. Environmental Toxicology and Chemistry 12:1001-1011.
Case, S. T. and B. Daneholt. 1977. Cellular and molecular aspects of genetic expression in Chironomus salivary glands. Pages 45-77 in J. Paul (editor). Biochemistry and Cell Differentiation II. Volume 15. Baltimore, University Park Press.
Clemente, J. S. and P. M. Fedorak. 2005. A review of the occurrence, analyses, toxicity, and biodegradation of naphthenic acids. Chemosphere 60:585-600.
Daly, C. and J. J. H. Ciborowski. 2008. A review of wetland research at Suncor: Re- establishing wetland ecosystems in an oil-sands affected landscape. Proceedings of the 1st International Oil Sands Tailings Conference, Edmonton, AB. Daneholt, B. 1975. Transcription in Polytene Chromosomes. Cell 4:1-9. Daneholt, B. and J. E. Edström. 1967. The content of deoxyribonucleic acid in
individual polytene chromosomes of Chironomus tentans. Cytogenetics 6:350-356.
Daneholt, B., J. E. Edström, E. Egyhazi, B. Lambert and U. Ringborg. 1969. RNA synthesis in a Balbiani ring in Chironomus tentans salivary gland cells. Chromosoma 28:418-429.
Dube, M. G. and J. M. Culp. 1996. Growth responses of periphyton and chironomids exposed to biologically treated bleached-kraft pulp mill effluent. Environmental Toxicology and Chemistry 15:2019-2027.
6

Environment Canada. 1997. Biological test method: Test for survival and growth in sediment using larvae of freshwater midges (Chironomus tentans or Chironomus riparius) Environmental Protection Series. Ottawa, Ontario, Canada. Ganshorn, K.D. 2002. Secondary production, trophic position and potential for
accumulation of polycyclic aromatic hydrocarbons in predatory Diptera in four wetlands of the Athabasca oil sands, Alberta, Canada. M.Sc. Thesis, University of Windsor. Windsor, Ontario, Canada. 285 pp.
Groenendijk, D., L. W. M. Zeinstra and J. F. Postma. 1998. Fluctuating asymmetry and mentum gaps in populations of the midge Chironomus riparius (Diptera: Chironomidae) from a metal-contaminated river. Environmental Toxicology and Chemistry 17:1999-2005.
Grossbach, U. 1977. The salivary gland of Chironomus (Diptera): A model system for the study of cell differentiation. Results and Problems in Cell Differentiation 8:147-196.
Hassell, K. L., B. J. Kefford and D. Nugegoda. 2006. Sub-lethal and chronic salinity tolerances of three freshwater insects: Cloeon sp. and Centroptilum sp. (Ephemeroptera: Baetidae) and Chironomus sp. (Diptera: Chironomidae). Journal of Experimental Biology 209:4024-4032.
Hudson, L. A. and J. J. H. Ciborowski. 1996. Teratogenic and genotoxic responses of larval Chironomus salinarius group (Diptera: Chironomidae) to contaminated sediment. Environmental Toxicology and Chemistry 15:1375-1381.
Hudson, L. A. and J. J. H. Ciborowski. 1996b. Spatial and taxonomic variation in incidence of mouthpart deformities in midge larvae (Diptera: Chironomidae: Chironomini). Canadian Journal of Fisheries and Aquatic Sciences 53:297-304. Hudson, P. L., J. F. Savino, and C. R. Bronte. 1995. Predator-prey relations and
competition for food between age-0 lake trout and slimy sculpins in the Apostle Island region of Lake Superior. Journal of Great Lakes Research 21:445-457.
Hum, P. and J. J. H. Ciborowski. 2000. Effects of oil sands mine-process water on the nucleolar organizer region of chironomids (Diptera). Undergraduate Thesis, University of Windsor. Windsor, Ontario, Canada.
Leonhardt, C. L. 2003. Zoobenthic succession in constructed wetlands of the Fort McMurray oil sands region: Developing a measure of zoobenthic recovery. M.Sc. Thesis, University of Windsor. Windsor, Ontario, Canada. 259 pp.
Lindegaard, C. 1995. Classification of water-bodies and pollution. Pages 385-404 in P. D. Armittage, P. S. Cranston, and L. C. V. Pinder (editors). The Chironomidae: The Biology and Ecology of Non-Biting Midges. Chapman and Hall, New York.
Martin, J. 1979. Chromosomes as tools in taxonomy and phylogeny of Chironomidae (Diptera). Entomologica Scandinavica Supplementum 10:67-74.
Martinez, E. A., B. C. Moore, J. Schaumloffel and N. Dasgupta. 2001. Induction of morphological deformities in Chironomus tentans exposed to zinc- and lead-spiked sediments. Environmental Toxicology and Chemistry 20:2475-2481.
Michailova, P. 1989. The polytene chromosomes and their significance to the systematics and phylogeny of the family Chironomidae, Diptera. Acta Zoologica Fennica 186:1-107.
Michailova, P., J. Ilkova, N. Petrova and K. White. 2001b. Rearrangements in the salivary gland chromosomes of Chironomus riparius Mg. (Diptera, Chironomidae) following exposure to lead. Caryologia 54:349-363.
7

Michailova, P., J. Ilkova and K. N. White. 2003. Functional and structural rearrangements of salivary gland polytene chromosomes of Chironomus riparius Mg. (Diptera, Chironomidae) in response to freshly neutralized aluminium. Environmental Pollution 123:193-207.
Michailova, P., N. Petrova, J. Ilkova, S. Bovero, S. Brunetti, K. White and G. Sella. 2006. Genotoxic effect of copper on salivary gland polytene chromosomes of Chironomus riparius Meigen 1804 (Diptera, Chironomidae). Environmental Pollution 144:647-654.
Michailova, P., N. Petrova, G. Sella, S. Bovero, L. Ramella, F. Regoli and V. Zelano. 2001a. Genotoxic effects of chromium on polytene chromosomes of Chironomus riparius Meigen 1804 (Diptera, Chironomidae). Caryologia 54:59-71. Michailova, P., N. Petrova, G. Sella, L. Ramella and S. Bovero. 1998. Structural- functional rearrangements in chromosome G in Chironomus riparius (Diptera, Chironomidae) collected from a heavy metal-polluted area near Turin, Italy. Environmental Pollution 103:127-134. Oliver, D. R. 1971. Life history of Chironomidae. Annual Review of Entomology 16:211-
230. Oil Sands Wetlands Working Group. 2000. Guideline for wetland establishment on reclaimed oil sands leases. Neil Chymko (Editor) Report # ESD/LM/00-1. Alberta Environment, Environmental Service. Pelling, C. and W. Beermann. 1966. Diversity and variation of the nucleolar organizer
regions in chironomids. National Cancer Institute Monographs 23:393-409. Planello, R., J. L. Martinez-Guitarte and G. Morcillo. 2007. Ribosomal genes as early
targets of cadmium-induced toxicity in Chironomus riparius larvae. Science of the Total Environment 373:113-121.
Rhodes, S., A. Farwell, L. M. Hewitt, M. Mackinnon, D. G. Dixon. 2004. The effects of dimethylated and alkylated polycyclic aromatic hydrocarbons on the embryonic development of the Japanese medaka. Ecotoxicology and Environmental Safety 60:247-258.
Staiber, W. and E. Behnke. 1985. Developmental puffing activity in the salivary gland and malpighian tubule chromosomes of Acricotopus lucidus (Diptera, Chironomidae). Chromosoma 93:1-16.
Timmermans, K. R., W. Peeters and M. Tonkes. 1992. Cadmium, zinc, lead and copper in Chironomus riparius (Meigen) larvae (Diptera, Chironomidae) - Uptake and effects. Hydrobiologia 241:119-134.
van den Heuvel, M. R., M. Power, M. D. MacKinnon, T. Van Meer, E. P. Dobson and D. G. Dixon. 1999. Effects of oil sands related aquatic reclamation on yellow perch (Perca flavescens). I. Water quality characteristics and yellow perch physiological and population responses. Canadian Journal of Fisheries and Aquatic Sciences 56:1213-1225. Waters, T. F. 1977. Secondary production in inland waters. Advances in Ecological
Research 10:91-164. Waters, T. F. 1979. Influence of benthos life-history upon the estimation of
secondary production. Journal of the Fisheries Research Board of Canada 36:1425-1430.
Whelly, M. P. 1999. Aquatic invertebrates in wetlands of the oil sands region of
8

9
northeast Alberta, Canada, with emphasis on Chironomidae (Diptera). M.Sc. Thesis, University of Windsor, Windsor, Ontario, Canada. 314 pp.
Winfield, I. J. and D. K. Winfield. 1994. Feeding ecology of the Diving Ducks Pochard (Aythya ferina), Tufted Duck (A. fuligula), Scaup (A. marila) and Goldeneye (Bucephala clangula) overwintering on Lough Neagh, Northern-Ireland. Freshwater Biology 32:467-477.
Yamamoto, H. 1970. Heat-shock induced puffing changes in Balbiani rings. Chromosoma 32:171-190.
Zhimulev, I. F., E. S. Belyaeva and V. F. Semeshin. 1981. Informational content of polytene chromosome bands and puffs. CRC Critical Reviews in Biochemistry 11:303-340.
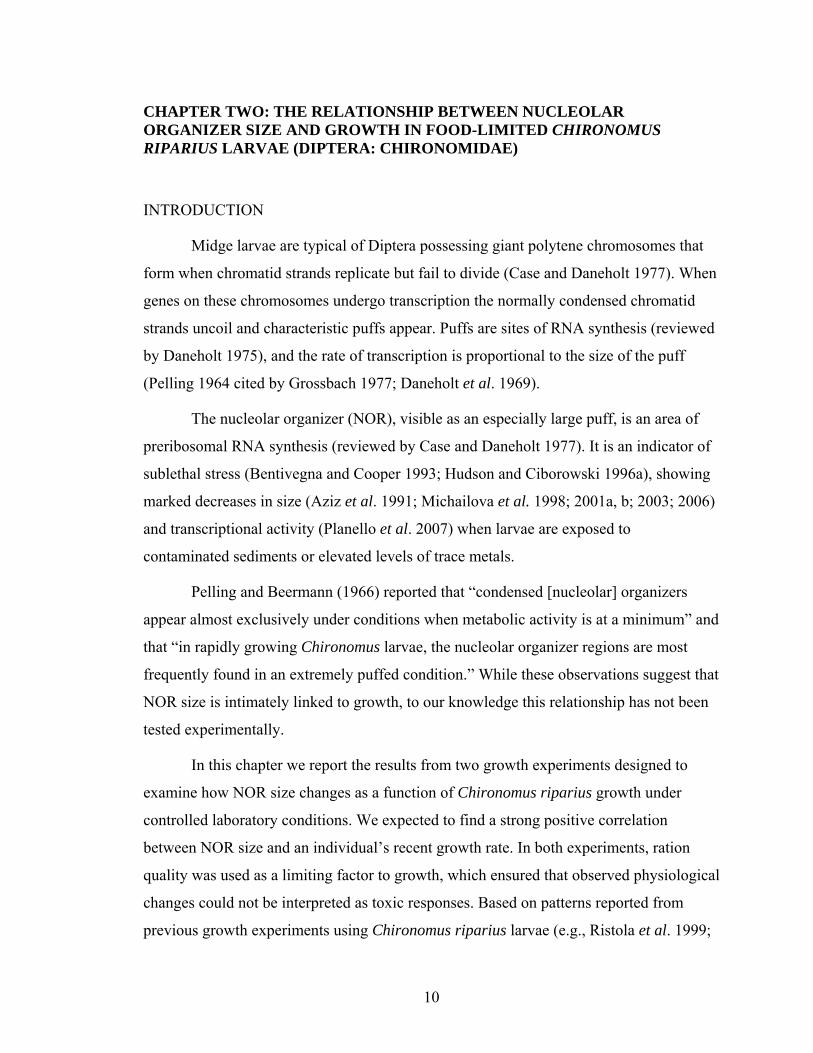
CHAPTER TWO: THE RELATIONSHIP BETWEEN NUCLEOLAR ORGANIZER SIZE AND GROWTH IN FOOD-LIMITED CHIRONOMUS RIPARIUS LARVAE (DIPTERA: CHIRONOMIDAE)
INTRODUCTION
Midge larvae are typical of Diptera possessing giant polytene chromosomes that
form when chromatid strands replicate but fail to divide (Case and Daneholt 1977). When
genes on these chromosomes undergo transcription the normally condensed chromatid
strands uncoil and characteristic puffs appear. Puffs are sites of RNA synthesis (reviewed
by Daneholt 1975), and the rate of transcription is proportional to the size of the puff
(Pelling 1964 cited by Grossbach 1977; Daneholt et al. 1969).
The nucleolar organizer (NOR), visible as an especially large puff, is an area of
preribosomal RNA synthesis (reviewed by Case and Daneholt 1977). It is an indicator of
sublethal stress (Bentivegna and Cooper 1993; Hudson and Ciborowski 1996a), showing
marked decreases in size (Aziz et al. 1991; Michailova et al. 1998; 2001a, b; 2003; 2006)
and transcriptional activity (Planello et al. 2007) when larvae are exposed to
contaminated sediments or elevated levels of trace metals.
Pelling and Beermann (1966) reported that “condensed [nucleolar] organizers
appear almost exclusively under conditions when metabolic activity is at a minimum” and
that “in rapidly growing Chironomus larvae, the nucleolar organizer regions are most
frequently found in an extremely puffed condition.” While these observations suggest that
NOR size is intimately linked to growth, to our knowledge this relationship has not been
tested experimentally.
In this chapter we report the results from two growth experiments designed to
examine how NOR size changes as a function of Chironomus riparius growth under
controlled laboratory conditions. We expected to find a strong positive correlation
between NOR size and an individual’s recent growth rate. In both experiments, ration
quality was used as a limiting factor to growth, which ensured that observed physiological
changes could not be interpreted as toxic responses. Based on patterns reported from
previous growth experiments using Chironomus riparius larvae (e.g., Ristola et al. 1999;
10

Pery et al. 2002), we expected that growth, and thus NOR size, would increase as ration
quality increased.
MATERIALS AND METHODS
Organism collection and maintenance
Chironomus riparius egg masses were obtained from a laboratory culture
maintained by Environment Canada (Burlington, ON). Upon arrival, egg masses were
incubated at room temperature until they hatched. Only first instar larvae (24 h old or
less) were used in experiments.
Experimental design
Two independent experiments were conducted simultaneously. Two trials (each
with 4 replicates per treatment) were conducted sequentially. The first trial ran from
January 26th to February 9th, 2007 and the second from February 16th to March 2nd, 2007.
Uniform ration experiment.-In this experiment a uniform feeding regime was
employed over the 14-d course of the trial to quantify the relationship between ration
quality and measures of larval survival, size, growth, and NOR size. Larvae were
provided with a daily food ration of 1.0 mg/larva. Food consisted of a mixture of ground
Nutrifin®, the food typically used in Chironomus cultures (eg., Naylor and Rodrigues
1995), and methylcellulose, which serves as a source of biomass that is consumed by
larvae but has no nutritive value (Burt 2005). Ration quality was regulated by varying the
proportions of each constituent. Treatments followed a geometric series of nutritional
quality (0:1, 1:7, 1:3, 1:1, and 1:0 w/w Nutrifin®: methylcellulose) and ranged from
having no nutritional value (0:1) to greatest nutritional value (1:0). At the conclusion of
the experiment we measured survival, biomass, and NOR size. We expected growth
(measured as individual final biomass) to vary as a function of ration quality. We
therefore also expected NOR size to vary as a function of ration quality; better fed larvae
would be growing faster and exhibit larger NOR than poorly fed larvae.
11

Variable ration experiment.-In this experiment a variable feeding regime was
employed over the 14-d course of the trial to determine if NOR size varied as a function
of recent growth independently of larval size. The experiment followed a 2 x 2 factorial
design. The two factors were ‘experimental period’ and ‘ration quality’. The time course
of this experiment was divided into ‘early’ (days 0-7) and ‘late’ (days 8-14) periods.
Ration quality was either ‘low’ (1:7 w/w Nutrifin®: methylcellulose) or ‘high’ (1:0 w/w
Nutrifin®: methylcellulose). Thus, larvae in a treatment received a ration of either ‘low’
or ‘high’ quality for the ‘early’ part of the trial, after which ration quality was either kept
the same or changed to the complementary treatment. At the conclusion of the experiment
we measured survival, biomass, and NOR size. Additional jars (n = 4) of ‘low’ and ‘high’
ration quality had been set up and harvested at the midpoint of the experiment (day 7) to
provide a second measure of biomass used to estimate the instantaneous growth rate of
chironomids during the ‘final’ period of the study.
Because the potential for new tissue elaboration is directly proportional to the
amount of food assimilated, we expected the final biomass of individual larvae to reflect
the quality of the ration with which they were provided averaged over the ‘early’ and
‘late’ periods. Therefore, larvae that were given a uniformly ‘low’ or ‘high’ quality ration
were expected to be small or large, respectively, and larvae whose ration was changed at
the midpoint of the trial were expected to be intermediate in size.
Unlike larval size, which we expected to depend on an individual’s entire feeding
history, we expected larval short-term growth rates at the conclusion of the experiment to
reflect the quality of the ration that they had been given during the ‘late’ period only.
Therefore, larvae switched from a ‘high’ to ‘low’ quality ration were expected to be
growing slowly at the end of the ‘late’ period. The converse was expected for larvae
switched from a ‘low’ to ‘high’ quality ration. We expected NOR size to reflect recent
growth rates, and thus also the quality of the ration provided during the ‘late’ period only.
Experimental procedures
Treatment jars were 12 x 12 x 15 cm, 2-L glass containers prewashed with 10 %
HNO3 and triple rinsed with distilled water. Jars contained 500 g of washed, fine silica
12
sand and 1-L of water aerated for 48 h prior to the addition of larvae. Ionic concentration
of the water was standardized by adding salts to deionized water (CaCl2, 79.2 mg/L;
MgS04, 44.5 mg/L; NaHCO3, 85.6 mg/L; KCl, 2.8 mg/L; Bedard et al. 1992). Each jar
was covered, continuously aerated using a branching capillary tube system (Corkum and
Hanes 1989), and kept at 21 ± 2 oC on a 16:8 h light:dark photoperiod within a walk-in
environmental chamber. Temperature, dissolved oxygen, and pH were measured in each
jar with a YSI 30 portable meter at the beginning, middle and end of each 14-d trial.
Viewed under a dissection scope, groups of 50 newly hatched larvae were
randomly selected from egg masses that had been placed in Petri plates, and pipetted into
20-mL scintillation vials. Vials were then immersed into each treatment jar to release the
larvae. Stock solutions of ground Nutrifin® (5 mg/mL of distilled water) and
methylcellulose (5 mg/mL of distilled water) were made daily. Food was added daily to
each treatment jar by diluting the stock solutions accordingly. All volumes were adjusted
to 10-mL to keep water levels even across treatments.
At the conclusion of each trial the jar contents were emptied into a 250-μm mesh
sieve, larvae were hand-picked from the retained sand with fine forceps, individually
blotted on paper towel to remove excess water, counted, and immediately preserved in
chilled (4oC) Carnoy’s solution (3:1 v/v absolute ethanol/glacial acetic acid). Carnoy’s
was poured off and replaced with fresh solution after 10 min, 1 h and 24 h. Total handling
time for each jar (time elapsed between first and last individual preserved) was constant
among trials and treatments (uniform ration experiment, 3.5 ± 0.3 min, n = 40; variable
ration experiment, 5.0 ± 1.3 min, n = 32).
Biomass and growth rate measurements
Preserved larvae were placed on their sides in a Petri plate and digitally
photographed over a 5 mm2 grid using a Hitachi® VK-C370 DSP colour video camera
equipped with a macro lens and a Pixelsmart® video card. Each chironomid was assigned
a unique number, its position was recorded on the digital image, and it was stored in its
own shell vial containing Carnoy’s solution. Total body length, from the anterior part of
the head to the posterior edge of the last abdominal segment, was measured to the nearest
13

0.01 mm using Mocha® Version 1.2 imaging analysis software version 1.2 (Jandel
Corporation©, 1992-1994). Body length was then converted to biomass using the length-
dry mass conversion method (Burgherr and Meyer 1997):
M = aLb [1]
where M is individual biomass (mg), L is body length (mm) and, a and b are constants
equal to 0.00068 and 2.620, respectively, derived from a length-mass regression equation
for Chironomus spp. (Benke et al. 1999). Instantaneous growth rates (g), where g
represents the mean growth rate for all larvae in a single jar, were then calculated as
follows:
g = ln [(Mt=14 / Mt=7)] / t [2]
where Mt=14 is mean final biomass, Mt=7 is mean biomass after 7 days, and t is the
number of days between biomass measurements (Hauer and Benke 1991).
While photographing the larvae we noticed considerable variation in development
among individuals of the same age. Considering that the pattern and timing of puff
activation may be associated with development (e.g., Ashburner 1967, Santa-Cruz et al.
1978), we scored each individual according to developmental stage prior to extracting the
salivary glands. Each larva was assigned to one of three classes (‘early’, stage 0-3;
‘intermediate’, stage 4-6; or ‘late’, stage 7-9) based on the nine developmental phases of
the fourth instar illustrated by Wuelker and Goetz (1968).
Polytene chromosome extraction and staining:
All larvae were preserved for at least 24 h. Polytene chromosomes were extracted
from salivary glands and stained using a modification of the aceto-orcein technique (M.G.
Butler, North Dakota State University, personal communication). To extract the salivary
glands from a preserved chironomid, a specimen was placed in a depression slide filled
with 50% acetic acid and viewed under the low power of a dissection microscope. The
head was removed and the body was severed just below the second thoracic segment. The
salivary glands were then extruded anteriorly from the thorax using gentle pressure,
carefully isolated, transferred to a microscope slide, and stained with aceto-orcein (1 mg
14

orcein/50-mL of 60% acetic acid). After 6 min, the glands were triple rinsed with 50 %
acetic acid (two drops placed over each gland and immediately drawn off with bibulous
paper) to remove any excess or unbound stain. Afterwards, salivary glands were rinsed
with a drop of 15 % lactic acid, followed immediately with a drop of 25 % lactic acid.
The glands were then transferred to a clean slide and covered with a drop of 45 % lactic
acid. A coverslip was placed on top, and the glands were squashed using a press designed
and constructed to deliver an even and consistent amount of pressure. The preparation
was allowed to sit for 10 min at room temperature to dry. The edges of the coverslip were
then rimmed with nail polish and the slide was stored in a freezer until it could be
digitally photographed.
Measurements of NOR size
Previous studies have characterized puff size by calculating the relative nucleolar
diameter (Bentivegna and Cooper 1993; Hudson and Ciborowski 1996a). Puff size is
proportional to chromosome size, and chromosome size corresponds to the size of an
individual (Bentivegna and Cooper 1993). Measurements taken from different-sized
larvae can therefore be standardized by measuring both NOR and chromosome size.
We also used diameter as a measure of NOR size (Appendix I). The NOR of C.
riparius is found on chromosome G (Michailova et al. 2006). NOR diameter was
measured at the centre of the Dd region. The diameter of the A1b band was used as a
measure of chromosome size (Fig. 1). This section is furthest away from the NOR and
Balbiani rings (BRs), making it least likely to be structurally affected by changes in their
activity (Zhimulev et al. 1981).
Polytene chromosomes were viewed at 400X magnification using a Meiji
compound microscope attached to a SPOT InsightTM Firewire 2 Megapixel Color Mosaic
digital video camera. Three to six chromosomes per larvae were photographed and NOR
diameter was measured from the digital images to the nearest 0.1 µm using UTHSCSA
ImageTool version 3.0 (© UTHSCSA 1996-2002). The mean NOR diameter for a single
chironomid was then calculated. Individuals from which less than three nucleoli were
measured were excluded from further analyses. For each replicate jar, mean NOR
15

NOR
BRc
BRb
NOR
BRc
BRb
Fig. 1. Chromosomal map (left; source unknown) and digital image taken at 400X magnification (right) of the IVth chromosome (G arm) of Chironomus riparius. Lines indicate the location of the Dd and A1a bands used as measures of NOR and chromosome size, respectively. Also indicated are the Balbiani rings (BRb and BRc).
16

diameter was calculated from measures taken for between two and six individuals. In
order to account for variability in size among individuals and because good quality stains
were difficult to obtain from individuals smaller than 9 mm (pers. obs.), we
systematically chose the three largest and median-sized larvae for analysis.
Statistical Analyses
Statistical analyses were performed using STATISTICA version 6.1 (Statsoft,
Inc., Tulsa, OK). Statistical significance of differences among treatment groups and trials
for water chemistry parameters, chironomid survival, biomass, and instantaneous growth
rate was tested using planned-comparison analysis of variance (ANOVA). The statistical
significance of differences among treatment groups and trials for NOR size (controlling
for chromosome size) was tested using planned-comparison analysis of covariance
(ANCOVA). All reported adjusted NOR values are adjusted to a mean chromosome size
of 9.2 µm; this was the greatest area of overlap among treatments. Statistical significance
of differences in the proportion of larvae in each developmental stage was tested using a
chi-square contingency test. The level of significance was set at p < 0.05 for all tests.
RESULTS
Uniform ration experiment
Water chemistry.-Mean temperature, dissolved oxygen, and pH values were all
significantly higher during trial 1 than during trial 2 (analysis of variance, p < 0.05), but
were not significantly different among treatments (Table 1; analysis of variance, p > 0.1).
Survival.-Mean (± SE) larval survival was significantly lower for trial 1 (34.25 ±
3.40 %, n = 16) than for trial 2 (55.75 ± 4.06 %, n = 16) (Fig. 2; F1,30 = 11.88, p < 0.001).
As expected, survival was significantly lower in the starved (0:1 w/w ground Nutrifin®:
methylcellulose) treatment (F1,30 = 52.45, p < 0.001). Because only a few very small
larvae survived in the 0:1 treatment they were not included in further analyses. Survival
among all other treatments was homogeneous (planned-comparisons, p > 0.05).
17

Table 1. Mean (± SE) values of water chemistry parameters during the variable ration and uniform ration experiments for both trial 1 (n = 16, n =19, respectively) and trial 2 (n = 16, n = 20, respectively).
Trial 1 Trial 2 F p
Variable ration experiment (n = 32)
Temperature (oC) 22.4 ± 0.08 21.3 ± 0.04 138.7 < 0.001
Dissolved oxygen (%) 70.4 ± 1.6 62.9 ± 1.8 9.33 < 0.01 pH 8.1 ± 0.06 8.0 ± 0.02 2.20 > 0.1
Uniform ration experiment (n = 39)
Temperature (oC) 22.4 ± 0.1 21.3 ± 0.04 132.9 < 0.001 Dissolved oxygen (%) 71.1 ± 1.04 63.9 ± 0.8 34.21 < 0.001 pH 8.1 ± 0.02 8.0 ± 0.03 28.6 < 0.001
18

Ration quality (Nutrifin®: methylcellulose)
Mea
n (±
SE)
surv
ival
(%)
0
20
40
60
80
0:1 1:7 1:3 1:1 1:0
*
Fig. 2. Mean (± SE) survival at the end of the uniform ration experiment. Asterisks indicate a significant difference at p < 0.05. Trial 1 (n = 4), open bars; Trial 2 (n = 4), filled bars.
19

Biomass.-Mean (± SE) individual biomass was significantly different among
treatments (planned comparisons, p < 0.01) and increased as ration quality increased (Fig.
3). Individuals provided with a low quality (1:7) ration were smallest, weighing 0.32 ±
0.02 mg (n = 8) on average, while those kept on the highest quality ration (1:0) were
largest, weighing 0.60 ± 0.02 mg (n = 8) on average. There was no significant difference
between trials (F1,24 = 0.22, p > 0.1). There was a trend for larvae in trial 1 to be larger
than larvae in trial 2. The lower survivorship in trial 1 may explain this result; because
there were fewer larvae in each jar, on average, larvae in trial 1 received more food per
individual than larvae in trial 2.
In addition to having an effect on biomass, ration quality also influenced
development. Two lines of evidence support this conclusion. First, at the conclusion of
the experiment seven individuals pupated; six of these were fed one of the two highest
quality rations (1:1 and 1:0 w/w Nutrifin®: methylcellulose). Secondly, based on the
assignment of individuals to one of three developmental classes (done prior to extracting
the salivary glands), the proportion of individuals ‘intermediate’ or ‘late’ in development
increased as diet quality increased (Table 2; chi-square contingency test, χ2 = 30.56, d.f. =
6, p < 0.001).
NOR size.-A total of 906 chromosomes was photographed and measured from 173
individuals. NOR size was significantly correlated with chromosome size (regression
analysis, R2 = 0.49, F1,30 = 28.71, p < 0.001); larger chromosomes had larger NOR (Fig.
4). A test for parallelism revealed this relationship was homogeneous across larvae fed
different quality rations (F3,16 = 0.81, p > 0.1). Mean (± SE) NOR size was significantly
larger in trial 1 larvae (22.54 ± 0.49 µm, n = 16) than in trial 2 larvae (20.64 ± 0.42 µm, n
= 16) (analysis of covariance, F1,23 = 10.70, p < 0.01). Contrary to our expectations,
however, NOR size did not significantly differ among larvae fed different quality rations
(analysis of covariance, F3,23 = 2.34, p > 0.1). Both NOR and chromosome size were
independent of larval body size (Fig. 5 and 6; linear regression: R2 = 0.01, F1,30 = 0.3, p >
0.1; R2 = 0.09, F1,30 = 3.04, p > 0.05, respectively).
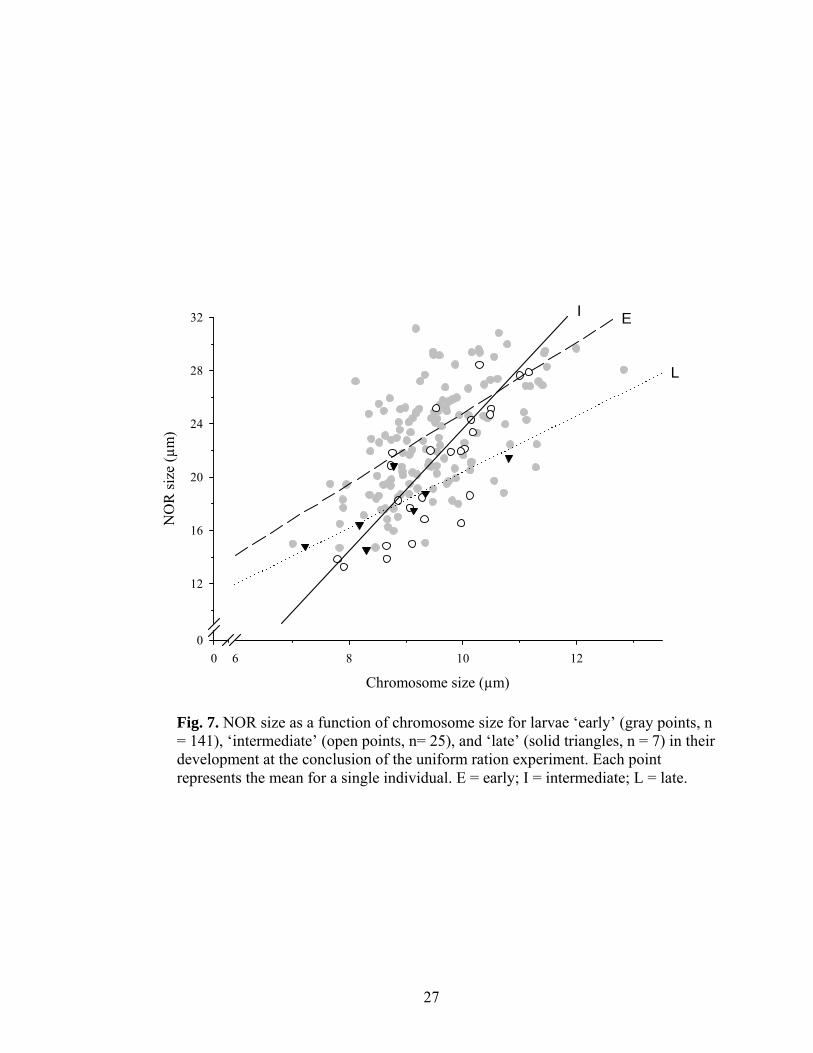
To account for some of the variability we contrasted the NOR of the various
developmental stages, independent of treatment (Fig. 7 and 8). Larvae that were ‘early’ in
20

Mea
n (±
SE)
indi
vidu
al b
iom
ass (
mg)
0.0
0.2
0.4
0.6
0.8
Ration quality (Nutrifin®: methylcellulose)
1:7 1:3 1:1 1:0
***
****
**
Fig. 3. Biomass of midge larvae (mg dry mass) at the end of the uniform ration experiment. Asterisks indicate a significant difference at p < 0.05 (*), p < 0.01 (**), or p < 0.001 (***). Trial 1 (n = 4), open bars; Trial 2 (n = 4), filled bars.
21
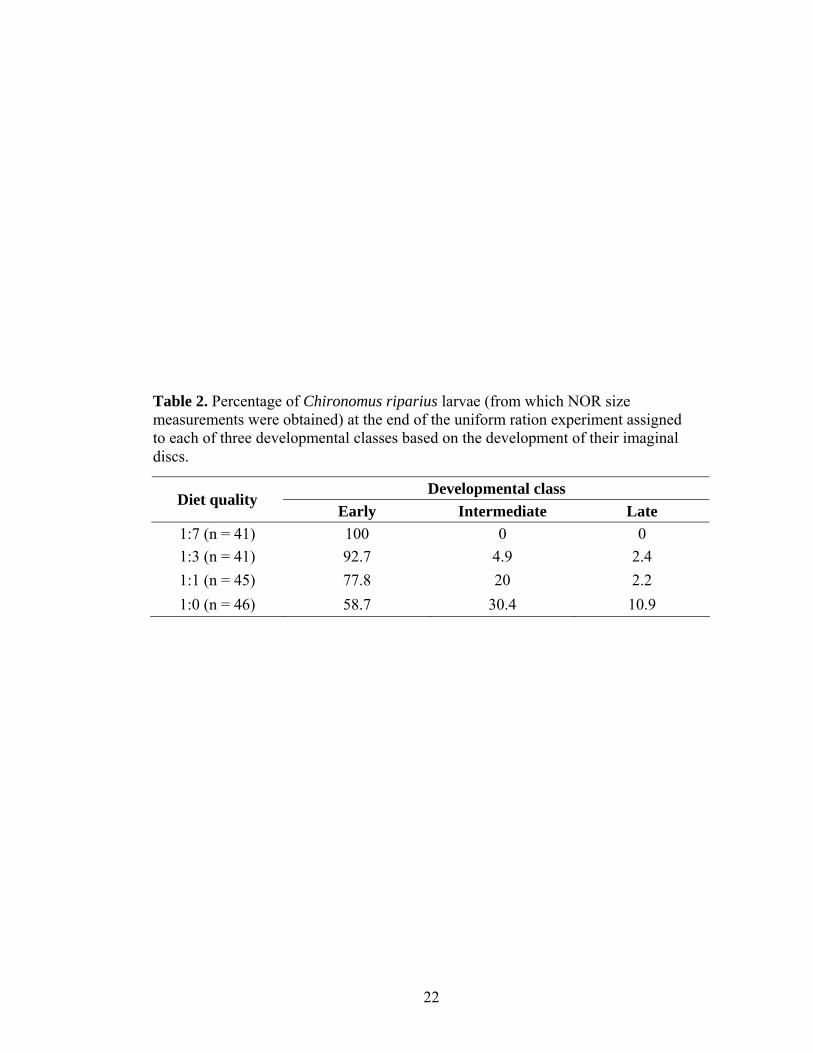
Table 2. Percentage of Chironomus riparius larvae (from which NOR size measurements were obtained) at the end of the uniform ration experiment assigned to each of three developmental classes based on the development of their imaginal discs.
Developmental class Diet quality
Early Intermediate Late 1:7 (n = 41) 100 0 0 1:3 (n = 41) 92.7 4.9 2.4 1:1 (n = 45) 77.8 20 2.2 1:0 (n = 46) 58.7 30.4 10.9
22

Chromosome size (µm)
0 8 9 10 11
NO
R si
ze (µ
m)
014
16
18
20
22
24
26
28
30
32
1:7
1:3
1:11:0
Fig. 4. NOR size at the end of the uniform ration experiment as a function of chromosome size at each of four different ration qualities (1:7, filled points; 1:3, open points; 1:1, filled triangles; 1:0, open triangles; n = 8). Each point represents the mean for all larvae from a single replicate jar. The slope of the relationship was only significant for the 1:7 and 1:3 ration qualities (R2 = 0.93, F1,6 = 78.6, p < 0.001; R2 = 0.54, F1,6 = 6.94, p < 0.05, respectively).
23

Individual biomass (mg)
0.0 0.4 0.6 0.8 1.0
NO
R si
ze (µ
m)
016
18
20
22
24
26
28
30
32
Fig. 5. Scatterplot showing the relationship between NOR size and larval size (biomass) at the end of the uniform ration experiment (n = 32). Each point represents the mean for a single replicate jar. The slope of the relationship was not significantly different than zero (r2 = 0.01, F1,30 = 0.3, p > 0.1).
24

Individual biomass (mg)
0.0 0.4 0.6 0.8 1.0
Chr
omos
ome
size
(µm
)
08
9
10
11
Fig. 6. Scatterplot showing the relationship between chromosome size and larval
size (biomass) at the end of the uniform ration experiment (n = 32). Each point represents the mean for a single replicate jar (n = 8). The slope of the relationship was not significantly different than zero (R2 = 0.09, F1,30 = 3.04, p > 0.05).
25

their development had a significantly larger mean (± SE) NOR (22.10 ± 0.29 µm, n =
141) than those larvae who were in ‘intermediate’ (19.64 ± 0.66 µm, n = 25) or ‘late’
(18.76 ± 1.23 µm, n = 7) developmental stages (planned-comparison, F1,169 = 14.89, p <
0.001).
Variable ration experiment
Water chemistry.-Mean temperature, dissolved oxygen, and pH were similar between
trials and among treatments (Table 1; analysis of variance, p > 0.05).
Survival.-Mean (± SE) survival did not significantly differ among treatments (Fig.
9; analysis of variance, F3,24 = 0.42, p > 0.1). Mean survival was significantly lower for
trial 1 (37.62 ± 4.12 %, n = 16) than for trial 2 (62.00 ± 3.37 %, n = 16) (analysis of
variance, F1,24 = 19.75, p < 0.001).
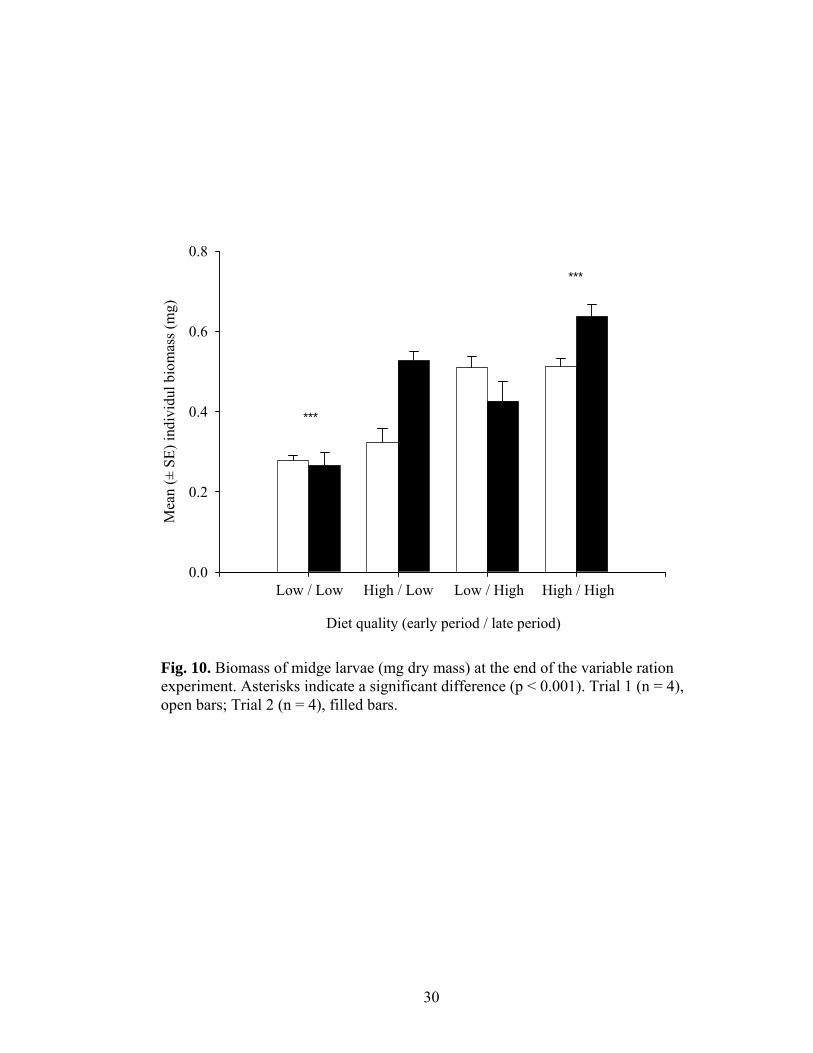
Biomass.-Both ‘early’ and ‘late’ ration quality significantly affected biomass (Fig.
10). At the midpoint of the experiment (day 7) the mean (± SE) individual biomass of
larvae provided with a low quality ration was only half of (0.027 ± 0.003 mg, n = 4) the
biomass of larvae that were provided with a high quality ration (0.054 ± 0.007 mg, n = 4)
(one-tailed t-test, d.f. = 6, t = -3.39, p < 0.05). Larvae fed a low quality ration during the
‘early’ period were also significantly smaller at the conclusion of the experiment than
larvae that were fed a high quality ration during the ‘early’ period (analysis of variance,
F1,24 = 61.54, p < 0.001). Regardless of the quality of the ration they received during the
‘early’ period, larvae provided with a low quality ration during the ‘late’ period were
significantly smaller than larvae that were fed a high quality ration during the ‘late’
period (analysis of variance, F1,24 = 34.79, p < 0.001). The quality of the ration provided
during the ‘late’ period had more of an effect on larval biomass during trial 2 than during
trial 1 (analysis of variance, F1,24 = 23.12, p < 0.001). Mean (± SE) individual biomass
was significantly lower during trial 1 (0.41 ± 0.12 mg, n = 16) than during trial 2 (0.46 ±
0.15 mg, n = 16) (analysis of variance, F1,24 = 7.05, p < 0.05).
In accord with our expectations, planned-comparisons showed that larval size at
the end of the study reflected the nutritional quality of the ration provided averaged over
26
Chromosome size (µm)
0 6 8 10 12
NO
R si
ze (µ
m)
0
12
16
20
24
28
32
L
EI
Fig. 7. NOR size as a function of chromosome size for larvae ‘early’ (gray points, n = 141), ‘intermediate’ (open points, n= 25), and ‘late’ (solid triangles, n = 7) in their development at the conclusion of the uniform ration experiment. Each point represents the mean for a single individual. E = early; I = intermediate; L = late.
27

Developmental stage
Adj
uste
d m
ean
(± S
E) N
OR
size
(µm
)
012
14
16
18
20
22
24
Early Intermdiate Late
**
Fig. 8. Adjusted mean (± SE) NOR size for larvae at different stages of development (early, n =141; intermediate, n = 25; late, n = 7). Values are adjusted for a chromosome size of 9.2 µm. Asterisks indicate a significant difference at p < 0.01.
28

Diet quality (early period / late period)
Mea
n (±
SE)
surv
ival
(%)
0
20
40
60
80
Low / Low High / Low Low / High High / High
Fig. 9. Mean (± SE) survival at the end of the variable ration experiment. Trial 1 (n = 4), open bars; Trial 2 (n = 4), filled bars.
29
Mea
n (±
SE)
indi
vidu
l bio
mas
s (m
g)
0.0
0.2
0.4
0.6
0.8
Diet quality (early period / late period)
Low / Low High / Low Low / High High / High
***
***
Fig. 10. Biomass of midge larvae (mg dry mass) at the end of the variable ration experiment. Asterisks indicate a significant difference (p < 0.001). Trial 1 (n = 4), open bars; Trial 2 (n = 4), filled bars.
30

both the ‘early’ and ‘late’ periods. Larvae given a ‘low’ quality ration throughout the
study were small, larvae given a ‘high’ quality ration were large, and larvae whose ration
was changed at the midpoint of the study were intermediate in size. Larval development
proceeded at a similar rate across treatments (Table 3; chi-square contingency test, χ2 =
8.17, d.f. = 6, p > 0.1).
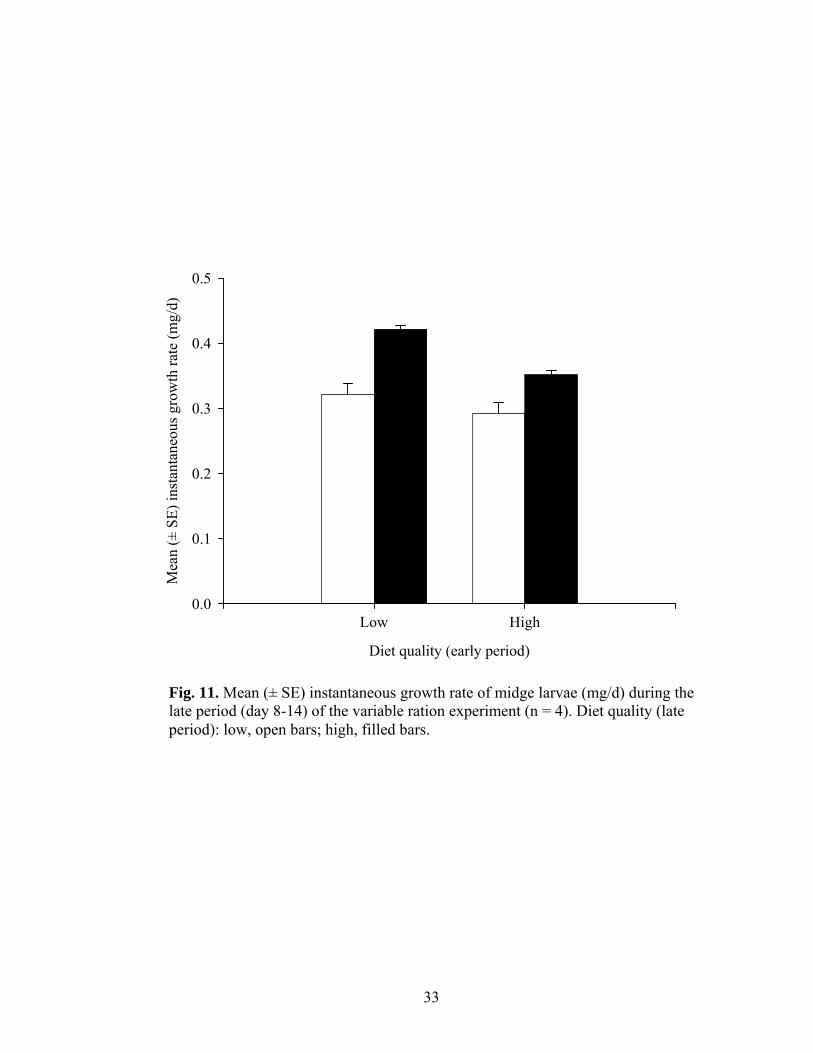
Instantaneous growth rate (day 8-14).-Growth rate measurements were calculated
only for trial 2 treatments (n = 4) as no measurements were obtained for larval biomass on
day 7 during trial 1. As expected, larval growth rate at the end of the study reflected the
nutritional quality of the ration provided during the ‘late’ period; larvae that were given a
high quality ration during the second half of the experiment were growing 25 % faster
than larvae given a low quality ration (Fig. 11; analysis of variance, F1,12 = 38.16, p <
0.001). However, the quality of the ration provided during the ‘early’ period also
significantly affected growth rate; larvae given the low quality ration ‘early’ were
growing 15 % faster at the conclusion of the experiment than those larvae provided with a
high quality ration ‘early’ (analysis of variance, F1,12 = 14.59, p < 0.01). Also in line with
our expectations, although larvae from the two reciprocal treatments were similar in size
at the end of the experiment (see Fig. 3; planned-comparison, F1,24 = 1.89, p > 0.1), larvae
switched from a low to high quality ration had a significantly higher mean instantaneous
growth rate during the ‘late’ period (day 8-14) than those larvae switched from a high to
low quality ration (planned-comparisons, F1,12 = 49.97, p < 0.001).
NOR size.-A total of 495 chromosomes was photographed and measured from 93
individuals. NOR size was significantly correlated with chromosome size (regression
analysis, R2 = 0.29, F1,14 = 5.68, p < 0.05); larger chromosomes had larger NOR (Fig. 12).
A test for parallelism revealed this relationship was homogeneous across all four
treatments (F1,8 = 0.008, p > 0.1). NOR size was significantly affected by the quality of
both the ‘early’ and ‘late’ rations (Fig. 13). When the quality of the ration provided
during the ‘early’ period was low, larvae exhibited significantly larger NORs at the
conclusion of the experiment (analysis of covariance, F1,11 = 14.72, p < 0.01). However, if
larvae were given low quality food during the ‘late’ period, they had significantly smaller
31

Table 3. Percentage of Chironomus riparius larvae (from which NOR size measurements were obtained) at the end of the variable ration experiment assigned to each of three developmental classes based on the development of their imaginal discs.
Developmental class Diet quality
(early period / late period) Early Intermediate Late Low/Low (n = 23) 100 0 0 High/Low (n = 21) 100 0 0 Low/High (n = 25) 100 0 0 High/High (n = 24) 87.5 12.5 0
32
Diet quality (early period)
Mea
n (±
SE)
inst
anta
neou
s gro
wth
rate
(mg/
d)
0.0
0.1
0.2
0.3
0.4
0.5
Low High
Fig. 11. Mean (± SE) instantaneous growth rate of midge larvae (mg/d) during the late period (day 8-14) of the variable ration experiment (n = 4). Diet quality (late period): low, open bars; high, filled bars.
33

Chromosome size (µm)
0 8 9 10 11
NO
R s
ize
(µm
)
016
18
20
22
24
26
28
Low / HighLow / Low
High / HighHigh / Low
Fig. 12. NOR size at the end of the variable ration experiment as a function of chromosome size for larvae provided with a uniform ration of low quality (filled circles; n = 4) or high quality (filled triangles; n = 4) and for larvae switched from one to the other at the midpoint of the experiment (low to high, open points; high to low, open triangles; n = 4). Each point represents the mean for a single replicate jar.
34

Diet quality (early period)
Adju
sted
mea
n (±
SE)
NO
R s
ize
(µm
)
012
14
16
18
20
22
24
Low High
Fig. 13. Adjusted mean (± SE) NOR size of larvae provided with either a uniform or variable ration during variable ration experiment (n = 4). Diet quality (late period): low, open bars; high, filled bars. Values are adjusted for a chromosome size of 9.2 µm.
35

NORs at the conclusion of the experiment than larvae fed a high quality ration over the
same interval (analysis of covariance, F1,11 = 8.74, p < 0.05).
NOR size and growth rate.-Separate analyses for both growth rate and NOR size
at the conclusion of trial 2 showed significant differences between treatments. When
larvae were compared directly, we found a significant positive relationship between
instantaneous growth rate and NOR size (Fig. 14; regression analysis, R2 = 0.43, F1,14 =
10.53, p < 0.01). As predicted, larvae which were growing rapidly during the ‘late’ period
of the experiment exhibited large NOR while larvae that grew slowly during the late
period exhibited small NOR, regardless of treatment.
DISCUSSION
We conducted two laboratory experiments to determine if changes in NOR size
reflected changes in growth. The uniform ration experiment revealed ration quality
influenced both chironomid size and development. It also demonstrated that NOR size
was independent of larval size, but developmentally dependent. In the variable ration
experiment, we found both early and late ration quality affected chironomid size and
growth. We also found that NOR size was linearly related to an individual’s recent
growth rate, confirming the notion that NOR size is intimately linked to growth.
Uniform ration experiment
Initial comparison of the observed and expected relationships gave results
inconsistent with expectations; NOR size did not vary as a function of ration quality.
However, further inspection suggests neither did chironomid growth. Typically, larval
chironomid growth is nonlinear; the rate of mass accrual decreases as body size increases
(Stites and Benke 1989). In the very late stages of prepupal development, fourth instar
larvae may even lose biomass (Vos et al. 2002). Thus, as larvae approach maximum size,
they allocate increasing amounts of energy to pupation rather than to growth. Eventually,
growth ceases altogether (growth is restricted to the larval instars; Butler 1984) and
metamorphosis takes place.
36

Instantaneous growth rate (mg / d)
0.00 0.25 0.30 0.35 0.40 0.45
Adj
uste
d m
ean
NO
R si
ze (µ
m)
0
16
18
20
22
24
26
Fig. 14. Scatterplot showing the relationship between instantaneous growth rate (from day 8-14; ‘late’ period) and NOR size at the end of the variable ration experiment (n = 16). NOR values are adjusted for a chromosome size of 9.2 µm. Each point represents the mean for a single replicate jar.
37

Laboratory-reared Chironomus riparius larvae attain a length of 12.5-12.6 mm
(Pery et al. 2002). At the conclusion of the uniform ration experiment, only 9 % of larvae
fed the lowest quality ration (1:7 Nutrifin®: methylcellulose) were larger than 12.6 mm.
In contrast, 57 % of the larvae fed an optimal ration (1:0 Nutrifin®: methylcellulose) were
larger than 12.6 mm. Presumably, these large individuals were approaching, or had
already reached, their maximum size. Furthermore, many of these larvae were late in
development. Therefore, both larval size and the proportion of larvae whose growth had
begun to slow increased as a function of ration quality.
We suggest this created a situation in which, on average, ‘recent’ growth rates
were similar among treatments, but for different reasons; most individuals fed a low
quality ration were growing slowly because of food limitation, whereas most individuals
fed a high quality ration were growing slowly because they had attained maximum size
and development. Thus, NOR size was invariable because recent growth rates were
invariable. Unfortunately, the uniform ration experimental design precluded obtaining
direct measures of recent growth during the late period. However, the finding that NOR
size decreased as a function of prepupal stage is consistent with this scenario.
Variable ration experiment
The relationship between NOR size and growth was most clearly demonstrated by
the results from the variable ration experiment. Chironomids in the reciprocal treatments
displayed very different NOR size despite being similar in size and development. The
differences in NOR size between the two treatments reflected differences in recent growth
rate, and as expected, larvae recently fed a high quality ration had larger NOR. The
finding that ‘early’ ration quality had an effect on growth rates during the ‘late’ period
was not surprising. Food deprivation early in development can impact several life-history
traits including survival, growth, and reproduction (Metcalfe and Monoghan 2001). With
respect to growth, many organisms exhibit accelerated growth rates following
unfavorable conditions or a period of resource limitation in an attempt to compensate or
‘catch-up’ (Metcalfe and Monoghan 2001). This is especially true when individuals are
nutritionally deprived early in life (e.g., Mangel and Munch 2005; Dmitriew et al. 2007).
38
Thus, compensatory growth likely explains why, despite being starved ‘early’, larvae fed
a high quality ration during the late period only had higher growth rates and higher NOR
size than larvae fed a high quality ration throughout. Interestingly, as in the uniform
ration experiment, larvae fed a high quality ration throughout exhibited similar NOR size
to larvae fed a low quality ration throughout; direct measures of growth confirmed that
these larvae were also growing at comparable rates.
Regression analysis showed a significant linear relationship between NOR size
and growth rate. While it explained 43 % of the observed variation, we suggest the
relationship is actually much stronger. Firstly, although NOR size was measured on an
individual basis and then averaged, we measured growth (change in total biomass) at the
level of the population (replicate jar). As a result, we were unable to account for among-
individual growth variation. This may have increased the variability of our measures,
particularly in the low quality ration and reciprocal treatments, since individual
differences in growth are magnified under more stressful conditions (Koehn and Bayne
1989). Secondly, our measure of instantaneous growth reflected the average growth rate
of larvae over a 7-d period. However, a significant difference in NOR activity and size is
observable in as little as 12 h after exposure to cadmium (Planello et al. 2007). Much
explanatory power was likely lost by our relating a short term putative growth indicator
(NOR size) with a measure of growth estimated over a 7-d interval. Both of these
concerns could be addressed in future studies by rearing and feeding larvae individually
and measuring them more frequently.
NOR size as an indicator of stress
Chironomid larvae exhibit both developmental (e.g., Timmermans et al. 1992;
Dube and Culp 1996) and teratogenic (e.g., Hudson and Ciborowski 1996b; Groenendijk
et al. 1998; Martinez et al. 2001) responses to chemical contaminants. As a result, they
have long been considered important bioindicators. More recently, chironomid larvae
have also been shown to respond to chemical stress by exhibiting structural and
functional changes in their polytene chromosomes.
39

The NOR is a specialized puff that displays reduced size, which is indicative of
reduced transcriptional activity, in larvae exposed to toxic stress. Hudson and Ciborowski
(1996a) found that the proportion of Chironomus salinarius group larvae exhibiting NOR
regression increased with exposure to greater degrees of sediment contamination. Field-
collected Chironomus riparius larvae living in a heavy-metal polluted river containing
elevated levels of chromium, copper, and zinc showed reduced NOR size (Michailova
1998). Chironomus riparius larvae exposed to water treated with chromium, lead,
aluminum, and copper also exhibit regressed NOR (Michailova 2001a, b; 2003; 2006). In
addition to decreasing in size, the NOR of Chironomus riparius also showed lower levels
of preribosomal RNA synthesis following exposure to cadmium (Planello et al. 2007). In
our study, we found that the NOR of Chironomus riparius responded to environmental
stress, showing marked differences in response to changes in food quality. We also found
that NOR size varied throughout development. These findings agree with previous
research conducted on the Balbiani rings, another specialized class of puffs. Similar to the
NOR, they regress in size following exposure to toxic chemicals (Aziz et al. 1991;
Bentivegna and Cooper 1993; Michailova et al. 1998; 2001a, b; 2003; 2006) and modify
their activity throughout development (Santa-Cruz et al. 1978).
Most importantly, we have demonstrated that NOR size is a significant predictor
of a chironomid’s most recent growth rate, independent of its body size. This finding
agrees with the observation of Pelling and Beermann (1966) that metabolically active
chironomid larvae exhibit extremely puffed NOR, whereas inactive larvae exhibit
condensed NOR. To our knowledge, this is the first experimental demonstration of the
relationship between NOR size and growth. Provided that the NOR is responsible for the
synthesis of preribosomal RNA (reviewed by Case and Daneholt 1977), our results are
consistent with other studies linking RNA synthesis to growth. In bacteria, total RNA and
ribosomal RNA (rRNA) concentrations increase as growth rates increase (Sutcliffe 1970;
Binder and Liu 1998). Similarly, the ratio of RNA:DNA is positively related with growth
in bacteria (Kemp et al. 1993) and invertebrates (McKee and Knowles 1989; Dahlhoff
and Menge 1996; Vrede et al. 2002; Schlechtriem et al. 2008) and is an increasingly
common indicator of growth and nutritional condition in fish (Buckley et al. 1999).
40

41
Our results validate the use of the NOR as a biomarker of RNA synthesis and/or
metabolic function (Hudson and Ciborowski 1996); NOR regression is indicative of
slowed/reduced growth and lower individual fitness (size is directly related to female
fecundity; Butler and Walker 1992). Our results also have important potential for
assessing chironomid growth and chironomid secondary production in natural
populations. While midge larvae are often easy to collect in the field, multiple generations
per year, non-recognizable cohorts, and rapid growth rates (e.g., Benke 1998) necessitate
the use of time consuming and labor intensive methods to estimate secondary production
(Waters 1977). In some instances, samples need to be taken no less than every three days
(Benke 1984). By using NOR size as a surrogate measure of growth in the field, growth
measures of individual larvae could be estimated from a single sample. Furthermore, by
using the species-specific banding pattern of the polytene chromosomes to distinguish
between otherwise morphologically indistinguishable species (Michailova 1989),
production could potentially be estimated on a species by species basis. Such an
application would require additional laboratory studies to assess how the relationship
between NOR size and growth rate varies among species

LITERATURE CITED
Ashburner, M. 1967. Patterns of puffing activity in salivary gland chromosomes of Drosophila .I. Autosomal puffing patterns in a laboratory stock of Drosophila melanogaster. Chromosoma 21:398-428.
Aziz, J. B., N. M. Akrawi and G. A. Nassori. 1991. The effect of chronic toxicity of copper on the activity of Balbiani rings and nucleolar organizing region in the salivary gland chromosomes of Chironomus ninevah larvae. Environmental Pollution 69:125-130.
Benke, A. C. 1984. Secondary production of aquatic insects. Pages 289-322 in V. H. Resh and D. M. Rosenberg. The Ecology of Aquatic Insects. New York, Praeger Publishers.
Benke, A. C. 1998. Production dynamics of riverine chironomids: Extremely high biomass turnover rates of primary consumers. Ecology 79:899-910.
Benke, A. C., A. D. Huryn, L. A. Smock and J. B. Wallace. 1999. Length-mass relationships for freshwater macroinvertebrates in North America with particular reference to the southeastern United States. Journal of the North American Benthological Society 18:308-343.
Bentivegna, C. S. and K. R. Cooper. 1993. Reduced chromosomal puffing in Chironomus tentans as a biomarker for potentially genotoxic substances. Environmental Toxicology and Chemistry 12:1001-1011.
Binder, B. J. and Y. C. Liu. 1998. Growth rate regulation of rRNA content of a marine Synechococcus (Cyanobacterium) strain. Applied and Environmental Microbiology 64:3346-3351.
Buckley, L., E. Caldarone and T.-L. Ong. 1999. RNA–DNA ratio and other nucleic acid- based indicators for growth and condition of marine fishes. Hydrobiologia 401:265-277.
Burgherr, P. and E. I. Meyer. 1997. Regression analysis of linear body dimensions vs. dry mass in stream macroinvertebrates. Archiv Fur Hydrobiologie 139:101-112.
Burt, J. A. 1998. Deformities and fluctuating asymmetry in Chironomidae (Diptera): Baseline and stress-induced occurrence. M.Sc. Thesis, University of Windsor, Windsor, Ontario, Canada. 148 pp.
Butler, M. G. 1984. Life Histories of aquatic insects. Pages 25-55 in V. H. Resh and D. M. Rosenberg. The Ecology of Aquatic Insects. New York, Praeger Publishers. Butler, M. G. and L. Walker. 2002. Fecundity, reproductive effort, and pupal size in the
profundal midge Chironomus cuccini (Diptera: Chironomidae). Netherlands Journal of Aquatic Ecology 26:263-267.
Case, S. T. and B. Daneholt. 1977. Cellular and molecular aspects of genetic expression in Chironomus salivary glands. Pages 45-77 in J. Paul (editor). Biochemistry and Cell Differentiation II. Volume 15. Baltimore, University Park Press.
Corkum, L. D. and E. C. Hanes. 1989. A laboratory aeration system for rearing aquatic invertebrates. Entomological News 100:169-172.
Dahlhoff, E. P. and B. A. Menge. 1996. Influence of phytoplankton concentration and wave exposure on the ecophysiology of Mytilus californianus. Marine Ecology Progress Series 144:97-107.
Daneholt, B. 1975. Transcription in Polytene Chromosomes. Cell 4:1-9.
42

Daneholt, B., J. E. Edstrom, E. Egyhazi, B. Lambert and U. Ringborg. 1969. RNA synthesis in a Balbiani ring in Chironomus tentans salivary gland cells. Chromosoma 28:418-429.
Dmitriew, C., M. Cooray, and L. Rowe. 2007. Effects of early resource-limiting conditions on patterns of growth, growth efficiency, and immune function at emergence in a damselfly (Odonata: Coenagrionidae). Canadian Journal of Zoology 85: 310-318. Dube, M. G. and J. M. Culp. 1996. Growth responses of periphyton and chironomids
exposed to biologically treated bleached-kraft pulp mill effluent. Environmental Toxicology and Chemistry 15:2019-2027.
Groenendijk, D., L. W. M. Zeinstra and J. F. Postma. 1998. Fluctuating asymmetry and mentum gaps in populations of the midge Chironomus riparius (Diptera: Chironomidae) from a metal-contaminated river. Environmental Toxicology and Chemistry 17:1999-2005.
Grossbach, U. 1977. The salivary gland of Chironomus (Diptera): A model system for the study of cell differentiation. Results and Problems in Cell Differentiation 8:147-196.
Hauer, F. R. and A. C. Benke. 1991. Rapid growth of snag-dwelling chironomids in a blackwater river - The influence of temperature and discharge. Journal of the North American Benthological Society 10:154-164.
Hudson, L. A. and J. J. H. Ciborowski. 1996a. Teratogenic and genotoxic responses of larval Chironomus salinarius group (Diptera: Chironomidae) to contaminated sediment. Environmental Toxicology and Chemistry 15:1375-1381.
Hudson, L. A. and J. J. H. Ciborowski. 1996b. Spatial and taxonomic variation in incidence of mouthpart deformities in midge larvae (Diptera: Chironomidae: Chironomini). Canadian Journal of Fisheries and Aquatic Sciences 53:297-304. Kemp, P. F., S. Lee and L. LaRoche. 1993. Estimating the growth rate of slowly
growing marine bacteria from RNA content. Applied and Environmental Microbiology 59:2594-2601.
Koehn, R. K. and B. L. Bayne. 1989. Towards a physiological and genetic understanding of the energetics of the stress response. Biological Journal of the Linnean Society 37:157-171.
Mangel, M. and S. B. Munch. 2005. A life-history perspective on short- and long-term consequences of compensatory growth. The American Naturalist 166:155-176.
Martin, J. 1979. Chromosomes as tools in taxonomy and phylogeny of Chironomidae (Diptera). Entomologica Scandinavica Supplementum 10:67-74.
Martinez, E. A., B. C. Moore, J. Schaumloffel and N. Dasgupta. 2001. Induction of morphological deformities in Chironomus tentans exposed to zinc- and lead-spiked sediments. Environmental Toxicology and Chemistry 20:2475-2481.
McKee, M. J. and C. O. Knowles. 1989. Temporal and spatial variation of RNA content in nymphs of the mayfly, Stenonema femoratum (Say). Environmental Pollution 58:43-55. Metcalfe, N. B. and P. Monoghan. 2001. Compensation for a bad start: grow now, pay
later? TRENDS in Ecology & Evolution 16:254-260. Michailova, P. 1989. The polytene chromosomes and their significance to the
systematics and phylogeny of the family Chironomidae, Diptera. Acta Zoologica Fennica 186:1-107.
43
Michailova, P., J. Ilkova, N. Petrova and K. White. 2001b. Rearrangements in the salivary gland chromosomes of Chironomus riparius Mg. (Diptera, Chironomidae) following exposure to lead. Caryologia 54:349-363.
Michailova, P., J. Ilkova and K. N. White. 2003. Functional and structural rearrangements of salivary gland polytene chromosomes of Chironomus riparius Mg. (Diptera, Chironomidae) in response to freshly neutralized aluminium. Environmental Pollution 123:193-207.
Michailova, P., N. Petrova, J. Ilkova, S. Bovero, S. Brunetti, K. White and G. Sella. 2006. Genotoxic effect of copper on salivary gland polytene chromosomes of Chironomus riparius Meigen 1804 (Diptera, Chironomidae). Environmental Pollution 144:647-654.
Michailova, P., N. Petrova, G. Sella, S. Bovero, L. Ramella, F. Regoli and V. Zelano. 2001a. Genotoxic effects of chromium on polytene chromosomes of Chironomus riparius Meigen 1804 (Diptera, Chironomidae). Caryologia 54:59-71. Michailova, P., N. Petrova, G. Sella, L. Ramella and S. Bovero. 1998. Structural- functional rearrangements in chromosome G in Chironomus riparius (Diptera, Chironomidae) collected from a heavy metal-polluted area near Turin, Italy. Environmental Pollution 103:127-134. Naylor, C. and C. Rodrigues. 1995. Development of a test method for Chironomus
riparius using a formulated sediment. Chemosphere 31:3291-3303. Pelling, C. and W. Beermann. 1966. Diversity and variation of the nucleolar organizer
regions in chironomids. National Cancer Institute Monographs 23:393-409. Perry, A. R. R., R. Mons, P. Flammarion, I. Lagadic and J. Garric. 2002. A modeling
approach to link food availability, growth, emergence, and reproduction for the midge Chironomus riparius. Environmental Toxicology and Chemistry 21:2507-2513.
Planello, R., J. L. Martinez-Guitarte and G. Morcillo. 2007. Ribosomal genes as early targets of cadmium-induced toxicity in Chironomus riparius larvae. Science of the Total Environment 373:113-121.
Ristola, T., J. Pellinen, M. Ruokolainen, A. Kostamo and J. V. K. Kukkonen. 1999. Effect of sediment type, feeling level, and larval density on growth and development of a midge (Chironomus riparius). Environmental Toxicology and Chemistry 18:756-764.
Santa-Cruz, M. C., A. Villanueva and J. L. Diez. 1978. Effect of galactose treatment in puffing pattern of Chironomu thummi Balbiani rings. Chromosoma 69:93-100.
Schlechtriem, C., O. E. Johannsson, K. L. Bowen, R. W. Smith and M. T. Arts. 2008. Effect of fasting under different temperature conditions on nucleic acid ratios in the opossum shrimp Mysis relicta: A calibration approach. Journal of Great Lakes Research 34:461-471. Stites, D. L. and A. C. Benke. 1989. Rapid growth rates of chironomids in 3 habitats of a
subtropical blackwater river and their implications for P/B ratios. Limnology and Oceanography 34:1278-1289.
Sutcliffe, W. H. 1970. Relationship between growth rate and ribonucleic acid concentration in some invertebrates. Journal of the Fisheries Research Board of
Canada 27:606-609. Timmermans, K. R., W. Peeters and M. Tonkes. 1992. Cadmium, zinc, lead and copper
44

45
in Chironomus riparius (Meigen) larvae (Diptera, Chironomidae) - Uptake and effects. Hydrobiologia 241:119-134.
Vos, J. H., P. J. Van den Brink, E. P. Van den Ende, M. A. G. Ooijevaar, A. J. P. Oosthoek, J. F. Postma and W. Admiraal. 2002. Growth response of a benthic detritivore to organic matter composition in sediments. Journal of the North American Benthological Society 21:443-456. Vrede, T., J. Persson and G. Aronsen. 2002. The influence of food quality (P:C ratio) on
RNA:DNA ratio and somatic growth rate of Daphnia. Limnology and Oceanography 47:487-494.
Warwick, W. F. 1985. Morphological abnormalities in Chironomidae (Diptera) larvae as measures of toxic stress in freshwater ecosystems: Indexing antennal deformities in Chironomus Meigen. Canadian Journal of Fisheries and Aquatic Sciences 42:1881-1914.
Waters, T. F. 1977. Secondary production in inland waters. Advances in Ecological Research 10:91-164.
Wulker and Goetz. 1968. Die Verwendung der Imaginalscheiben zur Bestimmung des Entwicklungszustandes von ChironomusLarven (Diptera). Zeitschrift für Morphologie und Okologie der Tiere 62:363-388.
Zhimulev, I. F., E. S. Belyaeva and V. F. Semeshin. 1981. Informational content of polytene chromosome bands and puffs. CRC Critical Reviews in Biochemistry 11:303-340.
CHAPTER THREE: NUCLEOLAR ORGANIZER (NOR) SIZE AS A FIELD-BASED MEASURE OF CHIRONOMINI (DIPTERA: CHIRONOMIDAE) GROWTH IN OIL SANDS CONSTRUCTED WETLANDS
INTRODUCTION
In the Athabasca region of northeastern Alberta, wetlands are constructed using
oil sands process materials (OSPM; mine water and fine tailings) as part of a strategy to
reclaim the landscape following mining activities (OSWWG 2000). During the extraction
process, salts (sulphates and chlorides), naphthenic acids (saturated acyclic and cyclic
carboxylic acids), and residual bitumen rich in polycyclic aromatic hydrocarbons, which
are natural constituents of oil sands, become concentrated in OSPM (van den Heuvel et
al. 1999). Consequently, constructed wetlands have elevated levels of both water soluble
and hydrophobic compounds of concern.
According to the Alberta Environmental Protection and Enhancement Act (EPEA)
oil sands companies must reclaim all leased land to a state of production approximating
that of the environment present prior to mining operations (EPEA, section 32, 1993).
Because constructed wetlands will make up 20-40 % of the final reclaimed landscape, oil
sands companies have been constructing wetlands for over 20 years to study the effects of
OSPM on wetland succession and stability (Daly and Ciborowski 2008).
As a dominant component of the zoobenthos and important contributors to the
carbon and energy flow in aquatic food webs (Benke and Wallace 1997), chironomid
growth and production in these constructed wetlands is particularly important. Previous
studies have found that chironomid community composition, abundance, and genus
richness differs between reference and OSPM-affected wetlands (Whelly 1999; Ganshorn
2002; Leonhardt 2003). Although OSPM is not teratogenic to chironomids (Whelly 1999;
Bendell-Young 2000), it is nonetheless toxic. In both the laboratory and field, chironomid
growth is reduced by up to as much as 25 % when larvae are exposed to OSPM (Whelly
1999; Ganshorn 2002). Barr (2009) found that the water component was the most
important factor regulating zoobenthic community composition (especially chironomid
genera) in oil sands constructed wetlands.
46
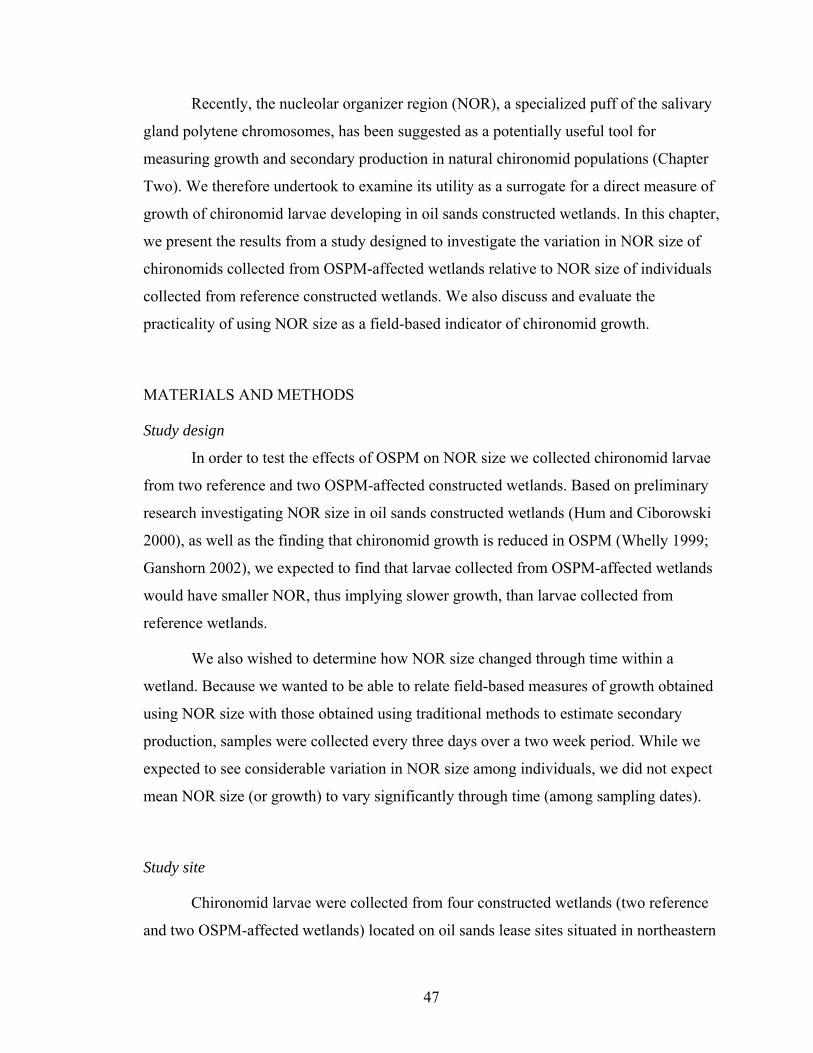
Recently, the nucleolar organizer region (NOR), a specialized puff of the salivary
gland polytene chromosomes, has been suggested as a potentially useful tool for
measuring growth and secondary production in natural chironomid populations (Chapter
Two). We therefore undertook to examine its utility as a surrogate for a direct measure of
growth of chironomid larvae developing in oil sands constructed wetlands. In this chapter,
we present the results from a study designed to investigate the variation in NOR size of
chironomids collected from OSPM-affected wetlands relative to NOR size of individuals
collected from reference constructed wetlands. We also discuss and evaluate the
practicality of using NOR size as a field-based indicator of chironomid growth.
MATERIALS AND METHODS
Study design
In order to test the effects of OSPM on NOR size we collected chironomid larvae
from two reference and two OSPM-affected constructed wetlands. Based on preliminary
research investigating NOR size in oil sands constructed wetlands (Hum and Ciborowski
2000), as well as the finding that chironomid growth is reduced in OSPM (Whelly 1999;
Ganshorn 2002), we expected to find that larvae collected from OSPM-affected wetlands
would have smaller NOR, thus implying slower growth, than larvae collected from
reference wetlands.
We also wished to determine how NOR size changed through time within a
wetland. Because we wanted to be able to relate field-based measures of growth obtained
using NOR size with those obtained using traditional methods to estimate secondary
production, samples were collected every three days over a two week period. While we
expected to see considerable variation in NOR size among individuals, we did not expect
mean NOR size (or growth) to vary significantly through time (among sampling dates).
Study site
Chironomid larvae were collected from four constructed wetlands (two reference
and two OSPM-affected wetlands) located on oil sands lease sites situated in northeastern
47

Alberta, Canada. One wetland was located on the Syncrude Canada Ltd. lease site
(Golden Pond) and three were located on the Suncor Energy Inc. lease site (High
Sulphate, Natural Wetland, and 4-m CT Wetland). For a description of the construction,
formation, age, and location of each wetland, see Appendix II. Chironomid larvae were
also collected on a single visit to other wetlands, including seven on Syncrude Canada
Ltd. lease site (Shallow wetland, South Beaver Wetland, Mike’s Pond, Northwest
Interceptor Ditch Wetland, Test Pond 3, Test Pond 5, Test Pond 9), one on Suncor Energy
Inc. lease site (Waste Area 11 Wetland), and one on Canadian Natural Resources lease
site (CNRL East Access Wetland). However, because of time constraints these samples
were not examined.
Sample collection
Prior to beginning the study each wetland was radially partitioned into five zones.
Samples were collected every three days between July 18th and August 5th, 2008. On each
sampling date, one location within each of the five zones was randomly sampled (five
samples/wetland/sampling date). Samples were collected by passing a sweep net back and
forth over the sediment surface for 20 s. Each sample was then washed using a 250-μm
net to remove fine sediment. The retained material was then placed in a sorting tray filled
with water. All visible chironomids were handpicked from the sediment using fine
forceps, blotted on paper towel, and immediately preserved with chilled Carnoy’s
solution (3:1 v/v absolute ethanol/glacial acetic acid) in a single 20-mL scintillation vial.
Carnoy’s was poured off and replaced with fresh solution after 10 min, 1 h, and 24 h. All
preserved samples were then stored in a freezer until they were analyzed.
Temperature, dissolved oxygen, conductivity, and pH were measured at each
wetland with a YSI model 30 portable meter on each sampling date. On the first and last
sampling date 100-mL water samples were collected and stored in amber vials from each
wetland and then sent to Syncrude Canada Ltd. for naphthenic acids, major ion, and
minor element analysis.
48

Laboratory procedures
Sample processing.-In the laboratory, each vial was emptied into a Petri dish, sorted
(separated according to subfamily or tribe using external head morphology) and counted.
Not all genera have easily-stained chromosomes. Because the genus Chironomus has
suitable chromosomes and is the most widely studied cytotaxonomically (Martin 1979),
only individuals identified as belonging to the tribe Chironomini were selected for further
analysis.
Next, the head capsule, body, and salivary glands of each larva were mounted on
microscope slides. An individual was placed in a depression slide filled with 50% acetic
acid and viewed under the low power of a dissection microscope. The head capsule was
then removed, placed ventral side up on a slide, and covered with two drops of CMC-9AF
aqueous mounting medium (Masters Chemical Co. Elk Park, IL). A coverslip was then
placed overtop and a small amount of pressure was applied to spread the mandibles. The
salivary glands were then extruded anteriorly from the thorax using gentle pressure
exerted with the bent tip of a dissecting needle, carefully isolated, transferred to another
microscope slide, and stained using a modification of the aceto-orcein technique (see
Chapter Two methods). The body was then placed next to the head capsule on the original
slide, covered with CMC-9AF medium, and covered with a coverslip. That slide was
allowed to air dry at room temperature for at least 48 h. The edges of the coverslip were
then ringed with nail polish and the slide was stored in a slide box.
Identification.-Using currently available keys based on external morphology
(Coffman and Ferrington 2008) we were able to identify larvae belonging to the genus
Chironomus. Several studies have investigated the banding patterns of chironomids
collected from natural populations around the world (e.g., Kiknadze et al. 1996; Kiknadze
et al. 1998; Butler et al. 1999; Kiknadze et al. 2000). However, to date there are no
taxonomic keys and only one guide to the polytene chromosomes of Chironomidae in
North America (Martin 2009c). An attempt to use the guide to the cytospecies of North
American Chironomus spp. was made (Martin 2009c), but we were unable to make
definitive species identifications. Operational taxonomic units were therefore developed
in order to distinguish among Chironomus larvae exhibiting distinct banding and puffing
49

patterns. In this chapter, we use the term ‘karyotype’ to refer to each distinct operational
taxonomic unit that may represent a unique species.
Identification and designation of operational taxonomic units.-Polytene
chromosomes were viewed at 400X magnification using a Meiji compound microscope to
which was attached a SPOT InsightTM Firewire 2 Megapixel Color Mosaic digital video
camera. Three to six sets of chromosomes per larvae were photographed. Operational
taxonomic units were then distinguished by identifying distinct banding and puffing
patterns of the polytene chromosomes. This was accomplished by individually examining
the photographs from a single individual, identifying characteristic bands and puffs
common to each photograph, and then assigning to this banding and puffing pattern a
unique karyotype label (e.g., ‘karyotype A’). This process was then repeated for a second
individual from the same sample. If the banding and puffing pattern of this individual was
distinct from previously examined individuals, it was also assigned a unique karyotype
label (e.g., ‘karyotype B’). This process was repeated until all individuals had been
assigned to a karyotype. In order for a banding and puffing pattern to be considered
distinct, two or more individuals had to have been assigned to that karyotype. Individuals
that appeared to have a distinct banding and puffing pattern, but for which we did not find
a corresponding match from other field-collected chironomids, were grouped under
‘Miscellaneous’.
Measurements of puffs.-Puff size is proportional to chromosome width, and
chromosome width corresponds to the size of an individual (Bentivegna and Cooper
1993; Chapter Two). Measurements taken from different-sized larvae can be standardized
by measuring both puff size and chromosome size. Previous studies have characterized
puff size in terms of relative width, calculating the relative diameter (Bentivegna and
Cooper 1993; Hudson and Ciborowski 1996). We also used puff diameter as our measure
of size (Appendix I).
Puff size was measured only for individuals identified as having the H karyotype
(Fig. 1). This karyotype exhibited two obvious puffs, one of which appeared to be a NOR;
puff diameter was therefore measured at the centre of this region. Because the number
and location of NOR(s) is species-specific (Michailova 1989), it was not possible to
50

P
B
P Fig. 1. Photograph of the polytene chromosomes of an individual collected from Golden Pond in July 2008 classified as “karyotype H”. P indicates the location of the puff (presumed to be the NOR) from which a measure of size was obtained. B indicates the reference band used as a measure of chromosome size. (400X magnification).
51
52
determine the location of the NOR of other karyotypes with absolute certainty. The
designation of the H-karyotype puff as the NOR was based on previous experience
working with the NOR of Chironomus riparius and by comparing its appearance to other
photographs of chironomid karyotypes containing NOR.
Chromosome size was defined as the diameter of a distinct band adjacent to the
puff (see Fig. 1). Three puff images per larva were measured from the digital images to
the nearest 0.1 µm using UTHSCSA ImageTool version 3.0 (© UTHSCSA 1996-2002).
The mean diameter of the three puffs measured was then calculated for each chironomid.
Statistical analyses
Statistical analyses were performed using STATISTICA version 6.1 (Statsoft,
Inc., Tulsa, OK). Statistical significance of differences in the proportion of taxa found in
reference and OSPM-affected wetlands was tested using a chi-square contingency test.
Statistical significance of differences between wetlands and among sampling dates for
puff size (controlling for chromosome size) was tested using analysis of covariance
(ANCOVA). All reported NOR values are adjusted to a mean chromosome size of 8.3
µm; this was the greatest area of overlap in chromosome size among larvae from different
wetlands. The level of significance was set at p < 0.05 for all tests.
RESULTS
Water chemistry
Table 1 summarizes mean temperature (oC), dissolved oxygen concentration
(mg/L), conductivity (µS), salinity (ppt), and pH of the overlying water in each wetland.
Overall, there were no consistent differences in these parameters among the wetlands
sampled. Characteristic of OSPM-affected wetlands, Natural Wetland and 4-m CT
Wetland had high concentrations of naphthenic acids (45.3 and 23.7 mg/L, respectively).
Comparatively, naphthenic acid concentrations were much lower in the reference
wetlands (Golden Pond, 3.5 mg/L; High Sulphate, 16.5 mg/L; see Appendix III for a
summary of major ion and minor element analyses).

Table 1. Summary of the water chemistry parameters (mean ± S.D.) of the overlying water of each wetland during the sampling period (n = 7 dates between 18 July and 5 August 2008).
Wetland Type Temperature (oC)
Dissolved Oxygen (mg/L)
Conductivity (µm) Salinity (ppt) pH
Golden Pond Reference 21.6 ± 1.9 5.1 ± 2.4 1277 ± 44.0 0.9 ± 0.0 8.3 ± 0.1 High Sulphate Reference 22.2 ± 2.0 3.1 ± 1.2 1907 ± 93.0 1.5 ± 0.2 8.2 ± 0.6
Natural Wetland OSPM 20.5 ± 4.1 5.8 ± 1.2 1750 ± 75.2 1.0 ± 0.1 9.3 ± 0.1 4m-CT OSPM 20.6 ± 3.2 4.9 ± 2.2 3007 ± 195.4 0.7 ± 0.1 8.3 ± 0.1
53
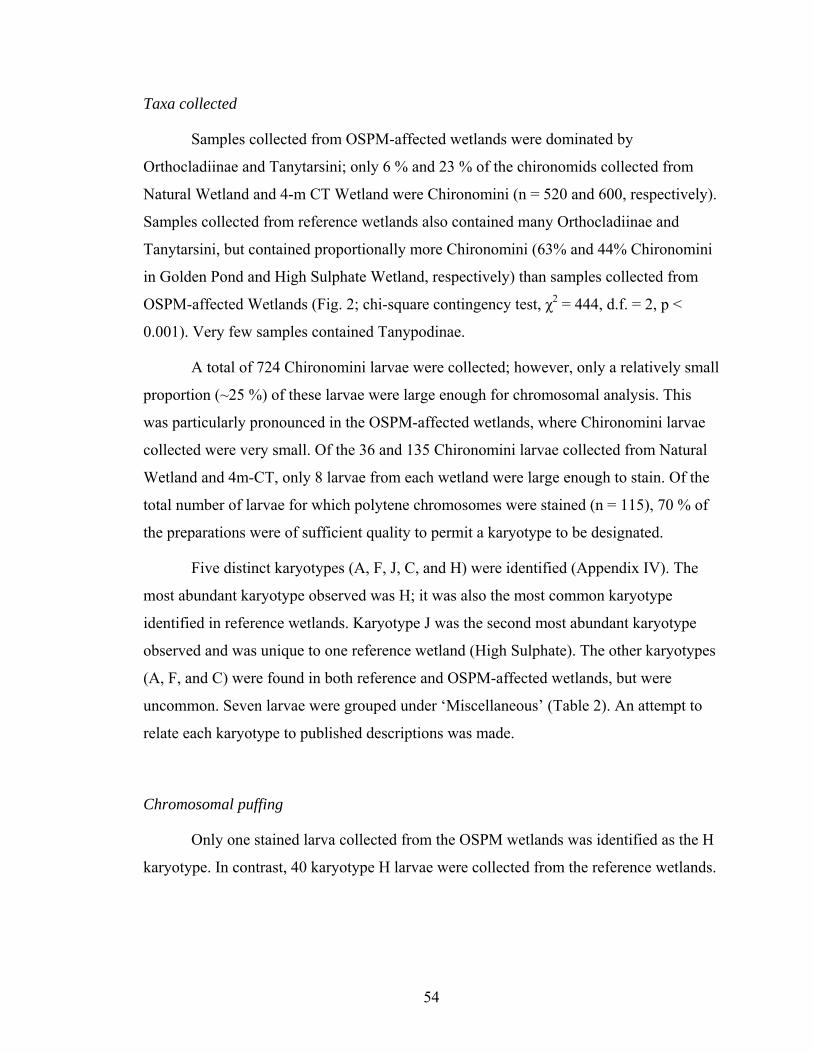
Taxa collected
Samples collected from OSPM-affected wetlands were dominated by
Orthocladiinae and Tanytarsini; only 6 % and 23 % of the chironomids collected from
Natural Wetland and 4-m CT Wetland were Chironomini (n = 520 and 600, respectively).
Samples collected from reference wetlands also contained many Orthocladiinae and
Tanytarsini, but contained proportionally more Chironomini (63% and 44% Chironomini
in Golden Pond and High Sulphate Wetland, respectively) than samples collected from
OSPM-affected Wetlands (Fig. 2; chi-square contingency test, χ2 = 444, d.f. = 2, p <
0.001). Very few samples contained Tanypodinae.
A total of 724 Chironomini larvae were collected; however, only a relatively small
proportion (~25 %) of these larvae were large enough for chromosomal analysis. This
was particularly pronounced in the OSPM-affected wetlands, where Chironomini larvae
collected were very small. Of the 36 and 135 Chironomini larvae collected from Natural
Wetland and 4m-CT, only 8 larvae from each wetland were large enough to stain. Of the
total number of larvae for which polytene chromosomes were stained (n = 115), 70 % of
the preparations were of sufficient quality to permit a karyotype to be designated.
Five distinct karyotypes (A, F, J, C, and H) were identified (Appendix IV). The
most abundant karyotype observed was H; it was also the most common karyotype
identified in reference wetlands. Karyotype J was the second most abundant karyotype
observed and was unique to one reference wetland (High Sulphate). The other karyotypes
(A, F, and C) were found in both reference and OSPM-affected wetlands, but were
uncommon. Seven larvae were grouped under ‘Miscellaneous’ (Table 2). An attempt to
relate each karyotype to published descriptions was made.
Chromosomal puffing
Only one stained larva collected from the OSPM wetlands was identified as the H
karyotype. In contrast, 40 karyotype H larvae were collected from the reference wetlands.
54

Reference OSPM-affected
07/18
/2008
07/21
/2008
07/24
/2008
07/27
/2008
07/30
/2008
08/02
/2008
08/05
/2008
Sampling date
0
20
40
60
80
100
0
20
40
60
80
100
Sampling Date
%
0
20
40
60
80
100
07/18
/2008
07/21
/2008
07/24
/2008
07/27
/2008
07/30
/2008
08/02
/2008
08/05
/2008
%
0
20
40
60
80
100
Fig. 2. Percentage of chironomid larvae collected belonging to each taxon (Tanytarsini/Orthocladiinae, black; Chironomini, white; Tanypodinae, gray) in reference (High Sulphate, top; Golden Pond, bottom) and OSPM-affected wetlands (Natural Wetland, top; 4m-CT, bottom) on seven sampling dates. See Appendix V for sample sizes on which these proportions are based.
55

Table 2. Number of chironomid larvae exhibiting a given karyotype for each wetland.
Karyotype Wetland Type
A C F H J Misc. Golden Pond Reference 1 1 4 18 0 2
High Sulphate Reference 2 4 0 22 15 2 Natural Wetland OSPM 1 1 0 0 0 2
4-m CT OSPM 2 0 2 1 0 1 Total 6 6 6 41 15 7
56

Because only a few individuals of each the A, F, and C karyotypes were collected and the
J karyotype was only found in one wetland, no karyotype-specific comparisons between
reference and OSPM-affected wetlands could be made. However, enough good-quality
preparations of karyotype H were obtained to compare puff size between the two
reference wetlands (Golden Pond and High Sulphate) and among sampling dates within
the reference wetlands.
A total of 106 chromosomes were photographed and measured from larvae
identified as belonging to the H karyotype. Puff size (µm) was significantly positively
related to chromosome size (regression analysis, R2 = 0.41, F1,38 = 26.28, p < 0.001);
larger chromosomes had larger puffs. A test for homogeneity of slopes revealed that this
relationship did not differ between wetlands (Fig. 3; F1,36 = 0.2, p > 0.1). Puff size was
not significantly different between wetlands (analysis of covariance, F1,37 = 0.92, p > 0.1).
Also, puff size within a wetland did not significantly differ among sampling dates
(analysis of covariance; Golden Pond, F2,11 = 1.73, p > 0.1; High Sulphate, F4,15 = 0.95, p
> 0.1). Only sampling dates from which puffs of three or more individuals were measured
were included in the analyses.
DISCUSSION
Chironomids in oil sands constructed wetlands
The taxonomic composition of our samples agreed with previous studies
examining chironomid community composition and abundance in oil sands constructed
wetlands. Chironomini were the dominant taxon in reference wetlands, while Tanytarsini
and Orthocladiinae were the dominant taxa in OSPM-affected wetlands. Whelly (1999)
found that the dominant genera in reference wetlands were Chironomus (tribe
Chironomini) and Tanytarsus (tribe Tanytarsini), while Tanytarsus and Psectrocladius
(Tribe Orthocladiinae) were the dominant genera in OSPM-affected wetlands. Ganshorn
(2002) found that Chironomini density, biomass, and secondary production was lower in
OSPM-affected wetlands than it was in reference wetlands. Tanypodinae, Tanytarsini,
and Orthocladiinae, on the other hand, were found to be unaffected by the presence of
OSPM (Ganshorn 2002). In a study to characterize the zoobenthic community of
57

Chromosome diameter (µm)
0 6 7 8 9 10 11 12
Puff
dia
met
er (µ
m)
0
10
12
14
16
18
20
22
24
Fig. 3. Relationship between puff size and chromosome size for larvae collected from High Sulphate (n = 22; open circles, dashed line) and Golden Pond (n = 18; closed circles; solid line).
58

reference and OSPM-affected wetlands, Leonhardt (2003) found that Tanypodinae,
Tanytarsini, and Orthocladiinae chironomids were characteristic of ‘mature’ (> 7 years
old) OSPM-affected wetlands; these taxa were also characteristic of ‘young’ (≤ 7 years
old) reference wetlands, which suggested the development of a ‘mature’ zoobenthic
chironomid community was delayed in OSPM-affected wetlands relative to reference
wetlands.
The fact that we found very few, and often very small, Chironomini larvae in
OSPM-affected wetlands was not surprising. Chironomini, in particular, do not tolerate
exposure to OSPM very well relative to other taxa such as Derotanypus (Tanypodinae)
and Psectrocladius (Orthocladiinae) (Whelly 1999, Leonhardt 2003, Barr 2009). In both
the laboratory and field, Chironomus larvae exposed to OSPM showed up to a 25 %
reduction in growth rates (Whelly 1999; Ganshorn 2002). Thus, some taxa are clearly
more tolerant of the conditions found in OSPM-affected wetlands than others. Previous
research suggests that some species within a taxa are also more tolerant of OSPM. For
example, undiluted oil sands process water was toxic to laboratory-bred Chironomus
tentans but not to Chironomus riparius (Whelly 1999). Interestingly, Whelly (1999) also
found evidence which suggests that, although OSPM was toxic to a laboratory-bred line
of Chironomus tentans, larvae derived fom the egg masses of an oil sands area wetland
population of Chironomus tentans were relatively tolerant to oil sands process water.
The different composition of taxa present in reference and OSPM-affected
wetlands could either reflect differences in tolerance to the chemical constituents found in
OSPM, or differences between freshwater and saline chironomid assemblages. OSPM-
affected wetlands have conductivity and salinity levels similar to saline lakes and
wetlands in Saskatchewan (e.g., Timms et al. 1986) and British Columbia (e.g., Cannings
and Scudder 1978). These saline wetlands are dominated by Chironominae (Tanytarsus,
Chironomus), Tanypodinae (Derotanypus, Procladius), and Orthocladiinae (Cricotopus),
which are also the predominant taxa found in OSPM-affected wetlands (Whelly 1999;
Leonhardt 2003; Barr 2009). Though both factors are likely playing a role in shaping
chironomid community assemblages, more research is needed to separate the effects of
elevated salinity from the effects of the chemical constituents unique to OSPM.
59

Because many species of chironomids, as well as of other Diptera, are
morphologically indistinguishable at the larval stage (Michailova 1989; Coffmann and
Ferrington 2008), much species diversity may be cryptic, and can only be revealed by
molecular genetic assays or more simply by examining the banding patterns of the
polytene chromosomes. Based on our observations, at least within the genus Chironomus,
there did not appear to be any cryptic species-specific assemblages within reference and
OSPM-affected wetlands; of the five Chironomus karyotypes identified (each one
presumably belonging to a unique species), one was found in samples from only a single
wetland and none were specific to either reference or OSPM-affected wetlands. However,
more extensive sampling to increase the sample size should be conducted before any
conclusions can be made. Further research should therefore be conducted in these
wetlands to determine if cryptic species-specific assemblages are present. One potential
avenue for investigation would be to look at the banding patterns of the polytene
chromosomes of larvae other than those belonging to the genus Chironomus.
NOR size in oil sands constructed wetlands
Preliminary research conducted on the polytene chromosomes of Chironomus and
Derotanypus spp. in constructed wetlands found that NOR size was significantly reduced
in larvae collected from OSPM-affected wetlands relative to reference wetlands with
otherwise similar environmental characteristics (Hum and Ciborowski 2000).
Unfortunately, as a result of the small number and size of Chironomini larvae collected
from OSPM-affected wetlands, we were unable to draw conclusions regarding the effect
of OSPM on NOR size (and thus growth) in our study. Although we obtained suitable
quality stains from seven larvae, no more than two of each larvae belonged to the same
karyotype; ideally, a measure of mean puff size should be obtained from three individuals
in order to calculate a suitable measure of variability.
We did, however, obtain enough samples and measurements of puff size of larvae
belonging to a single karyotype to perform a comparison between the two reference
wetlands. As previous studies have observed, we found that puff size was linearly
proportional to chromosome size (Bentivegna and Cooper 1993; Hudson and Ciborowski
60

1996; Chapter Two). Also as expected, we found that mean puff size was similar in both
reference wetlands and that it did not change over the course of the two week sampling
period. Thus, assuming the puff measured was in fact the NOR, and based on the
assertion that NOR size reflects recent growth (Chapter Two), Chironomini larvae in the
reference wetlands studied were growing at comparable rates. However, this result could
also indicate that NOR size is not variable under natural conditions and does not reflect
chironomid growth in the field. This uncertainty could be resolved by measuring the body
lengths of larvae collected on each sampling date and calculating growth rates in these
wetlands using traditional methods (e.g., the instantaneous growth rate method).
Measuring NOR size in the field
Several factors, specific to working with polytene chromosomes, made obtaining
measures of NOR size from field-collected larvae much more difficult than it was in the
laboratory (pers. obs.);
1. Unlike laboratory experiments, which are typically conducted using a single species,
field-collected samples contain chironomids belonging to several taxa. Chironomid
species richness is among some of the highest for aquatic insects, often reaching 80
species at a single site (Coffmann and Ferrington 2008). Prairie wetlands in Central
Saskatchewan contain 21.3 ± 1.85 (SD) chironomid species (Driver 1977). Although
there are karyological guides to the cytospecies of Bulgarian (Michailova 1989),
Australian (Martin 2009a), New Zealand (Martin 2009b), and North American
(Martin 2009c) chironomids, no cytotaxonomic keys have been developed that can
facilitate identifications by non-experts. Thus, identifying the karyotypes or species of
interest takes time. However, as non-experts we were able to construct our own
operational taxonomic units. While it took time to do, this method proved to be
effective and permitted the identification of five distinct karyotypes, and possibly
more if we include the ‘miscellaneous’ individuals;
2. Chromosomal preparations of larvae collected from the field are generally of poorer
quality than those of larvae bred in the laboratory (Michailova et al. 1985 cited by
Michailova 1989). Although we were able to assign most larvae to a karyotype, the
61

quality of many preparations was poor. In most cases, the banding pattern of the three
largest chromosomes was clear, but the resolution of chromosome IV (the smallest
chromosome) was very poor. Unfortunately, this chromosome is where several puffs,
including the NOR, are often located (Michailova 1989). Had we been able to discern
puffs on chromosome IV of more preparations, NOR from several karyotypes would
have likely been measured;
3. The number and location of NOR(s) is species-specific, with some species having as
many as three (Michailova 1989). Thus, even when a puff is clearly visible,
determining with absolute certainty that it is the NOR is not possible without being
able to consult a cytotaxonomic key or getting verification from an expert. This
problem could potentially be resolved, however, by staining some preparations with
fluorescent probes specific to the NOR (e.g., Planello et al. 2007 developed probes
specific to the ribosomal DNA of Chironomus riparius). Any intensely fluorescent
areas would indicate the location of an NOR, and by comparing images obtained
using fluorescent stain with those stained using aceto-orcein, their location could be
mapped;
4. Although stained polytene chromosome preparations can be obtained from other
genera, including those of Orthocladiinae and Tanypodinae, many species do not
possess good quality chromosomes suitable for cytological analysis (Martin 1979).
Furthermore, even when a species has good quality chromosomes, very small larvae
(< 9 mm) do not stain well (pers. obs.). The genus Chironomus, a member of the
Chironomini, is the most widely studied cytotaxonomically (Martin 1979) and the
most commonly used genus in toxicity studies using puffs as a biomarker of stress. It
is also the only genus in which the NOR has been related to growth (Chapter Two).
Thus, the fact that very few and only very small Chironomini were collected from
OSPM-affected wetlands is in and of itself a problem if the NOR is to be a broadly
useful tool for monitoring stress and measuring growth in oil sands constructed
wetlands; this may also be a problem in other stressed aquatic systems that contain
chironomids. Fortunately, while they were not abundant in the OSPM-affected
wetlands sampled in 2008, they are present; obtaining a large enough sample size may
62

simply be a matter of seasonal timing, among-year variation, locating suitable
microhabitats, or intensifying collection efforts at OSPM-affected wetlands.
Summary, Conclusions, and Recommendations
We examined preparations of polytene chromosomes from larval chironomids
living in two reference and two OSPM-affected constructed wetlands. Although detailed
cytotaxonomic keys were not available, cryptic cytogenetic variation was identified and
expressed as operational taxonomic units. At least five distinct karyotypes (represented by
two or more individuals) were found in one or more of the four wetlands. The
inconsistent quality of the chromosomal preparations made obtaining measures of NOR
size proportionally more difficult, but not impossible. Based on the measures obtained for
one abundant and relatively widespread karyotype, larger chromosomes had
proportionally larger NOR, which supports the need to standardize measurements of NOR
size in both the laboratory and the field. We also found that chironomid NOR size (and
thus presumably growth) was similar in the two reference wetlands studied over the
duration of the two-week sampling period. However, comparisons with OSPM-affected
wetlands could not be made as we did not obtain any measures of NOR size from either
of the two wetlands sampled.
Overall, it was difficult to obtain good quality chromosome preparations and
measures of NOR size in oil sands constructed wetlands. This was in large part due to the
small number and size of the Chironomini larvae collected in these wetlands. While the
polytene chromosomes of Chironomus spp. are well characterized, some Tanypodinae
and Orthocladiinae species also have usable polytene chromosomes (Martin 1979). These
taxa were dominant in all of our samples and future studies may do well to examine
whether or not NOR size in these species can be used as an indicator of stress and
measure of growth.
63

LITERATURE CITED
Barr, L. 2009. Experimental sediment exchanges between natural and constructed wetlands on oil sands leases near Fort McMurray Alberta. M.Sc. Thesis, University of Windsor. Windsor, Ontario, Canada. Bendell-Young, L. I., K. E. Bennett, A. Crowe, C. J. Kennedy, A. R. Kermode, M. M. Moore, A. L. Plant and A. Wood. 2000. Ecological characteristics of wetlands receiving an industrial effluent. Ecological Applications 10:310-322. Benke, A. C. and J. B. Wallace. 1997. Trophic basis of production among riverine
caddisflies: Implications for food web analysis. Ecology 78:1132-1145. Bentivegna, C. S. and K. R. Cooper. 1993. Reduced chromosomal puffing in Chironomus
tentans as a biomarker for potentially genotoxic substances. Environmental Toxicology and Chemistry 12:1001-1011.
Butler, M. G., Kiknadze, II, V. V. Golygina, J. Martin, A. G. Istomina, W. F. Wulker, J. E. Sublette and M. F. Sublette. 1999. Cytogenetic differentiation between Palearctic and Nearctic populations of Chironomus plumosus L. (Diptera, Chironomidae). Genome 42:797-815. Cannings, R. A. and G. G. E. Scudder. 1978. The littoral Chironomidae (Diptera) of saline lakes in British Columbia. Canadian Journal of Zoology 56:1144-1155. Coffman, W. P. and L. Ferrington. 2008. Chironomidae. Pages 635-754 in R. W. Merritt, K.W. Cummins, and M.B. Berg (editors). An Introduction to the Aquatic Insects of North America. 4th Ed., Kendall/Hunt Publishing Co., Dubuque, Iowa. Daly, C. and J. J. H. Ciborowski. 2008. A review of wetland research at Suncor: Re- establishing wetland ecosystems in an oil-sands affected landscape. Proceedings of the 1st International Oil Sands Tailings Conference, Edmonton, AB. Driver, E. A. 1977. Chironomid communities in small prairie ponds: some characteristics and controls. Freshwater Biology 7:121-133. Ganshorn, K.D. 2002. Secondary production, trophic position and potential for
accumulation of polycyclic aromatic hydrocarbons in predatory Diptera in four wetlands of the Athabasca oil sands, Alberta, Canada. M.Sc. Thesis, University of Windsor. Windsor, Ontario, Canada. 285 pp.
Hudson, L. A. and J. J. H. Ciborowski. 1996. Teratogenic and genotoxic responses of larval Chironomus salinarius group (Diptera: Chironomidae) to contaminated sediment. Environmental Toxicology and Chemistry 15:1375-1381.
Hum, P. and J. J. H. Ciborowski. 2000. Effects of oil sands mine-process water on the nucleolar organizer region of chironomids (Diptera). Undergraduate Thesis, University of Windsor. Windsor, Ontario, Canada.
Leonhardt, C. L. 2003. Zoobenthic succession in constructed wetlands of the Fort McMurray oil sands region: Developing a measure of zoobenthic recovery. M.Sc. Thesis, University of Windsor. Windsor, Ontario, Canada. 259 pp.
Kiknadze, I. I., M. G. Butler, K. G. Aimanova, L. I. Gunderina, and J. K. Cooper. 1996. Geographic variation in the polytene chromosome banding pattern of the Holarctic midge Chironomus (Camptochironomus) tentans (Fabricius). Canadian Journal of Zoology-Revue Canadienne De Zoologie 74:171-191.
Kiknadze, I. I., M. G. Butler, K. G. Aimanova, E. N. Andreeva, J. Martin and L. I. Gunderina. 1998. Divergent cytogenetic evolution in nearctic and palearctic
64

65
populations of sibling species in Chironomus (Camptochironomus) Kieffer. Canadian Journal of Zoology-Revue Canadienne De Zoologie 76:361-376. Kiknadze, I.I., M. G. Butler, V. V. Golygina, J. Martin, W. F. Wulker, J. E. Sublette and
M. F. Sublette. 2000. Intercontinental karyotypic differentiation of Chironomus entis Shobanov, a Holarctic member of the C-plumosus group (Diptera, Chironomidae). Genome 43:857-873.
Martin, J. 1979. Chromosomes as tools in taxonomy and phylogeny of Chironomidae (Diptera). Ent. Scand. Suppl. 10:67-74.
Martin, J. 2009a. Australian Chironomus species. Copyright © 1995-2009, The University of Melbourne. Martin, J. 2009b. New Zealand Chironomus species. Copyright © 1995-2009, The University of Melbourne. Martin, J. 2009c. North American cytospecies of the genus Chironomus. Copyright © 1995-2009, The University of Melbourne. Michailova, P. 1989. The polytene chromosomes and their significance to the
systematics and phylogeny of the family Chironomidae, Diptera. Acta Zoologica Fennica 186:1-107.
Oil Sands Wetlands Working Group. 2000. Guideline for wetland establishment on reclaimed oil sands leases. Neil Chymko (Editor) Report # ESD/LM/00-1. Alberta Environment, Environmental Service. Planello, R., J. L. Martinez-Guitarte and G. Morcillo. 2007. Ribosomal genes as early
targets of cadmium-induced toxicity in Chironomus riparius larvae. Science of the Total Environment 373:113-121.
Timms, B. V., U. T. Hammer, and J. W. Sheard. 1986. A study of benthic communities in some saline lakes in Saskatchewan and Alberta, Canada. Internationale Revue der gesamten Hydrobiologie und Hydrographie 71:759-777. Whelly, M. P. 1999. Aquatic invertebrates in wetlands of the oil sands region of
northeast Alberta, Canada, with emphasis on Chironomidae (Diptera). M.Sc. Thesis, University of Windsor, Windsor, Ontario, Canada. 314 pp.
van den Heuvel, M. R., M. Power, M. D. MacKinnon, T. Van Meer, E. P. Dobson and D. G. Dixon. 1999. Effects of oil sands related aquatic reclamation on yellow perch (Perca flavescens). I. Water quality characteristics and yellow perch physiological and population responses. Canadian Journal of Fisheries and Aquatic Sciences 56:1213-1225.

CHAPTER FOUR: GENERAL DISCUSSION AND CONCLUSIONS
The results presented in this thesis have shown that nucleolar organizer (NOR)
size is a significant predictor of a larval chironomid’s recent growth rate under controlled
laboratory conditions (Chapter Two). This finding is particularly important because of its
potential for providing a novel method for measuring chironomid growth rates, and
potentially secondary production, in natural populations.
CHIRONOMID SECONDARY PRODUCTION
In aquatic systems, the secondary production of the benthic macroinvertebrate
community is an important indicator of ecosystem function (Reice and Wohlenberg 1993;
Benke 2009). As a result, numerous studies on secondary production have been
conducted, and several different methods have been developed to estimate it (reviewed by
Waters 1977 and Benke 1996).
In its simplest form, secondary production is the formation of new biomass by an
individual or population over time. Production (P) is calculated as the product of the
mean density (D, individuals m-2) and change in biomass (∆B, g dry mass) over a given
sampling interval:
P = D x ∆B
Often, the secondary production of a population is estimated on an annual basis (g m-2 y-1)
by calculating production over several sampling intervals (spanning a year) and adding
them together. This ultimately requires the collecting and sorting of a very large number
of samples, which makes obtaining an estimate of secondary production a time
consuming and labour intensive process (Waters 1977).
In comparison to other aquatic invertebrates, chironomids often grow very rapidly
(e.g., Benke 1998). Consequently, samples need to be taken as often as every three days
in order to obtain credible estimates of growth (Benke 1984), which makes estimating
chironomid secondary production even more arduous. Further complicating the
estimation of chironomid secondary production is the fact that chironomid
66

populations often have multiple generations per year, and non-recognizable cohorts
(Waters 1977). As a result, non-cohort based methods are more appropriate for estimating
chironomid secondary production, especially when multiple, indistinguishable species
may be involved.
The instantaneous growth rate (IGR) method is a non-cohort based method that
has been increasingly used for estimating chironomid secondary production (e.g.,
Reynolds and Benke 2005). Using the IGR method, secondary production (P – mg m-2
unit time-1) is estimated by calculating the product of the population biomass (B – mg m-
2) and instantaneous growth rate (g – mg d-1);
P = B x g
Because larvae often exhibit taxon-specific and temperature-dependent growth rates (e.g.,
Reynolds and Benke 2005), and age (in days) of field-collected larvae can not be
determined, instantaneous growth rates must be derived independently in the laboratory.
This is typically done by retrieving egg masses from the field and rearing larvae under
conditions specific to the area from which they were collected. Daily instantaneous
growth rates are then calculated using regression analyses of biomass versus time since
hatching. The calculated growth rates are then used in combination with the biomass
estimates of the chironomid population from which the egg masses were collected and
secondary production estimates are obtained.
NOR SIZE AS A SURROGATE MEASURE OF SECONDARY PRODUCTION
Based on the results of Chapter Two, NOR size is a reflection of a chironomid’s
recent growth rate (averaged over a 7-d period); faster growing larvae have larger NOR.
Considering that differences in NOR size and activity are observable in as little as 12 h
following exposure to cadmium (Planello et al. 2007), NOR size likely reflects a
chironomid’s instantaneous growth rate (as recent as 12 h). NOR size could therefore
provide a surrogate measure of instantaneous growth rate for larvae collected in the field
that, combined with a measure of population biomass, could be used to estimate
secondary production using the IGR formula. Using NOR size as a surrogate measure of
instantaneous growth would be desirable for several reasons;
67

1. An estimate of ‘instantaneous’ secondary production could be obtained from a
single field-collected sample. Thus, half as many samples would need to be taken
(current methods require at least two samples be taken in order to obtain a
measure of growth). Given that production sampling and sorting is a very
laborious process, a reduction of this magnitude would be extremely valuable.
2. Considering that NOR function is homologous among species (Pelling and
Beermann 1966), and the polytene chromosomes provide a means for separating
morphologically indistinguishable species, instantaneous growth rates and
secondary production could potentially be calculated on a species by species basis.
3. A laboratory study to calibrate and estimate the instantaneous growth rates for the
conditions specific to each population would not be required. If NOR is a species-
specific or family-specific attribute, once the relationship between NOR size and
growth rate is calibrated, it could be applied to any population.
4. NOR size reflects the growth rate of larvae under conditions prevailing at the time
of collection. The current IGR method involves calculating growth rates under
specific and very static conditions, which may or may not be present throughout
the sampling period.
However, like all methods, using NOR size as a measure of instantaneous growth would
also have limitations;
1. Smaller larvae do not provide suitable preparations for NOR analysis (pers. obs.).
Any estimates of instantaneous growth or secondary production obtained using
this method would therefore exclude very small larvae. Whether or not this would
result in a significant underestimation of production would depend on how much
smaller larvae contribute to the overall production of a given population. In most
instances, smaller individuals make up a relatively small proportion of the overall
biomass of a population. For example, Morin et al. (2004) found a 1-mm sieve
only retained 33 % of the total number of individual invertebrates present in their
benthic samples, but that these organisms accounted for over 90 % of the total
biomass. A possible solution to this problem would be to use NOR size as a
relative measure of growth rate by comparing it among populations; by combining
68

these measurements with measures of population biomass, one could determine
the production of each population relative to another. One could also do a
sensitivity analysis and apply the maximum growth rate observed in the laboratory
or field for smaller invertebrates and calculate how much small larvae contribute
to the overall production of a population.
2. Not all species have good quality chromosomes suitable for analysis (Martin
1979). Therefore, this method could not be used to estimate the instantaneous
growth rates or secondary production of these taxa or species. As shown in
Chapter Three, this could be problematic if community composition and
abundance are very different between sites that are being compared.
3. Although several guides to the cytospecies of Chironomidae exist, no
cytotaxonomic keys have been developed to facilitate identifications by non-
experts. Because the number and location of the NOR(s) is species-specific,
locating and obtaining measures of NOR size for poorly studied species would be
difficult.
4. Chromosomal preparations of larvae collected from the field are generally of
poorer quality than those of larvae bred in the laboratory (Michailova et al. 1985
cited by Michailova 1989). Thus, even when a large number of larvae of suitable
size are collected and stained, NOR measurements can only be obtained from a
small percentage of the preparations (Chapter Three). However, considering NOR
measurements from only six larvae were sufficient to detect statistically
significant differences in the experiments conducted in Chapter Two, one may
only need to collect 10-20 good-sized larvae from a wetland to obtain a precise
measure of mean growth.
Fortunately, all four limitations discussed above could be addressed through further
research. In particular, by conducting studies to improve staining procedures for small
larvae, poorly studied taxa and species, and for field-collected larvae, NOR measurements
could be obtained from a much larger percentage of collected larvae. Future research
should also compare estimates of secondary production obtained using traditional
methods with estimates obtained using NOR size as a measure of instantaneous growth.
69

Quantitative zoobenthic samples were collected for production estimation
contemporaneously with the hand-collected larval collections. However, it was beyond
the scope of this thesis to generate the secondary production estimates necessary to permit
a comparison of both methods. This may be undertaken at a later date.
UTILITY OF THE NOR IN OIL SANDS CONSTRUCTED WETLANDS
The results of Chapter Three demonstrate that polytene chromosomal preparations
can be obtained from field-collected larvae, cryptic cytogenetic variation can be identified
in constructed wetlands through the designation of distinct operational taxonomic units,
and measurements of NOR size can be obtained from field-collected larvae. They also
demonstrate that NOR size, and presumably growth, is similar among larvae collected
from reference wetlands. Field validation of the relationship between NOR size and larval
growth rate could further be addressed by analyzing the samples collected for production
estimation in each wetland.
Unfortunately, as a result of the limitations mentioned above, in particular the
small number and size of Chironomini larvae present, no measurements of NOR size
were obtained from oil sands process material (OSPM) affected wetlands. Thus, the
utility of the NOR in oil sands constructed wetlands may be limited to obtaining measures
of NOR size from Orthocladiinae and Tanytarsini, the dominant taxa present in OSPM-
affected wetlands (Whelly 1999; Ganshorn 2002; Leonhardt 2003). Nonetheless, the
utility of polytene chromosomal preparations in separating morphologically
indistinguishable species, the rapidity and sensitivity with which the NOR responds to
chemical stress, and the finding that NOR size is related to growth, warrant further
developing the use of polytene chromosomes in oil sands constructed wetlands and other
aquatic systems in which chironomids are abundant.
IMPLICATIONS AND CONCLUSIONS
Organismal responses to environmental stress arise from changes at the molecular
and physiological level. Accordingly, several suborganismal measures (e.g., adenylate
70

energy charge, enzyme activities, ion regulation) have been developed as early indicators
of stress, particularly at the individual level (reviewed by Johnson et al. 1993). However,
despite knowledge that linkages exist, few techniques are available for measuring and
extrapolating the molecular and physiological responses to stress across multiple levels of
organization (Parker et al. 1999). The finding that NOR size is related to chironomid
growth validates the assumption that NOR size is an indicator of sublethal stress by
relating it to an ecologically relevant endpoint (growth).
If multiple estimates of NOR size can indeed be extrapolated to estimates of
chironomid larval population production, the NOR may ultimately serve as a sublethal
indicator of stress that permits one to correlate changes in response to stress at the
suborganismal level (NOR size) with changes at the individual (growth rate) and
population (secondary production) level.
71

LITERATURE CITED
Benke, A. C. 1984. Secondary production of aquatic insects. Pages 289-322 in V. H. Resh and D. M. Rosenberg (editors). The Ecology of Aquatic Insects. New York, Praeger Publishers. Benke, A. C. 1996. Secondary production of aquatic insects. Pages 557-578 in F. R. Hauer and B. Lamberti (editors) Methods in Stream Ecology. Academic Press, New York. Benke, A. C. 1998. Production dynamics of riverine chironomids: Extremely
high biomass turnover rates of primary consumers. Ecology 79:899-910. Benke, A. C. 2009. Secondary production as part of bioenergetic theory - contributions from freshwater benthic science. River Research and Applications. Ganshorn, K.D. 2002. Secondary production, trophic position and potential for
accumulation of polycyclic aromatic hydrocarbons in predatory Diptera in four wetlands of the Athabasca oil sands, Alberta, Canada. M.Sc. Thesis, University of Windsor. Windsor, Ontario, Canada. 285 pp.
Johnson, R. K., T. Wiederholm and D. M. Rosenberg. 1993. Freshwater biomonitoring using individual organisms, populations, and species assemblages of benthic macroinvertebrates. Pages 40-158 in D. M. Rosenberg and V. H. Resh (editors). Freshwater Biomonitoring and Benthic Macroinvertebrates. New York, Chapman and Hall. Leonhardt, C. L. 2003. Zoobenthic succession in constructed wetlands of the Fort
McMurray oil sands region: Developing a measure of zoobenthic recovery. M.Sc. Thesis, University of Windsor. Windsor, Ontario, Canada. 259 pp.
Michailova, P. 1989. The polytene chromosomes and their significance to the systematics and phylogeny of the family Chironomidae, Diptera. Acta Zoologica Fennica 186:1-107.
Martin, J. 1979. Chromosomes as tools in taxonomy and phylogeny of Chironomidae (Diptera). Entomologica Scandinavica Supplementum 10:67-74.
Morin, A., J. Stephenson, J. Strike, and A. G. Solimini. Sieve retention probabilities of stream benthic macroinvertebrates. Journal of the North American Benthological Society 23:383-391. Parker, E. D., V. E. Forbes, S. L. Nielsen, C. Ritter, C. Barata, D. J. Baird, W. Admiraal, L. Levin, V. Loeschke, P. Lyytikainen-Saarenmaa, H. Hogh-Jensen, P. Calow and B. J. Ripley. 1999. Stress in ecological systems. Oikos 86:179-184. Pelling, C. and W. Beermann. 1966. Diversity and variation of the nucleolar organizer
regions in chironomids. National Cancer Institute Monographs 23:393-409. Planello, R., J. L. Martinez-Guitarte and G. Morcillo. 2007. Ribosomal genes as early
targets of cadmium-induced toxicity in Chironomus riparius larvae. Science of the Total Environment 373:113-121.
Reynolds, S. K. and A. C. Benke. 2005. Temperature-dependent growth rates of larval midges (Diptera : Chironomidae) from a southeastern US stream. Hydrobiologia 544:69-75. Reice, S. R. and M. Wohlenberg. 1993. Monitoring freshwater benthic macroinvertebrates and benthic processes: Measures for assessement of ecosystem health. Pages 287-305 in D. M. Rosenberg and V. H. Resh (editors).
72

73
Freshwater Biomonitoring and Benthic Macroinvertebrates. New York, Chapman and Hall. Waters, T. F. 1977. Secondary production in inland waters. Advances in Ecological
Research 10:91-164. Whelly, M. P. 1999. Aquatic invertebrates in wetlands of the oil sands region of
northeast Alberta, Canada, with emphasis on Chironomidae (Diptera). M.Sc. Thesis, University of Windsor, Windsor, Ontario, Canada. 314 pp.

APPENDIX I: A COMPARISON OF METHODS FOR MEASURING NUCLEOLAR ORGANIZER SIZE
INTRODUCTION
Several different methods have been developed and employed to measure the size
of chromosomal puffs. Size is used as a surrogate measure of activity since the degree of
puffing is related to the rate of transcription; larger puffs produce more RNA (Pelling
1964 cited by Grossbach 1977; Daneholt et al. 1969). In most studies, puff size has been
measured using a qualitative approach where puffs are arbitrarily scored (e.g., 0
representing no puffing and 4 representing extremely puffed; e.g., Ashburner 1967) or
categorically assigned to classes (class I: puffs nearly or completely collapsed, class II:
puffs significantly reduced or, class III: normal puff size; e.g., Beermann 1971) based on
the degree of puffing (e.g., Santa-Cruz et al. 1978; Michailova 1998; 2001a, b; 2003;
2006; Meregalli et al. 2002).
Quantitative approaches have also been used to measure puff size. Both
Bentivegna and Cooper (1993) and Hudson and Ciborowski (1996) used the following
equation to calculate puff size:
Puff diameter = Puff diameter – Chromosome diameter
Chromosome diameter
Because puff size is proportional to chromosome size (see Chapter Two results),
and larger individuals tend to have larger chromosomes, this equation permits puffs from
different sized larvae to be standardized. Hum (2000) also used diameter as a measure of
puff size, but utilized the statistical procedure of analysis of covariance (ANCOVA) to
remove the effect of chromosome size.
The use of diameter as a measure of puff size has been recently criticized. In their
study examining the relationship between mouthpart deformities and nucleolar organizer
(NOR) size in Chironomus riparius larvae collected from a contaminated river, Meregalli
et al. (2002) measured size by classifying nucleoli as either puffed (active) or not puffed
(inactive). The authors proposed that their qualitative method was “easy and
unequivocal”, and stated that using diameter as a measure of size is biased because
74

the NOR is not a perfectly spherical structure; the value obtained therefore depends on
where and in what direction a measurement is taken. They also suggested that squashing
and flattening a three-dimensional structure results in added variability to the
measurement, confounding the estimation of size (Meregalli et al. 2002).
In this appendix we compare two methods for measuring NOR size (diameter vs.
area). We describe in detail the precautions we took to address the criticisms of Meregalli
et al. (2002) and present results that support the use of diameter as a preferred measure of
NOR size.
METHODS
Salivary gland preparations were obtained from larvae recovered at the end of the
two growth experiments discussed in Chapter Two. For a detailed description of the
staining and squashing procedures see the methods section of that chapter.
In order to address the criticism that puffs are three-dimensional and thus
flattening them confounds the estimation of size, glands were squashed using an
apparatus designed to deliver an equal and even amount of pressure. The “X-Press” (Fig.
1) is a vertical push-and-lock clamp attached to a 17.5 cm x 10 cm stainless steel plate.
Once the glands have been stained, the slide is placed face-up on the press against the
guides and the coverslip is centered below a rubber stopper attached to the clamp (the
rubber prevents the glass coverslip from being scratched). The clamp is then lowered until
it is locked in place and the glands are squashed. The locking mechanism ensures that a
consistent and constant amount of pressure is applied to each slide, standardizing the
amount of flattening that takes place and minimizing its confounding effect. As a result,
any measured differences in puff size between treatments would likely be the result of
differences in the size of the puff.
To address the concern that the NOR is not perfectly spherical, we did two things;
(1) diameter was always measured at the same place (a point equidistant from the two
boundaries of the puff along the chromosome) and in the same direction
75
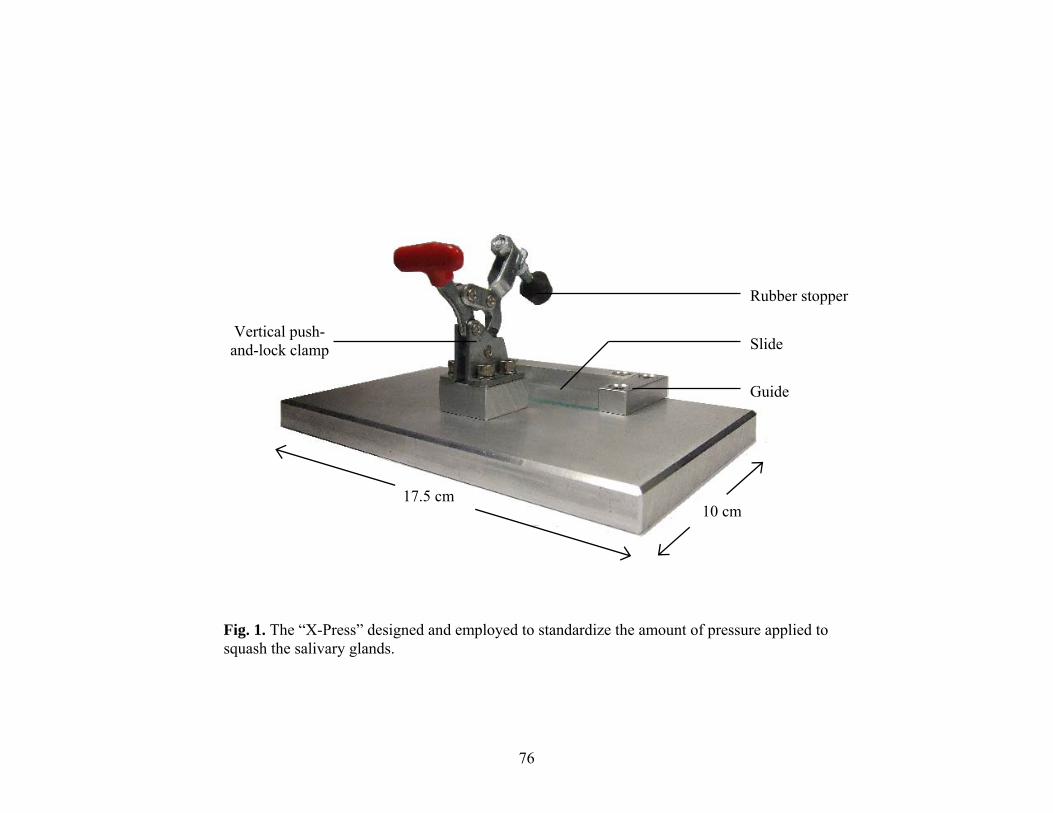
10 cm 17.5 cm
Slide
Guide
Vertical push-and-lock clamp
Rubber stopper
Fig. 1. The “X-Press” designed and employed to standardize the amount of pressure applied to squash the salivary glands.
76

(perpendicular to the length of the chromosome) and; (2) we also measured the area of the
NOR. Area has been used previously as a measure of puff size in Chironomus tentans
(Lezzi et al. 1981), but the two measurements (diameter vs. area) have not been compared
directly. NOR diameter and area were calculated using the same procedure (for a detailed
description of the measuring procedure see the methods section of Chapter Two). NOR
diameter was measured at the centre of the Dd region, whereas NOR area was measured
by tracing the contour of the puff (Fig. 2).
We used regression analysis to determine if our measures of diameter and area
were correlated. In order to determine which method of measurement was more precise
we calculated their coefficients of variation.
RESULTS
In both experiments, regression analysis revealed a highly significant positive
correlation between NOR diameter and NOR area (Fig. 3; R2 = 0.82, F1,30 = 134.5, p <
0.001; R2 = 0.94, F1,14 = 209.6, p < 0.001, for experiments 1 and 2, respectively). Of the
two measures, NOR diameter was the less variable, exhibiting only one-third of the
relative variation of NOR area (Table 1).
DISCUSSION
Our results demonstrate that diameter is an appropriate and precise measure of
NOR size. In both experiments, NOR diameter was a good predictor of NOR area,
showing a strong positive correlation and explaining 82 % and 94 % of the observed
variation in NOR area. Thus, although the NOR is not perfectly spherical, its diameter is a
valid measure of NOR size when the instrument describe above is used. This finding is
important for two reasons; (1) measuring diameter takes half as much time as measuring
area and; (2) diameter is a more objective measure because the edges of the NOR become
indistinct at many locations around its periphery, making it difficult to accurately trace
the full perimeter. Depending on the condition of the preserved specimen and the quality
of the stain, preparation quality varies and delimiting the contour of the NOR requires
77
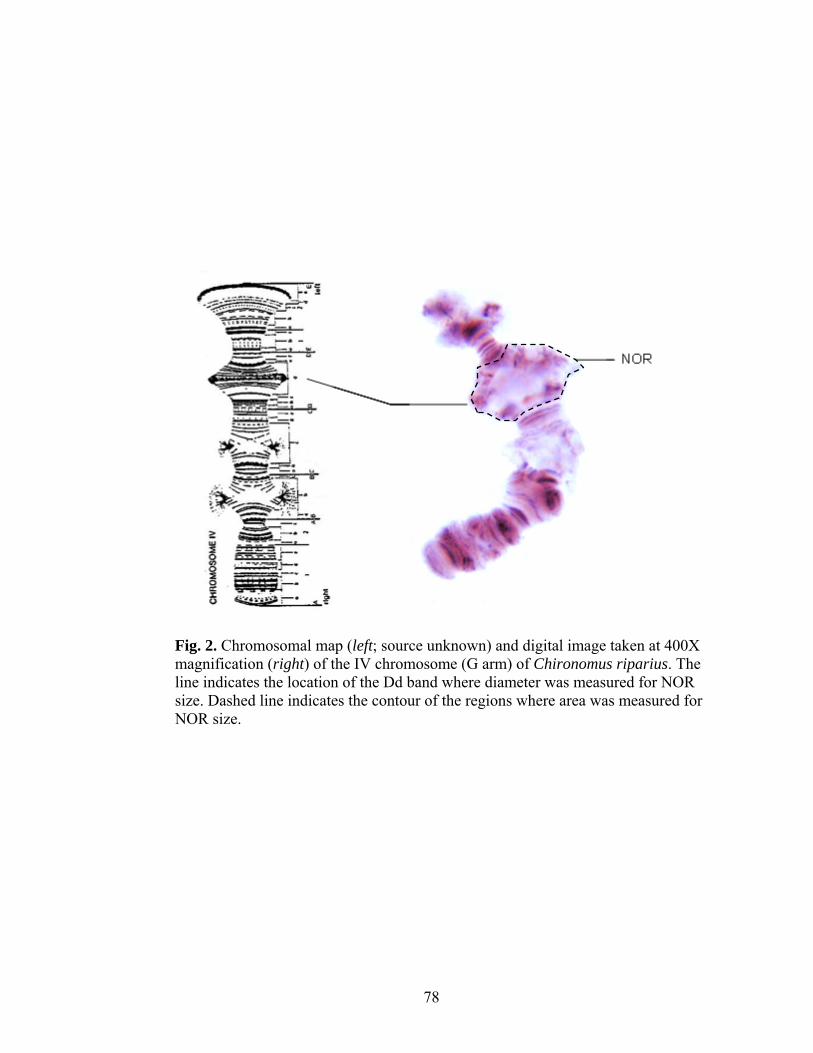
78
Fig. 2. Chromosomal map (left; source unknown) and digital image taken at 400X magnification (right) of the IV chromosome (G arm) of Chironomus riparius. The line indicates the location of the Dd band where diameter was measured for NOR size. Dashed line indicates the contour of the regions where area was measured for NOR size.

NOR diameter (µm)
0 18 20 22 24 26 28 30
NO
R a
rea
(µm
2 )
0
200
250
300
350
400
450
500
NOR diameter (µm)
0 18 20 22 24 26
NO
R a
rea
(µm
2 )
0
200
250
300
350
400
Fig. 3. NOR diameter was a significant predictor of NOR area in both Experiment One (n = 32; top) and Experiment Two (n = 16; bottom).
79

Table 1. Summary statistics including mean and standard deviation (s.d.) of NOR size for both measurements (diameter and area). In order to standardize our comparison, we took the √ of area.
Variable Ration Experiment (n = 16) NOR size Mean s.d. C.V.
Diameter (µm) 20.27 2.27 11.1 % √Area (µm2) 16.32 6.69 40.9 % Uniform Ration Experiment (n = 32)
NOR size Mean s.d. C.V.
Diameter (µm) 22.48 2.65 11.8 % √Area (µm2) 17.45 7.49 42.9 %
80
interpretation. Measuring diameter also requires some interpretation (determining where
the NOR begins and ends). However, this estimate is far less subjective than estimating
the full perimeter of the nucleolus. Furthermore, the results obtained using diameter as a
measure of size were less variable than those obtained using area (as indicated by the
lower coefficient of variation).
We suggest our quantitative method is a more meaningful and useful measure of
NOR size than the qualitative method of Meregalli et al. (2002). One major drawback of
categorically classifying puffs as either puffed (active) or not puffed (inactive) is the well-
established fact that certain puffs do not exhibit an all-or-none response; puff size varies
over a continuous scale (Beermann 1956). For example, while studying changes in the
puffing patterns of the polytene chromosomes of Drosophila melanogaster in response to
heat-shock, Ashburner (1970) found that the size of induced puffs increased
proportionally to the temperature increment. Although Ashburner (1970) also used a
qualitative method for measuring puff size (arbitrarily scoring puffs from 0 to 4 based on
the degree of puffing), a proportional change would not have been detected had he only
classified puffs as puffed or not puffed. Thus, if a qualitative method is to be employed, it
should at least recognize that puffing is a graded response.
Another drawback of using qualitative methods to characterize puff size is their
subjective nature. Although Meregalli et al. (2002) argue that their method is “easy and
unequivocal”, as with most qualitative measures, differences in the criteria used and
biases among observers will make it difficult to standardize and compare results across
studies. However, by using a quantitative method, such as measuring the diameter in the
same direction (perpendicular to the length of the chromosome) and the same place
(equidistant from the edges of the puffing region), puff size can be measured objectively
and consistently. Furthermore, our method is no more time consuming than currently
available qualitative measures, since measurements are obtained using a rapid and
straightforward procedure; chromosomes are viewed under a compound microscope
attached to a digital camera, a digital photograph is taken, and very precise estimates of
diameter are calculated using computer imaging software.
81

In summary, after addressing the criticisms of Meregalli et al. (2002) and in light
of the results presented in this appendix, we suggest using diameter as a measure of NOR
size is an efficient and objective way to quantify puff size. Future studies could further
improve this method by directly calibrating the relationship between NOR diameter and
preribosomal RNA concentration. Although RNA concentration is routinely quantified to
measure puff expression (e.g., Planello et al. 2007), it requires the use of expensive
molecular equipment and intricate molecular techniques. By calibrating the relationship
between NOR diameter and RNA concentration, a measure of puff expression could be
obtained by anyone with access to a compound microscope and a biological stain.
82

LITERATURE CITED
Ashburner, M. 1967. Patterns of puffing activity in salivary gland chromosomes of Drosophila .I. Autosomal puffing patterns in a laboratory stock of Drosophila melanogaster. Chromosoma 21:398-428.
Ashburner, M. 1970. Patterns of puffing activity in salivary gland chromosomes of Drosophila. V. Responses to environmental treatments. Chromosoma 31:356-376.
Beermann, W. 1956. Nuclear differentiation and functional morphology of chromosomes. Cold Spring Harbor Symposia on Quantitative Biology 21:217-
232. Beermann, W. 1971. Effect of alpha-amanitine on puffing and intranuclear RNA synthesis in Chironomus salivary glands. Chromosoma 34:152-167. Bentivegna, C. S. and K. R. Cooper. 1993. Reduced chromosomal puffing in Chironomus
tentans as a biomarker for potentially genotoxic substances. Environmental Toxicology and Chemistry 12:1001-1011.
Hudson, L. A. and J. J. H. Ciborowski. 1996. Teratogenic and genotoxic responses of larval Chironomus salinarius group (Diptera: Chironomidae) to contaminated sediment. Environmental Toxicology and Chemistry 15:1375-1381.
Hum, P. and J. J. H. Ciborowski. 2000. Effects of oil sands mine-process water on the nucleolar organizer region of chironomids (Diptera). Undergraduate Thesis, University of Windsor. Windsor, Ontario, Canada.
Lezzi, M., B. Meyer, and R. Mahr. 1981. Heat-shock phenomena in Chironomus tentans. 1. In vivo effects of heat, over-heat, and quenching on salivary chromosome puffing. Chromosoma 83:327-339..
Meregalli, G., R. Bettinetti, L. Pluymers, A. C. Vermeulen, B. Rossaro, and F. Ollevier. 2002. Mouthpart deformities and nucleolus activity in field-collected Chironomus riparius larvae. Archives of Environmental Contamination and Toxicology 42:405-409.
Michailova, P., J. Ilkova, N. Petrova and K. White. 2001b. Rearrangements in the salivary gland chromosomes of Chironomus riparius Mg. (Diptera, Chironomidae) following exposure to lead. Caryologia 54:349-363.
Michailova, P., J. Ilkova and K. N. White. 2003. Functional and structural rearrangements of salivary gland polytene chromosomes of Chironomus riparius Mg. (Diptera, Chironomidae) in response to freshly neutralized aluminium. Environmental Pollution 123:193-207.
Michailova, P., N. Petrova, J. Ilkova, S. Bovero, S. Brunetti, K. White and G. Sella. 2006. Genotoxic effect of copper on salivary gland polytene chromosomes of Chironomus riparius Meigen 1804 (Diptera, Chironomidae). Environmental Pollution 144:647-654.
Michailova, P., N. Petrova, G. Sella, S. Bovero, L. Ramella, F. Regoli and V. Zelano. 2001a. Genotoxic effects of chromium on polytene chromosomes of Chironomus riparius Meigen 1804 (Diptera, Chironomidae). Caryologia 54:59-71. Michailova, P., N. Petrova, G. Sella, L. Ramella and S. Bovero. 1998. Structural- functional rearrangements in chromosome G in Chironomus riparius (Diptera, Chironomidae) collected from a heavy metal-polluted area near Turin, Italy. Environmental Pollution 103:127-134. Planello, R., J. L. Martinez-Guitarte, and G. Morcillo. 2007. Ribosomal genes as early
83

84
targets of cadmium-induced toxicity in Chironomus riparius larvae. Science of the Total Environment 373:113-121.
Santa-Cruz, M. C., A. Villanueva and J. L. Diez. 1978. Effect of galactose treatment in puffing pattern of Chironomu thummi Balbiani rings. Chromosoma 69:93-100.
Zhimulev, I. F., E. S. Belyaeva, and V. F. Semeshin. 1981. Informational content of polytene chromosome bands and puffs. CRC Critical Reviews in Biochemistry 11:303-340.

APPENDIX II: ENVIRONMENTAL CHARACTERISTICS AND CONSTRUCTION OF THE STUDY WETLANDS
What follows is a description of the construction and formation of the oil sands
wetlands sampled for the study described in Chapter Three. Golden Pond and High
Sulphate Wetland were classified as reference wetlands. Natural Wetland and 4-m CT
Wetland were classified as oil sands process materials (OSPM) affected wetlands.
GOLDEN POND WETLAND (UTM COORDINATES: 462101E 6317245N)
The underlying and surrounding area was filled with mine tailing sand and
covered with 80 cm of clay/loam till. This wetland was constructed in 2000 using wetland
organic matter from the surrounding area as a surface substrate. It consists primarily of
surface water. Water depth is variable and reaches up to 1.5 m in the centre.
HIGH SULPHATE WETLAND (UTM COORDINATES: 466390E 6317229N)
The area surrounding this wetland was reclaimed in 1985 following mining by
Suncor, Inc. It sits on a substrate of lean oil sands. The area was initially filled with saline
sodic overburden and capped with 15 cm of muskeg soil. High Sulphate Wetland formed
opportunistically in 1987 in a depression. The water consists primarily of precipitation
and surface runoff. Average water depth is 60 cm and is relatively uniform across the
wetland.
NATURAL WETLAND (UTM COORDINATES: 469046E 6315329N)
The area in which this wetland is found was initially mined out and reclaimed to
forest (Spruce, Larch and Poplar) in the early 1980’s. Somewhere between 1984 and
1987, the increased settling of sand and seepage of oil sands processed water (OSPW)
from a dyke forming the south wall of Pond 5 (a storage pond) resulted in the formation
of Natural Wetland. Between 1991 and 1995 a series of modifications were made in order
to improve the wetland’s ability to treat OSPW seeping in from the dyke. In 1996,
composite tailings (CT; a specific type of OSPW) water was slowly pumped into the
85

wetland; it was subsequently treated with gypsum to encourage the consolidation of
suspended materials in the water. The sediment consists roughly 10 cm of organic
substrate that has accrued through production of emergent macrophytes overlying a sandy
base. The water consists primarily of dyke seepage (80 %) and surface runoff (20 %)
(Golder Associates Ltd. 2002). Water depth is relatively constant across the wetland,
reaching a maximum depth of 40 cm.
4-M CT WETLAND (UTM COORDINATES: 467777E 6316529N)
This wetland was constructed in the winter of 2000, along two other
interconnected wetlands, in order to examine the suitability of using composite tailings in
wetland reclamation (Daly et al. 2009). The wetland is filled with 4 m of consolidated
tailings (CT) and is uncapped, except for two small peninsulas consisting of 20-30 cm of
stockpiled muskeg. The water consists primarily of water rising out of the CT as it
consolidates, and OSPW which flows into 4-m CT from an adjacent wetland which
receives water directly from Pond 5. Water depth is uniform across the wetland and is
approximately 25 cm.
LITERATURE CITED
Golder Associates Ltd. 2002. Wetland study sites associated with oil sands research and monitoring. 022-2203. 96 pp.
86

Fig. 1. Photographs of Golden Pond in May 2008 (top) and July 2008 (bottom). Photographs by Joshua P. Martin.
87

Fig. 2. Photographs of High Sulphate Wetland in May 2008 (top) and July 2008 (bottom). Photographs by Joshua P. Martin.
88

Fig. 3. Photographs of Natural Wetland in May 2008 (top) and July 2008 (bottom). Photographs by Joshua P. Martin.
89

90
Fig. 4. Photographs of 4-m CT Wetland in May 2008 (top) and July 2008 (bottom). Photographs by Joshua P. Martin.

APPENDIX III: WATER CHEMISTRY OF STUDY THE WETLANDS – NAPHTHENIC ACIDS, MAJOR ION, AND MINOR ELEMENTS ANALYSES
Wetland Sampling Date pH Conductivity (µS/cm)
Temp (oC)
DO [ ] (mg/L)
Naphthenic Acids (mg/L)
NH4 (mg/L)
Na (mg/L)
Golden Pond July 18th, 2008 8.14 1745 21.7 7.0 3.7 0.34 208 Golden Pond August 8th, 2008 8.83 1680 23.2 3.4 0.01 225 High Sulphate July 18th, 2008 9.03 2890 23.0 12.6 17.8 0.01 408 High Sulphate August 8th, 2008 7.64 2980 23.5 15.2 0.01 437
Natural Wetland July 18th, 2008 9.55 1166 27.4 11.7 46.5 0.57 269 Natural Wetland August 8th, 2008 9.11 1242 20.7 44.1 0.56 292
4m-CT July 18th, 2008 8.27 1927 24.4 4.7 25.1 0.23 332 4m-CT August 8th, 2008 8.25 1953 20.4 22.3 0.22 326
Wetland Sampling Date K (mg/L)
Mg (mg/L)
Ca (mg/L)
F (mg/L)
Cl (mg/L)
SO4 (mg/L)
CO3 (mg/L)
HCO3 (mg/L)
Alkalinity (CaCO3)
Golden Pond July 18th, 2008 5.3 57.9 142 BDL 45.0 783 BDL 221 181 Golden Pond August 8th, 2008 1.1 57.6 115 BDL 38 746 BDL 163 134 High Sulphate July 18th, 2008 13.6 118.0 166 BDL 3.1 1710 BDL 127 104 High Sulphate August 8th, 2008 15.9 118 200 BDL 4.4 1590 BDL 239 196
Natural Wetland July 18th, 2008 8.7 9.4 11.4 1.2 18.0 239 39 347 349 Natural Wetland August 8th, 2008 11.9 14.1 19.4 1.3 17 204 37 504 475
4m-CT July 18th, 2008 12.0 62.7 58.8 BDL 44.0 469 0 672 551 4m-CT August 8th, 2008 13.5 58.5 83.3 BDL 43 595 16 512 446
BDL = Below detectable limits
91

Wetland Sampling Date Total Cations (mg/L)
Total Anions (mg/L)
Cation/Anion Na/Cl (Ca+Mg)
/ HCO3 Na /
(Ca+Mg) Al
(mg/L) Golden Pond 18-Jul-08 21.1 21.2 1.00 7.13 3.29 0.76 BDL Golden Pond 08-Aug-08 20.4 19.3 1.06 9.14 3.95 0.93 BDL
High Sulphate 18-Jul-08 36.2 37.8 0.96 203.1 8.71 0.98 BDL High Sulphate 08-Aug-08 39.2 37.2 1.06 153.3 5.06 0.96 BDL
Natural Wetland 18-Jul-08 13.3 12.5 1.06 23.1 0.19 8.64 1.5 Natural Wetland 08-Aug-08 15.1 14.2 1.07 26.5 0.23 5.92 0.6
4m-CT 18-Jul-08 22.9 22.0 1.04 11.6 0.74 1.77 BDL 4m-CT 08-Aug-08 23.6 22.5 1.05 11.7 1.01 1.57 BDL
Wetland Sampling Date B (mg/L)
Ba (mg/L)
Cd (mg/L)
Co (mg/L)
Cr (mg/L)
Cu (mg/L)
Fe (mg/L)
Li (mg/L)
Mn (mg/L)
Golden Pond July 18th, 2008 0.13 BDL BDL BDL BDL BDL BDL BDL BDL Golden Pond August 8th, 2008 0.13 BDL BDL BDL BDL BDL BDL BDL BDL
High Sulphate July 18th, 2008 0.84 BDL BDL BDL BDL BDL BDL BDL BDL High Sulphate August 8th, 2008 0.93 BDL BDL BDL BDL BDL BDL BDL BDL
Natural Wetland July 18th, 2008 2.17 BDL BDL BDL BDL BDL 1.7 BDL BDL Natural Wetland August 8th, 2008 2.46 BDL BDL BDL BDL BDL 0.9 BDL BDL
4m-CT July 18th, 2008 1.76 BDL BDL BDL BDL BDL 0.3 BDL BDL 4m-CT August 8th, 2008 1.73 BDL BDL BDL BDL BDL 0.3 BDL BDL
BDL = Below detectable limits
92

93
Wetland Sampling Date Mo (mg/L)
Ni (mg/L)
Pb (mg/L)
Sb (mg/L)
Se (mg/L)
Si (mg/L)
Sr (mg/L)
Ti (mg/L)
V (mg/L)
Golden Pond July 18th, 2008 BDL BDL BDL BDL BDL 0.4 0.79 BDL BDL Golden Pond August 8th, 2008 BDL BDL BDL BDL BDL 0.5 0.8 BDL BDL High Sulphate July 18th, 2008 BDL BDL BDL BDL BDL 0.6 1.91 BDL BDL High Sulphate August 8th, 2008 BDL BDL BDL BDL BDL 0.6 2.2 BDL BDL
Natural Wetland July 18th, 2008 0.4 BDL BDL BDL BDL 8.5 0.28 BDL BDL Natural Wetland August 8th, 2008 0.3 BDL BDL BDL BDL 6.1 0.5 BDL BDL
4m-CT July 18th, 2008 BDL BDL BDL BDL BDL 7.2 0.82 BDL BDL 4m-CT August 8th, 2008 BDL BDL BDL BDL BDL 6.4 1.0 BDL BDL
Wetland Sampling Date Zn (mg/L)
Zr (mg/L)
Golden Pond July 18th, 2008 BDL BDL Golden Pond August 8th, 2008 BDL BDL
High Sulphate July 18th, 2008 BDL BDL High Sulphate August 8th, 2008 BDL BDL
Natural Wetland July 18th, 2008 BDL BDL Natural Wetland August 8th, 2008 BDL BDL
4m-CT July 18th, 2008 BDL BDL 4m-CT August 8th, 2008 BDL BDL
BDL = Below detectable limits

APPENDIX IV: POLYTENE CHROMOSOME KARYOTYPES OF CHIRONOMUS LARVAE COLLECTED FROM THE STUDY WETLANDS
Fig. 2. Karyotype A (400X magnification). Photograph of the polytene chromosomes of a chironomid larva collected from Natural Wetland in July 2008. Numbers indicate characteristic bands and/or banding patterns. P = puff. Photograph by Joshua Martin.
94

Fig. 2. Karyotype C (400X magnification). Photograph of the polytene chromosomes of a chironomid larva collected from Natural Wetland in July 2008. Numbers indicate characteristic bands and/or banding patterns. P = puff. C = centromere. Photograph by Joshua Martin.
95

Fig. 3. Karyotype F (400X magnification). Photograph of the polytene chromosomes of a chironomid larva collected from 4-m CT in July 2008Numbers indicate characteristic bands and/or banding patterns. P = puff. Photograph by Joshua Martin.
96

Fig. 4. Karyotype H (400X magnification). Photograph of the polytene chromosomes of a chironomid larva collected from Golden Pond Wetland in July 2008. Numbers indicate characteristic bands and/or banding patterns. P = puff. Photograph by Joshua Martin.
97

98
Fig. 5. Karyotype J (400X magnification). Photograph of the polytene chromosomes of a chironomid larva collected from High Sulphate Wetland in July 2008. Numbers indicate characteristic bands and/or banding patterns. P = puff. Photograph by Joshua Martin.

APPENDIX V: RAW DATA – CHIRONOMID LARVAE SORTED BY TAXON
Wetland Name Date Number of Chironomini
Number of Tanypodinae
Number of Tanytarsini/ Orthocladiinae Total
Golden Pond July 18th, 2008 27 0 25 52 Golden Pond July 21st, 2008 20 5 7 32 Golden Pond July 24th, 2008 34 0 23 57 Golden Pond July 27th, 2008 25 1 16 42 Golden Pond July 30th, 2008 40 0 25 65 Golden Pond Aug. 2nd, 2008 62 0 29 91 Golden Pond Aug. 5th, 2008 46 0 15 61 High Sulphate July 18th, 2008 0 1 11 12 High Sulphate July 21st, 2008 31 6 13 50 High Sulphate July 24th, 2008 27 10 26 63 High Sulphate July 27th, 2008 26 21 27 74 High Sulphate July 30th, 2008 58 8 64 130 High Sulphate Aug. 2nd, 2008 42 1 30 73 High Sulphate Aug. 5th, 2008 115 3 50 168
Natural Wetland July 18th, 2008 0 0 55 55 Natural Wetland July 21st, 2008 0 1 52 53
Natural Wetland July 24th, 2008 1 2 55 58 Natural Wetland July 27th, 2008 2 4 69 75 Natural Wetland July 30th, 2008 14 1 76 91 Natural Wetland Aug. 2nd, 2008 12 0 84 96 Natural Wetland Aug. 5th, 2008 7 0 85 92
4m-CT July 18th, 2008 6 0 50 56 4m-CT July 21st, 2008 12 3 36 51 4m-CT July 24th, 2008 41 3 44 88 4m-CT July 27th, 2008 30 3 54 87 4m-CT July 30th, 2008 25 8 65 98 4m-CT Aug. 2nd, 2008 10 3 95 108 4m-CT Aug. 5th, 2008 11 2 99 112
99

VITA AUCTORIS
NAME: Joshua P. Martin PLACE OF BIRTH: Chatham, Ontario YEAR OF BIRTH: 1985 EDUCATION École Secondaire de Pain Court, Pain Court
1999-2003
University of Windsor, Windsor, Ontario
2003-2007 B.Sc. University of Windsor, Windsor, Ontario
2007-2010 M.Sc.
100