
the Nuclear Fuel Market- Post Fukushima - Nomura€¦ · The Nuclear Fuel Market-Post Fukushima ......
38
The Nuclear Fuel Market- Post Fukushima R. Gene Clark, Chief Executive Nomura Asia Equity Forum 2011 Singapore June 14, 2011
Transcript of the Nuclear Fuel Market- Post Fukushima - Nomura€¦ · The Nuclear Fuel Market-Post Fukushima ......

The Nuclear Fuel Market-Post Fukushima
R. Gene Clark, Chief Executive
Nomura Asia Equity Forum 2011
Singapore
June 14, 2011

2
Uranium Processing
“Enriched UF6”
“Natural” UF6 (uranium hexafluoride)
U3O8 or Yellow Cake
Uranium has to be further
processed to become
nuclear fuel.
The enrichment stage has
variable economic
efficiency, creating a
substitution factor of
electricity for uranium.

Nuclear Fuel Costs At Spot Prices
This fuel cost still represents only a small part of total electricity cost and are
rolled into the generating cost over the course of several years
2002 2004 2006 June 2007 2008 2010 YTD 2011
0
2
4
6
8
10
12
14
16
18US$/MWh
Other
Enrichm ent
UF6 Conversion
U3O8 ©2011-TradeTech

4
Topics
Uranium Market
Enrichment Market
Overall Market Conclusions

5
* TradeTech’s NUEXCO Exchange Value through 2009; TradeTech’s weekly Spot Price Indicator for 2010-2011YTD
** TradeTech’s Long-Term Price Indicator for U3O8
Jan 2
004
Jan 2
005
Jan 2
006
Jan 2
007
Jan 2
008
Jan 2
009
01/0
1/10
03/1
2/10
05/2
8/10
07/3
1/10
10/0
8/10
12/1
7/10
02/2
8/11
$0
$20
$40
$60
$80
$100
$120
$140US$/Pound U3O8
Spot Price*
Long-Term Price**
2004-2009 By Month 2010+ By Week
©2011-TradeTech
Uranium Prices in 2010+
Average Spot Price for
2010 is $46.71
Long-Term Price began to
climb after summer 2010, but in
light of Fukushima the price
has fallen slightly.
Spot Prices climbed significantly in the
second half of 2010, but began gradually
declining in January and dropped
significantly after the Fukushima
incident.

6
Uranium Market
Recent Developments Impacting Price
Uranium Demand Outlook
Uranium Supply Outlook
Price Outlook

Recent Developments…
2010 had the largest spot volume in history
of market; third year in a row of high volume
Uranium prices were low in 2009 and mid-
2010, but recovered later in 2010 through the
beginning of the year 2011
Excess US Government uranium stocks still
overhang the market, with announcements of
continued sales
7

…Recent Developments(post-Fukushima)
Incident at Fukushima Daiichi plant following earthquake/tsunami on March 11th
Germany announces immediate shut down of 7 older nuclear units and reevaluation of future plans to extend the lives of operating nuclear plants
China announces reassessment of safety standards for all future licensing of plants
8
9
How Does The Uranium Market Work?
Has been described as a very immature
“horse-trading” market, and is definitely a
boutique market
Market reporters like TradeTech publish
price indicators
No open exchange like LME

10
Primary and Secondary Supplie(r)s
Secondary supply is very large (40%)
A few producers control primary supply
0
10
20
30
40
50
Thousand tU
0
20
40
60
80
100
120
140
Million Pounds U3O8
Cameco
Kazatomprom
Rio TInto
AREVA
ARMZ
BHP BillitonNavoi
Other
Pu, U Recycling
Russian Stocks
Enrichment Tails StrippingU.S. DOE/USEC Stocks
US HEU
Russian Nuclear Weapons
Primary Supply Secondary Supply
Uranium One
Paladin

11
Current Uranium Supply Sources and Markets
Primary
Supply
= 69%
Secondary
Supply= 31%
Spot
Market= 13%
Longer-Term
Market
= 87%
6% 7%
63% 24%
Year
2010

Uranium Spot Volume By Buyer Type
12
2004 2005 2006 2007 2008 2009 2010 2011 YTD
0
10
20
30
40
50Million Pounds U3O8
Utility
Trader
Producer
Processor
Investor ©2011-TradeTech
Investors now have a major presence
and influence in the spot uranium market!
Physical traders have been
market players since the
mid-1980s.
Rising uranium prices
attracted a new class of spot
market participant: Financials
(physical investor/speculator).
1st Investor Activity
in 2004

Spot Volume By Buyer/Seller Type
13
Buyer Seller Buyer Seller Buyer Seller Buyer Seller0
10
20
30
40
50Million Pounds U3O8
Utility
Trader
Producer
Processor
Investor©2011-TradeTech
2008
2009
2010
2011 YTD
Investors still have a major presence, but the
financial crisis has lessened their buying interest/ability.
Investor/speculators
were net sellers in
2008, for the first
time.

14
Uranium Market
Developments in 2009 Impacting Price
Uranium Demand Outlook
Uranium Supply Outlook
Price Range Forecast

Nuclear Power Worldwide
Nuclear Power Units*
s
439 Operating
62 Under Construction
~150 Planned
~320 Proposed
Large existing base + growth from nuclear renaissance
Nuclear energy is a growth industry
15
*WNA April 2011 data

China MainlandIndia
KoreaJapan
RussiaUSA
FranceTaiwanCanada
IranUkraine
United Arab EmiratesSouth Africa
FinlandItaly
ArgentinaBrazil
Czech RepublicNetherlands
BelarusBulgaria
IndonesiaRomaniaSweden
PakistanSlovakia
LithuaniaMexico
BelgiumHungarySlovenia
SwitzerlandArmenia
SpainUK
Germany
0 10 20 30 40 50-10
*GW e To Be Added From 2008-2020
Nuclear Capacity GrowthWorld Nuclear Association Reference Case
Largest regional growth area: Asia
China’s growth
exceeds that of the
next highest 4
combined!
Following
Fukushima
accident Germany
likely to cancel
nuclear, UK?
16

17
Uranium Market
Developments in 2009 Impacting Price
Uranium Demand Outlook
Uranium Supply Outlook
Price Range Forecast

Current and Projected Uranium by Country
18
KazakhstanAustralia
CanadaRussia
NamibiaNigerUSA
South AfricaUzbekistan
ChinaMongolia
IndiaRomaniaUkraineMalawi
BrazilSpain
ArgentinaPakistan
Czech RepFrance
0 5 10 15 20 25 30 35
Thousand tU
0 10 20 30 40 50 60 70 80 90
Million Pounds U3O8
2010 Historical
2020 Potential
©2011-TradeTech

2010+ Uranium Supply Developments
Kazakhstan continues growth as new #1 producer
Paladin Energy initiates production in Malawi
BHP Billiton accident at Olympic Dam
ERA announces extension of shut-down at Ranger operations in northern Australia
McClean Lake Mill shut down in June 2010, due to lack of ore to process
Cameco continues remediation at Cigar Lake
Pace of exploration slows significantly
19
20
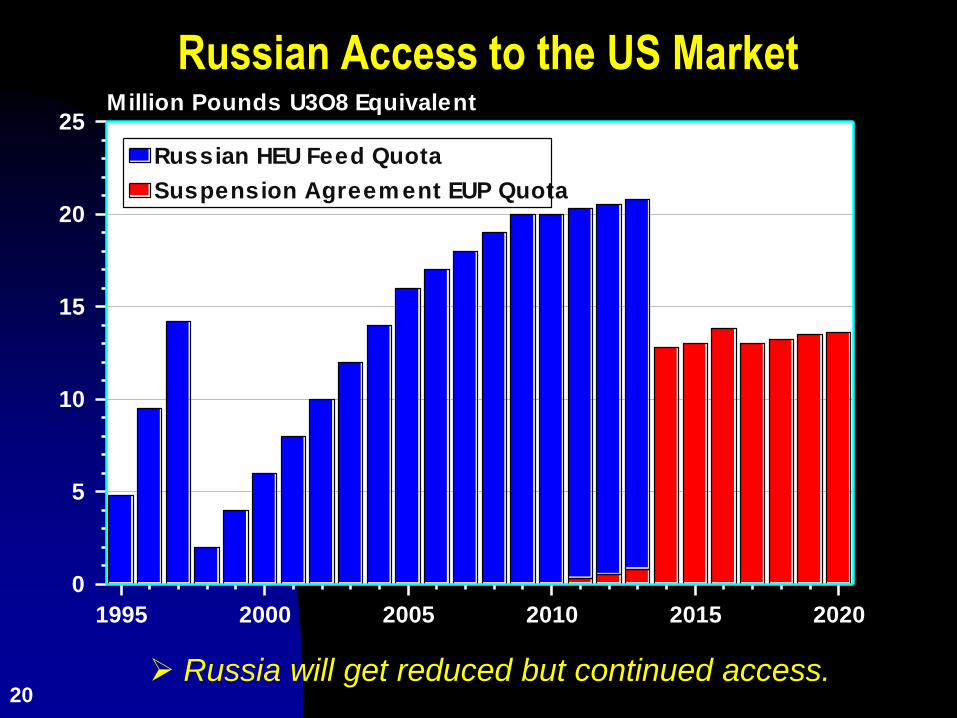
Russian Access to the US Market
Russia will get reduced but continued access.
1995 2000 2005 2010 2015 2020
0
5
10
15
20
25Million Pounds U3O8 Equivalent
Suspension Agreem ent EUP Quota
Russian HEU Feed Quota
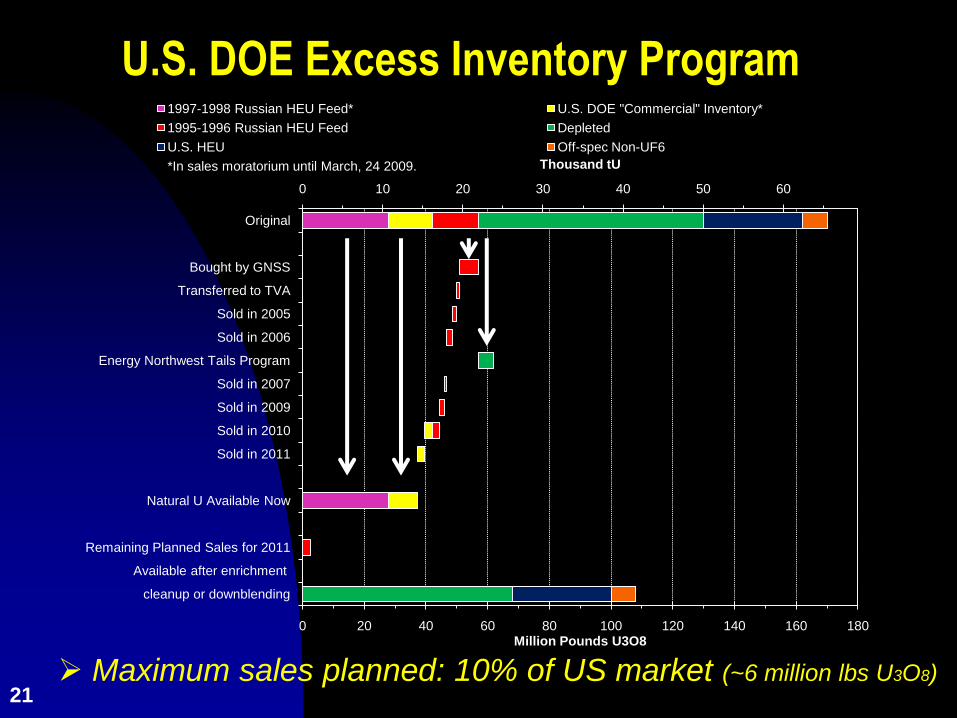
0 10 20 30 40 50 60
0 20 40 60 80 100 120 140 160 180
cleanup or downblending
Available after enrichment
Remaining Planned Sales for 2011
Natural U Available Now
Sold in 2011
Sold in 2010
Sold in 2009
Sold in 2007
Energy Northwest Tails Program
Sold in 2006
Sold in 2005
Transferred to TVA
Bought by GNSS
Original
Thousand tU
Million Pounds U3O8
1997-1998 Russian HEU Feed* U.S. DOE "Commercial" Inventory*
1995-1996 Russian HEU Feed Depleted
U.S. HEU Off-spec Non-UF6
*In sales moratorium until March, 24 2009.
U.S. DOE Excess Inventory Program
21 Maximum sales planned: 10% of US market (~6 million lbs U3O8)

2005 2010 2015 2020 2025
0
100
200
300
400
Million Pounds U3O8
0
20
40
60
80
100
120
140
160
Thousand tU
WNA 2009 Requirem ents
Secondary Sources
Currently Operating
Low er Case World Supply
Reference Case
Upper Case
Demand vs. Existing Supply Sources
40-80 million pounds U3O8 new production needed
(Reference Demand Case)
Production from new sources
needed, especially starting in 2014
Supply from “secondary” sources.
Supply from currently producing
“primary” U3O8 mines.
The world needs new
uranium mines!
22
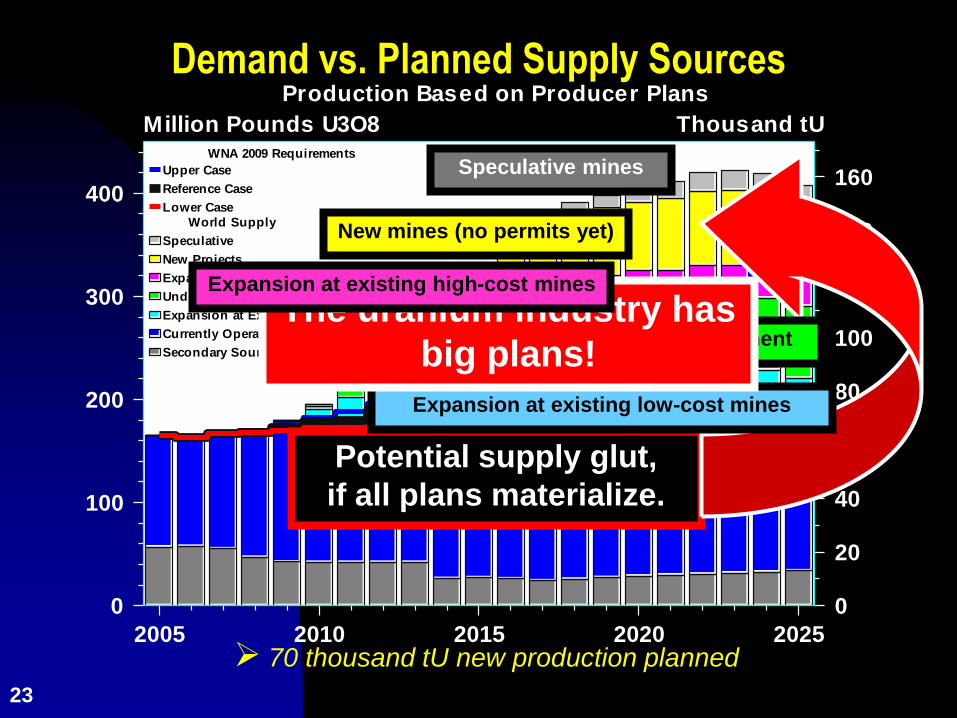
2005 2010 2015 2020 2025
0
100
200
300
400
Million Pounds U3O8
0
20
40
60
80
100
120
140
160
Thousand tUWNA 2009 Requirements
Secondary Sources
Currently Operating
Expansion at Existing Low-Cost Facilities
Under Active Development
Expansion at Existing High-Cost Facilities
New Projects
Speculative
Lower Case
World Supply
Reference Case
Upper Case
Production Based on Producer Plans
Demand vs. Planned Supply Sources
70 thousand tU new production planned
Potential supply glut,
if all plans materialize.
Expansion at existing low-cost mines
Under active developmentThe uranium industry has
big plans!
Expansion at existing high-cost mines
New mines (no permits yet)
Speculative mines
23

2005 2010 2015 2020 2025
0
100
200
300
400
Million Pounds U3O8
0
20
40
60
80
100
120
140
160
Thousand tUWNA 2009 Requirements
Secondary Sources
Currently Operating
Expansion at Existing Low-Cost Facilities
Under Active Development
Expansion at Existing High-Cost Facilities
New Projects
Speculative
Lower Case
World Supply
Reference Case
Upper Case
Demand vs. Deferred Supply Sources
Looming supply tightness,
especially in 2014-2017
Uranium supply will be
driven by price evolution
and financing availability!
Assuming several more
years of credit crunch and
depressed prices …
24

25
World Uranium Ore Quality
Source: CRU Strategies New uranium sources will be increasingly costly to produce.

26
The Major Current Suppliers
Kazatomprom: Kazakh government company
Cameco: Canadian company traded as CCO.TO
AREVA: French conglomerate 4% publicly traded
on NYSE Euronext
Rio Tinto (Energy Resources of Australian-ASX:
ERA)
ARMZ: Russian government company
Uranium One: Traded as UUU.TO on TSX
Navoi: Uzbek government company
BHP Billiton: Major mining company
Paladin: Traded as PDN on ASX

27
Uranium Market
Developments in 2010 Impacting Price
Uranium Demand Outlook
Uranium Supply Outlook
Price Range Forecast

Spot Price vs. Demand & Supply
28
Jan 04 Jan 05 Jan 06 Jan 07 Jan 08 Jan 09 Jan 10 Jan 11
0
5
10
15
0
50
100
150
Actual Spot Price*
Active Supply
Active Demand
Million Pounds U3 O8 U.S. Dollars per Pound U3O8
* TradeTech’s NUEXCO Exchange Value
©2011-TradeTech
Contrary to popular
belief, the uranium spot
market price DOES reflect
fundamental supply and
demand.

Jan 04Jan 05Jan 06Jan 07Jan 08Jan 09Jan 10Jan 11Jan 12Jan 13
0
5
10
Million Pounds U3O8
0
20
40
60
80
100
120
140U.S. Dollars per Pound U3O8
Actual Price
Actual Activ e Supply
Proj ected Activ e Supply
Activ e Demand
Proj ected Demand
©2011-TradeTech
Projected Spot Market
29
Recovery of spot price depends
on duration/extent of the credit
crunch and drawdown of utility
inventories
Assuming moderate supply and
demand for the next few years…
With continued moderate interest/ability
in the investor segment (low demand),
price could stay in the range of $40-60
for several years.
Uranium prices could recover faster,
with any combination of rekindled buyer
interest in the investor segment, utilities
buying for inventory, or producer
purchases due to production problems:
prices could then rebound to above $80
by early 2011

Conclusions
2009 -- the halt of the fall in spot prices, but downward pressure continued on the long-term price.
Uranium still not traded on an open exchange, in spite of efforts in the past few years
Next 2 years -- prices to stay in the $40-60 range (spot) and maybe $55-70 (long-term), unless a major supply event occurs
Growth in world nuclear power usage projected (especially Asia), with two major non-production supplies ending
Expansion of uranium enrichment capacity will tend to dampen demand growth for uranium, as enrichment substitutes for uranium on the margin.
30

31
Enrichment Market

32
Messages
The supply industry is in a technology transition
The USA is the enrichment battleground
Russia is the “500-pound gorilla”
Trade restrictions continue to distort the market
Centrifuge technology will dictate uranium
consumption
There may be “life after death” for old diffusion

33
The Major Suppliers
Rosatom: The Russian nuclear conglomerate;
output marketed by Techsnabexport
AREVA: The French nuclear conglomerate; 4%
publicly traded on NYSE Euronext
Urenco: German/Netherlands/UK joint venture
USEC Inc: U.S. company publicly traded as
NYSE:USU
CNNC: Chinese nuclear company; some output
marketed by CNEIC
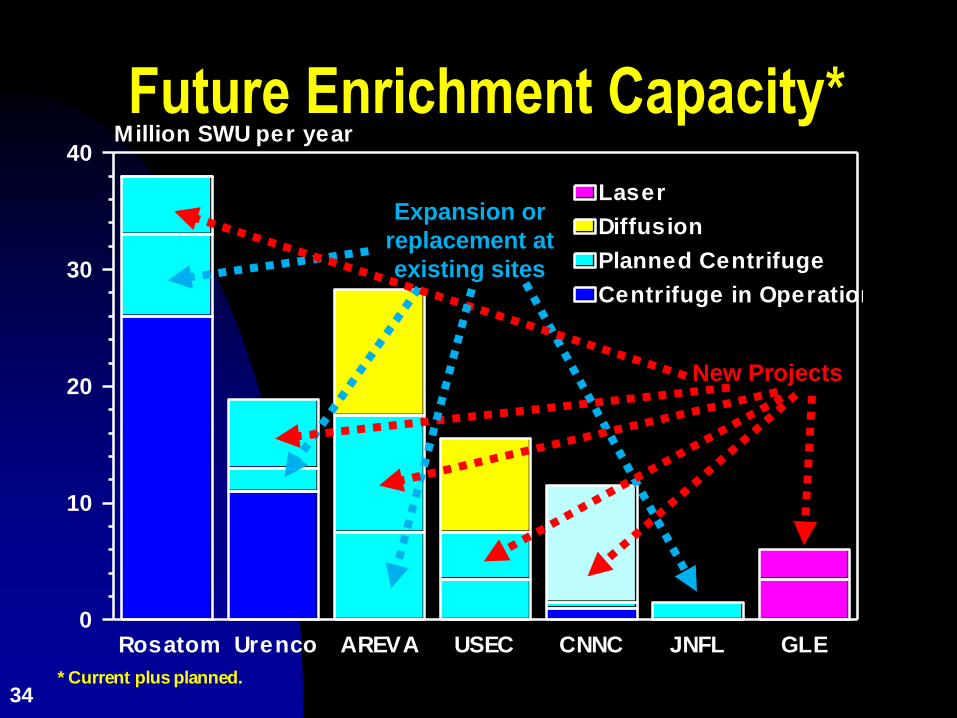
* Current plus planned.
Rosatom Urenco AREVA USEC CNNC JNFL GLE0
10
20
30
40Million SWU per year
Centrifuge in Operation
Planned Centrifuge
Diffusion
Laser
34
Future Enrichment Capacity*
Expansion or
replacement at
existing sites
New Projects

* Current plus planned.
Rosatom Urenco AREVA USEC CNNC JNFL GLE0
10
20
30
40Million SWU per year
Centrifuge in Operation
Planned Centrifuge
Diffusion
Laser
35
USA: The Battle Ground
Enrichment Import
Restrictions & The
Weakening Dollar
Foster Building
In The USA

36
Enrichment Implications All the major suppliers will be on the centrifuge technology by
the middle of the next decade, but the old gas diffusion plants might still have some useful life.
Once centrifuge manufacture becomes routine and the cost matures, there is “no stopping” the continual installation of centrifuge capacity; the installation rate is merely a function of the size of the centrifuge manufacturing capacity
Production costs (and thus possibly prices) could then stabilize or drop, given the centrifuge technology’s low operating costs.
But, maybe enrichment and uranium pricing will become locked in a competitive environment, if the relationship between the two becomes more transparent to the markets. Enrichment may serve as a long-term cap on uranium prices.
Trade restrictions against Russia will continue to result in a sub-optimal, economically-inefficient nuclear fuel market for the foreseeable future.

37
Overall Markets: Potential Surprises Cigar Lake uranium deposit may be delayed well into
the decade.
Olympic Dam expansion may not occur within a 10-year time.
GE’s SILEX enrichment system may rush to the forefront.
The USA may decide to process enrichment tails material, for sale into the market.
The USA may decide to release much more military stockpile into the market.
A lingering Fukushima crisis could slow the expansion of nuclear power in many regions
Russia could become integrated into the world fuel markets without restrictions.

38
R. Gene ClarkPresident
TradeTech Energy1289 North Fordham Blvd., Suite 202
Chapel Hill, North Carolina 27514 USA+1(919)933-7388 (office)
+1(919)933-6423 (fax)


